Article

Exploring the Impact and Prevention of Epidemics Based on Inter-Animal Transmission from an Environmental Perspective

1
MOE Key Laboratory of Deep Earth Science and Engineering, College of Architecture and Environment, Sichuan University, Chengdu 610065, China
2
Institute for Disaster Management and Reconstruction, Sichuan University, Chengdu 610207, China
*
Author to whom correspondence should be addressed.
Buildings 2024, 14(9), 2974; https://doi.org/10.3390/buildings14092974
Submission received: 30 July 2024 / Revised: 1 September 2024 / Accepted: 18 September 2024 / Published: 20 September 2024

Abstract

:
Respiratory infectious diseases are more likely to occur in indoor environments. Therefore, the probability of transmission when sharing the same indoor space with an infected individual for a certain period of time has an impact on the response measures to influenza outbreaks. The experimental methods for studying indoor transmission risks present significant operational challenges. Hence, to accurately predict the process of virus transmission in human living environments, it is crucial to use animal experiments in controlled environments. This study extensively reviews classical documents, taking into account exposure methods as well as environmental factors such as temperature, humidity, viral release intensity, and ventilation frequency. Based on the reference to animal experiments, the analogy law between the animal experiment environment and the human living environment is put forward. For human society, a dynamic respiratory infectious disease model that takes environmental factors into account is developed. The incidence probability of susceptible populations and the law of respiratory virus transmission at a certain time and space are explored. Ultimately, the statistical analysis revealed that temperature and susceptible people, followed by humidity and ventilation frequency, are the most sensitive factors influencing disease outbreak. In conclusion, this research provides a new reference model for predicting the spread of respiratory infectious diseases. It expands the application scope of animal experiments and offers guidance for setting environmental factors in animal virus transmission experiments, assessing the likelihood of infection in human living environments, guiding human behavior, and preparing for future virus outbreaks.

1. Introduction

The outbreak of severe acute respiratory infectious diseases in recent years has led to extensive research on the transmission mechanism of exhaled aerosols in respiratory infectious diseases. It has been recognized that infectious agents can be transmitted through human activities, droplets, or aerosols, leading to the spread and proliferation of infections [1]. However, the understanding of the transmission process is still limited, making it difficult to predict the risk of respiratory disease transmission.
Respiratory infectious diseases primarily occur in indoor environments [2]. For instance, influenza viruses can be transmitted through various means, including direct contact or the inhalation of exhaled aerosols [3]. Successful transmission of the virus from one person to another requires the virus to be released into the surrounding environment, a susceptible recipient, and the ability of the virus to remain infectious in the environment [4]. Therefore, the efficiency of transmission can be influenced by factors such as the characteristics of the virus, environmental parameters, the characteristics of the individuals involved, and the spatial conditions.
Currently, two main experimental methods are used to study the risk of indoor transmission: direct experiments and model experiments.
Most of the existing direct experimental research methods are conducted in real rooms through full-scale dummy experiments or real human interventions. For example, Rawat M.S. et al. [5] conducted their experiments in a 70 m3 laboratory room. However, using such a large room can introduce various factors that may interfere with the sampling of live viruses. Currently, direct full-scale dummy experiments are generally difficult and costly to perform, and the large space and real-size environment make it complex to control environmental factors.
Existing modeling experimental studies can be further broadly divided into two main categories. On the one hand, there are mathematical models, such as the original Wells-Riley model, which has a long history of development and has been used and updated for many generations. For example, Nicas M. [6] and Nazaroff W.W. et al. [7] considered the effect of respiratory protection by introducing an R parameter as the respirator particle penetration rate to achieve the effect. Fisk W. et al. [8] considered particle filtration and air disinfection such as UV irradiation. Franchimon F. et al. [9] considered the viability of infectious particles in terms of viability and the deposition effect. Nicas M. et al. [6] then considered the number of Mycobacterium tuberculosis released in the air and the fraction of infected particles deposited in the alveolar region per infected person, taking into account the real level of exposure of the susceptible population. In 2020, Caroline X. et al. [10] proposed a multi-pathway transmission model based on the Wells-Riley equation. The effectiveness of the viral dose delivered through different routes takes into account the combined effect of multiple routes of transmission such as close contact, proximity transmission, contact transmission, and airborne transmission. It is the most commonly used statistical analysis model today [11]. At the same time, the SIR (Susceptible Infected Recovered) model and SEIR (Susceptible–Exposed–Infected–Removed) model are two classic models in the field of infectious disease dynamics. During the outbreak period, many scholars used these two models to predict the development trend of COVID-19 [12]. For example, Khyar O. and Allali K. et al. [13] proposed the SEIR model, along with a proposal to extend it to a multi-strain dynamics model. Kozyreff G. et al. [14] used a SAR (successive approximation register) model of inpatient dynamics, which took into account the number of infected persons during hospitalization and ultimately found that the hospitalized population did not affect the remaining epidemiological status. Ram V. and Schaposnik L.P. et al. [15] briefly mentioned social distance in their study; that is, obedience to social distance will reduce the probability of interaction between two people in a logarithmic manner. Aikebaierd S. et al. [16] also improved the SIR equation. Although environmental factors such as temperature and humidity were involved, the main body of research was on boxes with no vital signs and only contact transmission. These scholars all made contributions to the applicability of the model, but the research on the impact of environmental factors was too one-sided, and there was still a huge research space for research on multiple transmission routes.
On the other hand, there are also animal models based on medical experimental research, such as the classic ferret model and hamster model, which can be used to study the infectivity of a certain virus in the process of interpersonal transmission. However, many of these animal experiments still require further development and research, and their scientific nature needs to be further standardized [17]. In many experimental studies using animal simulation experiments, the environment is set up arbitrarily without mentioning the strict control of temperature, humidity, etc. Additionally, there are no strict distance-setting standards, despite the fact that these factors may have a greater impact on the experimental results. For example, Sun X. et al. [18] studied the efficiency of airborne transmission of respiratory viruses in the ferret model. Although ferrets were kept in different cages, they did not consider the preset experimental environment or the setting of the distance between cages. Similarly, Port J.R. et al. [19] studied the Syrian hamster infection experiment and also did not consider the preset experimental environment. The susceptible hamsters were exposed to an aerosol transmission device with a tube at a distance of 200 cm. Stauft CB et al. [20] separated two Syrian hamsters in the same cage by a custom-made perforated metal separator at a temperature of 21.6 °C to 22.7 °C (72 °F ± 1 °F) and humidity of 30 to 70%. Pulit-Penaloza JA et al. [21] placed ferrets in stainless steel cages separated by perforated walls with 150 to 180 air changes per hour.
There are animal experiments that control environmental factors, the distance between test subjects, and the number of sensitive individuals, but there are still variations in the criteria for setting these factors. In their experiments on influenza virus transmission using the ferret model, Gudymo A. et al. [22] maintained a relative humidity of 30% and an air temperature of 20 °C inside the cabinet room. The distance between the cages was 10 cm, and the airflow was directed from the infected donor ferret to the three recipient ferrets at a flow rate of 3 cm/s. Kuehl P.J. et al. [23] developed a hamster transmission caging and exposure system where four susceptible individuals were separated by 4 inches. The temperatures ranged from 18 °C to 26 °C, the relative humidity ranged from 30% to 70%, and the airflow was controlled at 5 L/min. Zhang Y. et al. [24] conducted experiments with ferrets and Syrian hamsters, setting the temperature at 20–22 °C, setting the humidity at 30–40%, and maintaining a distance of 4 cm between the three susceptible individuals and the infected animals.
Therefore, this study integrates existing direct experimental methods that are both too complicated and too simple but lack a parameter reference model experiment. It is of practical significance to study the transmission mechanism over a certain period of time and when patients are in the same interior space. Based on the calculation of animal experiments under various environmental factors, this paper discusses in detail the possible impact of various factors on transmission and analyzes and determines which factors have the greatest impact on transmission and which factors can be ignored. Furthermore, based on the existing experimental animal enclosure, animal and human physiological parameters, and similar environmental conditions, the contact method of analogy can be used, such as through an improved SIR model or dynamic model of respiratory infectious diseases, to further study propagation characteristics.

2. Materials and Methods

2.1. Sample and Data

The focus of this study is to use the experimental data of a box infection in laboratory animals to simulate the process of virus infection in indoor interpersonal communication under different infection scenarios. Through the establishment of a dynamic model of respiratory infectious diseases, animal experiments were used to improve the parameters of the dynamic model of respiratory infectious diseases in human settlements. In the analogy, attention should be paid to physiological parameters such as biological volume, lung ventilation rate, and actual conditions such as activity. The model is developed by considering environmental parameters such as temperature, humidity, the intensity of viral release, the frequency of air changes, and exposure probabilities [25]. As such, the study’s content is extremely pertinent to both the building of interior environments and the exposure to indoor pollutants.

2.2. Analogue Basis and Parameter Measurements

In different types of human environments, the trajectory of human movement is unpredictable. However, in specific environments, there are social rituals and instinctive reactions that are inherent to humans. The probability of interpersonal contact can be predicted and is influenced by factors such as familiarity and group size. As shown in Figure 1, the narrower the space and the closer the relationship, the probability grows in the direction of the red arrow. According to the research of Zhang N et al. [26] on university classrooms, the average distance between face-to-face interpersonal contact was found to be 87.0%. This information, combined with the distance of air propagation, the use of N95 respirators, the volume of new air per person, the occupancy rate, and the distribution of students, can be used to analyze the risk within a certain time frame. Guo Y et al. [27] developed a wearable device for detecting close contact behavior in primary and secondary classrooms and found that the close contact rate was 37 ± 11% during orderly classes and 48 ± 13% during more disorderly classes. They also observed that lower grade students had a higher close contact rate and virus transmission potential. Therefore, this paper proposes an index, contact probability Pcontact, which represents the average probability of contact between all susceptible individuals and infected individuals or infected individuals who have come into contact with surfaces where the virus is still present within a certain spatial range. In medical animal infection experiments, the movement routes of animals are also unpredictable, but they can be correlated to different types of human living environments through artificial space segmentation and route restriction. Therefore, an analogy model can be established to distinguish the possible contact probability Pcontact in different spaces.

2.2.1. Probabilistic Contact Distance

If one wants to link the contact distance to the contact probability, the contact distance is probabilistic. If we directly discuss the process of interpersonal communication, there are many influencing factors and a huge amount of engineering, and it has very low practical value. So, we use the analogy of the human interaction process by discussing the contact distance of animal experiments. After simplification, the following three types of contact models can be roughly used to cover all interpersonal transmission processes.
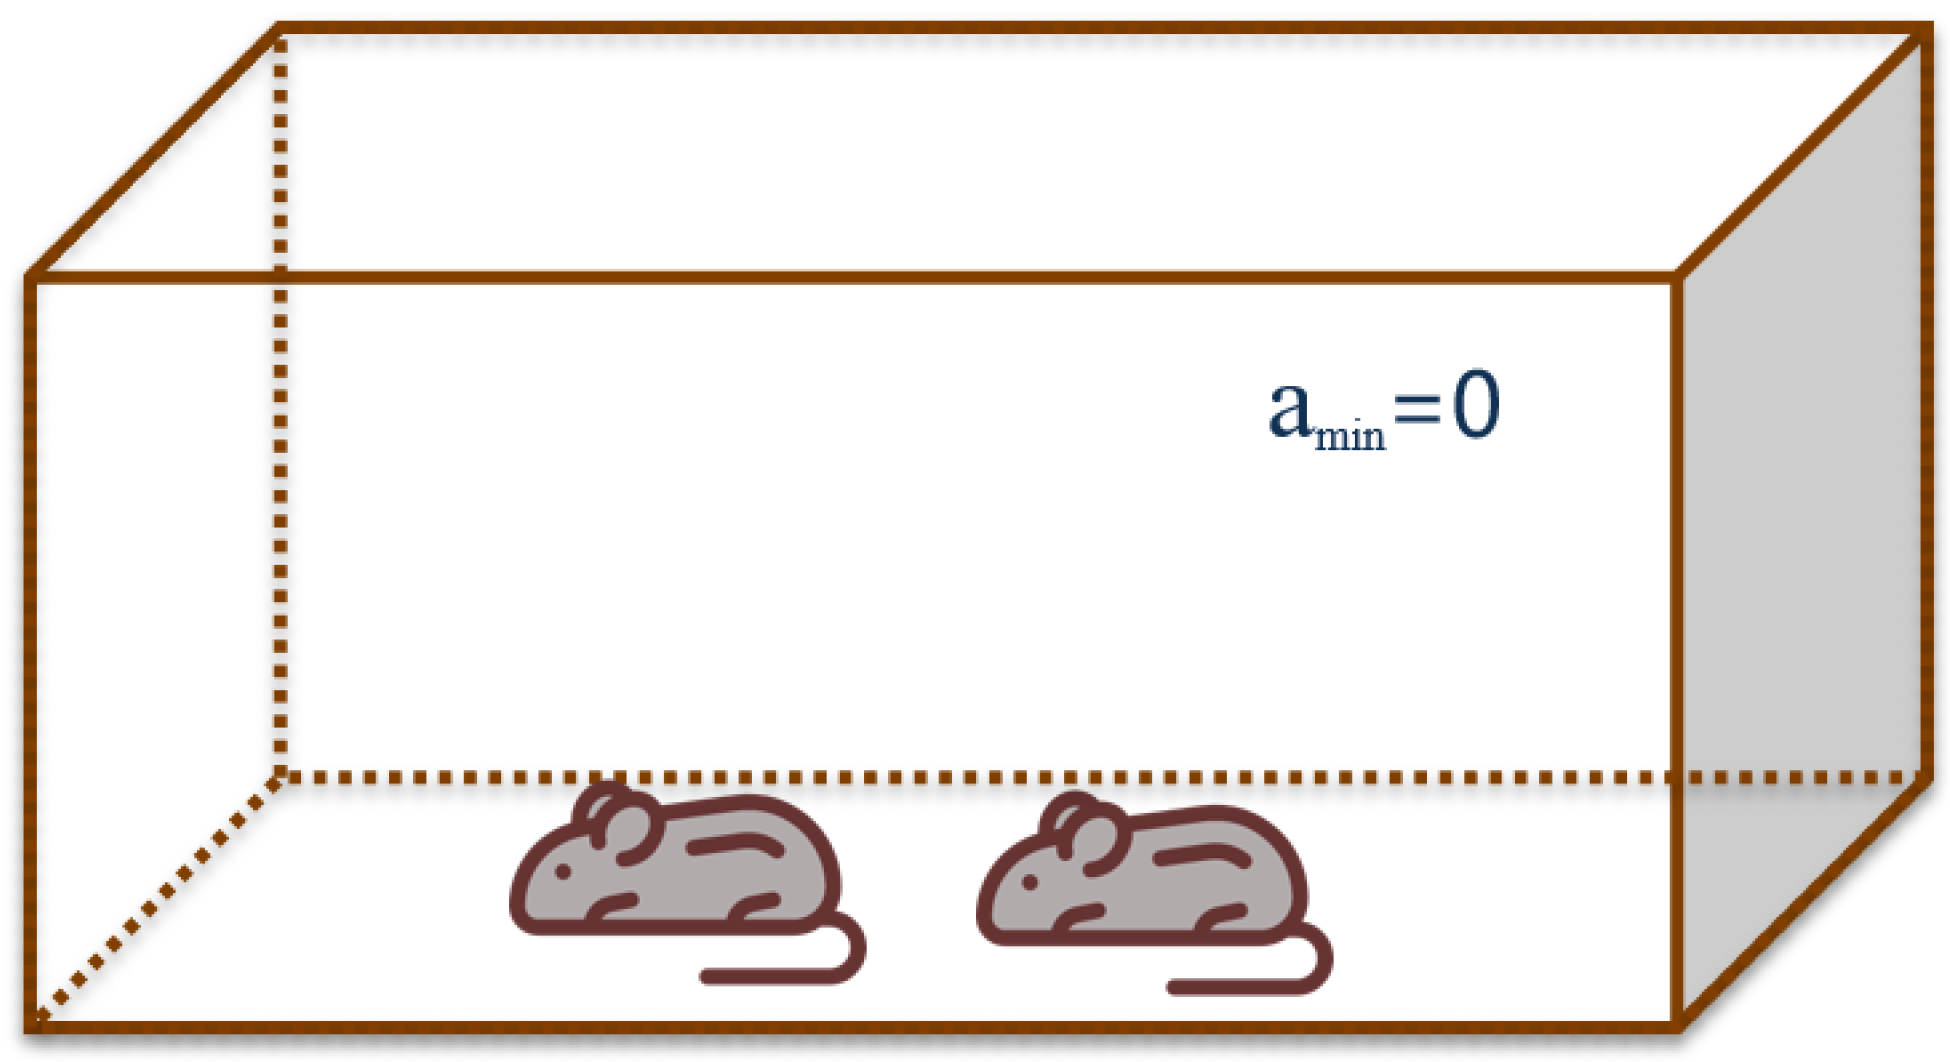
On the one hand, in small spaces where people are very familiar with each other, the closest distance and duration of contact between individuals are often longer compared to other types of spaces. The phenomenon of close contact between humans can be applied to animal experiments. Therefore, the cage model used in animal experiments involves keeping active animals together in close proximity, establishing a model with a high probability of contact (Pcontact of 90–100%). As shown in Figure 2. The parameter “amin” represents the closest distance with a probability of contact, which is suitable for places with limited space and frequent close contact between people, such as family gatherings.
On the other hand, in familiar and comfortable spaces or in situations where strangers are in close proximity, interpersonal contact may involve casual contact or accidental friction. This type of phenomenon, where there may be close contact between humans but droplet transmission is more significant, can be analogized to animal experiments. In this case, the cage-to-cage model is used in animal experiments. Although the animals are active, their contact is limited. As shown in Figure 3, a model with a lower probability of contact (Pcontact of 20–80%) is established, depending on factors such as the volume of the experimental animal (corresponding to human body weight), the size of the space, and the level of activity (the range of allowed or possible activities). Examples of corresponding scenarios include office spaces, classroom learning, and air travel.
Additionally, a zero-probability contact model (Pcontact of zero) is also applied to locations, like two rooms with the same air-conditioning system, where there is no chance of close contact. As shown in Figure 4.

2.2.2. Animal Distance Coefficient Calculation

According to the Pcontact obtained from the analysis of animal infection experiments, the corresponding distance coefficient b in different animal experiments can be calculated, where b is the distance coefficient proposed in this paper, which is calculated using actual data from animal experiments. It can be extrapolated to interpersonal interactions, and its magnitude characterizes the proximity of the distance between infected and susceptible individuals. In addition, the probability of contact can directly impact its magnitude. The calculation formula is as follows:
b = β T H n o I t 2
β is the probability of susceptible people becoming infected at a certain moment (%), T is the temperature (°C), H is the relative humidity (%), n is the number of air changes (h−1), o is the intensity of viral release, and t is the exposure time (h).
Then, these animal experiments are divided into an artificially set limit of activity range, as shown in Table 1. In guinea pig experiments, the animal’s range is roughly divided into three categories, collocation, neighboring cage, and long-distance contact, with probabilities of recent distance of 0, 4 mm, and 80 mm, respectively. To determine the probability of susceptible animals contacting an infected host, only cage animals have the possibility of contact, with neighboring cage contact probabilities set at 100% and 20%, respectively. For long-distance aerosol transmission, there is no possibility of contact because the distance between them is much larger than the length of the animal’s body, so the Pcontact is zero.
Combined with the set Pcontact, the constant b under different contact probabilities is derived by fitting the experimental data, which is Equation (2):
b a n i m a l = 1.82408 × 10 6 + 0.00825 × 2.21233 × 10 4 1 P c o n t a c t

2.2.3. Human Example Calculations

In this paper, guinea pigs were mainly chosen to establish an analogous model with humans. For the transmission of respiratory viruses in the human environment, Equation (2) takes into account the influence of environmental factors, but there are still some differences in physiological parameters, as shown in Table 2. The difference in body temperature is not obvious and can be ignored as an approximation. The body weight of a human is 200 times that of a guinea pig, and the large body surface area ratio means that the probability of exposure to an infectious agent in the same environment increases proportionally. At the same time, the human lung ventilation rate is 50 times that of the guinea pig, so the rate of pathogen release increases geometrically. When integrating the use of animal experiments to characterize the risk of transmission in human habitats, it is important to consider the difference in the value of the distance coefficient b.
Thus, the distance coefficient b in the habitat is expressed in Equation (3):
b p e r s o n = 1.82408 × 10 2 + 82.5 × 2.21233 × 10 4 1 P c o n t a c t
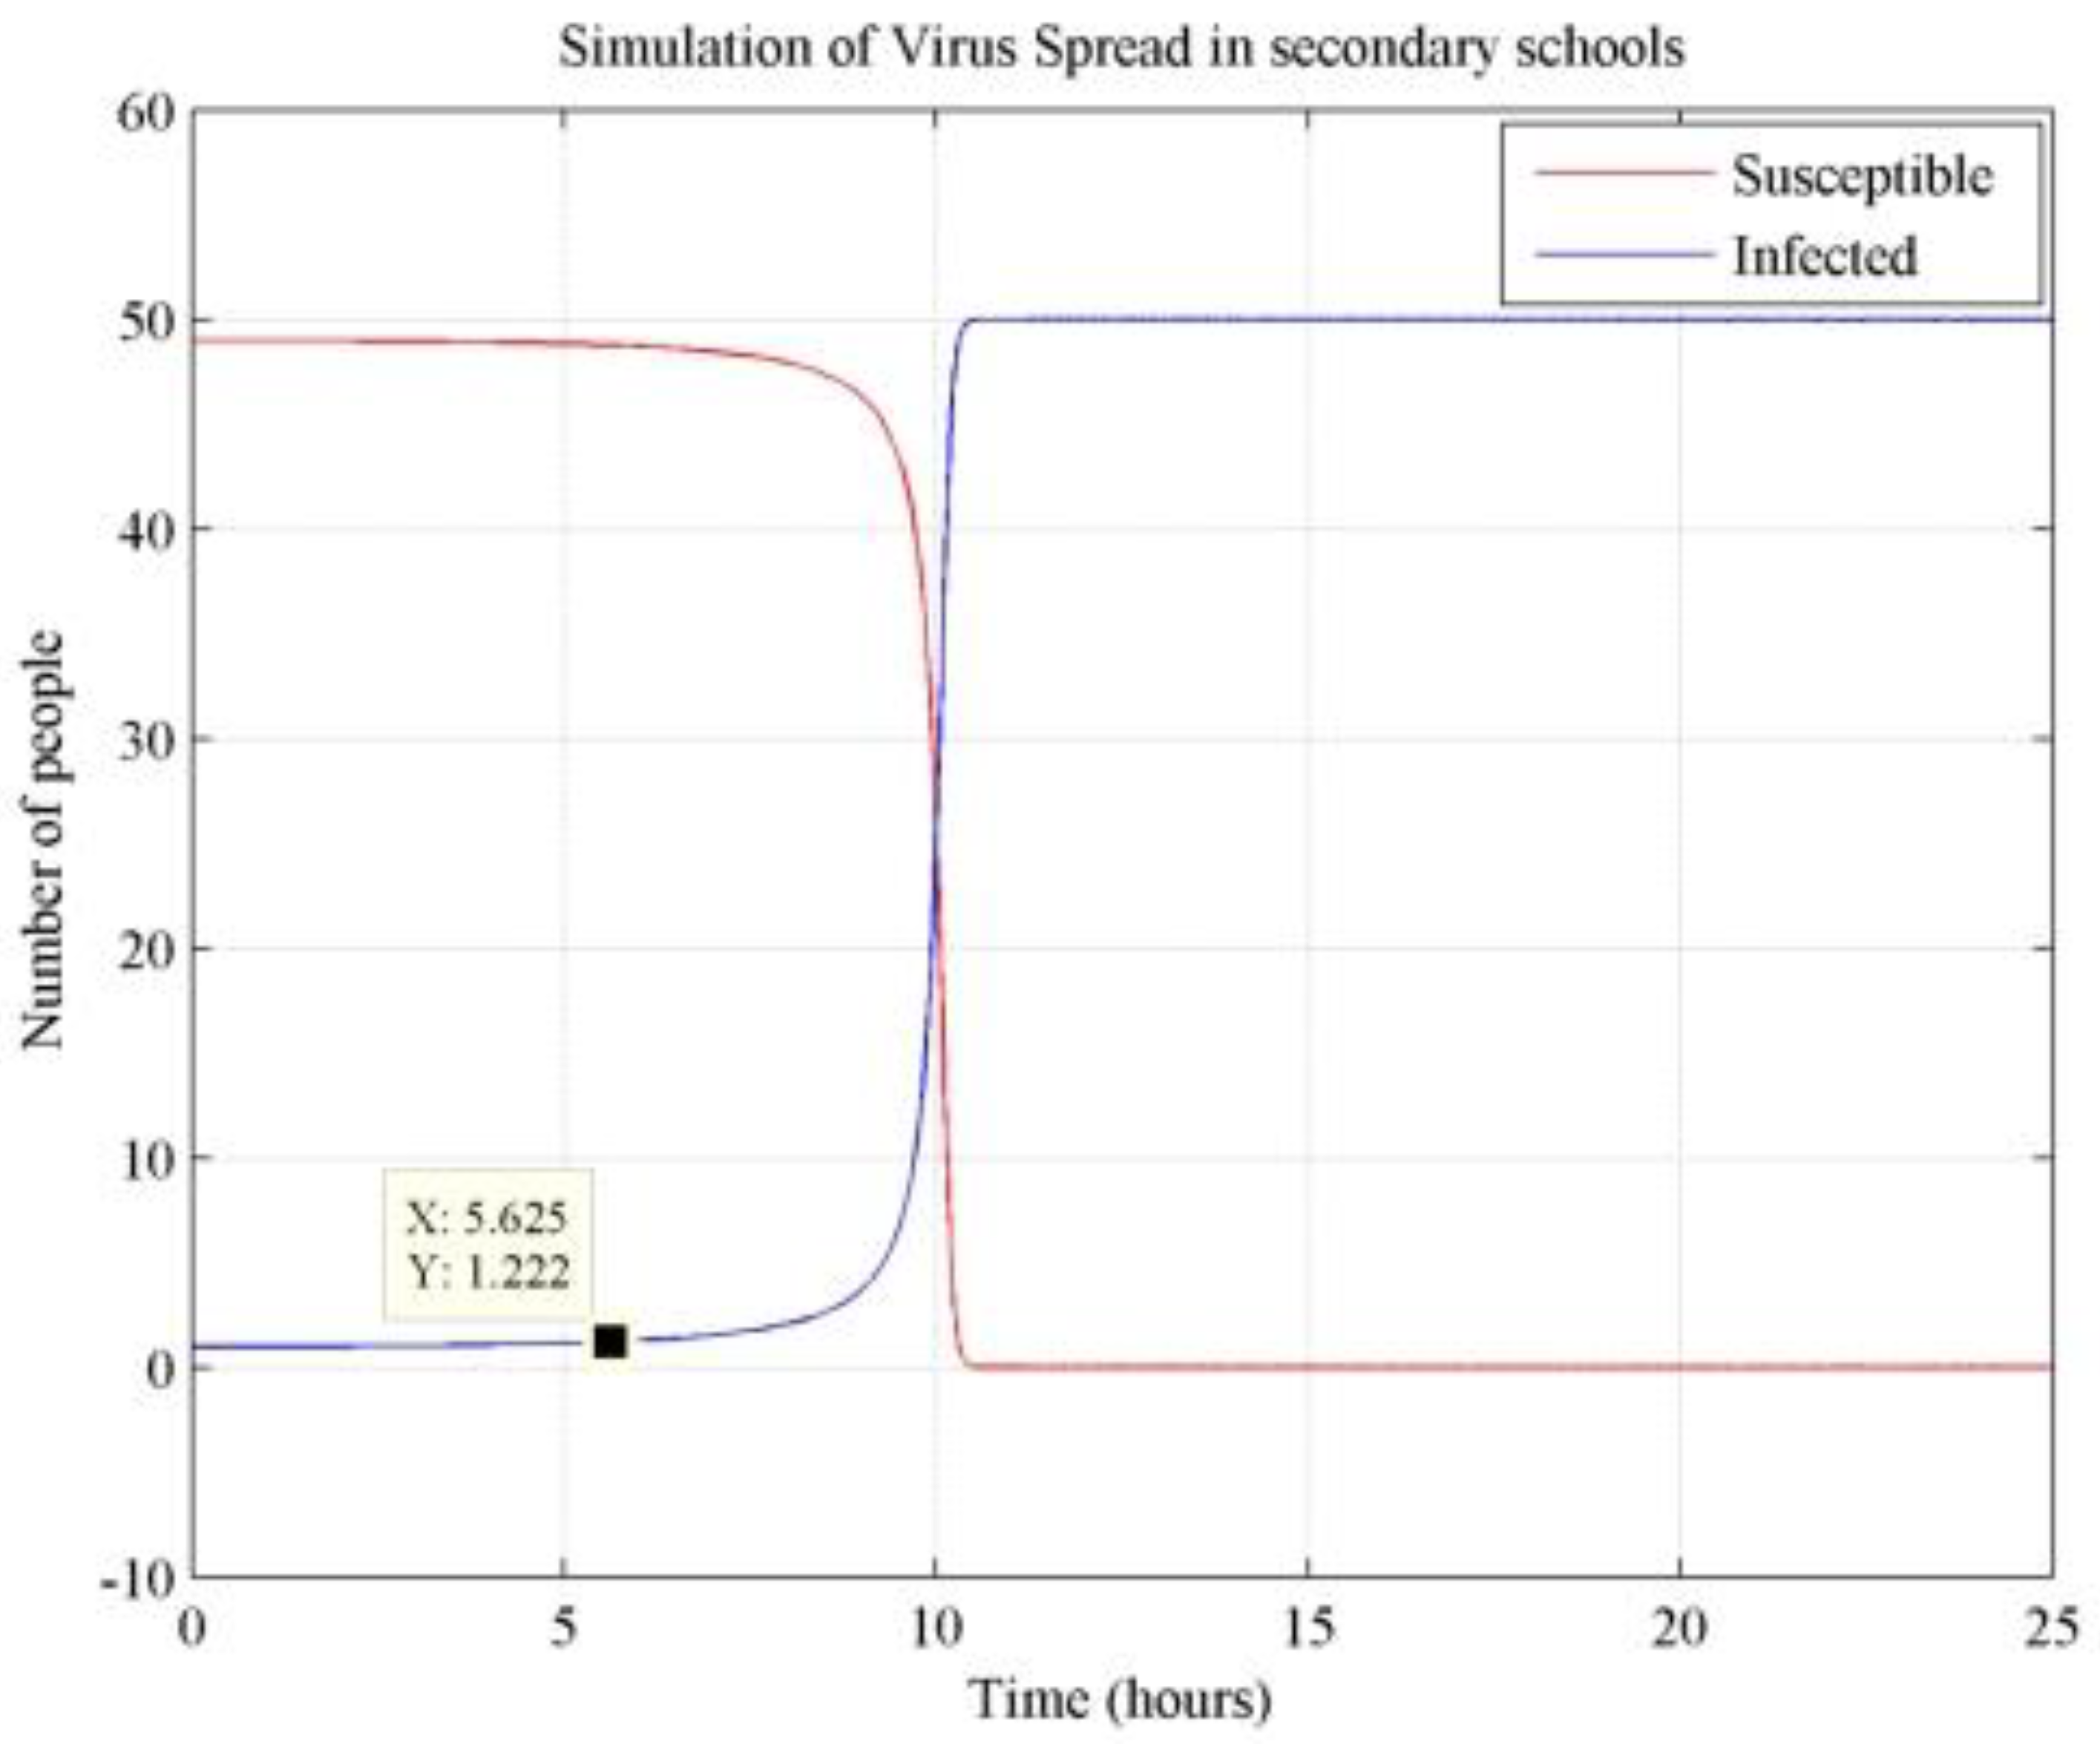
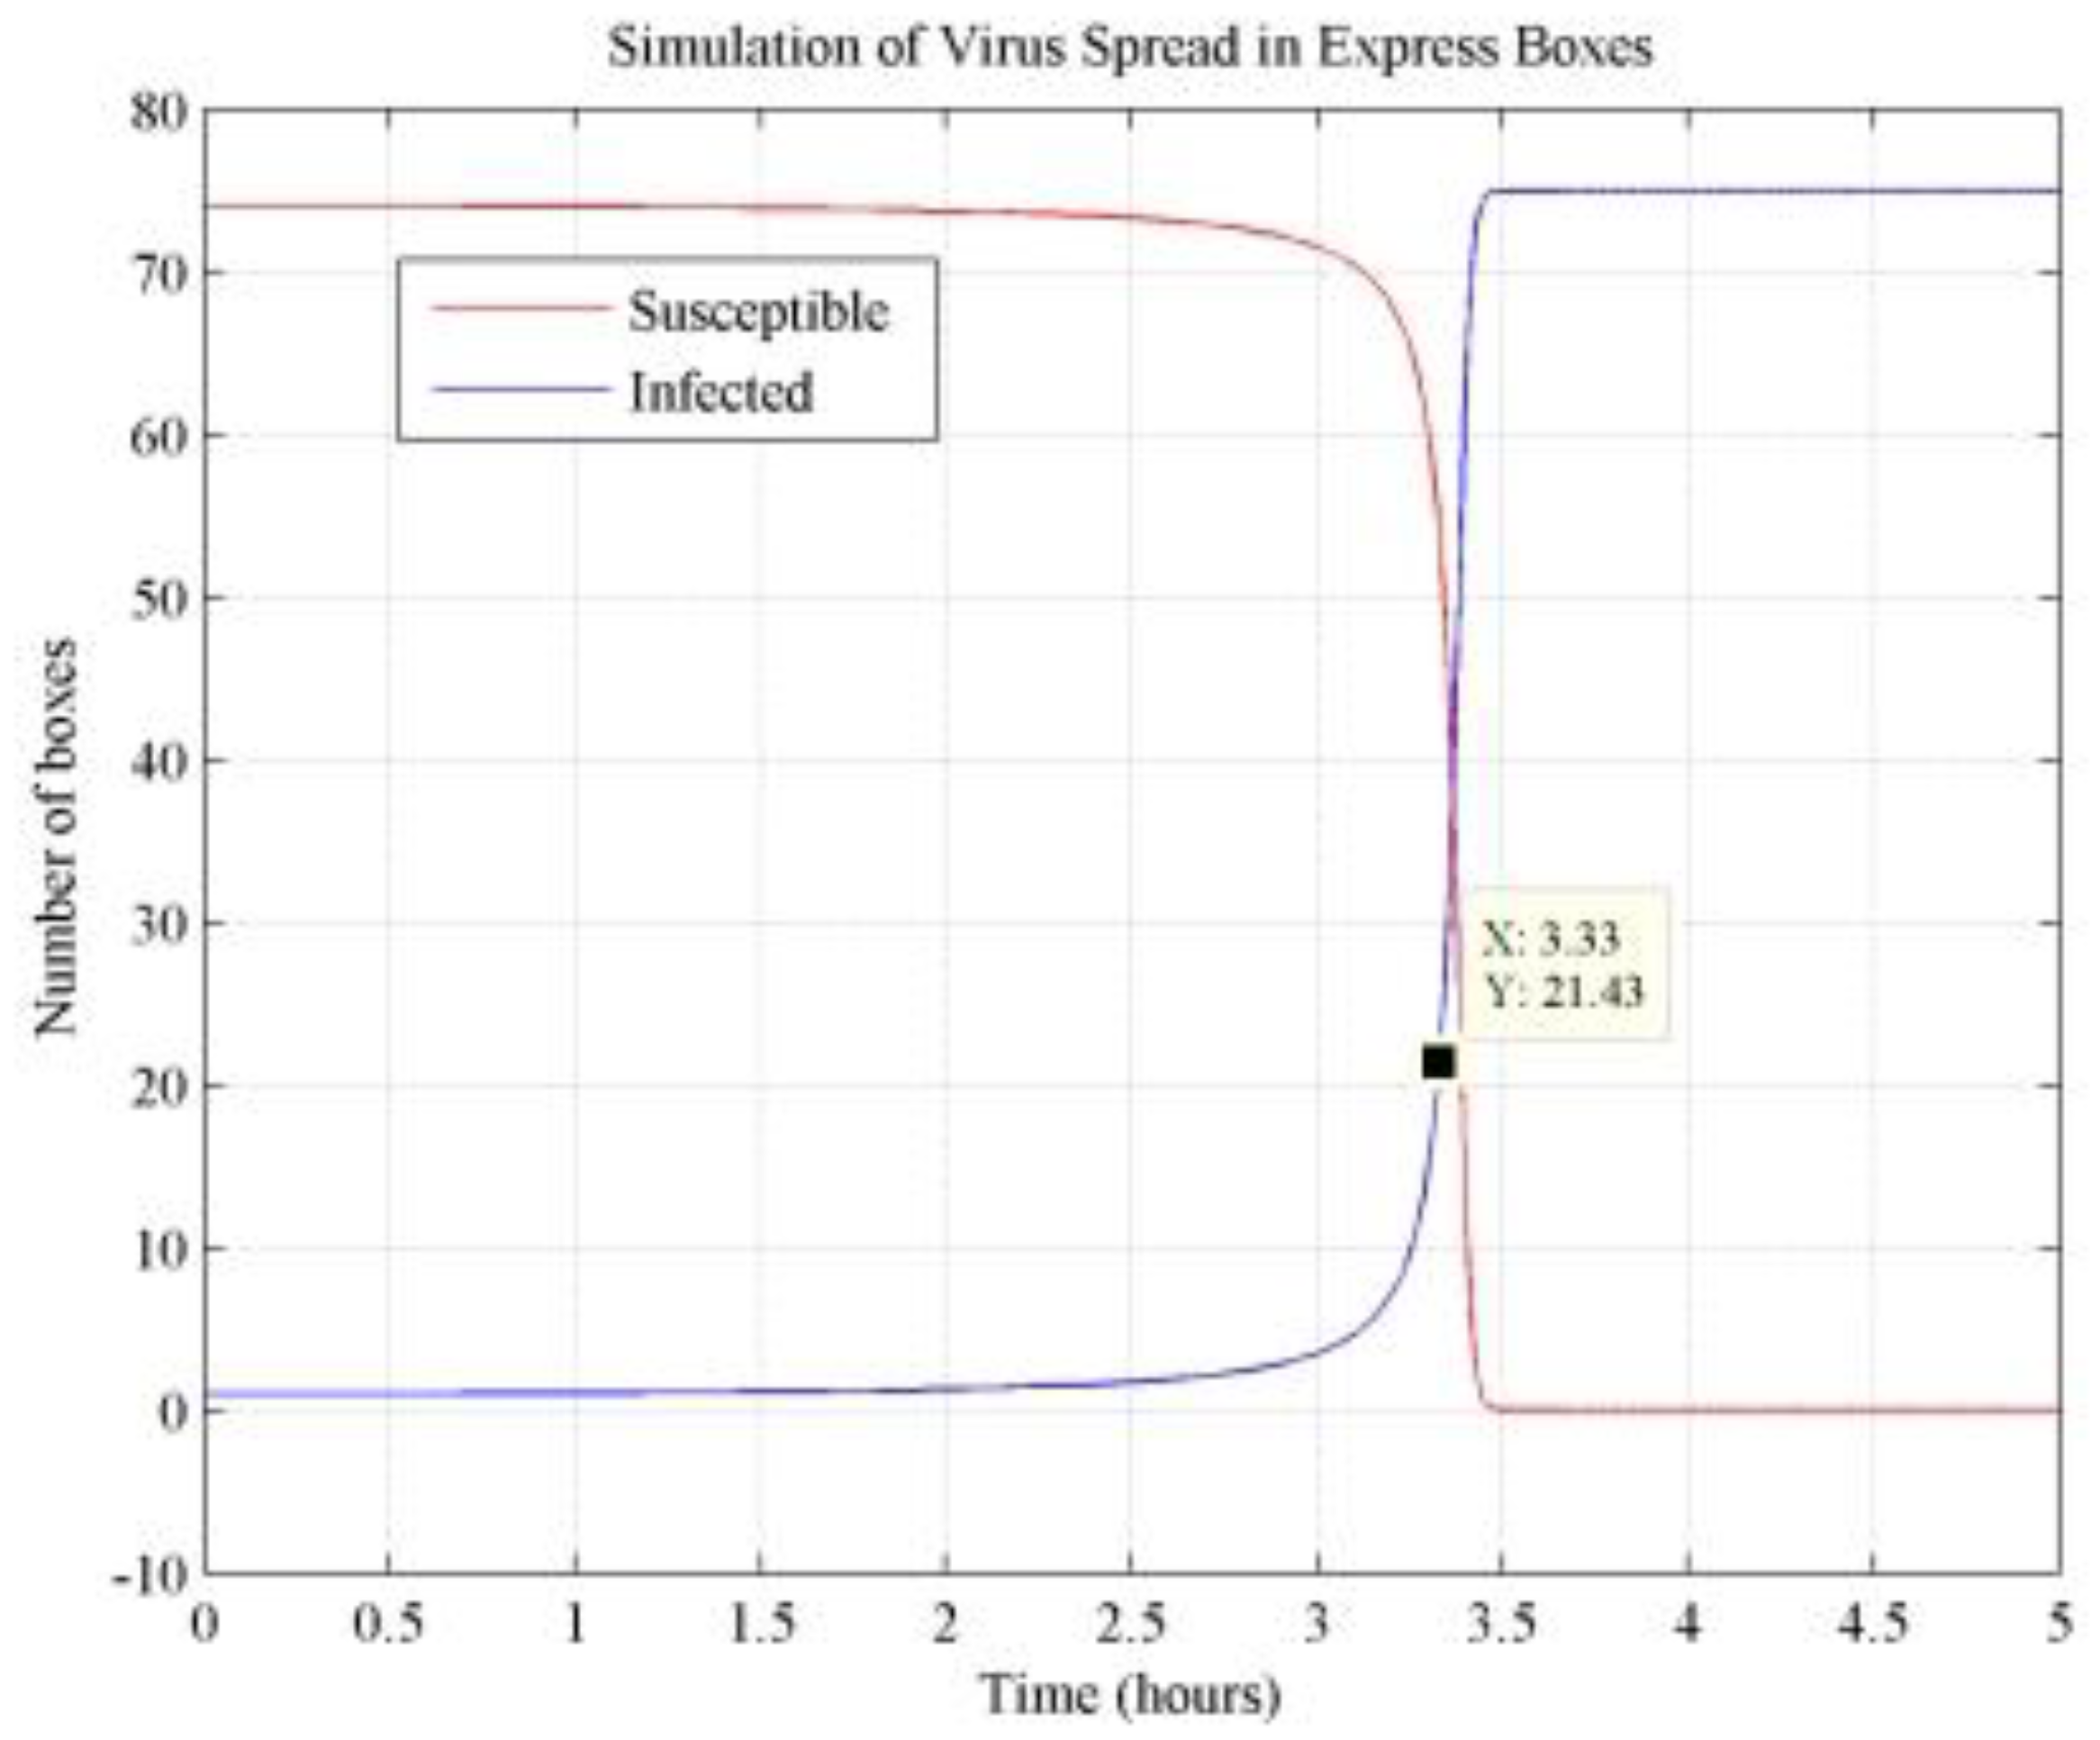
Referring to the determination of exposure probability in the existing research literature [26,27], the model proposed in this paper is used to calculate the infection rate based on the real infection rate of actual cases in interpersonal transmission. This calculated infection rate is then compared to the actual infection rate to verify the feasibility of the model, as shown in Table 3. In a study conducted in an elementary school, where there was 1 infected person and 49 susceptible persons in a 600 m3 school, the actual infection rate during a 6 h exposure time was 0.0052. The difference between this actual infection rate and the infection rate calculated using the viral infection risk assessment model established in this paper was less than 2%. Similarly, in a study conducted in a 168 m3 civil airplane during a 3.33 h voyage, there was 1 infected person and 74 susceptible persons, resulting in an actual infection rate of 0.27. This actual infection rate was only 2.2% different from the infection rate calculated using the viral infection risk assessment model established in this paper. A model of infection rates according to exposure time is provided in Appendix A (Figure A1 and Figure A2). Therefore, the model can be used to predict the likelihood and scale of viral infection outbreaks in human habitats, taking into account environmental impacts.

2.3. Models and Data Analysis Procedure

These models are also applied to locations, like two rooms with the same air-conditioning system, where there is no chance of close contact. These models categorize the population during a pandemic into susceptible (S), exposed (E), infected (I), and cured/recovered (R) individuals. In addition, β represents the likelihood that a susceptible population will contract an infection, α represents the inverse of the average incubation period, and γ represents the likelihood that an infected population will return to a cured or recovered state.
Firstly, a model of virus transmission (Equation (4)) was established. This model is based on the survival traits of respiratory viruses and ignores the cure/recovery (R) stage. Since the exposure time of human habitation in this study is short and there is no self-healing phenomenon after infection, it has been demonstrated that the virus can be transmitted to new individuals within tens of hours. During this time, the virus remains active and capable of transmission, posing a potential risk of virus transmission throughout the study period.
Secondly, given that environmental factors affect the coronavirus’s ability to spread, a thorough analysis of the literature found that, in more enclosed spaces like human habitats, a number of significant factors can affect the virus’s ability to spread [34]:
  • Temperature: This directly determines the activity level of the virus, with lower temperatures being more favorable for virus survival [35,36,37,38].
  • Humidity: Low humidity increases the persistence of the coronavirus [39,40].
  • Virus release intensity: More air changes will dilute the virus’s concentration, preventing airborne transmission. Nonetheless, it is crucial to take into account human comfort and prevent any negative effects brought on by unnecessarily high air change rates.
  • Air change rate: A higher number of air changes will dilute the virus concentration and thus have the effect of suppressing airborne transmission. At the same time, it is necessary to consider the comfort of the human body and avoid the reaction caused by being too much.
Based on the analysis of the aforementioned factors, an environmental impact factor ρ (Equation (5)) has been developed to study the viability and transmission trends of viruses in existing closed laboratory environments. The environmental impact value ρ combines the effects of multiple environmental factors and assists researchers in considering these factors when predicting the spread of viruses. This factor also enables more accurate predictions of the severity of the consequences of an infectious disease outbreak in a given space.
The virus infection risk assessment model is as follows:
d S d t = β S I d I d t = β S I N = S + I
The environmental impact is as follows:
ρ = n o I t T H
Among these variables, I represents the number of infected people (n), S represents the number of susceptible people (n), N represents the total number of individuals in the space, β represents the probability of susceptible individuals becoming infected at a certain moment (%), ρ represents the environmental impact factor, T represents the temperature (°C), H represents the relative humidity (%), n represents the number of air changes (h−1), o represents the intensity of viral release, and t represents the exposure time (h).
Finally, it is known from the knowledge of infectious disease dynamics that the transmission rate β for both the indoor infected (I) and susceptible (S) populations is proportional to both the exposure time and ρ. Combining (2), the rate of virus spread can be expressed as type (6).
β = b t ρ
where b is the distance coefficient.

3. Result and Discussion

To fully understand the specific impact of various environmental factors on the risk of virus transmission, the risk assessment model of virus infection proposed in this paper was used to calculate the influence of single-variable changes on virus transmission based on an actual case of infection in an aircraft cabin [33]. Based on the results, suggestions for environmental improvement to prevent large-scale disease outbreaks were put forward.
The virus spreading space was set to be the capacity of a civil airplane cabin (V = 168 m3), and the intensity of free virus spread was set to o = 2.5. This study assumed that there was only one infected person at the time of departure (I (0) = 1). The temperature (T) in the cabin was set to be in the range of 10–30 °C, the relative humidity (RH) was set to be in the range of 10–70%, and the number of air exchanges (n) was set to be in the range of 4–44 h−1, taking into consideration the realistic conditions of the cabin. The model of virus transmission under various circumstances was obtained using these parameters.

3.1. Effect of Temperature Changes on Virus Transmission

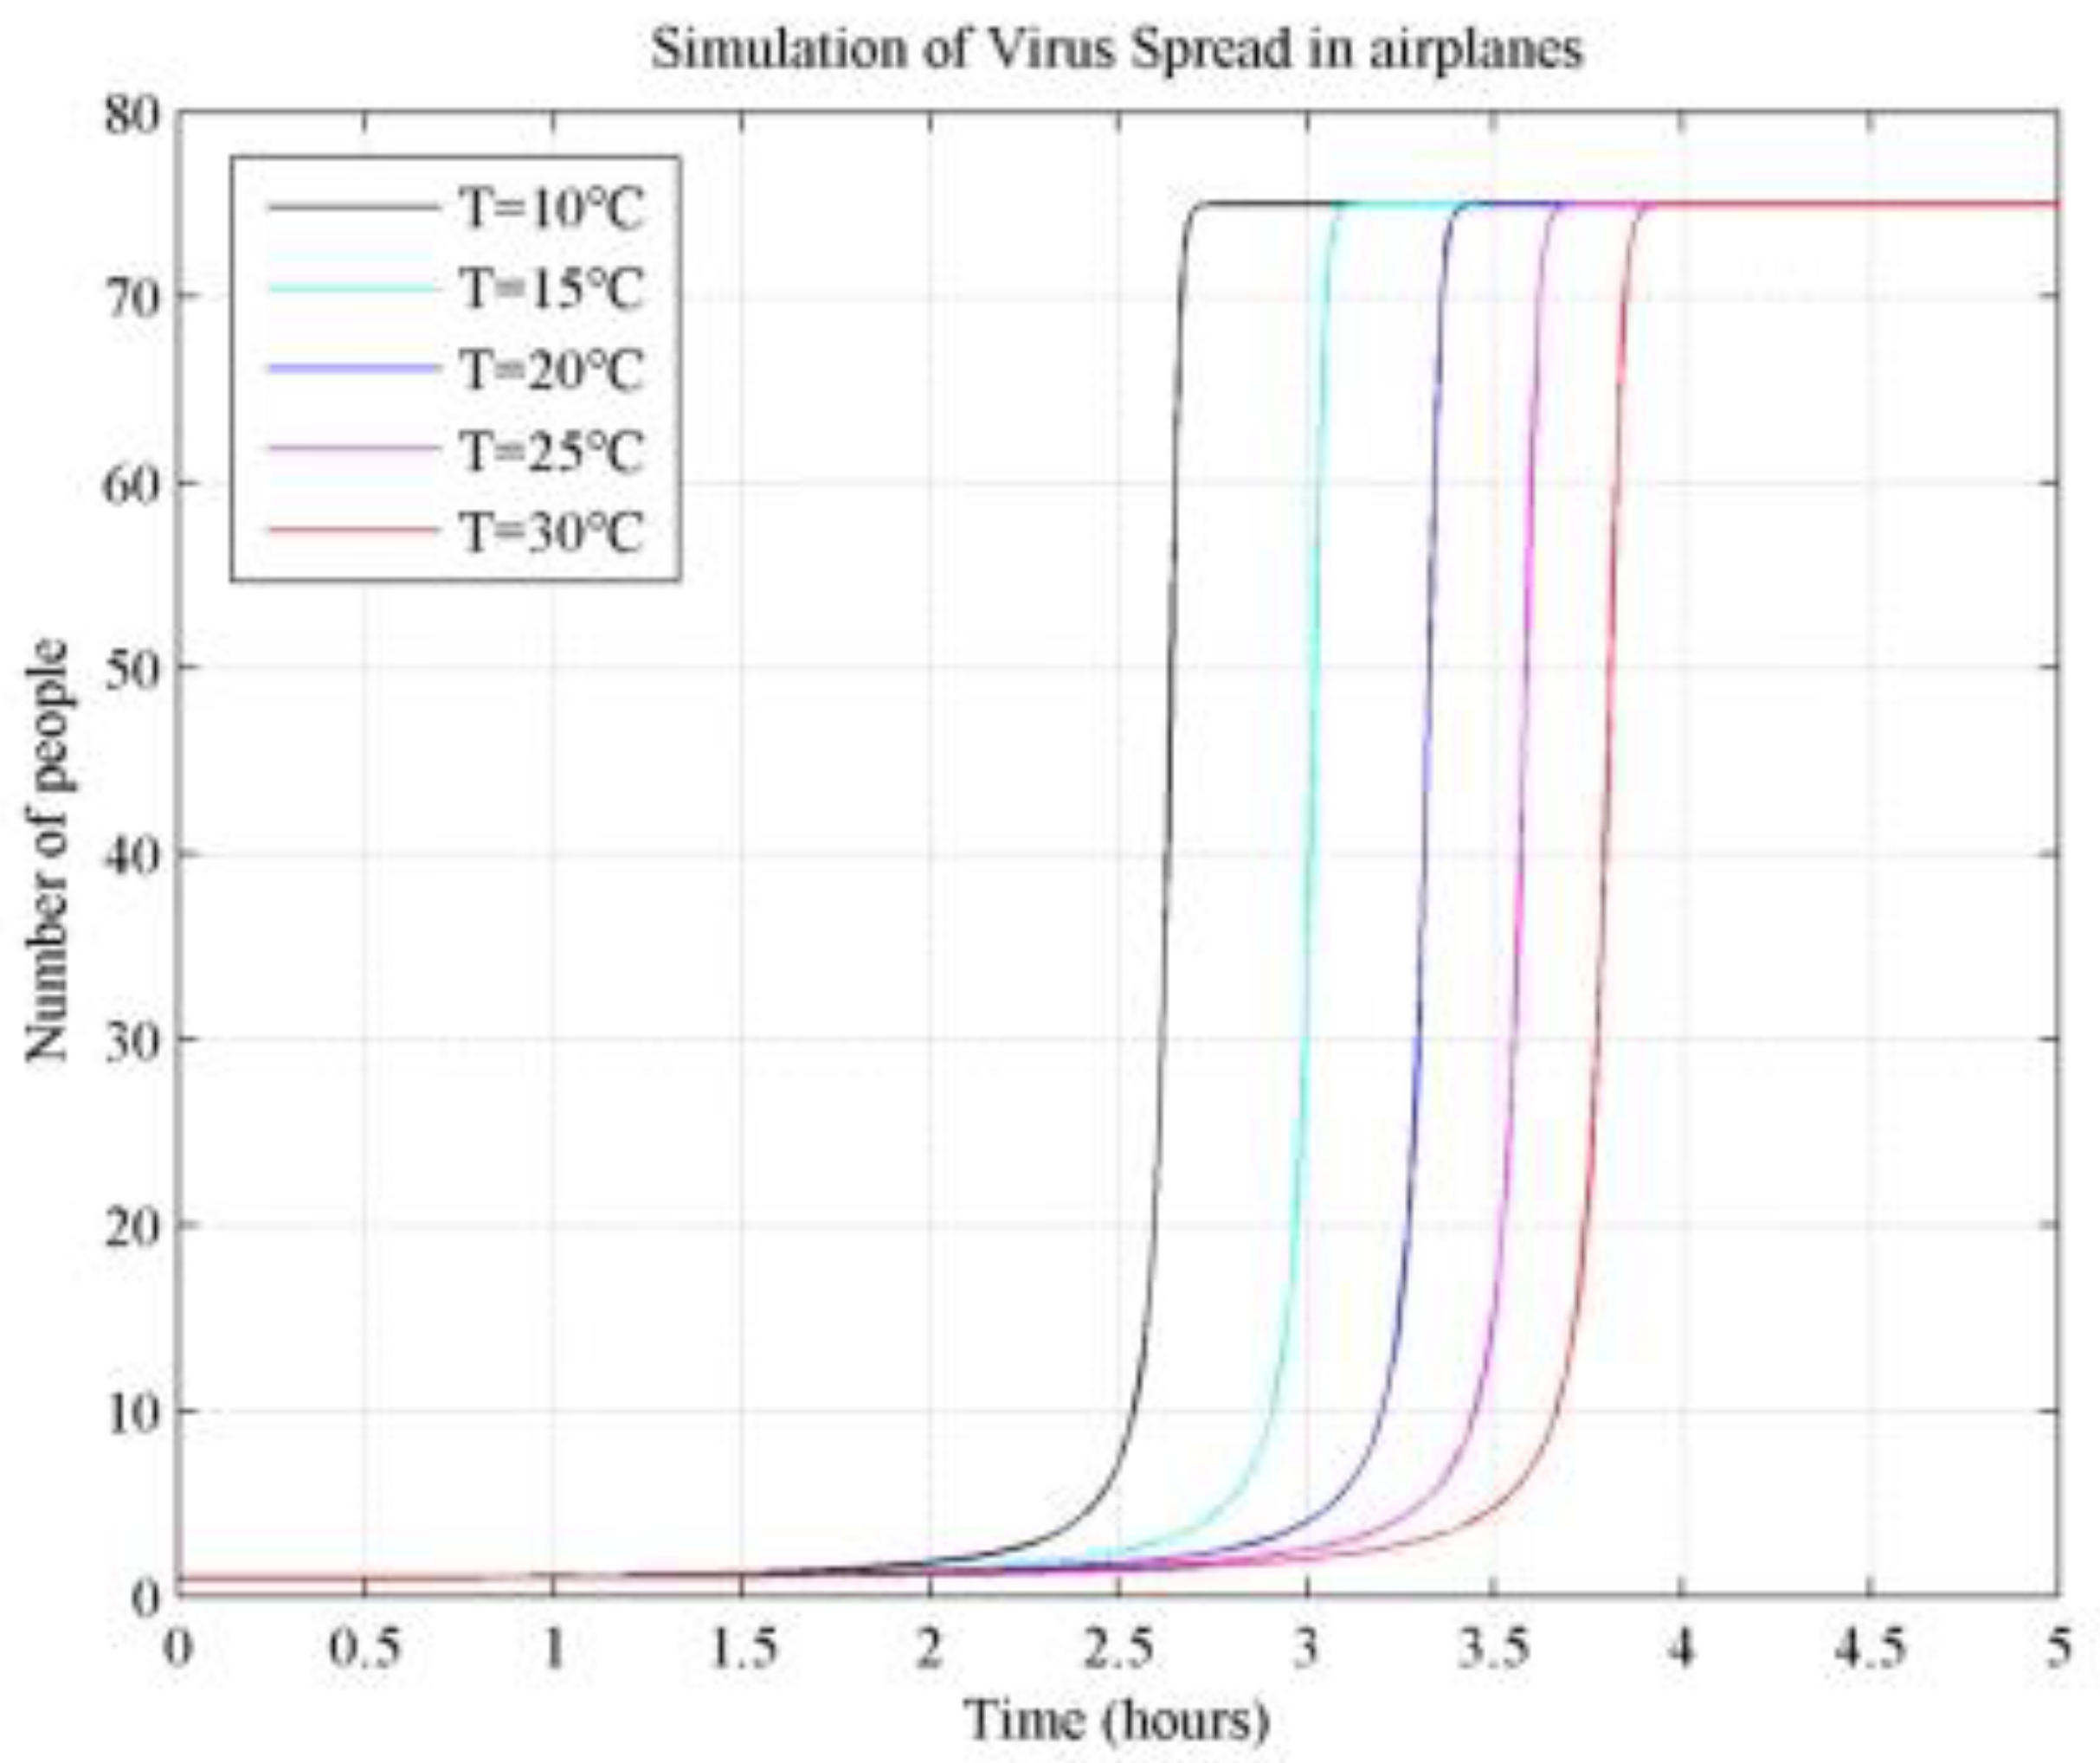
Table 4 shows the effect of temperature change on virus transmission in the cabin. It can be observed from the table that the appearance of the infected person is constantly delayed as the temperature (T) increases from 10 °C to 30 °C. For flight times shorter than 2.5 h, infections may not occur in cabins with temperatures greater than 20 °C. It took 3.95 h to infect everyone on the airplane when T changed from 30 °C to 10 °C, which is 2.74 h shorter compared to the former scenario. This suggests that as the temperature rises, the number of infected individuals within the cabin tends to decrease. This conforms to the law of biology, because low temperature is beneficial to the survival of the virus. The lower the temperature, the longer the half-life of the virus, and the longer the infectivity in the air and on the surface [41,42]. At the same time, cold air can also stimulate the respiratory tract, causing symptoms such as runny nose and spraying, and respiratory pathogens represented by influenza virus can be transmitted by droplets. The effects of cabin temperature changes on virus transmission are shown in Appendix A (Figure A3).

3.2. Effect of Relative Humidity on Virus Transmission

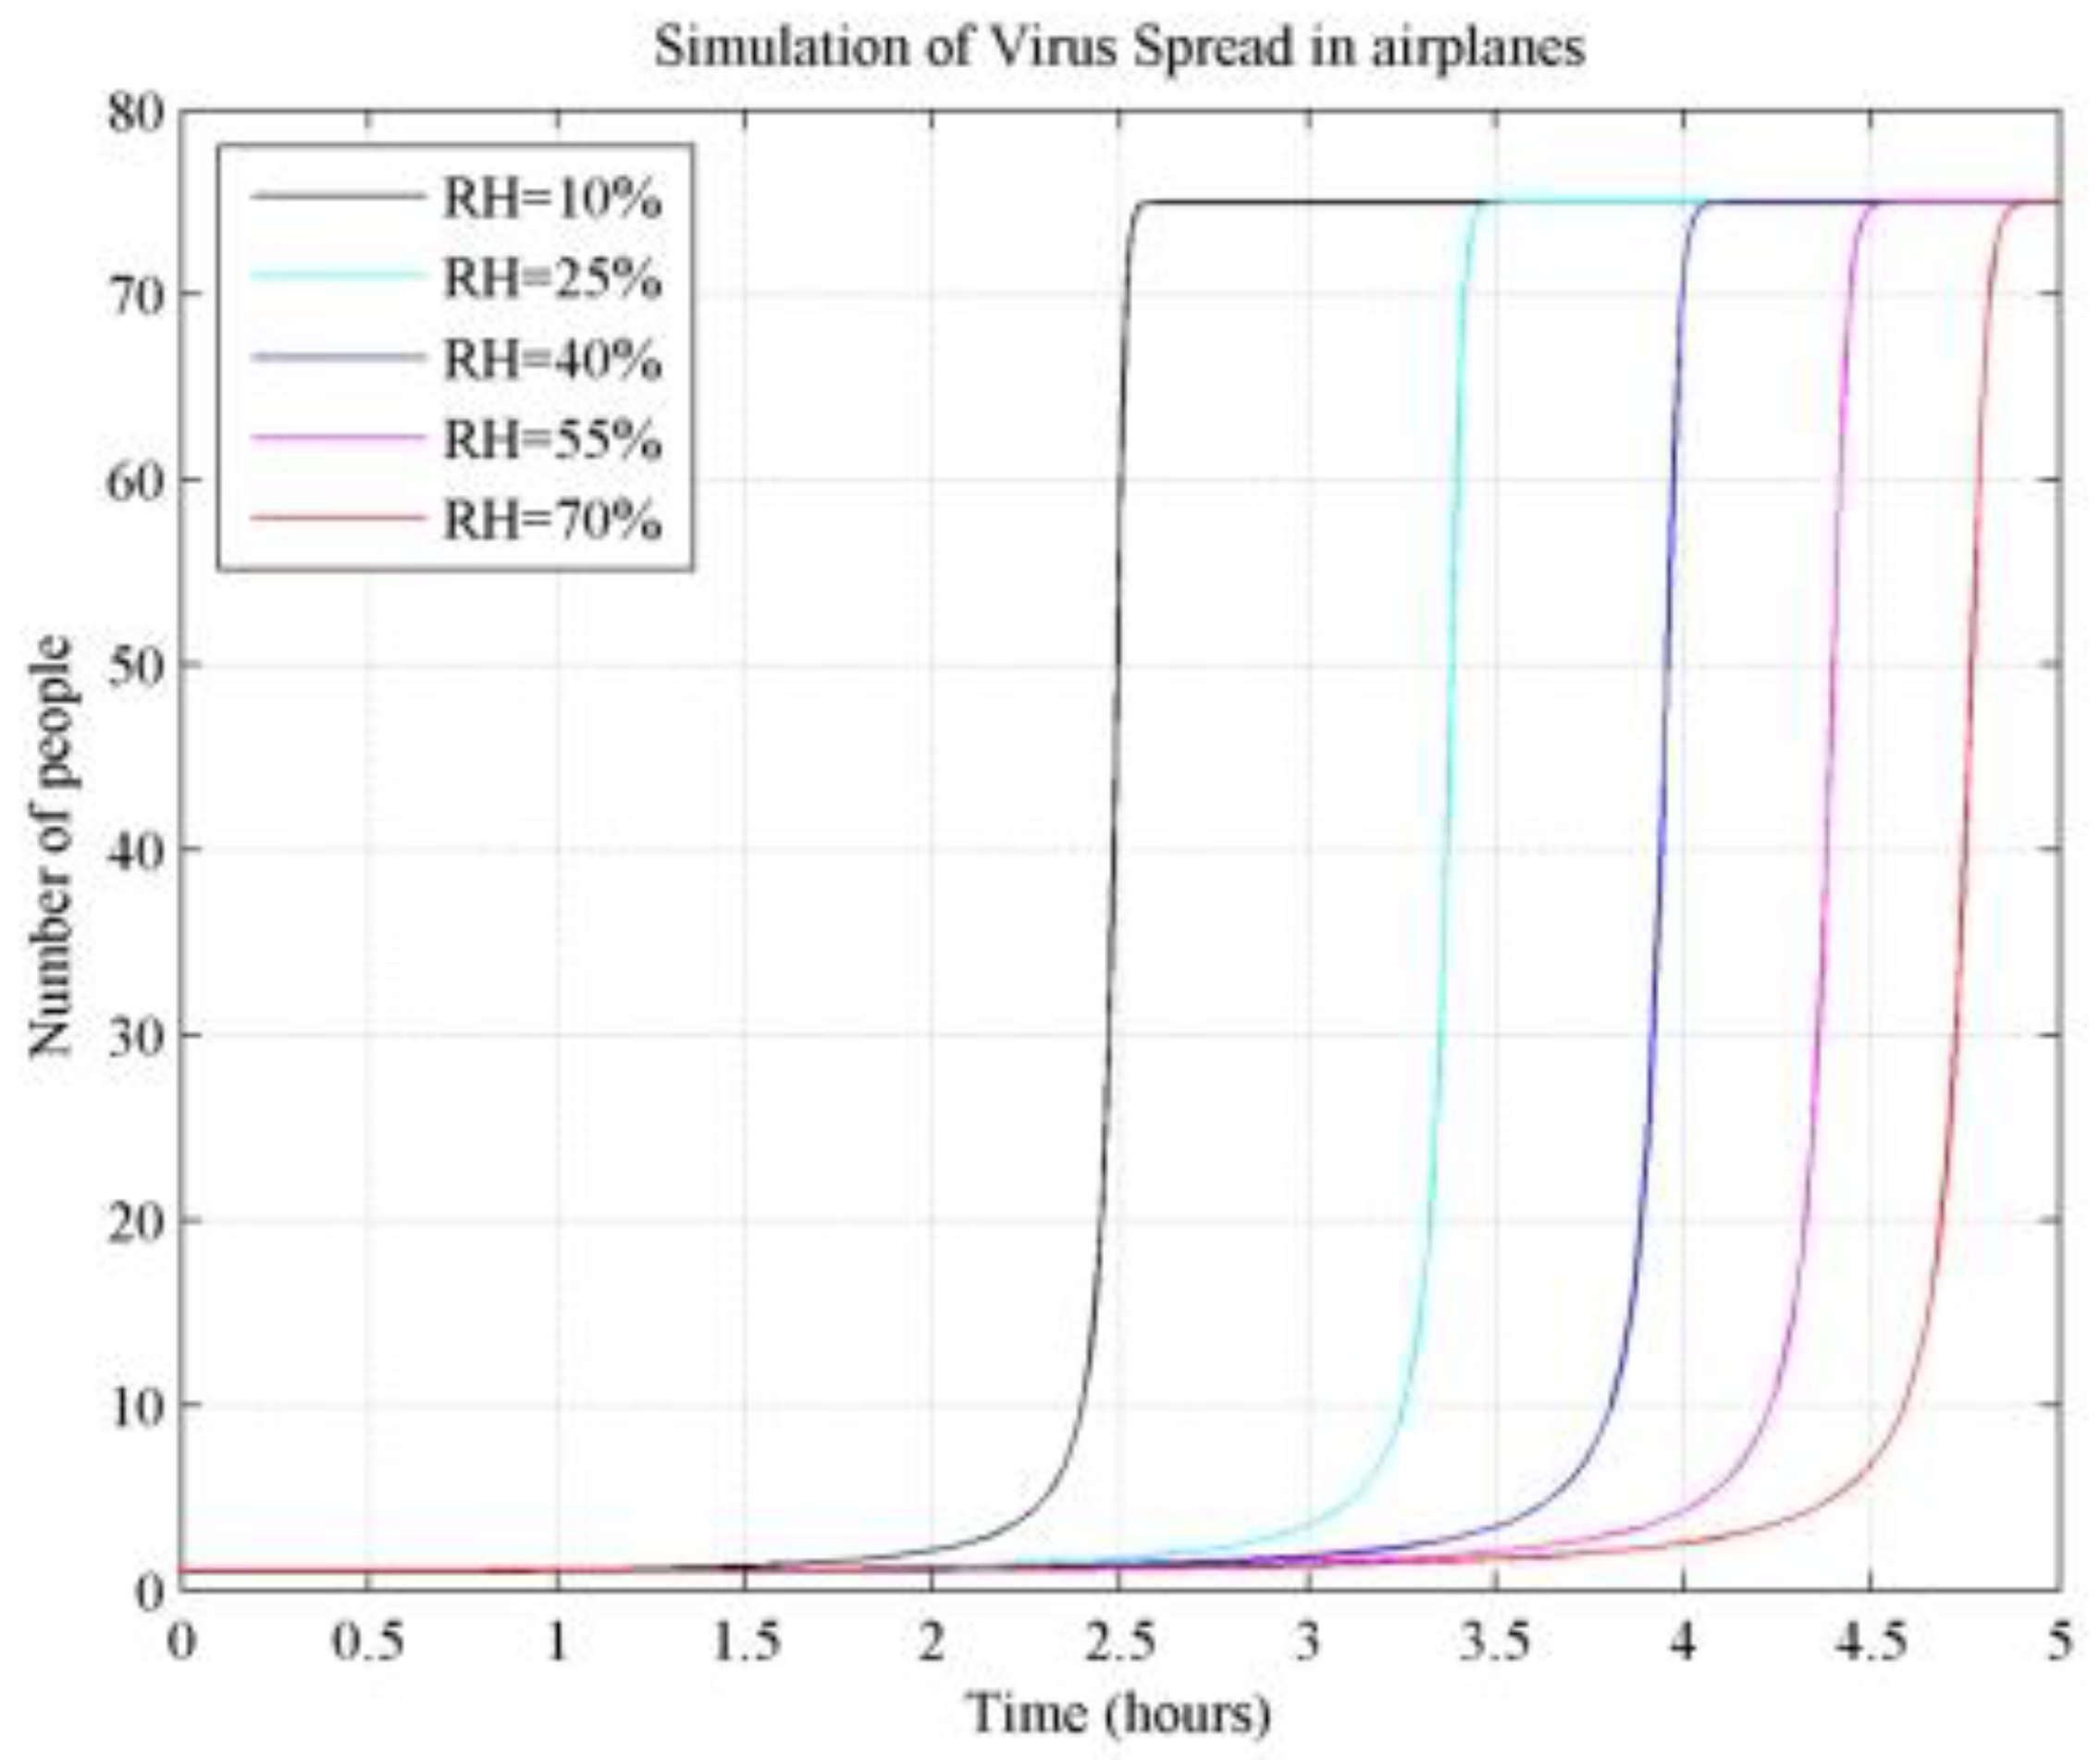
Table 5 illustrates the impact of changes in relative humidity on the spread of the virus within the cabin as the relative humidity increases from 10% to 70%. The table demonstrates that the onset of infection is consistently delayed as the relative humidity value increases from 10% to 70%. If the flight duration is less than 3.5 h, the infection may not occur in the cabin when the humidity is above 55%. It takes approximately 5 h for everyone on the airplane to become infected at RH = 70%, whereas at RH = 10%, it only takes 2.6 h, which is more than two hours shorter. This indicates that the number of infected individuals in the cabin decreases as the relative humidity increases. Moreover, the decline in the proportion of infected individuals from 10% to 25% is significantly bigger than the decline seen when the relative humidity keeps rising from 25% to 40%, 40% to 55%, or 55% to 70%. From a biological point of view, relative humidity affects the survivability of the virus, and low humidity is beneficial to the survival of the virus in the air or on the surface [43,44]. At the same time, dry air will dehydrate the body’s respiratory mucosa, reduce their protective effect, improve the aerosol transmission ability of bacteria, and increase the possibility of infection. The effect of changes in cabin relative humidity on virus transmission is shown in Appendix A (Figure A4).

3.3. Effect of the Number of Air Changes on Virus Transmission

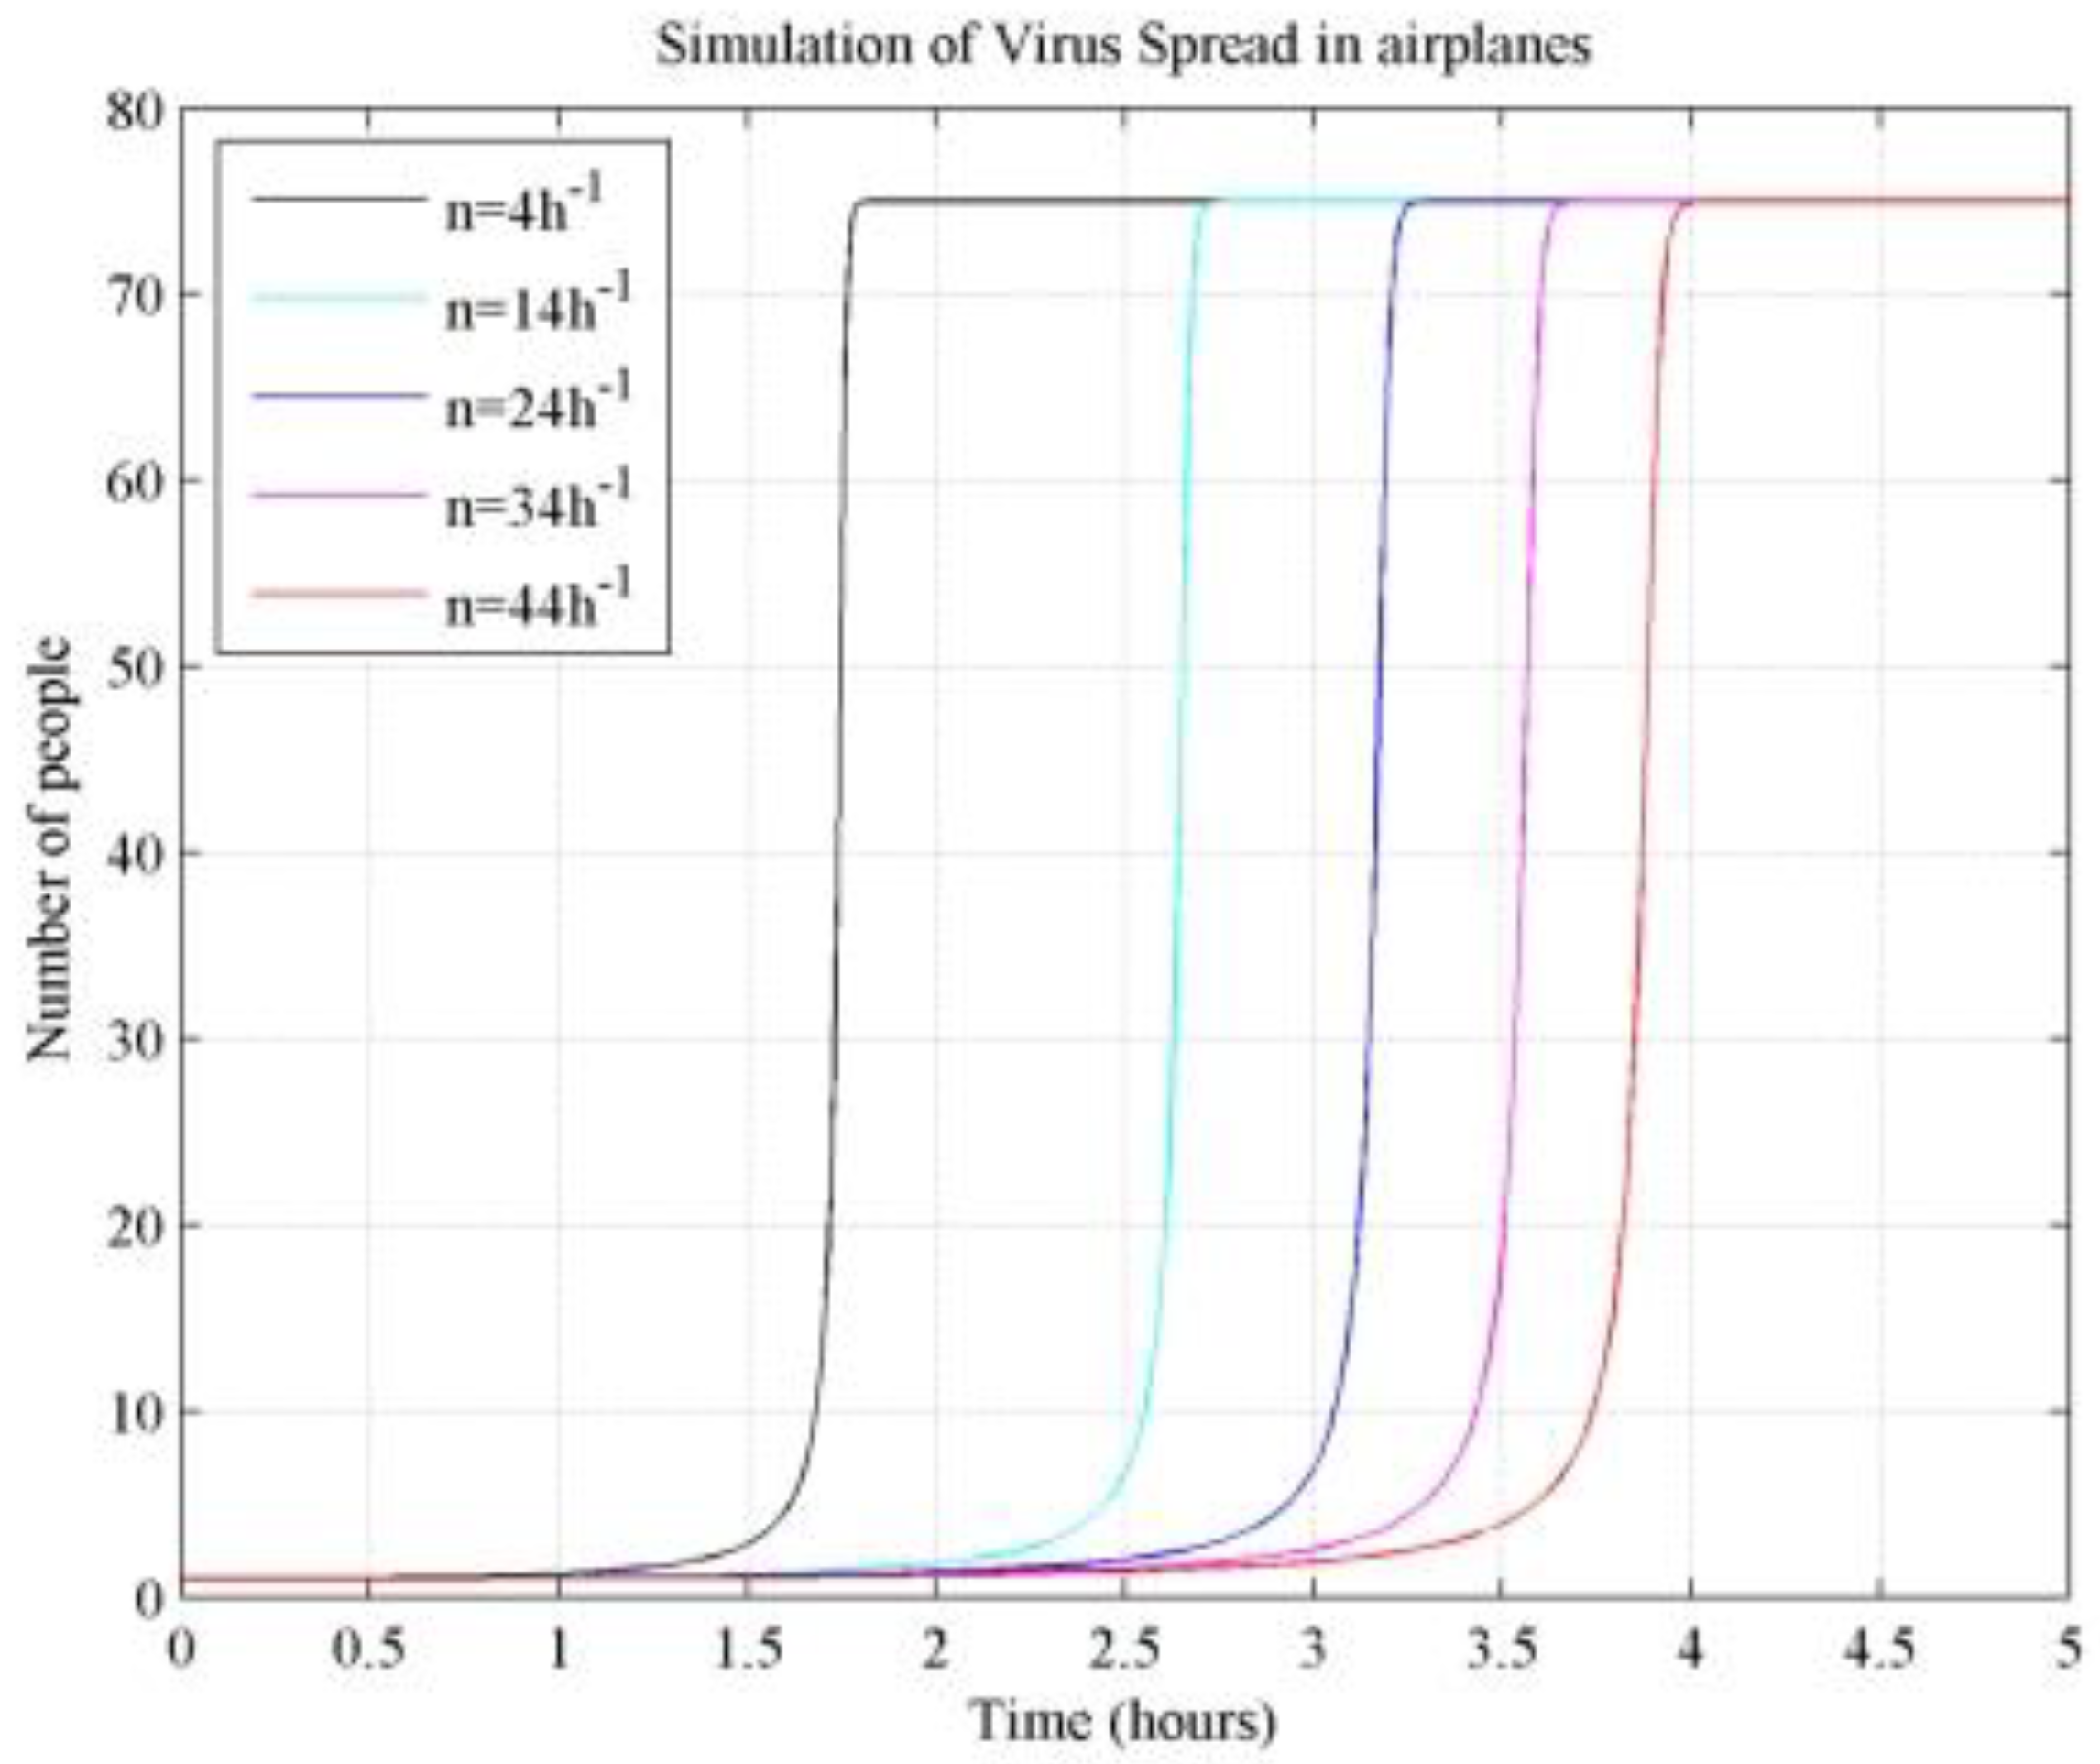
Table 6 presents the effect of the change in the number of air changes within the cabin on the spread of the virus, specifically as the number of air changes (n) increases from 4 h−1 to 44 h−1. The table reveals that the onset of infection is consistently delayed as the number of air changes (n) increases from 4 h−1 to 44 h−1. If the flight duration is less than 3 h, infection may not occur in the cabin with a higher number of air changes. It takes 4 h for everyone on the airplane to become infected at n = 44 h−1, whereas at n = 4 h−1, it only takes 1.8 h, which is more than two hours shorter. This indicates that the number of infected individuals in the cabin tends to decrease with an increase in the number of air changes. Additionally, the decrease in the number of infected people from 4 h−1 to 14 h−1 is much larger than the decrease observed when the number of air changes continues to increase, such as from 14 h−1 to 24 h−1, 24 h−1 to 34 h−1, or 34 h−1 to 44 h−1. The effects of cabin air changes on virus transmission are shown in Appendix A (Figure A5).

3.4. Effect of the Number of Susceptible Persons on Virus Transmission

Table 7 demonstrates the effect of the change in the number of susceptible individuals within the cabin on the spread of the virus as the number of susceptible individuals increases from 35 to 115. The table indicates that the onset of infection is consistently advanced as the number of individuals increases from 35 to 115. If the flight duration is less than 3 h, individuals below 55 may not yet show signs of infection in the cabin. It takes approximately 5 h for everyone on the airplane to become infected when the number of susceptible individuals increases from 35 to 115, which is only 2.2 h shorter compared to the former scenario. This implies that as the number of people who are susceptible rises, so does the number of infected people in the cabin. The impact of changes in the number of susceptible persons in the cabin on the spread of the virus is shown in Appendix A (Figure A6).

3.5. Statistical Analysis

Table 8 was obtained through a least squares linear regression analysis of the data presented in Table 4, Table 5, Table 6 and Table 7. The t-test in the linear regression analysis indicates that temperature has the greatest degree of influence on virus transmission, followed by the number of susceptible peoples, while the number of air changes and humidity are approximated and ranked later. However, it was analyzed in terms of sensitivity, as shown in Table 9. The infection situation was most sensitive to increases or decreases in the number of susceptible persons at each stage and more sensitive to changes in temperature below 15 °C, relative humidity below 25%, and the number of air changes below 14 h−1.

3.6. Practical Applications and Discussions

First of all, for government transport agencies for bus, train, and other short-distance public transport industries, according to the difference between seasons, the model can be used to calculate the optimal air-conditioning temperature in the cabin and the frequency of window ventilation according to the actual number of people, so as to minimize the probability of infection on a bus. For closed transportation vehicles such as high-speed trains and airplanes, it is more important to control the number of passengers in the cabin by regulating seat distance. At the same time, in the future battle against influenza prevention and control, the first priority should be given to controlling indoor temperature in densely populated areas or confined spaces. As shown in Table 4, the environmental temperature should be set to avoid the onset time of infection in order to prevent large-scale disease outbreaks. Additionally, when conditions permit and comfort is taken into consideration, humidity and air exchange frequency should be regulated.
Secondly, for the general public, when actually traveling during a pandemic, the traveling time and the number of people in the cabin will be the considerations of passengers in choosing their means of travel. For example, they will choose whether to travel by high-speed rail, which has a longer exposure time, or by air, which has a shorter exposure time, and choose whether to travel by large aircraft or small aircraft. In addition, depending on the seasonal temperature, passengers will choose whether or how to switch on the air-conditioning system next to their seats.
Furthermore, in order to guide virus research in interpersonal communication through animal experiments, it is necessary to control the temperature strictly and compare living environments. Experiments can be conducted at different temperature gradients to achieve more accurate and meaningful results. The number of susceptible animals that have been set randomly must also be taken into account. In conditional cases, air humidity, wind speed, and frequency of exposure can also be considered.

4. Conclusions

The main contribution of this study is the establishment of an analogous model of animal contact probability, which allows for the comparison of complex probabilities of interpersonal contact based on analogizable qualities observed in animal experimentation and interpersonal interactions. A dynamic model of respiratory infectious diseases was developed to incorporate environmental factors into the process of respiratory virus transmission. This study also made advancements in exploring the transmission mechanism within the same indoor space as the patient, thereby expanding the research value of animal experiments. Additionally, it provides suggestions for the need to strictly control temperature as an environmental factor in animal virus transmission experiments.
Admittedly, there are some limitations to our work. Firstly, in the modeling study of respiratory virus infection using the analogy model, there were subjective factors involved in selecting the environmental impact factors, and only the main influencing factors were considered in the qualitative analysis. For example, further research is needed to explore the specific circumstances under which temperatures need to be regulated and within what range. Secondly, due to variations in protective measures and immunity among individuals, the probability of virus infection may differ from person to person, requiring additional adjustments to the model.

Author Contributions

Conceptualization, Y.L. and E.L.; methodology, Y.L. and E.L.; software, Y.L.; validation, Y.J. and L.G.; formal analysis, Y.L. and W.H.; investigation, Y.L. and Y.J.; resources, E.L.; data curation, Y.L.; writing—original draft preparation, Y.L.; writing—review and editing, Y.L.; visualization, Y.L. and Z.C.; supervision, Y.L. and X.J.; project administration, Y.L.; funding acquisition, Y.L. All authors have read and agreed to the published version of the manuscript.

Funding

This work is supported by the National Natural Science Foundation of China (52078314), the National Natural Science Foundation of China (52308107), the Natural Science Foundation of Sichuan Province (2024YFHZ0343), and the China Postdoctoral Science Foundation (2024M752212).

Data Availability Statement

The original data obtained in this study are included in the article. Further inquiries can be directed to the corresponding author.

Conflicts of Interest

The authors declare no conflicts of interest.

Appendix A

For the sake of the integrity of the paper, the inclusion of these pictures will make the main content of the paper results not prominent enough. However, these six images are important additions to understanding the content of the text. Therefore, it is placed in Appendix A.
Figure A1. The number of infected and susceptible people in the school respiratory infectious disease dynamic model calculation. The red and blue lines in the graphs represent the trend of the number of susceptible and infected persons, respectively, with respect to the exposure time. Based on the exposure time of 6h in the real situation, the current infection rate value was calculated in the infection rate model calculation graph and compared with the real data for validation.
Buildings 14 02974 g0a1
Figure A2. The number of infected and susceptible people in aircraft cabins respiratory infectious disease dynamic model calculations. The red and blue lines in the graphs represent the trend of the number of susceptible and infected persons, respectively, with respect to the exposure time. Based on the exposure time of 3.33h in the real situation, the current infection rate value was calculated in the infection rate model calculation graph and compared with the real data for validation.
Buildings 14 02974 g0a2
Figure A3. Effect of temperature change on virus transmission in an aircraft cabin. The different coloured lines represent the trend in the number of susceptible individuals at different temperatures with exposure time, with temperatures increasing from left to right.
Buildings 14 02974 g0a3
Figure A4. Effect of humidity variations on virus propagation in aircraft cabin. The different coloured lines represent the trend in the number of susceptible individuals with exposure time at different relative humidities, with the relative humidity increasing in order from left to right.
Buildings 14 02974 g0a4
Figure A5. Effect of changes in the number of air changes on the spread of viruses in an aircraft cabin. The different coloured lines represent the trend of the number of susceptible individuals with exposure time at different numbers of breath changes, with the number of breath changes increasing from left to right.
Buildings 14 02974 g0a5
Figure A6. Effect of changes in the number of susceptible people on the spread of viruses within an aircraft cabin. The different coloured lines represent the trends in the number of susceptible individuals with exposure time for different total numbers of susceptible individuals, with the total number of susceptible individuals decreasing from left to right.
Buildings 14 02974 g0a6

References

  1. Gu, Z.; Han, J.; Zhang, L.; Wang, H.; Luo, X.; Meng, X.; Zhang, Y.; Niu, X.; Lan, Y.; Wu, S.; et al. Unanswered questions on the airborne transmission of COVID-19. Environ. Chem. Lett. 2023, 21, 725–739. [Google Scholar] [CrossRef] [PubMed]
  2. Zhang, S.; Lin, Z. Dilution-based evaluation of airborne infection risk-Thorough expansion of Wells-Riley model. Build. Environ. 2021, 194, 107674. [Google Scholar] [CrossRef] [PubMed]
  3. Andrup, L.; Krogfelt, K.A.; Hansen, K.S.; Madsen, A.M. Transmission route of rhinovirus-the causative agent for common cold. A systematic review. Am. J. Infect. Control 2023, 51, 938–957. [Google Scholar] [CrossRef] [PubMed]
  4. Le Sage, V.; Lowen, A.C.; Lakdawala, S.S. Block the Spread: Barriers to Transmission of Influenza Viruses. Annu. Rev. Virol. 2023, 10, 347–370. [Google Scholar] [CrossRef]
  5. Rawat, M.S.; Roberts, A.D.D.; Brown, D.M.M.; Ferro, A.R.R. Resuspension of Seeded Particles Containing Live Influenza A Virus in a Full-Scale Laboratory. Buildings 2023, 13, 1734. [Google Scholar] [CrossRef]
  6. Nicas, M. An Analytical Framework for Relating Dose, Risk, and Incidence: An Application to Occupational Tuberculosis Infection. Risk Anal. 1996, 16, 527–538. [Google Scholar] [CrossRef]
  7. Nazaroff, W.W.; Nicas, M.; Miller, S.L. Framework for Evaluating Measures to Control Nosocomial Tuberculosis Transmission. Indoor Air 1998, 8, 205–218. [Google Scholar] [CrossRef]
  8. Fisk, W.; Seppanen, O.; Faulkner, D.; Huang, J. Economic Benefits of an Economizer System: Energy Savings and Reduced Sick Leave. ASHRAE Trans. 2005, 111, 673–679. [Google Scholar]
  9. Franchimon, F.; Pernot, C.E.E.; Khoury, E.; Bronswijk, J.E.M.H. The feasibility of indoor humidity control against avian influenza. In Proceedings of the 11th International Conference on Indoor Air Quality and Climate (Indoor Air 2008), Copenhagen, Denmark, 17–22 August 2008. [Google Scholar]
  10. Gao, C.X.; Li, Y.; Wei, J.; Cotton, S.; Hamilton, M.; Wang, L.; Cowling, B.J. Multi-route respiratory infection: When a transmission route may dominate. medRxiv 2020, 752, 141856. [Google Scholar] [CrossRef]
  11. Aganovic, A.; Cao, G.; Kurnitski, J.; Melikov, A.; Wargocki, P. Zonal modeling of air distribution impact on the long-range airborne transmission risk of SARS-CoV-2. Appl. Math. Model. 2022, 112, 800–821. [Google Scholar] [CrossRef]
  12. Bougoffa, L.; Bougouffa, S.; Khanfer, A. Approximate and Parametric Solutions to SIR Epidemic Model. Axioms 2024, 13, 201. [Google Scholar] [CrossRef]
  13. Khyar, O.; Allali, K. Global dynamics of a multi-strain SEIR epidemic model with general incidence rates: Application to COVID-19 pandemic. Nonlinear Dyn. 2020, 102, 489–509. [Google Scholar] [CrossRef] [PubMed]
  14. Kozyreff, G. Hospitalization dynamics during the first COVID-19 pandemic wave: SIR modelling compared to Belgium, France, Italy, Switzerland and New York City data. Infect. Dis. Model. 2021, 6, 398–404. [Google Scholar] [CrossRef] [PubMed]
  15. Ram, V.; Schaposnik, L.P. A modified age-structured SIR model for COVID-19 type viruses. Sci. Rep. 2021, 11, 15194. [Google Scholar] [CrossRef]
  16. Aikebaier, S.; Song, Y.; Li, M.; Liu, J. Exploring the Impact and Prevention of Epidemics from a New Perspective: COVID-19 Transmission through Express Boxes. Int. J. Environ. Res. Public Health 2022, 19, 16884. [Google Scholar] [CrossRef]
  17. Onkhonova, G.; Gudymo, A.; Kosenko, M.; Marchenko, V.; Ryzhikov, A. Quantitative measurement of influenza virus transmission in animal model: An overview of current state. Biophys. Rev. 2023, 15, 1359–1366. [Google Scholar] [CrossRef]
  18. Sun, X.; Belser, J.A.; Pulit-Penaloza, J.A.; Brock, N.; Kieran, T.J.; Zeng, H.; Pappas, C.; Tumpey, T.M.; Maines, T.R.; Peiris, M. A naturally occurring HA-stabilizing amino acid (HA1-Y17) in an A(H9N2) low-pathogenic influenza virus contributes to airborne transmission. mBio 2024, 15, e0295723. [Google Scholar] [CrossRef]
  19. Port, J.R.; Morris, D.H.; Riopelle, J.C.; Yinda, C.K.; Avanzato, V.A.; Holbrook, M.G.; Bushmaker, T.; Schulz, J.E.; Saturday, T.A.; Barbian, K.; et al. Host and viral determinants of airborne transmission of SARS-CoV-2 in the Syrian hamster. eLife 2024, 12, RP87094. [Google Scholar] [CrossRef] [PubMed]
  20. Stauft, C.B.; Selvaraj, P.; D′Agnillo, F.; Meseda, C.A.; Liu, S.; Pedro, C.L.; Sangare, K.; Lien, C.Z.; Weir, J.P.; Starost, M.F.; et al. Intranasal or airborne transmission-mediated delivery of an attenuated SARS-CoV-2 protects Syrian hamsters against new variants. Nat. Commun. 2023, 14, 3393. [Google Scholar] [CrossRef]
  21. Pulit-Penaloza, J.A.; Brock, N.; Belser, J.A.; Sun, X.; Pappas, C.; Tumpey, T.M.; Maines, T.R. Kinetics and magnitude of viral RNA shedding as indicators for Influenza A virus transmissibility in ferrets. Commun. Biol. 2023, 6, 90. [Google Scholar] [CrossRef]
  22. Gudymo, A.; Onkhonova, G.; Danilenko, A.; Susloparov, I.; Danilchenko, N.; Kosenko, M.; Moiseeva, A.; Kolosova, N.; Svyatchenko, S.; Marchenko, V.; et al. Quantitative Assessment of Airborne Transmission of Human and Animal Influenza Viruses in the Ferret Model. Atmosphere 2023, 14, 471. [Google Scholar] [CrossRef]
  23. Kuehl, P.J.; Dearing, J.; Werts, A.; Cox, J.; Irshad, H.; Barrett, E.G.; Tucker, S.N.; Langel, S.N. Design and validation of an exposure system for efficient inter-animal SARS-CoV-2 airborne transmission in Syrian hamsters. Microbiol. Spectr. 2023, 11, e0471722. [Google Scholar] [CrossRef] [PubMed]
  24. Zhang, Y.; Zhang, Q.; Kong, H.; Jiang, Y.; Gao, Y.; Deng, G.; Shi, J.; Tian, G.; Liu, L.; Liu, J.; et al. H5N1 hybrid viruses bearing 2009/H1N1 virus genes transmit in guinea pigs by respiratory droplet. Science 2013, 340, 1459–1463. [Google Scholar] [CrossRef] [PubMed]
  25. Myung, H.; Joung, Y.S. Contribution of Particulates to Airborne Disease Transmission and Severity: A Review. Environ. Sci. Technol. 2024, 58, 6846–6867. [Google Scholar] [CrossRef]
  26. Zhang, N.; Yang, X.; Su, B.; Dou, Z. Analysis of SARS-CoV-2 transmission in a university classroom based on real human close contact behaviors. Sci. Total Environ. 2024, 917, 170346. [Google Scholar] [CrossRef]
  27. Guo, Y.; Dou, Z.; Zhang, N.; Liu, X.; Su, B.; Li, Y.; Zhang, Y.; Bovell-Benjamin, A. Student close contact behavior and COVID-19 transmission in China’s classrooms. PNAS Nexus 2023, 2, 142. [Google Scholar] [CrossRef]
  28. Lowen, A.C.; Steel, J.; Mubareka, S.; Palese, P. High temperature (30 degrees C) blocks aerosol but not contact transmission of influenza virus. J. Virol. 2008, 82, 5650–5652. [Google Scholar] [CrossRef]
  29. Steel, J.; Lowen, A.C.; Mubareka, S.; Palese, P. Transmission of influenza virus in a mammalian host is increased by PB2 amino acids 627K or 627E/701N. PLoS Pathog. 2009, 5, e1000252. [Google Scholar] [CrossRef]
  30. Lv, J.; Wei, B.; Yang, Y.; Yao, M.; Cai, Y.; Gao, Y.; Xia, X.; Zhao, X.; Liu, Z.; Li, X.; et al. Experimental transmission in guinea pigs of H9N2 avian influenza viruses from indoor air of chicken houses. Virus Res. 2012, 170, 102–108. [Google Scholar] [CrossRef] [PubMed]
  31. Enqi, L.; Hailin, Y.; Weiwang, G. Medical Experimental zoology. Genetic 2008, 30, 918. [Google Scholar]
  32. Chen, S.C.; Chang, C.F.; Liao, C.M. Predictive models of control strategies involved in containing indoor airborne infections. Indoor Air 2006, 16, 469–481. [Google Scholar] [CrossRef] [PubMed]
  33. Sze To, G.N.; Chao, C.Y. Review and comparison between the Wells-Riley and dose-response approaches to risk assessment of infectious respiratory diseases. Indoor Air 2010, 20, 2–16. [Google Scholar] [CrossRef] [PubMed]
  34. Reissner, J.; Siller, P.; Bartel, A.; Roesler, U.; Friese, A. Stability of Feline Coronavirus in aerosols and dried in organic matrices on surfaces at various environmental conditions. Sci. Rep. 2023, 13, 22012. [Google Scholar] [CrossRef] [PubMed]
  35. Doremalen, N.V.; Bushmaker, T.; Munster, V. Stability of Middle East respiratory syndrome coronavirus (MERS-CoV) under different environmental conditions. Eurosurveillance 2013, 18, 20590. [Google Scholar] [CrossRef]
  36. Pyankov, O.V.; Bodnev, S.A.; Pyankova, O.G.; Agranovski, I.E. Survival of aerosolized coronavirus in the ambient air. J. Aerosol Sci. 2018, 115, 158–163. [Google Scholar] [CrossRef]
  37. Birgand, G.; Peiffer-Smadja, N.; Fournier, S.; Kerneis, S.; Lescure, F.X.; Lucet, J.C. Assessment of Air Contamination by SARS-CoV-2 in Hospital Settings. JAMA Netw. Open 2020, 3, e2033232. [Google Scholar] [CrossRef]
  38. Faridi, S.; Niazi, S.; Sadeghi, K.; Naddafi, K.; Yavarian, J.; Shamsipour, M.; Jandaghi, N.Z.S.; Sadeghniiat, K.; Nabizadeh, R.; Yunesian, M.; et al. A field indoor air measurement of SARS-CoV-2 in the patient rooms of the largest hospital in Iran. Sci. Total. Environ. 2020, 725, 138401. [Google Scholar] [CrossRef]
  39. Zhang, C.; Liao, H.; Strobl, E.; Li, H.; Li, R.; Jensen, S.S.; Zhang, Y. The role of weather conditions in COVID-19 transmission: A study of a global panel of 1236 regions. J. Clean. Prod. 2021, 292, 125987. [Google Scholar] [CrossRef] [PubMed]
  40. Park, H.J.; Lee, S.-G.; Oh, J.S.; Nam, M.; Barrett, S.; Lee, S.; Hwang, W. The effects of indoor temperature and humidity on local transmission of COVID-19 and how it relates to global trends. PLoS ONE 2022, 17, e0271760. [Google Scholar] [CrossRef]
  41. Mazur-Panasiuk, N.; Woiniakowski, G. Natural inactivation of African swine fever virus in tissues: Influence of temperature and environmental conditions on virus survival. Vet. Microbiol. 2020, 242, 108609. [Google Scholar] [CrossRef]
  42. Prussin, A.J., II; Schwake, D.O.; Lin, K.; Gallagher, D.L.; Buttling, L.; Marr, L.C. Survival of the Enveloped Virus Phi6 in Droplets as a Function of Relative Humidity, Absolute Humidity, and Temperature. Appl. Environ. Microbiol. 2018, 84, e00551-18. [Google Scholar] [CrossRef] [PubMed]
  43. Lin, K.; Schulte, C.R.; Marr, L.C. Survival of MS2 and φ6 viruses in droplets as a function of relative humidity, pH, and salt, protein, and surfactant concentrations. PLoS ONE 2020, 15, e0243505. [Google Scholar] [CrossRef] [PubMed]
  44. Casanova, L.M.; Jeon, S.; Rutala, W.A.; Weber, D.J.; Sobsey, M.D. Effects of Air Temperature and Relative Humidity on Coronavirus Survival on Surfaces. Appl. Environ. Microbiol. 2010, 76, 2712–2717. [Google Scholar] [CrossRef] [PubMed]
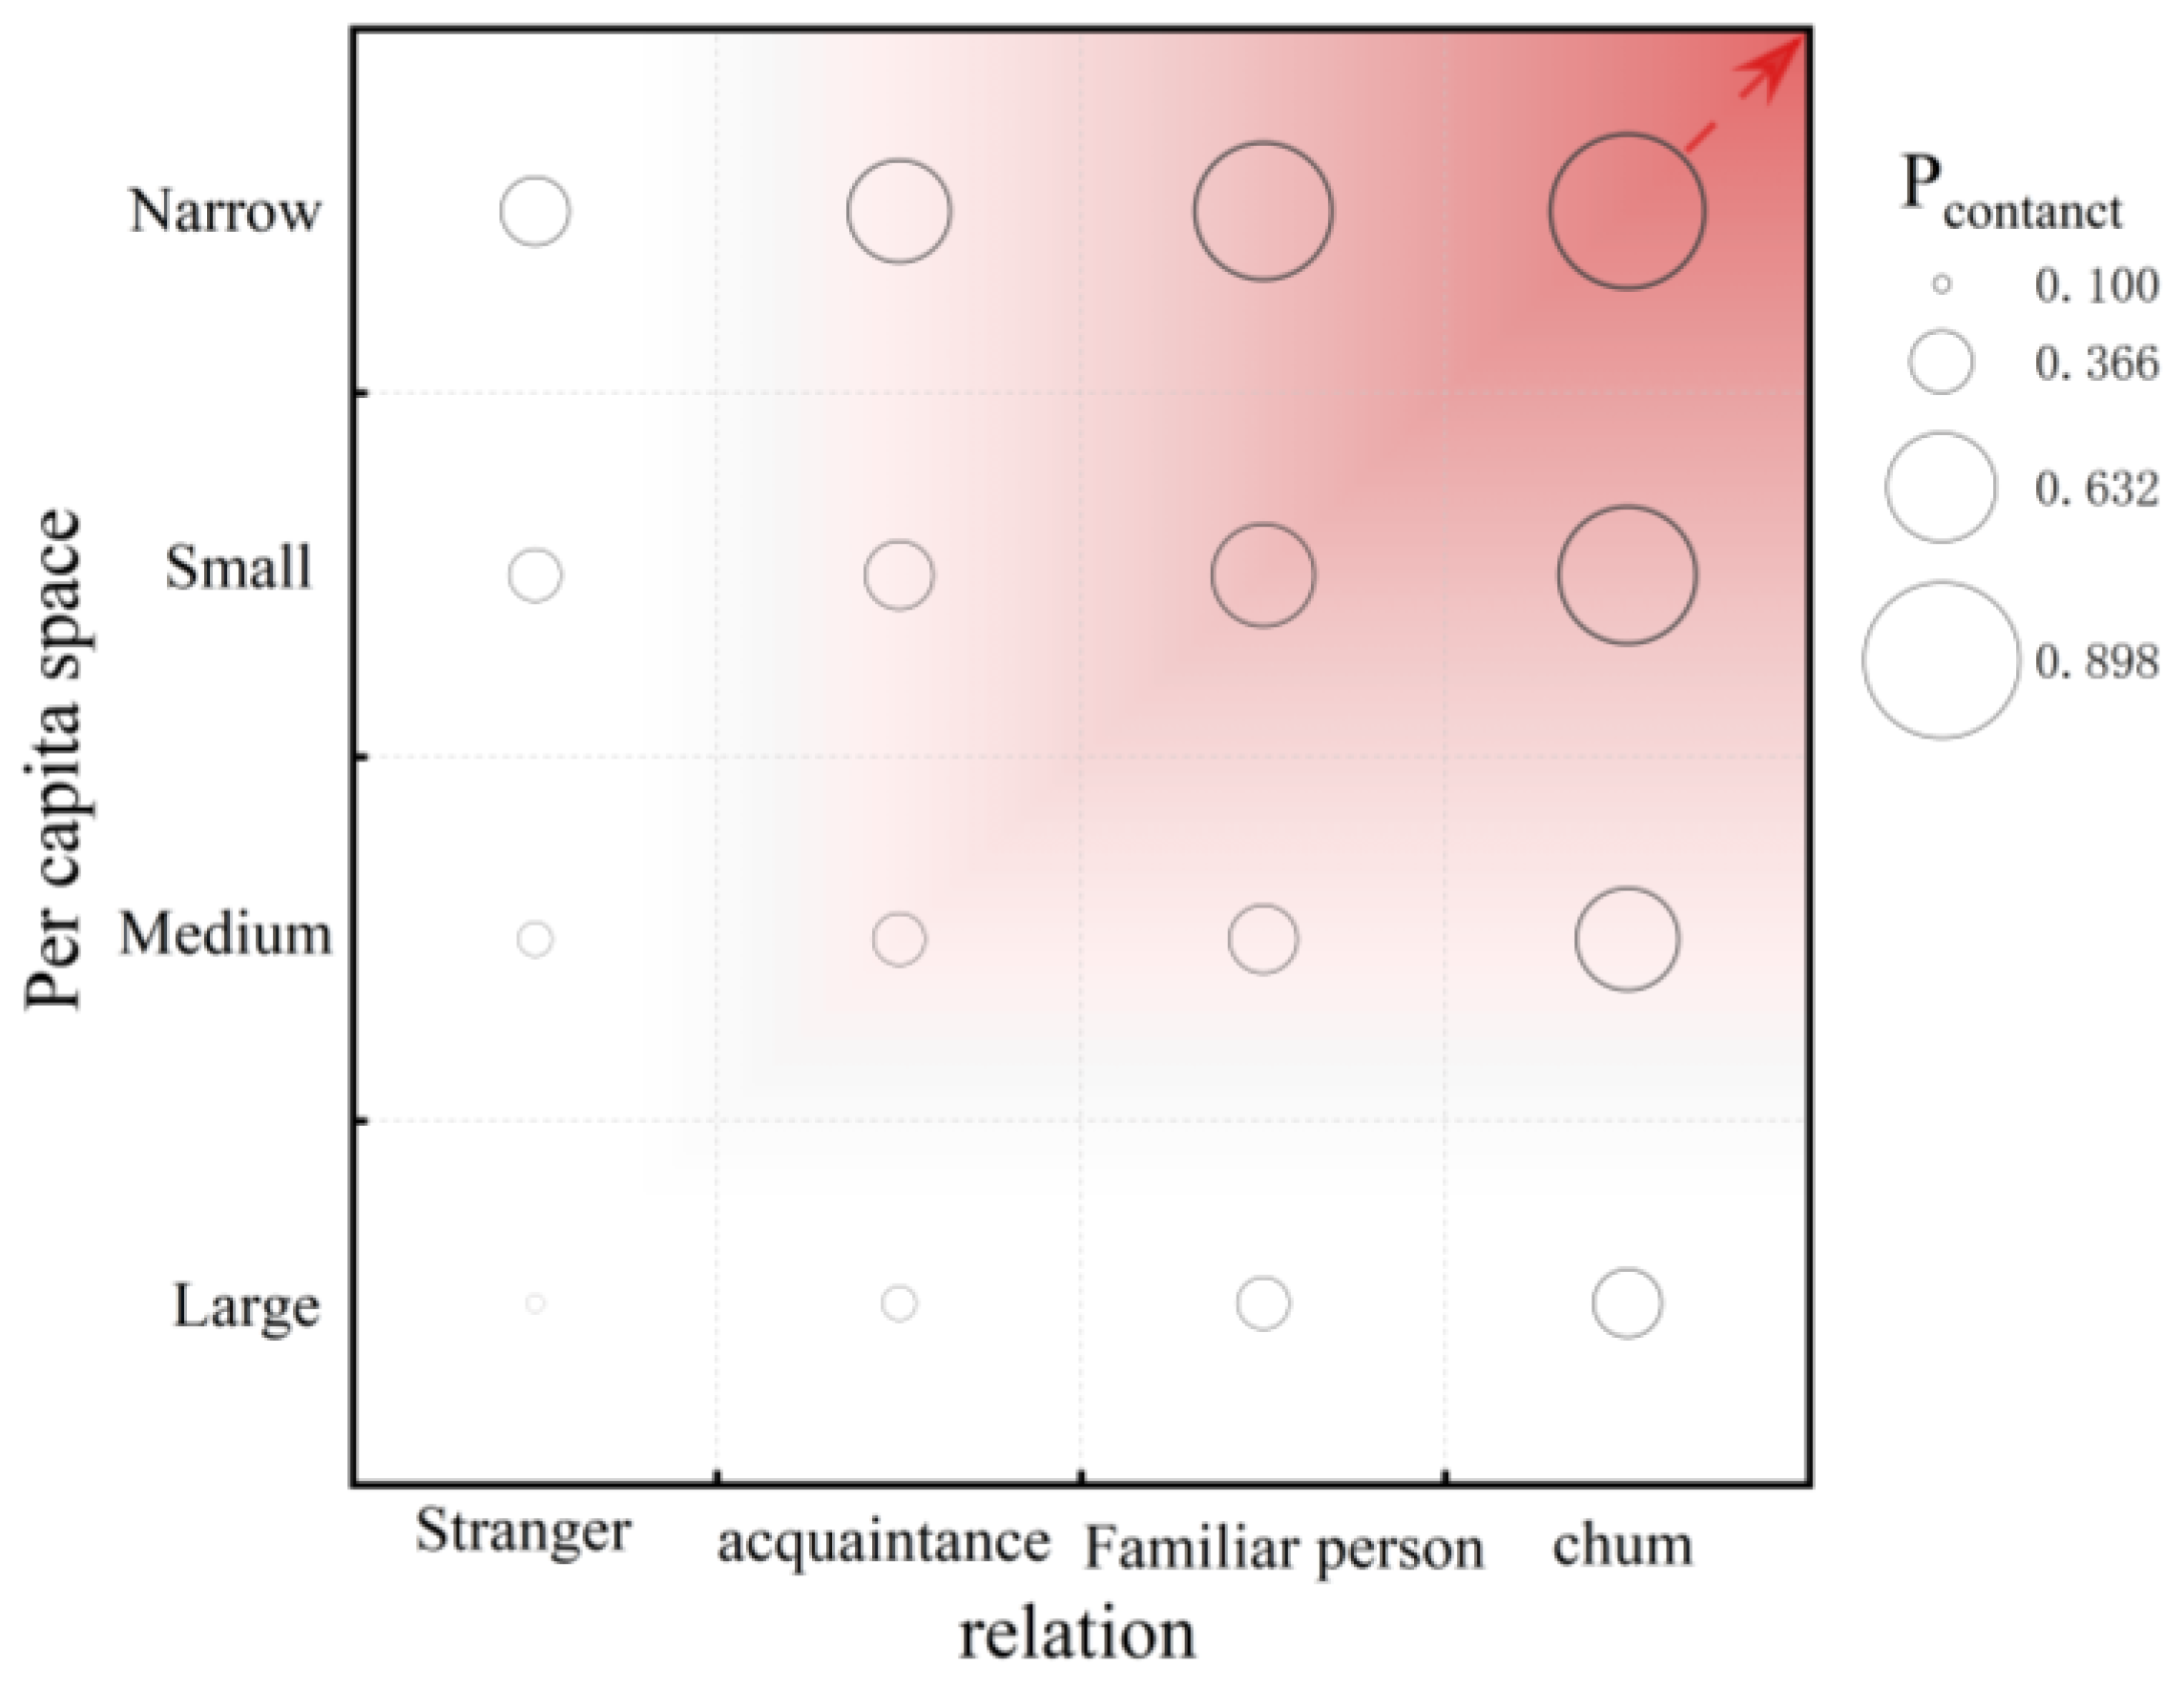
Figure 1. Factors influencing contact probability Pcontact.
Buildings 14 02974 g001
Figure 2. Probabilistic contact model.
Buildings 14 02974 g002
Figure 3. Lower-probability contact model.
Buildings 14 02974 g003
Figure 4. Zero-probability contact model.
Buildings 14 02974 g004
Table 1. Division of exposure probabilities in animal experiments.
Contact FormThe Closest Distance (cm)The Contact Probability Pcontact (%)Literature Sources
collocation0100Lowen A.C. [28]
Steel J. [29]
neighboring cage420Steel J. [29]
Long distance800Lv J. [30]
Table 2. Physiological parameters of experimental animals and humans adapted from [31].
Physiological ParametersGuinea PigMan
adult weight (g)250~35045,000~70,000
core temperature(°C)38.9~39.736.6–38
lung ventilation rate (mL/min)82.8~197.64800~10,000
Table 3. Validation of habitat calculated infection rates.
PlaceTemperature
(°C)
Relative Humidity
(%)
Air Exchange Rate (h−1)oPcontact
%
bExposure
Time
h
Calculation of Infection RateActual Infection RateLiterature Sources
School264062.5250.131460.00510.0052Chen, S.C. [32]
Airplane212522.5706.58733.330.2760.27Sze To, G.N. [33]
Table 4. Analysis of data on the effect of temperature change on infection time.
Temperature (°C)Presence of Infection
(h) I > 2
Outbreak
(h) I > 10
Total Infections
(h) I = 75
102.082.542.74
152.382.93.13
202.63.23.44
252.823.443.7
3033.673.95
Table 5. Analysis of data on the effect of changes in relative humidity on the duration of infection.
Relative Humidity (%)Presence of Infection
(h) I > 2
Outbreak
(h) I > 10
Total Infections
(h) I = 75
101.952.42.6
252.693.253.51
403.123.814.11
553.54.244.57
703.754.594.94
Table 6. Analysis of data on the effect of the number of air changes on the duration of infection.
Number of Air Changes (h−1)Presence of Infection
(h) I > 2
Outbreak
(h) I > 10
Total Infections
(h) I = 75
41.371.681.82
142.12.552.75
242.53.053.27
342.813.433.7
443.13.744.03
Table 7. Analysis of data on the effect of the number of susceptible people on the time of infection.
Susceptible PersonsPresence of Infection
(h) I > 2
Outbreak
(h) I > 10
Total Infections
(h) I = N
1151.692.062.19
952.082.522.7
752.433.013.25
552.923.623.93
353.664.54.99
Table 8. Linear regression analysis of the degree of influence of environmental factors and number of susceptible people on virus transmission.
Independent VariableResultsPresence of Infection
I > 2
Outbreak
I > 10
Total Infections
I = N
Significance Ranking
Temperature (°C)p-value<0.001<0.001<0.0011
t18.65817.59218.009
Beta0.9960.9950.995
Relative humidity (%)p-value0.0030.0020.0033
t8.5049.5039.421
Beta0.980.9840.984
Number of air changes (h−1)p-value0.0040.0040.0044
t8.2197.9268.157
Beta0.9790.9770.978
Susceptible peoplep-value0.0020.0010.0022
t−10.79−12.237−10.8
Beta−0.987−0.99−0.987
Table 9. Interval sensitivity coefficient analysis.
Coefficient of SensitivityIntervalPresence of Infection
I > 2
Outbreak
I > 10
Total Infections
I = N
Temperature (°C)10–150.380.370.37
15–200.280.310.3
20–250.40.350.35
25–300.320.340.34
Relative humidity (%)10–250.450.430.43
25–400.260.280.28
40–550.390.370.36
55–700.260.30.29
Number of air changes (h−1)4–140.480.470.47
14–240.260.270.26
24–340.370.370.39
34–440.350.30.3
Susceptible people115–95−0.88−0.86−0.89
95–75−0.79−0.92−0.96
75–55−0.46−0.46−0.47
55–35−0.69−0.66−0.74
Disclaimer/Publisher’s Note: The statements, opinions and data contained in all publications are solely those of the individual author(s) and contributor(s) and not of MDPI and/or the editor(s). MDPI and/or the editor(s) disclaim responsibility for any injury to people or property resulting from any ideas, methods, instructions or products referred to in the content.