Abstract
The L-shaped partially encased steel–concrete composite (PEC) stub column, composed of profile steel, concrete, and transverse links, tends to occupy less space than the rectangle-shaped PEC column when used as side or corner columns. In this study, an axial compression test involving three L-shaped PEC stub columns was conducted to investigate the influence of critical factors on axial compression performance. The test results indicated that the axial compression capacity can be effectively enhanced with an increase in material strength. Furthermore, finite element (FE) analysis was carried out with parameters such as material strength, steel thickness, transverse link spacing, transverse link diameter, transverse link distribution, and longitudinal rebar diameter. The results revealed that the primary failure modes of L-shaped PEC columns were concrete spalling and local buckling of the flange. Additionally, it was found that the increase in steel strength, steel thickness, and transverse link diameter, as well as the decrease in transverse link spacing, significantly improved the axial compression capacity and concrete confinement effect. However, an increase in concrete strength diminished the concrete confinement effect. Additionally, the accuracy of the axial compression capacity calculation methods in the Eurocode 4 and T/CECS719-2010 specifications for L-shaped PEC stub columns was verified. Finally, a calculation method based on the superposition principle incorporating the concrete confinement effect was proposed, and validated by comparing with experimental and FE results. Overall, this study could provide a theoretical basis for the engineering application of L-shaped PEC columns.
1. Introduction
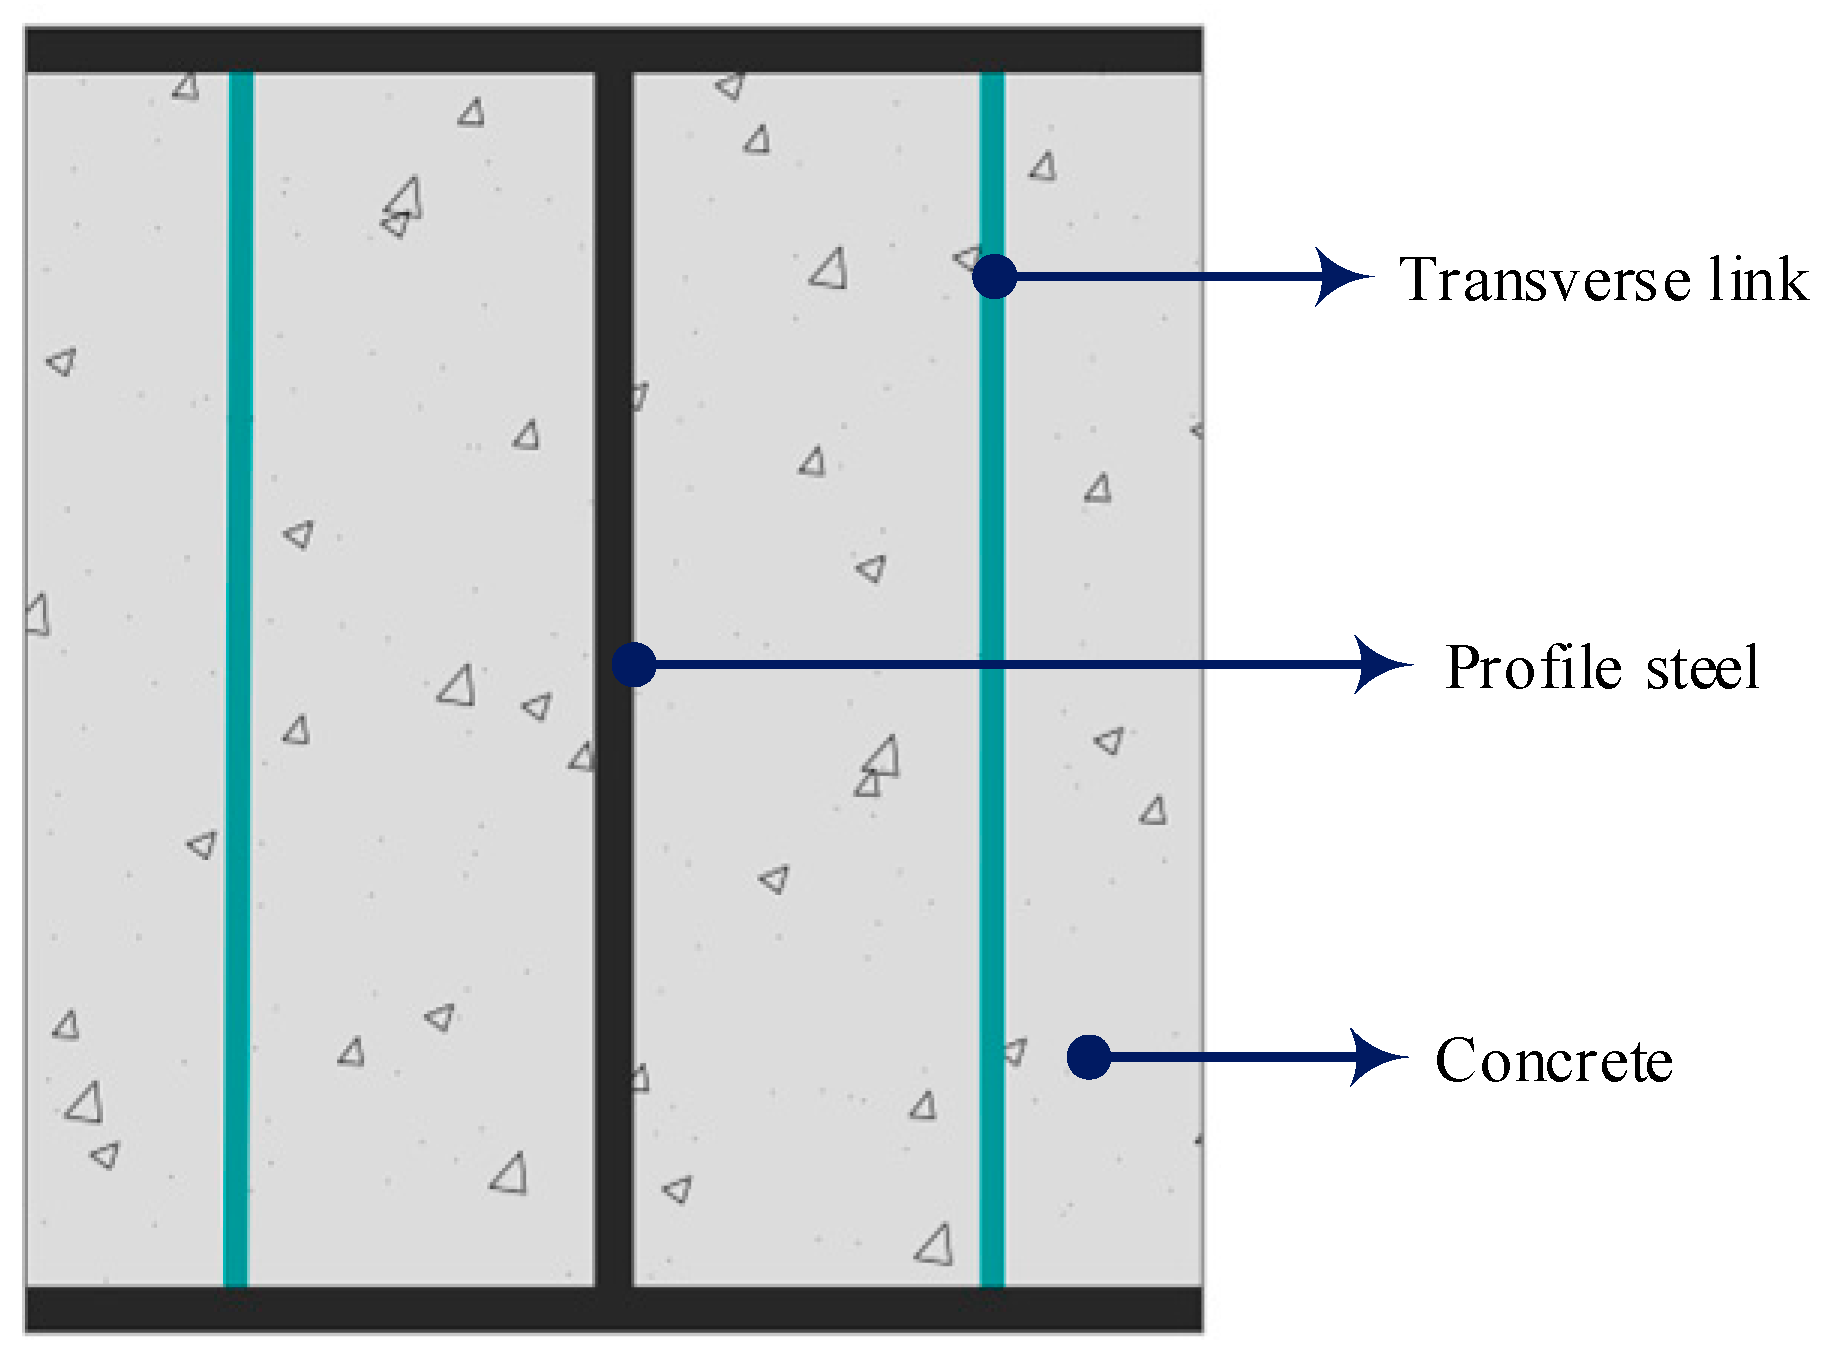
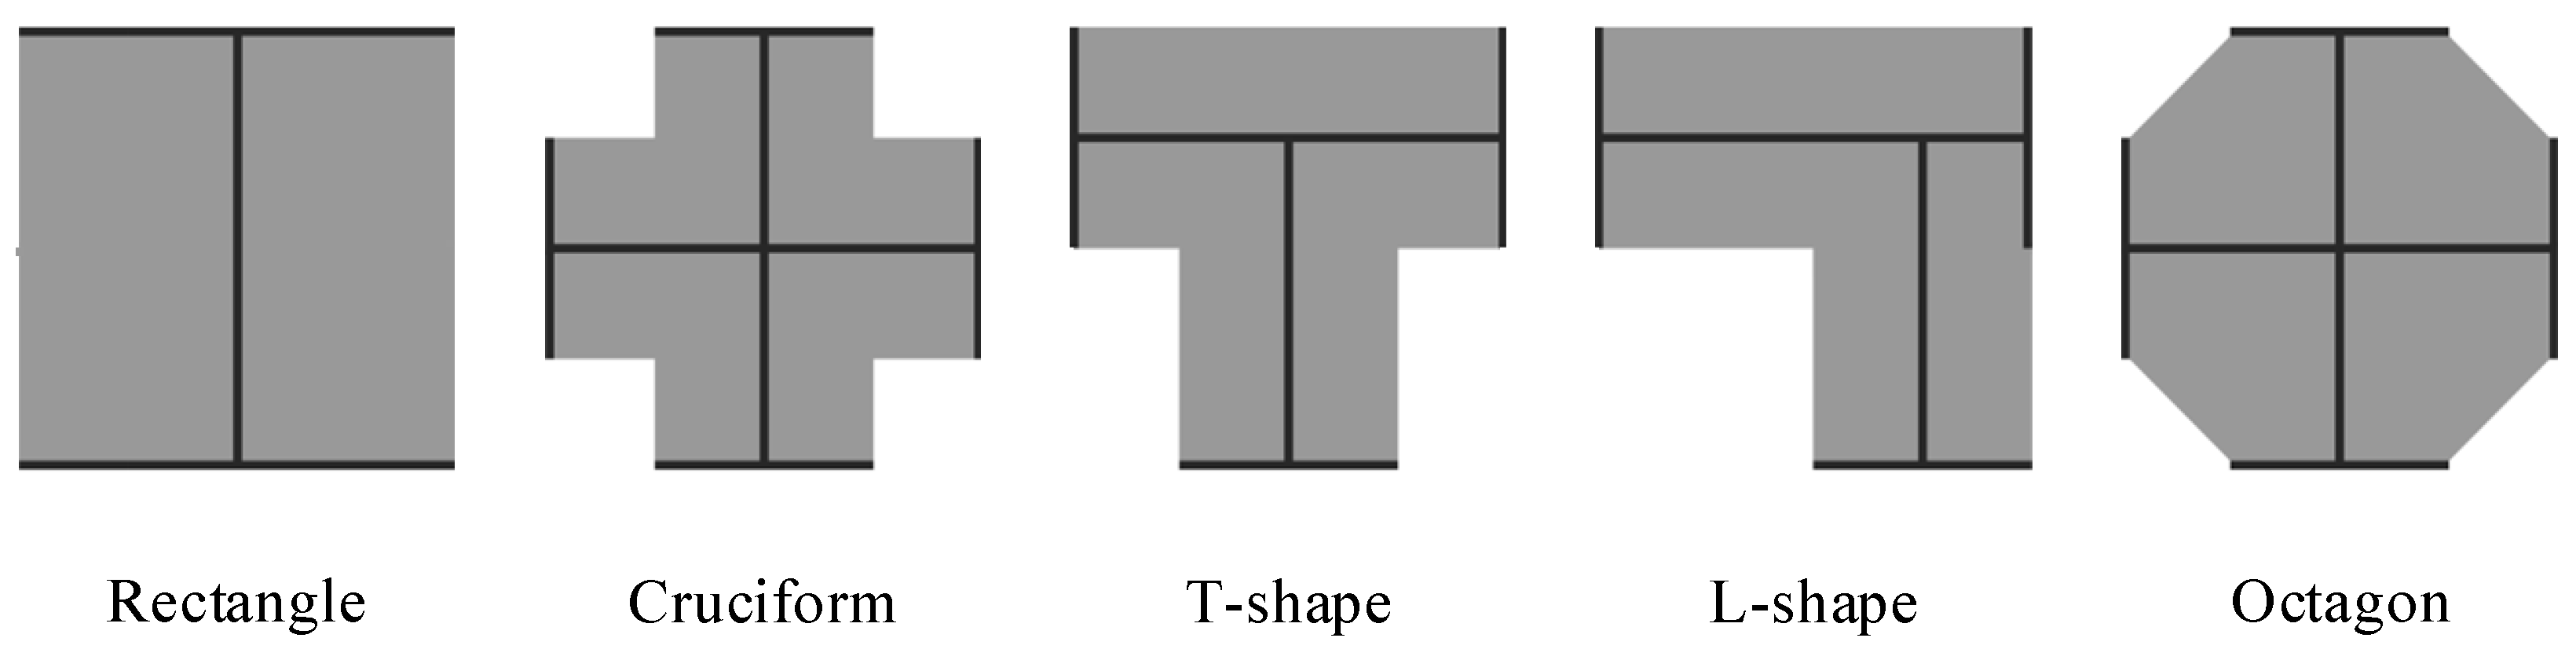
Partially encased steel–concrete composite (PEC) structure, one of the innovative composite structures, has been widely used in engineering practice due to its simple construction, excellent material coordination, and diverse forms. As shown in Figure 1, PEC columns and steel cellular beams were used in an office building of Zhejiang University, which makes the structure one of the most prefabricated buildings in China [1]. The PEC components are composed of profile steel, concrete, and transverse links, as displayed in Figure 2. The cross-sectional forms of PEC columns include rectangular sections and special-shaped sections, such as cruciform, T-shaped, L-shaped, and octagonal, which are shown in Figure 3.

Figure 1.
Office project of Zhejiang University, China.
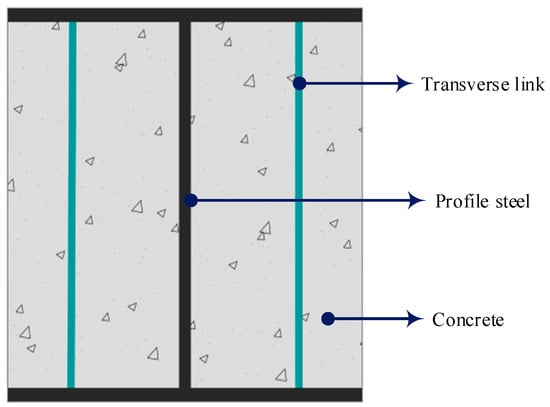
Figure 2.
Composition form of PEC components.
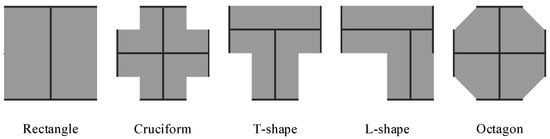
Figure 3.
Cross-sectional forms of PEC columns.
A few investigations have been conducted on PEC columns with rectangular sections. Tremblay et al. [2,3] conducted experimental studies, analyzed the failure modes of PEC columns considering parameters such as the steel thickness and material characteristics, and proposed a calculation formula to predict the axial compression capacity. Chicoine et al. [4,5] analyzed the effects of concrete strength and transverse link spacing, revealing that reducing transverse link spacing could prevent local buckling of the flange. Begum et al. [6,7] used finite element analysis to explore various factors that affect axial compression capacity, finding that local defects and residual stress exhibited a minor impact, while transverse links effectively reduce local buckling of the flange. Chen [8] investigated the influence of different reinforcement measures on PEC columns under axial and cyclic horizontal loads. The results showed that PEC columns performed well, and the impact of longitudinal rebars and stirrups on bearing capacity was minimal. Song [9,10] studied the global buckling, local buckling, and post-buckling behavior of PEC columns, finding that the influence of local buckling became insignificant as the slenderness ratio increased. Lin [11] explored the global buckling behavior of PEC columns under axial and eccentric loads, proposing design formulas for global stability. Chuan et al. [12] and Li et al. [13] investigated the effects of various transverse link configurations on PEC components, and the results showed that improved design of transverse links could enhance the constraint on the flange.
Theoretical analysis [14,15,16] demonstrated that steel in PEC columns exerted a constraining effect on the concrete, dividing the constrained area into highly and partially constrained zones. Liu et al. [17] explored the effects of flange width-to-thickness ratio and transverse link spacing on the distribution of constrained concrete areas. Experimental and numerical analysis [18,19,20] assessed the impact of different characteristics on performance and highlighted the suitability of PEC columns in seismic design. Related fire resistance tests were conducted [21,22,23], and the test results exhibited good structural response and economic benefits of PEC columns under fire conditions.
Recent investigations have focused on PEC columns with special cross-sections. Li et al. [24] conducted experiments on cruciform PEC columns, proposing methods to classify confinement regions and determine concrete confinement coefficients. Tao et al. [25] studied the mechanical behavior of T-shaped PEC columns under axial loading, revealing that the steel thickness and transverse link spacing significantly affected the axial compression capacity of the columns. Zhan et al. [26,27] observed that the aspect ratio of the cross-section exhibited a distinct impact on the stability of L-PEC columns. Jamkhaneh [15] explored the behavior of octagonal PEC columns under axial and bending loads through experiments and finite element analysis, showing that stirrups exhibited a limited impact on the flexural strength of the columns.
However, research on the axial compression capacity of L-shaped PEC stub columns remains insufficient. In this study, an axial compression test involving three L-shaped PEC stub columns was conducted, analyzing failure modes and the effects of material strength on axial compression behavior and bearing capacity. Then, finite element modeling was used to further analyze the effects of more parameters. Additionally, based on the experimental and finite element results, this study explored the applicability of axial compression capacity calculation formulas in relevant specifications for L-shaped PEC columns. Eventually, a calculation method based on the superposition principle considering the enhancement of concrete strength is proposed, which can be a theoretical basis for the engineering application of L-shaped PEC columns.
2. Experimental Investigation
2.1. Details of Columns
A total of three L-shaped PEC (LPEC) stub columns were designed and tested, which were composed of profile steel, concrete, transverse links, and internal stiffeners. Detailed information is shown in Figure 4. To ensure uniform stress distribution across the cross-section, 30 mm thick end plates were welded at both ends of the columns, and 10 mm thick internal stiffeners were welded 100 mm away from the ends to prevent end failure of columns. Transverse links, each with a diameter of 8 mm, were arranged at a spacing of 100 mm in the area between the internal stiffeners and were welded on the steel. The thicknesses of the flange and web were both 6 mm. To investigate the influence of material strength on the axial compression performance of LPEC columns, different materials were selected for comparison. The materials of test specimens are shown in Table 1.
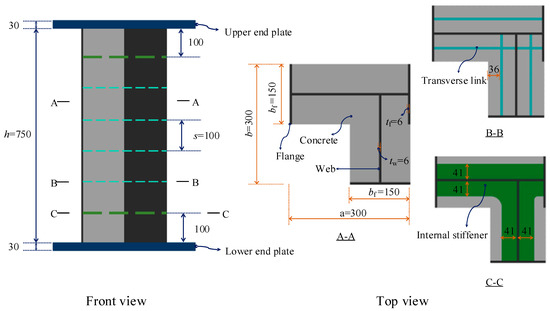
Figure 4.
The structure form of test specimens. Note: h refers to the height of specimens, s refers to the transverse link spacing, and a and b denote the widths in two dimensions of the cross-section. bf represents the width of the flange. tw and tf represent the thickness of the web and flange, respectively. d represents the diameter of the transverse links.

Table 1.
Material of test specimens.
2.2. Material Properties
2.2.1. Steel
The profile steel used in test specimens was of two grades: Q290 and Q345, which comply with the requirements of GB/T 228.1-2021 [28]. Samples were taken from the web and flange, respectively, for tensile testing. The average yield strength of the Q290 steel plate was measured to be 295.37 MPa, with an ultimate strength of 478 MPa and an average elastic modulus of 208 GPa. Similarly, the average yield strength of the Q345 steel plate was 355.54 MPa, with an ultimate strength of 563 MPa and an average elastic modulus of 209 GPa. The transverse links were made of HPB300 rebars, and the average yield strength of rebar samples taken from transverse links was measured to be 296.16 MPa, with an ultimate strength of 461 MPa and an average elastic modulus of 208 GPa.
2.2.2. Concrete
The self-compacting concrete had two nominal strengths: 25 MPa and 30 MPa. When casting the concrete of test specimens, six 150 mm × 150 mm × 150 mm cubic test blocks were made for each of the two grades. These test blocks were cured under the same conditions as the columns for 28 days. Then, in accordance with the GB/T 50081-2019 [29], the compressive strength and elastic modulus were tested. The measured average compressive strength of the C25 cubes was 27.10 MPa, with an average elastic modulus of 27.32 GPa. For the C30 cubes, the measured average compressive strength was 29.25 MPa, with an average elastic modulus of 28.69 GPa.
2.3. Setup and Measurement
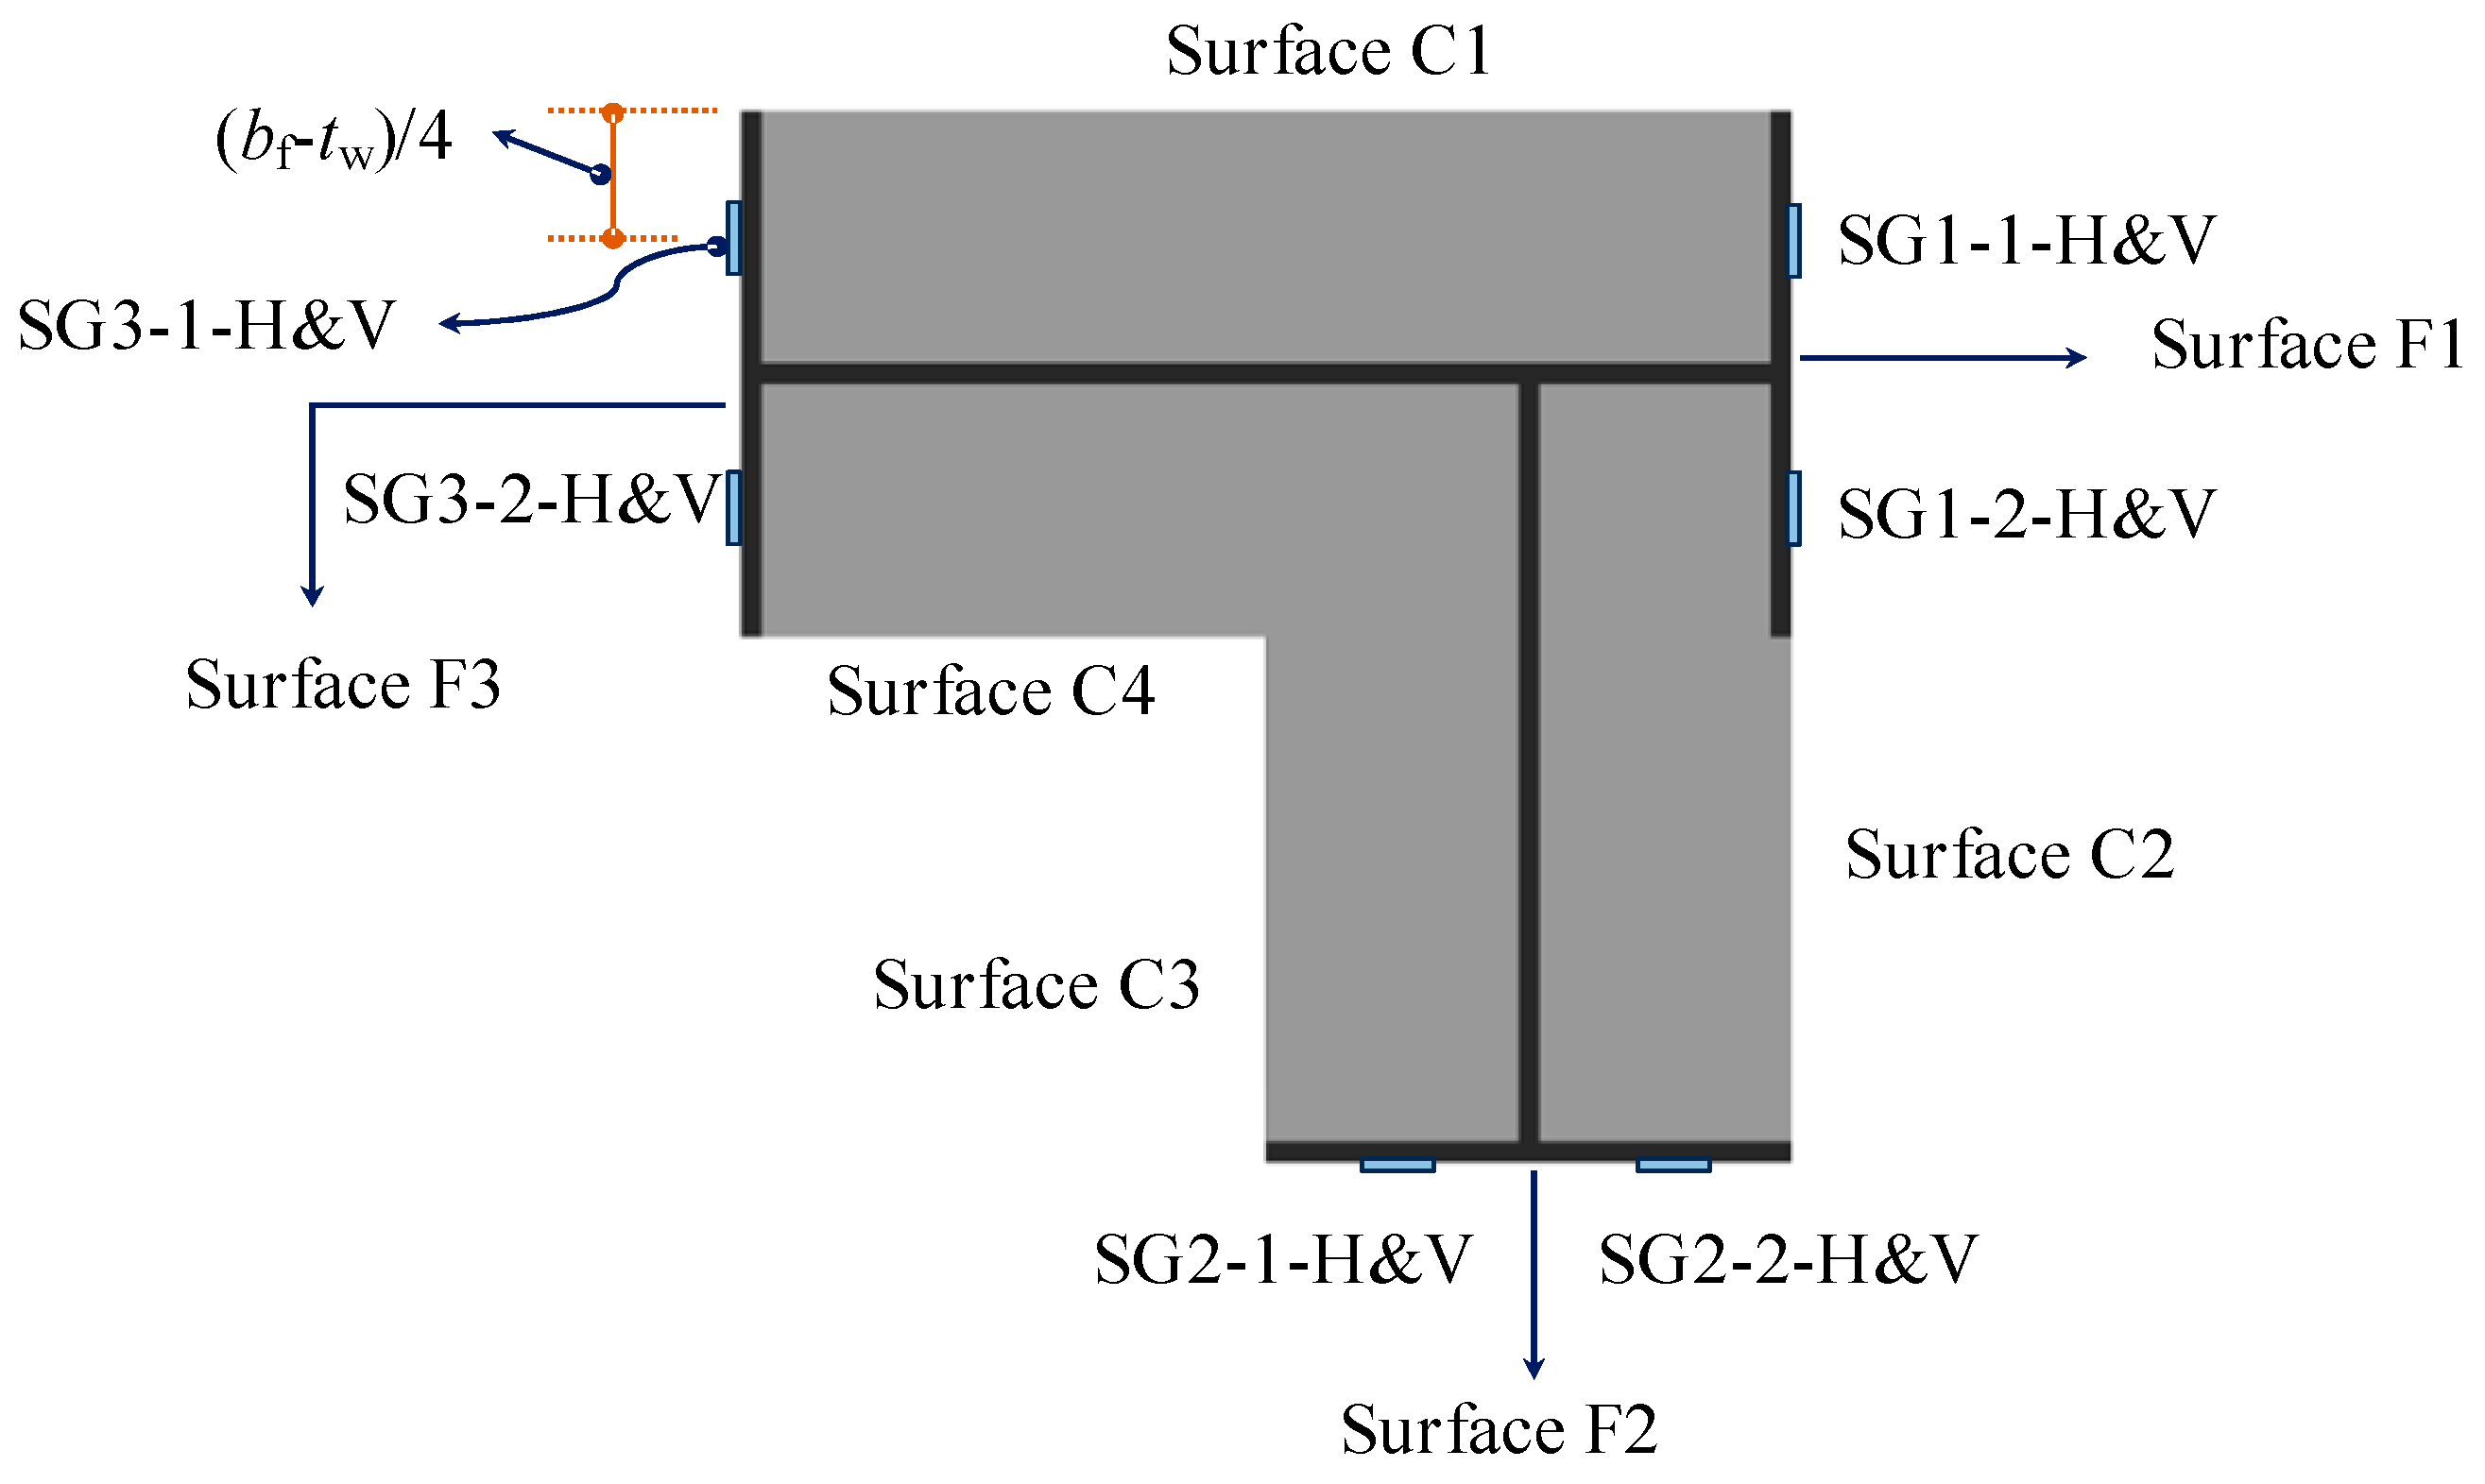
The YAW-5000F 500 ton loading machine was used to apply vertical loads to the columns for the axial compression test. Four vertical linear variable displacement transducers (LVDTs) were positioned at the four corners of the upper end plate to measure the axial displacement of columns, as specifically displayed in Figure 5. Strain gauges were placed on the surface of the flange at 0.5h of the column to measure the circumferential and tangential strains. For the convenience of description, the flange surfaces and the concrete surfaces were named individually, as illustrated in Figure 6. To avoid the influence of welding residual stress, the strain gauges were positioned at the extended portion of the flange. At each point, they were affixed in both tangential and circumferential orientations. Taking “SG1-1-H&V” as an example, this refers to the circumferential strain gauge “SG1-1-H” and the tangential strain gauge “SG1-1-V”. Before the start of the test, the loading machine was calibrated, and a preload of 0.1 Nu,CECS (Nu,CECS is the axial compression load calculated according to T/CECS 719-2020 [30]) was applied. After that, the formal loading process began. During the formal loading process, a displacement-controlled loading strategy was adopted with a loading rate of 0.005 mm/s. The loading process was stopped either when the load dropped to 80% of the peak load or when significant damage was observed in the column.
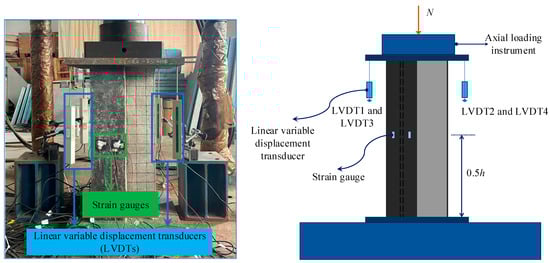
Figure 5.
Test setup and instrumentation.
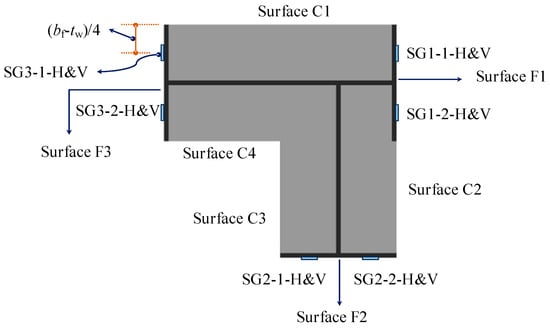
Figure 6.
Surface definition and strain gauge distribution.
2.4. Experimental Results and Analysis
2.4.1. Load Response and Failure Modes
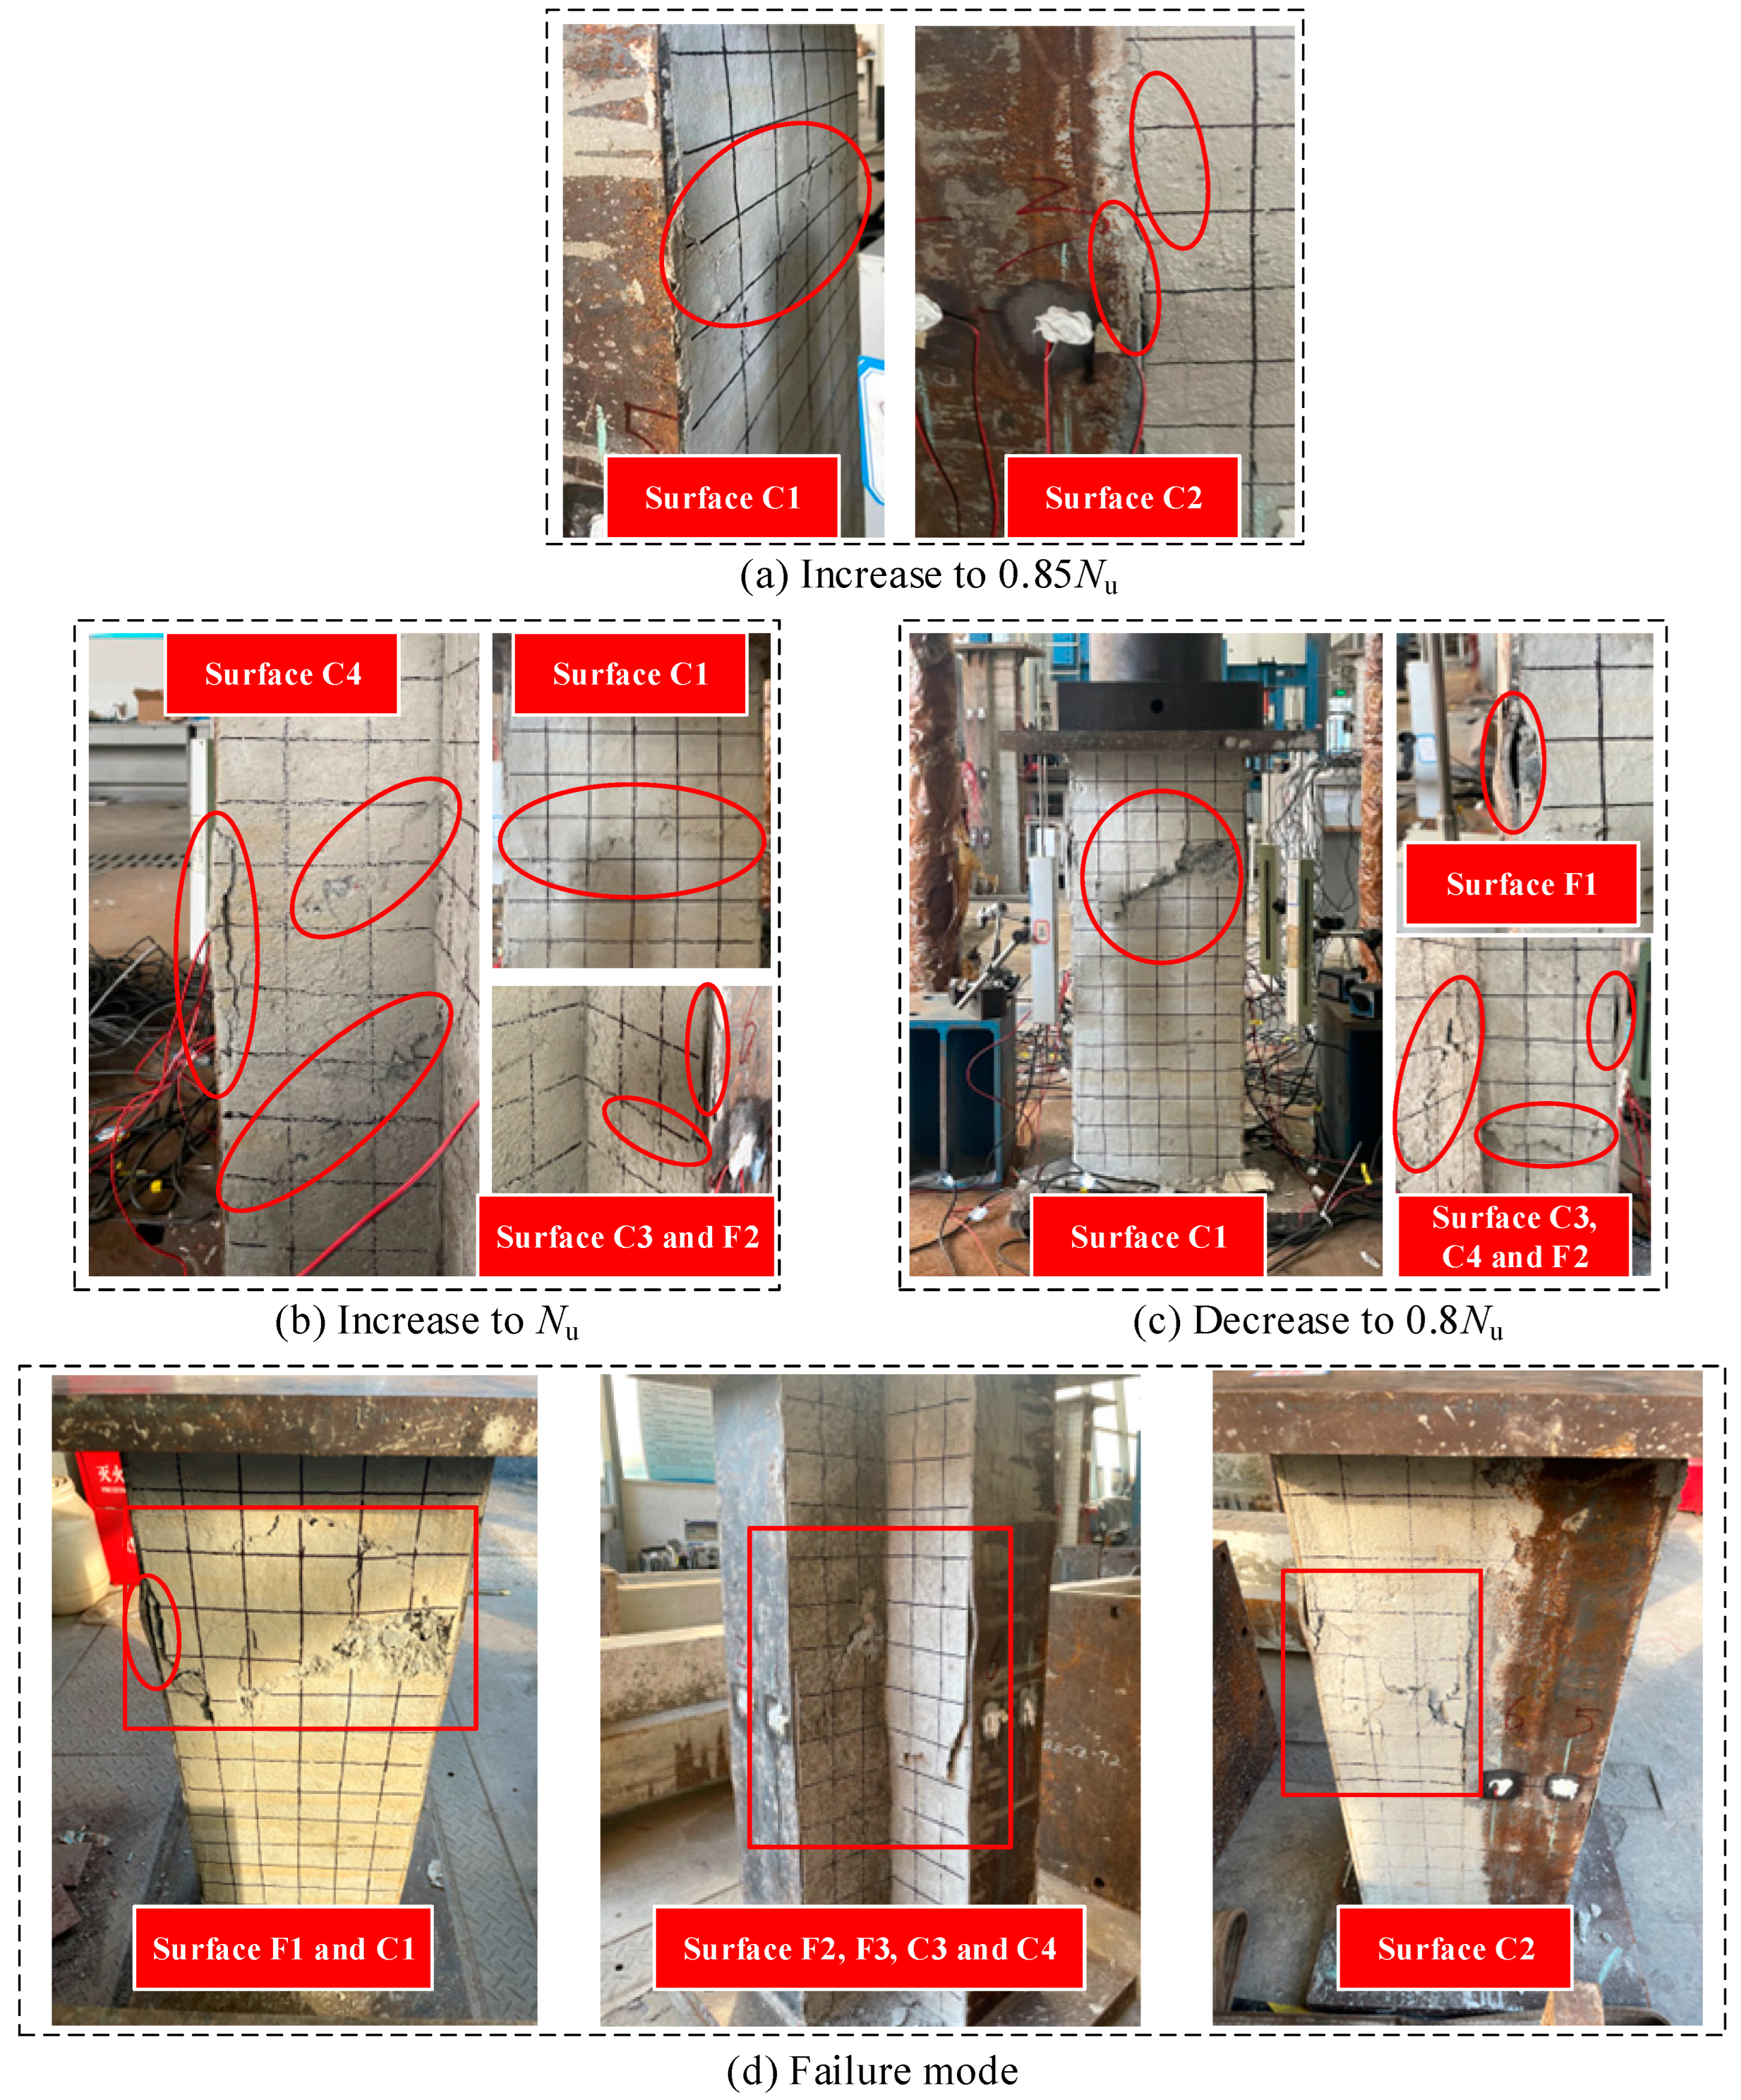
The experimental phenomena observed in all three test specimens were similar, taking the phenomenon of LPEC-2 as an example for analysis. Initially, the axial load was relatively small, and the column was in the elastic stage, without exhibiting significant deformation or concrete cracks. As the load increased to 0.85Nu (Nu refers to the ultimate axial compression load), cracks appeared on the surfaces C1 and C2; upon continued loading, the cracks widened and continued to develop. Approaching Nu, slight bulging occurred on the flange, and gaps appeared between the exposed concrete and the flange, accompanied by minor concrete peeling and slight sounds. After reaching Nu, the local buckling of the flange on surface F2 became evident, and local concrete was crushed and peeled off in large quantities. Loading was stopped when it decreased to 0.8Nu; Figure 7a–c illustrate this failure process. The final failure modes of the column were characterized by concrete spalling and local buckling of the flange, which are shown in Figure 7d.

Figure 7.
Failure process and the final failure modes.
2.4.2. Axial Load Displacement Curves
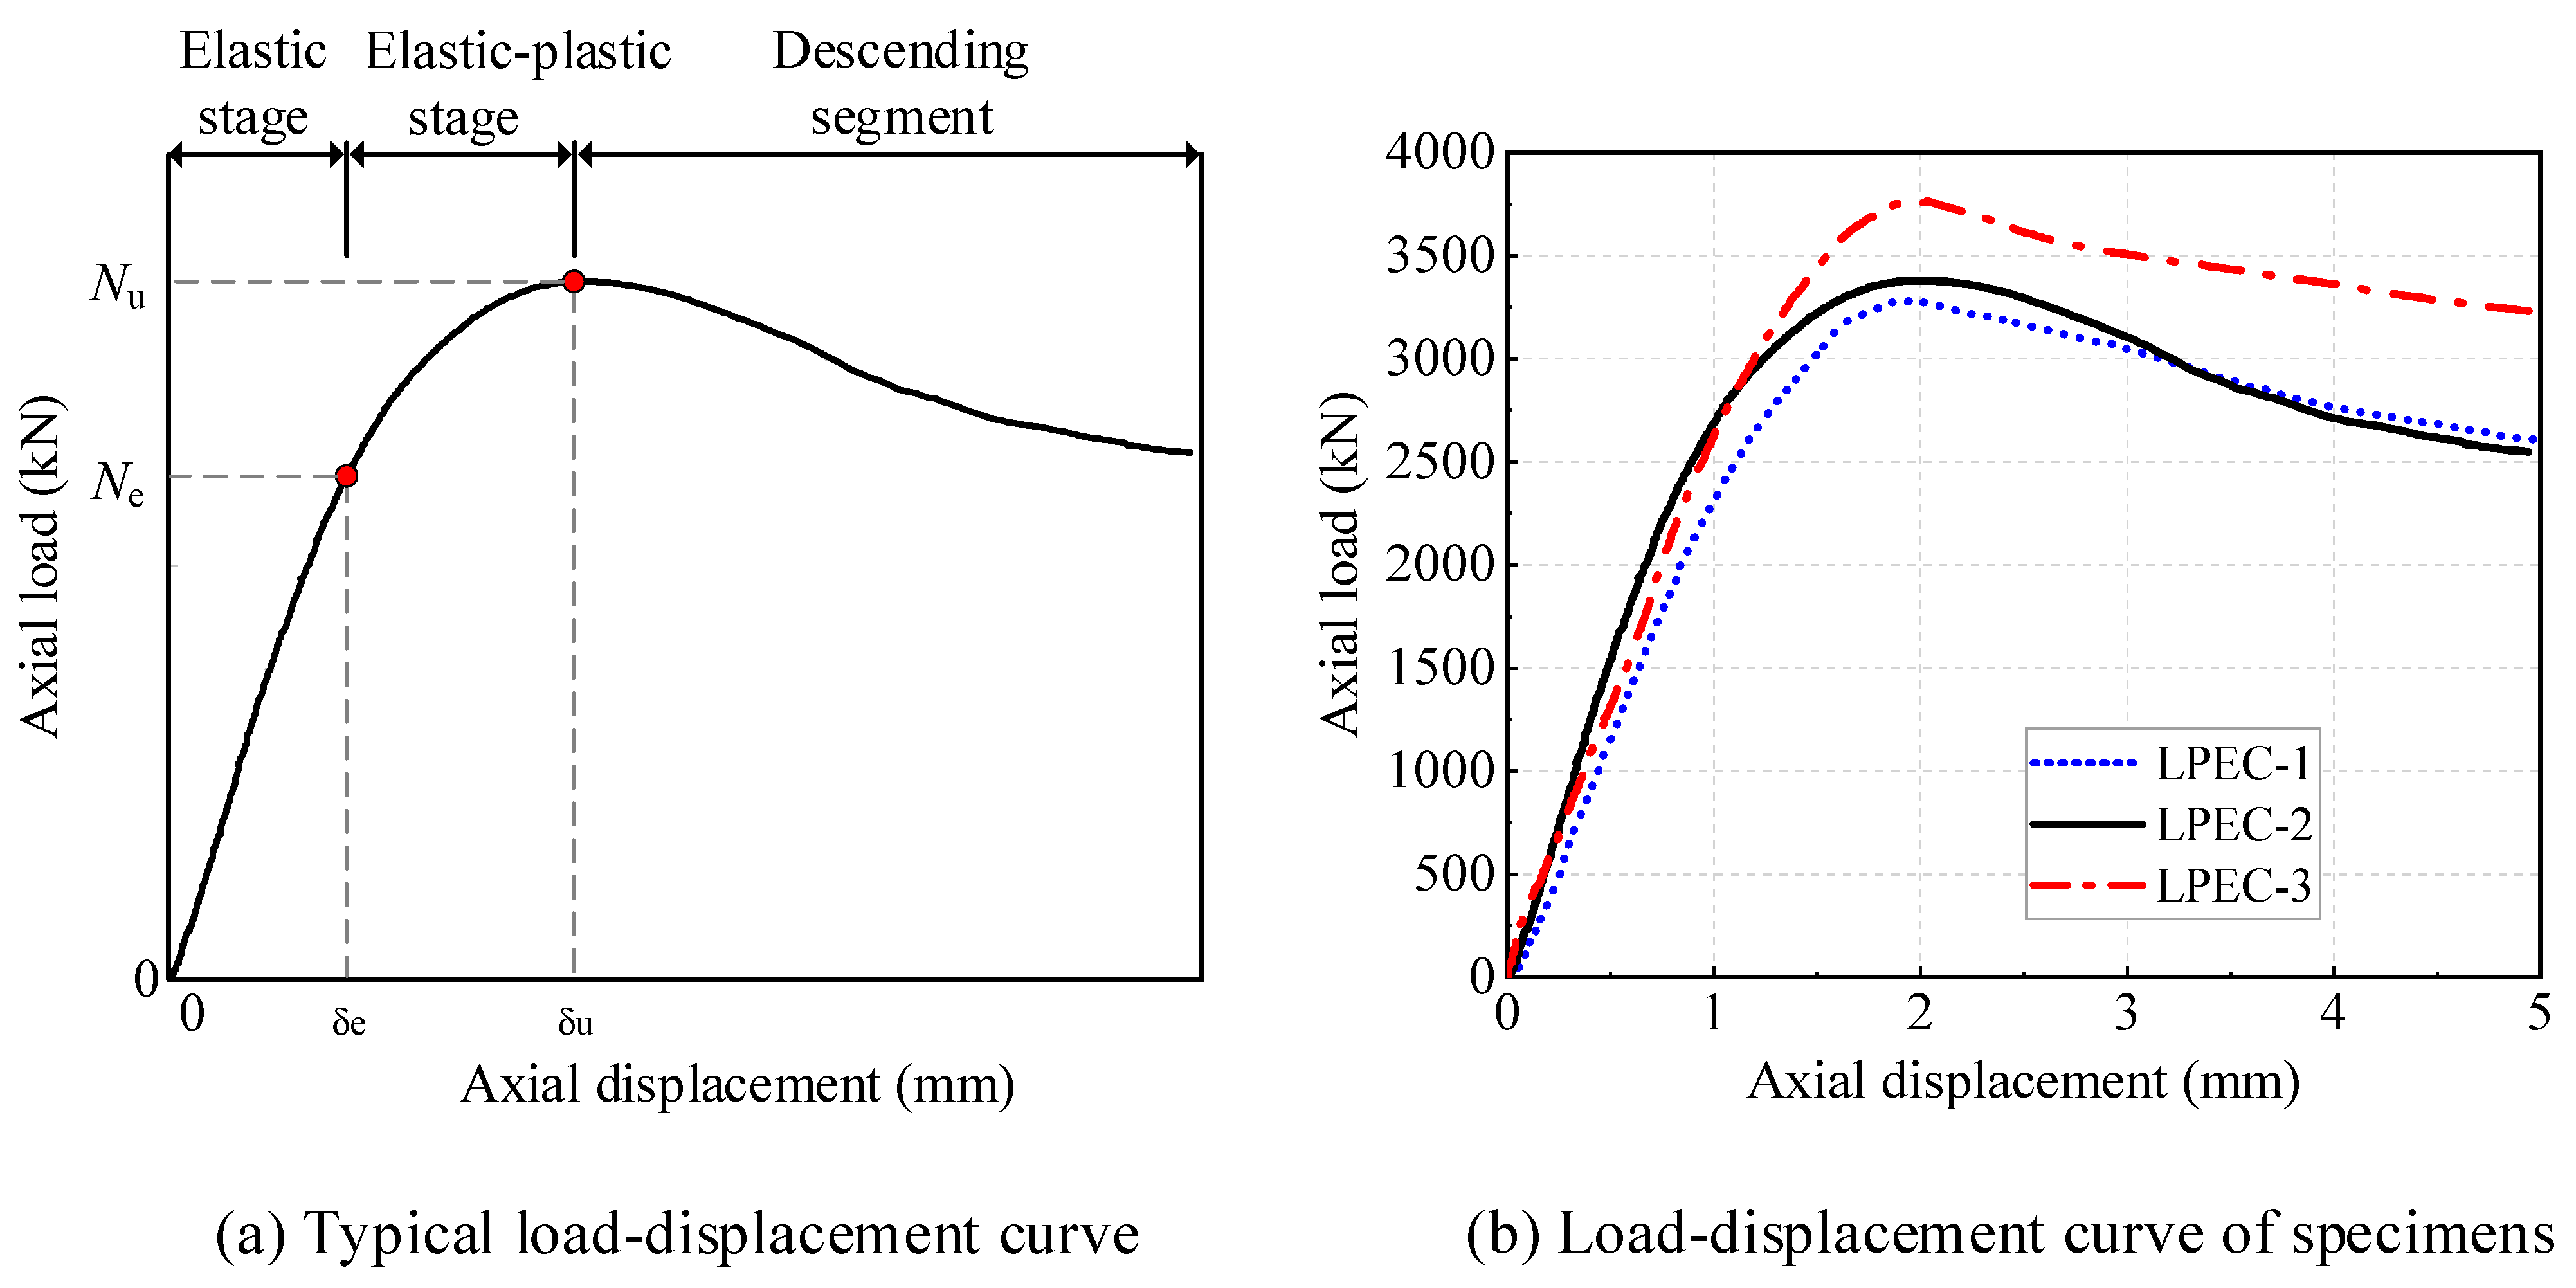
As shown in Figure 8a, the axial compression load–displacement curves of LPEC columns can be categorized into three distinct sections. In the initial stage, when the displacement was relatively small, the curve rose linearly, indicating the elastic phase where steel and concrete worked together. As the displacement continued to increase, the load also grew but at a decreased rate, signifying the transition into the elastic–plastic stage. During this stage, the core concrete expanded under compression, and the flange approached yield. Consequently, the slope of the curve gradually decreased until the load reached Nu. After the peak load was attained, the curve went to a descent stage, during which the crushing of the concrete led to a large axial displacement. Then, the descending portion of the curve gradually flattened out.
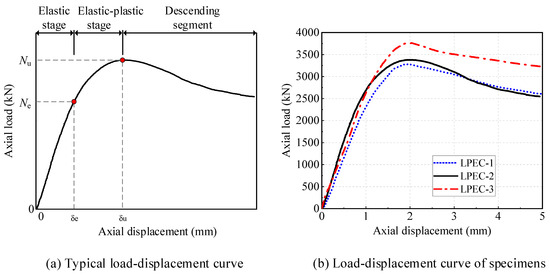
Figure 8.
Axial load–displacement curves of test specimens.
As displayed in Figure 8b, when comparing the descent segment of the curves, the decline rate of LPEC-1 was significantly slower than that of LPEC-2. This was because the increase in concrete strength led to higher brittleness, resulting in lower ductility for LPEC-2. When comparing LPEC-2 with LPEC-3, it was noted that LPEC-3, which had higher steel strength, exhibited a more gradual descent segment. This was due to the greater bearing capacity of steel in LPEC-3, which caused the load to drop more slowly when concrete failed.
2.4.3. Enhancement Index
The introduction of the bearing capacity enhancement index (IBCE) can visually reflect the influence of material strength changes on the bearing capacity, as shown in Equation (1):
where fy is the yield strength of steel, fc is the prismatic compressive strength of concrete, and fr is the yield strength of longitudinal rebars. As is the area of steel, Ac is the area of concrete, and Ar is the area of longitudinal rebars.
In addition, a concrete strength enhancement index (ICSE) was introduced to measure the strength of the concrete confinement effect, which was calculated by the following formula:
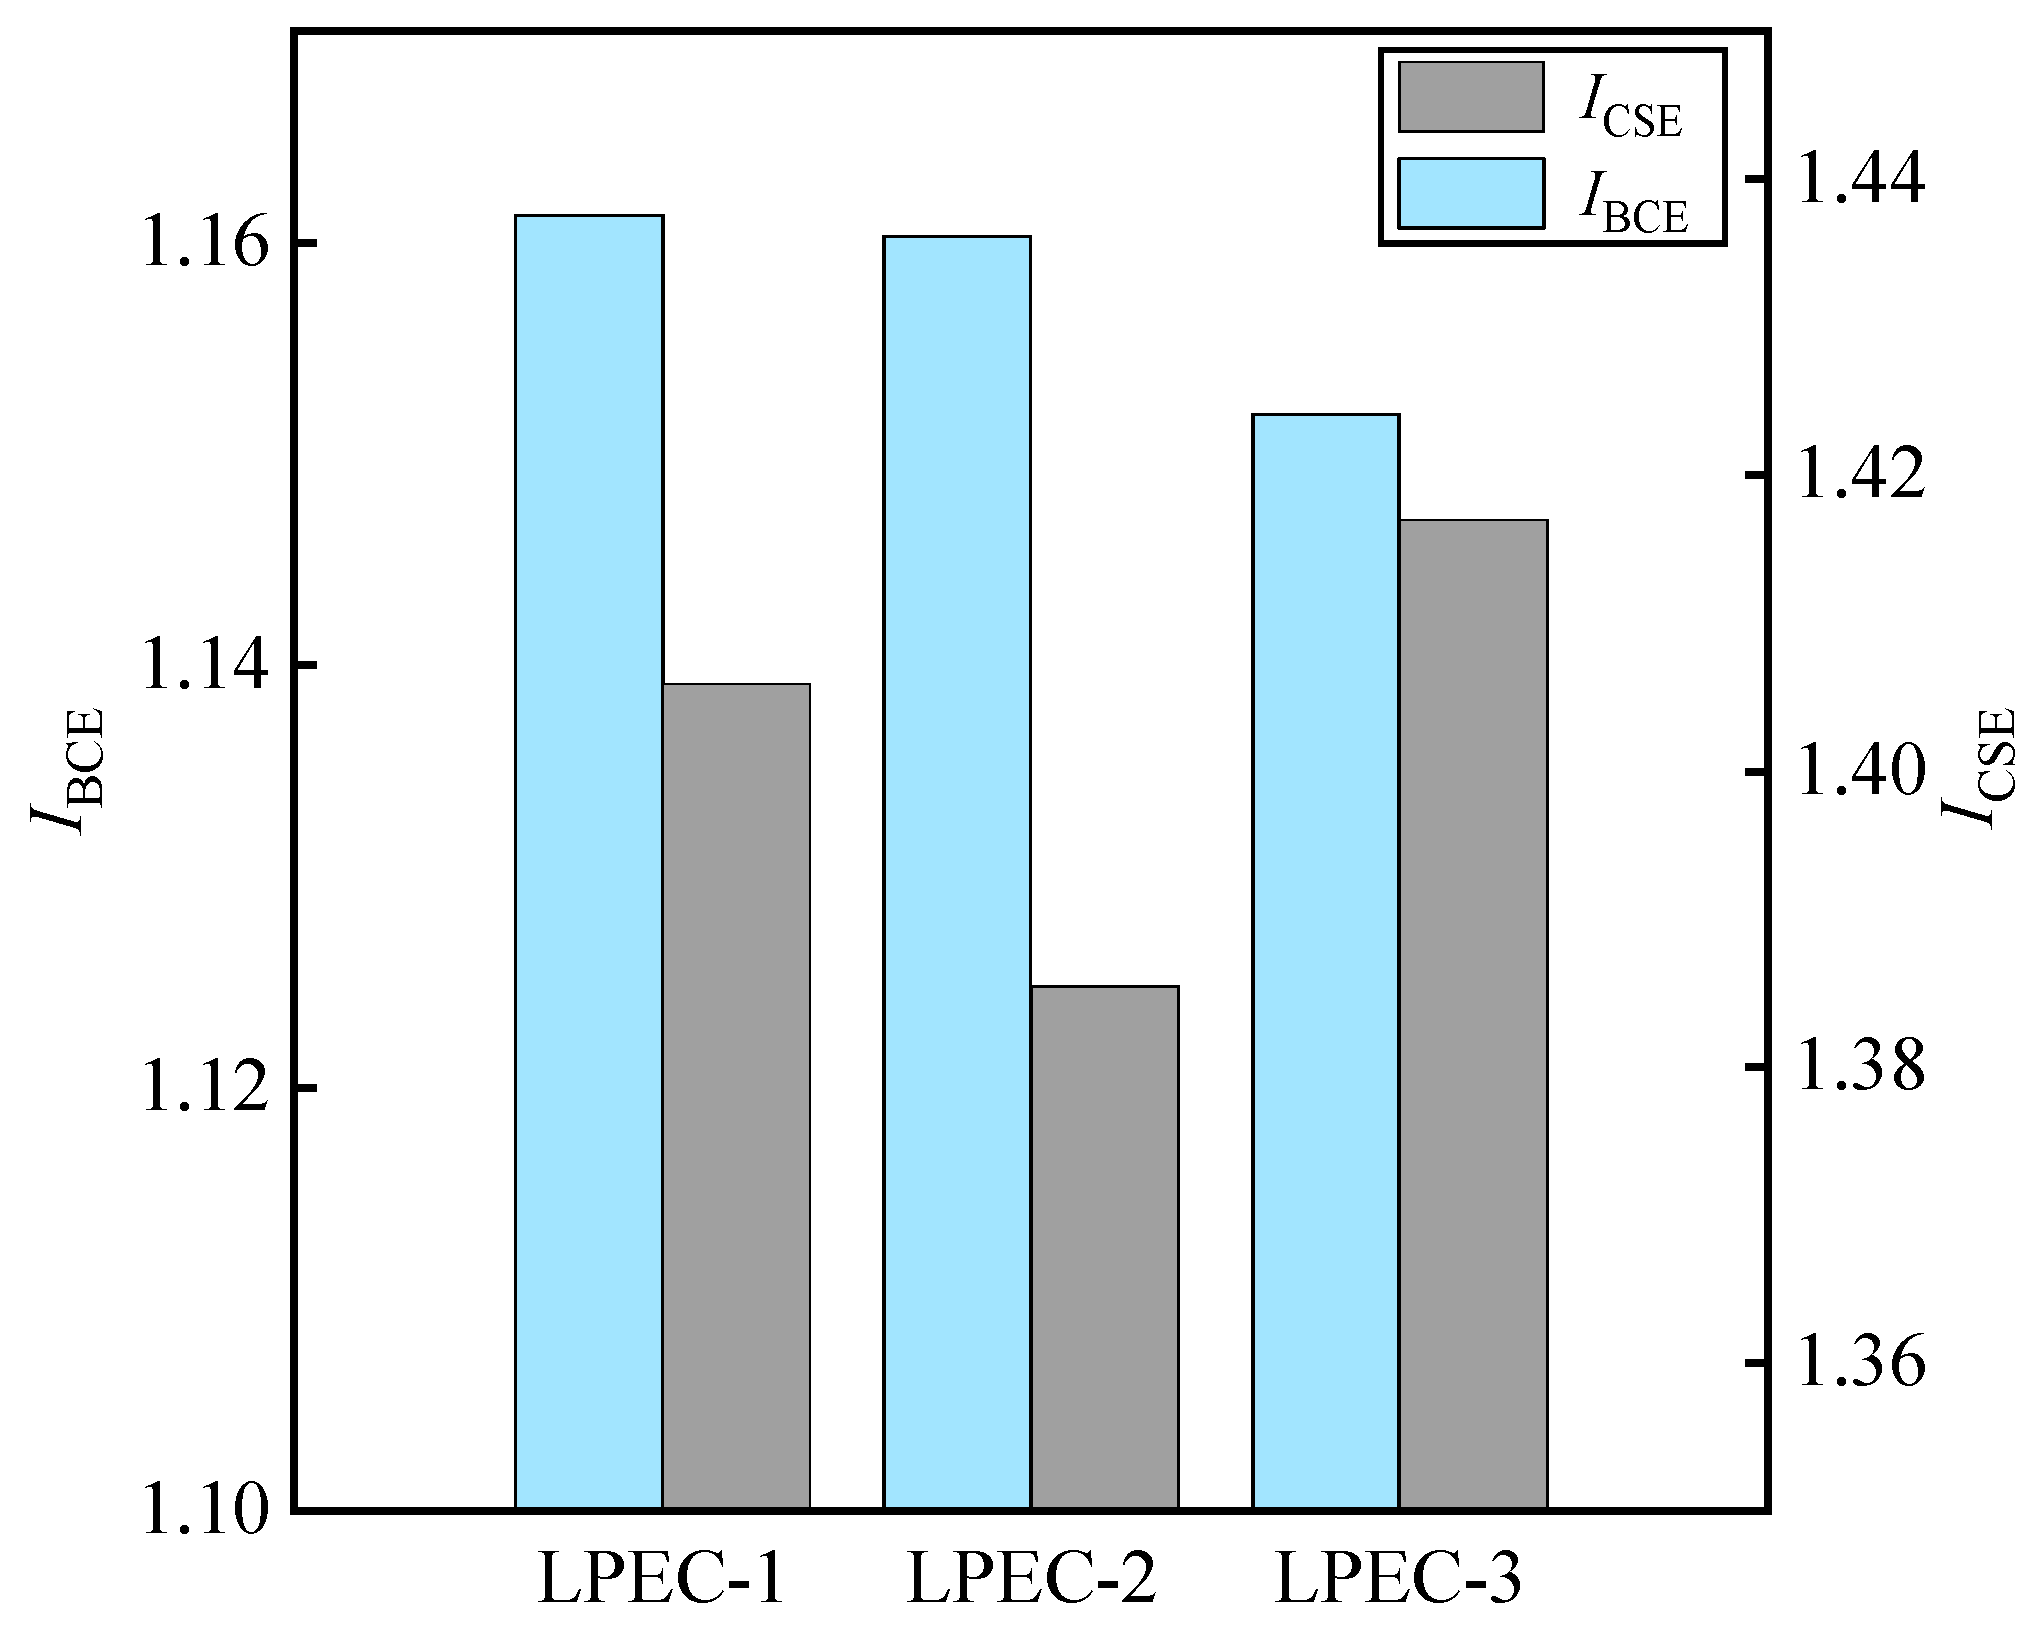
The IBCE and ICSE values of each column are shown in Table 2, with a comparison presented in Figure 9. The results demonstrated that the IBCE and ICSE values for all three stub columns exceeded 1.0. This is attributed to the confinement effect provided by both steel and transverse links, which reinforces the strength of concrete, thereby elevating the bearing capacity. LPEC-1, which had a lower concrete strength compared to LPEC-2, had a larger IBCE and ICSE, indicating that the increase in concrete strength would reduce the concrete confinement effect. The ICSE of LPEC-3 increased by 2.27% compared to the ICSE of LPEC-2. This is because an increase in steel strength enhances the confinement effect of the concrete. However, as the proportion of the bearing capacity provided by concrete to the total bearing capacity decreased, the IBCE of LPEC-3 decreased slightly, and the impact of confinement effect on total capacity also diminished simultaneously.
Table 2.
IBCE and ICSE values of test specimens.
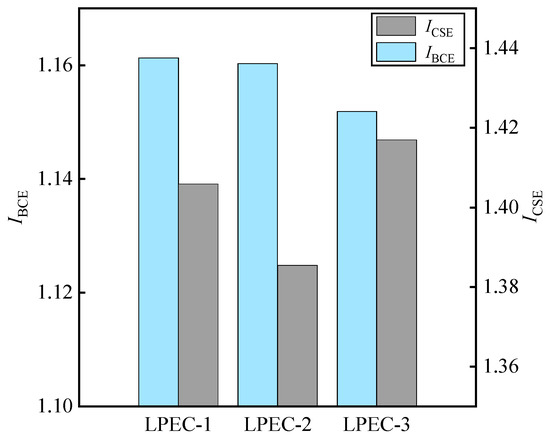
Figure 9.
Comparison of the enhancement index.
2.4.4. Flange Strain Response
To further investigate the failure mechanism of LPEC stub columns, the strain response analysis of the flange was conducted using LPEC-2 as a typical example. The load–strain relationships for each flange are shown in Figure 10a–c. The strain gauges corresponding to each flange are illustrated in Figure 6.
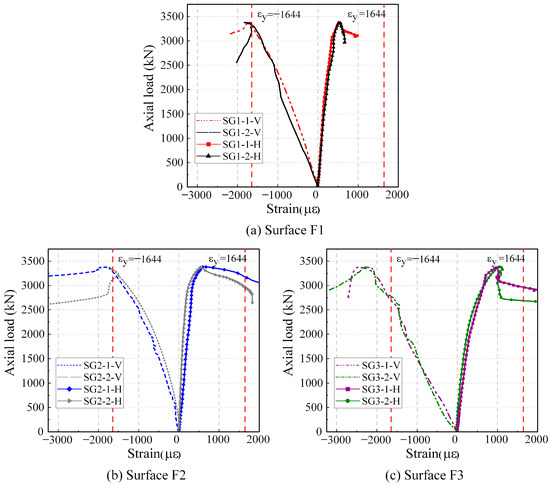
Figure 10.
Axial load–strain curves of LPEC-2.
During the initial loading stage, the strain growth rate on each flange was relatively stable, indicating that the flanges were in the elastic stage and the components were working together. As loading continued, the tangential strain on surface F3 reached the yield strain (εy = −1644) at 0.8Nu. With further loading, the strain growth rate slowed down, and surfaces F1 and F2 reached the yield strain when the load reached Nu, indicating that the performance of the flanges can be fully utilized. As the load approached its peak, the tangential strain of surfaces F1 and F2 abruptly mutated, indicating that local buckling occurred on the flange of surfaces F1 and F2, which was identical to the observed experimental phenomenon displayed in Figure 7. During the load descending stage, the tangential strain continued to increase, but the growth rate significantly decreased, indicating that all flange surfaces remained in a compression state until the column was destroyed.
3. Finite Element Parametric Analysis
3.1. Finite Element Modeling
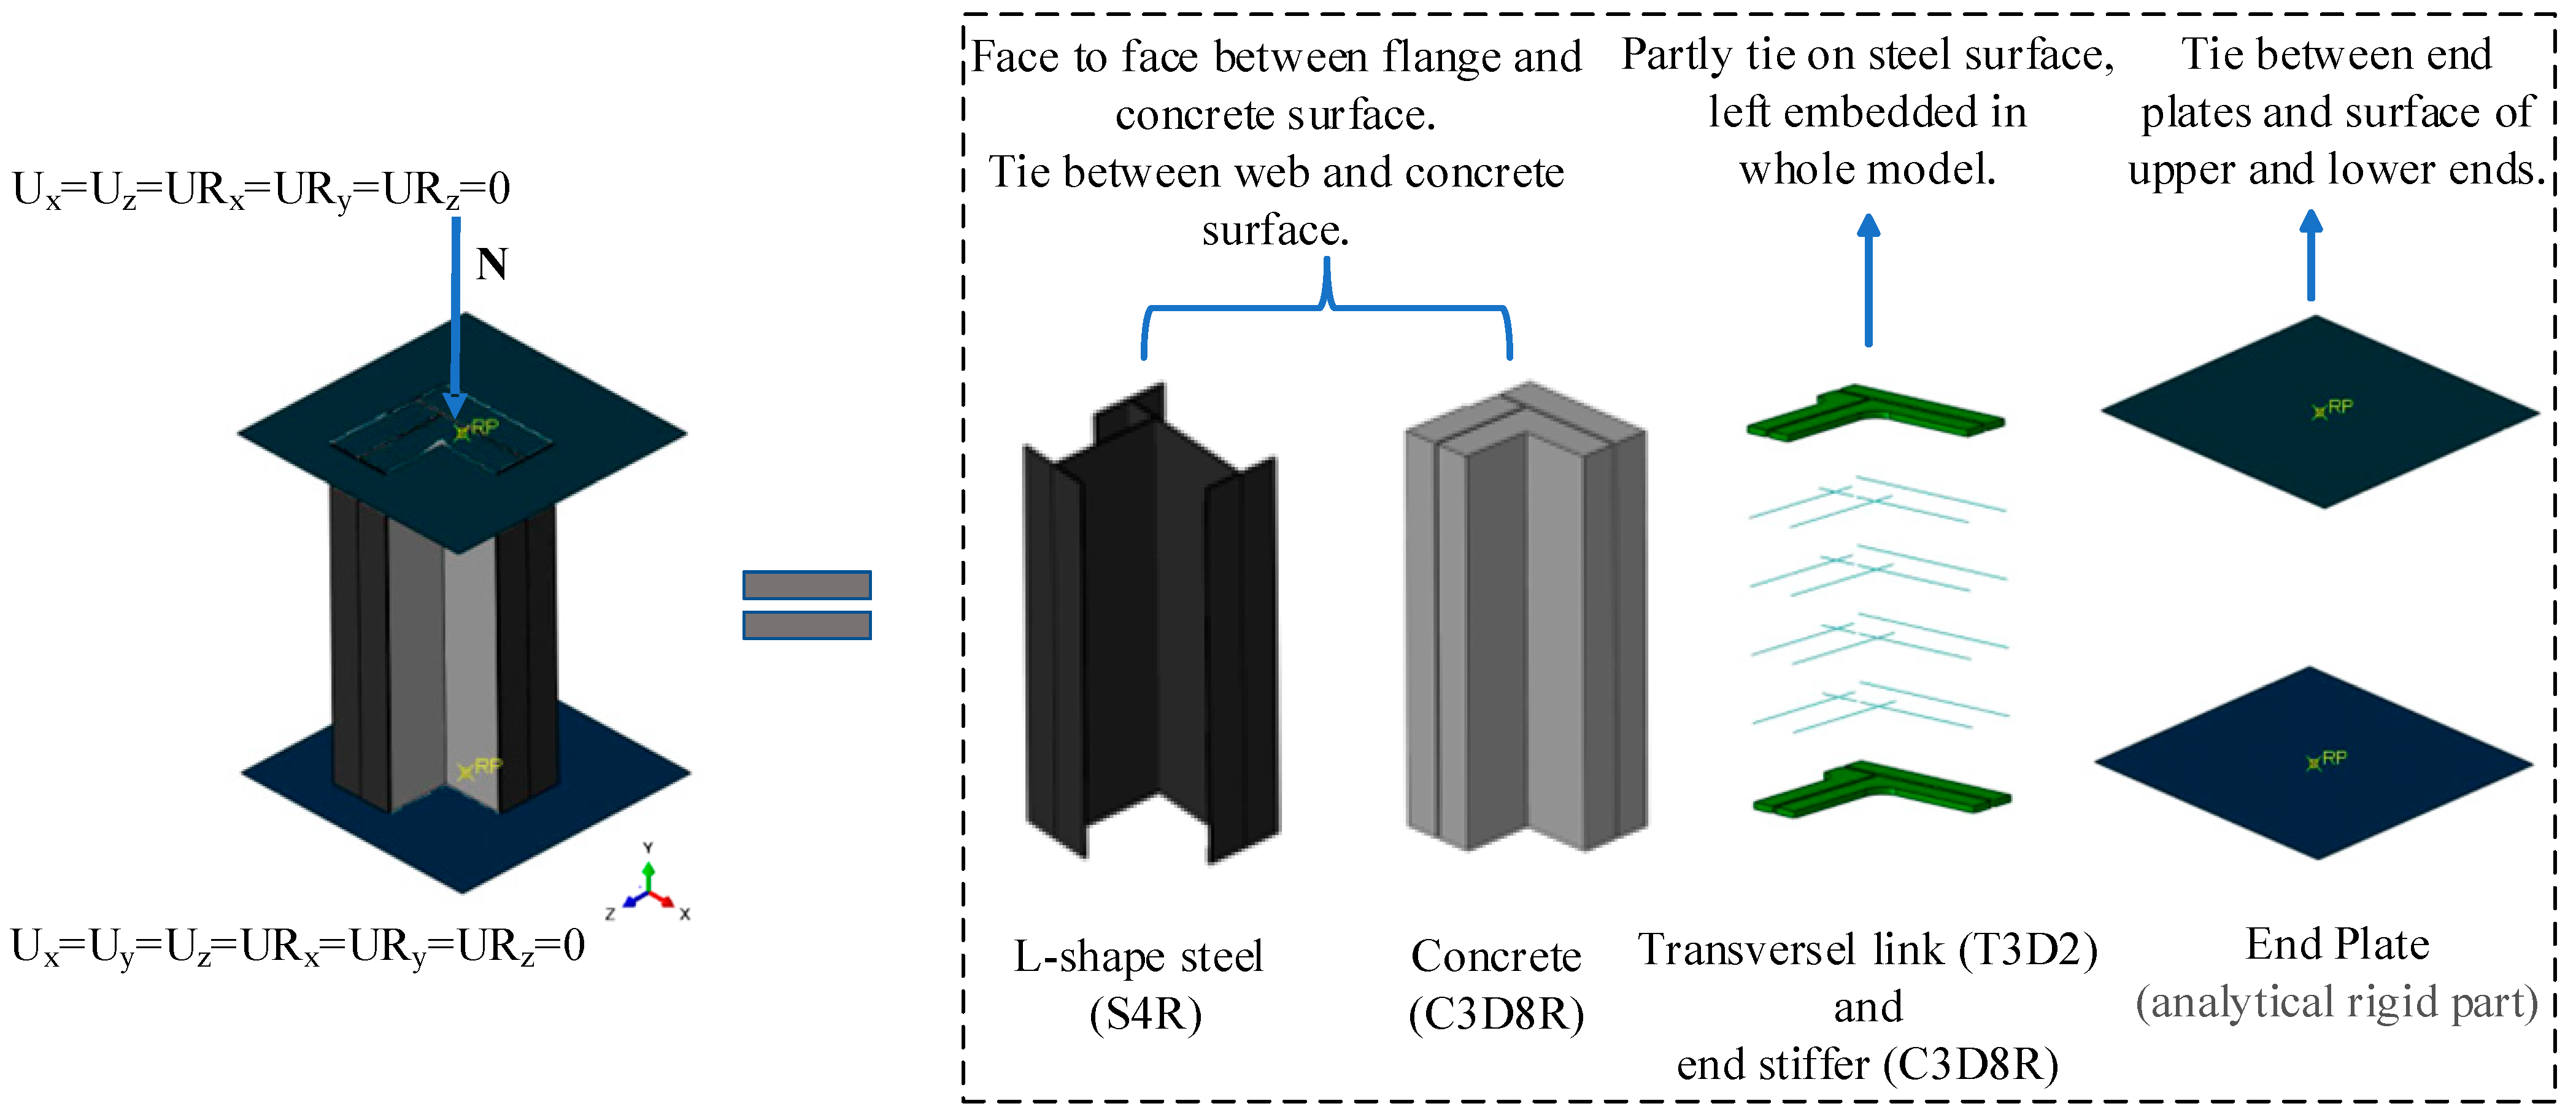
The CAE software Abaqus 2020 was utilized to establish LPEC models, which consist of profile steel, concrete, transverse links, internal stiffeners, and end plates. The profile steel was represented using the four-node reduced integration shell element (S4R), while the concrete and internal stiffeners were modeled with the eight-node reduced integration brick element (C3D8R). The transverse links were represented using the truss element (T3D2), and the end plates were designated as rigid bodies.
There was relative slippage between the flange and the concrete, whereas no slippage occurred between the web and the concrete according to experimental observations. Therefore, a “surface-to-surface contact” was employed to simulate the interaction between the flange and the concrete surface. This contact definition incorporated a tangential friction coefficient of 0.3 [31] and a normal hard contact behavior. Further, a tie connection [32] was used to simulate the interaction between the web and the concrete surface. Both ends of the transverse links and internal stiffeners were tied to surfaces of profile steel, and other parts of transverse links and internal stiffeners were embedded into the overall model. Additionally, the tie connection was also set along the end plate interface. Local imperfections were deemed negligible in this analysis considering their minimal influence on the bearing capacity [7].
The vertical mesh size was set to h/15, namely a mesh size of 50 mm. Horizontally, the mesh size was set to b/15, equivalent to 20 mm for a size of 300 mm × 300 mm × 150 mm (a × b × bf) cross-section. Similarly, the internal stiffeners and transverse links were meshed with a size of 20 mm to ensure accurate representation.
To simulate loading and boundary conditions, a reference point was established at the centroid of the L-shaped section, corresponding to the end plate. This reference point served as the application point for the axial displacement load, which was applied to the upper end plate. Figure 11 provides detailed information of the FE model.
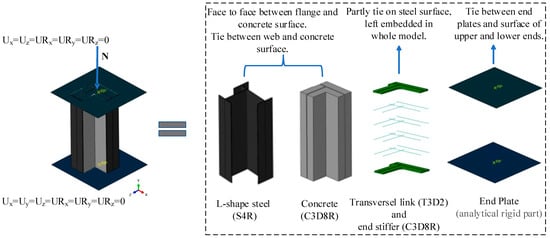
Figure 11.
Finite element modeling.
3.2. Material Model
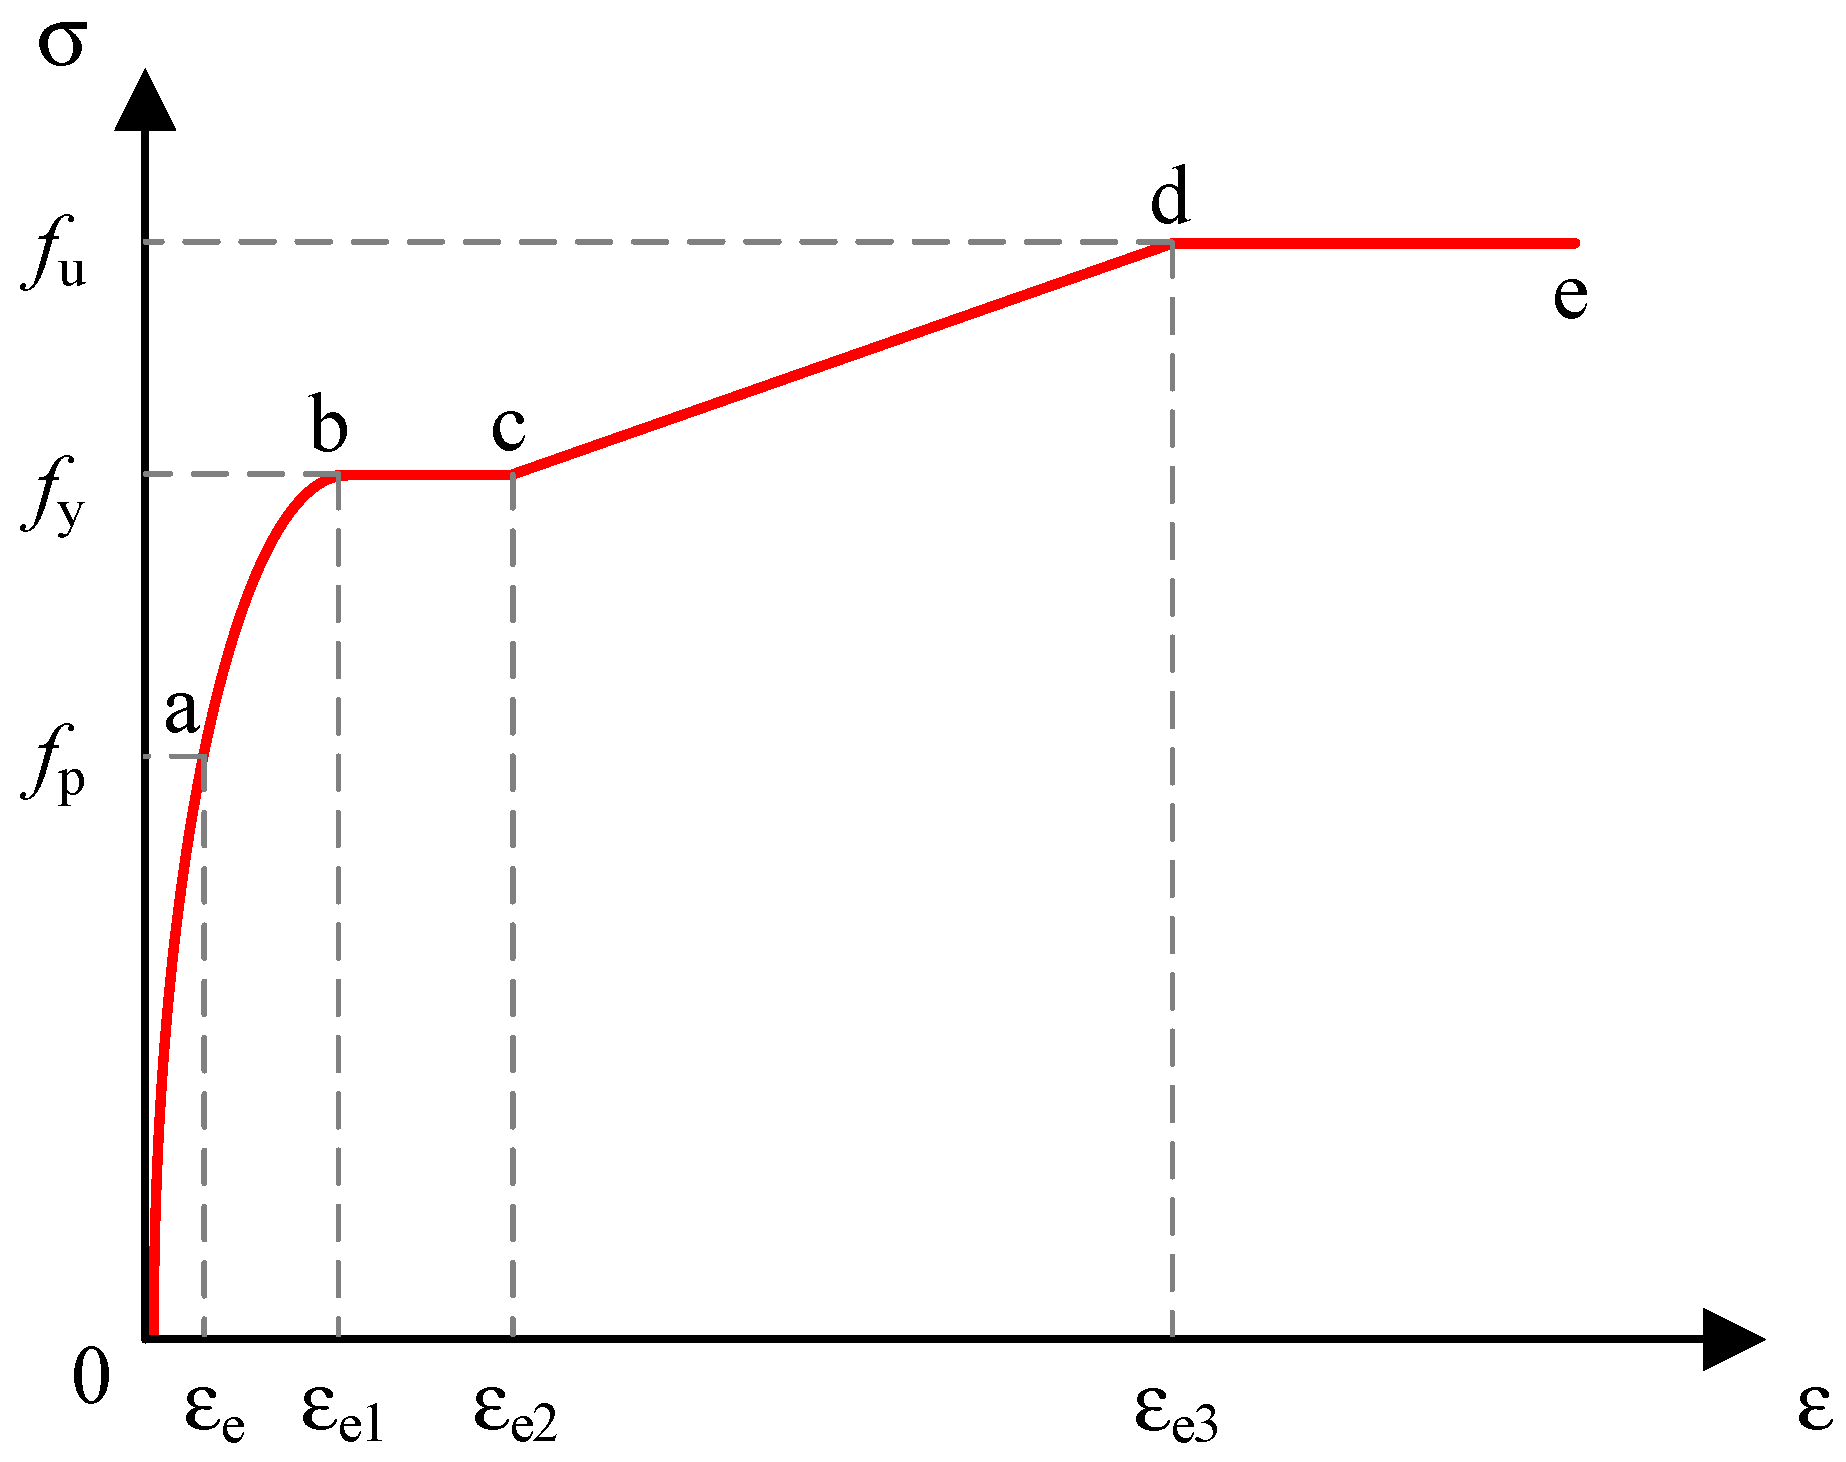
Steel materials, including profile steel, transverse links, and internal stiffeners utilized a five-stage linear constitutive model [33] that takes secondary flow plasticity into account. The stress–strain curve is shown in Figure 12 and the related formulas are shown as follows:
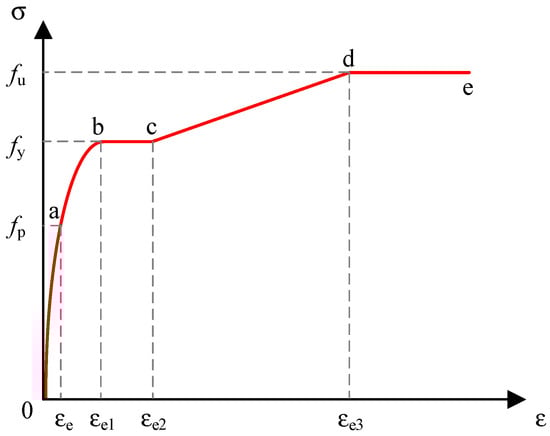
Figure 12.
Stress–strain relationship of steel.
To simulate the diverse structural responses of concrete, the plastic damage model in Abaqus was selected to represent the constitutive behavior of concrete. The stress–strain relationship was established according to the Chinese design code of concrete [34].
3.3. Validation of FE Models
As shown in Table 3, three refined FE models with identical geometric dimensions and material properties as those of test specimens were established. A comparative analysis was conducted between the FE model and the experimental results to verify the accuracy of the FE model. As shown in Figure 13a–c, the comparison of load–displacement curves revealed that the development and variation trends of the two curves were similar. The peak load calculated by the FE model matched well with the experimental results. However, the post-yielding plateau in the experimental results was lower than that of the FE model, which resulted from the brittle failure of concrete after reaching the peak load. Figure 14 displays a consistent local buckling failure mode of the flange with the experimental results. Therefore, the FE simulation is relatively accurate and suitable for further analysis of relevant parameters.
Table 3.
Material properties of FE models for validation.
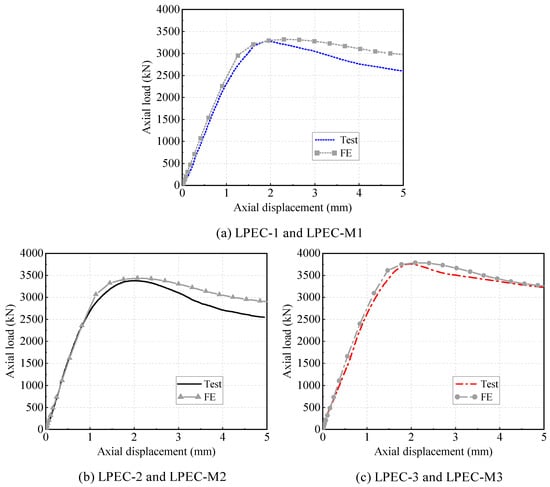
Figure 13.
Comparison of the load–displacement curves between experimental and FE analysis.
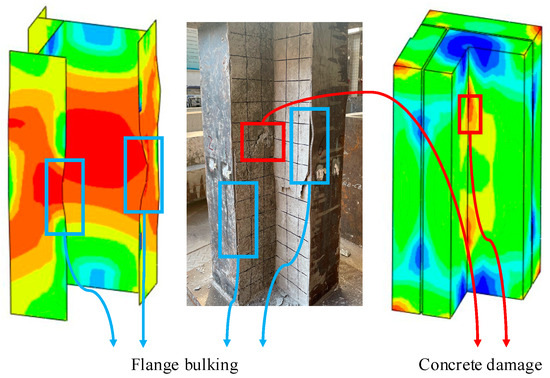
Figure 14.
Comparison of failure modes between experimental and finite element analysis.
3.4. Parametric Study
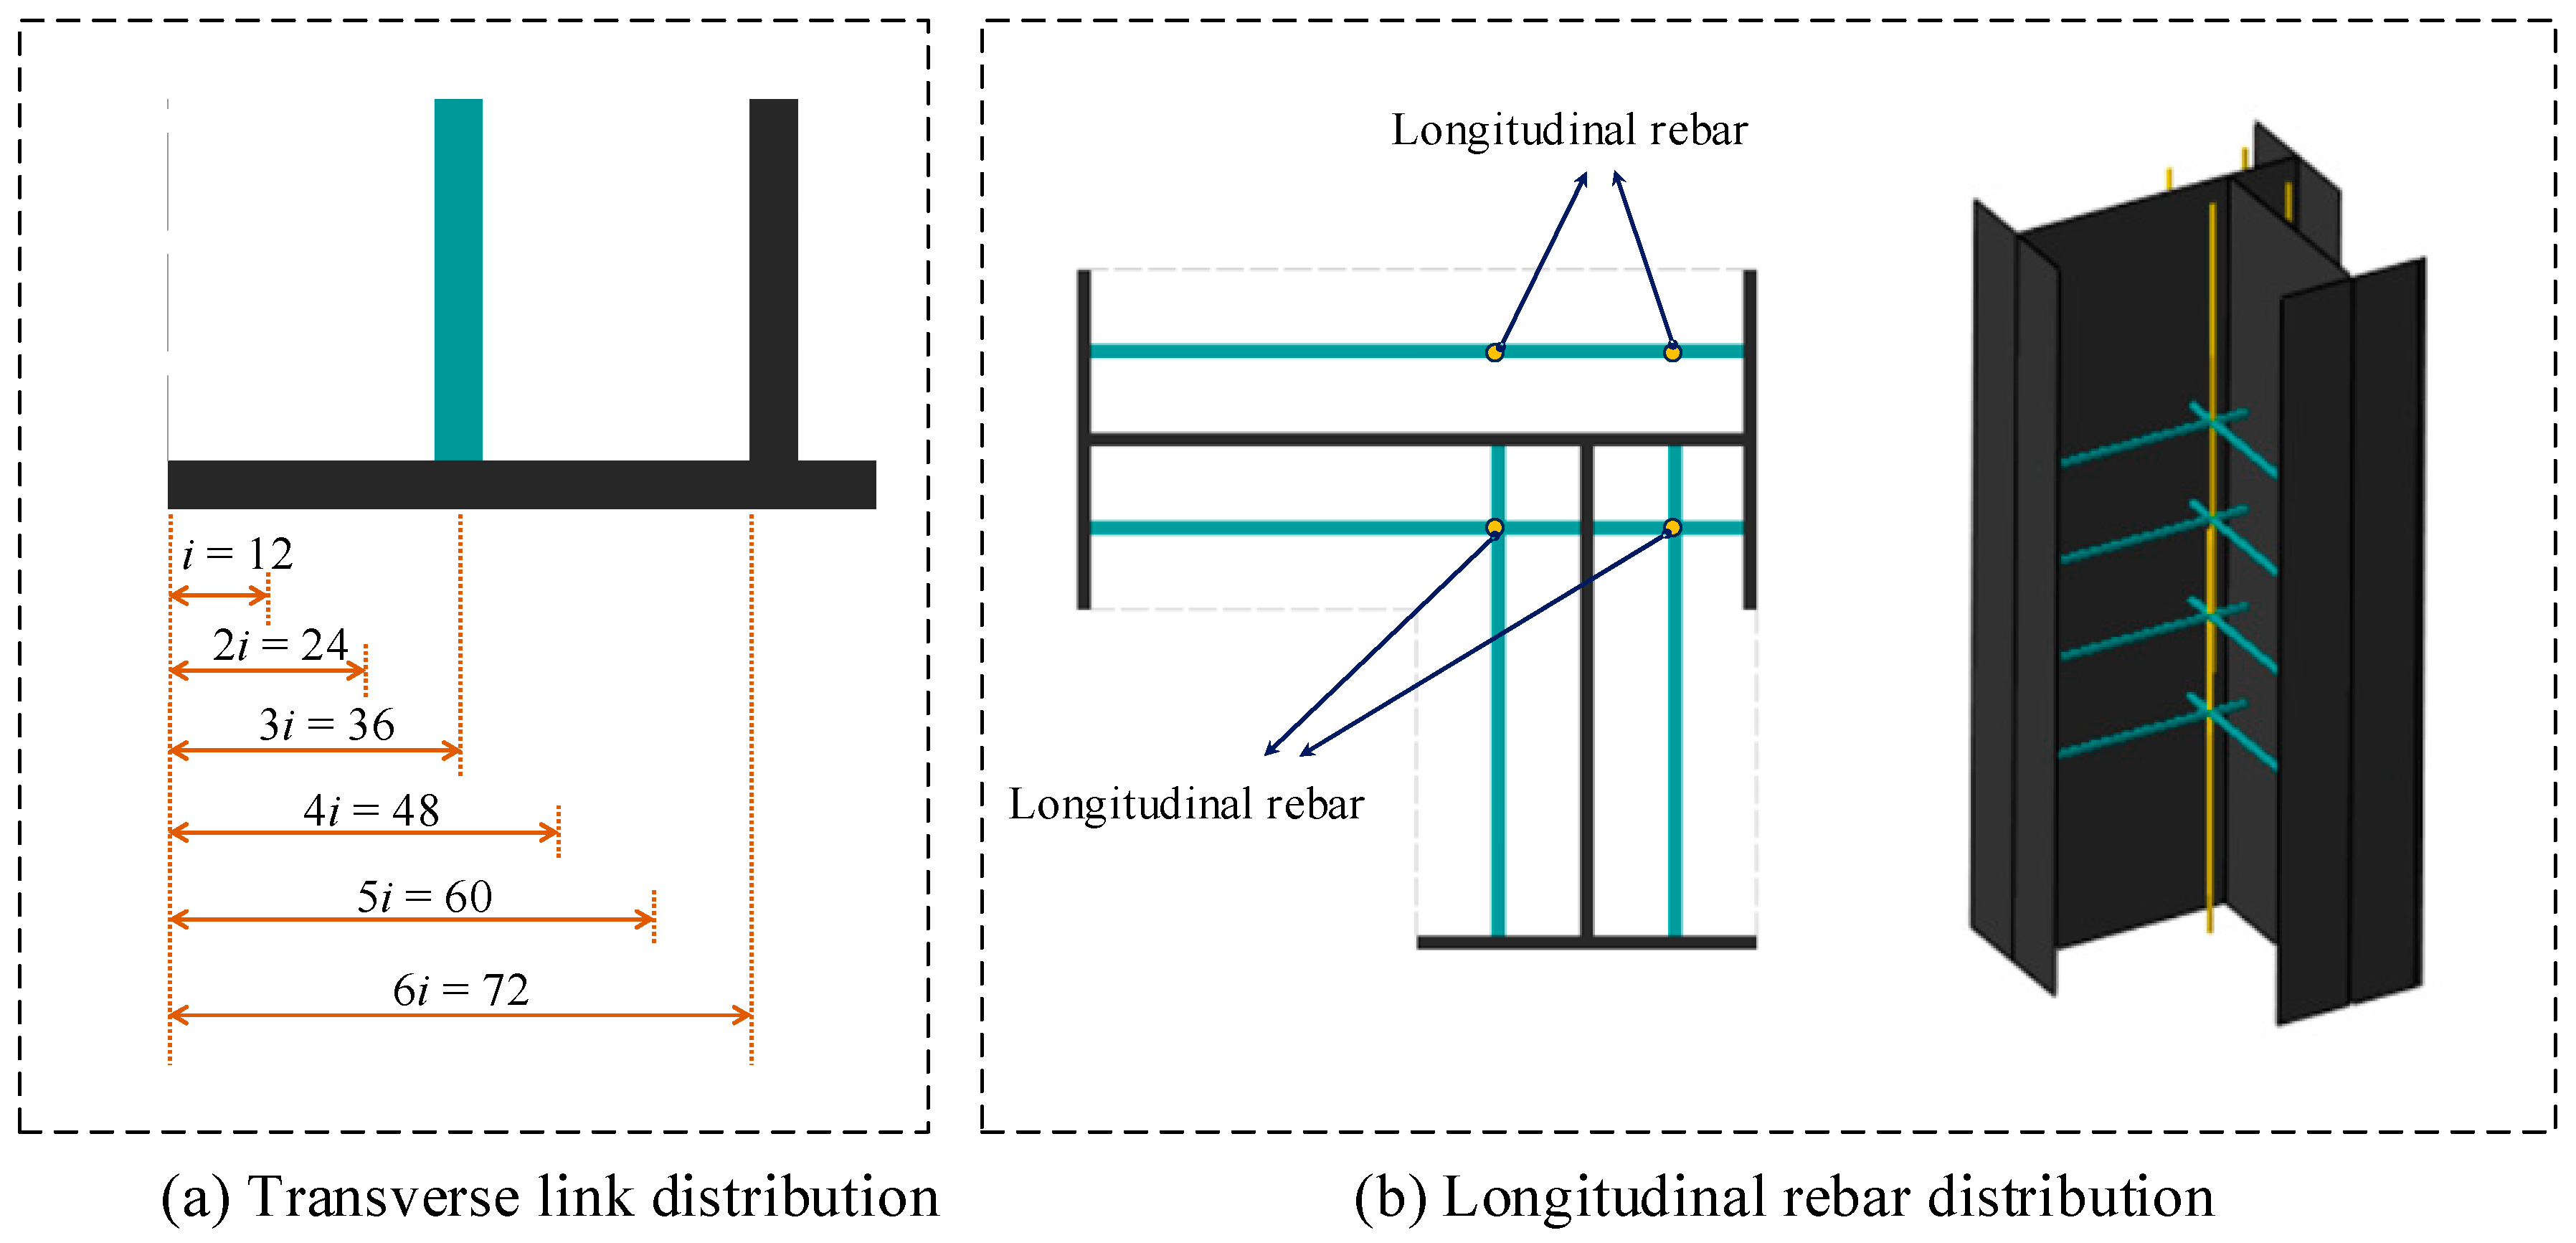
Relevant FE models were established to investigate the axial compression performance of LPEC stub columns, considering the influence of parameters including material strength, steel thickness (flange thickness and web thickness), transverse link spacing, transverse link diameter, and transverse link distribution which refers to the distance from the center axis of the transverse link to the end of the flange, expressed as a multiple of i, where i equals 12 mm, as shown in Figure 15a. When calculating the axial compression capacity of PEC stub columns, the confinement effect of longitudinal rebars on concrete is limited [35]. To investigate the impact of longitudinal rebars, this paper adopted the diameter of the longitudinal rebar as a parameter, a total of four longitudinal rebars using the truss element (T3D2) with a yield strength of 300 MPa were embedded in the FE model, and the schematic diagram of the arrangement is shown in Figure 15b. All the FE models have a height of 750 mm and a cross-section with dimensions a and b, both of which are equal to 300 mm, and the specific parameters of the models are shown in Table 4. The axial load–displacement curves and ICSE value of each FE model are shown in Figure 16 and Figure 17, respectively. The simulation results of FE models are shown in Table 5.
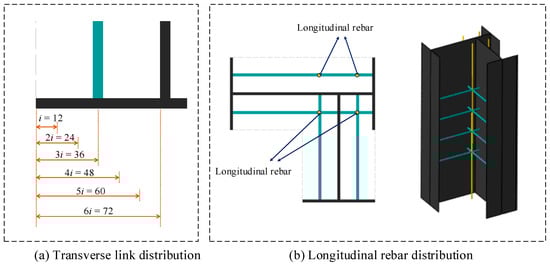
Figure 15.
Transverse link and longitudinal rebar distribution.
Table 4.
FE models for parametric analysis.
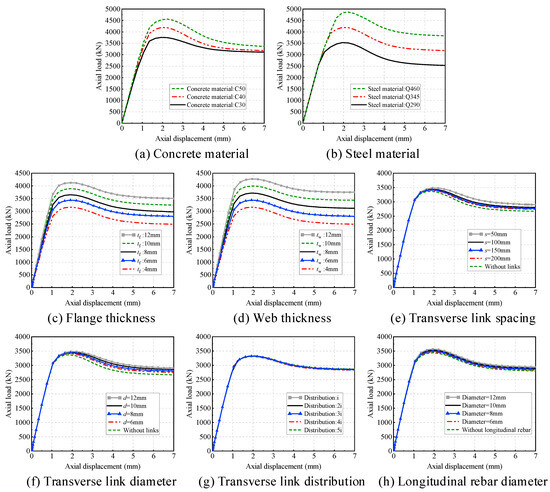
Figure 16.
Axial load–displacement curves of FE models in parametric analysis.
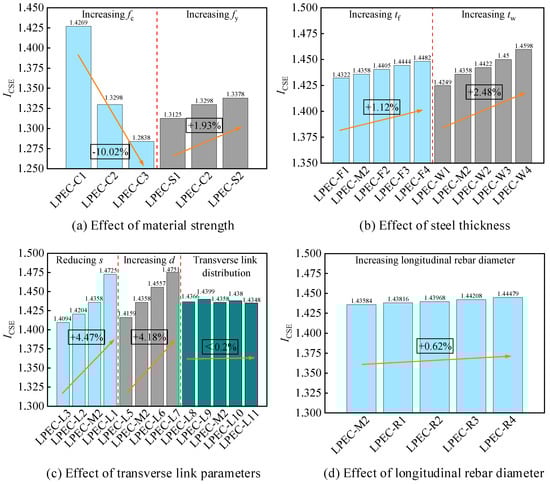
Figure 17.
ICSE of FE models in parametric analysis.
Table 5.
Simulation results of FE models in parametric analysis.
3.4.1. Effect of Material Strength
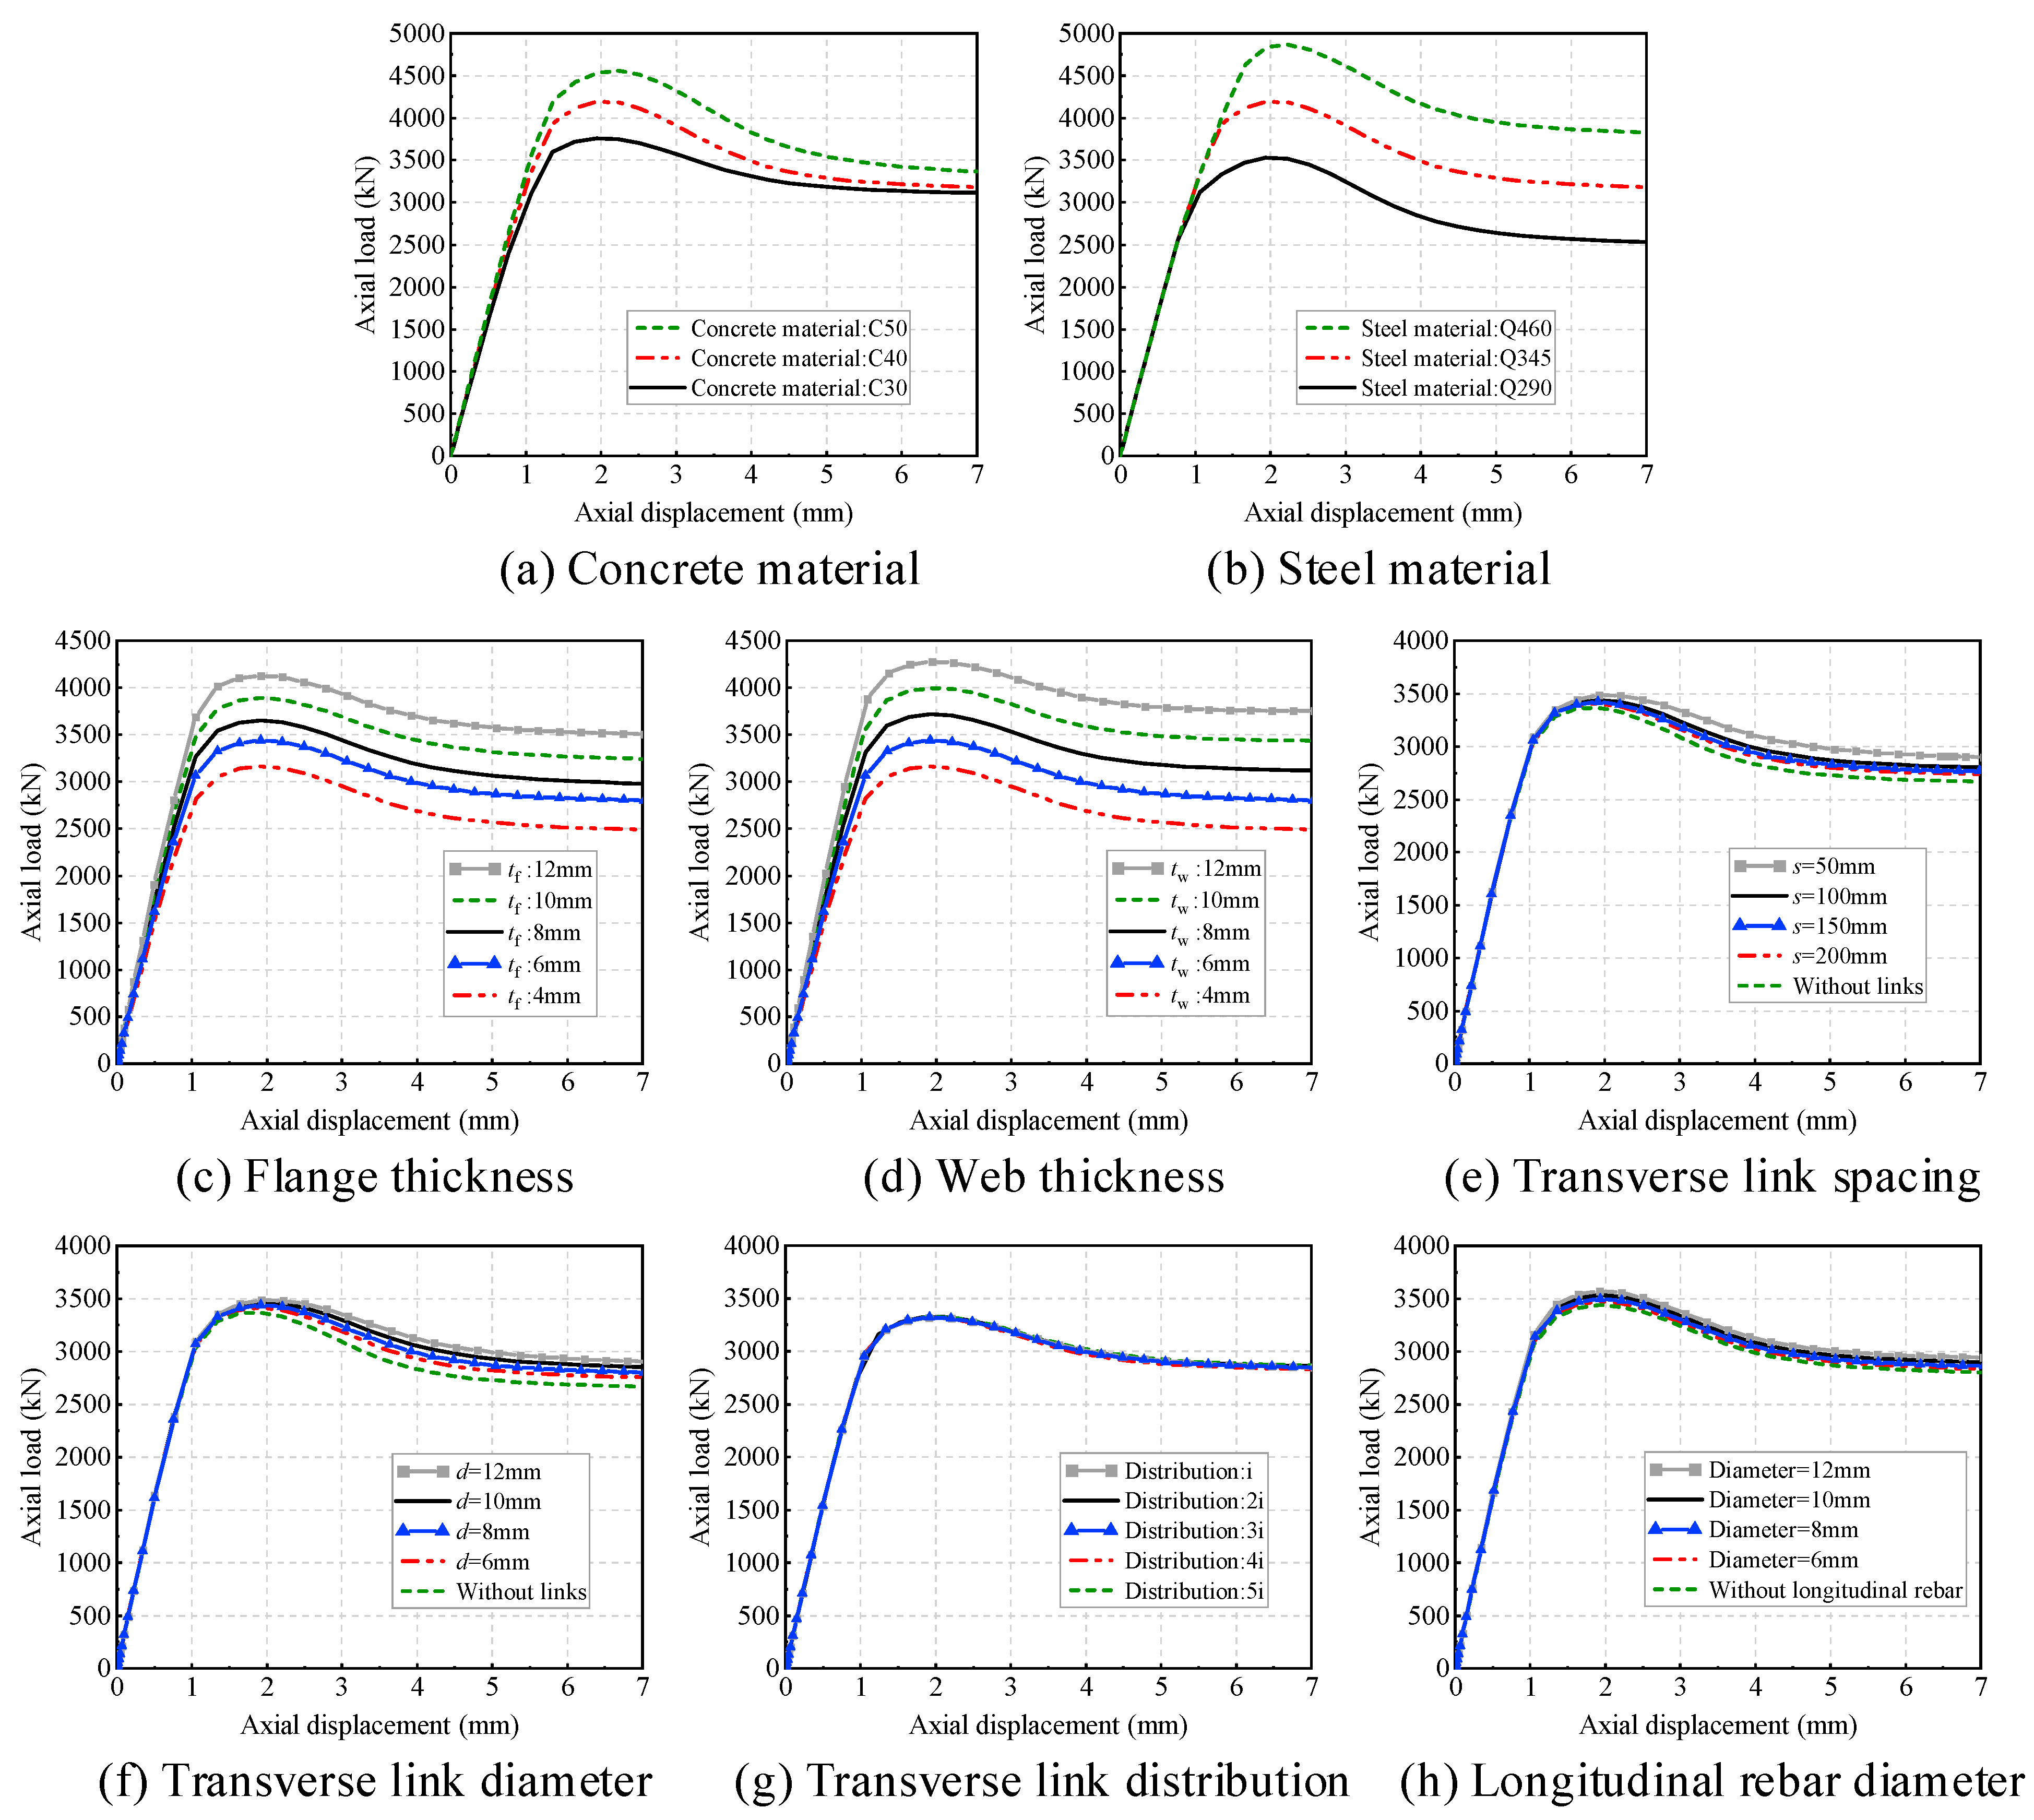
Figure 16a indicates that when the compressive strength of concrete increased from 30 MPa to 40 MPa and 50 MPa, the axial compression capacity of LPEC stub columns increased by 11.44% and 19.05% respectively, with an accompanying increase in initial stiffness. However, the ductility decreased, and the residual strength did not improve noticeably. Figure 16b shows that when the yield strength of steel increased from 235 MPa to 345 MPa and 460 MPa, the axial compression capacity of the stub columns increased by 18.78% and 37.94%, respectively. Additionally, both ductility and ultimate strength were enhanced. The above results suggested that increasing the material strength can effectively improve the axial compression capacity of LPEC stub columns.
As shown in Figure 17a, as the compressive strength of concrete increased from 30 MPa to 40 MPa and 50 MPa, the ICSE decreased by 6.80% and 10.02%, indicating that increasing the concrete strength significantly reduced the confinement effect. On the other hand, as the yield strength of steel increased from 235 MPa to 345 MPa and 460 MPa, the ICSE increased by 1.32% and 1.93%, suggesting that increasing the steel strength influenced the confinement effect slightly.
3.4.2. Effect of Steel Thickness
Figure 16c indicates that when the flange thickness increased from 4 mm to 6 mm, 8 mm, 10 mm, and 12 mm, the axial compression capacity of the column increased by 8.36%, 15.07%, 22.58%, and 30.09%, respectively; a significant improvement in initial stiffness was also observed. Similarly, Figure 16d shows that when the web thickness increased from 4 mm to 6 mm, 8 mm, 10 mm, and 12 mm, the axial compression capacity of the LPEC stub column increased by 8.74%, 17.54%, 26.35%, and 35.19%, accompanied by a notable improvement in both initial stiffness and ductility. This demonstrated that increasing the steel thickness can significantly improve the axial compression performance of LPEC stub columns.
As shown in Figure 17b, when the flange thickness increased from 4 mm to 6 mm, 8 mm, 10 mm, and 12 mm, the ICSE increased by 0.25%, 0.58%, 0.85%, and 1.12%, respectively. Meanwhile, when the web thickness increased from 4 mm to 6 mm, 8 mm, 10 mm, and 12 mm, the ICSE increased by 0.73%, 1.20%, 1.76%, and 2.48%, respectively. It indicated that increasing the flange thickness can slightly enhance the confinement strength of concrete, but the effect was limited, and increasing the web thickness had a significant effect on enhancing the concrete confinement.
3.4.3. Effect of Transverse Link Parameters
Figure 16e illustrates that when the transverse link spacing dropped from 200 mm to 150 mm, 100 mm, and 50 mm, the axial compression capacity of the stub column increased by 0.39%, 0.94%, and 2.24%, respectively. Similarly, Figure 16f shows that when the transverse link diameter increased from 6 mm to 8 mm, 10 mm, and 12 mm, the axial compression capacity of the stub column increased by 0.71%, 1.41%, and 2.10%, respectively. However, Figure 16g shows that when the transverse link distribution changed, the ultimate axial compression capacity did not vary significantly.
As shown in Figure 17c, when the transverse link spacing dropped from 200 mm to 150 mm, 100 mm, and 50 mm, the ICSE increased by 0.77%, 1.87%, and 4.47%, respectively; when the transverse link diameter increased from 6 mm to 8 mm, 10 mm, and 12 mm, the ICSE increased by 1.40%, 2.81%, and 4.18%, respectively.
The results above indicated that reducing the transverse link spacing and increasing its diameter can notably improve both the axial compression capacity and the concrete confinement effect of LPEC stub columns. However, the transverse link distribution had a relatively minor impact on both the ultimate axial compression capacity and the concrete confinement effect of the column, making it negligible.
3.4.4. Effect of Longitudinal Rebar Diameter
Figure 16h illustrates that when the longitudinal rebar diameter increased from 6 mm to 8 mm, 10 mm, and 12 mm, the axial compression capacity of the stub column increased by 0.74%, 1.70%, and 2.88%, respectively. This indicated that increasing the longitudinal rebar diameter can improve the column’s bearing capacity. As shown in Figure 17d, compared to the column without longitudinal rebars which can be considered as having a longitudinal rebar diameter of 0 mm, the ICSE values for columns with longitudinal rebar diameters of 6 mm, 8 mm, 10 mm, and 12 mm increased by 0.16%, 0.26%, 0.43%, and 0.62%, respectively. This indicated that longitudinal rebar had a limited effect on enhancing the concrete confinement.
4. Discussion on Calculation Methods in Specifications
Currently, there is no existing method for calculating the axial compression capacity of LPEC stub columns. Therefore, two calculation methods in specifications (T/CECS719-2020 [30] and EC4 [36]) were selected to calculate the axial compression capacity of LPEC stub columns in the aforementioned experiments and FE parametric analysis, in order to verify the accuracy of these two specifications.
4.1. Eurocode 4
According to specification EC4, the calculation formula for the axial compression capacity of PEC stub columns is shown in Equation (8):
where Nu,EC4 represents the axial compression capacity of the PEC column; As represents the area of steel; Ac represents the area of concrete; Ar represents the area of longitudinal rebars; fys represents the yield strength of steel; fc′ represents the cylinder compressive strength of concrete; and fr represents the yield strength of longitudinal rebar.
4.2. T/CECS 719-2020
According to specification T/CECS719-2020, the calculation formula for the axial compression capacity of PEC stub columns is shown in Equation (9):
where Nu,CECS represents the axial compression capacity of the PEC column; As represents the area of steel; Ac represents the area of concrete; Ar represents the area of longitudinal rebars; fys represents the yield strength of steel; fc represents the prismatic compressive strength of concrete; and fr represents the yield strength of longitudinal rebar.
4.3. Comparison of Different Specifications
By comparing the experimental and FE calculation results with those calculated from the specifications, as detailed in Table 6, the results show that the ratios of Nu to Nu,CECS range from 1.13 to 1.198, with an average value of 1.167. Similarly, the ratios of Nu and Nu,EC4 range from 1.129 to 1.196, with an average ratio of 1.166. The comparison results indicate that both specifications underestimate the axial compression capacity of LPEC stub columns. These underestimated results arise from the fact that both methods rely primarily on the integration of material strengths, and the enhanced concrete strength resulting from the concrete confinement effect is ignored.
Table 6.
Comparison between experimental, FE analysis and specifications.
5. Proposed Calculation Method Considering Strength Enhancement of Concrete
To precisely calculate the axial compression capacity of LPEC stub columns, a calculation method based on the superposition principle incorporating the concrete confinement effect is proposed. By dividing the concrete into zones and calculating the concrete strength separately in each zone, this method considers the differences in the constrained strength of concrete in various regions, each represented by a specific enhancement coefficient. Considering the varying degrees of constrained strength provided by steel, the concrete is divided into highly constrained regions and partially constrained regions. The regions covered by webs on both sides are defined as highly constrained regions, and the regions covered by only one web or no web are classified as partially constrained regions, as shown in Figure 18.

Figure 18.
Division of constrained regions.
The formula for calculating the bearing capacity of LPEC stub columns can be expressed as Equation (10), where Nu,p represents the axial compression capacity calculated by the proposed calculation formula; Kchi represents the enhancement coefficient for concrete in highly constrained regions calculated by Equations (19) and (20); and Kcpi represents the enhancement coefficient for concrete in partially constrained regions calculated by Equation (25). In addition, the influence of transverse links on the bearing capacity is represented by an enhancement coefficient Klink calculated by Equation (26). Achi represents the area of the highly constrained region as expressed in Equation (11); Di represents the width of the highly constrained region as expressed in Equations (12) and (13); Acpi represents the area of the partially constrained region as expressed from Equation (14) to (17); As represents the area of steel as expressed in Equation (18); Ar represents the area of longitudinal rebars; fc represents the prismatic compressive strength of concrete; fy represents the yield strength of steel; and fr represents the yield strength of longitudinal rebar.
5.1. Enhancement Coefficient for Concrete in Highly Constrained Regions
Based on the results from the experiments and FE analysis, no local buckling phenomenon was observed on the web plate when the column broke. The confinement state of concrete in highly constrained regions can be considered similar to that in a square steel tube of the same size [37]. The enhancement coefficient for the strength of constrained concrete is calculated according to the formula put forward by Yu et al. [38], specifically detailed in Equations (19) and (20).
5.2. Enhancement Coefficient for Concrete in Partially Constrained Regions
Based on the observed experimental phenomena, local buckling occurred on the flange when the column reached the axial compression capacity, the out-of-plane bending deformation of the flange’s extended portion exerted a confining effect on the concrete in partially constrained areas. Therefore, the flange’s extended portion can be viewed as a cantilever beam, and the effective lateral stress distribution can be simplified as a rectangular distribution [39]; it is assumed that at the ultimate load, the internal moment resisted by the flange’s extended portion is equal to the bending moment generated by the lateral stress on the flange, as shown in Figure 19. The effective lateral confining stress exerted by the flange’s extended portion on the concrete can be expressed by Equation (21), where flyi is flange effective lateral constraint stress. When local buckling occurs on the flange, the effective partially constrained area is considered as the area enclosed by two parabolas with a terminal angle of 45 degrees and profile steel [40].
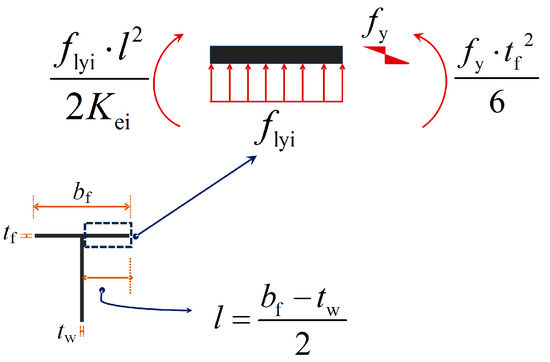
Figure 19.
The confinement mechanism of the flange’s extended portion on concrete.
The effective partially constrained area is denoted as Aecpi, as shown in Figure 20; since Acp4 is relatively small, to facilitate calculations, Aecp4 and Acp4 are considered to be approximately equal. Kei represents the effective confinement coefficient for concrete in the partially constrained region, as expressed in Equation (22).
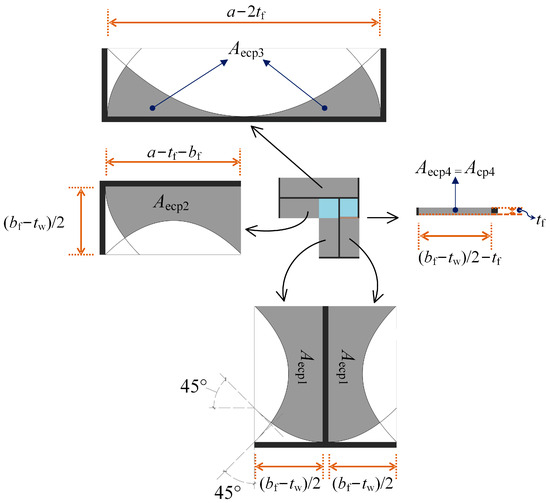
Figure 20.
The effective constrained area within the partially constrained regions.
Incorporating the mathematical expression introduced by EI-Tawil [41], which correlates confining stress with the strength improvement coefficient of concrete, upper and lower bounds for the strength enhancement coefficient of constrained concrete are considered in this study. These bounds are contingent upon the magnitude of lateral stresses exerted on the concrete in two directions. When flxi ≤ flyi = 0.3fc′, the upper bound kh is expressed as follows:
When flxi = flyi, the lower bound kl is expressed as:
where flxi represents the effective lateral constraint stress in the horizontal direction orthogonal to flyi, and considering only the confining effect of the flange on the concrete in the partially constrained areas, flxi is deemed to be zero [39]; fc′ is the strength of cylindrical concrete.
By considering both cases, the expression of the enhancement coefficient for concrete in partially constrained regions (Kcpi) is given in Equation (25):
5.3. Enhancement Coefficient Provided by the Transverse Links
As analyzed in Section 3.4.4, the transverse link spacing and diameter have a significant impact on the axial compression capacity, while the transverse link distribution has a relatively minor effect. Therefore, the enhancement coefficient provided by the transverse links is expressed as a function of the transverse link spacing and diameter. Through the calculation results of a few FE models with transverse link diameter from 4 mm to 20 mm and transverse link spacing from 50 mm to 200 mm, the expression for the enhancement coefficient provided by the transverse links is fitted as shown in Equation (26), where d represents the transverse link diameter and s represents the transverse link spacing.
5.4. Verification of the Proposed Calculation Method
A total of 27 FE models were established for further analysis. The materials (fy and fc), steel thickness (tw and tf), transverse link spacing (s) and diameter (d), and the size of the shape (a and b) were considered parameters. All the FE models had a height of 750 mm, and the detailed parameters of the models are shown in Table 7.
Table 7.
Supplementary FE models.
When comparing the experimental and FE analysis results with the calculating results, the ratio of Nu to Nu,p was mostly between 0.97 and 1.03, with an average value of 1.024 and a standard deviation of 0.02. The detailed results are shown in Table 8 and the error graph is shown in Figure 21. This indicates that the experimental and FE analysis results are in good agreement with the formula results. The calculation method based on the superposition principle considering the concrete confinement effect is suitable for calculating the axial compression capacity of LPEC stub columns.
Table 8.
Comparison between experimental, FE analysis and proposed calculation method.
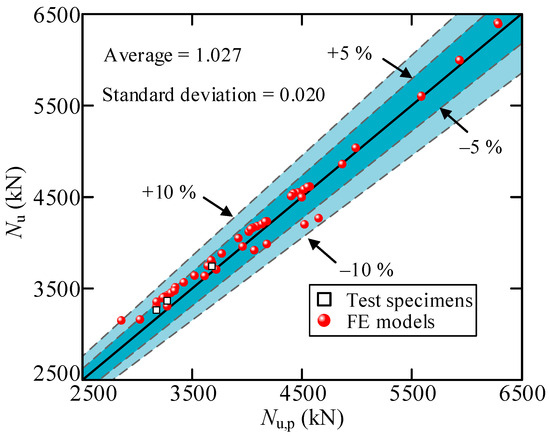
Figure 21.
Accuracy of the proposed calculation formula.
6. Conclusions
This study conducted experiments and finite element parametric analysis on the axial compression capacity of L-shaped PEC stub columns. The experimental phenomena, mechanical properties, and calculation methods for axial compression capacity were studied separately. The main conclusions are summarized as follows:
- The primary failure modes observed in the experiments were concrete spalling and local buckling of the flange. The load–displacement curve of an L-shaped PEC stub column under axial compression exhibited distinct phases: an initial elastic stage, followed by an elastic–plastic stage, and ultimately a load-decreasing stage.
- Experimental results demonstrated that the bearing capacity enhancement index (IBCE) value of L-shaped PEC columns exceeded 1.0, and the confinement effect significantly improved the bearing capacity of the concrete. Additionally, the decrease in the concrete strength or the increase in steel strength leads to an increase in the concrete strength enhancement index (ICSE) value.
- The finite element models were validated to be accurate. According to the FE parametric analysis, the axial compression capacity of the L-shaped PEC stub column improved with increases in concrete strength, steel strength, steel thickness, transverse link diameter, and longitudinal rebar diameter, as well as a decrease in transverse link spacing. Furthermore, the concrete confinement effect was enhanced with increases in steel strength, steel thickness, and transverse link diameter, as well as a decrease in transverse link spacing.
- The current calculation methods in relevant specifications (T/CECS719-2020 and EC4) do not consider the concrete confinement effect, which leads to an underestimation of the calculation results. A calculation method based on the superposition principle considering the concrete confinement effect is proposed. By comparing the results with experimental and FE parametric analysis, it can be considered that this calculation method has high accuracy.
Author Contributions
Conceptualization, H.Z. and Y.X.; data curation, Y.Q.; formal analysis, H.Z.; funding acquisition, H.Z. and Y.X.; investigation, Y.Q. and Y.X.; methodology, H.Z. and Y.X.; project administration, Y.X. and Z.X.; resources, H.Z. and Y.X.; software, Y.Q. and H.Z.; supervision, H.Z. and Z.J.; validation, Y.Q. and H.Z.; writing—original draft, Y.Q.; writing—review and editing, H.Z. All authors have read and agreed to the published version of the manuscript.
Funding
This work was supported by the Construction Research Project of Zhejiang Province (2023K142).
Data Availability Statement
All data from this study are available upon reasonable request to the corresponding author.
Conflicts of Interest
Authors Haochuan Zhu, Zhibin Xiao and Zhenfen Jin were employed by the company The Architecture Design & Research Institute of Zhejiang University Co., Ltd. The remaining authors declare that the research was conducted in the absence of any commercial or financial relationships that could be construed as a potential conflict of interest.
References
- Jin, Z.F.; Li, S.H.; Xiao, Z.B.; Rong, Z.H. Design method and practice of partially-encased composite steel and concrete structures. Prog. Steel Build. Struct. 2023, 25, 94–101. [Google Scholar]
- Tremblay, R.; Massicotte, B.; Filion, I.; Maranda, R. Experimental study on the behaviour of partially encased composite columns made with light welded h steel shapes under compressive axial loads. Proc. Annu. Tech. Sess. Struct. Stab. Res. Counc. 1998, 195–204. Available online: https://publications.polymtl.ca/29273/ (accessed on 18 September 2024).
- Tremblay, R.; Chicoine, T.; Massicotte, B. Design equation for the axial capacity of partially encased non-compact columns. In Proceedings of the Conference: Composite Construction in Steel and Concrete IV, Banff, AB, Canada, 28 May–2 June 2000; pp. 506–517. [Google Scholar]
- Chicoine, T.; Tremblay, R.; Massicotte, B.; Ricles, J.M.; Lu, L.-W. Behavior and strength of partially encased composite columns with built-up shapes. J. Struct. Eng. 2002, 128, 279–288. [Google Scholar] [CrossRef]
- Chicoine, T.; Massicotte, B.; Tremblay, R. Long-term behavior and strength of partially encased composite columns made with built-up steel shapes. J. Struct. Eng. 2003, 129, 141–150. [Google Scholar] [CrossRef]
- Begum, M.; Driver, R.G.; Elwi, A.E. Numerical simulations of the behaviour of partially encased composite columns. Struct. Eng. Rep. 2007, 1–270. Available online: https://era.library.ualberta.ca/items/53a177b8-9080-43c3-8574-89fab6e2ba92/download/199c40e9-0ffb-4087-af35-33c68ae9123f (accessed on 18 September 2024).
- Begum, M.; Driver, R.G.; Elwi, A.E. Finite-element modeling of partially encased composite columns using the dynamic explicit method. J. Struct. Eng. 2007, 133, 326–334. [Google Scholar] [CrossRef]
- Chen, Y.; Wang, T.; Yang, J.; Zhao, X. Test and numerical simulation of partially encased composite columns subject to axial and cyclic horizontal loads. Int. J. Steel Struct. 2010, 10, 385–393. [Google Scholar] [CrossRef]
- Song, Y.-C.; Wang, R.-P.; Li, J. Local and post-local buckling behavior of welded steel shapes in partially encased composite columns. Thin-Walled Struct. 2016, 108, 93–108. [Google Scholar] [CrossRef]
- Song, Y.; Li, J.; Yam, M.C.H.; Chen, Y. A nonlinear fiber beam-column model for partially encased composite columns incorpo-rating local buckling effect. J. Build. Eng. 2023, 68, 106211. [Google Scholar] [CrossRef]
- Lin, D.H.; Chen, Y.Y. Overall stability analysis of partially encased composite columns. Eng. Mech. 2019, 36, 71–77+85. [Google Scholar]
- Chuan, G.; Chen, Y. Static loading test and shear strength calculation of assembled frame connections of partially encased composite structures. J. Build. Struct. 2017, 38, 83–92. [Google Scholar]
- Li, W.; Chen, Y. Experimental Study on the Behavior of Partially Encased Composite Bending Members with Different Links. Prog. Steel Build. Struct. 2015, 17, 1–6. [Google Scholar]
- Chen, C.-C.; Lin, N.-J. Analytical model for predicting axial capacity and behavior of concrete encased steel composite stub columns. J. Constr. Steel Res. 2006, 62, 424–433. [Google Scholar] [CrossRef]
- Jamkhaneh, M.E.; Kafi, M.A.; Kheyroddin, A. Behavior of partially encased composite members under various load condi-tions: Experimental and analytical models. Adv. Struct. Eng. 2019, 22, 94–111. [Google Scholar] [CrossRef]
- Lai, B.; Liew, J.Y.R.; Venkateshwaran, A.; Li, S.; Xiong, M. Assessment of high-strength concrete encased steel composite columns subject to axial compression. J. Constr. Steel Res. 2020, 164, 105765. [Google Scholar] [CrossRef]
- Liu, J.; Chen, Y.; Chan, S.L.; Chan, T.M.; Zhu, S. The Influence of Section Aspect Ratio on the Mechanical Performance of Partially Encased Composite Columns; Hong Kong Institution of Steel Construction: Hong Kong, China, 2020. [Google Scholar]
- Zhou, W.; Li, B.-S.; Zhao, G.-T.; Gao, C. Experimental study of seismic performance of PEC column-steel beam 3D frame with endplate connection. J. Constr. Steel Res. 2023, 202, 107765. [Google Scholar] [CrossRef]
- Wang, W.; Cai, H.; Bai, C.; Bao, H.; Gao, B.; Yuan, Z.; Wang, K. Seismic performance of partially encased concrete composite columns with corrugated web. J. Build. Eng. 2023, 77, 107481. [Google Scholar] [CrossRef]
- Yu, J.; Zhao, C.; Zhong, W. Seismic behavior of partially encased composite columns-steel plate shear wall structure with different semi-rigid joints. J. Build. Eng. 2024, 82, 108177. [Google Scholar] [CrossRef]
- Piquer, A.; Hernández-Figueirido, D. Protected steel columns vs partially encased columns: Fire resistance and economic con-siderations. J. Constr. Steel Res. 2016, 124, 47–56. [Google Scholar] [CrossRef]
- Li, S.; Liew, J.R.; Xiong, M.-X.; Lai, B.-L. Experimental investigation on fire resistance of high-strength concrete encased steel composite columns. Fire Saf. J. 2021, 121, 103273. [Google Scholar] [CrossRef]
- Cai, X.; Xu, C.; Zhu, Y.; Shi, H.; Mao, X.; Tian, S. Similarity analysis of the fire-resistant behaviour of partially encased composite columns in different scales. Structures 2024, 62, 106310. [Google Scholar] [CrossRef]
- Li, G.; Li, Y. Constitutive models of constrained concrete in cross-shaped PEC column under axial compression. J. Constr. Steel Res. 2024, 215, 108533. [Google Scholar] [CrossRef]
- Tao, S.-Q.; Liu, Y.; Wang, J.-F.; Yu, Q.-J.; Zhao, J.-H. Experimental investigation and design method of axial compression behavior of T-shaped partially encased steel-concrete composite stub columns. J. Build. Eng. 2024, 85, 108668. [Google Scholar] [CrossRef]
- Zhan, X.; Qin, Z.; Li, J.; Chen, Y. Global stability of axially loaded partially encased composite column with L-shaped section. J. Constr. Steel Res. 2023, 200, 107671. [Google Scholar] [CrossRef]
- Zhan, X.; Qin, Z.; Chen, Y.; Li, J.; Jiao, W. Stability of partially encased composite steel and concrete column with L-shaped section under eccentric compression around minor axis. J. Build. Struct. 2024, 45, 180–191. [Google Scholar]
- GB/T228-2021; Metallic Materials-Tensile Testing at Ambient Temperature. Architecture Industrial Press of China: Beijing, China, 2021.
- GB/T50081-2019; Standard for Test Methods of Concrete Physical and Mechanical Properties. Architecture Industrial Press of China: Beijing, China, 2019.
- T/CECS 719-2020; Technical Specification for Partially Coated Steel-Concrete Composite Structures. China Engineering Construction Standardization Association: Beijing, China, 2020.
- Yang, H.; Lam, D.; Gardner, L. Testing and analysis of concrete-filled elliptical hollow sections. Eng. Struct. 2008, 30, 3771–3781. [Google Scholar] [CrossRef]
- Begum, M.; Driver, R.G.; Elwi, A.E. Behaviour of partially encased composite columns with high strength concrete. Eng. Struct. 2013, 56, 1718–1727. [Google Scholar] [CrossRef]
- Han, L.-H.; Yao, G.-H.; Tao, Z. Performance of concrete-filled thin-walled steel tubes under pure torsion. Thin-Walled Struct. 2007, 45, 24–36. [Google Scholar] [CrossRef]
- GB 50010-2010; Code for Design of Concrete Structures. Ministry of Housing and Urban-Rural Development of the People’s Republic of China, and General Administration of Quality Supervision, Inspection and Quarantine of the People’s Republic of China: Beijing, China, 2015.
- Qian, Z.; Wang, J.; Liu, Y.; Xu, Q. Axial compressive performance of partially encased steel-concrete composite stub columns filled with lightweight aggregate concrete. Eng. Struct. 2023, 291, 116422. [Google Scholar] [CrossRef]
- EN1994-1-1:2004; Eurocode 4 (EC4), Design of Composite Steel and Concrete Structures-Part1-1: General Rules and Rules for buildings. European Committee for Standardization: Brussels, Belgium, 2004.
- Wang, J.F.; Tao, S.Q.; Liu, Y. Numerical analysis and calculation methods on the axial compression behavior of cross-shaped partially encased concrete composite columns. Prog. Steel Build. Struct. 2023, 3, 65–74. [Google Scholar]
- Yu, Y.; Lv, X.L.; Kiyoshi, T. Sasaki Satoshi, Study on the Performance of Axially Compressed Square Steel Tube-Confined Concrete Short Columns: II. Analysis. Build. Struct. 2000, 2, 43–46. (In Chinese) [Google Scholar]
- El-Tawil, S.M.; Deierlein, G.G. Fiber Element Analysis of Composite Beam-Column Cross-Sections; Cornell University: Ithaca, NY, USA, 1996. [Google Scholar]
- Zhao, X.Z.; Wen, F.P. Theoretical study on confinement mechanism and stress-strain model for steel confined concrete in SRC columns. Eng. Mech. 2018, 35, 36–46. [Google Scholar]
- El-Tawil, S.; Deierlein, G.G. Strength and ductility of concrete encased composite columns. J. Struct. Eng. 1999, 125, 1009–1019. [Google Scholar] [CrossRef]


Disclaimer/Publisher’s Note: The statements, opinions and data contained in all publications are solely those of the individual author(s) and contributor(s) and not of MDPI and/or the editor(s). MDPI and/or the editor(s) disclaim responsibility for any injury to people or property resulting from any ideas, methods, instructions or products referred to in the content. |
© 2024 by the authors. Licensee MDPI, Basel, Switzerland. This article is an open access article distributed under the terms and conditions of the Creative Commons Attribution (CC BY) license (https://creativecommons.org/licenses/by/4.0/).