Article

Study on the Characteristics of Community Elderly Care Service Facilities Usage and Optimization Design Based on Life Cycle Theory

1
School of Human Settlements and Civil Engineering, Xi’an Jiaotong University, Xi’an 710049, China
2
China Railway First Survey and Design Institute Group Co., Ltd., Xi’an 710043, China
*
Author to whom correspondence should be addressed.
Buildings 2024, 14(9), 3003; https://doi.org/10.3390/buildings14093003
Submission received: 5 August 2024 / Revised: 14 September 2024 / Accepted: 20 September 2024 / Published: 21 September 2024

Abstract

:
As the aging population in China increases, home-based elderly care is set to become the main mode of elderly care in the future. The construction of community elderly care service facilities is receiving more and more attention from society. Currently, residential area design standards in China lack clear guidance on the spatial planning of facilities, which will lead to unreasonable facility layout planning and insufficient convenience in the utilization of facilities by the elderly. Fully considering the distribution characteristics of community elderly care service facilities and the needs of the community life circle when planning residential areas can effectively solve this problem. This study takes Xi’an City as the research object, based on the theory of life circle, through questionnaire surveys and cluster analysis, analyzes the current situation of the construction of elderly care service facilities and the characteristics of the use by the elderly. Combined with the community life circle model, the study scope is divided into community life circle levels, and put forward the planning strategies of coverage rate, number, richness, and spatial layout of the facilities, respectively. These strategies are designed to enhance the quality of life for seniors, ensuring that they have access to essential support and resources within their communities. It demonstrated that middle-aged elderly prefer community canteens and activity centers, while those with limited mobility and multiple chronic diseases have a higher demand for health service centers and community canteens. The utilization weight analysis shows that vegetable markets and supermarkets are most frequently used, whereas health service centers are the least utilized. The research proposes strategic planning enhancements, including full coverage of basic facilities, targeted increases in high-demand facilities, and tailored facilities for elderly characteristics. It recommends cross-community layouts to ensure service radius coverage, development reservations for future needs, and quality improvements to address the low satisfaction rates of existing facilities. The study concludes that a targeted approach to facility planning, considering the elderly’s diverse needs, can enhance the community elderly care service system’s sustainability and effectiveness.

1. Introduction

1.1. Background

Population aging is one of the major social issues that must be addressed in the 21st century. Data from the seventh national population census in China in 2020 show that the population aged 60 and above has exceeded 260 million, accounting for 18.7% of the total population [1]. At present, a population with 10% or more of people aged 60 and above is typically considered to have entered an aging society; China has far exceeded this standard. Faced with the intensifying situation of population aging and a series of urgent issues arising from it, such as the elderly care model, the adjustment of social resources, and the allocation of public facilities, the Chinese government proposed a national development plan in 2022 to “continue to build a coordinated elderly care service system of home, community, and institutions” [2]. The “institutional elderly care” and “home-based elderly care” models are currently the two most prevalent elderly care approaches in China. Influenced by the traditional Chinese concept of family, the vast majority of the elderly prefer the home-based elderly care model [3]. This is mainly because the elderly are more familiar with their living environment and can receive care from family members more conveniently. However, due to the trend of family miniaturization and fewer children in China, the number of elderly people living alone is increasing. When the elderly cannot be adequately taken care of by family members, they need to rely more on public elderly care service facilities in the community to meet their various daily life needs.
In 2018, the Chinese government issued the “Standard for Urban Residential Area Planning and Design”, replacing the previously used “ten thousand person index” for residential areas with the “life circle model” [4]. Unlike the traditional “ten thousand person index”, which mainly focuses on the number of facilities, the “life circle model” pays more attention to the type and distribution of facilities around the residential area.
Since 2000, China has built a large number of residential areas. However, when these residential areas were built, the concept of the life circle was not considered, resulting in many communities having inadequately constructed service facilities. The quality of services provided by these facilities is also generally low, which significantly reduces the quality of life of the elderly living in the community. This situation manifests in two ways: on one hand, the elderly face difficulties in community life and lack adequate care resources; on the other hand, there is a shortage of facilities and a low utilization rate of elderly care service facilities [2]. The main reason for these problems is that the elderly are limited by their walking ability, and their daily life is more dependent on the surrounding service facilities [5]. Therefore, since 2021, the Chinese government has promulgated a series of national policies, proposing the planning model of “15 min life circle” and the construction goals of community public service facilities. These policies all put forward requirements for the construction of communities which are suitable for the elderly [6,7,8].
While the government has charted a developmental course, the precise approaches to construction are yet to be underpinned by quantifiable evidence. A primary cause of this shortfall is that current research on elderly care facilities predominantly concentrates on their number and variety, rather than thoroughly exploring the needs of the elderly. Studies to date have prioritized the particular requirements of elderly individuals with health issues, often overlooking the broader, common needs of the aging population. Consequently, the findings from existing research, although they touch upon the quantity, size, and distribution of facilities, fail to account for the varying degrees of demand for different amenities among the elderly. This oversight has contributed to the suboptimal appeal and utilization of community services tailored for seniors. To bridge this gap, our research group has focused on the central urban districts of Xi’an, surveying elderly individuals across a spectrum of ages and health statuses, with the aim of gauging their needs and satisfaction with both community elderly care and commercial amenities. The insights gleaned from this study are expected to offer tailored recommendations and a foundation for prioritizing the enhancement of service facilities.

1.2. Literature Review

1.2.1. The Life Circles Theory

The life circle refers to the spatial scope or behavioral space formed by residents around their homes, where they carry out various life activities. Relevant scholars have summarized it into two models: one is the concept model centered on the residence, which can be divided into multiple levels according to the time scale, conforming to the people-oriented nature of the living circle, but it cannot be used for the configuration of facilities. The other is the planning model, where residences and related facilities are laid out in the community space, which is more in line with the requirements for the planning and construction of facilities and is the focus of living circle planning [9].
Research on the life circle originated in Japan in the 1950s. To strengthen urban governance, the Japanese government adopted the concept of the life circle, which encompasses spatiotemporal scales, and applied it multiple times in regional planning and development. Japanese scholars have conducted extensive research on the living circle system and measurement applications [10], expanding into more application directions, including disaster prevention living circles [11]. Subsequently, South Korea borrowed it for residential planning, replacing the community with the living circle and practicing it at the micro level.
The model of living circles is also widely applied in developed countries, serving as a significant part of sustainable urban development. Scholars from countries such as France, the United States, and Singapore, based on the characteristics of their cities, have proposed urban development plans of 15 or 20 min [12]. These bottom-up urban planning methods focus on the convenience and accessibility of facilities and coordinated development between regions. They hope to improve the city’s street network and encourage residents to walk or cycle in a low-carbon manner to alleviate traffic pressure, thereby gaining fair access to urban services. Da Silva posits that cities should prioritize accessibility as an indicator of transportation planning to strengthen the planning of its sustainability, thus focusing on the efficiency of 20 min walking or cycling [13]. Moreno advocates for “time urbanism”, asserting that the quality of urban life is inversely proportional to the time spent on transportation. Therefore, within a 15 min circle, various basic urban social functions should be met, which requires considering factors such as proximity, diversity, density, and digitalization to improve the city’s livability and resilience [14].

1.2.2. Home-Based or Community Elderly Care

According to a United Nations report, in 2017, the number of elderly people worldwide exceeded 13% of the total population, and this number is expected to continue increasing over the next few decades [15]. The aging of the global population has emerged as one of the major issues of the 21st century, with the rising proportion of elderly individuals having a profound impact on countries around the world.
Countries that were the first to enter an aging society have shifted from a single institutional elderly care model to a variety of home-based or community elderly care models, tailored to their respective populations, systems, and cultures. For example, the United States has retirement communities [16], Germany has multigenerational support communities [17], and Japan has a “medical care combined with elderly care” community elderly care model [18]. These models rely on fully age-friendly housing, comprehensive elderly care facilities within the community, intergenerational assistance among neighbors, and a comprehensive social security system, effectively addressing the practical issues of population aging.
Recent research has focused more on the significance of aging in place and the impact of neighborhood facilities on the elderly. Wiles elucidated the meaning of aging in place in terms of functionality, symbolism, and emotional attachment, as well as its significance for family, neighborhood, and community [19]; Frank demonstrated the elderly’s dependence on neighborhood quality and outdoor spaces [20]; Jacqueline analyzed the main types of facilities, distances, and densities that affect the physical activity of the elderly [21]; Andrea proved that the diversity of community convenience facilities can promote elderly mobility [22]; and Angela used walking as an intermediary variable, and through a mental health scale, explained the relationship between neighborhood cognition and happiness from aspects such as social contact, community quality, local facility use, safety, and mental health [23].

1.2.3. Development of the Elderly Care Service Facilities

Regarding the research on the construction of service facilities, scholars place strong emphasis on the equal rights of residents to access these facilities, which includes meeting minimum standards and ensuring equal choices. Therefore, research has mainly focused on the accessibility of road network planning and the equity of facility space, with the majority of articles focusing on medical facilities.
Regarding accessibility, Philippe summarizes geographic accessibility into four parameters: the definition of the residential area, aggregation methods, accessibility measures, and distance [24]; Bauer, in a case study of Berlin, introduced a variable distance decay function into the two-step floating catchment area method and confirmed the applicability of the theory [25]; Benevenuto introduced the open space accessibility poverty index to measure the transportation-related exclusion in rural areas due to a lack of basic opportunities (e.g., healthcare, education, work) [26].
Regarding equity, Hashem focused on the spatial mismatch between population distribution and facility distribution, and based on this, constructed a comprehensive model of spatial inequity measurement, using Geographical Information Systems to analyze the model [27]. Seongman used the Lorenz curve and Gini coefficient based on service accessibility to calculate the spatial equity index [28]. Sharma, for urban medical service facilities, used regression models, bivariate Gini indices, and Moran’s I to reveal the degree of spatial inequality of hospitals, and prioritized policy measures according to the social vulnerability index [29]. Sangwan explained the spatial inequality of medical service facilities in some parts of South Korea and the relationship between facility accessibility and socioeconomic variables through the Gaussian Mixture Model and Ordinary Least Squares Regression Model [30].

1.2.4. Supply of Community Elderly Care Services

The supply of community elderly care services can be divided into studies on the supply subjects and the content of the supply [31]. Some researchers, based on the ideology of welfare pluralism, assert that the supply subjects are diverse, pointing out the disadvantages of monopolistic government welfare as the only supplier, and advocate for the participation of market forces in community elderly care services. Pinker emphasized the need for close cooperation between statutory administrative departments, voluntary sectors, and private sectors to establish intimate and friendly partnerships. This approach aims to establish and improve informal care and support networks based on families and communities [32]. Therefore, the community support system is a system and framework that can provide services and support for the community population, including the elderly. Conversely, regarding supply content, there is a wealth of research on the categories of elderly community care services. Many scholars have classified the types of elderly care services and highlighted the standards for these services. Shaw pointed out that the community needs to focus on the elderly who require special care, such as the disabled and those living alone, providing them with psychological, social, and daily living services. Among them, 92% of elderly patients with mental illnesses also need to enjoy community support services, which can greatly alleviate their conditions [33]. Sumini and others believe that community nursing is extremely important in community elderly care services [34]. The home-based family nursing provided by the community is a response to the trends of increasing elderly population and the rise in elderly disability and dementia. The key factor in promoting the implementation of family nursing services is the technical and resource support provided by the community. Wang, from the perspective of technology-assisted elderly care, pointed out that machine-assisted fitness programs help elderly people with disabilities in the community meet their daily living and medical care needs [35]. A healthy physical promotion plan can be designed for the elderly through machines and implemented in the community to help disabled or semi-disabled elderly people maintain their health.

1.2.5. Elderly Community Care Needs

Regarding the current material and psychological needs of the elderly, the needs of the elderly population exhibit heterogeneity due to individual differences in physical capabilities and mental health issues. The needs of the elderly are mainly reflected in daily living care, financial subsidies, healthcare, mental comfort, social participation, and smart elderly care.
Lin’s research in Japan found that the elderly have the greatest dependency on daily care and healthcare services, and elderly people living alone have a higher probability of suffering from Alzheimer’s disease [36]. Hajek’s study indicates that due to changes in population structure and a significant trend towards an aging population, the future demand for long-term medical care in Germany will increase significantly [37]. Joyce used cluster analysis and chi-square analysis to explore the group differences in the use of community care services by different elderly individuals, suggesting that providing targeted services to different elderly people at the community level helps them gain more opportunities for social participation and meet their social participation needs [38]. Teresa conducted a characteristic analysis of the nutritional status, cognitive function, functional status, depression, and loneliness of community-dwelling elderly people aged 65 and over who are disabled or living alone. The study found that community elderly are at risk of developing cognitive disorders, depression, and loneliness. The community needs to continuously improve elderly care services and preventive measures to provide mental comfort and support, thereby enhancing the health status and quality of life of elderly residents in the community [39]. Hee found that psychological health issues, such as depression, sleep disorders, and perceived stress, are significantly correlated with the frequency of falls in community elderly people. The community needs to implement specialized fall prevention programs, pay attention to the mental and psychological health issues of the elderly, and protect their physical functions [40]. Doughty pointed out that the use of intelligent assistive technology helps to promote the independence of the vulnerable elderly population with disabilities in their daily living care needs, replacing traditional expensive nursing services [41]. Overall, the needs of the elderly are mainly reflected in various aspects such as healthcare, social services, home care, food services, emotional expression, and social participation. These needs correspond to certain existing facilities in contemporary society, which may not necessarily be specifically designed for the elderly but are still in high demand among them.
In summary, research on the theory of life circle mainly revolves around two main areas: the main user groups of facilities and the setting of these facilities. The focus is on the supply of the community and the needs of residents, including specific indicators such as development intensity, population density, and management level.
When researching community elderly care service facilities, current research mainly revolves around the types and needs of services that affect the elderly. It mainly includes the following four elements: age, degree of disability, health status, and care resources. The most influential elderly care facilities in the community for the elderly mainly include the following five types of facilities: elderly day care facilities, elderly service facilities, elderly activity facilities, elderly universities, and elderly dining facilities. The planning and layout research on community elderly care service facilities mainly starts from the perspective of facility equity and accessibility. The main research content includes service coverage, number of facilities, supply–demand ratio, distribution characteristics, spatial accessibility, and user opinions.
Existing academic research on the needs of the elderly tends to focus more on those with special needs such as “advanced age” and “frail health”, with relatively fewer studies addressing the needs of the general elderly population (scholars often assume that these elderly people have no special needs or categorize them similarly to young people). Although some government policies mention the construction of community service facilities, they also tend to favor “facilities specifically serving the elderly” and do not emphasize the important role that general community service facilities can play in the lives of the elderly. Therefore, conducting in-depth, quantifiable research on the community needs of all age groups and health conditions of the elderly is an important supplement to the current research on the development of community living circles.

2. Method

This study aims to explore the planning strategies for community elderly care service facilities within the framework of the life circle theory. Based on the current situation of the construction and demand for community elderly care service facilities in Xi’an, with the daily life needs and satisfaction levels of the elderly regarding these facilities, the study identifies the characteristics of facility utilization by the elderly. Finally, it proposes corresponding planning strategies for construction and management.
This study primarily employed two methods: questionnaire surveys and cluster analysis. The specific content, corresponding methods, and evaluation indicators are shown in Table 1.

2.1. Community Elderly Care Service Facility Usage and Demand Characteristics Survey

The survey was conducted by randomly selecting elderly individuals in the research community. The questionnaire was designed according to the cognitive degree of the elderly and was divided into three parts. The questionnaire is in the Appendix A.
The first part is the collection of basic information about the elderly. Questions cover the gender of the elderly, the residential area in which they live, their age, the people living with the elderly, the condition of chronic diseases, and self-assessment of the elderly’s mobility. This part is mainly used for classifying the elderly.
The second part is the collection of facility usage. It starts with the elderly’s perception of the facilities, asking the elderly to evaluate whether the various facilities under study exist around them, and if they do, whether they are used. If the facilities do not exist, it is necessary to state whether they are needed. Then, a survey was conducted on the use frequency and satisfaction with the facilities.
The third part involved collecting potential issues with the facilities that the elderly use. The main purpose was to identify problems in design and management that affect the elderly’s willingness and feelings in using the facilities. Through the questionnaire, the main concerns of the elderly were organized, for example: few facilities, far from home, small facility rooms, low service level, poor management, and high prices.
In this section on questionnaire distribution, as shown in Figure 1, a total of 10 sample communities were selected, including the two main types of communities in China: general communities and unit-based communities. The classification of the number of community service facilities in the figure is the result of our research group’s previous research. Each community contains varying numbers of households and residential units, covering different community structures, ages, sizes, and boundary shapes, which can better represent the actual situation of various communities in the main urban area of Xi’an. A total of 215 valid questionnaires were collected, covering elderly people aged 60–69, 70–79, and over 80 years old with various health levels such as health, difficulty in traveling alone and the need for wheelchairs to travel.

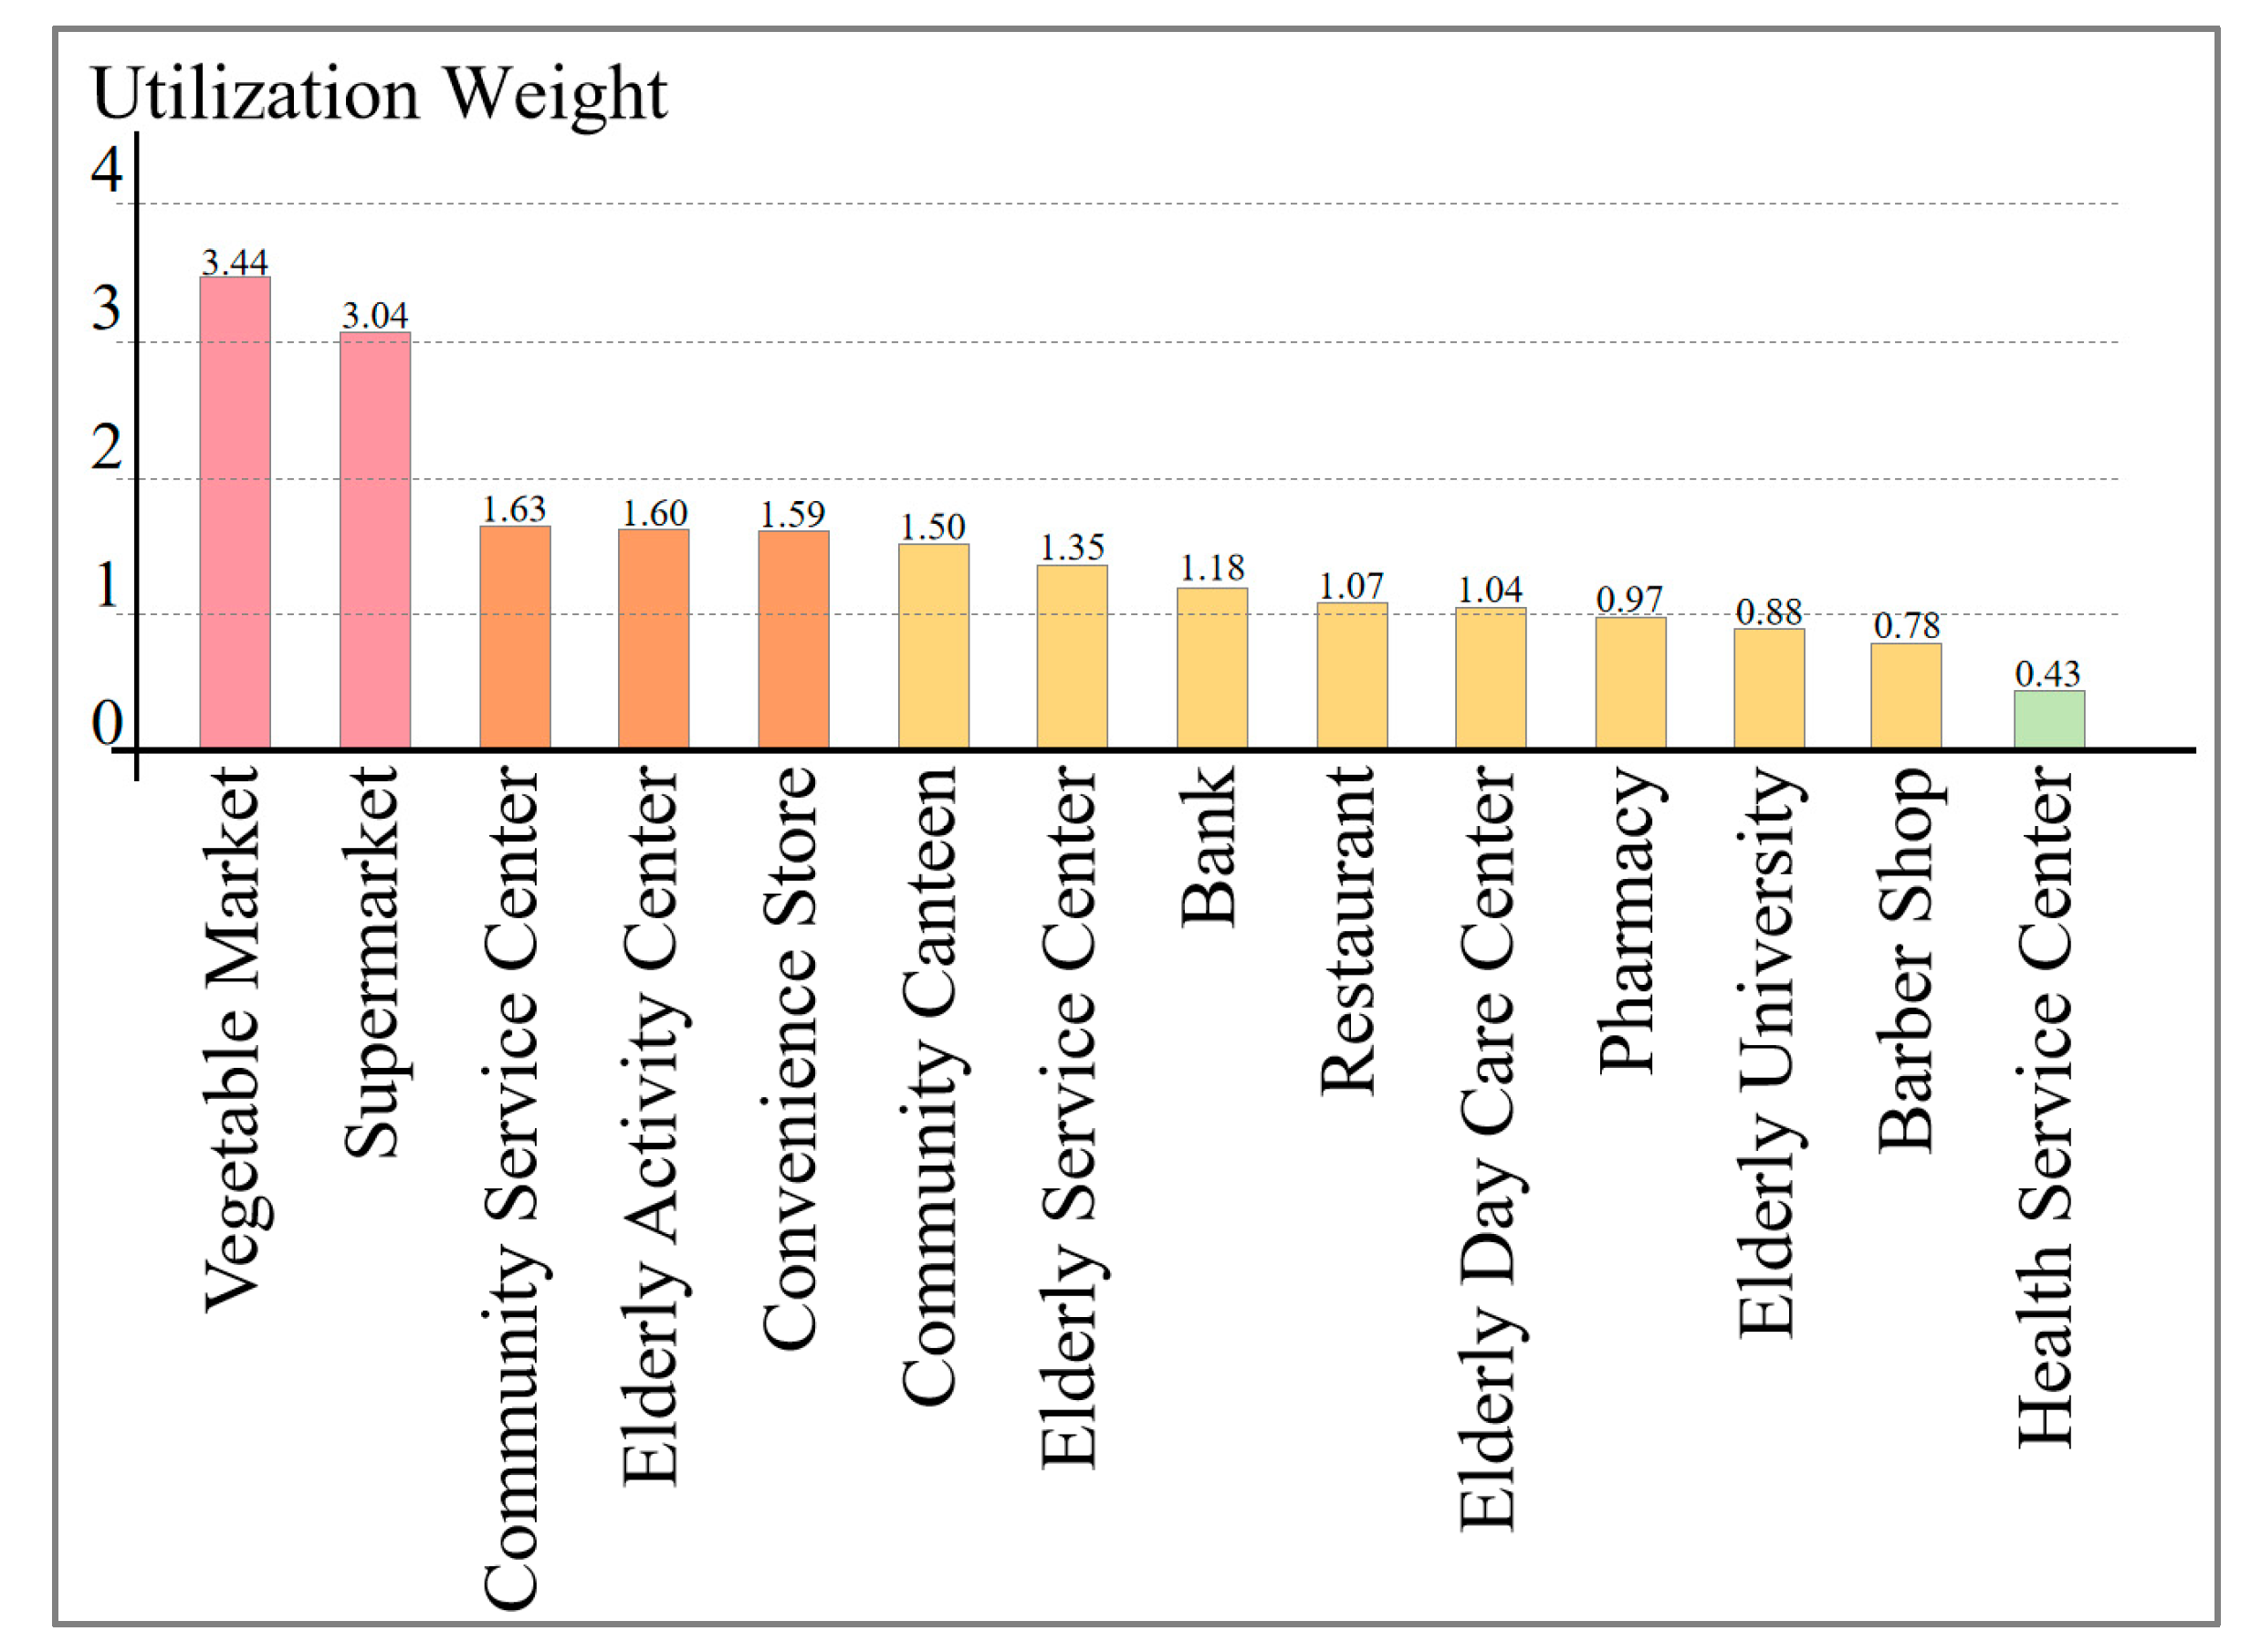
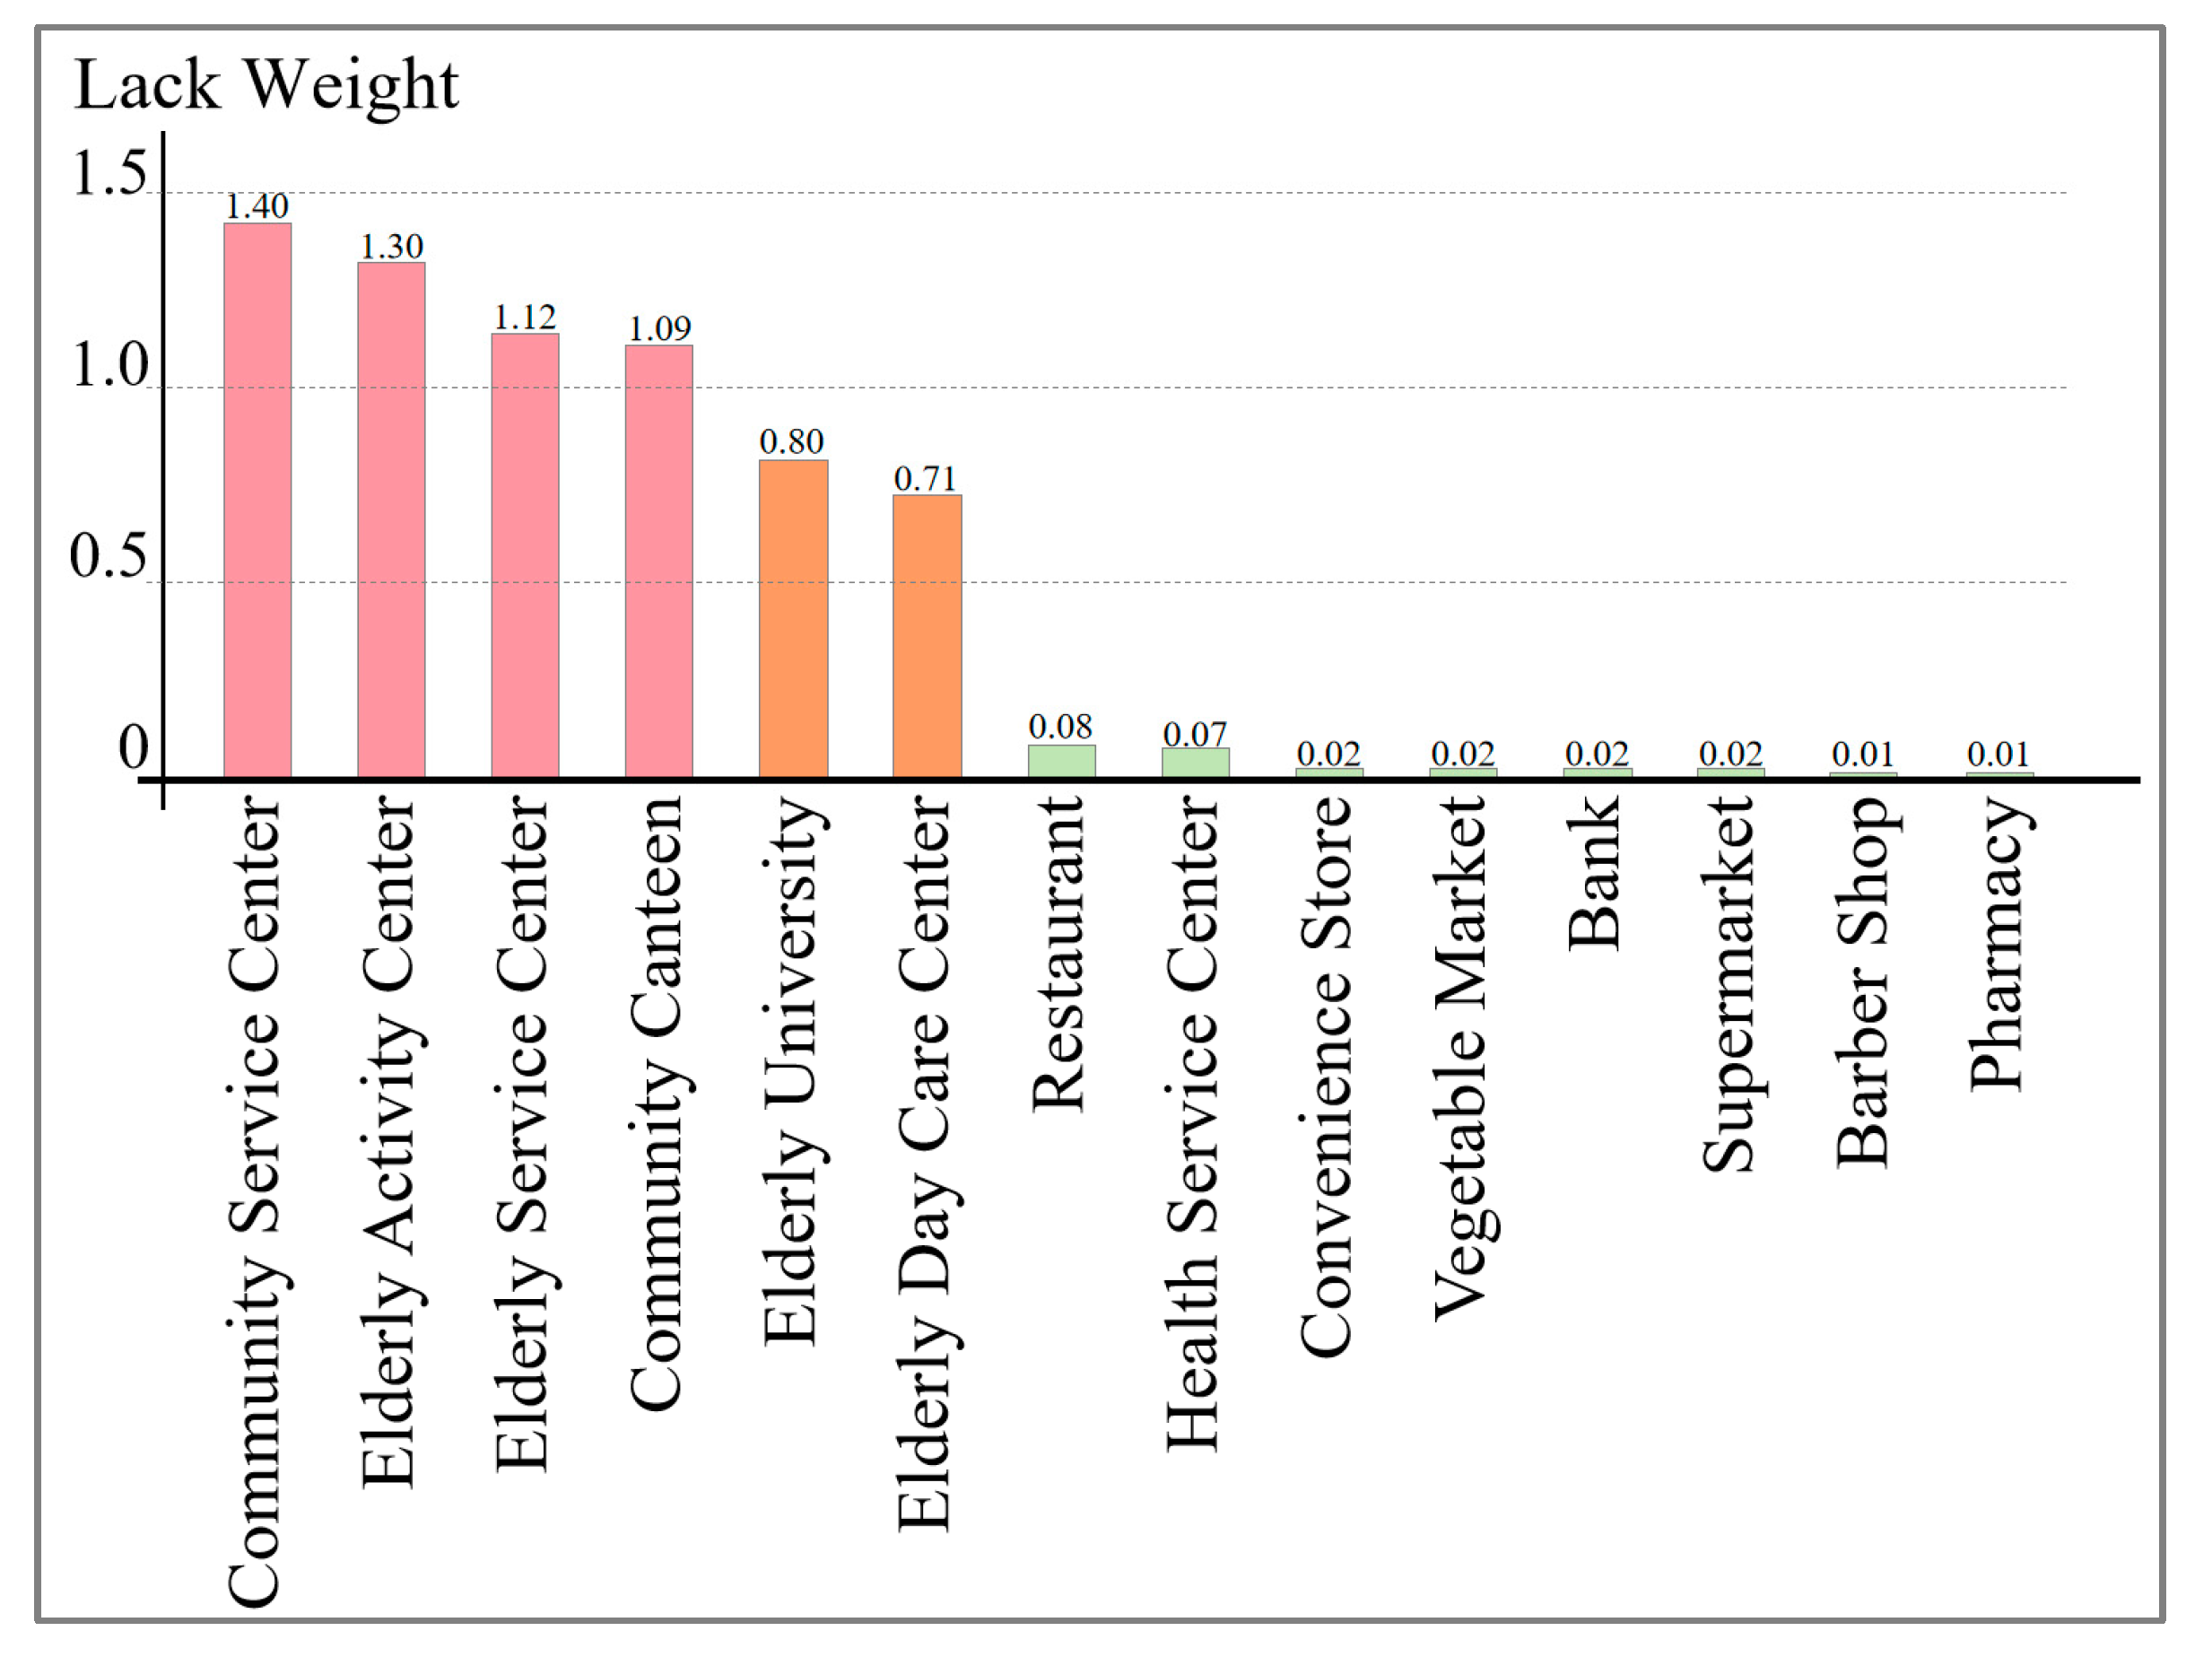
2.2. The Utilization Weight and Lack Weight of Facilities
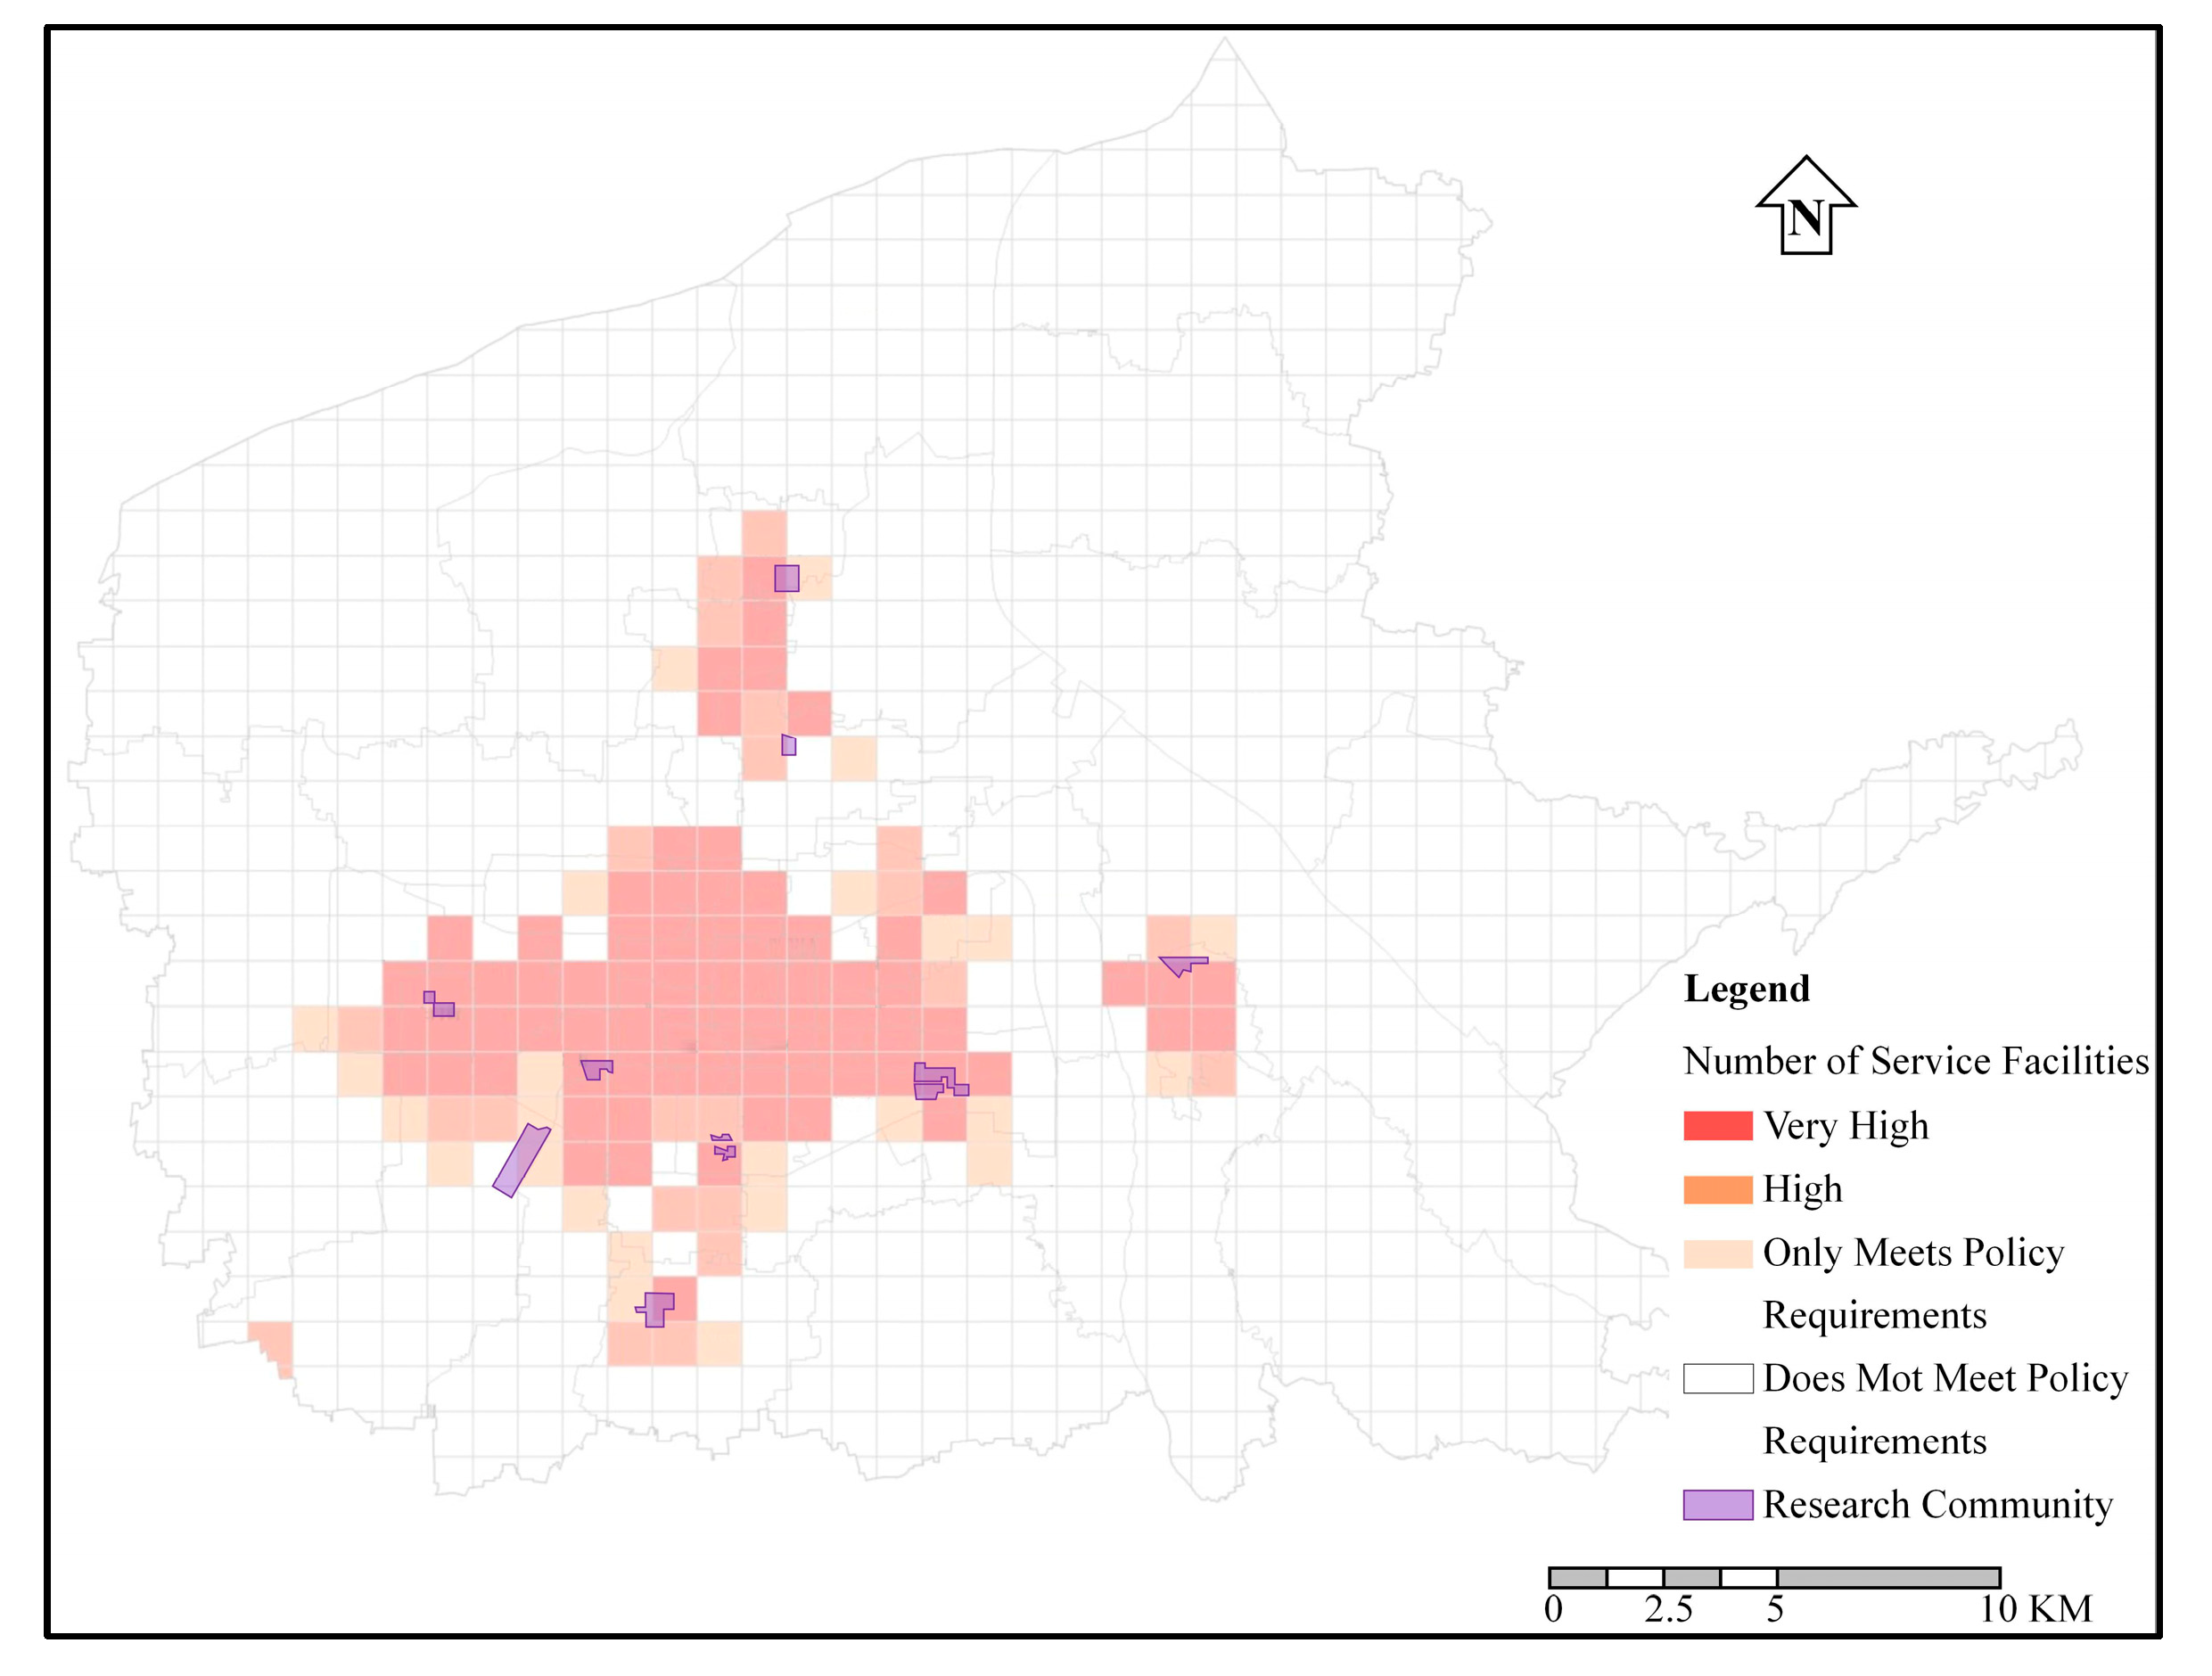
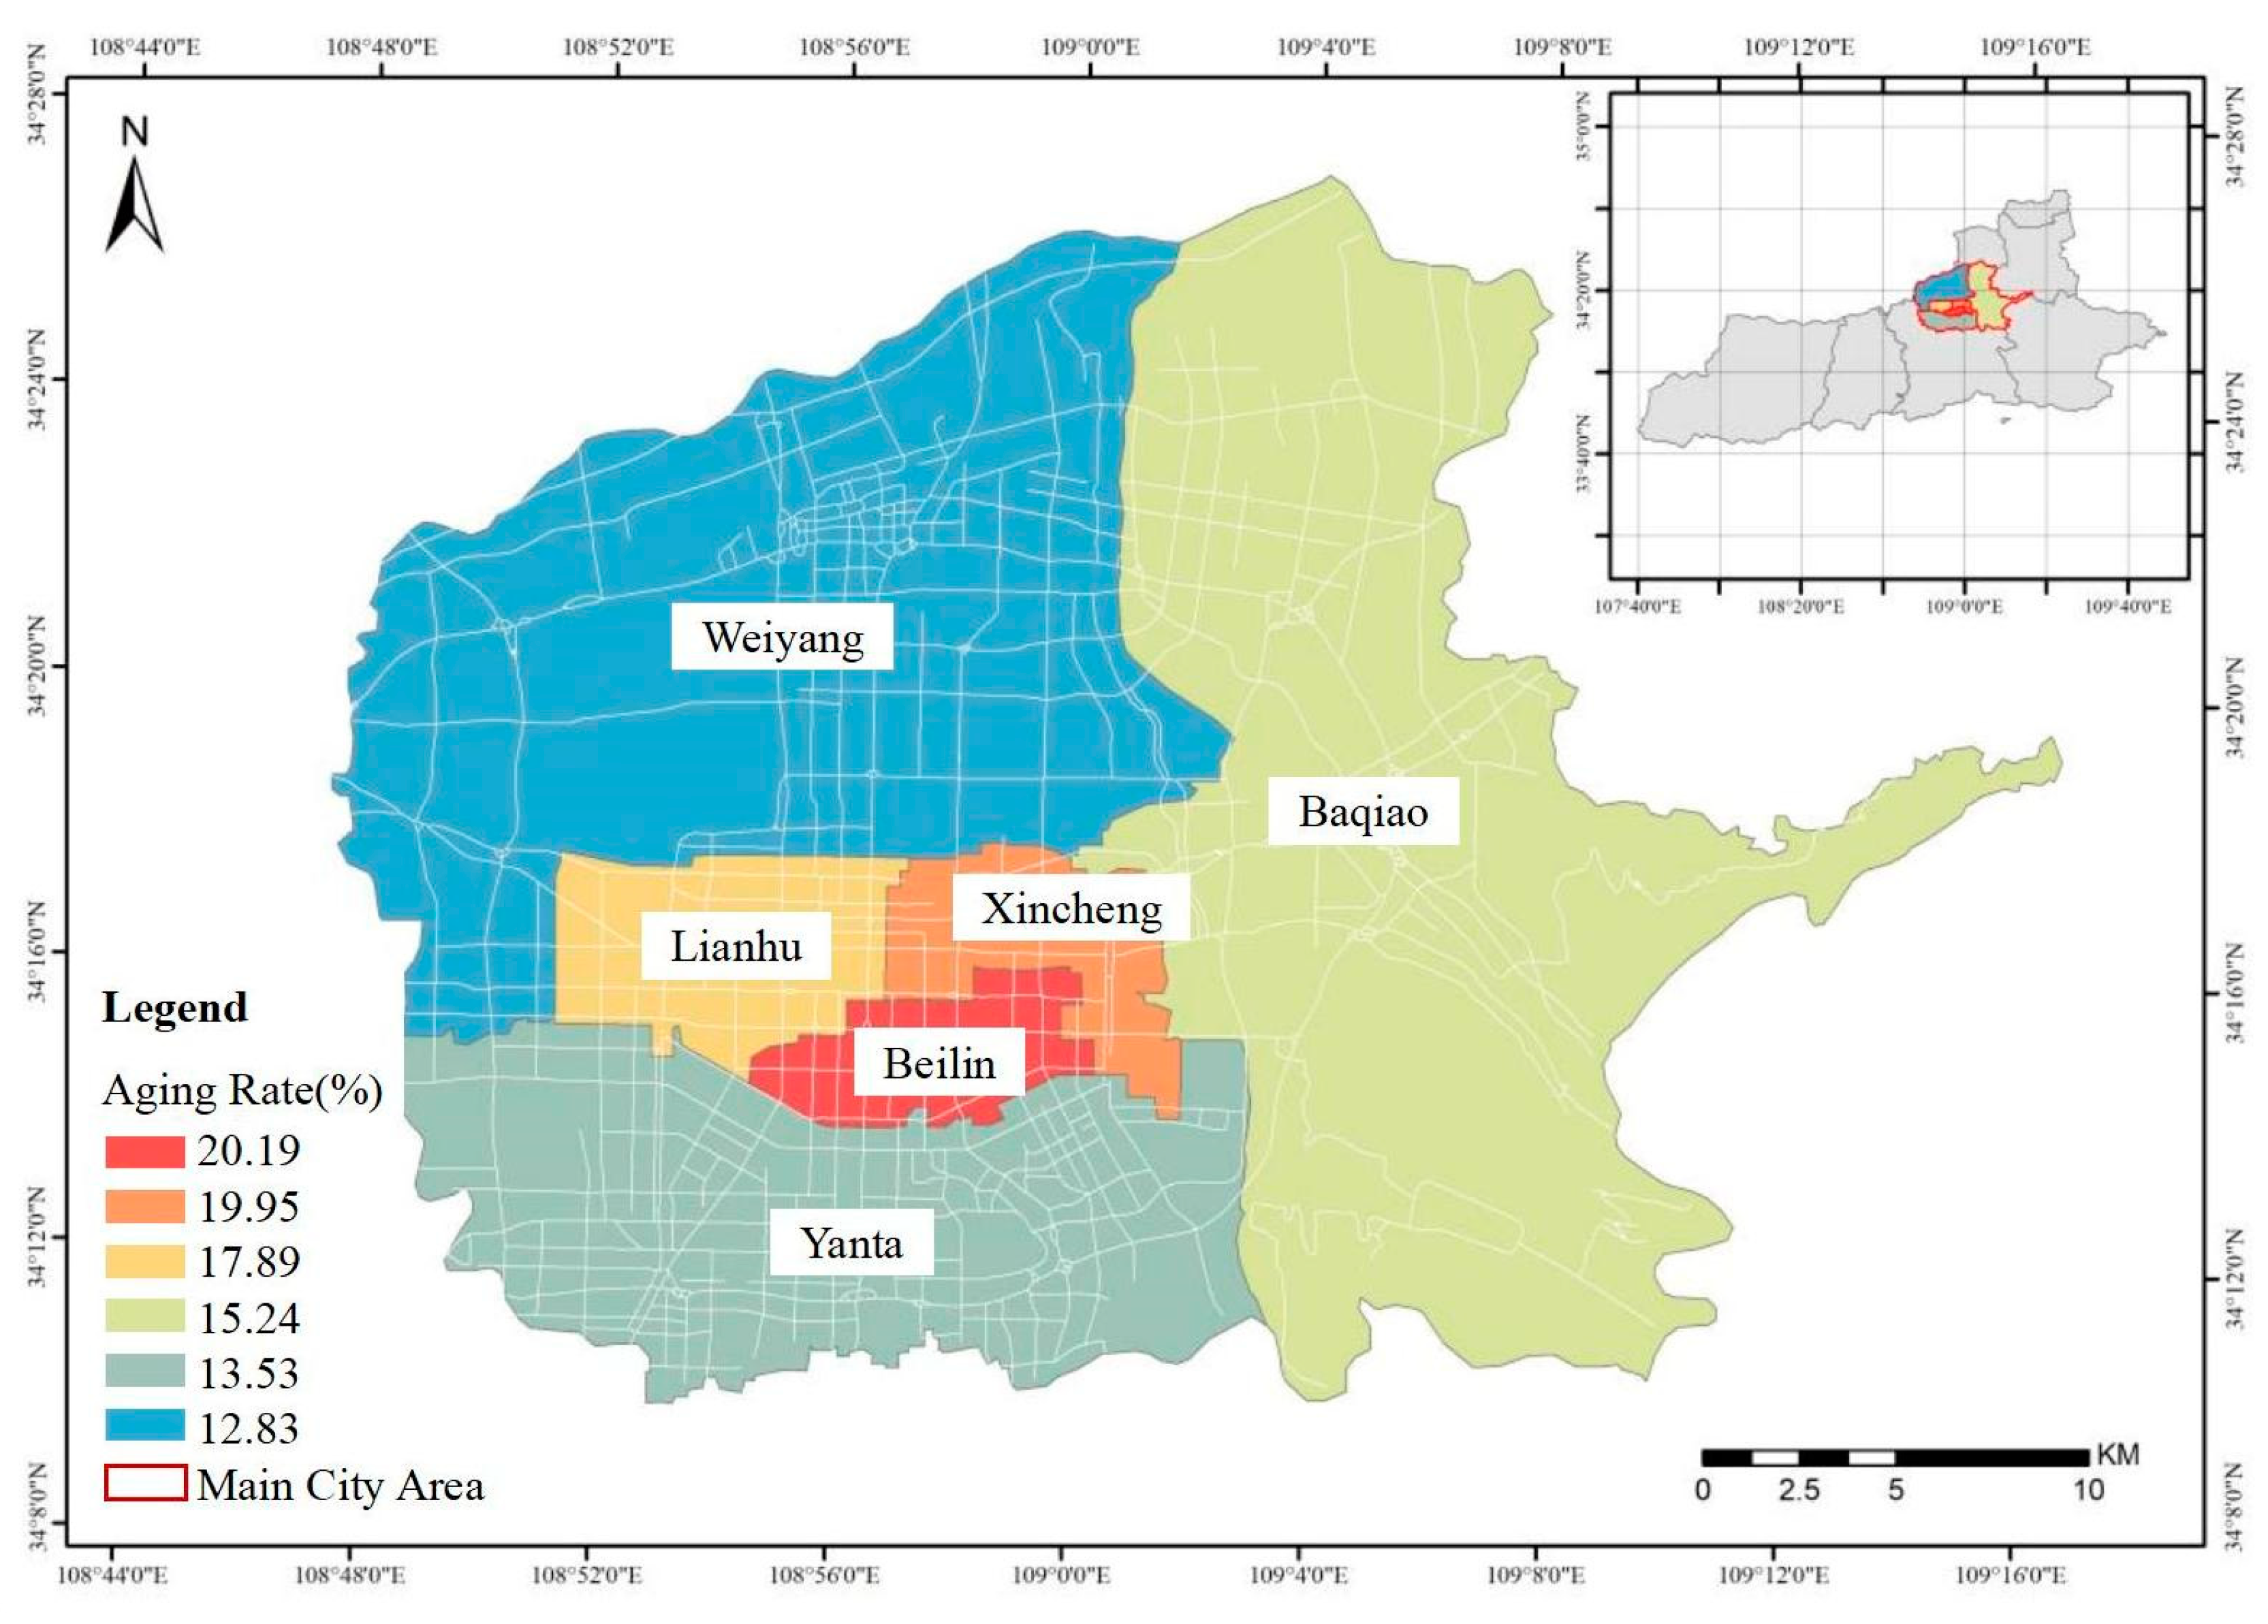
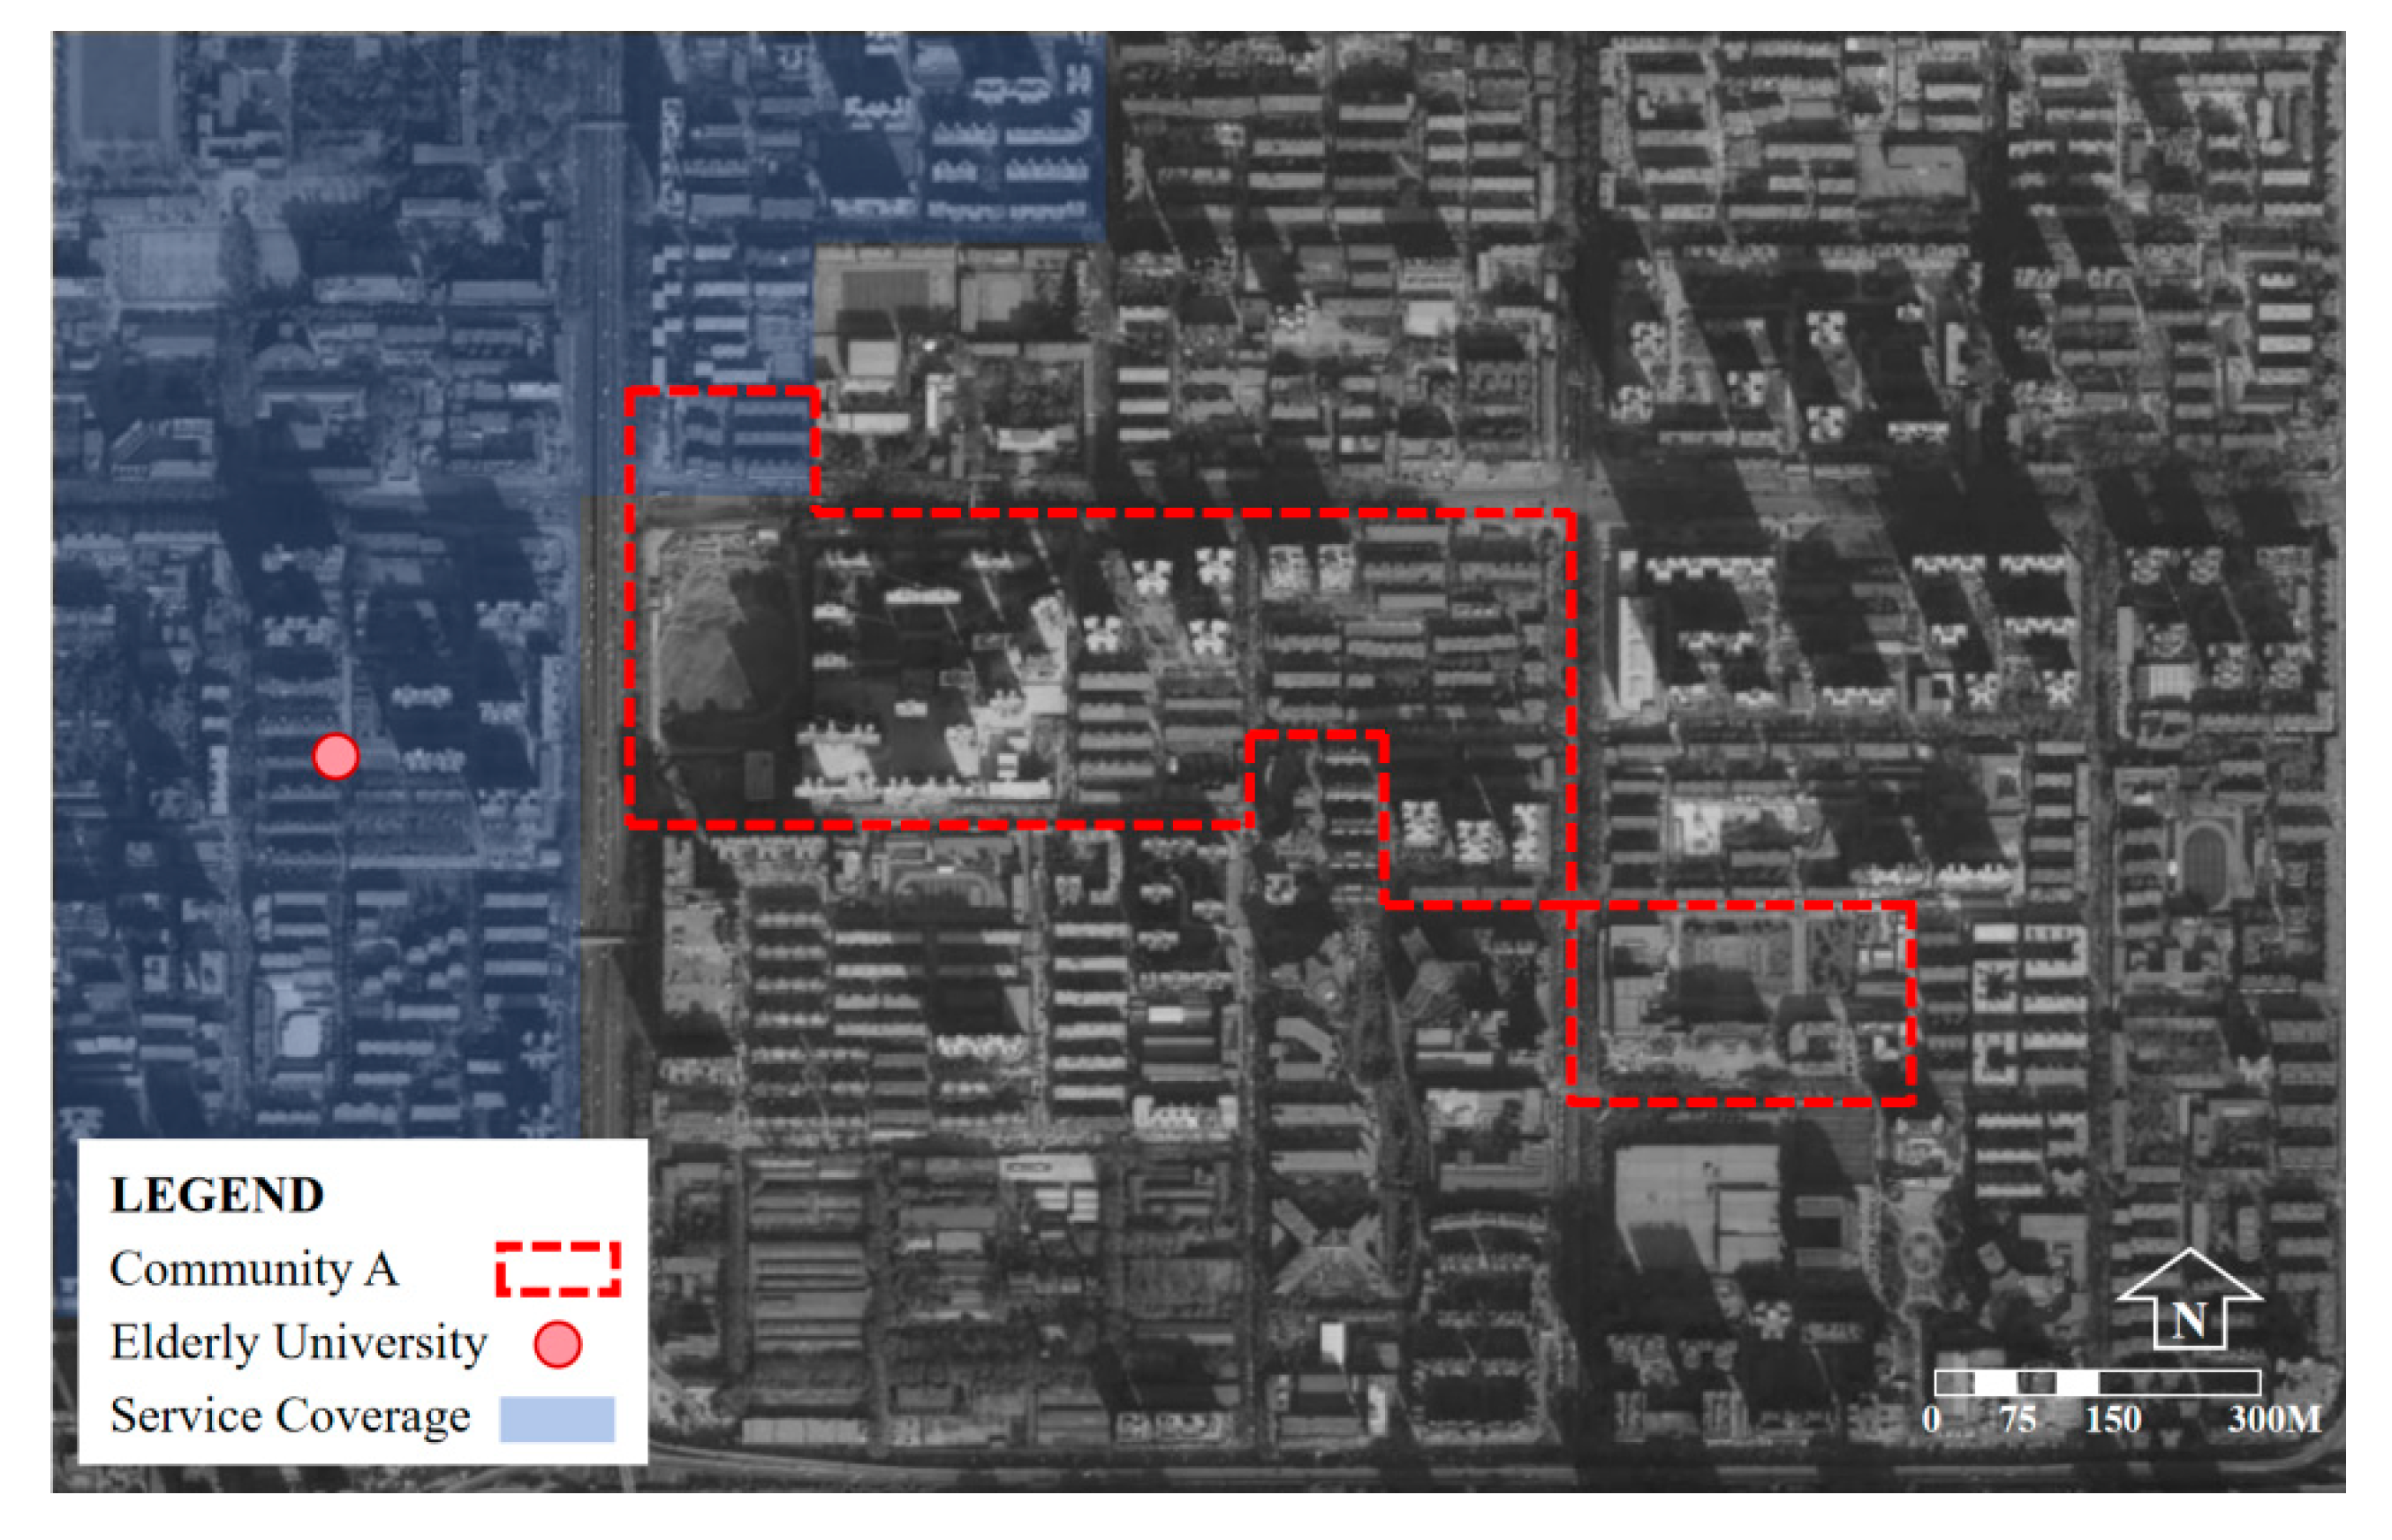
To quantify the elderly’s demand for various elderly care service facilities, this article uses the facility utilization weight (WU) and lack weight (WL) for evaluation. Two types of data were collected through questionnaires: “the frequency of use of various facilities” and “the extent of utilization of various facilities by the elderly”.
This article uses a Likert scale to quantitatively calculate the utilization and lack weight of each facility, categorizing the frequency of use and the extent of utilization of facilities from low to high into five levels, scored from 1 to 5 points. The weighted average of the frequency of use for each facility is obtained, and the WU and WL for each facility are calculated according to the following formulas, respectively:
W u = W ¯ × r hu
W l = W ¯ × r nn
where Wu represents the utilization weight of the facility, Wl denotes the lack weight of the facility, W ¯ signifies the weighted average of the facility usage frequency, rhu indicates the percentage of elderly people who choose “have and use” the facilities, and rnn represents the percentage of elderly people who choose “do not have but need” the facilities.

2.3. Research Area

The research subject of this article is the community elderly care service facilities. It includes not only facilities specifically designed to serve the elderly, but also public service facilities and commercial service facilities related to elderly care that the elderly use in their daily life. Three kinds of facilities together provide facility support for the elderly’s community life, and the classification method of the above-mentioned service facilities follows the relevant regulations of the Chinese government [42,43].
The facilities specifically designed to serve the elderly include elderly day care facilities, elderly service facilities, elderly activity facilities, elderly universities, and elderly catering. Public service facilities related to elderly care include community service facilities and community health service facilities. Commercial service facilities related to elderly care include shopping, catering, hairdressing, medical and healthcare, and financial service facilities.
The questionnaires for this study were distributed across six central administrative districts in Xi’an City (Figure 2). According to the seventh population census data of Xi’an, the number of elderly people aged over 60 in the central urban area exceeds the international standard of 10%, with the aging rate in the three most central districts exceeding 20% [44]. Xi’an, once a pilot city for China’s elderly care policies, has seen over a decade of development in community elderly care service facilities since their establishment in 2009. Until 2021, Xi’an had established 32 comprehensive elderly care service centers and 926 community elderly care service stations, achieving a facility coverage rate of 83% [45]. In relevant surveys among the elderly in Xi’an, a third of them expressed their hope that the community could provide elderly care services. However, there are still limitations in facility service capabilities, failing to meet the needs of the elderly [46]. Therefore, conducting research in the main urban areas of Xi’an can provide a good understanding of the current usage status of elderly care service facilities and the actual needs of the elderly, making it highly representative.

3. Result

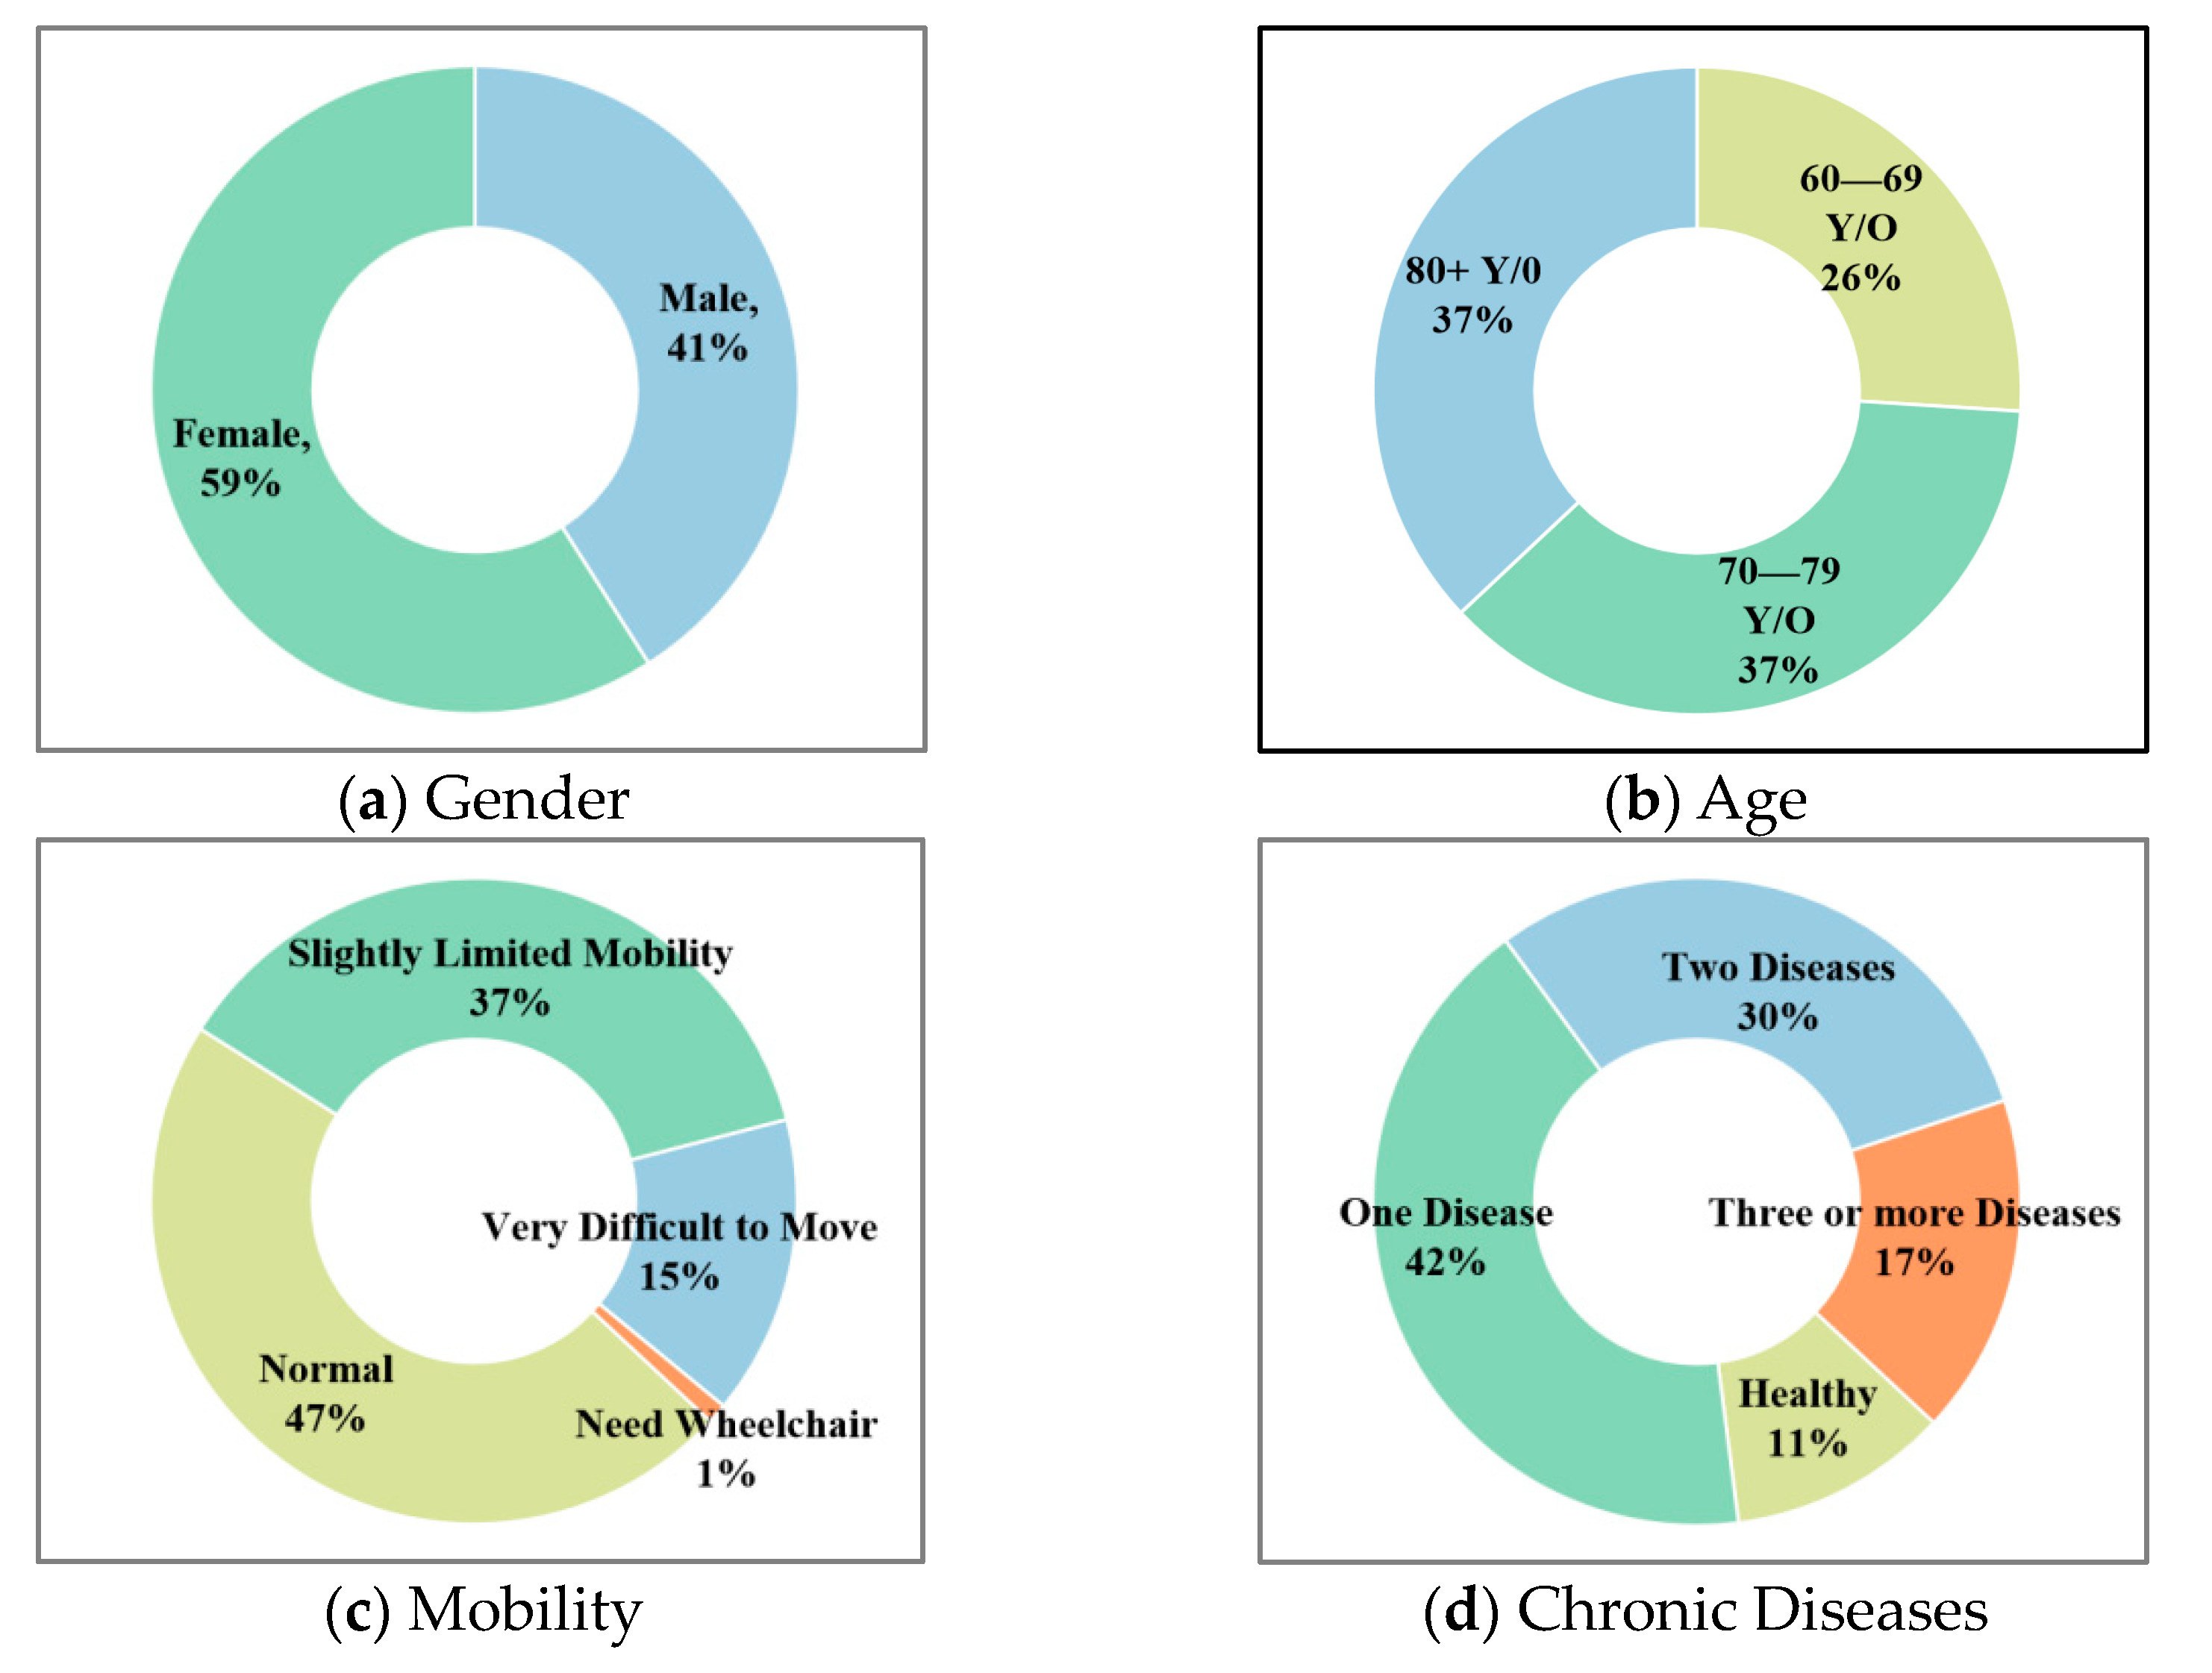
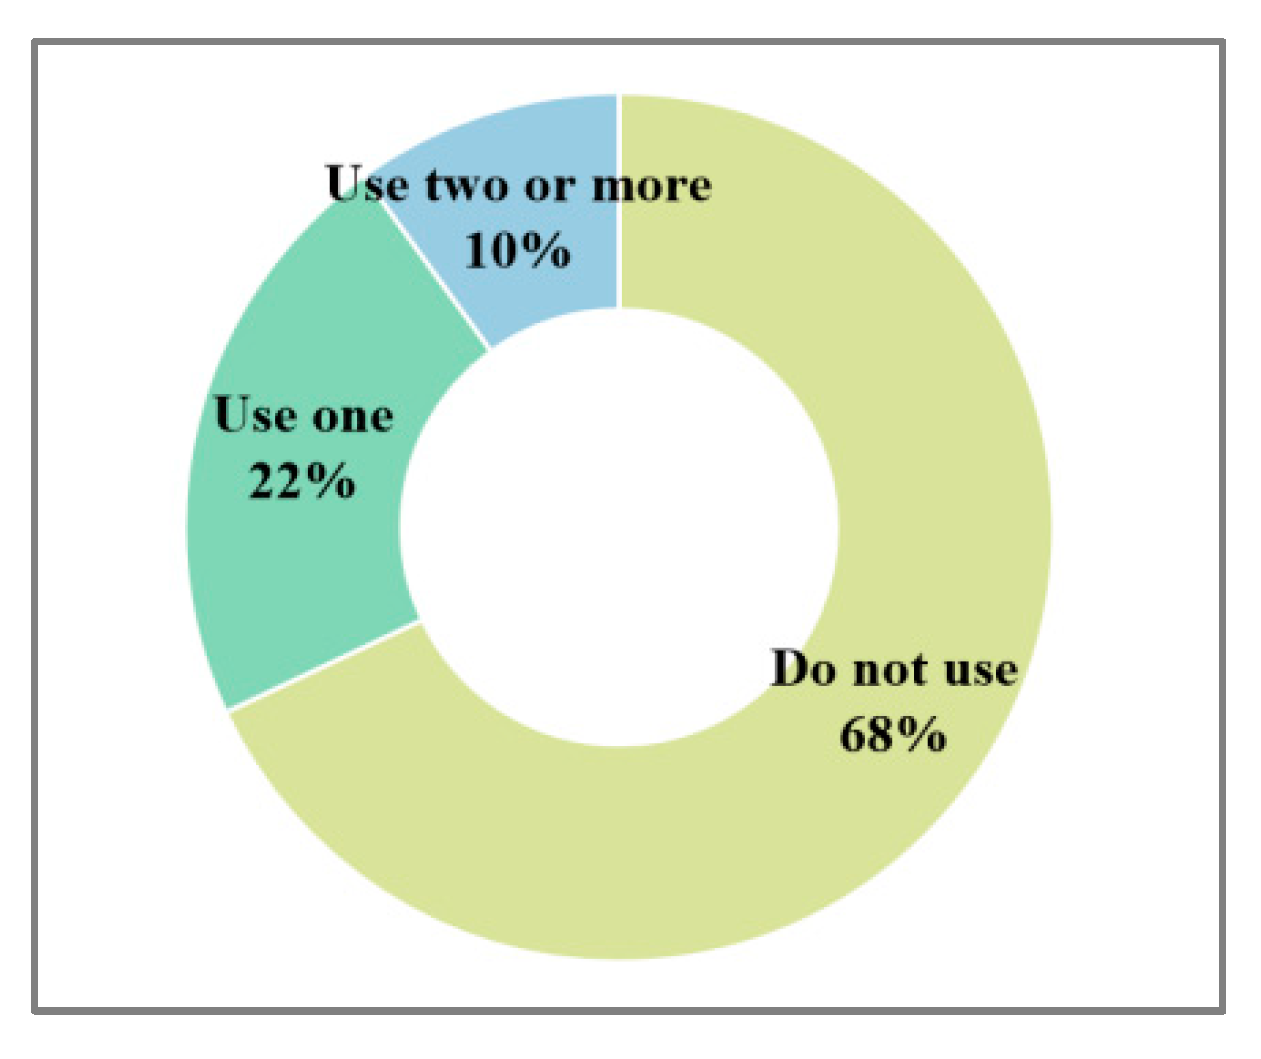
3.1. Basic Information

A total of 215 valid questionnaires were collected for the survey, and the basic details of the survey data are shown in Figure 3. Among them, the age distribution is relatively even, with a lower proportion of younger elderly aged 60–69 years old, accounting for only 26%. This may be due to the fact that younger elderly people’s travel activities are not limited to the community, resulting in fewer samples being collected. The proportions of middle-aged elderly people aged 70–79 years old and very elderly individuals aged over 80 years old are both 37%.
In terms of mobility, 47% of the elderly respondents indicated that they have completely normal mobility, while 37% have some difficulty in walking or moving their legs flexibly. Nearly 20% of the elderly people have significant difficulties in mobility, and only one of the respondents reported requiring a wheelchair for travel.
Regarding chronic diseases, based on the number of chronic conditions, only 10% of the elderly respondents are in excellent health without any chronic diseases. A total of 42% of the elderly suffer from one chronic disease, 30% suffer from two, and nearly 20% suffer from three or more chronic diseases. The survey found that most elderly people need to take medication regularly to maintain their health.

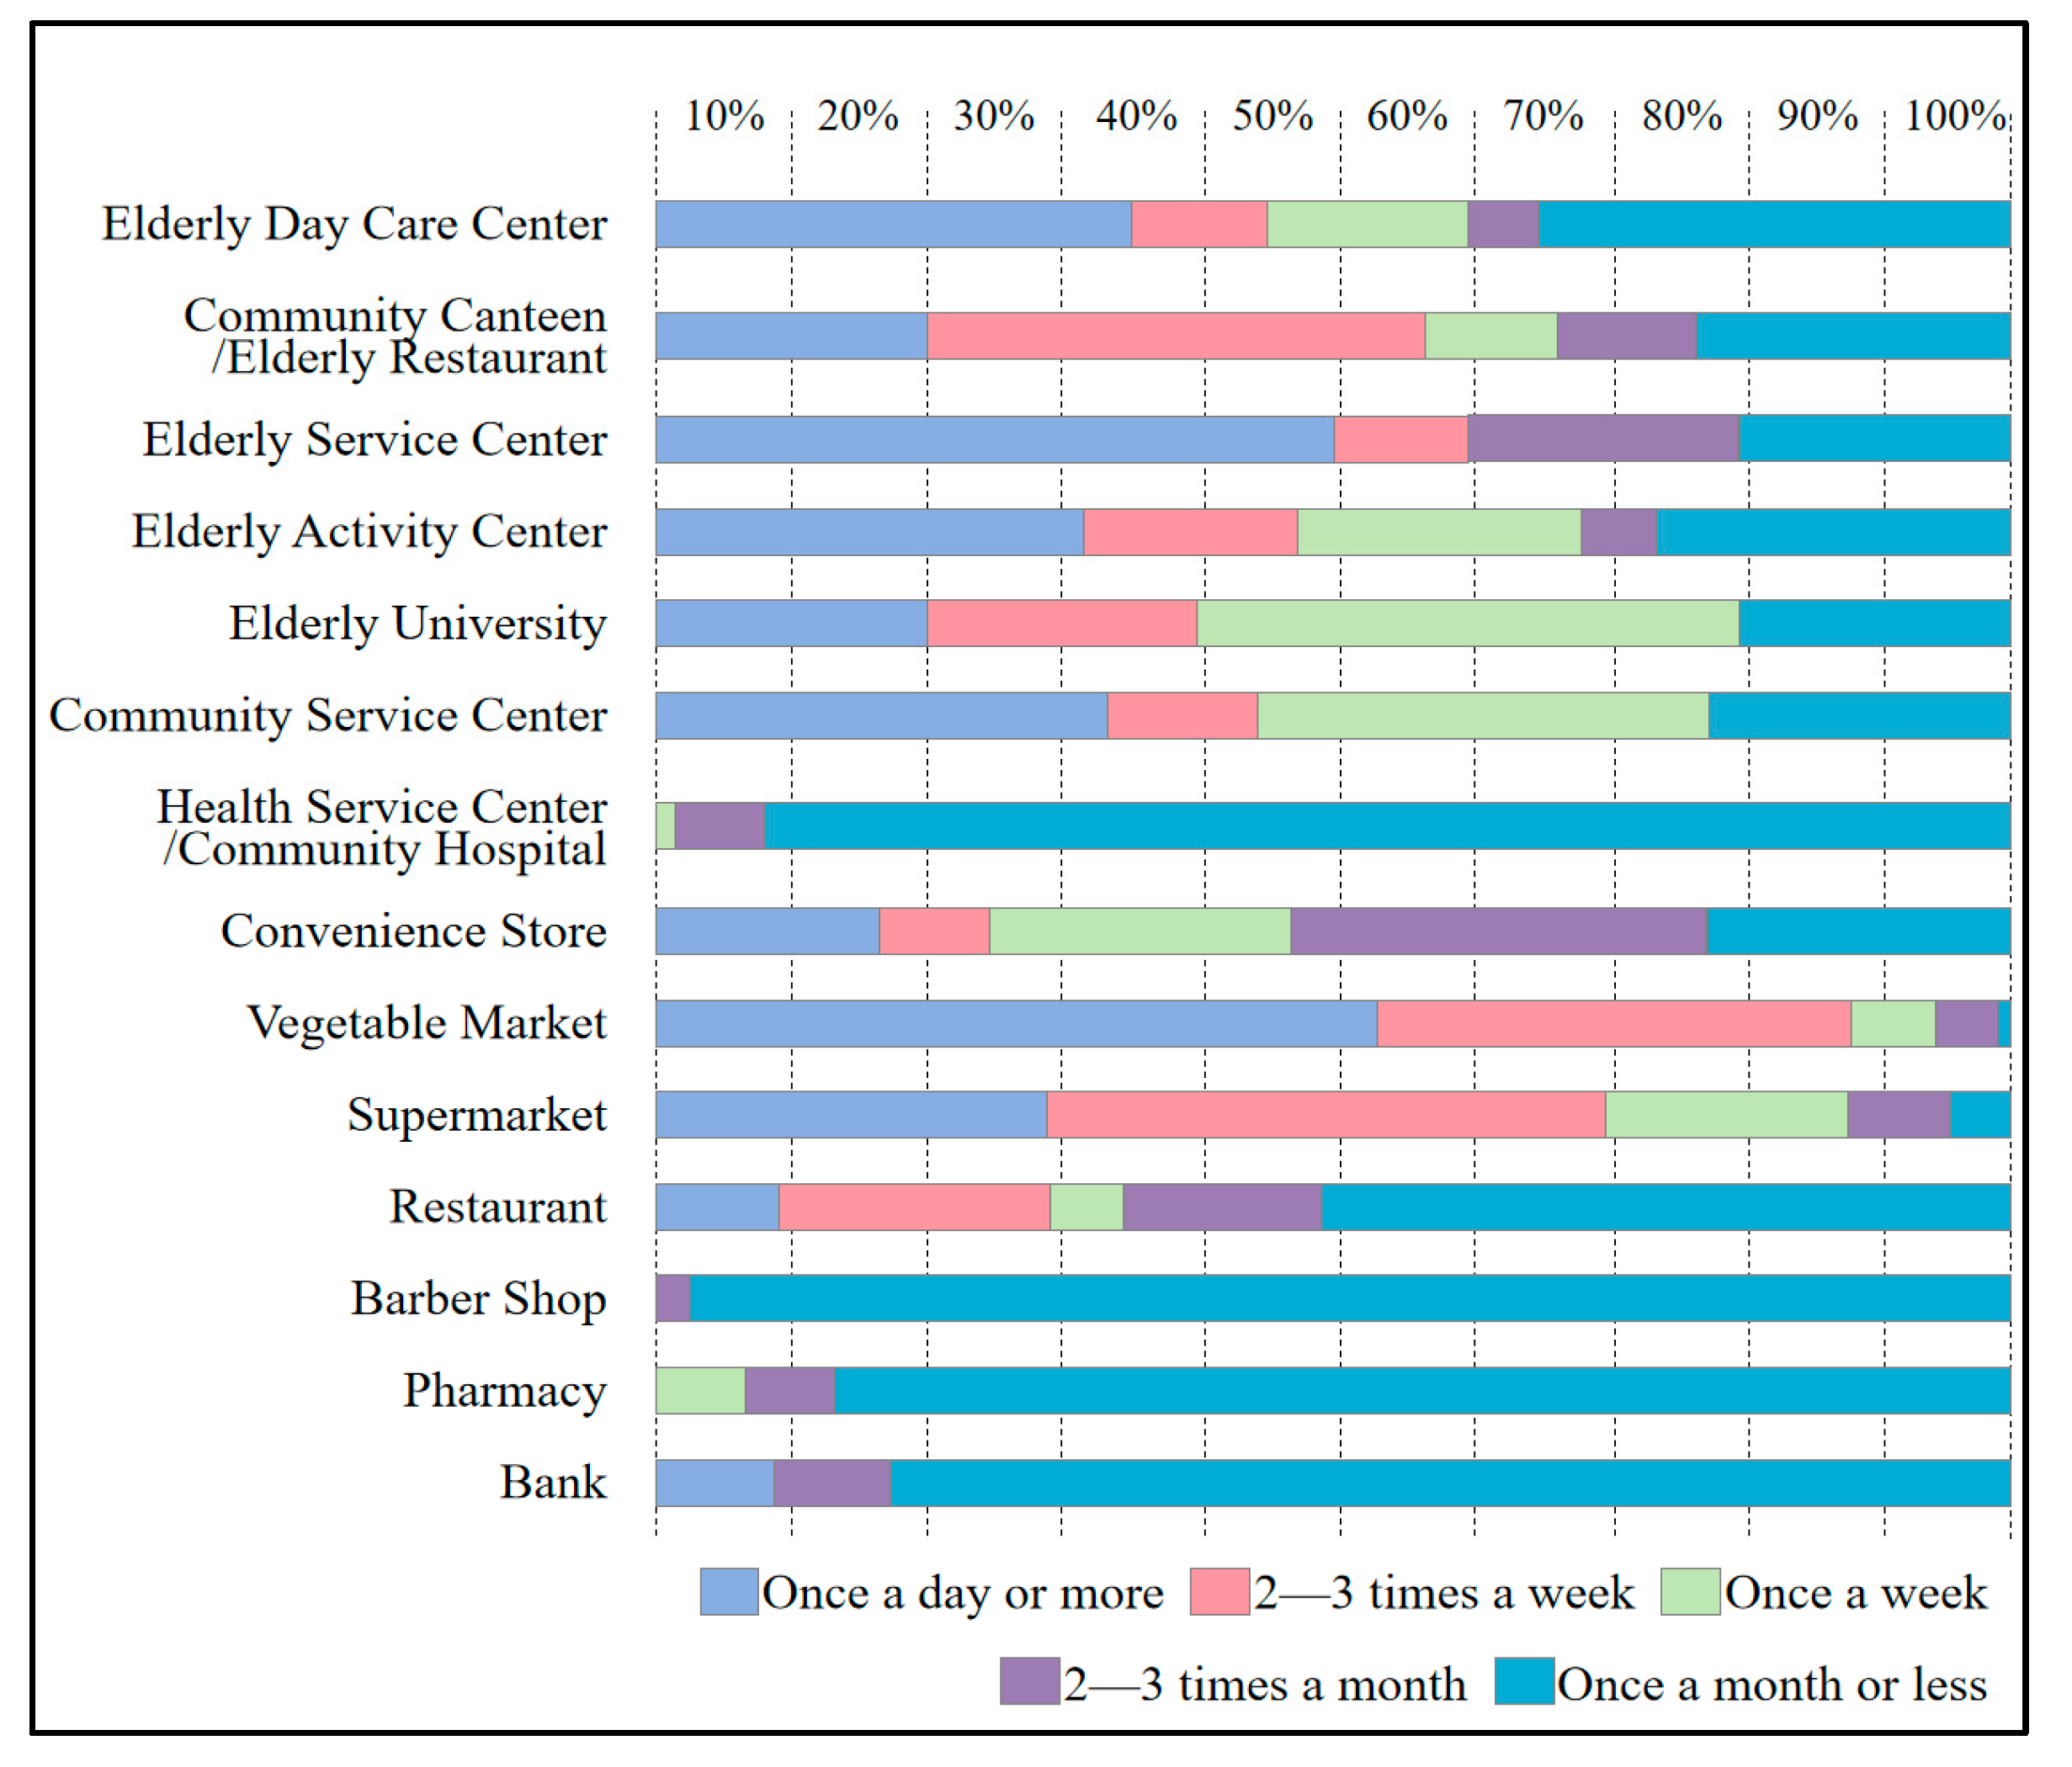
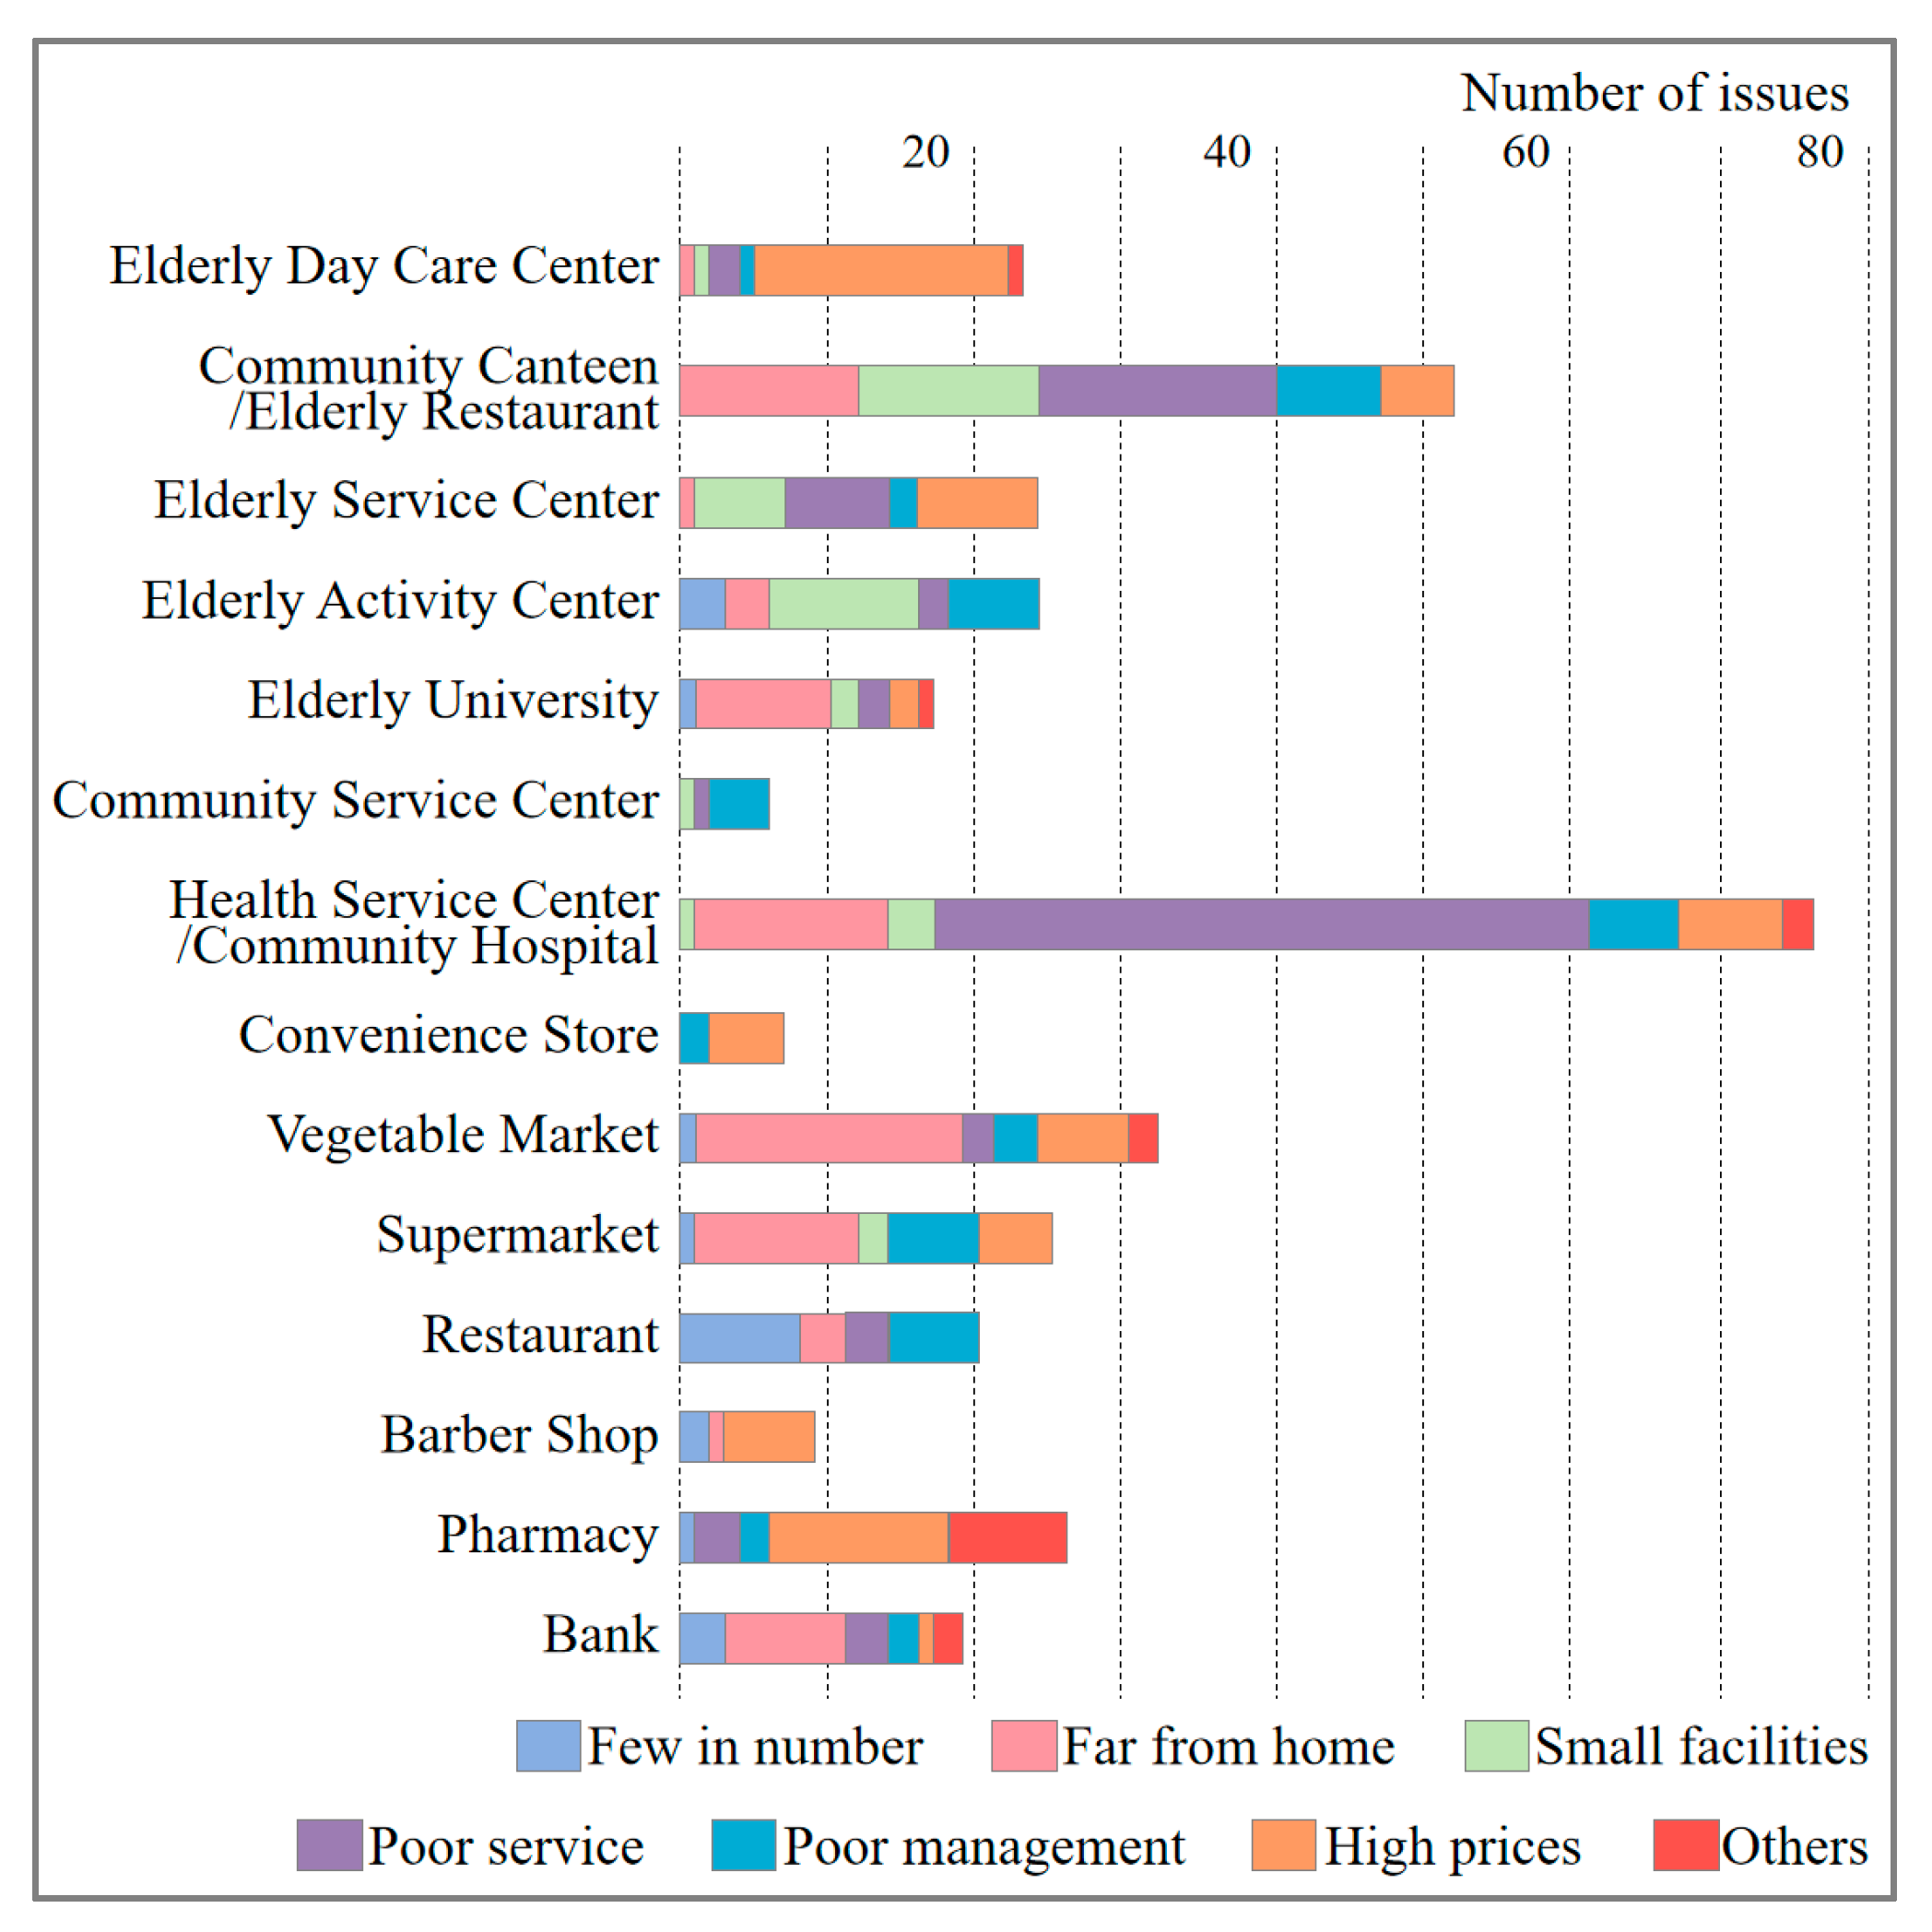
3.2. The Demand Characteristics of Elderly Care Service Facilities

As shown in Figure 4, there is a significant difference in the frequency of use for all types of facilities. The vegetable market is the most frequently used facility, with nearly half of the elderly having the habit of visiting the market once a day or more, and one-third indicating that they visit 2–3 times a week. Elderly service centers are also facilities that are frequently used by the elderly. For health service centers/community hospitals, pharmacies, barbershops, and banks, the overall usage frequency of the sample is relatively low, with over 80% of users indicating that they use these facilities once a month or less. In addition, the number of users of convenience stores and restaurants is also relatively low, with more than half of the participants visiting these facilities at most once a month.
As shown in Figure 5, for those facilities specialized in serving the elderly (including day care facilities for the elderly, elderly service facilities, elderly activity facilities, elderly university, and elderly restaurants), the total number of users of these facilities is relatively small. A total of 67.6% of elderly people in the survey do not use or report that there are no such facilities surrounding their communities, 22.3% of elderly people use one type of elderly service facility, and only 9.8% of elderly people use two or more types of elderly service facility.
The problems raised by the elderly regarding facilities are shown in Figure 6; the elderly overwhelmingly considered the problems of facilities being far from home, low service standards, and high prices as the most prominent, each accounting for more than 20% of the total. Other issues included inadequate management, small rooms in facilities, and a limited number of facilities.
The health service center/community hospital has the most prominent issues, mainly characterized by low service levels, a lack of doctors and medicines, and the inability to meet basic medical needs. The problems with community canteens/elderly restaurants are also very prominent, mainly due to low service levels, small facility rooms, and facilities being far from home. The main issues with elderly day care centers are high prices; the elderly believe that their meager pensions, after paying for daily medicines, are insufficient to afford the high cost of day care services. The main problem with elderly service centers and elderly activity centers is that their area is too small. The main problem with the elderly university is that it is far from the community.

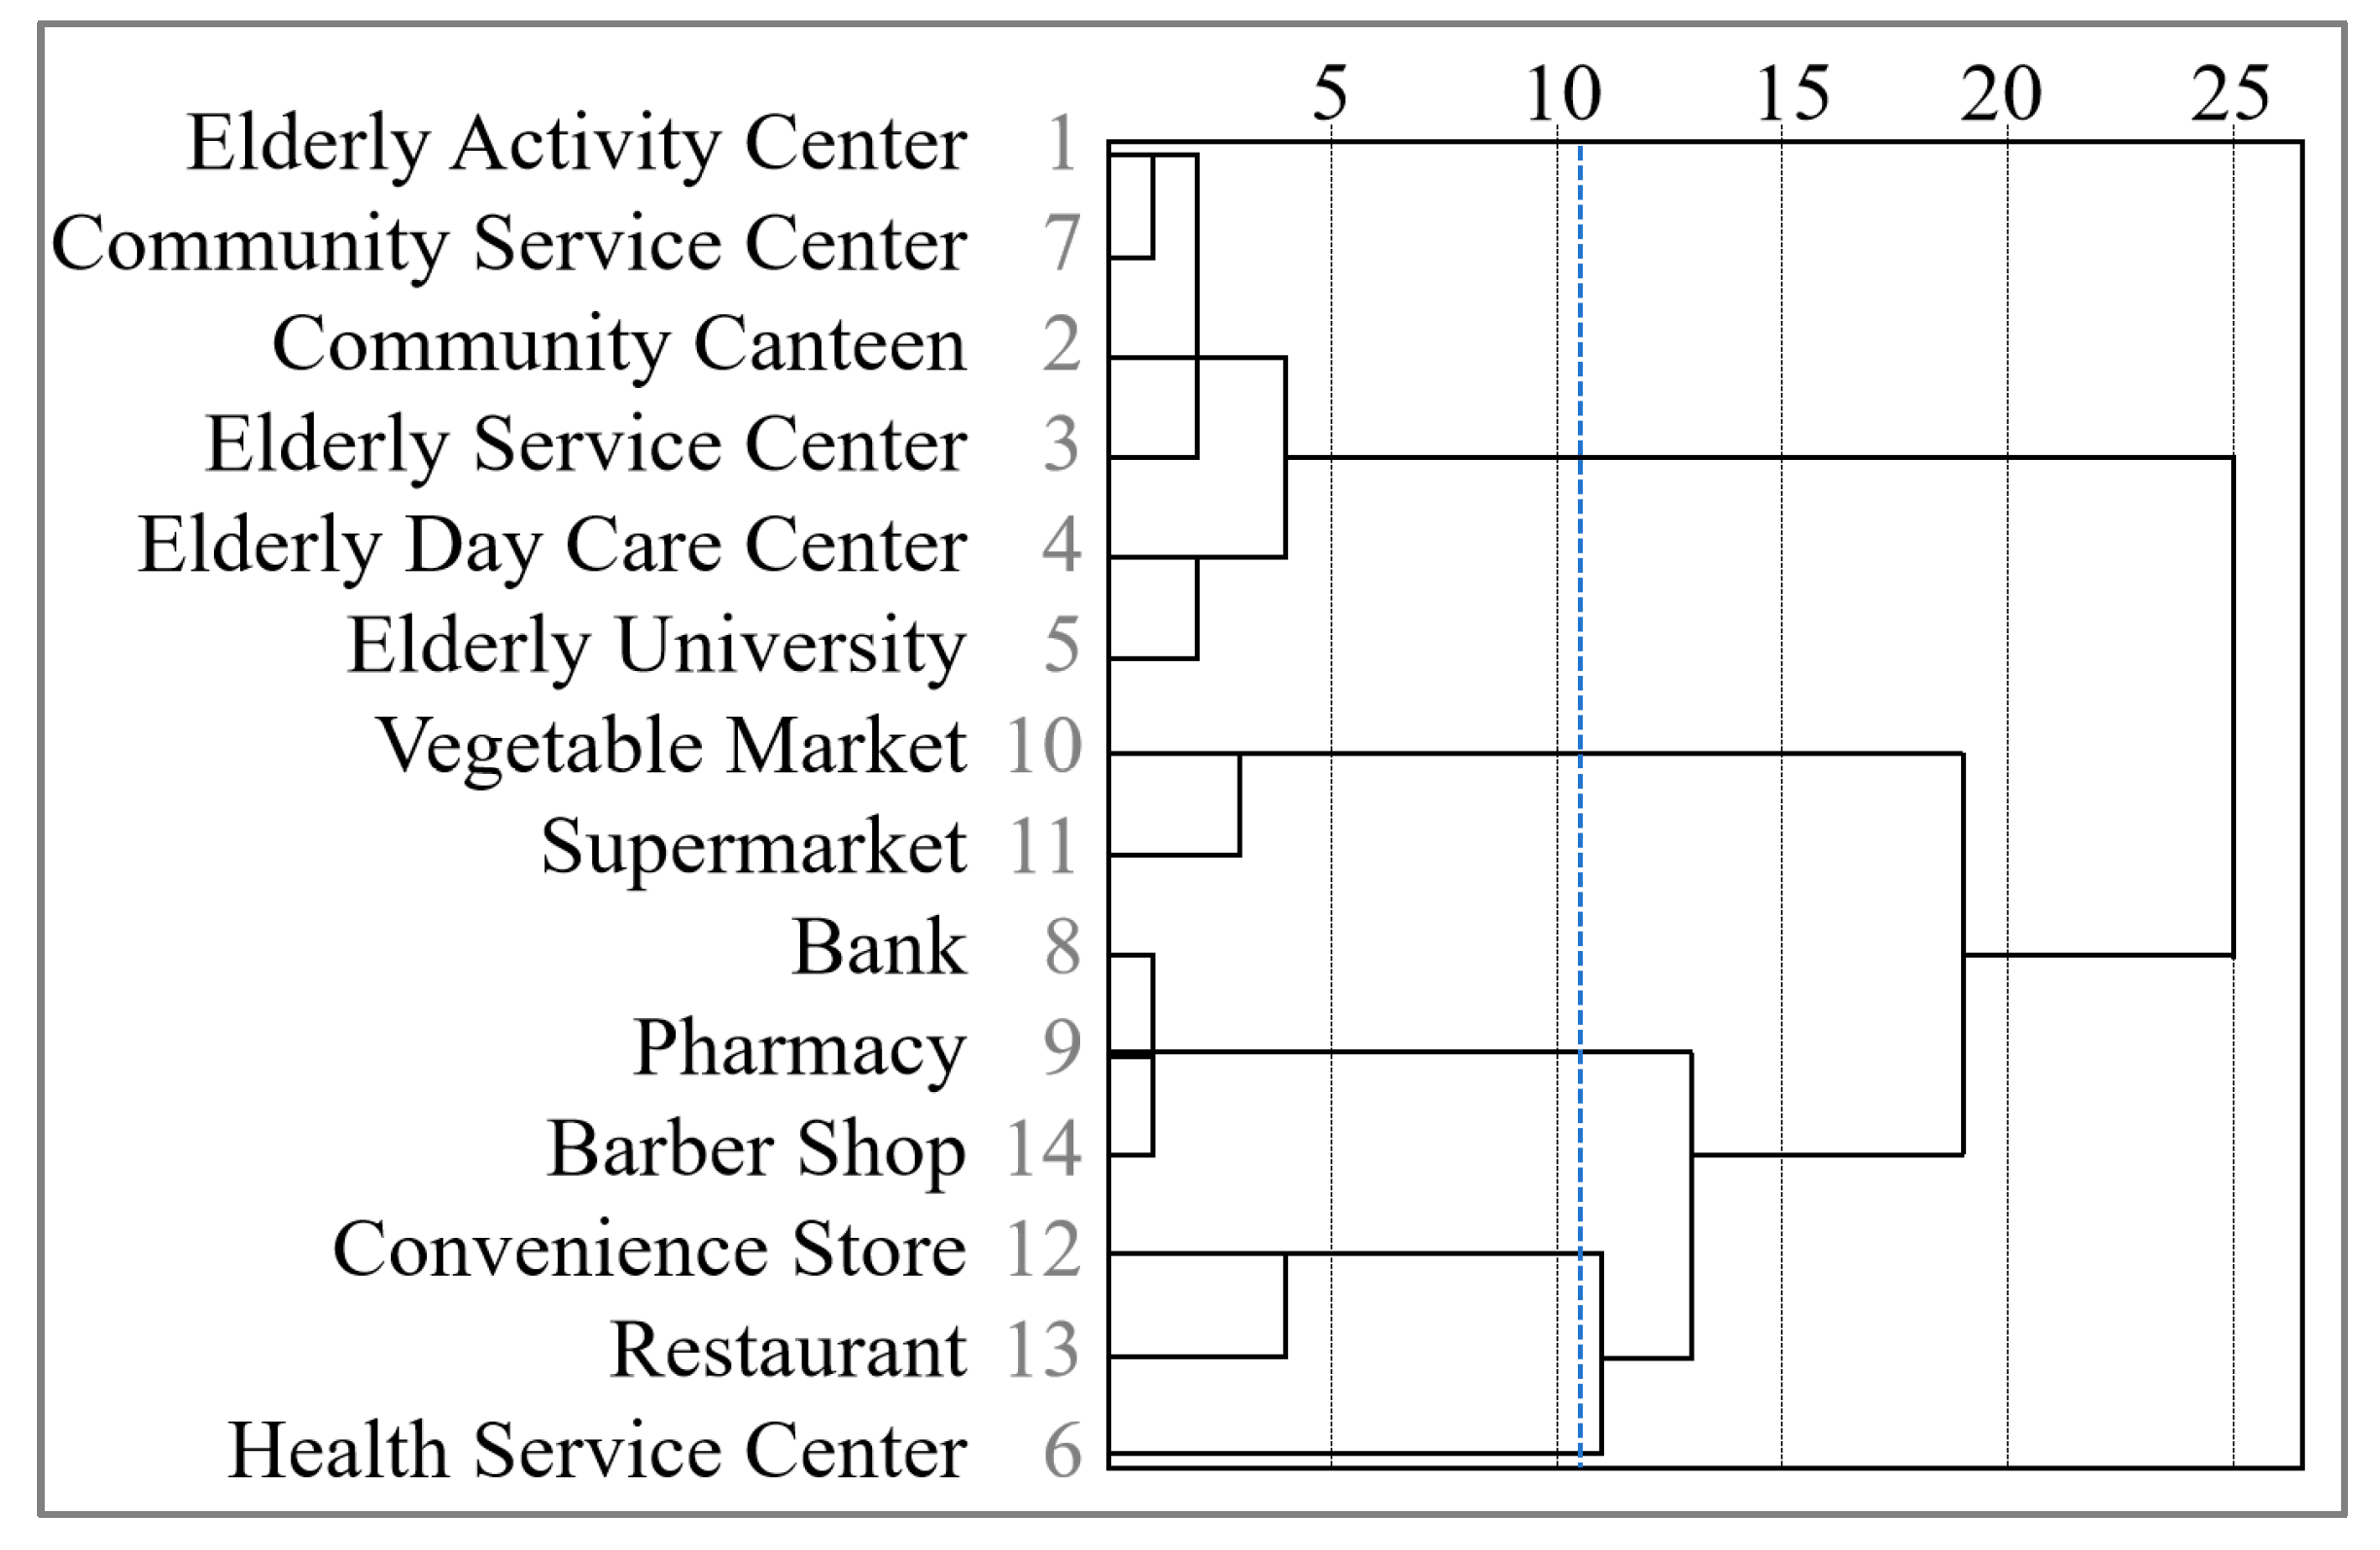
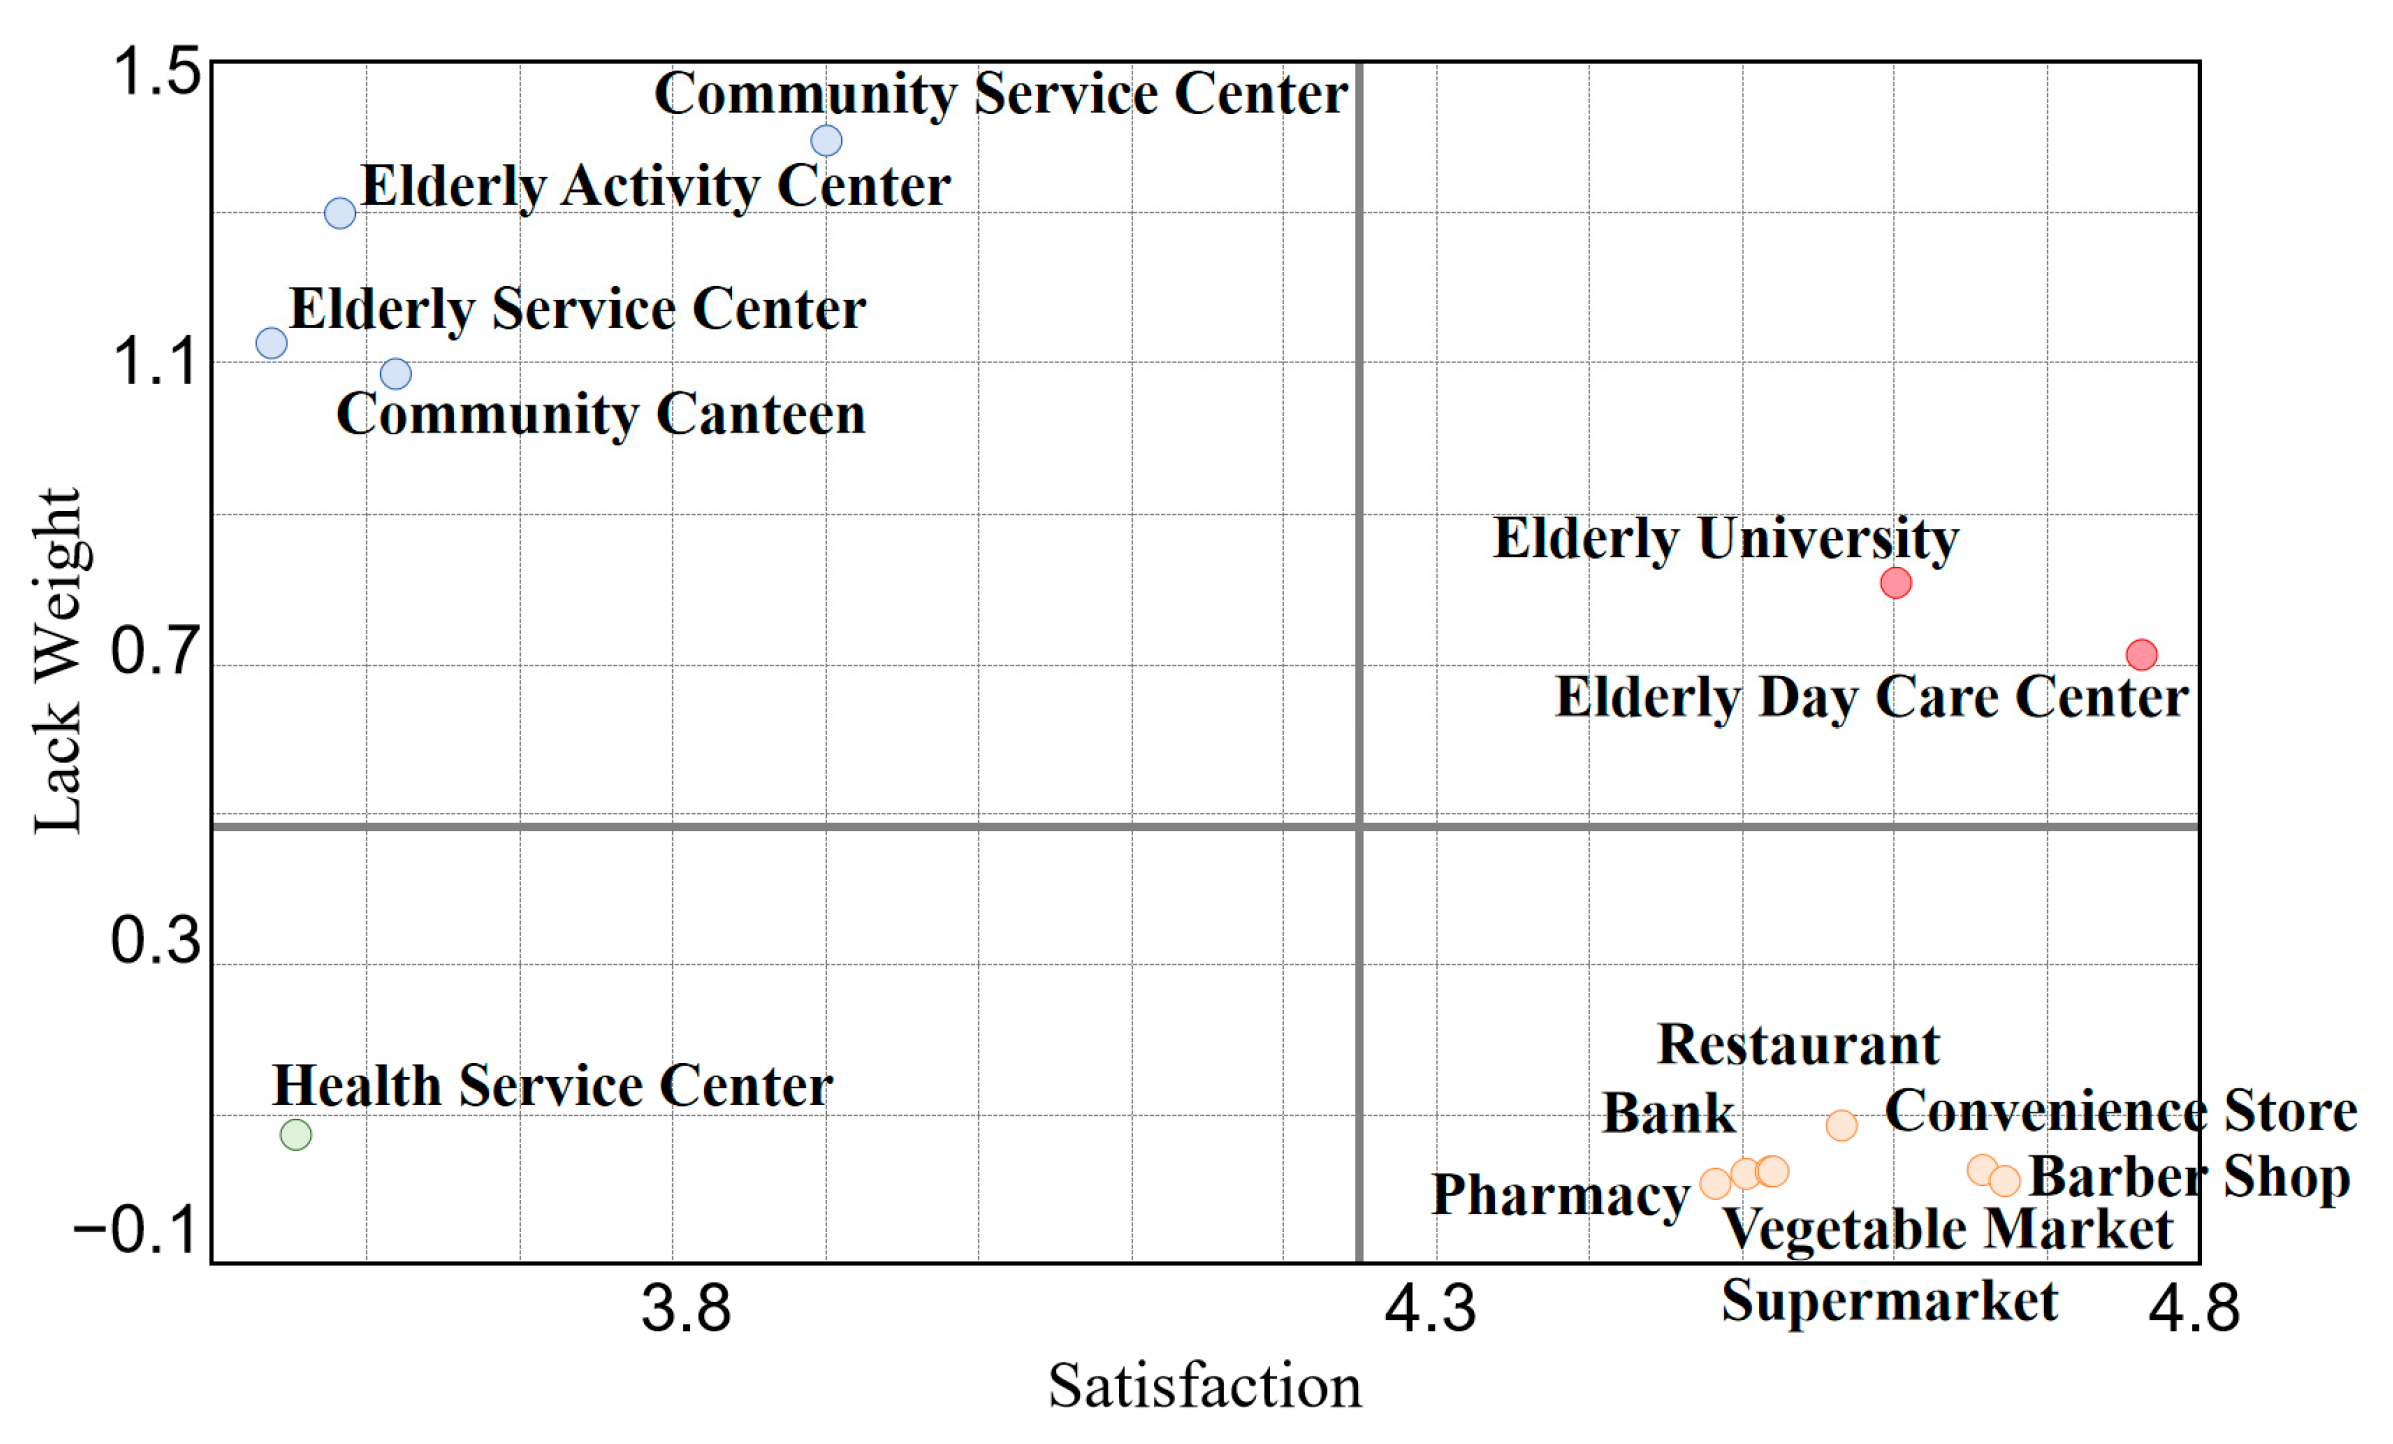
3.3. The Utilization and Lack Weight of Elderly Care Service Facilities

According to the characteristics of the use and demand for facilities by the elderly, as shown in Figure 7, there is a significant difference in the demand and use type of community elderly care service facilities among the elderly. The elderly use indicator-type service facilities less frequently; the usage of commercialized service facilities is much greater. The characteristics of the demand for facilities are also the same.
For indicator-type service facilities, the most used by the elderly is the health service center/community hospital, reaching 33.3%, while the use of other facilities is only around 10%, and the facility with the lowest usage percentage is the elderly university (2.6%). Considering that the frequency of use may be affected by the scarcity of some facilities, the greatest demand for facilities is the elderly activity center (49.0%), community service center (49.8%), and community canteen/elderly restaurant (46.8%). There is also a significant demand for other facilities, with the lowest demand for the elderly university teaching points. However, due to the insufficient supply of existing facilities, most facility demands cannot be met. In addition, the health service center/station/community hospital is the facility with the highest percentage of non-use among those that exist, and about 20% of the elderly also expressed that they have but do not use the community canteen/elderly restaurant and the elderly activity center. Figure 5 shows that the elderly have expressed significantly more dissatisfaction with community hospitals and community canteens (more than double the dissatisfaction compared to other facilities); however, these two types of facilities are also the least likely to be considered unnecessary by the elderly among those specifically designed to serve them.
For commercial service facilities, the elderly believe that every type of facility exists in the existing neighborhood, with about 80% of the elderly expressing their willingness to use the vegetable market, supermarket, hairdressing services, pharmacies/medicine stores, and banks. The demand for convenience stores is relatively low (59.9%), and the demand for dining is the lowest (48.5%), which is the facility that the elderly say they have around their residence but use the least. In addition, there is a minority of about 10% in each type of facility where the elderly themselves do not use the facility, instead having their family members fulfil the facility’s functions for them.
The primary reason affecting the use of indicator-type service facilities by the elderly is the lack of facilities, with many facility demands not being met. The unmet demand for health service centers/community hospitals is 6.2%, while the unmet demand for all other facilities is more than 20%. Among these, the elderly university and community day care center have relatively higher unmet demands, at 24.6% and 23.3%, respectively. In the existing facilities, the low usage rate of health service centers/community hospitals is because some elderly people prefer to go to large hospitals or small clinics they are familiar with for medical treatment; for commercial service facilities, due to the elderly’s concept factors, most are unwilling to eat out, prefer not to spend more money at convenience stores, and can have their hair cut by themselves or their family members, reducing the need to use such facilities.
As shown in Figure 8, in terms of the utilization weight of various facilities, the vegetable market and supermarket score the highest, exceeding 3 points, and are the most frequently used facilities by the elderly, providing the most help for their daily lives. For the community service center (1.63), elderly activity center (1.60), and convenience stores (1.59), which are facilities that the elderly use quite a lot, the weight reaches more than half that of the previous two types of facilities. The health service center/community hospital has the lowest score (0.43), which is the only facility with a weight lower than 25% of the weight of the most commonly used facilities for the elderly.
In analyzing the lack weight of facilities, the most severe shortages are found to be the community service center, elderly activity center, elderly service center, and community canteen/elderly restaurant, with scores all exceeding 1.0 point. These shortages are significantly higher than those for other facilities and indicate the greatest need for improvement (as shown in Figure 9). The facilities that are comparatively lacking are the elderly university and the elderly day care center, with scores of around 0.7 to 0.8. The remaining facilities all score below 0.1 points, indicating that there is basically no shortage in the current situation.
Based on the average utilization weight of each facility by the elderly, the percentage of users, and the percentage of each facility’s lack weight, cluster analysis was performed with the criterion of inter-group distance. As shown in Figure 10, the facilities can be divided into the following five types: (1) high-demand facilities, (2) high-frequency usage facilities, (3) low-frequency usage facilities, (4) high-frequency habitual facilities, and (5) low-frequency occasional facilities.
Specifically, high-demand facilities are those that the elderly need relatively more but face limitations in daily use due to the lack of facilities in the current situation, including the elderly activity center, community service center, community canteen/elderly restaurant, elderly service center, elderly day care center, and elderly universities. High-frequency usage facilities are those with the highest frequency of use by the elderly, including the vegetable market and supermarket. Low-frequency usage facilities are those with a lower frequency of use by the elderly, including banks, pharmacies, and hair salons. High-frequency habitual facilities are those that some elderly people choose to use and have a high frequency of use, including convenience stores and dining facilities. Low-frequency occasional facilities refer to those used by only some elderly people and with a low frequency of use, mainly the health service center/community hospital.

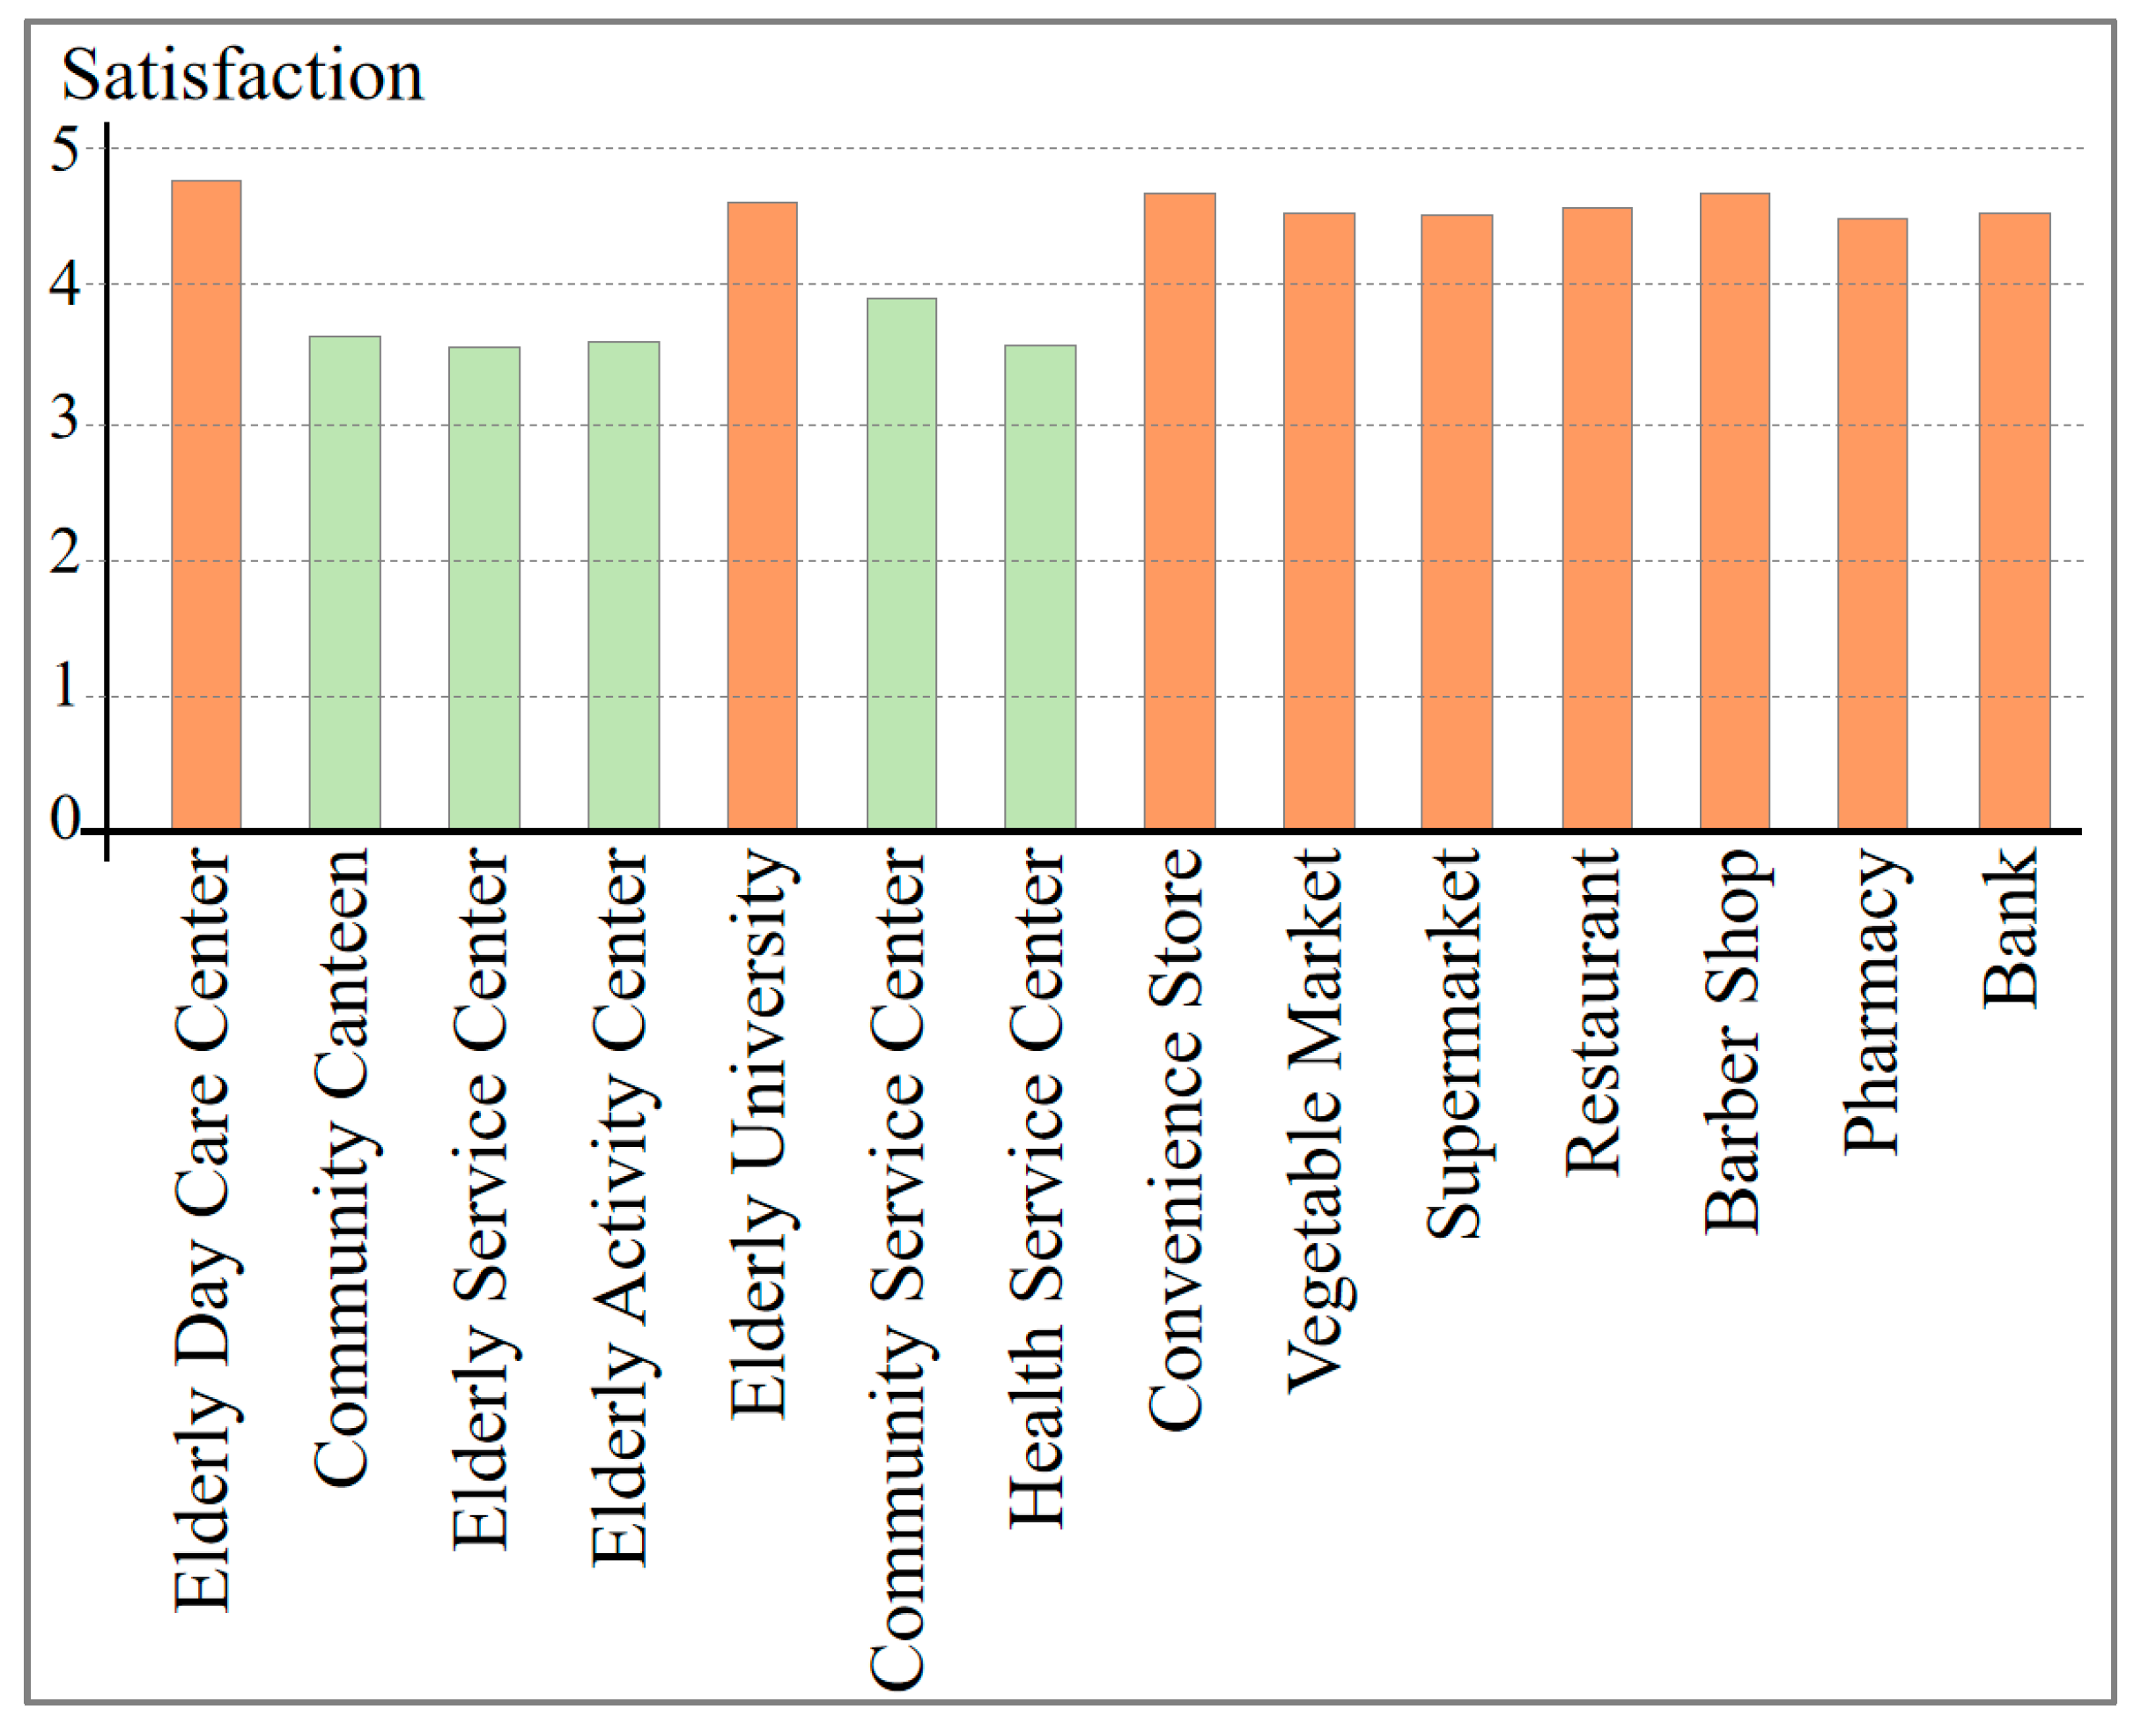
3.4. Satisfaction with the Utilization of Elderly Care Service Facilities

In terms of the satisfaction rating of the elderly for the facilities (as shown in Figure 11), the overall satisfaction of the elderly with indicator-type service facilities is lower compared to commercial service facilities. Among them, the satisfaction rates of community service centers (3.9), community canteens (3.6), elderly activity centers (3.6), health service centers (3.6), and elderly service centers (3.5) are less than 90% of the total score, which is also the lowest satisfaction rate among all facilities.
Specifically, the scores for the elderly day care centers and the elderly universities are relatively high, indicating that the services provided by these facilities are good. For other facilities, many elderly people believe that the facilities do not truly care about their real needs, and the service level of the facilities is limited. It should be noticed that although the elderly university has a relatively high satisfaction rate, according to the research in the previous sections, the utilization weight and demand weight of this facility are both ranked relatively low among all facilities. For commercial service facilities, the elderly are generally satisfied because they are familiar with the surrounding commercial facilities and find them convenient to use, with only a few dissatisfied responses.

3.5. Demand Characteristics of Facilities among Different Types of Elderly

In this section, to facilitate easier reading of various tables, red, orange, green, and blue are used to represent the maximum, second maximum, second minimum, and minimum values of indicators for elderly people across different age groups, activity capacity, and chronic diseases, respectively.

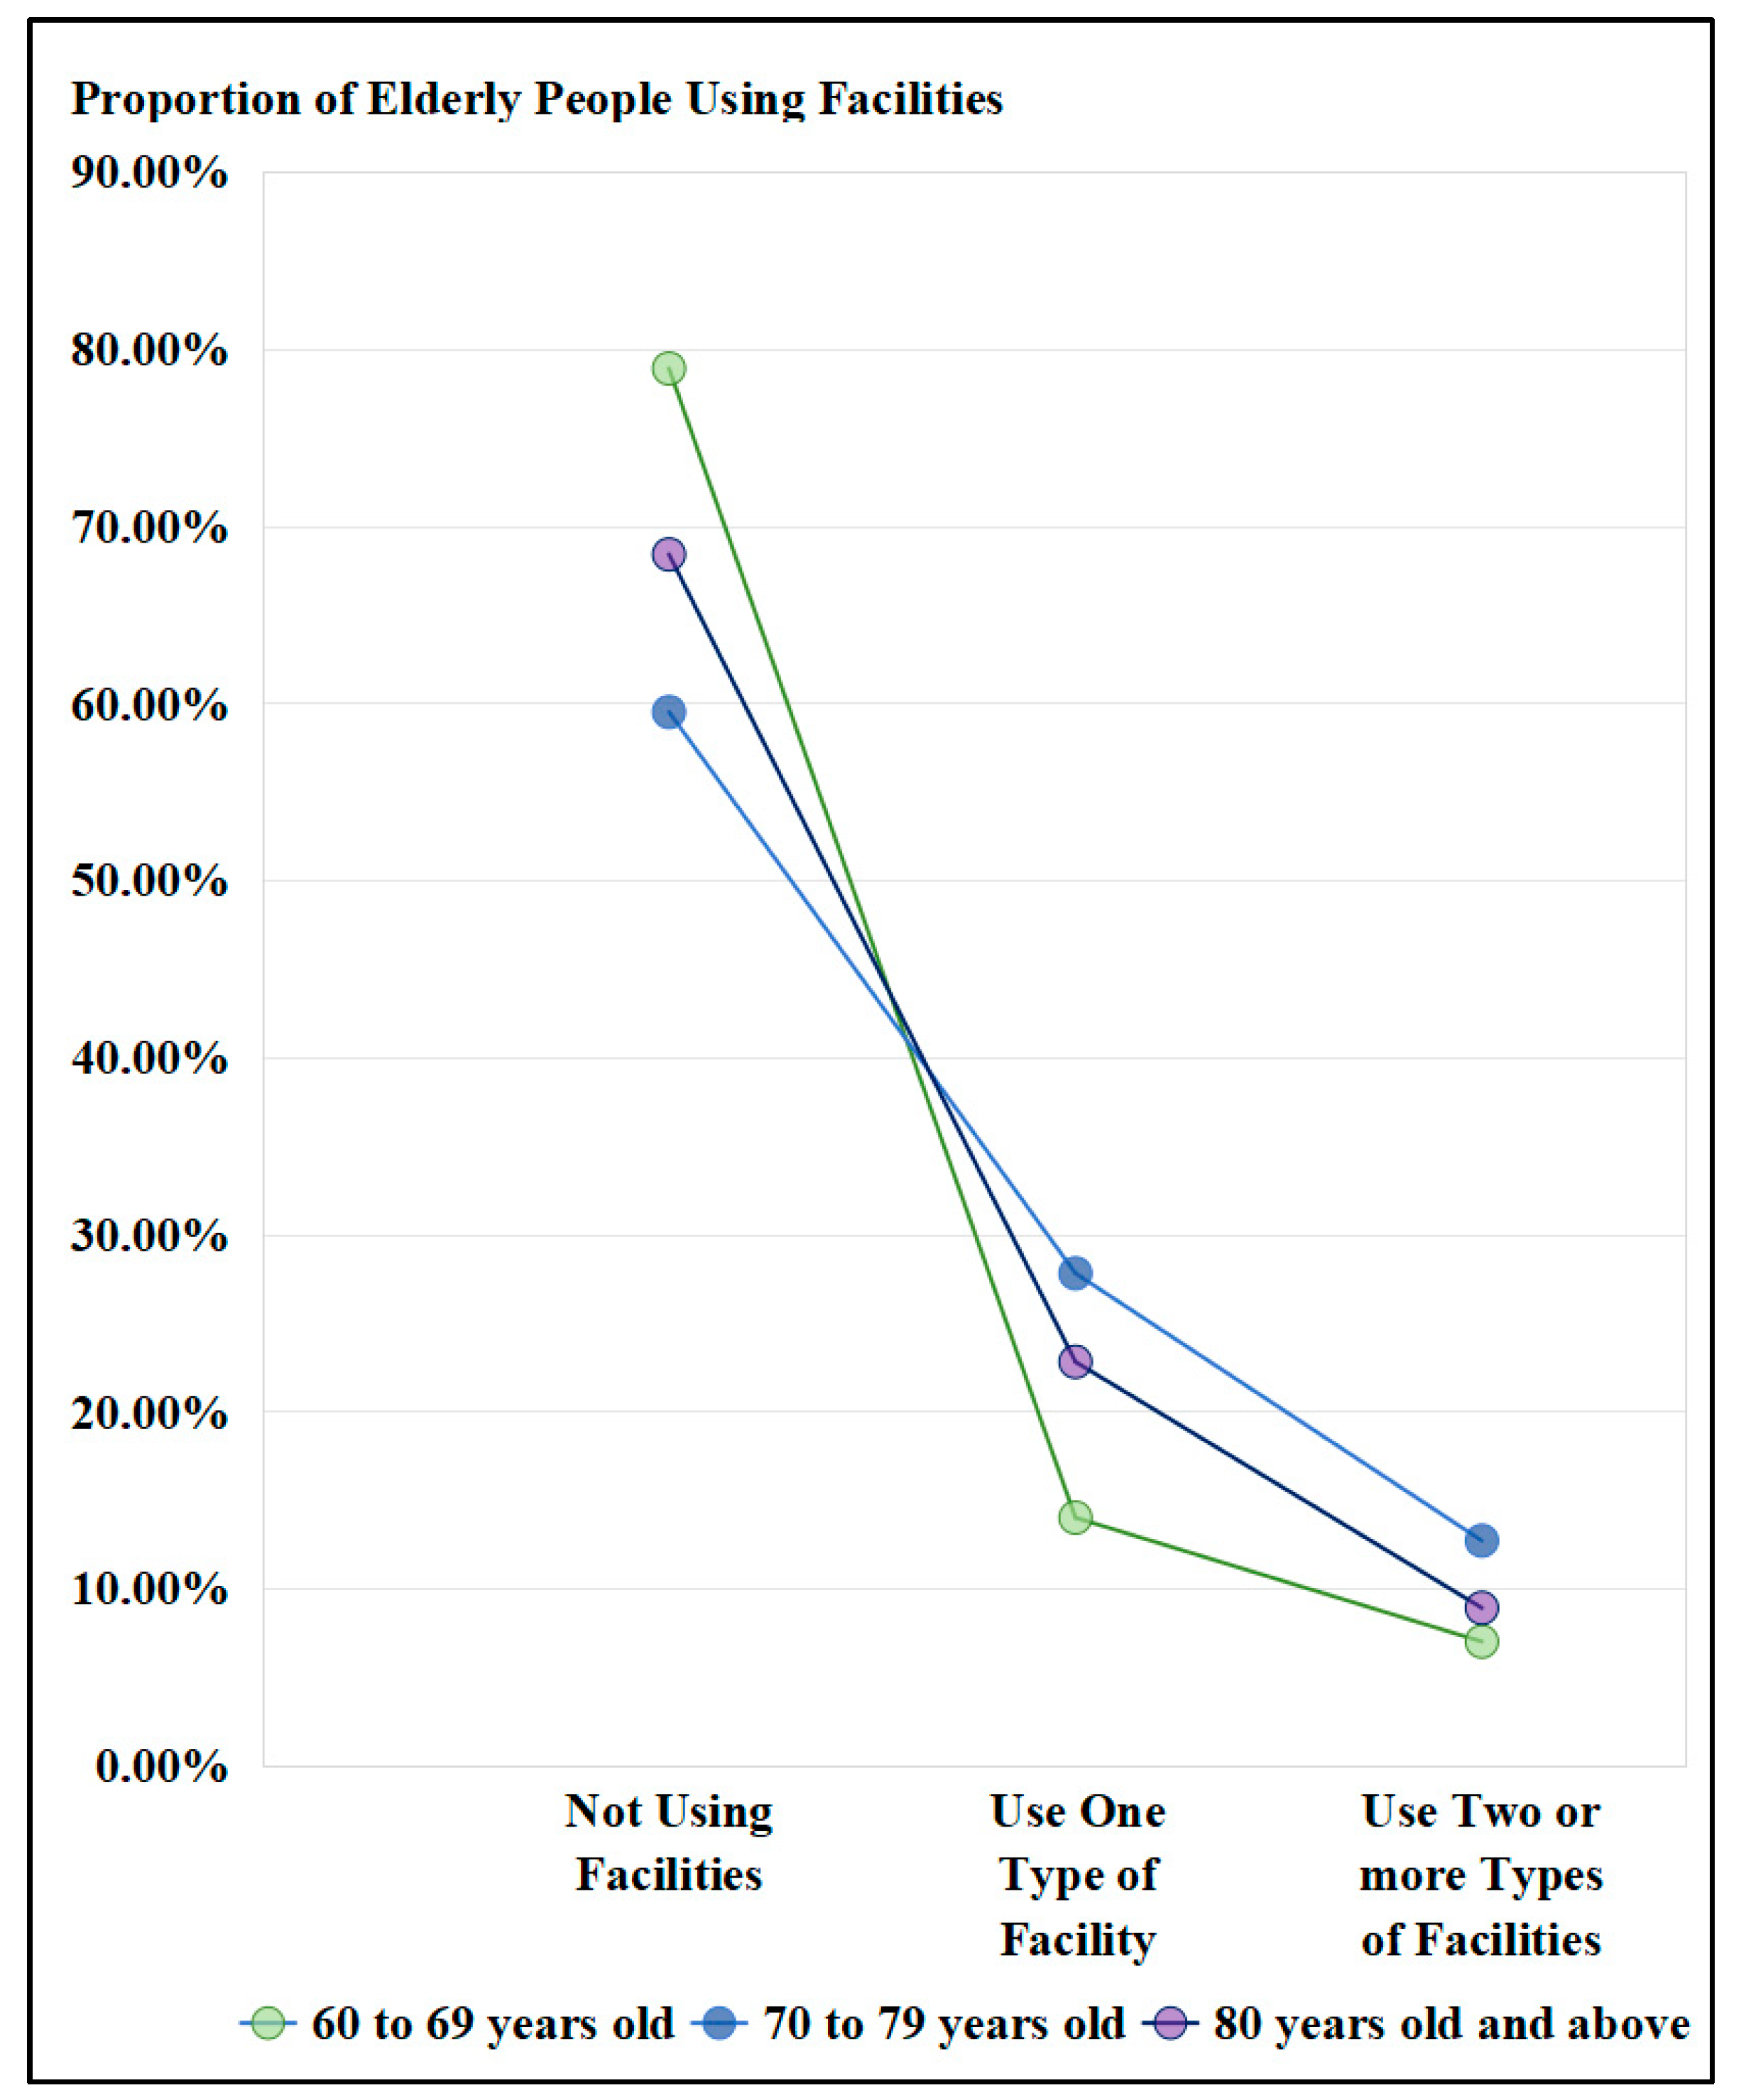
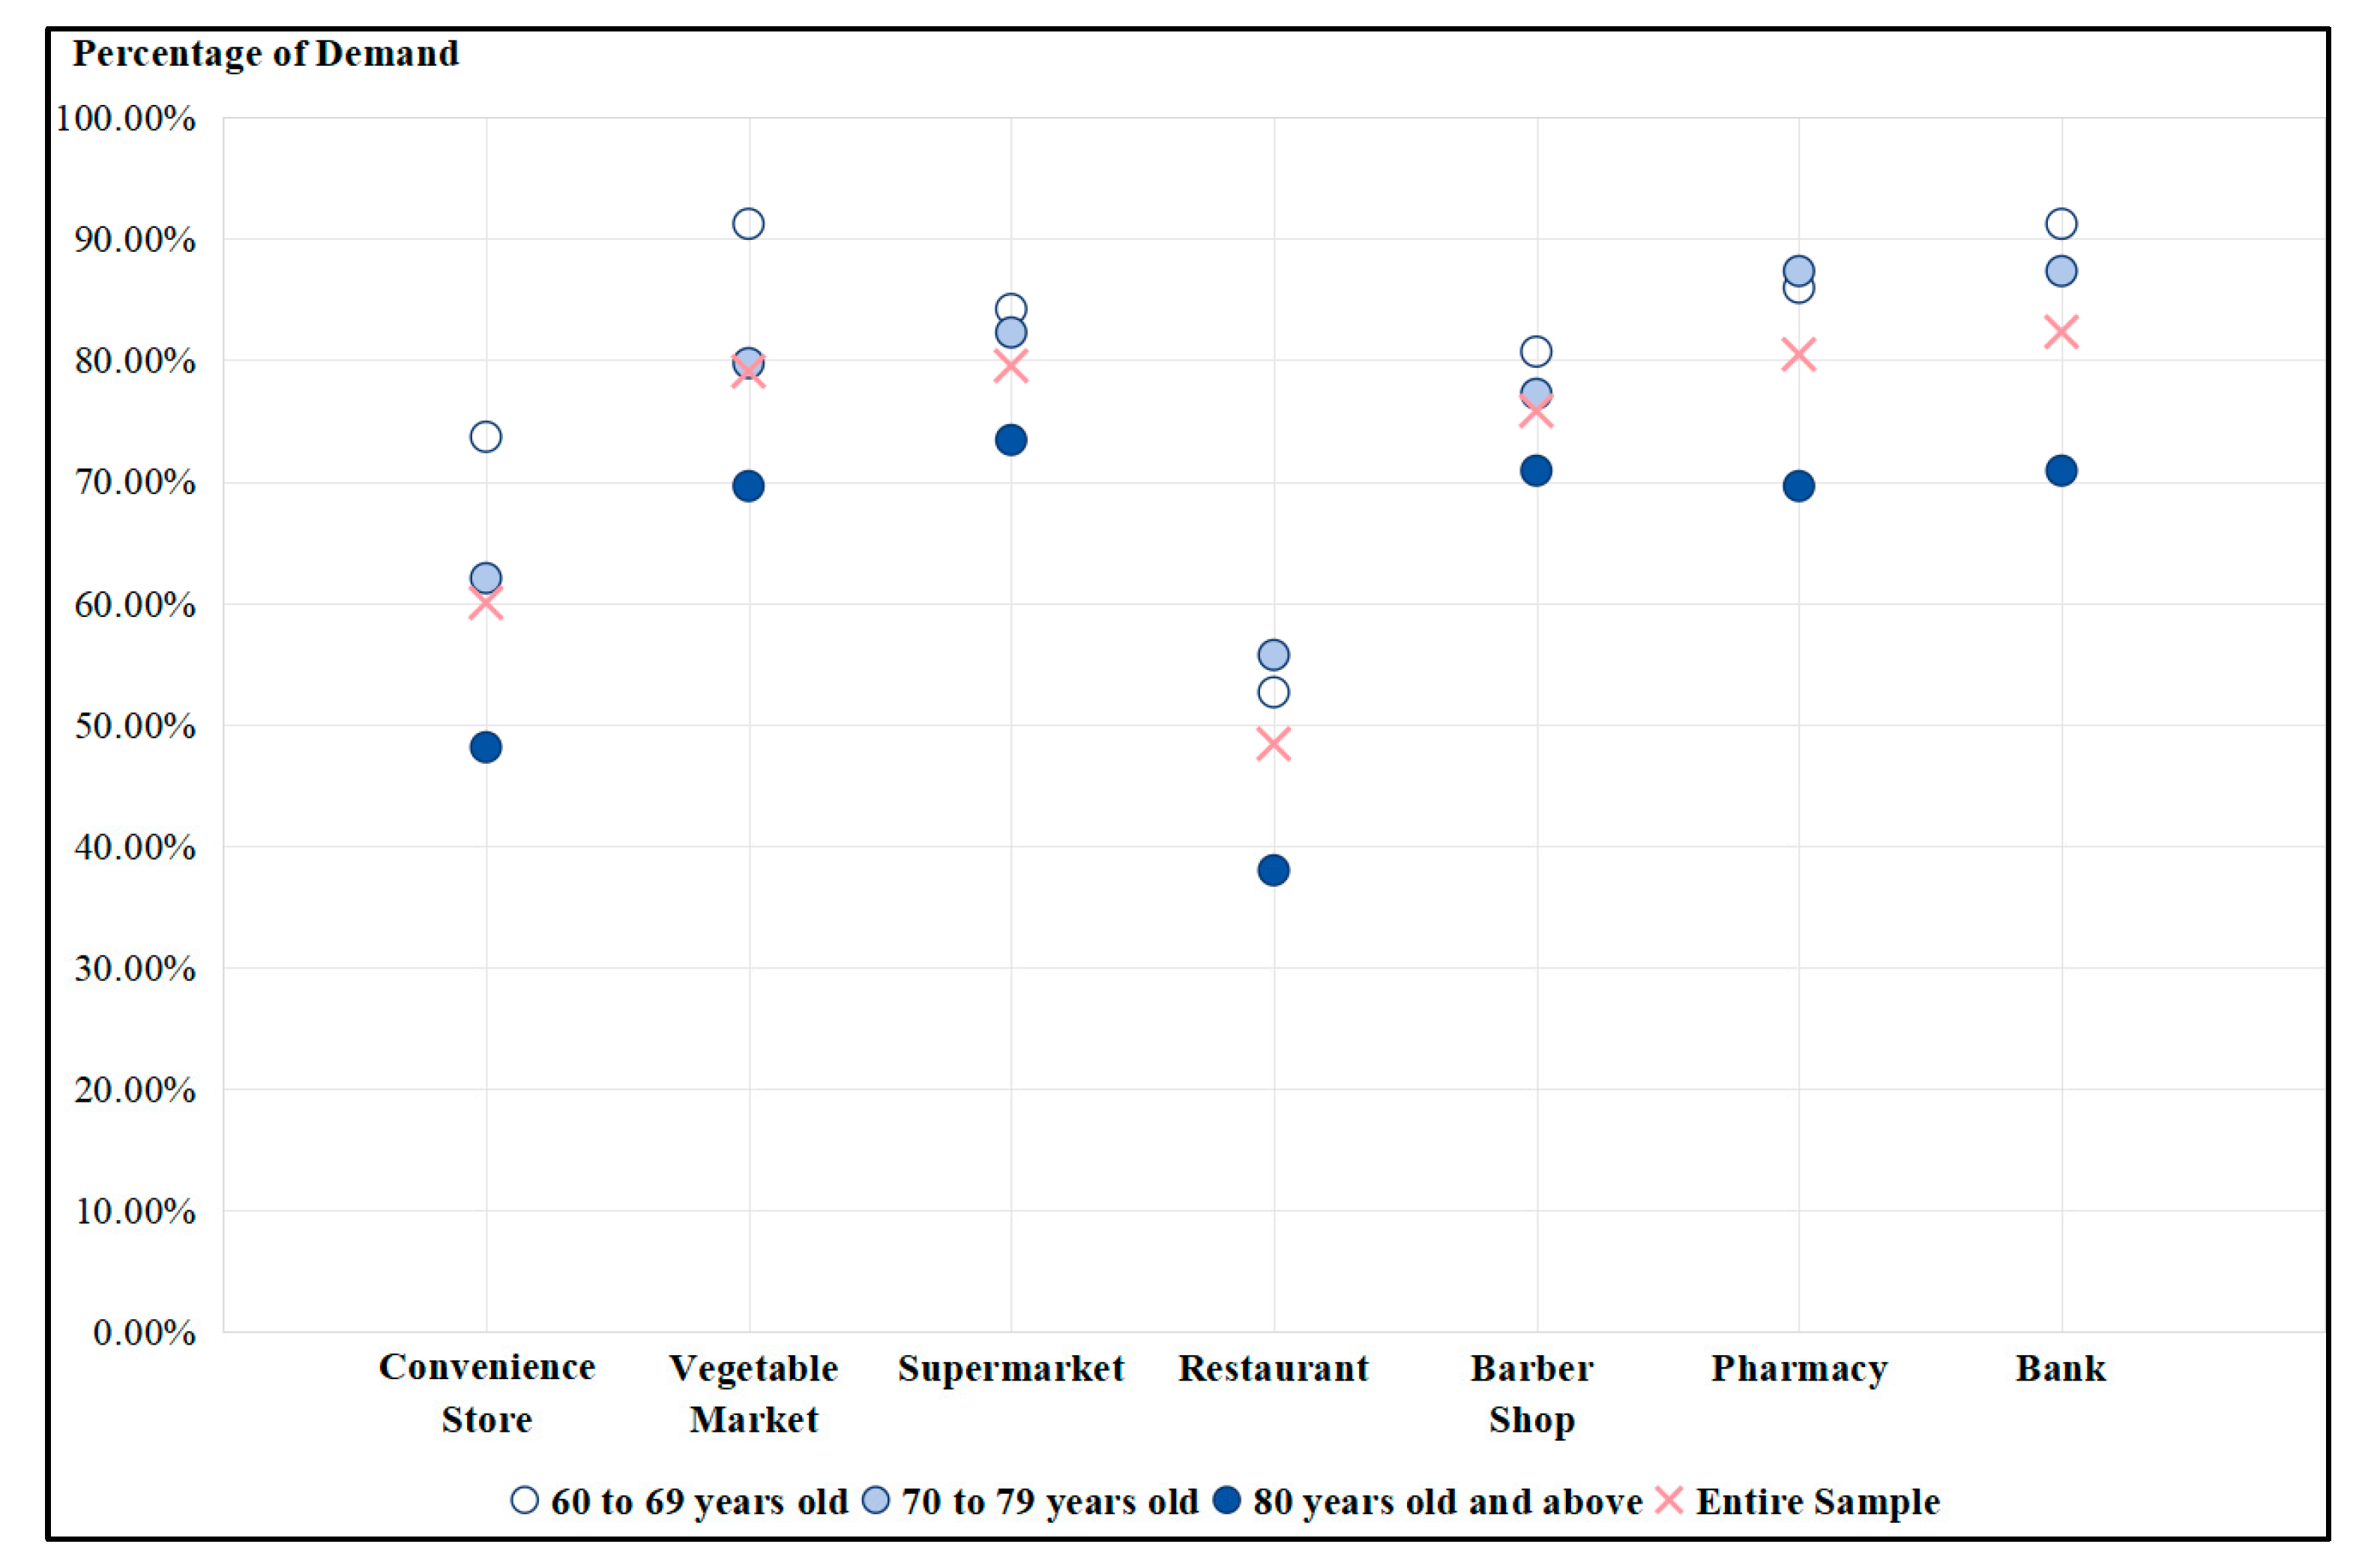
3.5.1. Different Age Groups

As shown in Table 2, elderly individuals from all age groups have a relatively low demand for elderly day care centers and elderly universities among the index service facilities. The facilities with higher demand are elderly activity centers, community service centers, and community canteens. For all elderly people, the facility with the highest demand is the elderly activity center, followed by the community service center. The facilities with the lowest demand are the elderly university, followed by the elderly day care centers. This characteristic is consistent with the needs of elderly people over 70 years of age.
Younger elderly people have a lower demand for elderly day care centers, which is related to the higher self-care ability of the younger elderly, and they do not need to use the relevant facilities. Middle-aged elderly people have a higher demand for community restaurants/elderly canteens, and the older elderly have a higher demand for elderly activity centers. These characteristics clearly relate to the decline in the physical function of the elderly. As middle-aged elderly people experience a gradual decline in physical function, the intensity of cooking (including buying, cooking, cleaning, throwing away garbage, and so on) by themselves will gradually increase, so the likelihood of eating out will also rise. However, as age further increases, the intensity of physical activity required for going out will also gradually increase, so the desire to eat out will gradually decrease. Conversely, participating in activities at the activity center is more suitable for the elderly’s needs for outdoor exercise/activities (although most activities at the elderly activity center are still mainly seated). Overall, as age increases, the use of facilities among the elderly initially tends toward independent activities (ages 60–69) and gradually shifts to a greater need for community services (ages 70–79). As age further increases, the elderly are more and more inclined to choose more static activity facilities.
Figure 12 shows the proportion of demand for various facilities among elderly people across different age groups. As shown in the figure, the demand for indicator-type facilities among the elderly takes four forms. For elderly day care centers, community canteens, and elderly service centers, the demand is greatest among elderly people aged 70–79, with the youngest elderly people having the lowest demand, while those over 80 have a demand that is essentially the same as the average for all elderly people. The similar characteristic of these facilities is that they all have explicit services for the elderly, and elderly people need to be present to participate, which makes the demand higher for older elderly people, while younger elderly people are less in need of these services. The second category consists of senior universities and community service centers, where the demand is lowest for those over 80 and essentially the same for other age groups. These facilities are similar to the first category, with explicit service content, and it is precisely because of the characteristics of their service content (e.g., reading, social welfare distribution, cultural and entertainment activities organization) that these activities are less attractive to older elderly people. The third category is health service centers, where the demand is lowest for those over 80 and highest for the youngest elderly people, showing a clear trend of decreasing demand with increasing age of the elderly. This is different from the intuitive perception that “the older the elderly, the more they need medical facilities.” The reason is that after the elderly reach a certain age, their demand for professional hospitals increases, and community-level medical services can no longer meet their needs. The difference in demand proportions among elderly people of all age groups is essentially the same, which is consistent with the characteristics of the average life expectancy of the Chinese population. According to statistical data from China in 2023, the average life expectancy is 78.6 years, so the demand for community health centers among all elderly people is closest to that of the 70–79 age group (with a difference of 0.98%). The fourth category is the elderly activity center, where the demand is extremely similar for all elderly people, at only 3.26%, which is the smallest among all facility types (the second smallest is the health service center at 8.42%). This facility also has the strongest average demand among the elderly, reaching 49.77%. The largest difference in demand for other facilities is for senior universities, at 20.25%.
From the perspective of the usage of elderly service facilities, as shown in Table 3, the number of young elderly people who do not use these facilities is the highest, accounting for 78.9%. This is because a large number of young elderly people do not feel that they have aged, and some of them are still working and do not have a need for these facilities. The proportion of middle-aged and elderly people using one or more types of elderly services is relatively high, totaling over 40%, making them the main group using elderly service facilities. The use of elderly care facilities by elderly people falls between the two. It should be pointed out that the number of facilities used by the elderly here refers only to those that provide services specifically for the elderly, such as the use of commercial facilities including supermarkets and banks.
Figure 13 shows the proportionate changes in the number of facilities used by elderly people across different age groups. It can be observed that elderly people across all age groups exhibit a characteristic where “most do not use facilities, and the proportions of using one facility and multiple facilities are similar”. Taking the elderly aged 60–69 as an example, the percentage point difference between those who do not use any facilities and those who use one facility is as high as 64.9%, while the difference between those who use one facility and those who use multiple facilities is only 7%, with a slope difference of 9.3 times. The differences in facility usage rates for the other two age groups of elderly people are as follows: for those aged 70–79, the differences are 31.7% and 15.1% (2.1-fold slope difference); for those over 80, the differences are 45.6% and 13.9% (3.3-fold slope difference).
It should be noted that for the elderly from the 60s age group to the 70s age group, the difference in the number of facilities used becomes smaller with increasing age. This characteristic underlines the fact that the current service facilities are indeed helpful to the elderly, and the older the elderly, the greater the demand for community-provided services. The reason for this feature is related to the construction of age-friendly communities in China, where the government promotes many age-friendly renovation plans for the community. However, this characteristic is exactly the opposite in the elderly population from the 70s age group to the 80s age group. This change characteristic is related to the average life expectancy of the Chinese population. The average life expectancy of the Chinese population has never exceeded 80 years of age, and it can be considered that the physical condition of the elderly over 80 is characterized by a rapid decline, and their demand for external assistance is not as high as it was when they were younger. The main reason for this characteristic is related to the types of community service facilities provided for the elderly in China. Combined with the study in Figure 12, it can be seen that the elderly over 80 only have a higher demand for the community activity center, with a demand that is only 0.86% higher than the average.
Regarding the commercial service facilities, as shown in Table 4, the needs of the elderly are mainly concentrated in banks and pharmacies, a characteristic closely related to their living and health needs. In addition, supermarkets and vegetable markets are in high demand. As supermarkets in Chinese cities can, to some extent, fully cover the services provided by vegetable markets, it can be said that the elderly’s demand for these two types of facilities is primarily focused on purchasing daily necessities. The elderly have relatively lower demand for facilities such as convenience stores and restaurants. Although convenience stores offer the advantages of long operating hours and a variety of products, their higher prices often differ significantly from the consumption preferences of the elderly. Moreover, the elderly generally do not have an urgent need to purchase goods late at night, and their daily necessities can be completely met by supermarkets. The lower demand for restaurants is related to the common Chinese preference for cooking at home.
The above-mentioned demand characteristics are not closely related to age, and the needs of the elderly in all age groups are basically consistent. In general, the elderly in all age groups have a high demand for all types of commercial facilities.
Figure 14 shows the usage of various commercial service facilities by elderly people across different age groups. It can be observed that the demand for commercial facilities among the elderly exhibits two distinct characteristics. The first category includes convenience stores, vegetable markets, supermarkets, barbershops, and banks. The demand for these five types of facilities shows a clear negative correlation with increasing age. This is because commercial service facilities inherently possess general societal attributes and are not constructed specifically for the lives of the elderly; therefore, younger elderly individuals are more likely to be in closer proximity to the services provided by these facilities. The second category consists of restaurants and pharmacies. The highest demand for these two types of facilities is among elderly individuals aged 70, with the caveat that the demand for both is essentially the same for all elderly individuals except those in their 80s, with the greatest difference being only 3.07%. In addition to these observations, a common feature of commercial service facilities is that the average demand ratio for all facilities is lower for elderly individuals in the 60s and 70s age groups compared to other age groups. This characteristic is similar to those found in indicator facilities such as senior universities, community service centers, and health service centers.

3.5.2. Different Activity Capacity

An analysis was conducted on the usage needs of elderly people with different mobility abilities and indicator service facilities. One elderly person reported needing a wheelchair; this case is excluded because wheelchair-bound elderly people have greater limitations on facility needs.
As shown in Table 5, elderly people prefer to participate in activities at elderly activity centers, community service centers, and community canteens. Facilities with lower demand for the elderly include day care centers and elderly universities. It should be pointed out that the day care center, as the most important service facility for community elderly care, has not been widely recognized by the elderly. The most critical issue is its high cost, and elderly people do not choose to live in day care centers when they can take care of themselves. The ability to move has no significant impact on the demand of elderly people for using senior universities. Overall, the stronger the ability to move, the more elderly people participate in senior universities.
Overall, there is a significant similarity between the elderly’s activity ability and their demand for various facilities, and this similarity is closely related to the increase in their age. This is because, typically, as the elderly age, their ability to move around also tends to decline gradually.
In terms of the characteristics of the number of elderly service facilities used (Table 6), regardless of mobility, the number of elderly people who do not use elderly service facilities is the highest, accounting for 59.4% to 72.5%. This is significantly higher than the number of elderly people who use one type of facility. This feature is the same as that in Section 3.5.1.
For commercial service facilities, as shown in Table 7, elderly people with completely normal mobility and those with less mobility in their legs and feet have a significantly higher demand for vegetable markets, supermarkets, pharmacies, and banks compared to elderly people with very limited mobility. The demand for dining and hairdressing is basically not constrained by mobility. Even as the mobility of the elderly decreases, a considerable proportion of the elderly will still need to use these two types of facilities.

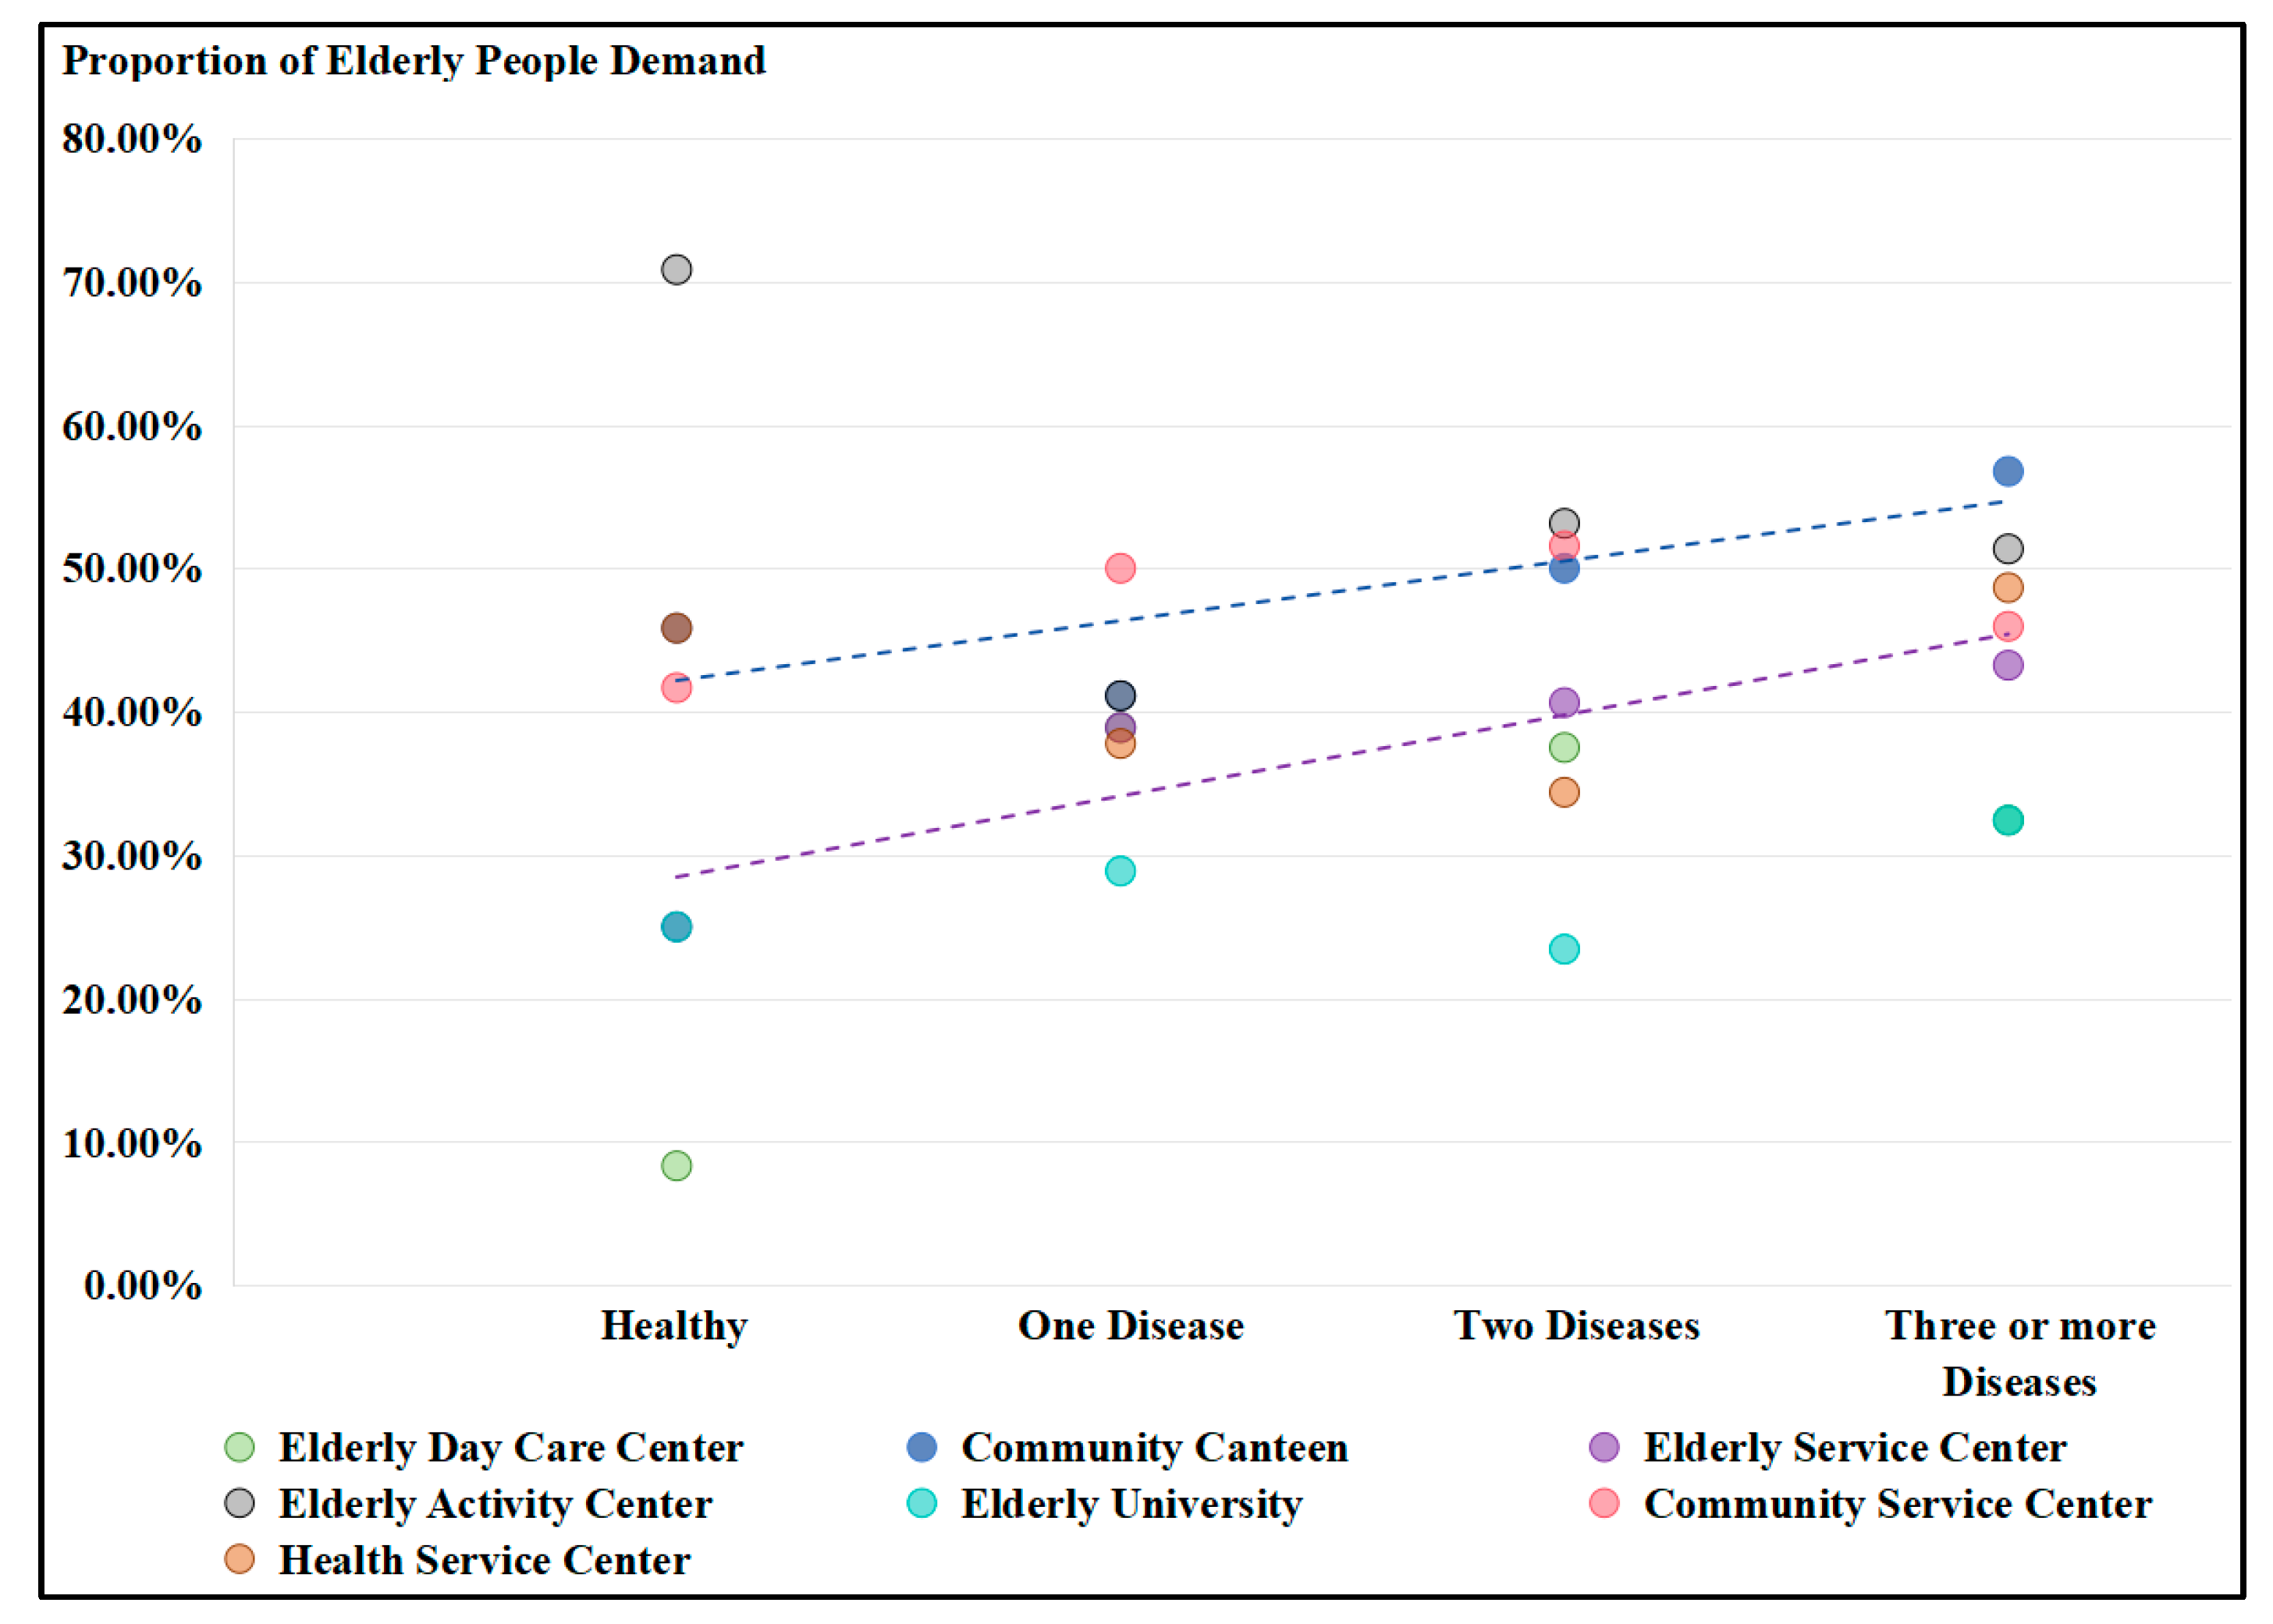
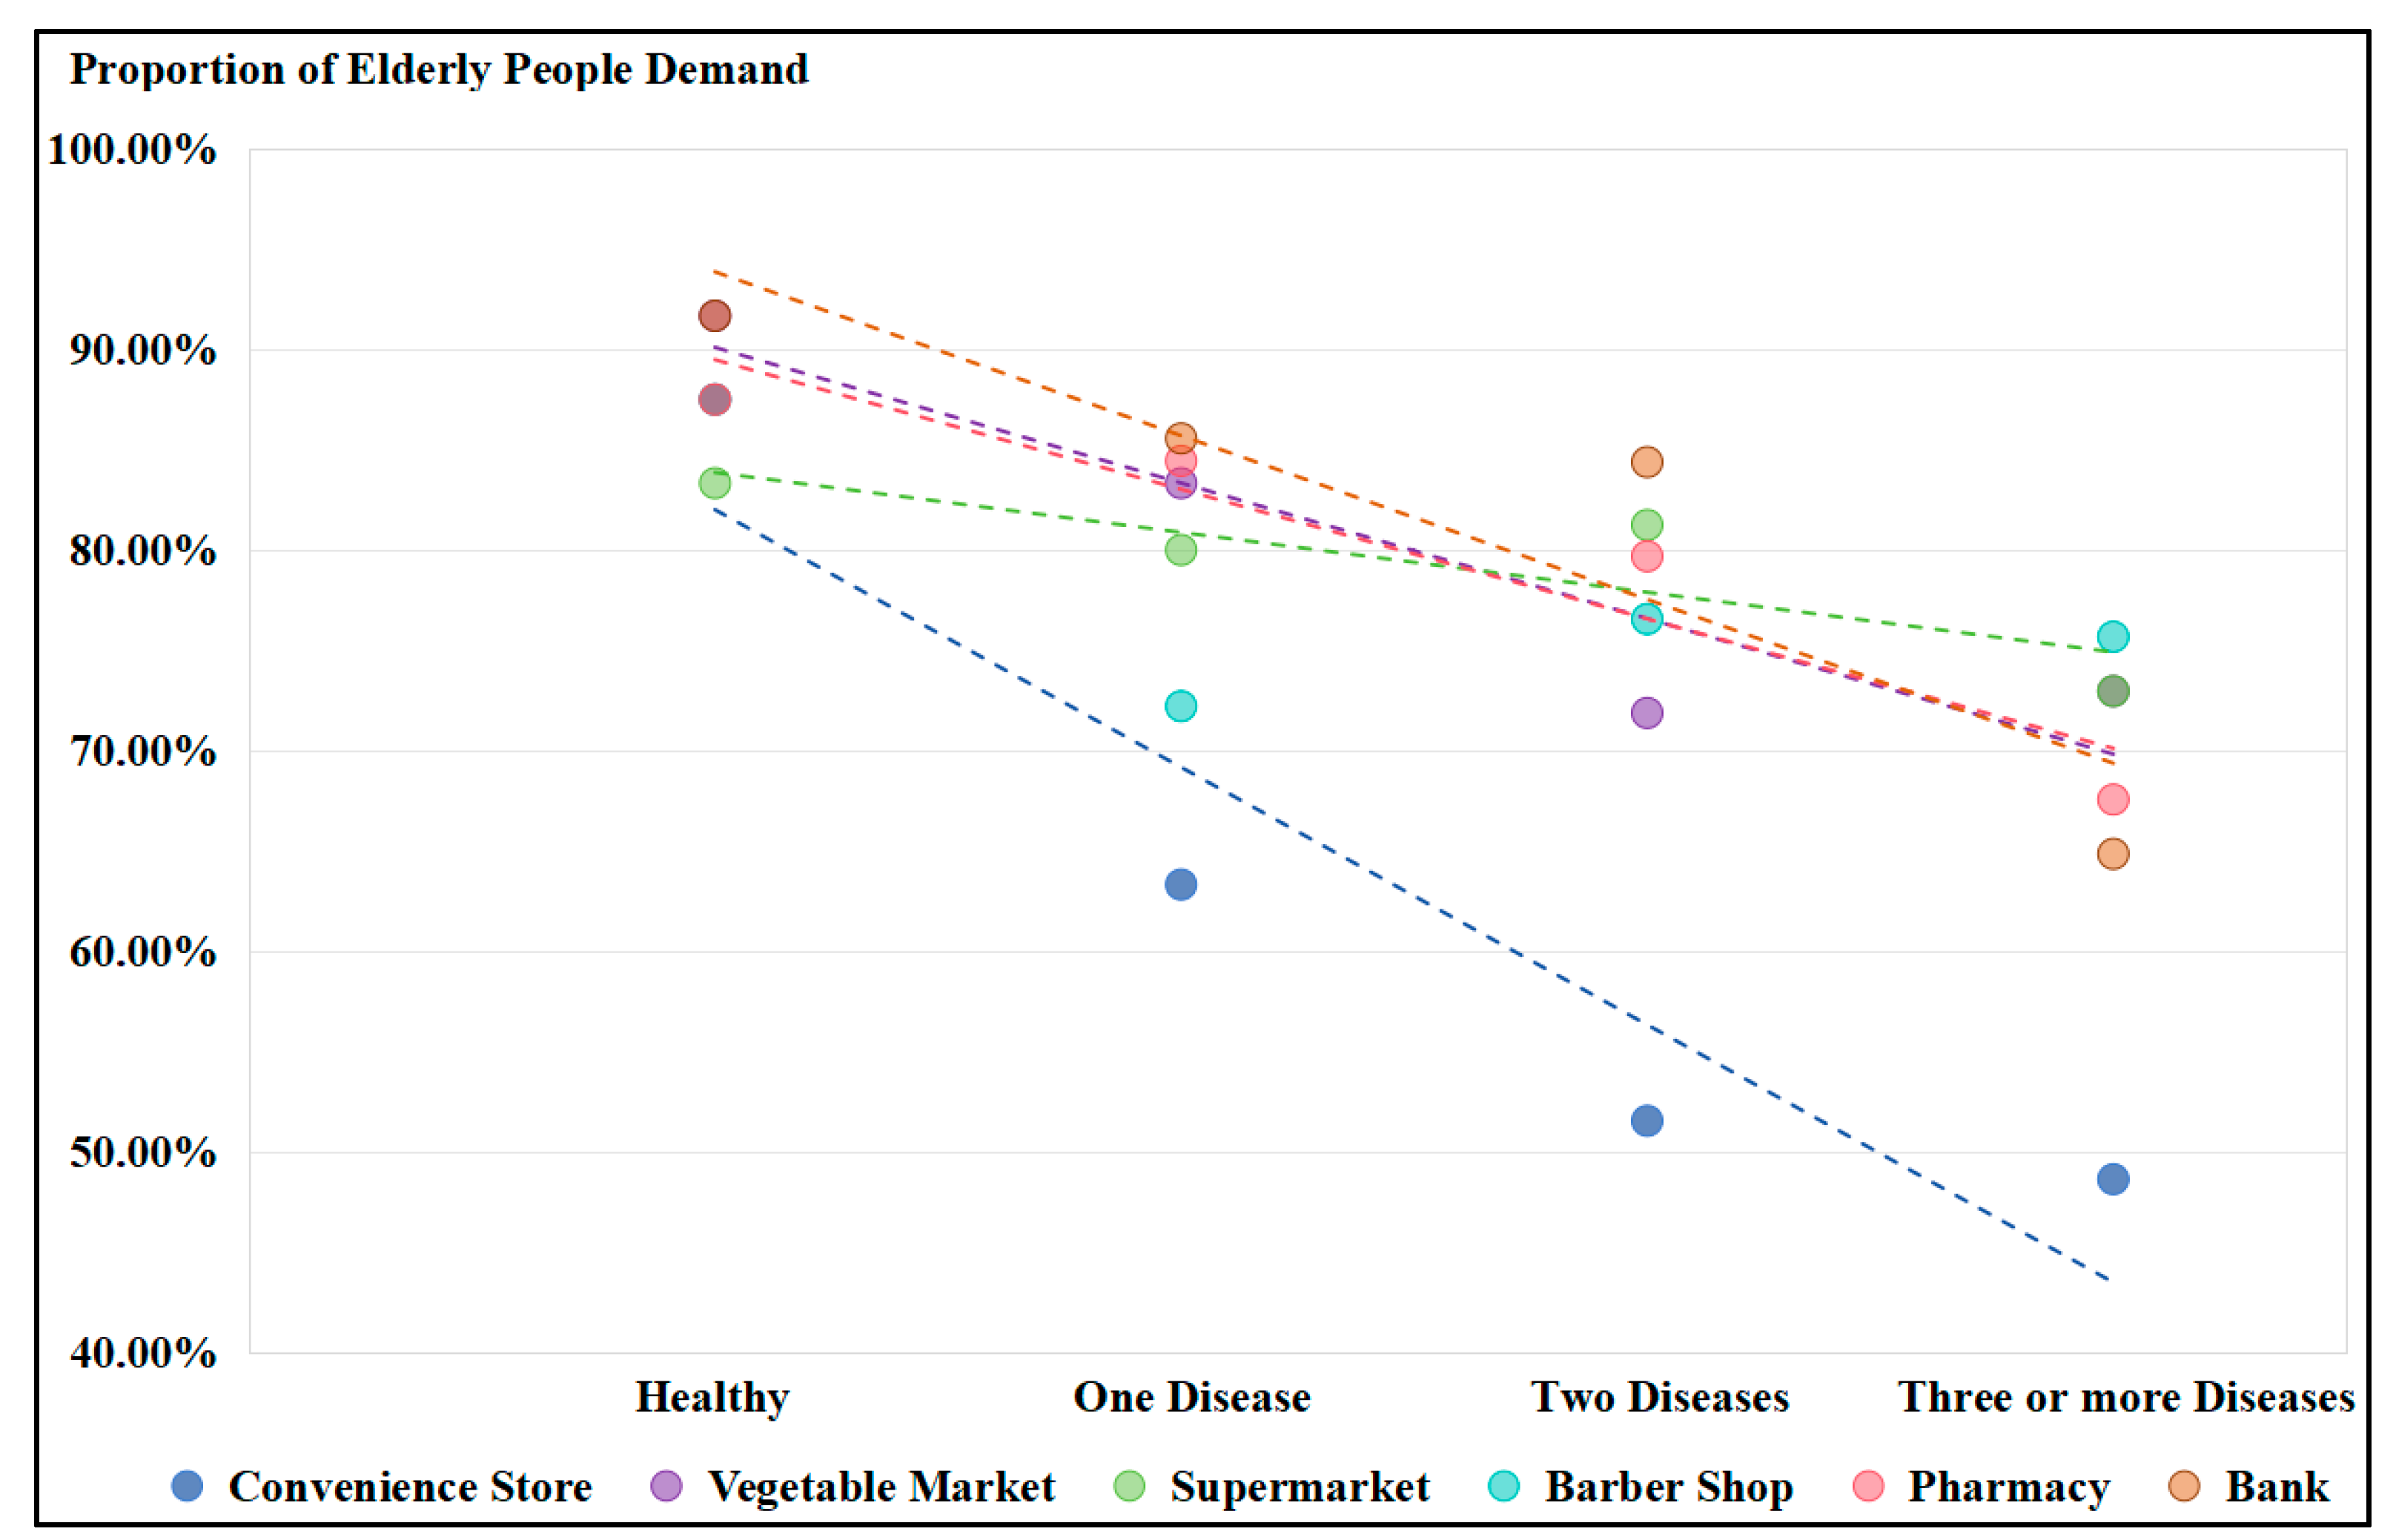
3.5.3. Different Chronic Diseases

An analysis of the use and demand for indicator-type service facilities among the elderly with different chronic disease conditions is presented, as shown in Table 8. Healthy elderly have a lower demand for elderly day care centers (8.33%), elderly service centers (25.00%), and elderly universities (25.00%); these elderly people require less basic life support but have a higher demand for elderly activity centers, paying more attention to daily activity management. Elderly people with one or two chronic diseases have little difference in facility needs; elderly people with more than three chronic diseases have a greater need for community canteens/elderly restaurants to assist in their physical convalescence. It should be noted that, aside from healthy elderly individuals, those with at least one chronic condition have the lowest demand for elderly universities.
Although the level of physical health affects the demand for facilities among the elderly, this correlation is not significantly present in all facility categories. As shown in Figure 15, among the seven types of indicator service facilities, only the demand for elderly service centers and community restaurants by the elderly shows a more obvious linear relationship with physical health status. Among them, the elderly service center (purple line) has the strongest correlation with health status, with an R2 of 0.798 and p < 0.005; the community restaurant (dark blue line) has an R2 of 0.657 and p < 0.005. The demand for other facilities, aside from these two, has a correlation coefficient with health status that is below 0.5. Generally, in statistics, an R2 greater than 0.8 is considered to indicate a significant correlation. Considering the subjective nature of “demand” in this study, we can consider an R2 greater than 0.6 to already represent a significant correlation.
As shown in Table 9, there is no clear association between chronic disease conditions and the use of elderly service facilities. In the samples, no healthy elderly individuals use two or more facilities, which may be due to the elderly’s preference to use elderly service facilities as little as possible when their physical conditions permit them to. Moreover, regardless of the health status of the elderly, the proportion of elderly people who do not use elderly care facilities is the highest (70.8%, 70.0%, 62.5%, 70.3%).
Table 10 describes the usage rates of commercial service facilities by elderly people with different health conditions. Among them, elderly people without chronic diseases use all facilities, with the lowest usage rate being supermarkets; however, 83.33% of the elderly go to supermarkets for shopping. Elderly people with one chronic disease have the highest usage rate for commercial facilities such as banks, pharmacies, and vegetable markets. Elderly people with two chronic diseases have the highest usage rates for facilities such as banks, supermarkets, and pharmacies. Elderly people with three or more chronic diseases have the highest usage rates for facilities such as hairdressing, vegetable markets, and supermarkets. It should be noted that among all facilities, there is a positive correlation between the health level of the elderly and the usage rates of pharmacies, banks, and convenience stores, meaning that the healthier the elderly, the higher the proportion of them using these facilities. The usage rates of other facilities by the elderly are not clearly correlated with their health status.
As shown in Figure 16, unlike indicator service facilities, the demand for commercial service facilities among the elderly shows a very clear correlation with their physical health status. Except for barbershops, all other commercial facilities exhibit a significant correlation with the health status of the elderly. The highest correlation is with pharmacies (red line), with an R2 of 0.904 (p < 0.005); followed by convenience stores, vegetable markets, banks, and supermarkets, with correlation coefficients of 0.879 (dark blue line), 0.869 (purple line), 0.822 (brown line), and 0.735 (green line), respectively, and p-values of all these cases are less than 0.01.

4. Discussion

4.1. Characteristics of Elderly Needs Affecting the Planning of Community Service Facilities

Figure 17 shows a four-quadrant analysis chart based on satisfaction ratings and the lack weight of facilities, summarizing which facilities need to be improved and upgraded in the current situation. Centered around the average value, facilities are categorized into four types according to the quadrants: facilities to be promoted and increased, primary facilities for improvement, secondary facilities for improvement, and facilities to maintain advantage.
For the three levels of the life circle, facilities are categorized according to the five types of utilization (as Section 3.3 shows) and four types of improvement, analyzing the types of facility needs at each level.
Specifically, the elderly service station and community service station at the 5 min level are facilities that the elderly need to use and are severely lacking, requiring priority improvement. In addition, the elderly day care center is also a facility that needs to be constructed, and existing construction experience can be summarized for promotion and construction. The health service station is a facility occasionally used by the elderly and needs partial improvement. The rest of the facilities can maintain the status quo.
At the 10 min level of facilities, the community canteen/elderly restaurant and the elderly activity station are the facilities with a high degree of demand from the elderly, requiring priority improvement in quality. The vegetable market and supermarket are the most frequently used facilities by the elderly on a daily basis, and it is necessary to maintain the construction and operation of such facilities.
At the 15 min level of facilities, the elderly service center, elderly activity center, and community service center are the primary facilities that need to be improved (especially in terms of increasing the number). Among them, the elderly university, and the health service center/community hospital both need to increase their numbers, while the bank facilities can maintain the construction and operation mode.
According to the quadrant analysis of satisfaction and facility lack weight, (1) the elderly service center and community service center at the 5 min level are facilities that the elderly are currently dissatisfied with and feel are severely lacking, and the rational construction and operation of day care centers must be improved (although the acceptance rate by the elderly is low, with the increasingly pronounced characteristics of China’s declining birth rate, this facility will be indispensable in the future); (2) for the facilities at the 10 min level, the community canteen/elderly restaurant and elderly activity center are facilities that need to be improved first; (3) for the facilities at the 15 min level, the elderly service center, elderly activity center, and community service center are facilities that need to be improved first, and the elderly university also needs to be expanded. Based on the analysis of the facility utilization characteristics of different types of elderly people, in terms of indicator-type service facilities, middle-aged elderly people have a higher demand for elderly day care centers, community restaurants/elderly canteens, and elderly service centers; elderly people with weak mobility have a high demand for the use of elderly service centers, elderly activity centers, and health service centers/community hospitals; healthy elderly people have a higher demand for health service centers/community hospitals; and elderly people with severe chronic diseases have a higher need for community canteens/elderly restaurants and health service centers/community hospitals.

4.2. The Impact of Elderly Needs Characteristics on Urban Development

4.2.1. The Facility Needs of the Elderly and Its Impact on Daily Living Behaviors

The needs of the elderly for facilities not only affect their physical health but also their mental well-being, social participation, and overall quality of life. It is generally believed that if a more comprehensive service facility environment can be provided for the elderly, it can enhance their social participation, health, self-efficacy, and safety, while also reducing certain economic burdens on the elderly and their families.
The independence and self-efficacy of the elderly are frequently discussed issues in the development of elderly-friendly societies. As society has evolved, elderly care services have moved beyond merely providing basic needs for food, shelter, and transportation. On this foundation, it is also necessary to provide the elderly with a more dignified living environment. Providing the elderly with essential facilities such as senior service centers, activity centers for the elderly, and community canteens can enhance their self-efficacy, instilling confidence in their abilities and improving their independence. This may encourage them to participate more actively in social and community activities. Increased social activities for the elderly can better reduce their “sense of social loneliness”, which is crucial for their psychological health and emotional well-being. This study also found that there is a significant difference between the facility needs of elderly people aged 70–79 and those of younger elderly people, making the elderly in this age group more similar to those over 80 in terms of facility usage. However, it should be pointed out that the average life expectancy in China has reached 78.6 years, and not all elderly people over 70 are in the late stages of life; they should have better participation in social activities.
In addition, constructing more convenient medical facilities and services, such as community hospitals with chronic disease treatment capabilities (e.g., dialysis, geriatric respiratory diseases) and rehabilitation centers, helps the elderly to obtain the necessary medical services in a timely manner, thereby maintaining and improving their health conditions and preventing community hospitals from becoming mere prescription dispensaries. Lastly, the availability and affordability of facilities also affect the elderly’s demand–use behavior. Currently, the cost of using some commercial facilities is too high compared to the pensions of the elderly, which limits their use of these services (with barber shops and convenience stores being the most obvious). Providing a more graduated range of living service facilities can better enhance the quality of life for the elderly.

4.2.2. The Potential for Improved Elderly Needs Satisfaction through the Optimized Design of Service Facilities

This study found that there is a significant difference in the use of community service facilities among different age groups of the elderly. This paper divides the elderly into three age groups, representing several representative stages of the later life of the elderly. Elderly people in their 60s are basically not much different from middle-aged people in their current life. Except for the elderly with significantly poor health, other elderly people can even be considered as “middle-aged people who do not have to work” and, with the revision of China’s retirement policy, the retirement age for future populations will be postponed to 65 years old. People in their 70s are at a stage where their physical fitness begins to decline gradually. It is also in this age group that the physical condition of the elderly undergoes noticeable “rapid aging”. People in their 80s are elderly groups who have exceeded the average life expectancy of the Chinese population, and their physical functions, social activity participation, and so on are distinctly different from other groups. These differences have led to a lack of targeted populations in traditional elderly service facilities. How to consider the vitality and independence of the elderly, their ability and desire to participate in social activities, family responsibilities, and the diversity of interest services is a key point for further optimizing the construction of elderly service facilities in the future.
From this, we can consider that the construction of scientific community service facilities should be sustainable and adaptable to all age groups. The following points should be considered: (1) service content design: community service facilities will need to be redesigned in the future to meet the needs of people across different age groups. Based on this demand, the service content of the facilities should consider the elderly groups that are suitable for participation, such as community service centers and community activity centers, which can take more into account the younger elderly population. (2) Community participation: younger elderly individuals should be encouraged to participate in the planning and management of community service facilities. They have more free time and relatively abundant energy, and at the same time, they share certain similarities with the elderly population that can help facilities better meet their needs. (3) Economic sustainability: the younger elderly population is more willing to pay for high-quality services; however, traditional elderly service facilities are designed for the older elderly, who are the group with the least desire to use commercial service facilities. Therefore, in the design, some community service facilities should not be limited to their own communities. They should adopt more commercial and lifestyle thinking and carry out planning and design that crosses communities and even administrative regions.

4.3. Optimization Strategies for Community Elderly Care Service Facilities

In the life circle theory, the planning principles for elderly care service facilities include (1) full-service coverage, (2) system integrity, (3) differentiated configuration, and (4) resident participation. Through these measures, it can be ensured that within the accessible range, the elderly have an adequate number of service facilities, a rich variety of types, and a reasonable distribution. Based on the life circle theory and the findings we put forward in Section 4.1, we took two adjacent communities as examples to carry out an optimized design for their elderly service facilities. A satellite image of the communities is shown in Figure 18.

4.3.1. The Quantity of Facilities

(1) Full Coverage of Basic Facilities.
The existence of facilities within the 15 min life circle but with a very low coverage rate indicates that the elderly have a very high demand for certain types of facilities. The first step is to identify the uncovered areas of the community as the service scope to ensure that basic guaranteed service facilities are provided to meet the basic living needs of the elderly. Taking the community service center in Community A as an example, as shown in Figure 19, although there is a community service center within the community, the coverage is very limited and cannot meet the actual usage needs. At the same time, the elderly have a high willingness to demand. Therefore, it is appropriate to increase the number of facilities to cover the entire community. In terms of specific configuration methods, all types of facilities that are lacking can be considered in conjunction with the life circle layer to reduce the cost of new facilities and strive to put the facilities into use as soon as possible.
(2) Appropriate Increase in the Number of Quality Improvement Facilities.
For quality improvement service facilities, it is not necessary to cover all communities. However, for communities with high demand, the number of facilities should be appropriately increased to provide full community coverage. Taking the elderly university in Community A as an example, as shown in Figure 20, there is an existing elderly university near the community, but the elderly in this area have a high demand for the elderly university, so the number of facilities should be appropriately increased. In terms of specific configuration, it is necessary to flexibly consider the characteristics of each facility and consider increasing the number through methods such as the transformation of commercial podium buildings.
(3) Build Corresponding Facilities based on the Characteristics of the Elderly.
The sustainable development of facilities requires long-term and stable use by the elderly, so it is necessary to have a clearer understanding of the physical conditions and behavioral characteristics of the elderly within the community in order to build facilities that are highly demanded by the elderly and meet the needs of the elderly in the area. For example, for the problem of older elderly people in the community who have difficulty eating, increasing the number and quality of elderly restaurants should be considered. In the case of a community with a larger number of younger elderly people, it would be appropriate to increase the number of elderly activity centers or elderly universities to enrich the daily lives of the elderly.

4.3.2. The Spatial Layout of Facilities

(1) Cross-community Layout for Elderly Care Service Facilities.
When planning community elderly care service facilities, it is necessary to break the geographical boundaries of the community and consider the overall space of the facilities as a whole area. For the actual living domain of the elderly, the configuration requirements of the service facilities should be clarified during the planning phase. This includes developing a unified planning layout, reasonable allocation of the service range of the facilities, and ensuring the overall density and spacing of the facilities. Taking the community canteen/elderly restaurant between Community A and Community B as an example (Figure 21), the coverage of this facility for both communities is less than 70%, but there is a significant demand for use by the elderly. If a new community canteen is simply built within a single community, it may fail to cover all communities and residential buildings in the area. Therefore, facility planning needs to be carried out on a larger scale. For example, a community canteen could be constructed between the communities, ensuring that the service radius of the facility can fully cover both communities while maintaining an appropriate distance from each community.
(2) Reserve for Development Needs.
Implementing the construction plan of the community living circle from the very beginning of the community establishment can effectively meet the needs of the elderly within the community. For newly built communities, although the aging population situation may not be apparent for the time being, as time progresses and the social population structure changes, there will be an increasing need for community elderly care service facilities. Therefore, during the planning phase, it is important to reserve land and space for elderly care service facilities in advance. When the elderly have needs, these facilities can be quickly constructed to meet the needs of an aging community.

4.3.3. The Quality of Facilities

(1) Expansion and Upgrading of Facilities with Insufficient Scale.
In the case of insufficient facility scale, the possibility of facility renovation and expansion should be considered, space allocated reasonably, and the areas and buildings with extremely low usage frequency reduced. Business formats should be arranged sensibly to avoid the simultaneous mixed use of a single space. In construction, when the area is small, it should be ensured that the facility is “compact and exquisite”. When there is a possibility to expand the facility area, the function of the facility should be “spacious and comprehensive”, where possible, to serve a wider range of elderly people.
(2) Increasing Guidance on Facility Service Level.
For the poor service situation in the facilities, it is necessary to strengthen the guidance on the facilities from the policy aspect and promote and spread high-quality services so that they can serve more elderly people. Especially when the elderly have a strong demand for such facilities, the community also needs to train service personnel to provide better-quality services. Regarding service items, appropriately reducing the content of services and focusing on the specificity of services can improve elderly satisfaction.

4.3.4. Service Management

(1) Supervise Indicator-Type Service Facilities.
For activity-based facilities, it is recommended to keep statistics on their business hours and the number of elderly people who visit each day, encourage the organization of various activities to enrich the lives of the elderly, conduct regular mutual evaluations and scoring, and quantify the results with accountability. For service-based facilities, it is suggested to adjust from a performance perspective, actively collect information on facility services, promptly resolve usage issues, and regularly conduct training and evaluation scoring. Facilities that meet standards and receive good reviews should be given certain subsidies or policy honors to ensure the facilities are controllable and adjustable.
(2) Standardize and Guide Commercial Service Facilities.
As commercial service facilities, which are relatively numerous in the community, are more influenced by market mechanisms, they should also be guided by the community to some extent. When constructing and updating facilities, it is important to guide appropriately, advocate for commercial facilities to adjust to the types and spaces of services that elderly people need most, standardize various details of facility services, and create high-quality elderly care service facilities.
(3) Provide Subsidies for Elderly Service Prices.
For facilities that the elderly view as having excessively high prices, or the community elderly care service facilities that the elderly need most, such as pharmacies, it is suggested that subsidies can be provided for elderly people with low income levels or excessive daily medication expenses, while controlling the prices of pharmaceutical facilities to enable the elderly to better enjoy the services of the facilities.

5. Conclusions

At present, China is the country with the largest population in the world. The post-World War II baby boom has made the issue of an aging society in China increasingly severe. With the development of urbanization, the aging problem in cities is particularly prominent. Due to Chinese traditional culture and family concepts, most elderly people prefer to age in place. Therefore, there is a need for communities to adapt to the living needs of the elderly and provide more comfortable and targeted elderly care service facilities. However, the current community construction is mainly based on the “indicators per thousand people”, which does not specifically consider the special needs of the elderly population. This study is based on the life circle theory and, through the method of questionnaire survey, it studied the current situation of community service facilities and the needs of the elderly and analyzed the spatial characteristics of community elderly care service facilities and characteristics of facility utilization in elderly life. The current status of the use of community elderly care service facilities was analyzed and studied, and the planning strategy of community elderly care service facilities has been summarized.
The following conclusions were reached: (1) there are current problems with the insufficient quantity and uneven spatial distribution of urban community elderly care service facilities in Xi’an. This includes construction issues such as fewer facilities, facilities far from home, and small area sizes, as well as management problems such as low service levels and poor management. (2) When the characteristics of facility utilization by the elderly were summarized based on age, mobility, and chronic disease conditions, it was found that middle-aged elderly people have a higher demand for elderly day care centers, community canteens/elderly canteens, and elderly service centers; elderly people with weak mobility have a high demand for elderly service centers, elderly activity centers, and health service centers/community hospitals; healthy elderly people have a higher demand for health service centers/community hospitals; and elderly people with severe chronic diseases have a higher need for community canteens/elderly canteens and health service centers/community hospitals. (3) According to the characteristics of elderly facility usage, facilities at different levels were classified and studied. Among them, the 5 min level facilities, including elderly service stations and community service stations, are those with dissatisfaction and severe shortages, while elderly day care centers need to be promoted and constructed based on existing construction experience; at the 10 min level, community canteens/elderly canteens and elderly activity stations are facilities that need to be improved and promoted first; at the 15 min level, elderly service centers, elderly activity centers, and community service centers need to be improved and promoted as soon as possible. The elderly university needs large-scale construction and expansion.
This study proposes targeted construction and optimization methods for the planning principles of elderly care service facilities under the guidance of community life circles. In terms of increasing the number of community elderly care service facilities, the recommendations including ensuring full coverage of basic guarantee facilities, appropriately increasing the number of quality improvement facilities, and adding corresponding facilities according to the characteristics of the elderly. To improve the layout of community elderly care service facilities, it is advised to unify the layout of the community elderly care service facility environment, carry out spatial replacement for facilities with poor locations, and reserve the location of elderly care service facilities in new construction areas. To improve the quality of community elderly care service facilities, the study suggests expanding and upgrading facilities with insufficient scale, increasing guidance on the service level of facilities, and promoting the improvement of communities that are difficult to transform via conventional methods through partial urban renewal. Regarding the management of community elderly care service facilities, it is recommended to supervise and urge compliance with standards for indicator-based service facilities, guide commercialized service facilities in a standardized manner, and appropriately subsidize the service prices for the elderly.
The Chinese government’s “14th Five-Year Plan” for the Development of National Aging Affairs and the Elderly Care Service System Planning proposes that the compliance rate of elderly care service facilities in new urban areas should reach 100%. This indicates that service facilities should be extensively covered to ensure that all elderly people can receive the services they need. The community service facility optimization design method proposed in this study integrates four aspects: the quantity of facilities, the spatial layout of facilities, the quality of facilities, and service management. The plan involves service quality, the efficiency of facility utilization, basic guarantees for the elderly population, and the feasibility of community participation, which can achieve more targeted services for the elderly without changing the current basic construction model of community service facilities. At the same time, considering the coverage rate would also reduce the vacancy rate of facilities and the risk of over-provision.

6. Limitations

As some elderly people are sensitive about their age, even though the questionnaire in this study includes detailed age information, the actual outcomes only categorize the elderly by “age groups.” Additionally, during the research, our team only administered random questionnaires to elderly individuals encountered outside; however, many seniors prefer not to participate in outdoor activities. As a result, the study’s statistics on the demand for facilities may be slightly underestimated, while the reported satisfaction with facilities might be slightly overestimated compared to the real situation. In the future, more precise age data and a broader distribution of the survey population may lead to the development of a more accurate model for assessing the demand for elderly facilities.

Author Contributions

Conceptualization, Y.Y.; methodology, Y.Y. and D.Z.; investigation, C.L.; writing—original draft preparation, Y.Y. and C.L.; writing—review and editing, Y.Y. and D.Z.; visualization, Y.Y. and C.L.; project administration, D.Z.; funding acquisition, D.Z. All authors have read and agreed to the published version of the manuscript.

Funding

This research is funded by the Shaanxi Land Construction-Xi’an Jiaotong University Land Engineering and Human Settlements Technology Innovation Center Open Fund (No.: 201912131-A5).

Data Availability Statement

We confirm that the data and figures provided in the manuscript are sufficient to support the relevant conclusions of the paper, and no additional research data is required.

Conflicts of Interest

Author Yujun Yang and Dian Zhou were employed by Xi’an Jiaotong University and author Chenxi Li wad emplyed by China Railway First Survey and Design Institute Group Co., Ltd. The remaining authors declare that the research was conducted in the absence of any commercial or financial relationships that could be construed as a potential conflict of interest.

Appendix A

Questionnaire on the utilization of facilities for the elderly.
This questionnaire is filled out anonymously, and the data obtained will only be used for research and study purposes. Thank you for your support and cooperation!
  • Your gender is: ○ male/○ female
  • Your age is: _year
  • Your community is: _village
  • Who do you live with? (Type in the conforming box)
GrandchildrenSons and DaughtersMan and WifeElder Member of a FamilyBe on One’s Own
 
5.
Do you suffer from the following diseases?
hypertension
diabetes mellitus
asthma
Cardiac and cerebrovascular diseases (coronary heart disease, cerebral infarction, cerebral atrophy, cerebral hemorrhage, etc.)
Stomach disease (chronic gastritis, gastric ulcer, etc.)
Chronic lung disease (bronchitis, emphysema, etc.)
therioma
Cataract/glaucoma
Reproductive system diseases
Ostearthropathy (rheumatism, arthritis, disc disease, etc.)
other diseases
was free from any disease
6.
How good is your mobility?
was perfectly normal
The legs and feet are not very flexible
Action is very difficult
A wheelchair is required to travel
7.
Are there any old service facilities or community pension-related public service facilities around your community? If not, do you need/if so, do you use it, is the reason you do not use it?
Facility NameNo and No NeedNo But NeedHave But Do Not UseHave and UseThe Reason
Senior activity center/station
Community canteen/restaurant for the elderly
Senior service center/station
Day-care centers for the elderly
College teaching sites for the elderly
Health service center/station/community hospital
Community service center/station
(Note: Reasons for not using: A person does not need, B facility is far away from home, C facility room is small, D service level is low, E management is not in place, and F price is high).
8.
For the following old service facilities and public service facilities related to community pension, what is your use and satisfaction? What do you think is the current problem of the facilities?
InstallationSenior Activity Center/StationCommunity Canteen/Restaurant for the ElderlySenior Service Center/StationDay-Care Centers for the ElderlyCollege Teaching Sites for the ElderlyHealth Service Center/Station/Community HospitalCommunity Service Center/Station
satisfaction
The status of the problem
walking time
Walking experience
operating frequency
service time
Room size
(Note: Satisfaction; A is very dissatisfied, B is relatively dissatisfied, C is general, D is relatively satisfied, E is very satisfied; Current problems: the number of A facilities is small, B facilities is far away from home, C facilities room is small, D service level is low, E management is not in place, F price is high; walking time: A. Within 5 min, the B. For 5–10 min, and for C. For 10–15 min, and for D. For 15–30 min, and for E. More than 30 min. Walking experience: A. Too long a time is unbearable, B. Long time is tolerable, C. The right time is more convenient; Frequency of use: A. Once or more daily, and B. Two and three times a week, and C. Once a week, and D. 2 times and 3 times per month, E. Once a month or less; Usage time: A. Within 5 min, the B. For 5–15 min, and for C. For 15–30 min, and for D. 30 min–1 h, and E. More than 1 h; Room size: A. Is more crowded, and B. size to fit, C. More empty).
9.
Do you use the following community pension related life service facilities, do you use them or do them for your children? What is your satisfaction? Do you think of the current problem of the facilities? What other personalized facilities do you need/often use (TCM clinic/health massage/)?
RespectBankPharmacy/Pharmaceutical SalesVegetable marketSupermarketConvenient StoreCatering 2. Food & BeverageBeauty Hair
Whether to use
Satisfaction score
operating frequency
service time
The status of the problem
(Note: whether to use: A has no and do not need, B has no but need, C has but do not use, D has and use, E children for the wo).

References

  1. National Bureau of Statistics. The Seventh National Population Census Bulletin, Population Age Structure. Available online: http://www.stats.gov.cn/sj/tjgb/rkpcgb/qgrkpcgb/202302/t20230206_1902005.html (accessed on 11 May 2021).
  2. State Council. Notice of the State Council on Issuing the “14th Five-Year Plan” for the Development of Aging Affairs and the Elderly Care Service System. Available online: http://www.gov.cn/zhengce/content/2022-02/21/content_5674844.htm (accessed on 21 February 2022).
  3. Xu, M.; Zhao, Y.; You, J.; Wang, B.Y.; Li, Z. Preference and Influencing Factors of Community Home-based Elderly Care in Community-living Elderly People in Nanning. Chin. Gen. Pract. 2020, 23, 2328–2334. (In Chinese) [Google Scholar] [CrossRef]
  4. GB 50180—2018; Urban Residential Area Planning and Design Standard. Architecture & Building Press: Beijing, China, 2018. Available online: https://www.chinesestandard.net/PDF/English.aspx/GB50180-2018 (accessed on 19 September 2024).
  5. Huang, J.; Zhang, R.; Hu, G. Research on the Daily Life Circle of the Elderly Based on Spatiotemporal Behavior—Spatial Identification and Feature Analysis. Urban Plan. Forum 2019, 87–95. (In Chinese) [Google Scholar] [CrossRef]
  6. Department of Circulation Development. Notice of the General Office of the Ministry of Commerce and 11 Other Departments on Issuing the “Urban 15-Minute Convenience Life Circle Construction Guide”. Available online: http://www.mofcom.gov.cn/article/h/redht/202107/20210703179512.shtml (accessed on 20 July 2021).
  7. Ministry of Natural Resources of the People’s Republic of China. Technical Guidelines for Community Life Circle Planning: TD/T 1062-2021. 2021. Available online: http://www.nrsis.org.cn/portal/stdDetail/240432 (accessed on 19 September 2024).
  8. Office of the Ministry of Housing and Urban-Rural Development. Notice of the Office of the Ministry of Housing and Urban-Rural Development on Issuing the Guide for the Construction of Complete Residential Communities. Available online: https://www.gov.cn/zhengce/zhengceku/2022-01/12/content_5667815.htm (accessed on 17 December 2021).
  9. Liu, Q.; Qian, Z.; Huang, D.; Zhou, X. Spatial pattern evolution characteristics and trends of 15 min9ute living circle. J. Urban Plan. 2020, 6, 94–101. (In Chinese) [Google Scholar]
  10. Xiao, Z.; Chai, Y.; Zhang, Y. Review of the Progress in Research and Practice of Life Circle Planning at Home and Abroad. Planner 2014, 30, 89–95. (In Chinese) [Google Scholar]
  11. Li, Y.; Chai, Y.; Ta, N. From Disaster Prevention Life Circle to Safe Life Circle: Japanese Experience and Chinese Reflection. Int. Urban Plan. 2022, 37, 113–120. (In Chinese) [Google Scholar] [CrossRef]
  12. Xiao, Z.; Han, L.; Chai, Y. Reflections on Integrating Life Circle Planning into National Spatial Planning. Planner 2022, 38, 145–151. (In Chinese) [Google Scholar]
  13. Da Silva, D.C.; King, D.A.; Lemar, S. Accessibility in Practice: 20-Minute City as a Sustainability Planning Goal. Sustainability 2019, 12, 129. [Google Scholar] [CrossRef]
  14. Moreno, C.; Allam, Z.; Chabaud, D.; Gall, C.; Pratlong, F. Introducing the “15-Minute City”: Sustainability, Resilience and Place Identity in Future Post-Pandemic Cities. Smart Cities 2021, 4, 93–111. [Google Scholar] [CrossRef]
  15. United Nations, Department of Economic and Social Affairs. World Population Ageing. 2017. Available online: https://www.un.org/development/desa/pd/content/world-population-ageing-2017 (accessed on 1 October 2017).
  16. Tang, X.; Zhou, Y. Community Renewal Strategy for Implementing on site Elderly Care: A Study of Naturally Formed Retirement Communities (NORC) in the United States. J. Archit. 2018, 2, 80–84. (In Chinese) [Google Scholar]
  17. Peng, Y.; Zhou, S.; Wen, P. German Multi Generational Mutual Aid Community Elderly Care Model and Its Implications. Shanghai Urban Plan 2021, 103–108. Available online: https://www.shplanning.com.cn/archive/detail/id/980.html (accessed on 4 August 2024). (In Chinese).
  18. Zhu, W.; Lin, Y. Construction of the “Medical Elderly Integration” Community Elderly Care Model in Japan and Its Implications for China: Based on the Perspective of Institutional Analysis. Southwest Financ. 2022, 1, 76–87. (In Chinese) [Google Scholar]
  19. Wiles, J.L.; Leibing, A.; Guberman, N.; Reeve, J.; Allen, R.E. The Meaning of “Aging in Place” to Older People. Gerontologist 2012, 52, 357–366. [Google Scholar] [CrossRef] [PubMed]
  20. Oswald, F.; Jopp, D.; Rott, C.; Wahl, H.W. Is Aging in Place a Resource for or Risk to Life Satisfaction? Gerontologist 2011, 51, 238–250. [Google Scholar] [CrossRef] [PubMed]
  21. Kerr, J.; Rosenberg, D.; Frank, L. The Role of the Built Environment in Healthy Aging. J. Plan. Lit. 2012, 27, 43–60. [Google Scholar] [CrossRef]
  22. Rosso, A.L.; Grubesic, T.H.; Auchincloss, A.H.; Tabb, L.P.; Michael, Y.L. Neighborhood Amenities and Mobility in Older Adults. Am. J. Epidemiol. 2013, 178, 761–769. [Google Scholar] [CrossRef]
  23. Curl, A.; Mason, P. Neighbourhood Perceptions and Older Adults’ Wellbeing: Does Walking Explain the Relationship in Deprived Urban Communities? Transp. Res. Part. A Policy Pract. 2019, 123, 119–129. [Google Scholar] [CrossRef]
  24. Apparicio, P.; Abdelmajid, M.; Riva, M.; Shearmur, R. Comparing Alternative Approaches to Measuring the Geographical Accessibility of Urban Health Services: Distance Types and Aggregation-error Issues. Int. J. Health Geogr. 2008, 7, 7. [Google Scholar] [CrossRef]
  25. Bauer, J.; Groneberg, D.A. Measuring Spatial Accessibility of Health Care Providers—Introduction of a Variable Distance Decay Function within the Floating Catchment Area (FCA) Method. PLoS ONE 2016, 11, e0159148. [Google Scholar] [CrossRef]
  26. Benevenuto, R.; Caulfield, B. Measuring Access to Urban Centres in Rural Northeast Brazil: A Spatial Accessibility Poverty Index. J. Transp. Geogr. 2020, 82, 102553. [Google Scholar] [CrossRef]
  27. Dadashpoor, H.; Rostami, F.; Alizadeh, B. Is Inequality in the Distribution of Urban Facilities Inequitable? Exploring a Method for Identifying Spatial Inequity in an Iranian City. Cities 2016, 52, 159–172. [Google Scholar] [CrossRef]
  28. Jang, S.; An, Y.; Yi, C.; Lee, S. Assessing the Spatial Equity of Seoul’s Public Transportation Using the Gini Coefficient Based on Its Accessibility. Int. J. Urban Sci. 2016, 21, 91–107. [Google Scholar] [CrossRef]
  29. Sharma, G.; Patil, G.R. Public Transit Accessibility Approach to Understand the Equity for Public Healthcare Services: A Case Study of Greater Mumbai. J. Transp. Geogr. 2021, 94, 103–123. [Google Scholar] [CrossRef]
  30. Lee, S. Spatial and Socioeconomic Inequalities in Accessibility to Healthcare Services in South Korea. Healthcare 2022, 10, 2049. [Google Scholar] [CrossRef] [PubMed]
  31. AHiggins, J. Comparative social policy. Q. J. Soc. Aff. 1986, 3, 90–91. [Google Scholar]
  32. Pinker, R. Making Sense of the Mixed Economy of Welfare. Soc. Policy Adm. 1992, 4, 273–284. [Google Scholar] [CrossRef]
  33. Shaw, W.S.; Patterson, T.L.; Semple, S.J.; Halpain, M.C.; Koch, W.L.; Harris, M.J.; Grant, I.; Jeste, D.V. Use of community support services by middle-aged and older patients with psychotic disorders. Psychiatr. Serv. 2000, 51, 506–512. [Google Scholar] [CrossRef]
  34. Sumini, S.; Sukamdi, E.; Pangaribowo, E.H.; Keban, Y.T.; Darwin, M.; Grosset, J.F. Elderly Care: A Study on Community Care Services in Sleman, DIY, Indonesia. J. Aging Res. 2020, 7, 3983290. [Google Scholar] [CrossRef]
  35. Wang, Y.H.; Hsu, N.W.; Huang, H.Y.; Tsai, C.C.; Pan, P.J. Effectiveness of a machine-assisted healthy physical fitness promotion program for community elderly. J. Chin. Med. Assoc. JCMA 2020, 83, 779–783. [Google Scholar] [CrossRef]
  36. Lin, H.R.; Otsubo, T.; Imanaka, Y. Survival analysis of increases in care needs associated with dementia and living alone among older long-term care service users in Japan. BMC Geriatr. 2017, 17, 182. [Google Scholar] [CrossRef]
  37. Hajek, A.; Lehnert, T.; Wegener, A.; Riedel-Heller, S.G.; König, H.H. Factors associated with preferences for long-term care settings in old age: Evidence from a population-based survey in Germany. BMC Health Serv. Res. 2017, 17, 156. [Google Scholar] [CrossRef]
  38. Madeira, T.; Peixoto-Plácido, C.; Sousa-Santos, N.; Santos, O.; Alarcão, V.; Nicola, P.J.; Lopes, C.; Gorjão, C.J. Geriatric Assessment of the Portuguese Population Aged 65 and Over Living in the Community: The PEN-3S Study. Acta Medica Port. 2020, 33, 475–482. [Google Scholar] [CrossRef]
  39. Joyce, S.; Berry, H.; Jorgensen, M.; Brett, L.; Georgiou, A.; McClean, T.; Westbrook, J. Social Participation Among Older Adults Receiving Community Care Services. J. Appl. Gerontol. Off. J. South. Gerontol. Soc. 2020, 40, 997–1007. [Google Scholar]
  40. Hee, J.K.; Park, J.; Ryu, S.Y. The effects of mental health on recurrent falls among elderly adults, based on Korean Community Health Survey data. Epidemiol. Health 2020, 42, e2020005. [Google Scholar]
  41. Doughty, K.; Williams, G. New models of assessment and prescription of smart assisted living technologies for personalised support of older and disabled people. J. Assist. Technol. 2016, 10, 39–50. [Google Scholar] [CrossRef]
  42. Ministry of Housing and Urban-Rural Development of the People’s Republic of China. Code for Design of Elderly Care Facilities: JGJ 450-2018. 2018. Available online: https://www.soujianzhu.cn/NormAndRules/NormContent.aspx?id=324 (accessed on 19 September 2024).
  43. Ministry of Housing and Urban-Rural Development of the People’s Republic of China. Urban Planning Standards for the Elderly Facilities: GB 50437-2007. 2018. Available online: https://www.soujianzhu.cn/NormAndRules/NormContent.aspx?id=376 (accessed on 19 September 2024).
  44. Xi’an Municipal Bureau of Statistics. Main Data Bulletin of the Seventh National Population Census in Xi’an. Available online: http://tjj.xa.gov.cn/rdzt/xapc/60b47af8f8fd1c0bdc2d59c0.html (accessed on 31 May 2021).
  45. General Office of Xi’an Municipal People’s Government. Notice on Issuing the Layout Plan of Elderly Care Service Facilities in Xi’an (2018–2030). Available online: https://www.xa.gov.cn/gk/zcfg/szbf/5d495b2765cbd87465b11025.html (accessed on 7 January 2019).
  46. Survey Center of Xi’an Municipal Bureau of Statistics. Survey Report on the Living Conditions and Elderly Care Status of Elderly People in Xi’an City. Available online: http://tjj.xa.gov.cn/tjsj/tjxx/619e21e3f8fd1c0bdc6da63f.html (accessed on 24 November 2021).
Figure 1. Research community.
Buildings 14 03003 g001
Figure 2. Overview of the research area.
Buildings 14 03003 g002
Figure 3. Basic information of the survey.
Buildings 14 03003 g003
Figure 4. Use frequency of community service facilities.
Buildings 14 03003 g004
Figure 5. Use frequency of facilities specialized in serving the elderly.
Buildings 14 03003 g005
Figure 6. Current problems of facilities.
Buildings 14 03003 g006
Figure 7. The use of and demand for community elderly care service facilities.
Buildings 14 03003 g007
Figure 8. Ranking of the utilization weight for community elderly care service facilities.
Buildings 14 03003 g008
Figure 9. Ranking of the lack weight for community elderly care service facilities.
Buildings 14 03003 g009
Figure 10. Cluster tree diagram of utilization degree of community elderly care service facilities.
Buildings 14 03003 g010
Figure 11. Ranking of satisfaction with the utilization of elderly care service facilities.
Buildings 14 03003 g011
Figure 12. Demand for indicator service facilities across different age groups.
Buildings 14 03003 g012
Figure 13. Proportion of facility usage by different age groups.
Buildings 14 03003 g013
Figure 14. Demand for commercial service facilities across different age groups.
Buildings 14 03003 g014
Figure 15. Correlation between the health conditions and demand for indicator service facilities.
Buildings 14 03003 g015
Figure 16. Correlation between the number of health conditions and demand for commercial service facilities.
Buildings 14 03003 g016
Figure 17. Four-quadrant chart of lack weight and satisfaction.
Buildings 14 03003 g017
Figure 18. Location of study case.
Buildings 14 03003 g018
Figure 19. Location and service coverage of community service centers in community A.
Buildings 14 03003 g019
Figure 20. Location and service coverage of elderly university in community A.
Buildings 14 03003 g020
Figure 21. Location and service coverage of community canteen in community A and B.
Buildings 14 03003 g021
Table 1. Research content and corresponding methods.
Research ContentMethodEvaluation Indicators
Demand Characteristics of Elderly Care Service FacilitiesQuestionnaire
Utilization and Lack Weight of Elderly Care Service FacilitiesQuestionnaire
Cluster Analysis
The Utilization Weight and
Lack Weight of Facilities
Satisfaction with the Utilization of Elderly Care Service Facilities Satisfaction Rating
Demand Characteristics of Facilities among Different Types of Elderly Proportion of Need and Usage.
Table 2. Percentage of demand for indicator service facilities across different age groups.
Age GroupElderly Day Care CenterCommunity CanteenElderly
Service Center
Elderly
Activity Center
Elderly UniversityCommunity Service CenterHealth Service Center
60 to 69 years old24.56%36.84%35.09%47.37%33.33%52.63%43.86%
70 to 79 years old43.04%55.70%44.30%50.63%35.44%51.90%40.51%
80 years old and above31.65%45.57%35.44%50.63%15.19%43.04%35.44%
Table 3. Number of elderly service facilities used by people across different age groups.
Age GroupNot Using FacilitiesUsing One
Type of Facility
Use Two or More
Types of Facilities
Total
60 to 69 years old45 (78.90%)8 (14.00%)4 (7.00%)57 (100.00%)
70 to 79 years old47 (59.50%)22 (27.80%)10 (12.70%)79 (100.00%)
80 years old and above54 (68.40%)18 (22.80%)7 (8.90%)79 (100.00%)
Entire Sample146 (67.90%)48 (22.30%)21 (9.80%)215 (100.00%)
Table 4. Percentage of demand for commercial service facilities used by people across different age groups.
Age GroupConvenience
Store
Vegetable
Market
SupermarketRestaurantBarber
Shop
PharmacyBank
60 to 69 years old73.68%91.23%84.21%52.63%80.70%85.96%91.23%
70 to 79 years old62.03%79.75%82.28%55.70%77.22%87.34%87.34%
80 years old and above48.10%69.62%73.42%37.97%70.89%69.62%70.89%
Entire Sample60.00%79.07%79.53%48.37%75.81%80.47%82.33%
Table 5. Percentage of demand for indicator service facilities used by people with different levels of activity capacity.
Activity CapacityElderly Day Care CenterCommunity CanteenElderly
Service Center
Elderly
Activity Center
Elderly UniversityCommunity Service CenterHealth Service Center
Normal25.49%41.18%31.37%50.00%29.41%46.08%39.22%
Slightly Limited Mobility42.50%53.75%43.75%47.50%26.25%51.25%35.00%
Very Limited Mobility40.63%50.00%50.00%56.25%25.00%53.13%53.13%
Entire Sample33.95%46.98%38.60%49.77%27.44%48.84%39.53%
Table 6. Number of elderly service facilities used by people with different levels of activity capacity.
Activity CapacityNot Using FacilitiesUsing One
Type of Facility
Use Two or More
Types of Facilities
Total
Normal74 (72.50%)19 (18.60%)9 (8.80%)102 (100.00%)
Slightly Limited Mobility52 (65.00%)19 (23.80%)9 (11.30%)80 (100.00%)
Very Limited Mobility19 (59.40%)10 (31.30%)3 (9.40%)32 (100.00%)
Entire Sample146 (67.90%)48 (22.30%)21 (9.80%)214 (100.00%)
Table 7. Percentage of demand for commercial service facilities used by people with different levels of activity capacity.
Activity CapacityConvenience
Store
Vegetable
Market
SupermarketRestaurantBarber
Shop
PharmacyBank
Normal59.80%87.25%82.35%51.96%77.45%85.29%90.20%
Slightly Limited Mobility70.00%78.75%85.00%47.50%76.25%85.00%85.00%
Very Limited Mobility37.50%56.25%59.38%40.63%68.75%56.25%53.13%
Entire Sample60.00%79.07%79.53%48.37%75.81%80.47%82.33%
Table 8. Percentage of demand for indicator service facilities used by people with different numbers of chronic diseases.
Chronic DiseasesElderly Day Care CenterCommunity CanteenElderly
Service Center
Elderly
Activity Center
Elderly UniversityCommunity Service CenterHealth Service Center
Healthy8.33%45.83%25.00%70.83%25.00%41.67%45.83%
One Disease38.89%41.11%38.89%41.11%28.89%50.00%37.78%
Two Diseases37.50%50.00%40.63%53.13%23.44%51.56%34.38%
Three or More Diseases32.43%56.76%43.24%51.35%32.43%45.95%48.65%
Entire Sample33.95%46.98%38.60%49.77%27.44%48.84%39.53%
Table 9. Number of elderly service facilities used by people with different numbers of chronic diseases.
Chronic DiseasesNot Using FacilitiesUsing One
Type of Facility
Use Two or More
Types of Facilities
Total
Healthy17 (70.80%)7 (29.20%)0 (0.00%)24 (100.00%)
One Disease63 (70.00%)18 (20.00%)9 (10.00%)90 (100.00%)
Two Diseases40 (62.50%)16 (25.00%)8 (12.50%)64 (100.00%)
Three or More Diseases26 (70.30%)7 (18.90%)4 (10.80%)37 (100.00%)
Entire Sample146 (67.90%)48 (22.30%)21 (9.80%)215 (100.00%)
Table 10. Percentage of demand for commercial service facilities of different chronic diseases.
Chronic DiseasesConvenience
Store
Vegetable
Market
SupermarketBarber
Shop
PharmacyBank
Healthy87.50%91.67%83.33%87.50%87.50%91.67%
One Disease63.33%83.33%80.00%72.22%84.44%85.56%
Two Diseases51.56%71.88%81.25%76.56%79.69%84.38%
Three or More Diseases48.65%72.97%72.97%75.68%67.57%64.86%
Entire Sample60.00%79.07%79.53%75.81%80.47%82.33%
Disclaimer/Publisher’s Note: The statements, opinions and data contained in all publications are solely those of the individual author(s) and contributor(s) and not of MDPI and/or the editor(s). MDPI and/or the editor(s) disclaim responsibility for any injury to people or property resulting from any ideas, methods, instructions or products referred to in the content.

