Abstract
This study investigates the corrosion performance of reinforced steel in concrete subjected to carbonation and chloride ingress. Four systems were examined: normal concrete (NC15), chloride-exposed (ClC15), carbonated (COC15), and chloride-exposed carbonated concrete (COClC15). A comprehensive assessment was carried out using electrochemical testing, gravimetric weight loss, chloride profiling, Temkin adsorption isotherm modeling, and SEM analysis. Electrochemical results showed a marked increase in corrosion activity under combined chloride–carbonation exposure. The highest corrosion current density (icorr) was obtained in COClC15 (0.4779 µA/cm2), compared with only 0.0106 µA/cm2 for NC15. Gravimetric analysis confirmed these findings, with COClC15 exhibiting a corrosion rate nearly 1.5 times greater than ClC15 and 52 times higher than NC15 after 120 days. Chloride profiling revealed reduced binding efficiency in carbonated concrete; at 5 mm depth, COClC15 bound only 0.06% chloride, while ClC15 retained 0.43%. The Temkin adsorption isotherm further quantified the weakened binding capacity. The binding coefficient (β) of COClC15 was considerably lower than ClC15 and NC15, reflecting the impact of C–S–H decalcification and aluminate phase transformation into carboaluminates, which restrict Friedel’s salt formation. SEM micrographs corroborated these observations, showing extensive microstructural degradation in COClC15. This study revealed that the synergy of carbonation and chloride ingress reduces chloride-binding capacity, accelerates depassivation, and severely compromises the durability of reinforced concrete in aggressive environments.
1. Introduction
Reinforced concrete is an extensively used construction material due to its structural stability, high compressive strength, and relatively low production cost. However, its long-term durability is frequently challenged by the corrosion of reinforcing steel, particularly when exposed to aggressive environmental conditions. The corrosion of reinforcing steel shortens service life, compromises structural integrity, and leads to significant maintenance and repair costs. On a global scale, the economic impact of corrosion on infrastructure—including bridges, buildings, dams, and marine facilities—is substantial, accounting for an estimated 3–4% of the GDP of developed countries [1,2,3,4,5].
The reinforcing steel corrosion in concrete is predominantly governed by two mechanisms: carbonation and chloride ingress [3,6,7,8]. Chloride-induced corrosion is most prevalent in marine environments and regions where deicing salts are applied, while carbonation varies in severity depending on environmental exposure conditions. For instance, concrete structures situated in seawater or splash zones are primarily affected by chloride attack, since the high relative humidity in such regions inhibits carbonation. As a result, the simultaneous action of carbonation and chloride ingress is uncommon in submerged or splash-zone environments. Conversely, in marine atmospheric zones where both carbon dioxide and chloride ions are present, their combined effect can significantly accelerate steel rebar depassivation [9]. Because when chloride ions penetrate the concrete matrix under highly alkaline pore solution conditions (pH > 12.5), they react with aluminate phases of the hydrated cement, particularly tricalcium aluminate (C3A), to form Friedel’s salt (3CaO Al2O3 CaCl2·10H2O). This reaction acts as a chloride-binding mechanism, which temporarily lowers the amount of free chlorides present in the pore solution [10,11]. However, as carbonation advances, calcium hydroxide is consumed and calcium silicate hydrate (C–S–H) undergoes decalcification, leading to a reduction in pore solution pH [12]. This decline in alkalinity destabilizes Friedel’s salt, resulting in its decomposition and the liberation of chloride ions back into the pore solution [13,14]. Consequently, carbonation not only diminishes the chloride-binding capacity of the cement matrix but also increases chloride mobility, thereby accelerating the passive film deterioration and initiating corrosion in reinforced steel. Hence, investigating the redistribution of chlorides under carbonation is essential for understanding corrosion risks [6,15,16,17,18,19].
Previous research on corrosion of reinforcing steel in concrete has largely focused on the effects of either chloride ingress [20,21,22] or carbonation in isolation [4,20,23,24]. While some experimental and modeling studies have examined their combined influence, these are mostly limited to simulated pore solutions rather than real concrete systems, where carbonation progresses by diffusion and alters chloride-binding mechanisms [6,13,18,19,25,26,27,28,29,30]. Further, a few studies have addressed the quantification of bound chlorides and reinforcing steel corrosion under the coupled influence of carbonation and chloride ingress [15,17,31,32,33], and systematic comparative evaluations with non-carbonated concrete remain lacking.
In this work, the corrosion performance of reinforcing steel rebars and chloride-binding behavior in concrete were systematically studied under different exposure conditions. Four systems were considered: normal concrete (NC15), chloride-exposed concrete (ClC15), carbonated concrete (COC15), and chloride-exposed carbonated concrete (COClC15), over 120 days of exposure. Corrosion rates were assessed using electrochemical and gravimetric techniques. Free and total chloride contents were determined through leaching and acid-soluble methods, with bound chloride calculated as their difference. The Temkin adsorption isotherm was applied to estimate chloride binding coefficients in both carbonated and non-carbonated systems. Furthermore, microstructural changes induced by the combined deterioration process were examined using scanning electron microscopy (SEM).
2. Materials and Methods
2.1. Materials Used
In this investigation, Type I Ordinary Portland Cement (OPC) conforming to KS L 5201-2016 [34] was procured from Sunshin Company, Seoul, South Korea. The chemical composition of OPC was examined with an X-ray fluorescence spectrometer (XRF, ZSX Primus IV, Tokyo, Japan), and the results are presented in Table 1. Coarse aggregates within the 6–10 mm range and fine aggregates passing through a 2.36 mm sieve were utilized, both satisfying the specification of KS F 2526:2007 [35].

Table 1.
Chemical composition of OPC.
Thermo-mechanically treated (TMT) steel reinforcement bars were employed, having the following chemical composition (wt.%): 0.024 P, 0.193 C, 0.125 Cr, 0.080 S, 0.125 Cu, 0.281 Si, 0.540 Mn, and 98.632 Fe. Steel rebars with a diameter of 10 mm were cut into 200 mm lengths. Prior to casting the reinforced concrete specimens, the rebar surfaces were cleaned to remove oxide layers by immersion in a pickling solution, following ASTM G1-03, for 3–5 min [36]. Subsequently, the steel rebars were carefully rinsed with distilled water, degreased using acetone, and dried at 40 °C. To prepare the specimens for electrochemical testing, a section of each steel bar was insulated with heat shrinkable silicon rubber tube, leaving 100 mm exposed length, (surface area of 31.4 cm2).
2.2. Casting of Concrete Specimens
In this study, concrete specimens shaped as rectangular prisms (200 × 100 × 100 mm3) were cast, each containing two parallel steel rebars placed at a cover depth of 15 mm. The concrete mix was proportioned to achieve a target strength of 25 N/mm2, with a ratio of 1:2.63:2.52 and a fixed water–cement ratio of 0.50. Details of the mix proportions are provided in Table 2. The concrete mix was poured into a mould in three layers, and each layer compacted with a vibrator, covered with plastic sheets to retain moisture, and stored at room temperature for 24 h, after which they were demoulded and cured in water at 25 ± 2 °C for 28 days.
Table 2.
Mix design used.
After curing for 28 days, the concrete specimens were dried and coated on four sides, leaving the bottom and top surfaces to ensure unidirectional penetration of chloride as well as CO2. The diagram and photographic images of the prepared concrete specimens are illustrated in Figure 1. For each exposure condition, three replicate specimens were prepared for comparison, resulting in a total of 4 × 3 (twelve) prismatic concrete specimens for the experimental program.
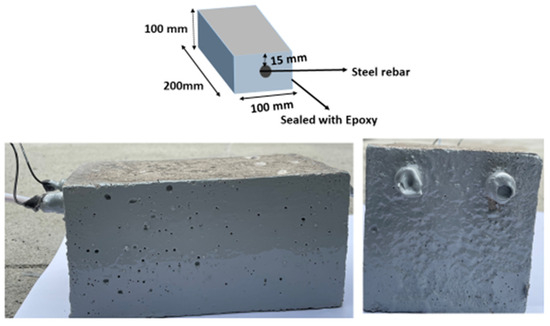
Figure 1.
Diagram and photographic image of the prepared concrete specimens.
2.3. Exposure Conditions
After coating, the prismatic concrete specimens were subjected to accelerated carbonation in a controlled chamber maintained at a CO2 concentration of 5 ± 3%, relative humidity of 60 ± 5%, and a temperature of 25 ± 2 °C. Specimens were removed at 7-day intervals, sectioned laterally, and the carbonation depth was determined. For this purpose, a 1% phenolphthalein indicator solution was sprayed on the freshly cut cross-sections. Areas exhibiting a pink coloration were identified as uncarbonated zones, while gray regions corresponded to carbonated concrete (Figure 2) [37]. The carbonation depth was measured using a vernier caliper after sufficient time was allowed for color development. Complete carbonation of the slurry specimens was observed at approximately 28 days; however, to ensure thorough carbonation, the exposure duration was extended by an additional 2 days. Under the given test conditions, the average carbonation depth of the specimens was determined to be 15 ± 2 mm. After carbonation, one set of concrete specimens was stored under laboratory conditions at a temperature of 25 ± 2 °C, while another set was exposed to a 3.5% NaCl solution. For comparison, non-carbonated concrete specimens were also subjected to identical exposure environments, namely 3.5% NaCl solution and laboratory conditions at 25 ± 2 °C. (The concrete specimens were exposed to continuous immersion in a 3.5 wt.% NaCl solution). The details exposure conditions are given in Table 3.
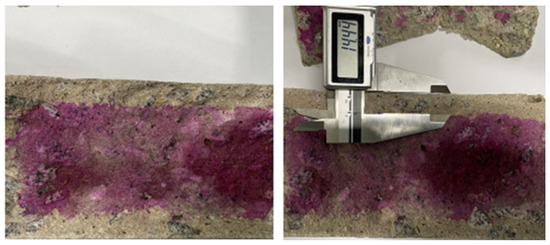
Figure 2.
Photographic image of the concrete specimens after carbonation conditions.
Table 3.
The concrete specimen exposure details.
2.4. Corrosion Studies
2.4.1. Electrochemical Studies
Electrochemical impedance spectroscopy (EIS) was performed at 1, 45, 90, and 120 days using a VersaSTAT potentiostat (Princeton Applied Research, Oak Ridge, TN, USA). EIS was carried out between a frequency range of 100 kHz to 0.01 Hz with an AC perturbation amplitude of 20 mV. For these tests, a surface-mounted electrode (SME) system was employed, comprising a stainless-steel plate with a centrally embedded SCE enclosed in a PVC body [38,39]. The SME was positioned on the concrete surface with a sponge layer placed between the electrode and the specimen. During measurements, the reinforcing steel, stainless steel and saturated calomel electrode (SCE), were connected as the working, counter and reference electrodes, respectively. The photograph image of the experimental set up is shown in Figure 3. To maintain proper ionic conductivity between the SME and the reinforcing steel, the sponge was moistened with a conductive gel (0.04 N of NaOH).
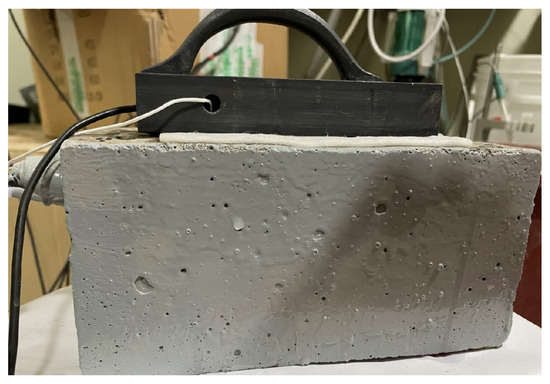
Figure 3.
Photographic image of the electrochemical experiment set up.
In addition, potentiodynamic polarization tests were conducted on embedded steel rebars after 120 days of exposure. The same three-electrode systems used for EIS measurements were applied. The potentiodynamic parameters, namely anodic Tafel slope (βa), cathodic Tafel slope (βc), corrosion potential (Ecorr) and corrosion current density (icorr), were obtained by analyzing the polarization curves in the Tafel region. The measurements were performed with a potential scan rate of 0.1 mV·s−1 over a range of ±100 mV with respect to the open-circuit potential. All electrochemical studies were carried out for all concrete specimens under laboratory conditions at 25 ± 2 °C. Each system was stabilized for 30 min at steady-state OCP before performing EIS and potentiodynamic polarization measurements. The corrosion rate was determined using the standard relation (Equation (1)):
where K = 3.27 × 10⁻³ is the unit constant for mmpy, icorr denotes the corrosion current density (µA cm−2). EW and D represent the equivalent weight (27.925 g mol−1) and density of the steel (7.86 g cm−3).
2.4.2. Gravimetric Weight Loss Methods
After 120 d of exposure period, the concrete specimens were broken to retrieve the reinforcing steel without causing damage. The steel rebars were visually inspected to evaluate the surface condition and corrosion products. The corrosion products were removed by immersing the reinforcing steel in a pickling solution for 3 min, followed by rinsing with distilled water and acetone, and then drying at 40 °C ± 2 °C for 6 h. The dried reinforcing steel was then weighed, and the weight loss was computed from the difference between initial and final weight. This weight loss was used to calculate the corrosion rate using Equation (2) [3]:
where Δw signifies the weight loss (mg), D represent the density (g cm−3) of the steel rebars (7.86 g cm−3) and A and t are area of the steel rebar and exposure time (h).
Corrosion rate = (87.6 × ∆w)/(D × A × t)
2.5. Estimation of pH and Chloride Contents
At the end of the exposure period, the concrete specimens were sectioned from the outer surface toward the embedded steel reinforcement. Each section was further divided into three pieces with a thickness of 5 mm, representing cover depths of C5, C10, and C15. The sections were then crushed and ground to obtain powders passing through a 150 μm sieve. For pH determination, 50 g of powder was mixed with 50 mL of distilled water, shaken for 1 h, and filtered. The filtrate pH was measured with a calibrated portable digital pH meter, and the average of three readings was reported.
The free chloride content (water-soluble chloride) and total chloride content (acid-soluble chloride) were used in accordance with ASTM C1218 and ASTM C1152 standards, respectively [40,41]. Approximately 5 g of powdered material was used for each test. Both free (water-soluble) and total (acid-soluble) chloride contents were quantified by potentiometric titration with a Metrohm 888 Titrando system.
2.6. Characterization Studies
At the end of the exposure period, concrete samples adjacent to the steel rebar surface were extracted and sectioned into pieces of approximately 1 cm2 for surface morphology analysis. The surface morphology and elemental composition were examined using Scanning electron microscopy coupled with energy dispersive spectroscopy (SEM/EDS) (TESCAN MIRA3, Brno, Czech Republic) operated at 15 kV to examine the microstructural features of the specimens under different exposure conditions. To further characterize the crystalline phases present on the concrete surface, X-ray diffraction (XRD) analysis was conducted with a Rigaku D/MAX-2500 diffractometer (Tokyo, Japan) equipped with Cu Kα radiation (λ = 1.54059 Å) at 40 kV and 20 mA. The diffraction peaks were analyzed using X’Pert HighScore Plus software (version 2.0, PANalytical).
3. Results and Discussions
3.1. Electrochemical Studies
Figure 4a–d presents the Nyquist plots obtained from EIS measurements of reinforcing steel in 15 mm cover concrete under different exposures—atmosphere, 3.5% NaCl, carbonation, and combined carbonation with 3.5% NaCl (NC15, ClC15, COC15, and COClC15)—after 1, 45, 90, and 120 days. Early exposures (after exposure period of 1 d) are dominated by a high-frequency semicircle consistent with charge-transfer control beneath a compact passive film. At intermediate exposures (45–90 d) most specimens develop two resolved time constants: an outer layer response (associated with oxide/corrosion-product resistance, ROl, and its non-ideal capacitance) and an inner charge-transfer response (associated with Rct). This two-layer signature reflects formation of a porous corrosion-product/altered cementitious layer above the steel. At longer exposure (120 d), Figure 4c in particular shows a marked change: the low-frequency impedance is reduced and an inductive feature appears [42], indicating transport-limited behavior and localized degradation of the steel rebar surface.
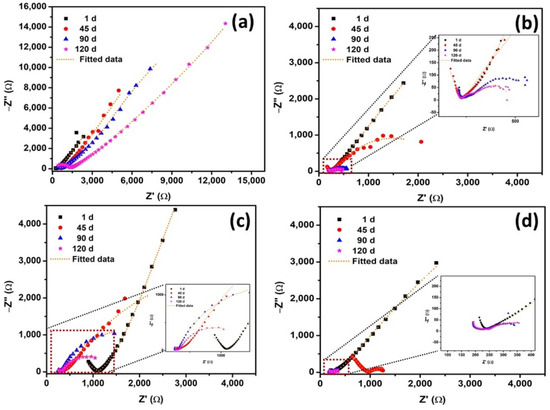
Figure 4.
Nyquist plots of steel reinforced concrete after 1, 45, 90, 120 d of exposure in NC15, ClC15, COC15 and COClC15 environments.
The EIS spectra were analyzed using suitable equivalent circuit (EC) models depending on the exposure time. The circuit [RS–(ROl||CPEOl)–(RCT||CPECT)], shown in Figure 5, represents a two-layer system: concrete resistance (RS), oxide layer resistance (ROl), and resistance of charge transfer (RCT), with constant phase elements (CPEOl and CPECT) replacing ideal capacitors to account for surface heterogeneity. The impedance of CPE is expressed as [43]:
where Q is the CPE constant, i denotes the imaginary unit, ω = 2πf represents the angular frequency, and n reflects surface non-uniformity. Further, the effective double-layer capacitance (Ceff dl) calculated from the CPECT (Qdl) values using Brug’s relation. This approach accounts for interfacial inhomogeneity’s that cause time-constant dispersion [44,45].
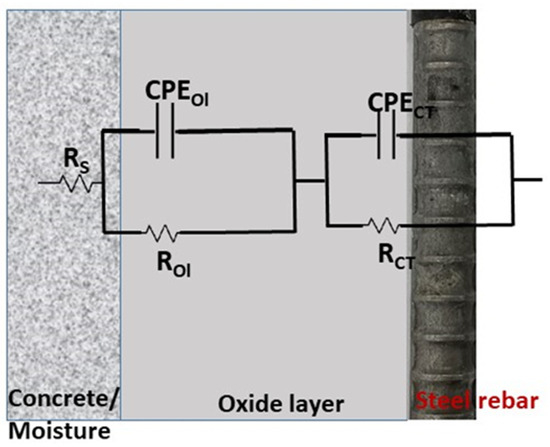
Figure 5.
Schematic diagram of the equivalent circuit.
The fitted EIS parameters and calculated Ceff dl values for steel rebars embedded in NC15, ClC15, COC15, and COClC15 after 1, 45, 90, and 120 days are presented in Table 4. Under NC15 (atmospheric exposure), both ROl and RCT exhibited a gradual increase, from 730 and 28,366 Ω at 1 d to 2631 and 32,314 Ω at 120 d. This systematic enhancement reflects the progressive development of the portlandite layer at the steel–concrete interface through ongoing cement hydration, which contributes to improved barrier properties and higher resistance to corrosion. For ClC15, the ROl and RCT values were 506 and 18,799 Ω after 1 day, slightly higher than those of COC15 and COClC15. This can be attributed to the initially limited availability of chloride ions at the steel–concrete interface, which delayed passive film breakdown. However, by 45 days, both ROl and RCT decreased markedly, indicating the ingress of chloride ions, progressive attack on the portlandite phase, and deterioration of the passive barrier [46]. A further gradual decline in these parameters was observed with prolonged exposure, confirming sustained chloride-induced corrosion activity. In the case of COClC15, ROl and RCT values were consistently lower than those in ClC15 and COC15, reflecting the synergistic effect of carbonation and chloride ingress in accelerating passive film breakdown. Interestingly, a slight increase in ROl values was recorded at 120 days for ClC15, COC15, and COClC15 compared to 90 days, likely due to the accumulation of porous corrosion products that temporarily enhanced interfacial resistance. When compared with NC15, the reduction factors of RCT for ClC15 were 1.51, 10.23, 99.62, and 151.72; for COC15, 1.67, 2.92, 4.16, and 14.62; and for COClC15, 1.72, 13.72, 244.81, and 225.97 at 1, 45, 90, and 120 days, respectively.
Table 4.
EIS parameters of the steel reinforced concrete after 1, 45, 90 and 120 d of exposure in NC15, ClC15, COC15 and COClC15 environments.
The calculated Ceff dl values at different exposure periods are presented in Table 4. As shown in Table 4, the Ceff dl values for steel rebars in ClC15, COC15, and COClC15 were considerably higher than those in NC15. This increase indicates adsorption of aggressive ions at the steel–concrete interface, which elevates the dielectric constant and double-layer capacitance while reducing passive film thickness [47,48]. Such changes promote higher charge transfer and accelerate corrosion processes.
The potentiodynamic polarization behavior of steel rebars embedded in NC15, ClC15, COC15, and COClC15 is presented in Figure 6, and the corresponding corrosion kinetic parameters are summarized in Table 5. For NC15, the corrosion current density (icorr) was 0.0106 µA cm−2, confirming the presence of a stable passive film that provides strong resistance to corrosion. In contrast, after 120 days of exposure, significantly higher icorr and corrosion rate values were recorded in aggressive environments: ClC15 (0.3945 µA cm−2; 4.5840 × 10⁻³ mmpy), COC15 (0.0978 µA cm−2; 1.1366 × 10⁻³ mmpy), and COClC15 (0.4779 µA cm−2; 5.5539 × 10⁻³ mmpy). Notably, the icorr and corrosion rate values for ClC15 were approximately 4.16 and 4.03 times higher compared with COC15, respectively, signifying that chloride-induced corrosion is considerably more aggressive than carbonation-induced corrosion [6]. However, the corrosion rate values of reinforcing steel in COClC15 were 1.21 and 4.89 times higher compared with ClC15 and COC15, respectively. This can be attributed to carbonation lowering the pore solution pH, which reduces the chloride threshold for depassivation, while chlorides promote rapid pit initiation and growth, thereby intensifying corrosion severity. Overall, the results confirm that after 120 days of exposure, corrosion severity followed the order: NC15 < COC15 < ClC15 < COClC15.
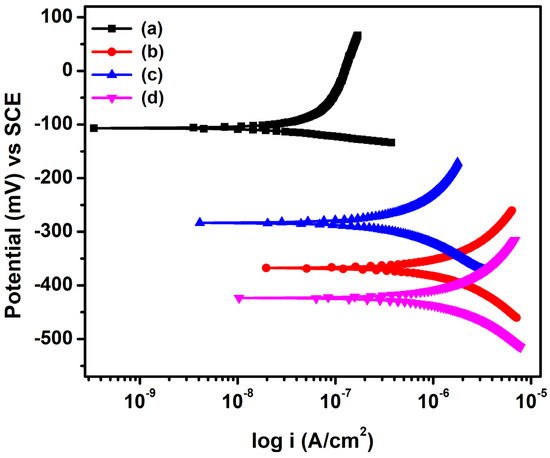
Figure 6.
Potentiodynamic polarization curve for steel reinforced concrete after 120 d of exposure in (a) NC15; (b) ClC15; (c) COC15 and (d) COClC15 environments.
Table 5.
Potentiodynamic polarization parameters of steel reinforced concrete after an exposure period of 120 d.
3.2. Weight Loss Methods
Figure 7a–d shows the photograph image of the steel rebars after 120 days of exposure in different environments. The NC15 sample (Figure 7a, atmosphere exposure) shows an almost intact surface with no corrosion, confirming stable passivation. In ClC15 (Figure 7b, chloride exposure), localized rust patches appear, indicating chloride penetration and pitting initiation. The COC15 sample (Figure 7c, carbonated exposure) shows more widespread rust, as carbonation reduces alkalinity and weakens the passive film. The most severe damage is seen in COClC15 (Figure 7d, combined carbonation and chloride exposure), where heavy rust and surface deterioration confirm the combined aggressive effect of chloride ions and carbonation.
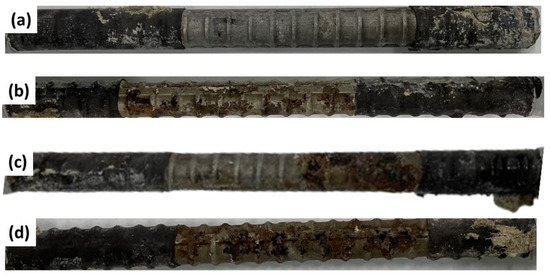
Figure 7.
Photographic image of the reinforcing steel rebar in concrete after 120 d of exposure in (a) NC15; (b) ClC15; (c) COC15 and (d) COClC15 environments.
The corrosion rate, determined from gravimetric analysis of embedded steel rebars after 120 days of exposure (Table 6), is consistent with the electrochemical findings. The NC15 system had the lowest weight loss (7.2 mg) and corrosion rate (0.0887 × 10⁻² mmpy), confirming strong protection under normal conditions. Chloride exposure (ClC15) caused a sharp increase in corrosion (252.6 mg, 3.1131 × 10⁻² mmpy), while carbonation (COC15) led to moderate corrosion (118.9 mg, 1.4654 × 10⁻² mmpy). The combined action of carbonation and chlorides (COClC15) was most damaging, with the highest weight loss (382.6 mg) and corrosion rate (4.7153 × 10⁻² mmpy). This clearly shows that carbonation lowers the pH, making steel more vulnerable to chloride attack, while chlorides accelerate localized corrosion (autocatalytic reaction) [46].
Table 6.
The rate of corrosion obtained from gravimetric weight loss methods.
3.3. Estimation of Chloride Contents
Chlorides in concrete exist in two forms: free and bound. The total chloride content is generally quantified as acid-soluble chlorides, while the water-soluble fraction represents free chlorides; the difference corresponds to bound chlorides. Bound chlorides are further categorized as physically bound (weak adsorption on hydration products) and chemically bound (formation of stable compounds). Physically bound chlorides are weakly adsorbed on the surface of calcium silicate hydrate (C–S–H), as represented in Equation (5), and chemically bound species, where chlorides react with aluminate phases such as C3A to form Friedel’s salt (Equation (6)). These binding mechanisms immobilize part of the penetrating chlorides, thereby delaying reinforcement depassivation [49,50].
However, when the binding capacity is exceeded, excess free chlorides accumulate in the pore solution, increasing the risk of corrosion initiation. Chloride profiles measured in NC15, ClC15, COC15, and COClC15 specimens after 120 days (Table 7) indicate that both free and bound chloride concentrations decrease with increasing cover depth, reflecting the protective effect of thicker concrete covers. Notably, bound chloride contents are substantially higher in non-carbonated chloride-exposed concrete (ClC15) compared with carbonated systems (COClC15). This reduction in chloride binding capacity under carbonation is attributed to the decalcification of hydration products and destabilization of aluminate phases. Carbonation consumes portlandite and decalcifies C–S–H, forming CaCO3 and silica gel (Equations (7) and (8)), which lowers the surface charge and reduces the adsorption capacity of C–S–H. In addition, carbonation transforms aluminate silicate hydrates phase into carboaluminates (Equation (9)), restricting the formation of Friedel’s salt and limiting chemical chloride immobilization [50,51]. Thus, carbonation not only lowers pore solution alkalinity but also reduces both physical adsorption and chemical binding of chlorides, thereafter enhancing steel rebar corrosions.
Table 7.
Chloride contents in NC15, ClC15, COC15 and COClC15 concrete.
The Temkin adsorption isotherm was employed to describe the relationship between bound and free (water-soluble) chlorides in the concrete matrix, as expressed in Equation (10) [52,53]:
where CB and Cf signify the intensities of bound and water-soluble chlorides, respectively. The parameters α and β are the Temkin model parameters, while T and R represent the absolute temperature (298.15 K in this study) and gas constant (8.314 J·K−1·mol−1), respectively.
The Temkin adsorption isotherm coefficients for NC15, ClC15, COC15, and COClC15 specimens after 120 days of exposure are revealed in Figure 8 and their corresponding parameters summarized in Table 8. All systems exhibit a high correlation coefficient (R2 = 0.99), indicating an excellent fit of chloride binding behavior to the Temkin model. The Temkin parameter α, which represents the adsorption capacity, is highest for NC15, followed by COC15, COClC15, and ClC15. This trend suggests that non-carbonated, chloride-free concrete (NC15) possesses a significantly greater binding capacity compared to chloride- and carbonation-exposed systems. The binding energy constant (β), which reflects the intensity of chloride binding, is also higher in NC15 relative to the other specimens, with the lowest value observed in COClC15 (8.97). The reduction in β for carbonated chloride-contaminated concrete indicates weakened chloride–matrix interactions, primarily due to the decalcification of C–S–H and destabilization of aluminate phases caused by carbonation. These findings highlight that carbonation not only decreases the chloride-binding capacity (α) but also lowers the binding strength (β) [53,54], thereby increasing the availability of free chlorides in the pore solution and accelerating corrosion risk of embedded steel rebars.
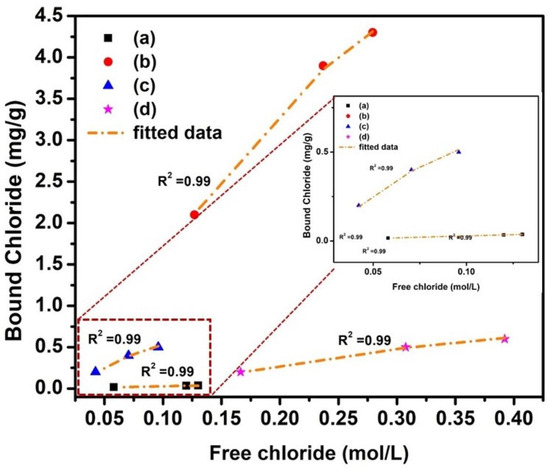
Figure 8.
Adsorption isotherm (Temkin) for concrete after 120 d of exposure in (a) NC15; (b) ClC15; (c) COC15 and (d) COClC15 environments.
Table 8.
Temkin adsorption isotherm coefficient.
3.4. Characterization Studies
The SEM micrographs (Figure 9a–d) illustrate the surface morphology of NC15, ClC15, COC15, and COClC15 concrete specimens after 120 days of exposure. In NC15 (Figure 9a), a relatively dense and compact matrix is observed, indicating minimal microstructural damage and the preservation of hydration products, consistent with the passive state of the embedded steel.
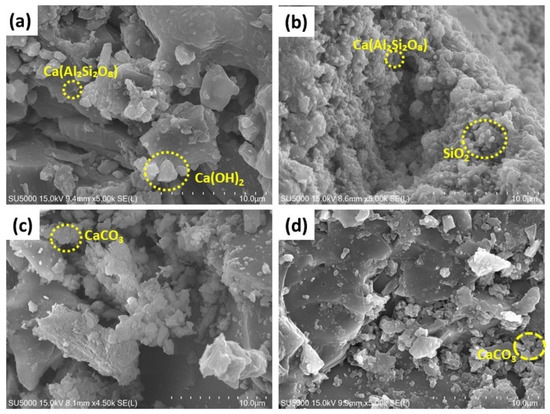
Figure 9.
SEM images of the concrete surface after 120 d of exposure in (a) NC15; (b) ClC15; (c) COC15 and (d) COClC15 environments.
Further, ClC15 (Figure 9b) reveals a porous and heterogeneous microstructure with significant microcrack formation, confirming chloride-induced deterioration. The COC15 specimen (Figure 9c) shows partially degraded hydration phases with moderate porosity, characteristic of carbonation-induced decalcification of calcium hydroxide and partial destabilization of the C–S–H gel. The COClC15 sample (Figure 9d) exhibits the most severe deterioration, with highly porous and fragmented microstructures. This synergistic damage results from carbonation lowering the pore solution pH, thereby accelerating chloride ingress and destabilizing the passive film on steel reinforcement.
Figure 10a–d presents the EDS spectra of NC15, ClC15, COC15, and COClC15 specimens after 120 days of exposure. In NC15 (Figure 10a), the spectrum is dominated by Ca–A–Si phases, characteristic of C–S–H and portlandite. In ClC15 (Figure 10b), elevated Ca content with detectable Cl indicates chloride binding through the formation of Friedel’s salt. The spectra of COC15 and COClC15 (Figure 10c,d) reveal pronounced C and O enrichment accompanied by significant Si depletion, reflecting C–S–H decalcification and extensive CaCO3 precipitation. These findings confirm that carbonation reduces the chloride-binding capacity of the cement matrix and destabilizes hydration products, thereby enhancing the corrosion susceptibility of embedded reinforcement.
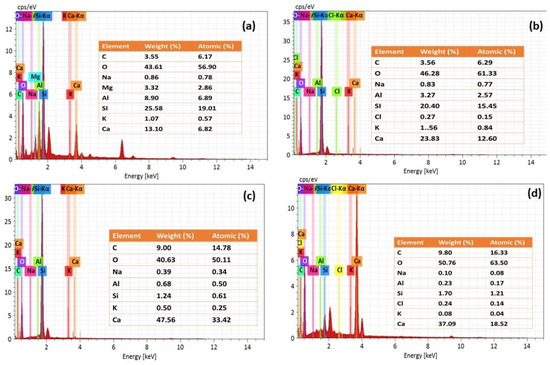
Figure 10.
EDS results for the concrete surface after 120 d of exposure in (a) NC15; (b) ClC15; (c) COC15 and (d) COClC15 environments.
Further, The X-ray diffraction (XRD) patterns of the NC15, ClC15, COC15, and COClC15 concrete specimens after 120 days of exposure are presented in Figure 11a–d. The crystalline phases were identified by comparison with the Joint Committee on Powder Diffraction File (JCPDS) standard reference database. In the NC15 specimen, prominent reflections corresponding to portlandite [Ca(OH)2] were observed at 2θ = 18.09°, 34.09°, and 50.79° (JCPDS No. 00-004-0733), confirming the presence of unreacted calcium hydroxide. Peaks detected at 12.03°, 22.04°, and 26.8° were attributed to calcium aluminosilicate [Ca(Al2Si2O8)] (anorthite, JCPDS No. 01-073-1435), while diffraction peaks at 29.4° and 39.4° were assigned to vaterite [CaCO3] (JCPDS No. 01-072-0506). In contrast, the COC15 and COClC15 specimens exhibited a noticeable reduction in the intensity of Ca(OH)2 and Ca(Al2Si2O8) reflections, accompanied by a slight increase in the intensity of calcite peaks, indicating progressive carbonation during exposure. This trend suggests that Ca(OH)2 is gradually consumed through carbonation reactions forming CaCO3, consistent with findings reported in previous studies on carbonated cementitious systems [55,56,57].
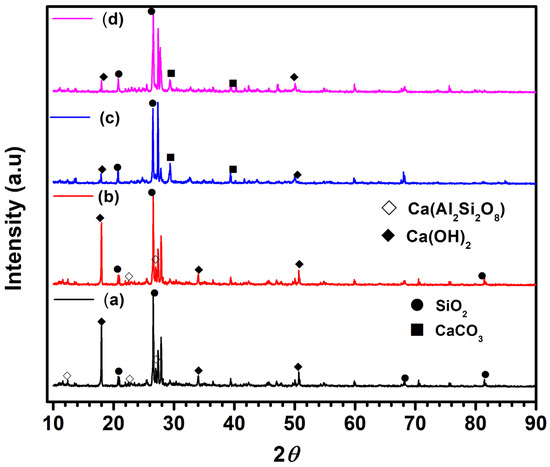
Figure 11.
XRD pattern for concrete surface after 120 d of exposure in (a) NC15; (b) ClC15; (c) COC15 and (d) COClC15 environments.
Thus, the XRD analysis clearly demonstrates that carbonation dominates in COC15 rich and combined COClC15 environments, leading to the transformation of Ca(OH)2 into CaCO3, with implications for phase assemblage evolution and the chemical stability of cementitious matrices.
4. Conclusions
This study examined the performance of reinforced concrete exposed to different environments, resulting in the following conclusions:
- ➢
- Electrochemical analysis confirmed that the chloride–carbonation system (COClC15) exhibited the most severe corrosion, with icorr reaching 0.4779 µA/cm2, far higher than NC15 (0.0106 µA/cm2).
- ➢
- Gravimetric weight loss showed a similar trend, as the corrosion rate of COClC15 (4.71 × 10⁻² mmpy) was ~1.5 times greater than ClC15, ~3.2 times greater than COC15, and nearly 52.4 times higher than NC15 after 120 days.
- ➢
- Chloride profiling revealed that carbonation reduces chloride-binding efficiency; COClC15 retained only 0.06% bound chloride at 5 mm cover compared to 0.43% in ClC15.
- ➢
- Temkin adsorption isotherm analysis supported this finding, with a much lower β value in COClC15 (8.97) compared to ClC15 (16.8) and NC15 (33), indicating reduced chloride immobilization due to C–S–H decalcification and aluminate phase transformation.
- ➢
- Visual inspection and SEM analysis revealed extensive rusting, cracking, and microstructural degradation in COClC15, consistent with electrochemical and gravimetric data.
This study found that the combined effect of chloride ingress and carbonation significantly amplifies rebar corrosion by accelerating depassivation, lowering chloride binding, and compromising the durability of reinforced concrete.
Author Contributions
S.K.: Formal analysis, data curation, methodology, conceptualization, writing—original draft preparation, writing—review and editing. J.K.C.: Conceptualization, Project administration, supervision, Funding acquisition, validation, writing—review and editing. All authors have read and agreed to the published version of the manuscript.
Funding
This research received no external funding.
Data Availability Statement
The original contributions presented in this study are included in the article. Further inquiries can be directed to the corresponding author(s).
Acknowledgments
The authors thank the Department of Civil and Environmental Engineering, Hongik University, for providing research facilities and academic support. Special appreciation is extended to the laboratory staff and graduate students for their assistance in the electrochemical and gravimetric studies. The constructive feedback from colleagues and peer researchers is also gratefully acknowledged. This work was partially supported by resources from the Hongik University Graduate School.
Conflicts of Interest
All authors declare that there is no conflict of interest.
References
- Emmons, P.H.; Sordyl, D.J. The state of the concrete repair industry, and a vision for its future. Concr. Repair Bull. 2006, 19, 7–14. [Google Scholar]
- Stewart, M.G.; Wang, X.; Nguyen, M.N. Climate change impact and risks of concrete infrastructure deterioration. Eng. Struct. 2011, 33, 1326–1337. [Google Scholar] [CrossRef]
- Kwon, S.-J.; Lee, H.-S.; Karthick, S.; Saraswathy, V.; Yang, H.-M. Long-term corrosion performance of blended cement concrete in the marine environment–A real-time study. Constr. Build. Mater. 2017, 154, 349–360. [Google Scholar] [CrossRef]
- Fuhaid, A.F.A.; Niaz, A. Carbonation and corrosion problems in reinforced concrete structures. Buildings 2022, 12, 586. [Google Scholar] [CrossRef]
- Tang, H.; Peng, J.; Peng, H.; Yang, Y.; Gao, Q.; Xiao, L.; Li, H.; Zheng, L.; Chen, Z.; Yang, Z. Test and theoretical investigations on flexural behavior of high-performance H-shaped steel beam with local corrosion in pure bending zone. Steel Res. Int. 2025, 96, 2400640. [Google Scholar] [CrossRef]
- Zhou, Y.; Gencturk, B.; Willam, K.; Attar, A. Carbonation-induced and chloride-induced corrosion in reinforced concrete structures. J. Mater. Civ. Eng. 2015, 27, 04014245. [Google Scholar] [CrossRef]
- Xie, M.; Dangla, P.; Li, K. Reactive transport modelling of concurrent chloride ingress and carbonation in concrete. Mater. Struct. 2021, 54, 177. [Google Scholar] [CrossRef]
- Wang, Y.; Nanukuttan, S.; Bai, Y.; Basheer, P. Influence of combined carbonation and chloride ingress regimes on rate of ingress and redistribution of chlorides in concretes. Constr. Build. Mater. 2017, 140, 173–183. [Google Scholar] [CrossRef]
- Gustafsson, M.E.; Franzén, L.G. Dry deposition and concentration of marine aerosols in a coastal area, SW Sweden. Atmos. Environ. 1996, 30, 977–989. [Google Scholar] [CrossRef]
- Qiu, Q. A state-of-the-art review on the carbonation process in cementitious materials: Fundamentals and characterization techniques. Constr. Build. Mater. 2020, 247, 118503. [Google Scholar] [CrossRef]
- Saillio, M.; Baroghel-Bouny, V.; Barberon, F. Chloride binding in sound and carbonated cementitious materials with various types of binder. Constr. Build. Mater. 2014, 68, 82–91. [Google Scholar] [CrossRef]
- Dong, B.; Qiu, Q.; Xiang, J.; Huang, C.; Sun, H.; Xing, F.; Liu, W. Electrochemical impedance interpretation of the carbonation behavior for fly ash–slag–cement materials. Constr. Build. Mater. 2015, 93, 933–942. [Google Scholar] [CrossRef]
- Backus, J.; McPolin, D.; Basheer, M.; Long, A.; Holmes, N. Exposure of mortars to cyclic chloride ingress and carbonation. Adv. Cem. Res. 2013, 25, 3–11. [Google Scholar] [CrossRef]
- Kuosa, H.; Ferreira, R.; Holt, E.; Leivo, M.; Vesikari, E. Effect of coupled deterioration by freeze–thaw, carbonation and chlorides on concrete service life. Cem. Concr. Compos. 2014, 47, 32–40. [Google Scholar] [CrossRef]
- Mi, T.; Li, Y.; Liu, W.; Dong, Z.; Gong, Q.; Min, C.; Xing, F.; Wang, Y.; Chu, S. The effect of carbonation on chloride redistribution and corrosion of steel reinforcement. Constr. Build. Mater. 2023, 363, 129641. [Google Scholar] [CrossRef]
- Miron, L.E.R.D.; Koleva, D.A.; Miron, L.E.R.D. Concrete Durability; Springer: Berlin/Heidelberg, Germany, 2017. [Google Scholar]
- Lee, M.K.; Jung, S.H.; Oh, B.H. Effects of carbonation on chloride penetration in concrete. ACI Mater. J. 2013, 110, 559. [Google Scholar] [CrossRef]
- Zhu, X.; Zi, G.; Cao, Z.; Cheng, X. Combined effect of carbonation and chloride ingress in concrete. Constr. Build. Mater. 2016, 110, 369–380. [Google Scholar] [CrossRef]
- Montemor, M.F.; Cunha, M.; Ferreira, M.; Simões, A. Corrosion behaviour of rebars in fly ash mortar exposed to carbon dioxide and chlorides. Cem. Concr. Compos. 2002, 24, 45–53. [Google Scholar] [CrossRef]
- Revert, A.B.; De Weerdt, K.; Hornbostel, K.; Geiker, M.R. Carbonation-induced corrosion: Investigation of the corrosion onset. Constr. Build. Mater. 2018, 162, 847–856. [Google Scholar] [CrossRef]
- Montemor, M.; Simoes, A.; Ferreira, M. Chloride-induced corrosion on reinforcing steel: From the fundamentals to the monitoring techniques. Cem. Concr. Compos. 2003, 25, 491–502. [Google Scholar] [CrossRef]
- Page, C.L. Initiation of chloride-induced corrosion of steel in concrete: Role of the interfacial zone. Mater. Corros. 2009, 60, 586–592. [Google Scholar] [CrossRef]
- Heiyantuduwa, R.; Alexander, M.; Mackechnie, J. Performance of a penetrating corrosion inhibitor in concrete affected by carbonation-induced corrosion. J. Mater. Civ. Eng. 2006, 18, 842–850. [Google Scholar] [CrossRef]
- Hussain, R.R.; Ishida, T. Critical carbonation depth for initiation of steel corrosion in fully carbonated concrete and development of electrochemical carbonation induced corrosion model. Int. J. Electrochem. Sci. 2009, 4, 1178–1195. [Google Scholar] [CrossRef]
- Pang, C.; Gao, M.; Xu, J.; Wang, L.; Liu, G.; Qin, H. Influence of test methods and carbonation on chloride ion diffusion coefficient of concrete. J. Southeast Univ. Nat. Sci. Ed. 2011, 41, 1313–1318. [Google Scholar]
- Anik, D.; Jacques, M.; Jean-Pierre, O.; Simone, J.; Kati, H. Chloride binding capacity of various hydrated cement systems. Adv. Cem. Based Mater. 1997, 6, 28–35. [Google Scholar] [CrossRef]
- Yoon, I.-S.; Çopuroğlu, O.; Park, K.-B. Effect of global climatic change on carbonation progress of concrete. Atmos. Environ. 2007, 41, 7274–7285. [Google Scholar]
- Delnavaz, A.; Ramezanianpour, A.A. The assessment of carbonation effect on chloride diffusion in concrete based on artificial neural network model. Mag. Concr. Res. 2012, 64, 877–884. [Google Scholar] [CrossRef]
- Zhu, X.; Zi, G.; Lee, W.; Kim, S.; Kong, J. Probabilistic analysis of reinforcement corrosion due to the combined action of carbonation and chloride ingress in concrete. Constr. Build. Mater. 2016, 124, 667–680. [Google Scholar] [CrossRef]
- Gong, B.; Li, H. A couple Voronoi-RBSM modeling strategy for RC structures. Struct. Eng. Mech. Int. J. 2024, 91, 239–250. [Google Scholar]
- Moreno, M.; Morris, W.; Alvarez, M.; Duffó, G. Corrosion of reinforcing steel in simulated concrete pore solutions: Effect of carbonation and chloride content. Corros. Sci. 2004, 46, 2681–2699. [Google Scholar] [CrossRef]
- Chávez-Ulloa, E.; Camacho-Chab, R.; Sosa-Baz, M.; Castro-Borges, P.; Pérez-López, T. Corrosion process of reinforced concrete by carbonation in a natural environment and an accelerated test chamber. Int. J. Electrochem. Sci. 2013, 8, 9015–9029. [Google Scholar] [CrossRef]
- Trabanelli, G.; Monticelli, C.; Grassi, V.; Frignani, A. Electrochemical study on inhibitors of rebar corrosion in carbonated concrete. Cem. Concr. Res. 2005, 35, 1804–1813. [Google Scholar] [CrossRef]
- KS L-5201:2016; Portland Cement. Korean Standards Association: Seoul, Republic of Korea, 2016.
- KS F-2526:2007; Concrete Aggregate. Korea Standard Committee: Seoul, Republic of Korea, 2007.
- ASTM G1-03; Standard Practice for Preparing, Cleaning, and Evaluating Corrosion Test Specimens. American Society for Testing and Materials: West Conshohocken, PA, USA, 2003.
- Lo, Y.; Lee, H. Curing effects on carbonation of concrete using a phenolphthalein indicator and Fourier-transform infrared spectroscopy. Build. Environ. 2002, 37, 507–514. [Google Scholar] [CrossRef]
- Vedalakshmi, R.; Dolli, H.; Palaniswamy, N. Embeddable corrosion rate-measuring sensor for assessing the corrosion risk of steel in concrete structures. Struct. Control Health Monit. 2009, 16, 441–459. [Google Scholar] [CrossRef]
- Subbiah, K.; Velu, S.; Kwon, S.-J.; Lee, H.-S.; Rethinam, N.; Park, D.-J. A novel in-situ corrosion monitoring electrode for reinforced concrete structures. Electrochim. Acta 2018, 259, 1129–1144. [Google Scholar] [CrossRef]
- ASTM C1218M-20; Standard Test Method for Water-Soluble Chloride in Mortar and Concrete. ASTM International: West Conshohocken, PA, USA, 2008.
- ASTM C 1152M-20; Standard Test Method for Acid-Soluble Chloride in Mortar and Concrete. ASTM International: West Conshohocken, PA, USA, 2020.
- Xie, Y.; Dong, J.; Wu, L.; Wang, W.; Sun, X.; Meng, X.; Huang, Y. Unraveling the relationship between severe plastic deformation and corrosion responses of AZ31 Mg alloys. Corros. Sci. 2025, 250, 112881. [Google Scholar] [CrossRef]
- Macdonald, J.R.; Johnson, W.B.; Raistrick, I.; Franceschetti, D.; Wagner, N.; McKubre, M.; Macdonald, D.; Sayers, B.; Bonanos, N.; Steele, B. Impedance Spectroscopy: Theory, Experiment, and Applications; John Wiley & Sons: Hoboken, NJ, USA, 2018. [Google Scholar]
- Brug, G.; van den Eeden, A.L.; Sluyters-Rehbach, M.; Sluyters, J.H. The analysis of electrode impedances complicated by the presence of a constant phase element. J. Electroanal. Chem. Interfacial Electrochem. 1984, 176, 275–295. [Google Scholar] [CrossRef]
- Subbiah, K.; Lee, H.-S.; Al-Hadeethi, M.R.; Park, T.; Lgaz, H. Assessment of the inhibitive performance of a hydrazone derivative for steel rebar in a simulated concrete medium: Establishing the inhibition mechanism at an experimental and theoretical level. Chem. Eng. J. 2023, 458, 141347. [Google Scholar] [CrossRef]
- Subbiah, K.; Lee, H.-S.; Mandal, S.; Park, T. Conifer cone (Pinus resinosa) as a green corrosion inhibitor for steel rebar in chloride-contaminated synthetic concrete pore solutions. ACS Appl. Mater. Interfaces 2021, 13, 43676–43695. [Google Scholar] [CrossRef] [PubMed]
- Bentiss, F.; Lebrini, M.; Lagrenee, M. Thermodynamic Characterization of Metal Dissolution and Inhibitor Adsorption Processes in Mild Steel/2,5-Bis(n-Thienyl)-1,3,4-Thiadiazoles/Hydrochloric Acid System. Corros. Sci. 2005, 47, 2915. [Google Scholar] [CrossRef]
- Wang, M.; Zhu, S.; Jiang, F.; Feng, Y.; Zhang, X.; Wang, Y.; Zhu, C. Corrosion Inhibition Mechanism and Performance Prediction of Corrosion Inhibitors in Grouting Materials for Anchor Cables in Deep Coal Mines. Rock Mech. Rock Eng. 2025, 1–22. [Google Scholar] [CrossRef]
- Ben-Yair, M. The effect of chlorides on concrete in hot and arid regions. Cem. Concr. Res. 1974, 4, 405–416. [Google Scholar] [CrossRef]
- Karthick, S.; Muralidharan, S.; Saraswathy, V.; Kwon, S.-J. Effect of different alkali salt additions on concrete durability property. J. Struct. Integr. Maint. 2016, 1, 35–42. [Google Scholar] [CrossRef]
- Zhu, Q.; Jiang, L.; Chen, Y.; Xu, J.; Mo, L. Effect of chloride salt type on chloride binding behavior of concrete. Constr. Build. Mater. 2012, 37, 512–517. [Google Scholar] [CrossRef]
- Ding, Z.; Chen, Y. Ability of Hardened Paste of Cementitious Calcium–Aluminophosphate Mineral to Bind with Chloride Ions. J. Mater. Civ. Eng. 2022, 34, 04022054. [Google Scholar] [CrossRef]
- Subbiah, K.; Lee, H.-S.; Park, T.; Annamalai, S. Studies on corrosion monitoring of reinforced concrete in a chloride environment using an embedded solid-state reference electrode. Constr. Build. Mater. 2023, 364, 129964. [Google Scholar] [CrossRef]
- Glass, G.; Reddy, B.; Buenfeld, N. The participation of bound chloride in passive film breakdown on steel in concrete. Corros. Sci. 2000, 42, 2013–2021. [Google Scholar] [CrossRef]
- Bertos, M.F.; Simons, S.; Hills, C.; Carey, P. A review of accelerated carbonation technology in the treatment of cement-based materials and sequestration of CO2. J. Hazard. Mater. 2004, 112, 193–205. [Google Scholar] [CrossRef]
- Shao, Y.; Monkman, S. Carbonated cementitious materials and their role in CO2 sequestration. In Proceedings of the Measuring, Monitoring and Modeling Concrete Properties: An International Symposium dedicated to Professor Surendra P. Shah, Northwestern University, USA, Evanston, IL, USA, 16–18 August 2006; pp. 353–359. [Google Scholar]
- Shao, Y.; Mirza, M.S.; Wu, X. CO2 sequestration using calcium-silicate concrete. Can. J. Civ. Eng. 2006, 33, 776–784. [Google Scholar] [CrossRef]


Disclaimer/Publisher’s Note: The statements, opinions and data contained in all publications are solely those of the individual author(s) and contributor(s) and not of MDPI and/or the editor(s). MDPI and/or the editor(s) disclaim responsibility for any injury to people or property resulting from any ideas, methods, instructions or products referred to in the content. |
© 2025 by the authors. Licensee MDPI, Basel, Switzerland. This article is an open access article distributed under the terms and conditions of the Creative Commons Attribution (CC BY) license (https://creativecommons.org/licenses/by/4.0/).