
Cooling Heritage Scenarios: Transforming Historic Squares for Thermal Comfort

 ,
,  , and
, and 
Abstract
:1. Introduction
2. Materials and Methods
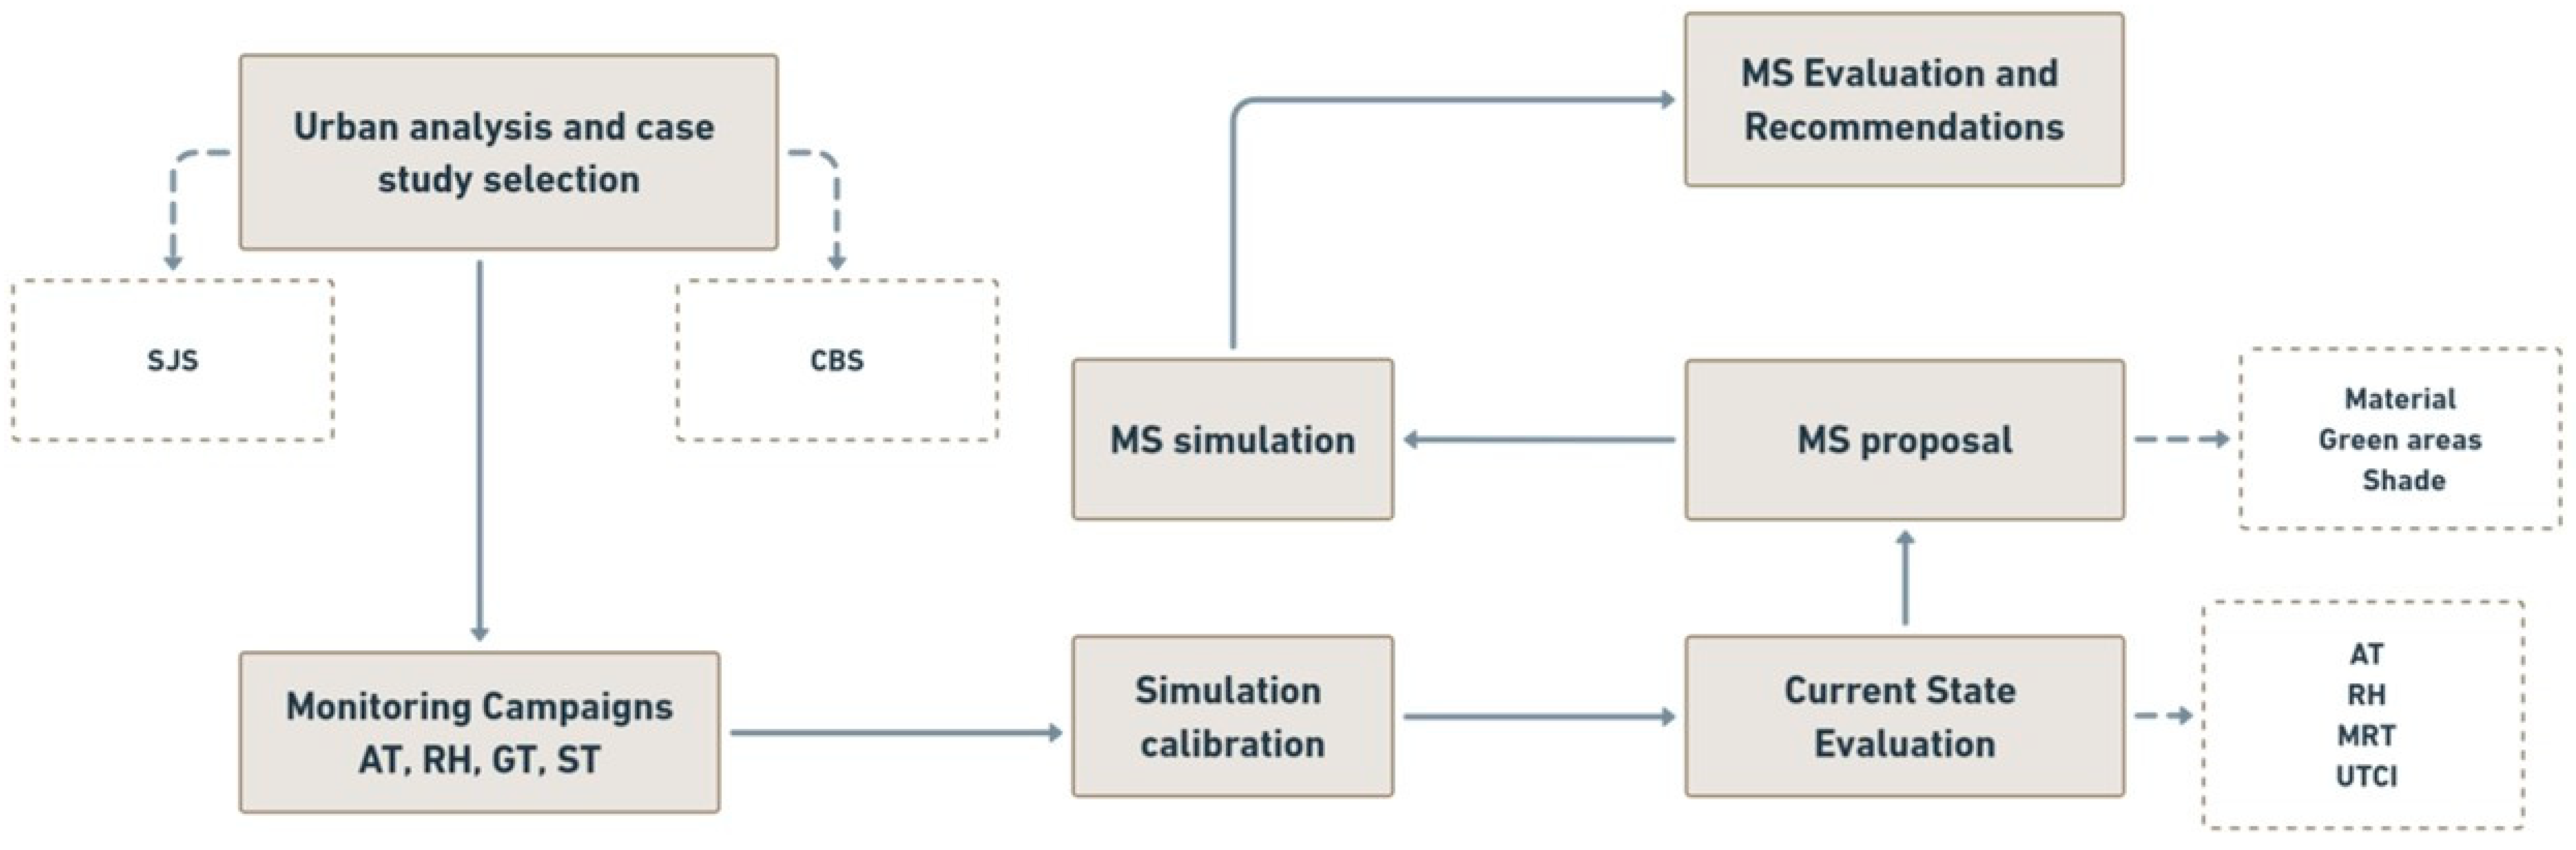
2.1. Research Philosophy and Strategy
2.2. Time Horizon, Data Collection Techniques, and Analysis Tools
2.3. Case Studies
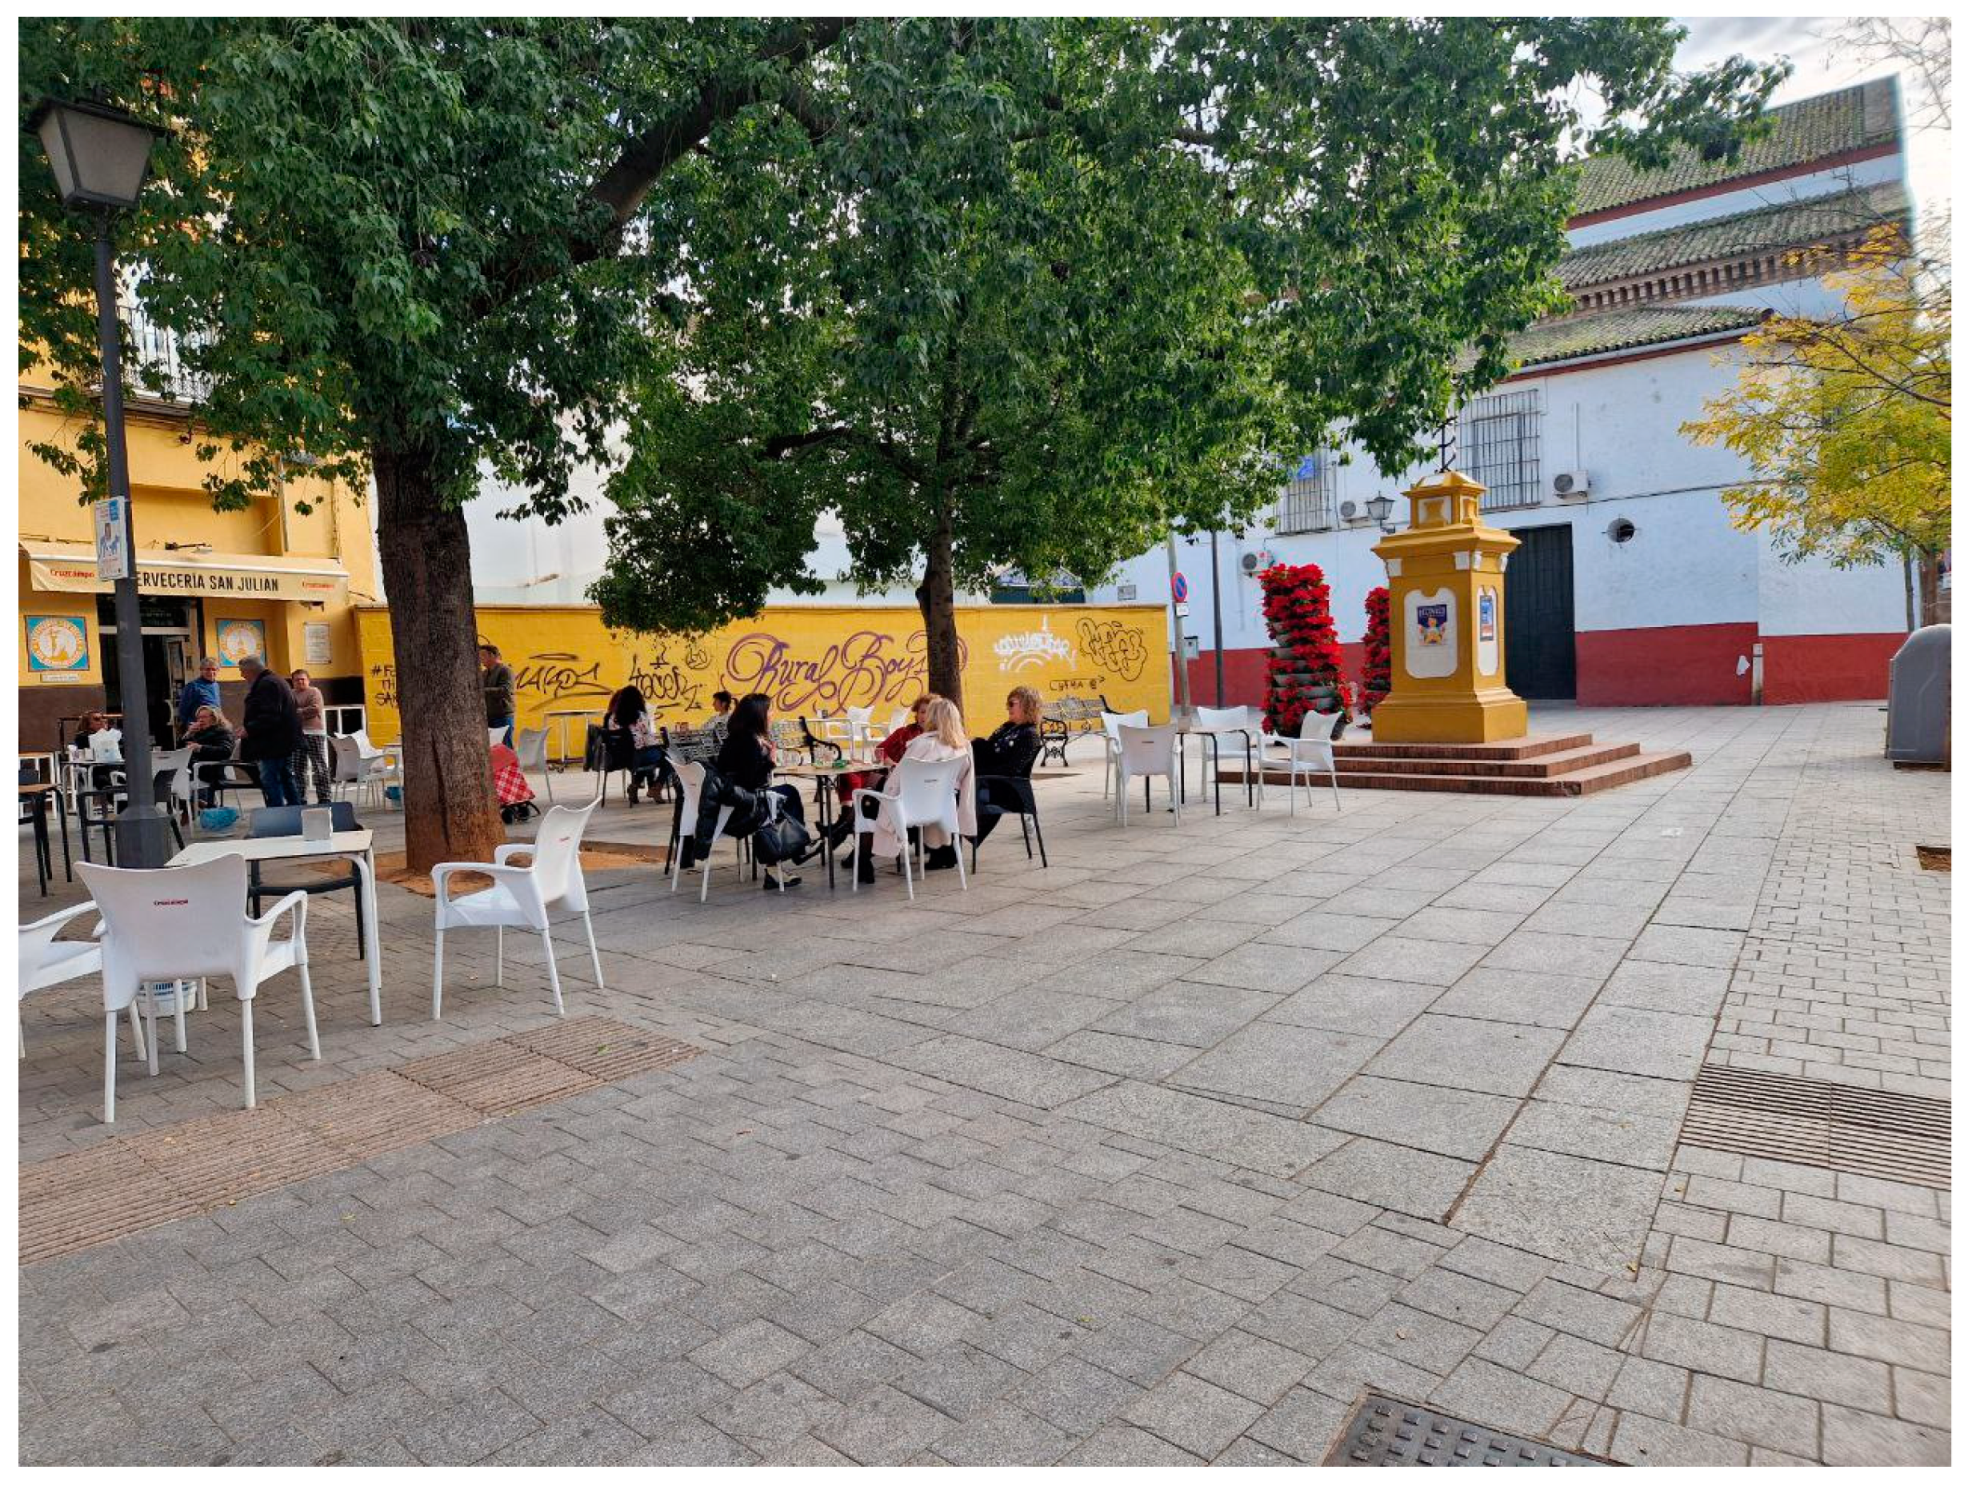
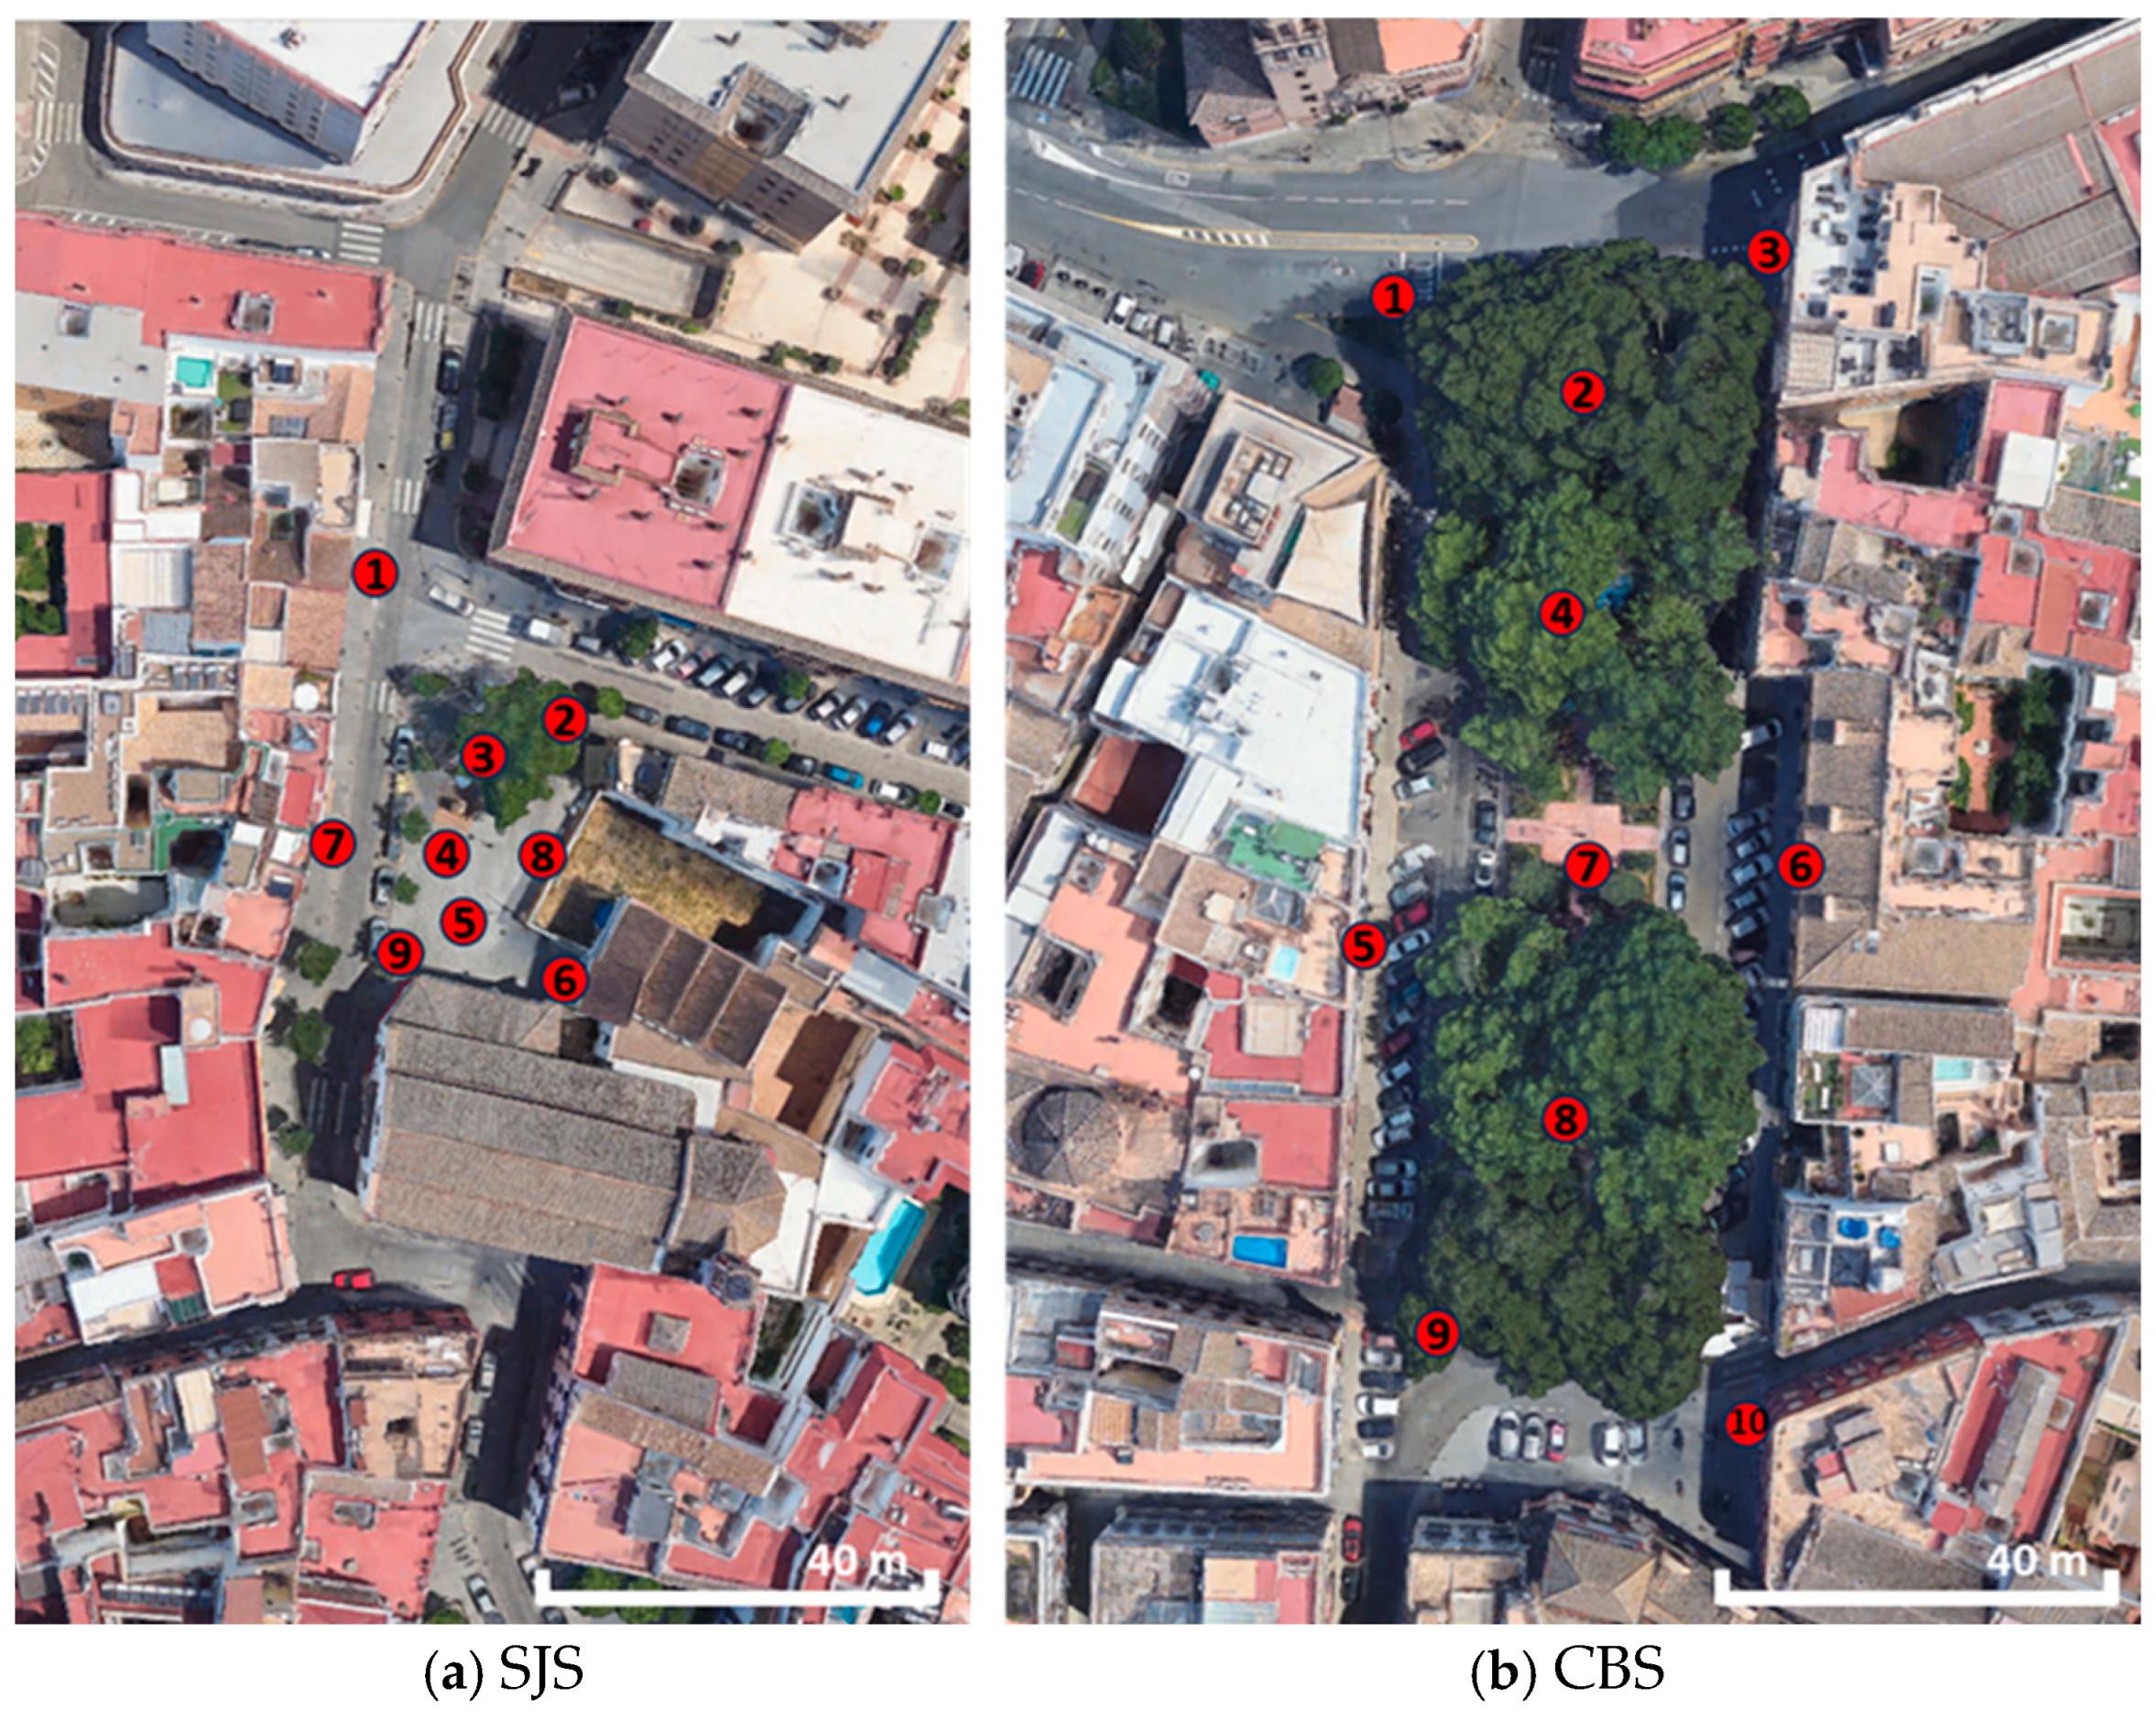
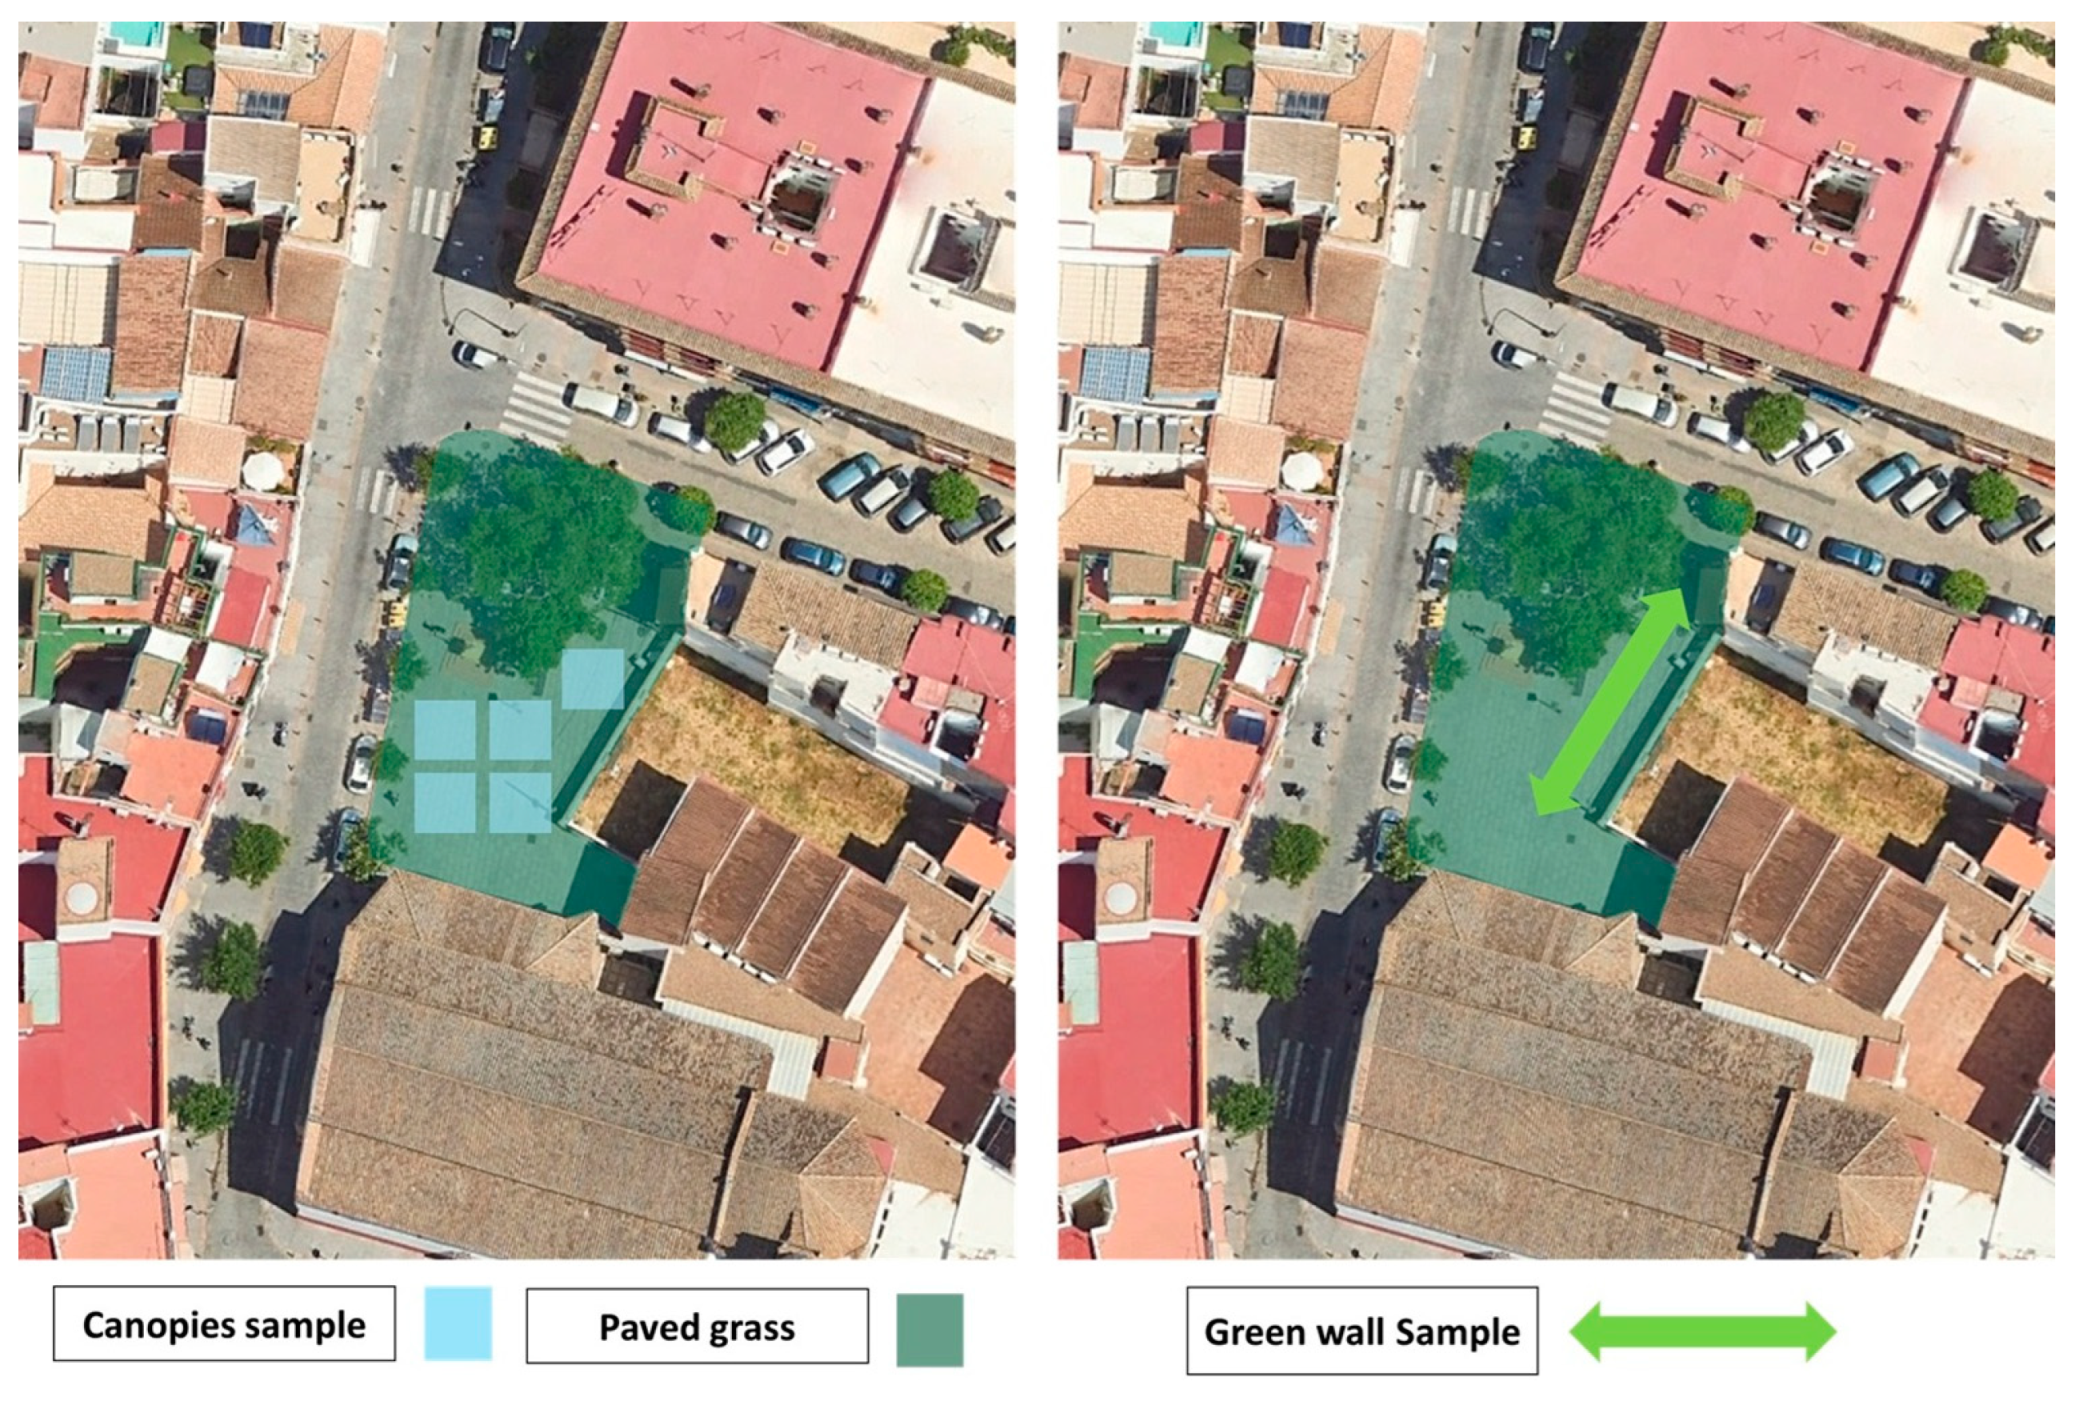
- San Julian Square (SJS) has been chosen for the assessment of thermal comfort, as its shape, design features, and lack of water elements and greenery are also a feature of many small squares nearby. SJS is approximately 28.5 m wide and 44 m long, while the surrounding buildings average a height of 9.5 m. Traditional construction techniques have played a crucial role in shaping the thermal properties of these squares: the surrounding facades are primarily made of local traditional mass bricks, with mortar render painted in light colors, while the roofs are ceramic tiles. Granite cobblestone covers the road surrounding two sides of the square, while the pathways are paved in cement mortar tile or stone tiles, as shown in Figure 3. The cobblestones, laid using compacted sand beds and interlocked with mortar, provide stability but lack permeability and contribute to surface heating.
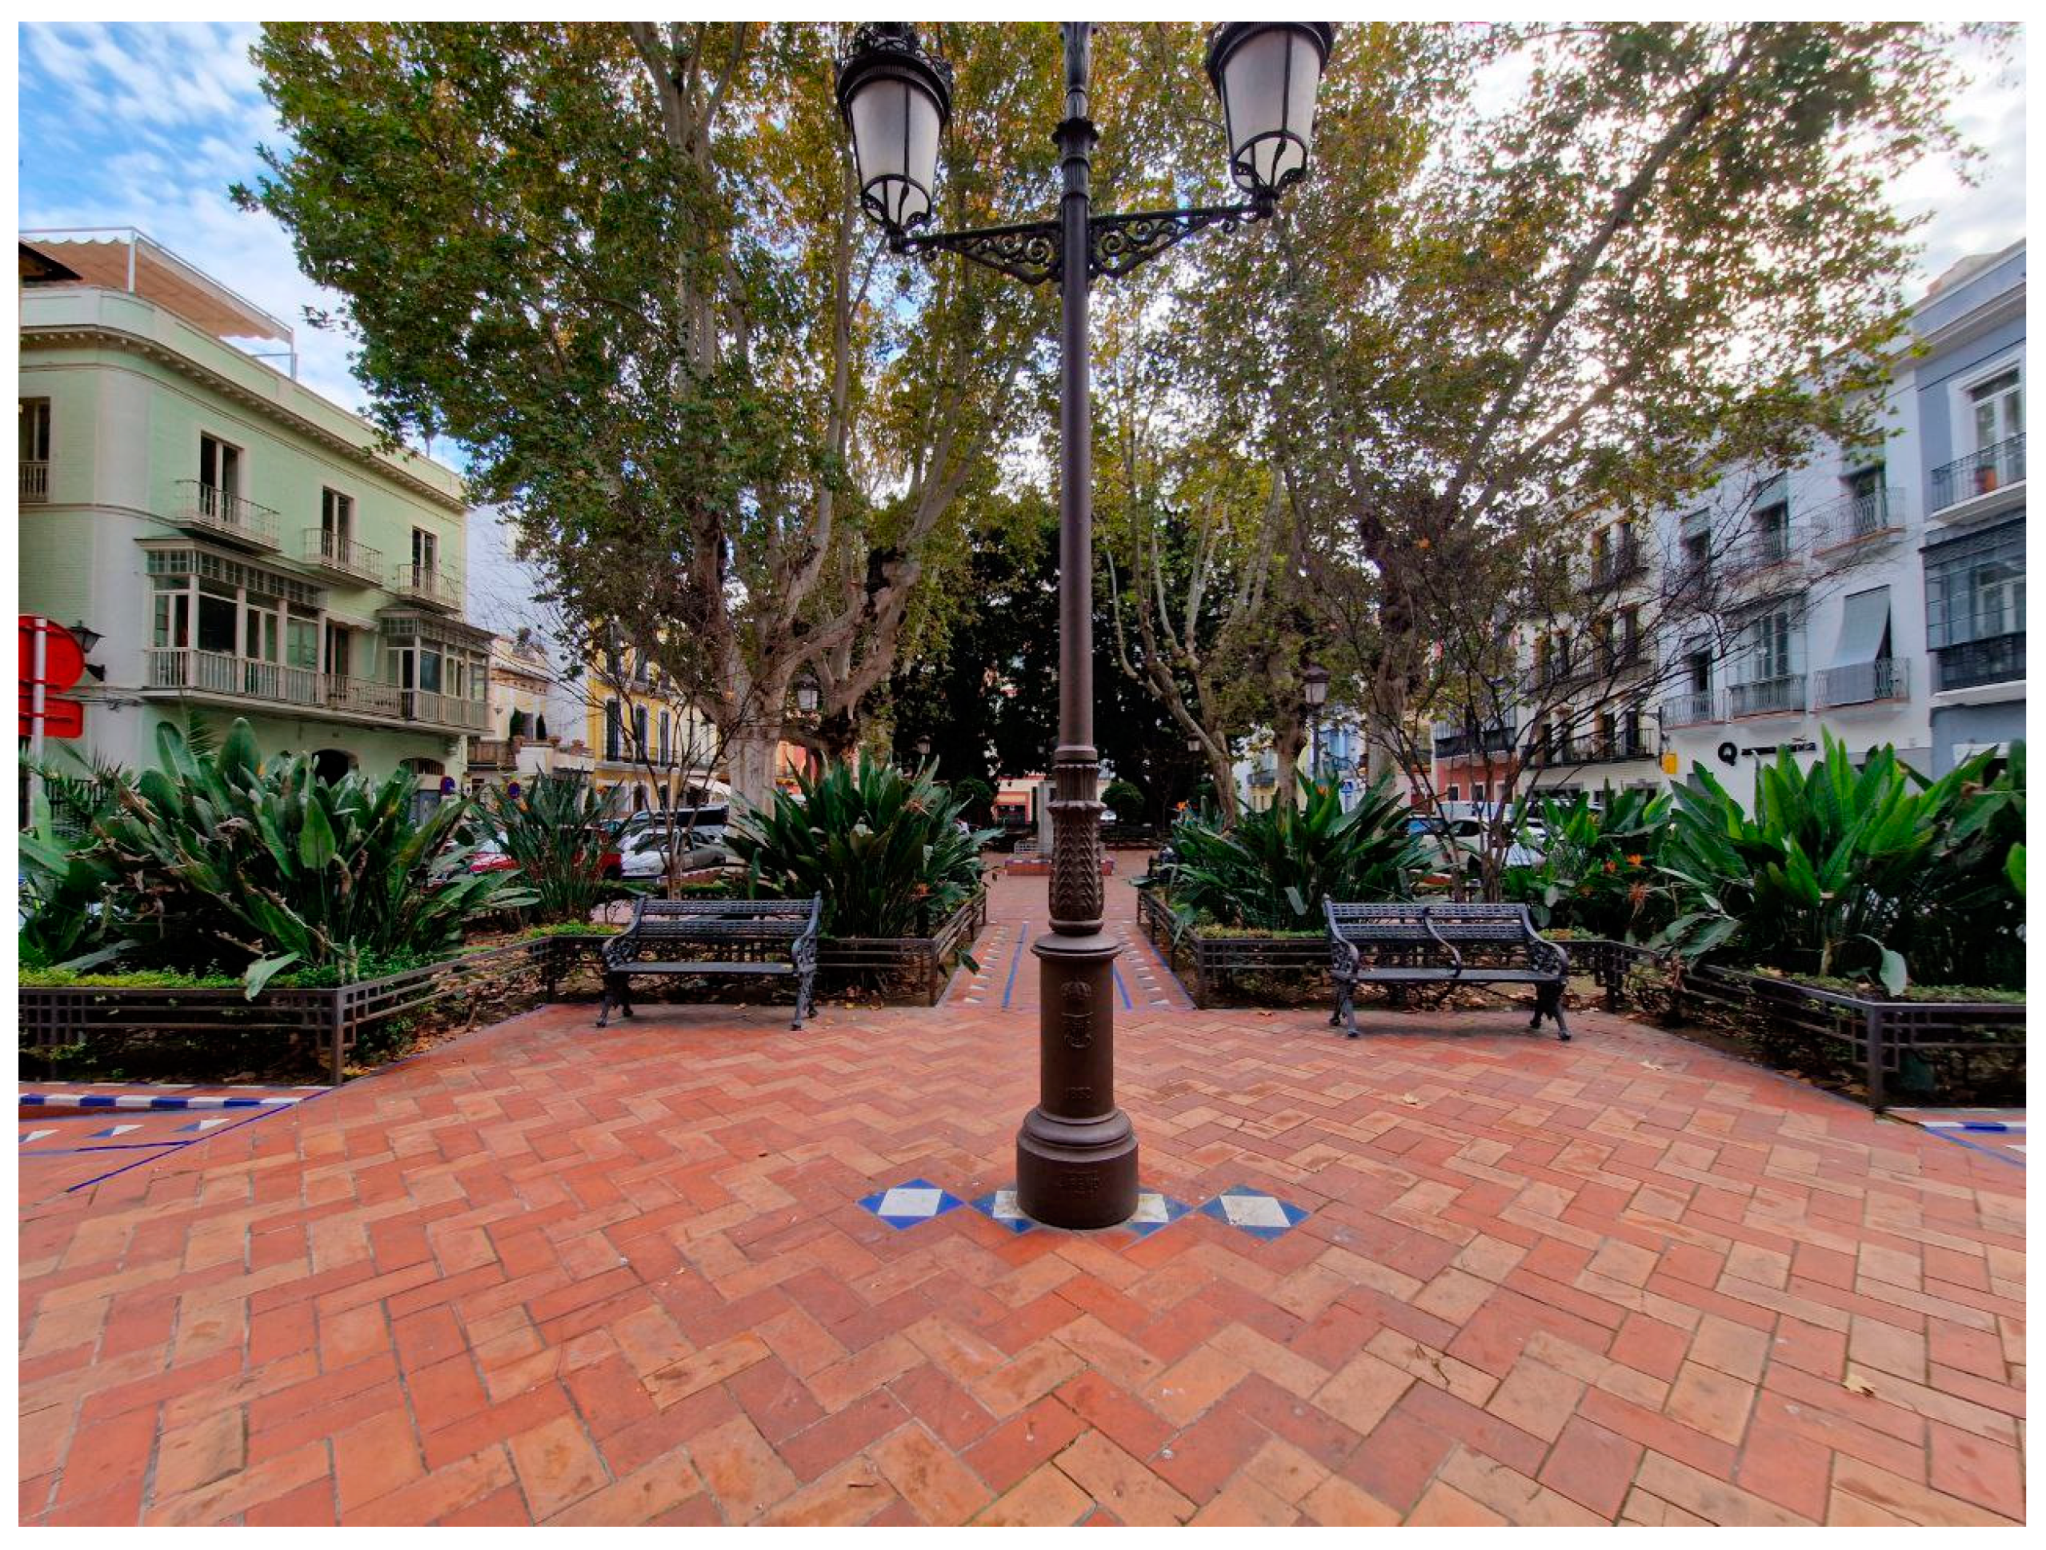
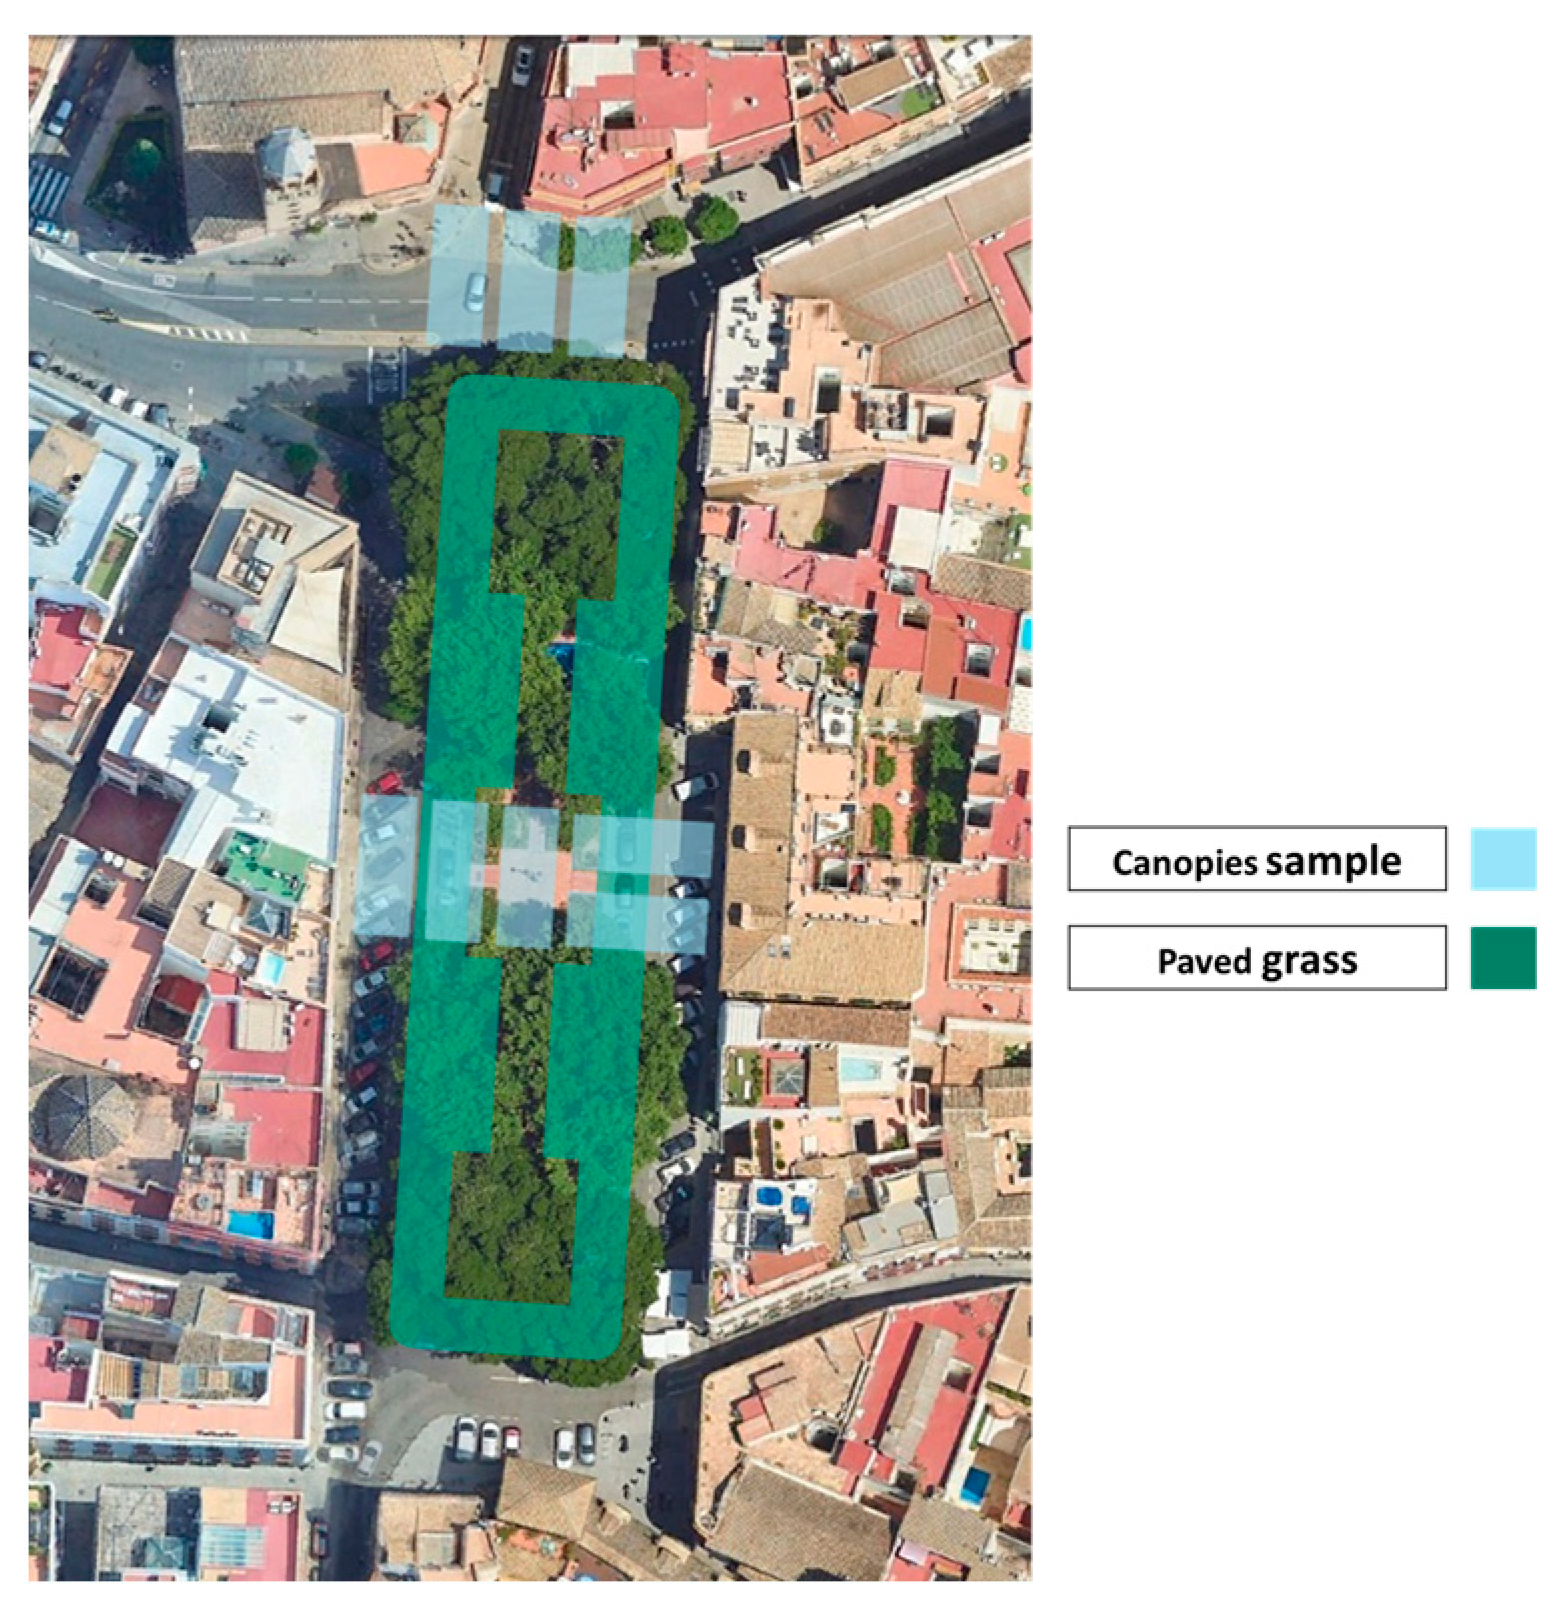
- In contrast, Cristo de Burgos Square (CBS) has an abundance of vegetation. The square, which is 40.2 m wide and 132.9 m long, is surrounded by buildings with a height of 10.5 m. The materials of surrounding buildings are also traditional mass brick walls with mortar render and light paint colors, while the roofs still use ceramic tiles. On the ground, an asphalt road surrounds the square, while the pedestrian area is paved with red brick tile (Figure 4). The dimensions and materials significantly influence the area’s environmental situation. The design elements of the square—mostly existing greenery that provides shade—play an essential part in shaping visitors’ thermal experiences and will guide us in analyzing its microclimate and comparing it with the previous one of both squares. Valuable input on thermal standards can be obtained thanks to the potential perception of variables such as solar exposure and wind flow positioning. CBS features red brick tiles laid over concrete layers, which enhance durability but restrict natural cooling mechanisms. However, in their current form, these historically authentic methods limit thermal mitigation options.
2.4. Field Measurements
2.5. Simulation Setup
2.6. Performance Parameters
2.7. Calibration of the Models
2.8. Mitigation Strategies
3. Results
3.1. Monitoring Results
Calibration of the Simulations
3.2. Simulation Results
3.2.1. SJS-CS
3.2.2. SJS-MS
3.2.3. CBS-CS
3.2.4. CBS-MS
4. Discussion
4.1. Regarding the Monitoring and Validation of the Study
4.2. Regarding the Effectiveness of the Strategies Proposed
4.3. Limitations
5. Conclusions
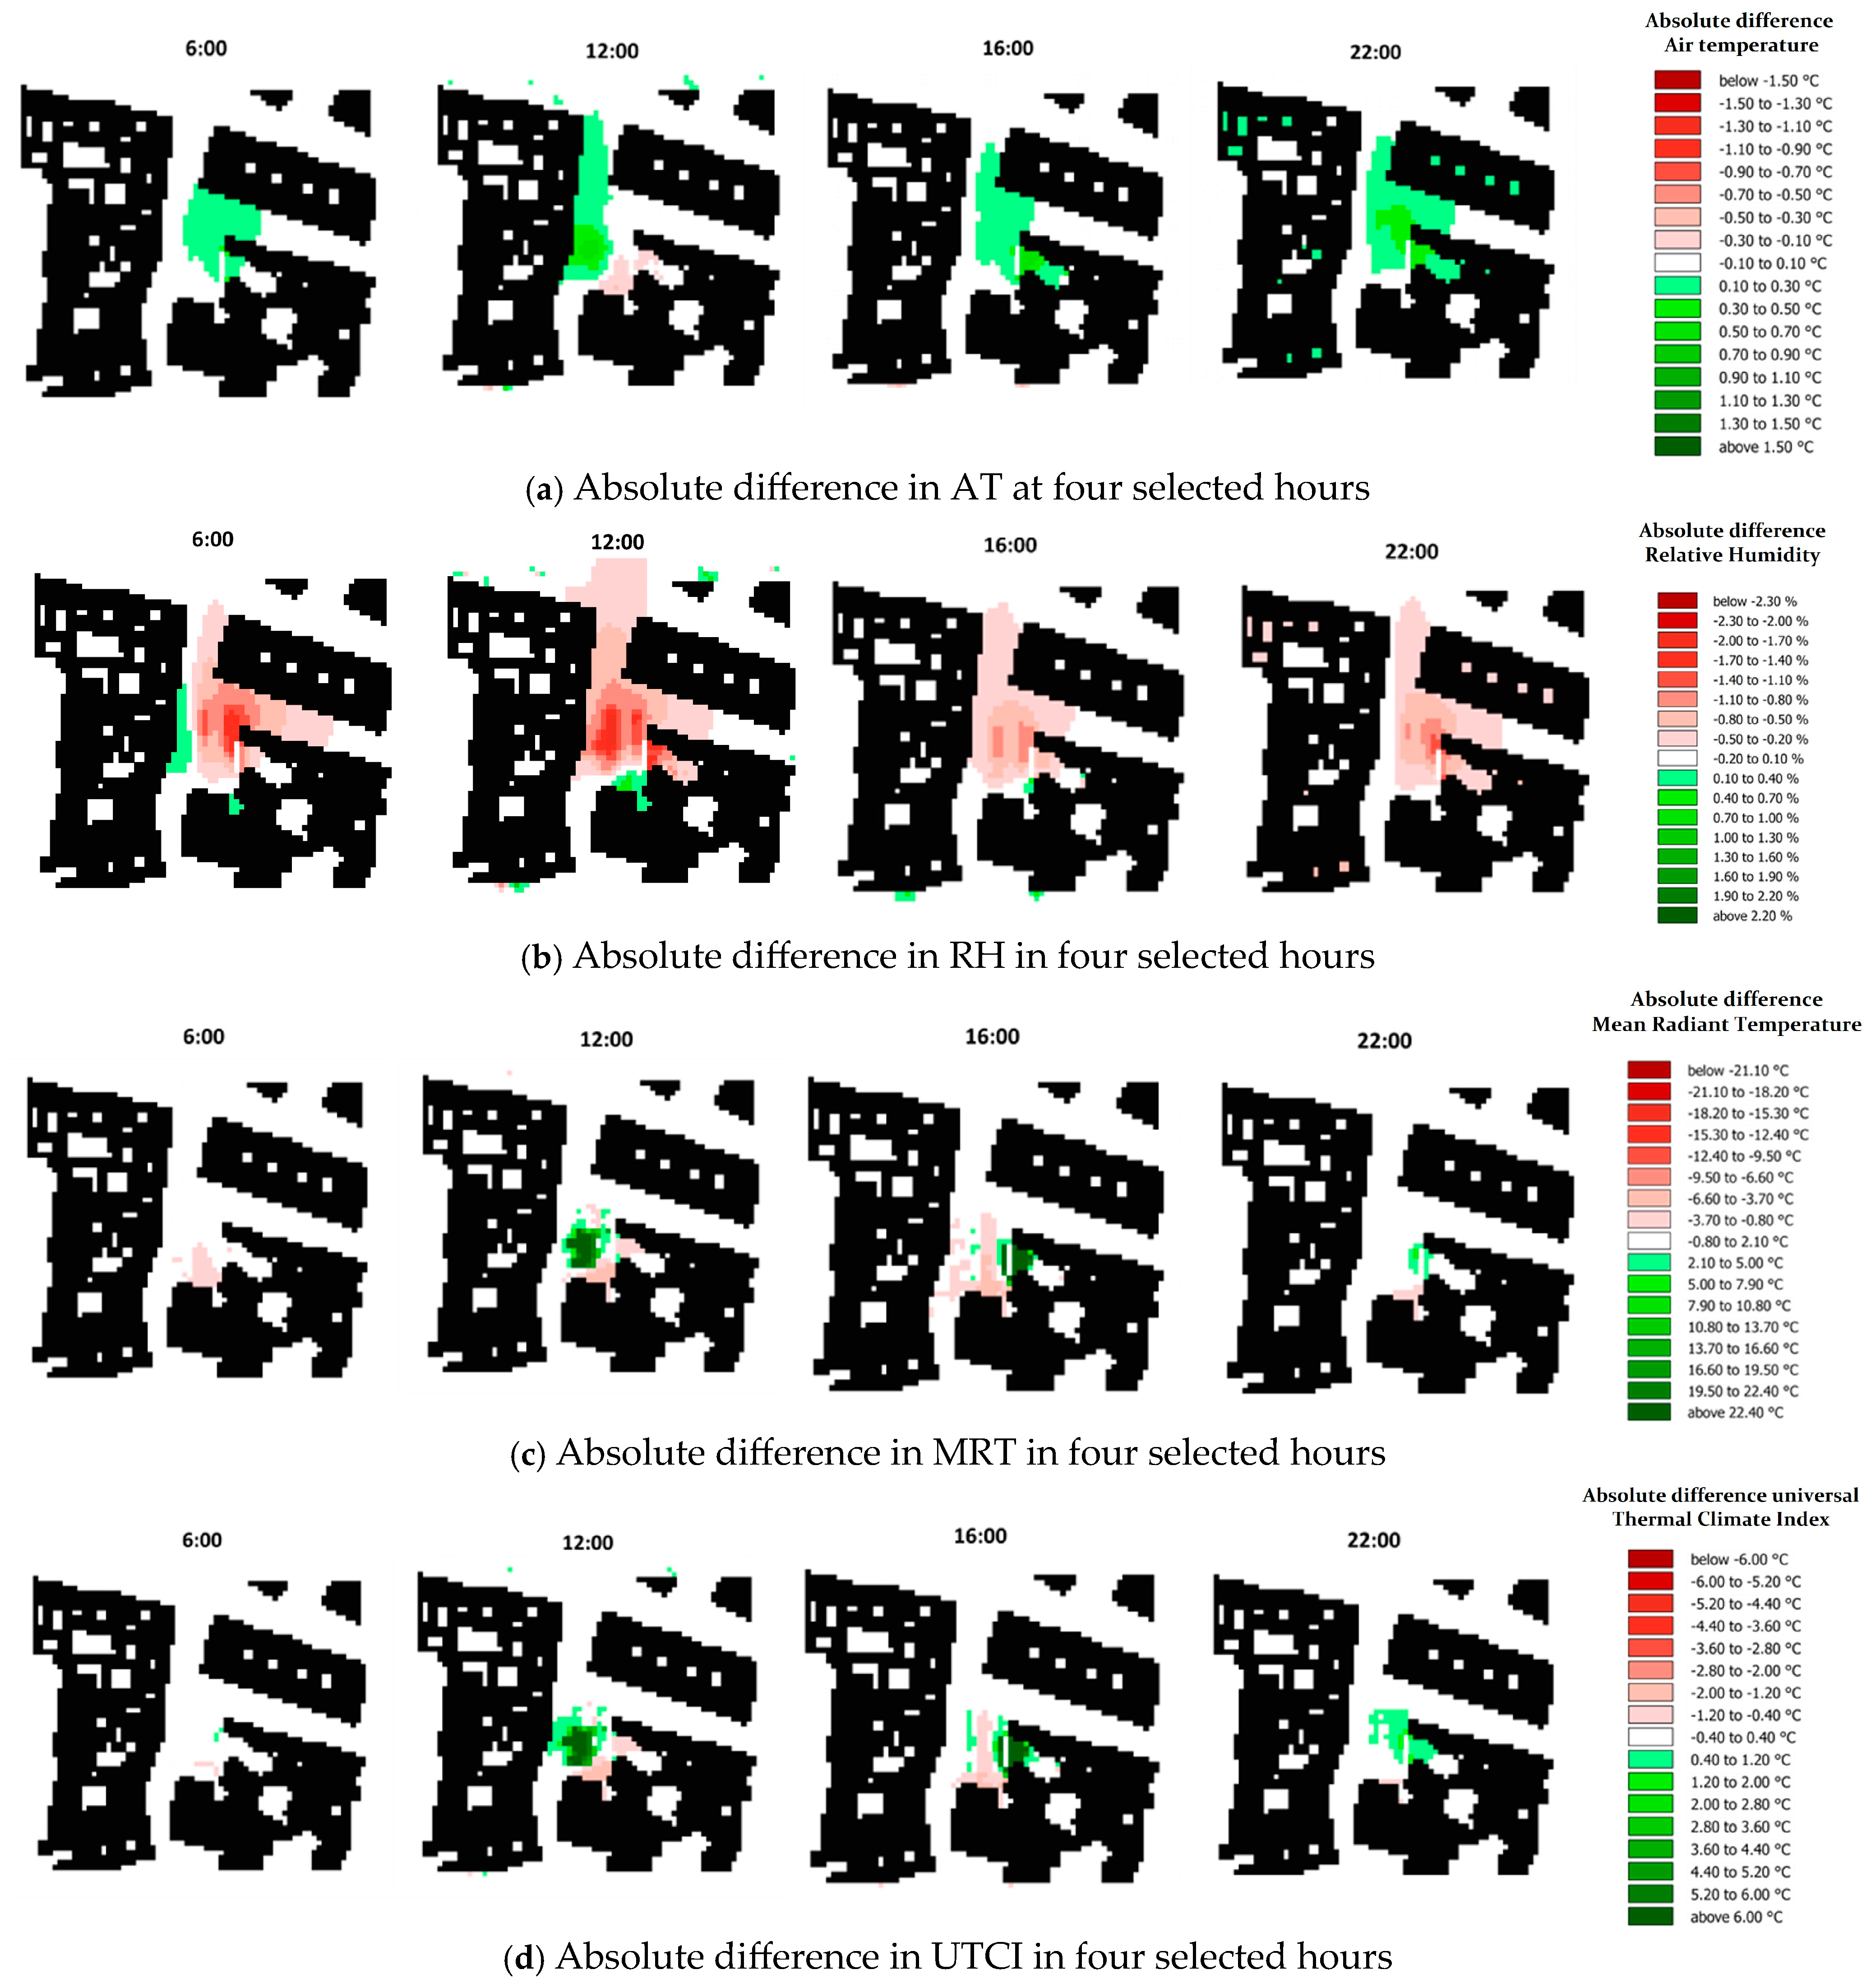
- Canopies emerged as the most impactful intervention, significantly reducing the UTCI values (by up to 6.5 °C in SJS and 5 °C in CBS) during peak hours by providing extensive shading.
- Green walls offered localized cooling effects, lowering the MRT by up to 5 °C while enhancing the aesthetic and ecological values.
- Paved grass and permeable asphalt demonstrated moderate cooling effects, reducing surface and ATs in heavily exposed and already shaded areas.
Author Contributions
Funding
Data Availability Statement
Conflicts of Interest
References
- United Nations, Department of Economic and Social Affairs, Population Division. World Urbanization Prospects The 2018 Revision (ST/ESA/SER.A/420); United Nations: New York, NY, USA, 2019. [Google Scholar]
- Salih, K.; Nagy, I.R.B. Review of the Role of Urban Green Infrastructure on Climate Resiliency: A Focus on Heat Mitigation Modelling Scenario on the Microclimate and Building Scale. Urban Sci. 2024, 8, 220. [Google Scholar] [CrossRef]
- Yilmaz, D.; Ozturk, S. Urban Heat Island From A 3d Modeling Perspective—A Review. Environ. Model. Assess. 2024, 29, 1111–1129. [Google Scholar] [CrossRef]
- Sola-Caraballo, J.; Lopez-Cabeza, V.P.; Roa-Fernández, J.; Rivera-Gomez, C.; Galan-Marin, C. Assessing and upgrading urban thermal resilience of a Spanish MoMo neighbourhood over the span of 1960–2080. Build. Environ. 2024, 256, 111485. [Google Scholar] [CrossRef]
- Chu, Z.; Li, S.; Li, T.; Qian, H.; Liu, C.; Yan, Z. Numerical simulation of layout and landscape elements on the thermal environment of urban squares. Ecol. Inform. 2024, 82, 102770. [Google Scholar] [CrossRef]
- Gonçalves, A.; Ribeiro, A.C.; Maia, F.; Nunes, L.; Feliciano, M. Influence of green spaces on outdoors thermal comfort-structured experiment in a Mediterranean climate. Climate 2019, 7, 20. [Google Scholar] [CrossRef]
- Aghamolaei, R.; Azizi, M.M.; Aminzadeh, B.; O’donnell, J. A comprehensive review of outdoor thermal comfort in urban areas: Effective parameters and approaches. Energy Environ. 2023, 34, 2204–2227. [Google Scholar] [CrossRef]
- Maruani, T.; Amit-Cohen, I. Open space planning models: A review of approaches and methods. Landsc. Urban Plan. 2007, 81, 1–13. [Google Scholar] [CrossRef]
- Chen, L.; Ng, E. Outdoor thermal comfort and outdoor activities: A review of research in the past decade. Cities 2012, 29, 118–125. [Google Scholar] [CrossRef]
- Mandić, L.; Đjukić, A.; Marić, J.; Mitrović, B. A Systematic Review of Outdoor Thermal Comfort Studies for the Urban (Re)Design of City Squares. Sustainability 2024, 16, 4920. [Google Scholar] [CrossRef]
- Zhang, J.; Zhang, F.; Jiang, L.; Guo, W.; Cao, Q.; Shi, M.; Xiao, A. Comparative review of urban geometric parameters and their uses in outdoor thermal environment studies. J. Urban Manag. 2024, 13, 541–552. [Google Scholar] [CrossRef]
- Tan, Y.; Li, C.; Feng, H.; Yang, J. Exploring the Land Cover Material Interaction of Urban Open Space on the Thermal Comfort of Crowds in High-Temperature Environments and Retrofit Strategies: Two Case Studies in the Nanjing Xinjiekou District. Land 2024, 13, 314. [Google Scholar] [CrossRef]
- da Silva, P.W.S.; Duarte, D.H.S.; Rahman, M.A.; Rötzer, T.; Pauleit, S. Testing Strategies for Planting Design in Urban Squares to Improve Human Comfort throughout the Seasons. Atmosphere 2024, 15, 870. [Google Scholar] [CrossRef]
- Banerjee, S.; Pek, R.X.Y.; Yik, S.K.; Ny Ching, G.; Ho, X.T.; Dzyuban, Y.; Crank, P.J.; Acero, J.A.; Chow, W.T. Assessing impact of urban densification on outdoor microclimate and thermal comfort using ENVI-met simulations for Combined Spatial-Climatic Design (CSCD) approach. Sustain. Cities Soc. 2024, 105, 105302. [Google Scholar] [CrossRef]
- Pistore, L.; Pasut, W. Roots and Mechanisms of Thermal Comfort Expectations: From Individuals’ Own Background to Adaptation and Change. In Proceedings of the 5th International Conference on Building Energy and Environment; Wang, L.L., Ge, H., Zhai, Z.J., Qi, D., Ouf, M., Sun, C., Wang, D., Eds.; Springer Nature: Singapore, 2023; pp. 2325–2336. [Google Scholar]
- Lenzuni, P.; Freda, D.; Del Gaudio, M. Classification of thermal environments for comfort assessment. Ann. Occup. Hyg. 2009, 53, 325–332. [Google Scholar] [CrossRef] [PubMed]
- Ahmed, N.M.; Altamura, P.; Giampaoletti, M.; Hemeida, F.A.; Mohamed, A.F.A. Optimizing human thermal comfort and mitigating the urban heat island effect on public open spaces in Rome, Italy through sustainable design strategies. Sci. Rep. 2024, 14, 19931. [Google Scholar] [CrossRef] [PubMed]
- Njoku, C.A.; Daramola, M.T. Human Outdoor Thermal Comfort Assessment in a Tropical Region: A Case Study. Earth Syst. Environ. 2019, 3, 29–42. [Google Scholar] [CrossRef]
- Błażejczyk, K. UTCI—10 years of applications. Int. J. Biometeorol. 2021, 65, 1461–1462. [Google Scholar] [CrossRef]
- Brecht, B.M.; Schädler, G.; Schipper, J.W. UTCI climatology and its future change in Germany—An RCM ensemble approach. Meteorol. Z. 2020, 29, 97–116. [Google Scholar] [CrossRef]
- UTCI—Universal Thermal Climate Index. n.d. Available online: http://www.utci.org/ (accessed on 3 June 2020).
- Jendritzky, G.; de Dear, R.; Havenith, G. UTCI—Why another thermal index? Int. J. Biometeorol. 2012, 56, 421–428. [Google Scholar] [CrossRef]
- Krüger, E.L. Literature Review on UTCI Applications. In Applications of the Universal Thermal Climate Index UTCI in Biometeorology: Latest Developments and Case Studies; Krüger, E.L., Ed.; Springer International Publishing: Cham, Switzerland, 2021; pp. 23–65. [Google Scholar] [CrossRef]
- Lee, H.; Park, S.; Mayer, H. Approach for the vertical wind speed profile implemented in the UTCI basics blocks UTCI applications at the urban pedestrian level. Int. J. Biometeorol. 2024, 1–14. [Google Scholar] [CrossRef] [PubMed]
- Feng, L.; Yang, S.; Zhou, Y.; Sun, J. Optimization strategy of architectural forms to improve the thermal comfort of residential area. J. Build. Eng. 2024, 86, 108905. [Google Scholar] [CrossRef]
- Li, Y.; Zhang, Y.; Wang, Y.; Song, Z.; Zhou, Z.; Ding, L.; Chen, C.; Jin, X.; Cheng, Y. Assessing thermal comfort for the elderly in historical districts and proposing adaptive urban design strategies: A case study in Zhenjiang, China. Landsc. Ecol. Eng. 2024, 21, 29–46. [Google Scholar] [CrossRef]
- Lin, C.; Wu, Z.; Li, H.; Huang, J.; Huang, Q. Comprehensive analysis on the thermal comfort of various greening forms: A study in hot-humid areas. Environ. Res. Commun. 2024, 6, 025010. [Google Scholar] [CrossRef]
- Yahia, M.W.; Johansson, E.; Thorsson, S.; Lindberg, F.; Rasmussen, M.I. Effect of urban design on microclimate and thermal comfort outdoors in warm-humid Dar es Salaam, Tanzania. Int. J. Biometeorol. 2018, 62, 373–385. [Google Scholar] [CrossRef] [PubMed]
- Coccolo, S.; Paoli, M.D.; Stracqualursi, A.; Andreucci, M.B. Design the Urban Microclimate: Nature-Based Solutions and Technology at Nexus. In Urban Services to Ecosystems: Green Infrastructure Benefits from the Landscape to the Urban Scale; Catalano, C., Andreucci, M.B., Guarino, R., Bretzel, F., Leone, M., Pasta, S., Eds.; Springer International Publishing: Cham, Switzerland, 2021; pp. 413–433. [Google Scholar] [CrossRef]
- Gomaa, M.M.; El Menshawy, A.; Nabil, J.; Ragab, A. Investigating the Impact of Various Vegetation Scenarios on Outdoor Thermal Comfort in Low-Density Residential Areas of Hot Arid Regions. Sustainability 2024, 16, 3995. [Google Scholar] [CrossRef]
- Kamata, Y.; Kang, J.E. Effect of greening vacant houses on improvement in thermal environment using ENVI-met simulation: A case study on Busan metropolitan city. Environ. Plan. B Urban Anal. City Sci. 2024, 51, 1308–1321. [Google Scholar] [CrossRef]
- Nouri, A.S.; Costa, J.P.; Santamouris, M.; Matzarakis, A. Approaches to outdoor thermal comfort thresholds through public space design: A review. Atmosphere 2018, 9, 108. [Google Scholar] [CrossRef]
- Ma, X.; Chau, C.; Lu, S.; Leung, T.; Li, H. Modelling the effects of neighbourhood and street geometry on pedestrian thermal comfort in Hong Kong. Arch. Sci. Rev. 2024, 1–16. [Google Scholar] [CrossRef]
- Liu, Z.; Li, J.; Xi, T. A Review of Thermal Comfort Evaluation and Improvement in Urban Outdoor Spaces. Buildings 2023, 13, 3050. [Google Scholar] [CrossRef]
- Qi, J.; He, B.-J. Urban Heat Mitigation Strategies. In Climate Change and Cooling Cities; Cheshmehzangi, A., He, B.-J., Sharifi, A., Matzarakis, A., Eds.; Springer Nature: Singapore, 2023; pp. 21–44. [Google Scholar] [CrossRef]
- Srivastava, V.T.; Sharma, A.; Jadon, S.S. A review of the formation, mitigation strategies from 50 years of global urban heat island studies. Environ. Dev. Sustain. 2024. [Google Scholar] [CrossRef]
- Irfeey, A.M.M.; Chau, H.-W.; Sumaiya, M.M.F.; Wai, C.Y.; Muttil, N.; Jamei, E. Sustainable Mitigation Strategies for Urban Heat Island Effects in Urban Areas. Sustainability 2023, 15, 10767. [Google Scholar] [CrossRef]
- Santamouris, M.; Ding, L.; Fiorito, F.; Oldfield, P.; Osmond, P.; Paolini, R.; Prasad, D.; Synnefa, A. Passive and active cooling for the outdoor built environment—Analysis and assessment of the cooling potential of mitigation technologies using performance data from 220 large scale projects. Sol. Energy 2017, 154, 14–33. [Google Scholar] [CrossRef]
- Santamouris, M.; Synnefa, A.; Karlessi, T. Using advanced cool materials in the urban built environment to mitigate heat islands and improve thermal comfort conditions. Sol. Energy 2011, 85, 3085–3102. [Google Scholar] [CrossRef]
- Castellani, B.; Morini, E.; Anderini, E.; Filipponi, M.; Rossi, F. Development and characterization of retro-reflective colored tiles for advanced building skins. Energy Build. 2017, 154, 513–522. [Google Scholar] [CrossRef]
- Zhang, R.; Xu, X.; Liu, K.; Kong, L.; Wang, W.; Wortmann, T. Airflow modelling for building design: A designers’ review. Renew. Sustain. Energy Rev. 2024, 197, 114380. [Google Scholar] [CrossRef]
- Li, Y.; Ren, C.; Ho, J.Y.-E.; Shi, Y. Landscape metrics in assessing how the configuration of urban green spaces affects their cooling effect: A systematic review of empirical studies. Landsc. Urban Plan. 2023, 239, 104842. [Google Scholar] [CrossRef]
- Zhao, Y.; Zhao, K.; Zhang, X.; Zhang, Y.; Du, Z. Assessment of combined passive cooling strategies for improving outdoor thermal comfort in a school courtyard. Build. Environ. 2024, 252, 111247. [Google Scholar] [CrossRef]
- Lopez-Cabeza, V.P.; Alzate-Gaviria, S.; Diz-Mellado, E.; Rivera-Gomez, C.; Galan-Marin, C. Albedo influence on the microclimate and thermal comfort of courtyards under Mediterranean hot summer climate conditions. Sustain. Cities Soc. 2022, 81, 103872. [Google Scholar] [CrossRef]
- Lai, D.; Liu, W.; Gan, T.; Liu, K.; Chen, Q. A review of mitigating strategies to improve the thermal environment and thermal comfort in urban outdoor spaces. Sci. Total Environ. 2019, 661, 337–353. [Google Scholar] [CrossRef] [PubMed]
- Garcia-Nevado, E.; Beckers, B.; Coch, H. Assessing the cooling effect of urban textile shading device through time-lapse thermography. Sustain. Cities Soc. 2020, 63, 102458. [Google Scholar] [CrossRef]
- Wang, Q.; Peng, L.L.; Jiang, W.; Yin, S.; Feng, N.; Yao, L. Urban form affects the cool island effect of urban greenery via building shadows. Build. Environ. 2024, 254, 111398. [Google Scholar] [CrossRef]
- Doulos, L.; Santamouris, M.; Livada, I. Passive cooling of outdoor urban spaces. The role of materials. Sol. Energy 2004, 77, 231–249. [Google Scholar] [CrossRef]
- Kolokotsa, D.D.; Giannariakis, G.; Gobakis, K.; Giannarakis, G.; Synnefa, A.; Santamouris, M. Cool roofs and cool pavements application in Acharnes, Greece. Sustain. Cities Soc. 2018, 37, 466–474. [Google Scholar] [CrossRef]
- Diz-Mellado, E.; López-Cabeza, V.P.; Rivera-Gómez, C.; Naboni, E.; Galán-Marín, C. Optimizing a courtyard microclimate with adaptable shading and evaporative cooling in a hot mediterranean climate. J. Build. Eng. 2024, 88, 109167. [Google Scholar] [CrossRef]
- Bruse, M.; Simon, H. ENVI-Met. 2004. Available online: https://envi-met.com (accessed on 3 January 2025).
- Faragallah, R.N.; Ragheb, R.A. Evaluation of thermal comfort and urban heat island through cool paving materials using ENVI-Met. Ain Shams Eng. J. 2022, 13, 101609. [Google Scholar] [CrossRef]
- Sola-Caraballo, J.; Lopez-Cabeza, V.P.; Roa-Fernandez, J.; Rivera-Gomez, C.; Palomares-Figueres, M.T.; Galan-Marin, C. Assessing the microclimatic adaptation of a Modern Movement 1960s neighbourhood through its urban evolution. In Proceedings of the 18th IBPSA International Conference, Buildings Simulation 2023, Shanghai, China, 4–6 September 2023. [Google Scholar] [CrossRef]
- Parison, S.; Chaumont, M.; Kounkou-Arnaud, R.; Long, F.; Bernik, A.; Da Silva, M.; Hendel, M. The Effects of Greening a Parking Lot as a Heat Mitigation Strategy on Outdoor Thermal Stress Using Fixed and Mobile Measurements: Case-Study Project “Tertiary Forest. Sustain. Cities Soc. 2023, 98, 104818. [Google Scholar] [CrossRef]
- Wollschläger, N.; Zinck, F.; Schlink, U. Sustainable Urban Development for Heat Adaptation of Small and Medium Sized Communities. Land 2022, 11, 1385. [Google Scholar] [CrossRef]
- Maiullari, D.; Gherri, B.; Finizza, C.; Maretto, M.; Naboni, E. Climate change and indoor temperature variation in Venetian buildings: The role of density and urban form. J. Phys. Conf. Ser. 2021, 2042, 012060. [Google Scholar] [CrossRef]
- Santamouris, M.; Yun, G.Y. Recent development and research priorities on cool and super cool materials to mitigate urban heat island. Renew. Energy 2020, 161, 792–807. [Google Scholar] [CrossRef]
- Takva, Y.; Takva, Ç.; İlerisoy, Z.Y. Sustainable Adaptive Reuse Strategy Evaluation for Cultural Heritage Buildings. Int. J. Built Environ. Sustain. 2023, 10, 25–37. [Google Scholar] [CrossRef]
- Aguilar-Sanchez, M.; Almodovar-Melendo, J.-M.; Cabeza-Lainez, J. Thermal Performance Assessment of Burkina Faso’s Housing Typologies. Buildings 2023, 13, 2719. [Google Scholar] [CrossRef]
- Lopez-Cabeza, V.P.; Agarwal, A. Sustainable strategies for improving passive survivability of the traditional Pol House in Ahmedabad. Build. Environ. 2022, 207, 108503. [Google Scholar] [CrossRef]
- Sola-Caraballo, J.; Serrano-Jiménez, A.; Rivera-Gomez, C.; Galan-Marin, C. Multi-Criteria Assessment of Urban Thermal Hotspots: A GIS-Based Remote Sensing Approach in a Mediterranean Climate City. Remote Sens. 2025, 17, 231. [Google Scholar] [CrossRef]
- Gobierno de España, Agencia Estatal de Meteorología—AEMET. n.d. Available online: http://www.aemet.es/es/portada (accessed on 4 September 2023).
- López-Cabeza, V.; Galán-Marín, C.; Rivera-Gómez, C.; Roa-Fernández, J. Courtyard microclimate ENVI-met outputs deviation from the experimental data. Build. Environ. 2018, 144, 129–141. [Google Scholar] [CrossRef]
- Complete Guide—ENVI-Met. n.d. Available online: https://envi-met.com/tutorials-overview/ (accessed on 22 July 2024).
- ASHRAE. ASHRAE Guideline 14-2014. Measurement of Energy, Demand, and Water Savings. 2014. Available online: https://www.ashrae.org/technical-resources/standards-and-guidelines#technology1 (accessed on 3 January 2025).
- Pacifici, M.; Nieto-Tolosa, M. Comparing ENVI-Met and Grasshopper Modelling Strategies to Assess Local Thermal Stress and Urban Heat Island Effects. In Urban Microclimate Modelling for Comfort and Energy Studies; Palme, M., Salvati, A., Eds.; Springer International Publishing: Cham, Switzerland, 2021; pp. 293–316. [Google Scholar] [CrossRef]
- Perini, K.; Chokhachian, A.; Dong, S.; Auer, T. Modeling and simulating urban outdoor comfort: Coupling ENVI-Met and TRNSYS by grasshopper. Energy Build. 2017, 152, 373–384. [Google Scholar] [CrossRef]
- Gál, C.V.; Kántor, N. A comparative numerical simulation and validation study. Urban Clim. 2020, 32, 100571. [Google Scholar] [CrossRef]
- Crank, P.J.; Middel, A.; Wagner, M.; Hoots, D.; Smith, M.; Brazel, A. Validation of seasonal mean radiant temperature simulations in hot arid urban climates. Sci. Total Environ. 2020, 749, 141392. [Google Scholar] [CrossRef] [PubMed]
- Taleghani, M.; Sailor, D.; A Ban-Weiss, G. Micrometeorological simulations to predict the impacts of heat mitigation strategies on pedestrian thermal comfort in a Los Angeles neighborhood. Environ. Res. Lett. 2016, 11, 024003. [Google Scholar] [CrossRef]
- Cohen, P.; Potchter, O.; Schnell, I. The impact of an urban park on air pollution and noise levels in the Mediterranean city of Tel-Aviv, Israel. Environ. Pollut. 2014, 195, 73–83. [Google Scholar] [CrossRef]
- Shashua-Bar, L.; Hoffman, M.E. Vegetation as a climatic component in the design of an urban street: An empirical model for predicting the cooling effect of urban green areas with trees. Energy Build. 2000, 31, 221–235. [Google Scholar] [CrossRef]
- Pisello, A.L.; Cotana, F. The thermal effect of an innovative cool roof on residential buildings in Italy: Results from two years of continuous monitoring. Energy Build. 2014, 69, 154–164. [Google Scholar] [CrossRef]


| Instrument and Model | TROTEC TC100 Thermo-Hygrometer | TROTEC TA300 Anemometer | Testo 905 T2 Thermometer |
|---|---|---|---|
| Range | Temperature: −20 °C to 60 °C Humidity: 1% to 99% RH | Wind Speed: 0.4 m/s to 30 m/s Air Velocity: 0.4 m/s to 30 m/s Temperature: −20 °C to 60 °C | −50 °C to 300 °C |
| Accuracy | Temperature: ±0.5 °C at 25 °C Humidity: ±3% RH (at 25 °C, 30% to 80% RH); ±5% RH (at 25 °C, <30% RH or >80% RH) | Wind Speed/Air Velocity: ±3% of reading ±0.1 m/s Temperature: ±0.8 °C | ±1 °C (−50 °C to −20.1 °C); ±0.5 °C (−20 °C to 99.9 °C); ±1% of reading (remaining range) |
| Resolution | Temperature: 0.1 °C Humidity: 0.1% RH | Wind Speed/Air Velocity: 0.1 m/s Temperature: 0.1 °C | 0.1 °C |
| Operating Environment | Temperature: 0 °C to 50 °C Humidity: 0% to 95% RH (non-condensing) | Temperature: 0 °C to 50 °C Humidity: 0% to 80% RH (non-condensing) | temperature: −20 °C to 50 °C |
| Parameters | SJS | CBS |
|---|---|---|
| Number of grid cells | 80 × 70 × 15 | 100 × 105 × 30 |
| Size of the cells (m) (x,y,z) | 2 × 2 × 2 | 2 × 2 × 2 |
| Nesting grids | 4 | 4 |
| Model rotation out of north | 0 | 0 |
| Telescoping factor (%) | 15 | 15 |
| Telescoping starts after height (m) | 20 | 20 |
| Image of the model |  | 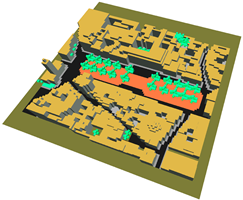 |
| Meteorological inputs | Air temperature and relative humidity | Hourly data in Table 4 |
| Wind speed and direction | 1 m/s = 191.73° | |
| Specific humidity at 2500 m | 8.0 g/kg | |
| Roughness length | 0.01 m | |
| Vegetation | 3D tree Simple plant | 02SSSS, 02ALDM, 02ALDS (SJS) 0200XX, 020027, 010027, 01PLDM, 02ALDM, 02ALDS (CBS) |
| Building | Walls and roof materials | Table 5 |
| Soil | Initial conditions for soil materials (Table 5) | Upper layer (0–20 cm): 65%/20 °C Middle layer (20–50 cm): 70%/20 °C Deep layer (50–200 cm): 75%/19 °C |
| Simulation | Start simulation day (DD.MM.YYYY) Start simulation time (HH:MM: SS) | 22.07.2023 21.00.00 |
| Total simulation time (hours) | 28 h |
| Hour | AT (°C) | RH (%) | Hour | AT (°C) | RH (%) | Hour | AT (°C) | RH (%) | Hour | AT (°C) | RH (%) |
|---|---|---|---|---|---|---|---|---|---|---|---|
| 0:00 | 25.3 | 43 | 6:00 | 21.7 | 67 | 12:00 | 29.2 | 41 | 18:00 | 36.5 | 18 |
| 1:00 | 23.6 | 49 | 7:00 | 21.6 | 66 | 13:00 | 31.1 | 37 | 19:00 | 37.4 | 18 |
| 2:00 | 22.7 | 58 | 8:00 | 22.1 | 66 | 14:00 | 32.9 | 31 | 20:00 | 36.5 | 19 |
| 3:00 | 22.5 | 64 | 9:00 | 24.1 | 61 | 15:00 | 34.8 | 26 | 21:00 | 34.5 | 24 |
| 4:00 | 21.7 | 65 | 10:00 | 26.3 | 54 | 16:00 | 36.0 | 24 | 22:00 | 32.0 | 32 |
| 5:00 | 21.8 | 67 | 11:00 | 27.5 | 49 | 17:00 | 36.3 | 26 | 23:00 | 29.7 | 37 |
| Property/Material | Absorp. | Transmis. | Albedo | Emissiv. | Vol. Heat ((J/(m3·K)) × 106) | T.Conduct. (W/(m·K)) | Density (kg/m3) | Z0 Roughness Length (m) |
|---|---|---|---|---|---|---|---|---|
| Existing materials | ||||||||
| Asphalt | 0.88 | - | 0.12 | 0.90 | 2.251 | 0.90 | - | 0.010 |
| Concrete | 0.50 | - | 0.50 | 0.93 | 2.083 | 1.63 | - | 0.010 |
| Red cobblestone | 0.70 | - | 0.30 | 0.90 | 2 | 1.00 | - | 0.010 |
| Granite pavement | 0.65 | - | 0.35 | 0.90 | 2.345 | 3.10 | - | 0.010 |
| Natural soil | 0.80 | - | 0.20 | 0.90 | 1.320 | 0.00 | - | 0.015 |
| Proposed materials | ||||||||
| Clear permeable concrete | 0.50 | - | 0.50 | 0.93 | 1.750 | 1.00 | - | 0.010 |
| Paved grass | 0.70 | - | 0.30 | 0.97 | 0.836 | 0.00 | - | 0.015 |
| Textile shade | 0.20 | 0.30 | 0.50 | 0.70 | Specific Heat 1500 J/(kg K) | 0.19 | 350 | 0.020 |
| NMBE | MAPE | RMSE | CV(RMSE) | ||
|---|---|---|---|---|---|
| AT | SJS | 15% | 12% | 5.4 | 14% |
| CBS | 17% | 13% | 5.0 | 16% | |
| RH | SJS | 0% | 0% | 1.1 | 5% |
| CBS | −3.90% | −3% | 2.7 | 8% | |
| MRT | SJS | 17.3% | 14% | 6.4 | 16% |
| CBS | 3.80% | 3% | 4.1 | 12% | |
| UTCI | SJS | 19.7% | 16% | 9.8 | 25% |
| CBS | −8.10% | −9% | 5.3 | 17% |
Disclaimer/Publisher’s Note: The statements, opinions and data contained in all publications are solely those of the individual author(s) and contributor(s) and not of MDPI and/or the editor(s). MDPI and/or the editor(s) disclaim responsibility for any injury to people or property resulting from any ideas, methods, instructions or products referred to in the content. |
© 2025 by the authors. Licensee MDPI, Basel, Switzerland. This article is an open access article distributed under the terms and conditions of the Creative Commons Attribution (CC BY) license (https://creativecommons.org/licenses/by/4.0/).
Share and Cite
Rezaie, P.; Lopez-Cabeza, V.P.; Sola-Caraballo, J.; Galan-Marin, C. Cooling Heritage Scenarios: Transforming Historic Squares for Thermal Comfort. Buildings 2025, 15, 564. https://doi.org/10.3390/buildings15040564
Rezaie P, Lopez-Cabeza VP, Sola-Caraballo J, Galan-Marin C. Cooling Heritage Scenarios: Transforming Historic Squares for Thermal Comfort. Buildings. 2025; 15(4):564. https://doi.org/10.3390/buildings15040564
Chicago/Turabian StyleRezaie, Pegah, Victoria Patricia Lopez-Cabeza, Javier Sola-Caraballo, and Carmen Galan-Marin. 2025. "Cooling Heritage Scenarios: Transforming Historic Squares for Thermal Comfort" Buildings 15, no. 4: 564. https://doi.org/10.3390/buildings15040564
APA StyleRezaie, P., Lopez-Cabeza, V. P., Sola-Caraballo, J., & Galan-Marin, C. (2025). Cooling Heritage Scenarios: Transforming Historic Squares for Thermal Comfort. Buildings, 15(4), 564. https://doi.org/10.3390/buildings15040564