


Study on the Application and Deformation Characteristics of Construction Waste Recycled Materials in Highway Subgrade Engineering
Abstract
:1. Introduction
2. Basic Properties of Recycled Materials from Construction Waste
2.1. Basic Properties of Recycled Materials
2.1.1. Water Absorption and Apparent Density
2.1.2. Crushing Value and Content of Flaky Particles
2.1.3. Recycled Fine Aggregate Properties
2.2. Roadworthiness of Recycled Materials
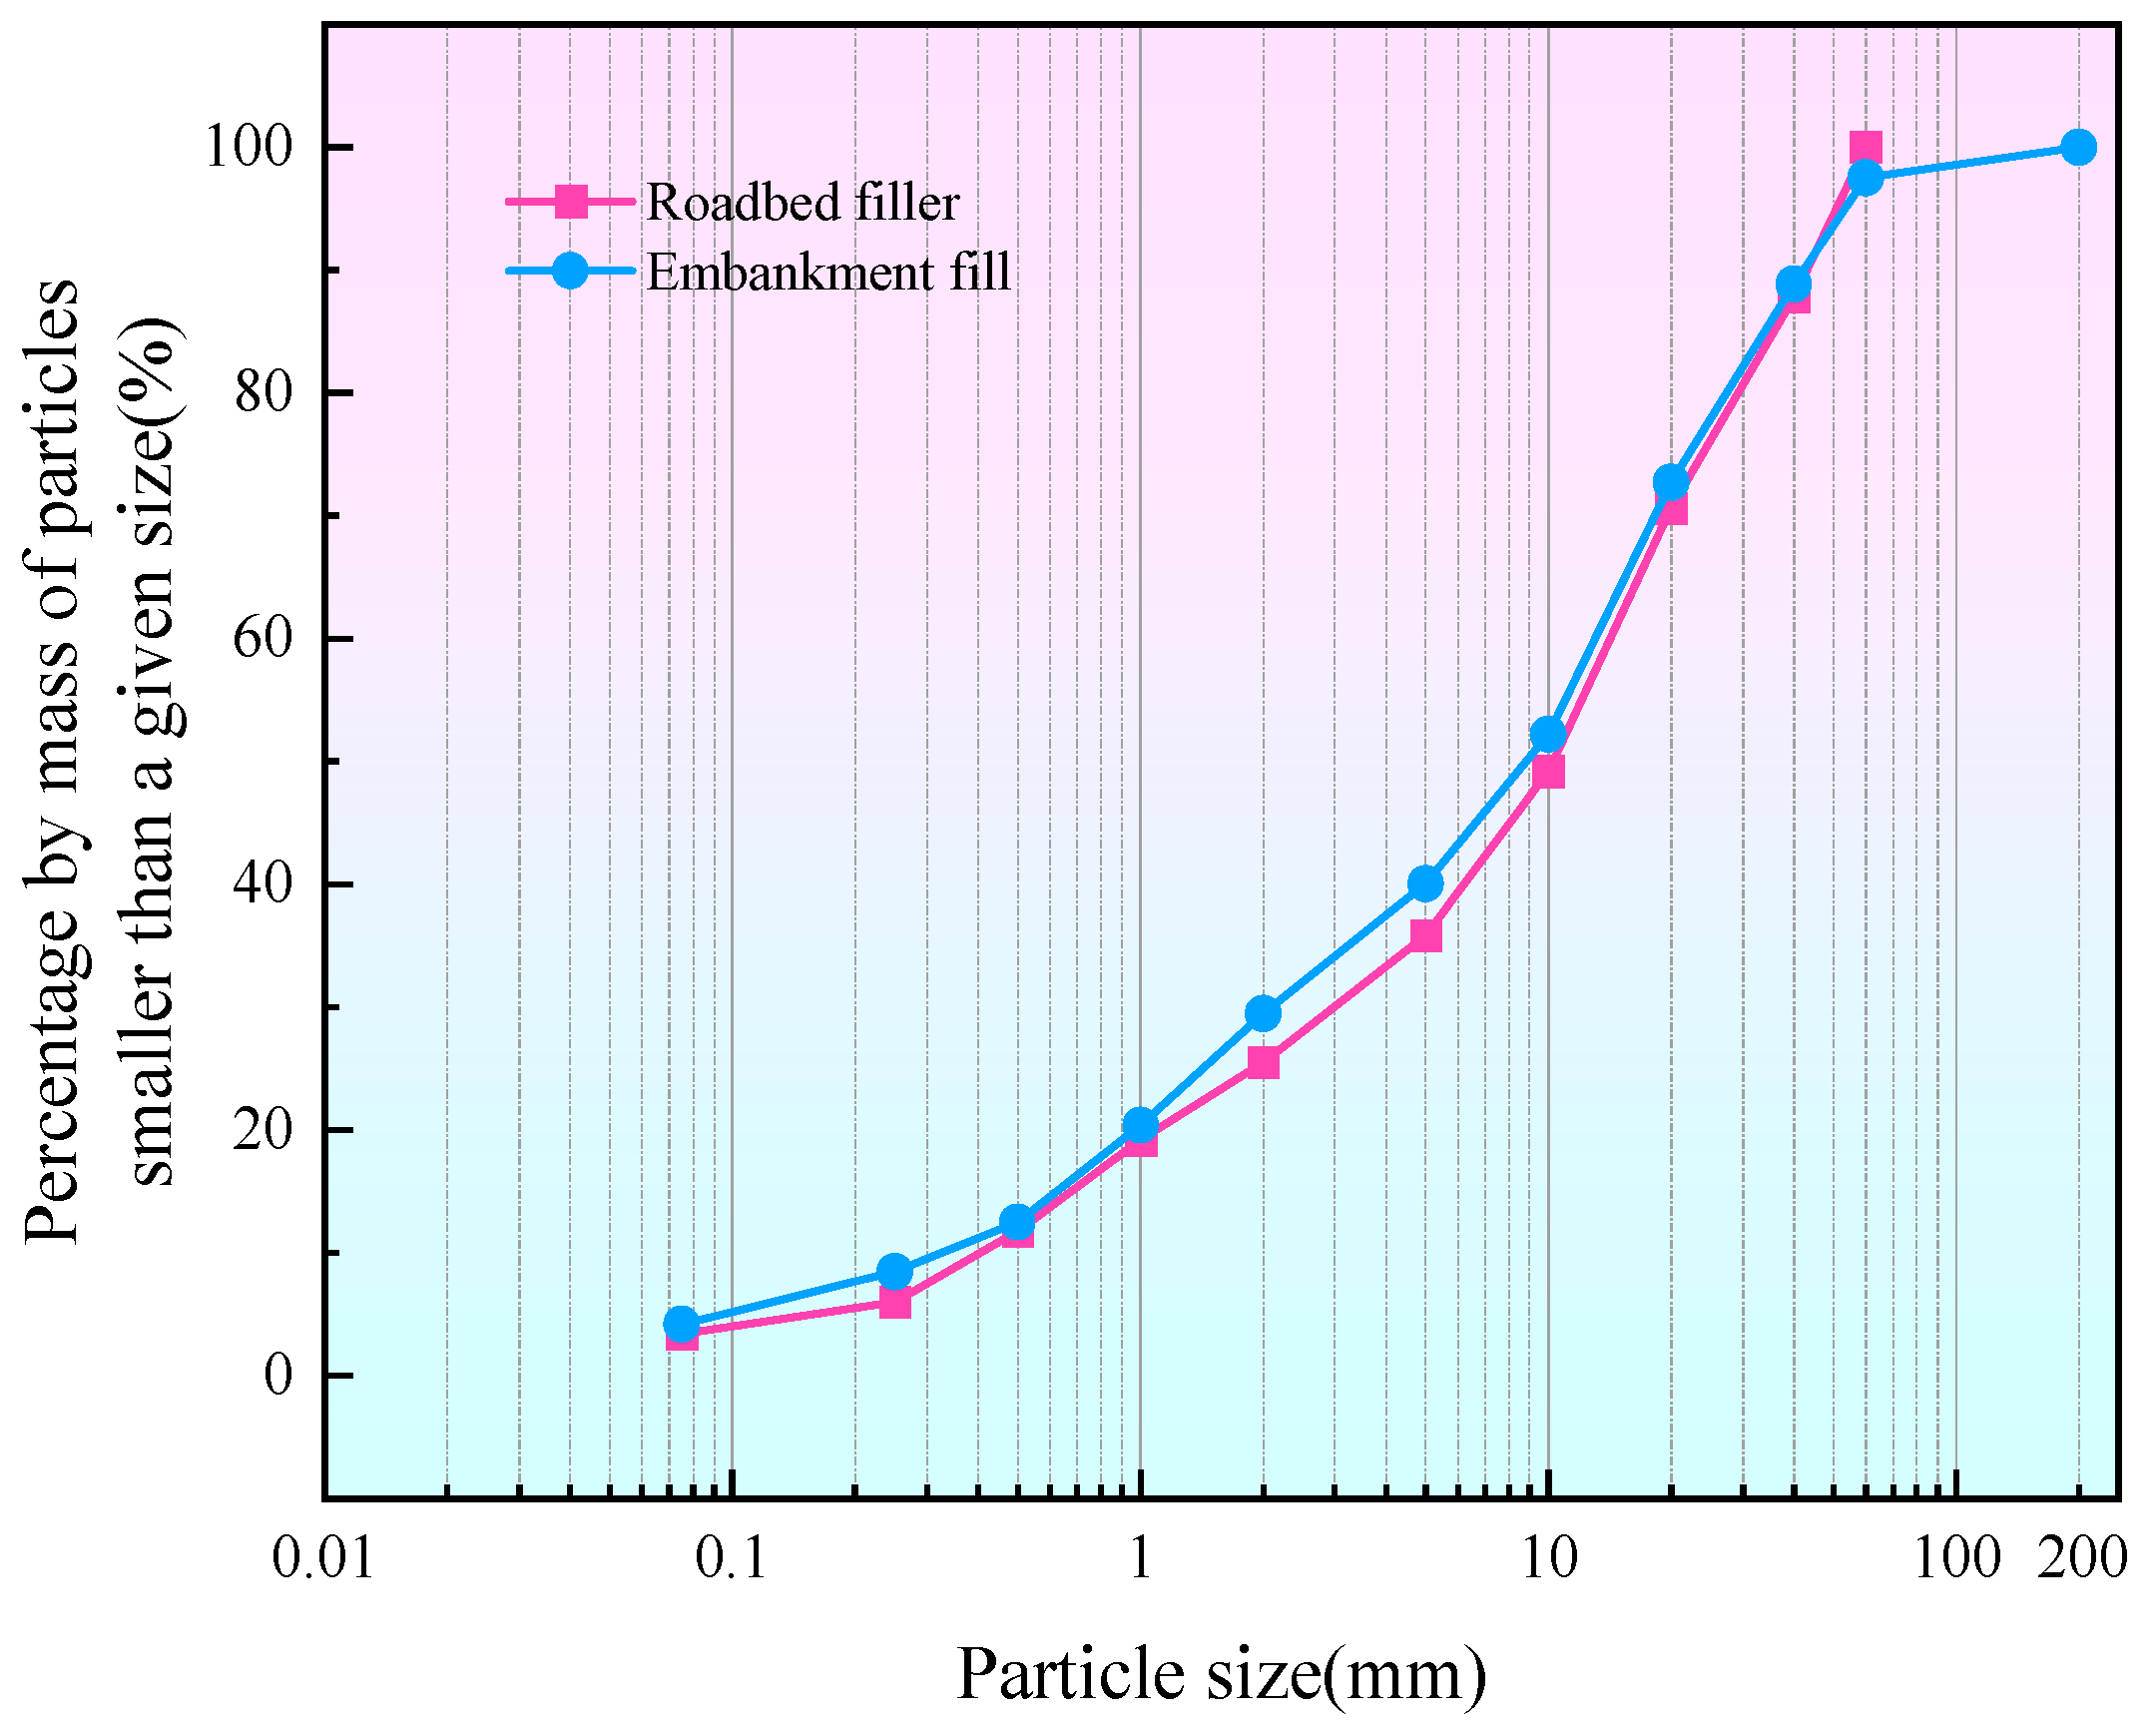
2.2.1. Grain Gradation
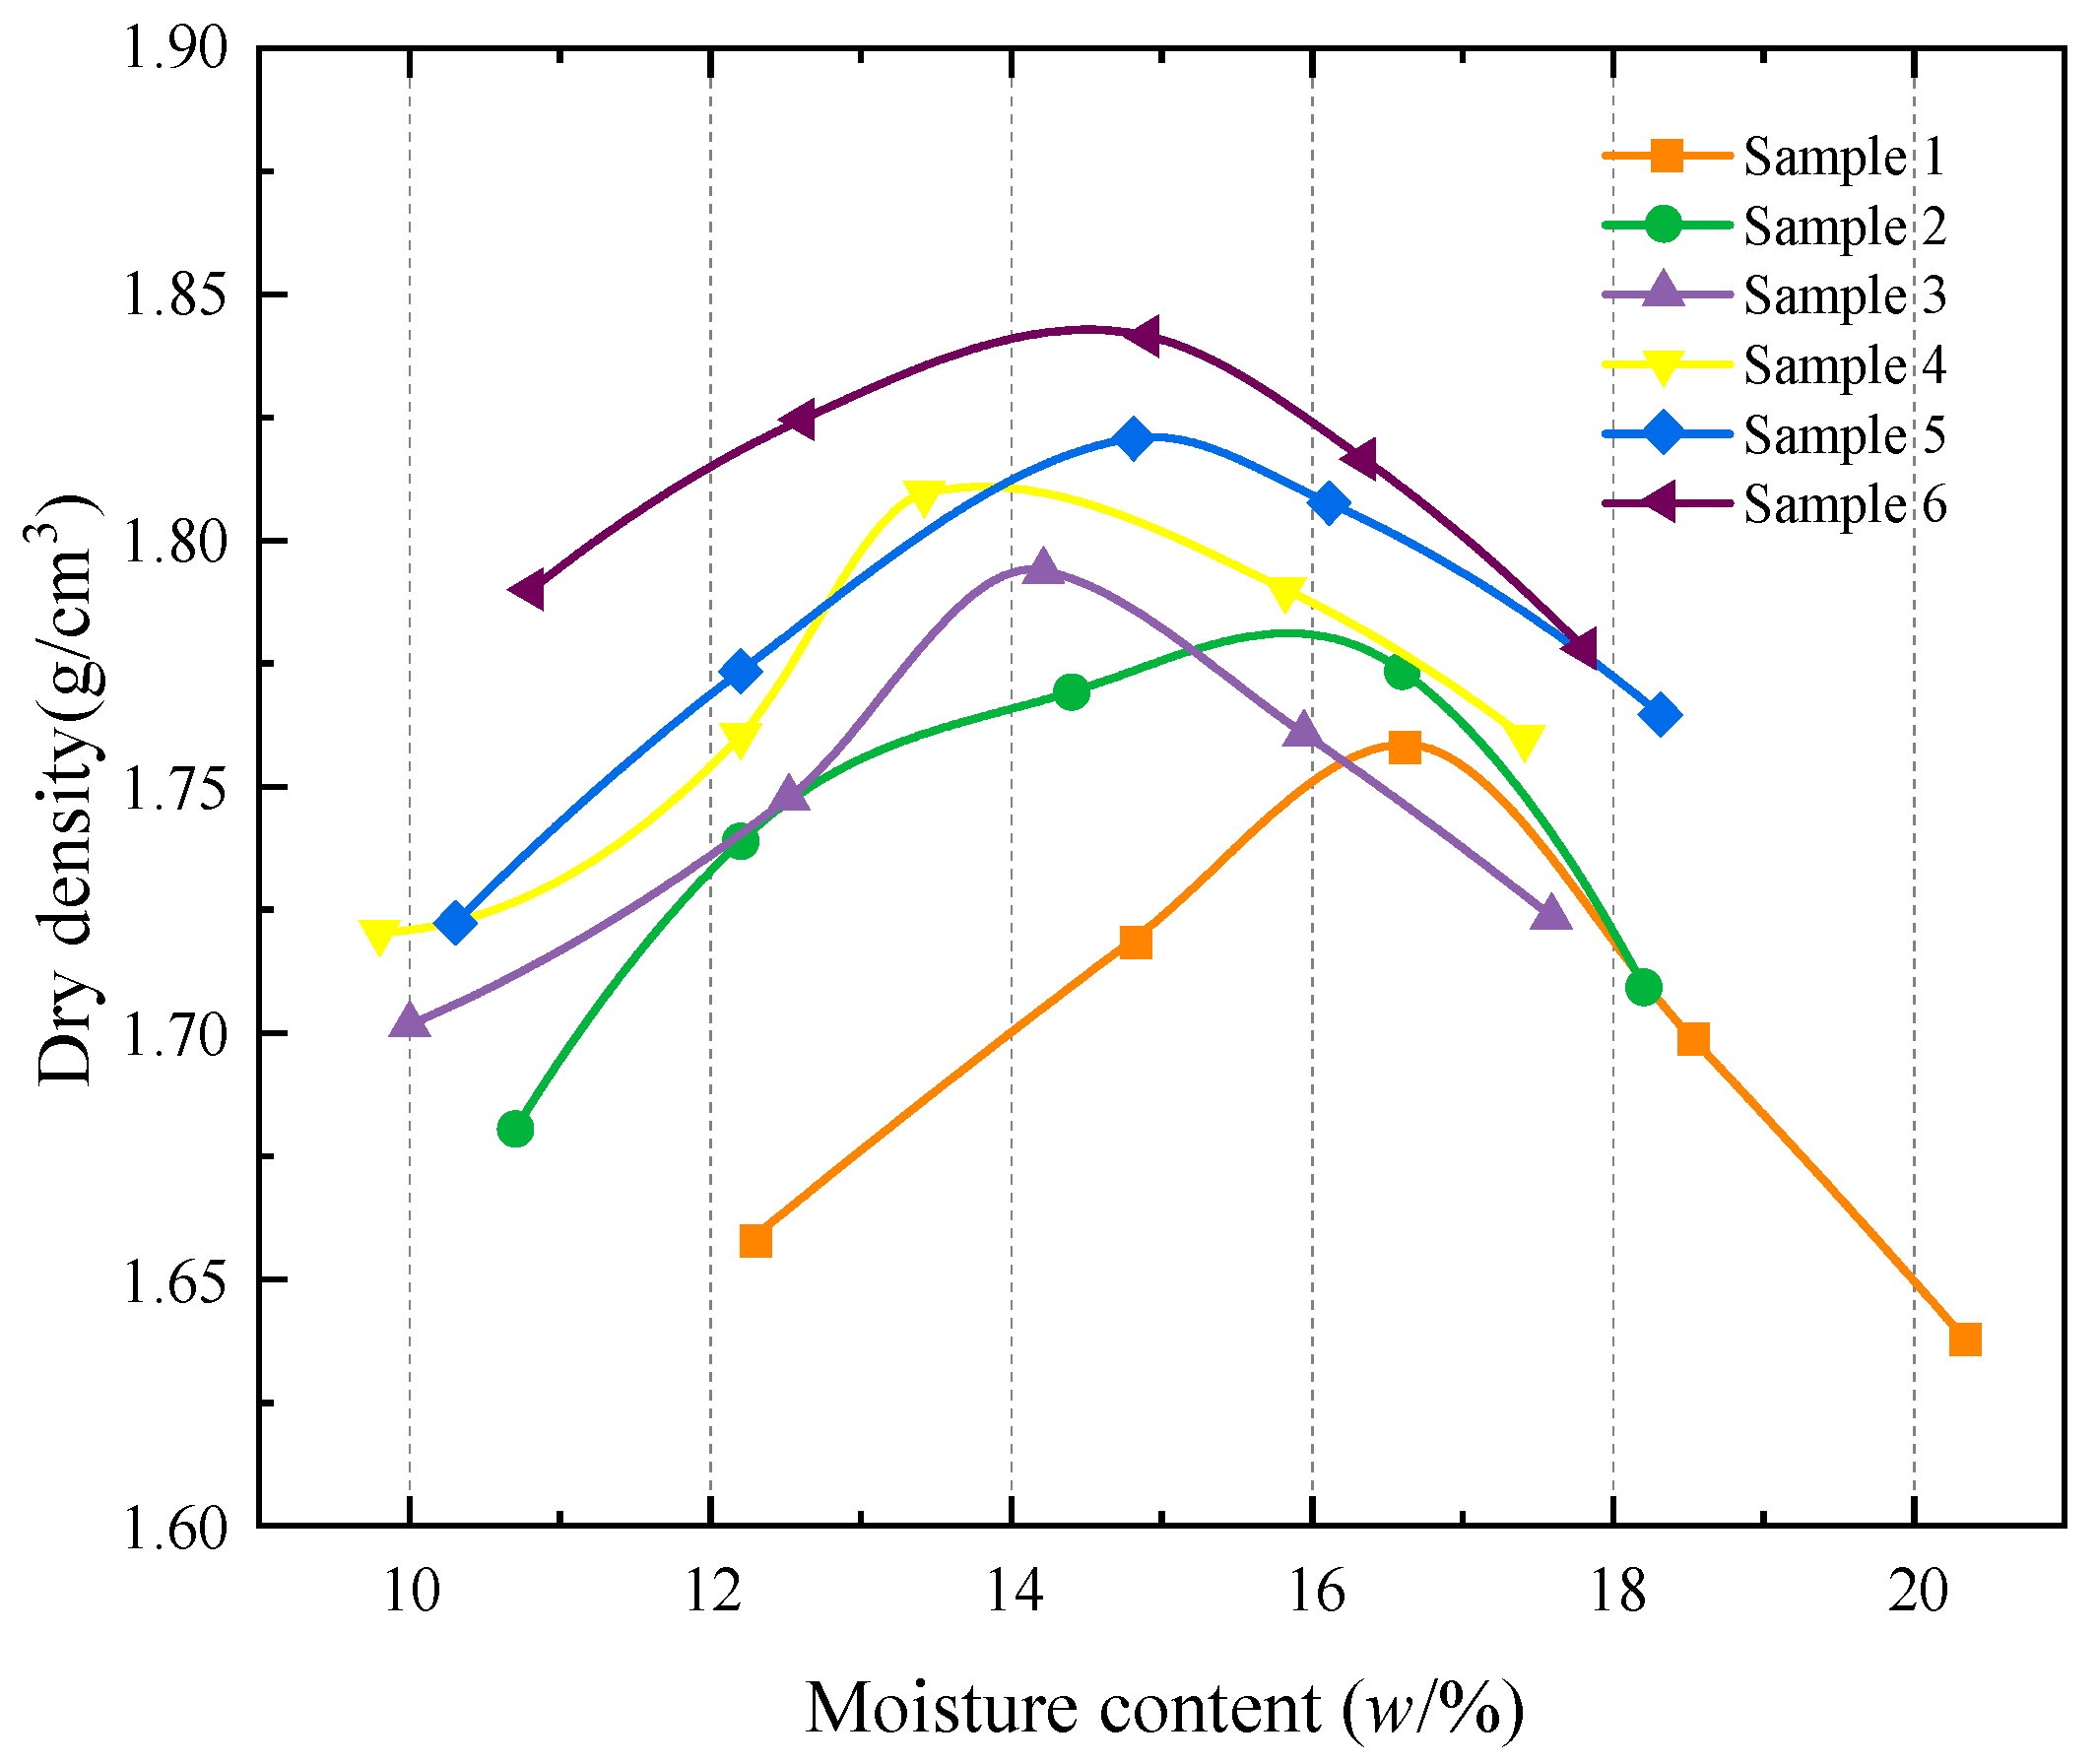
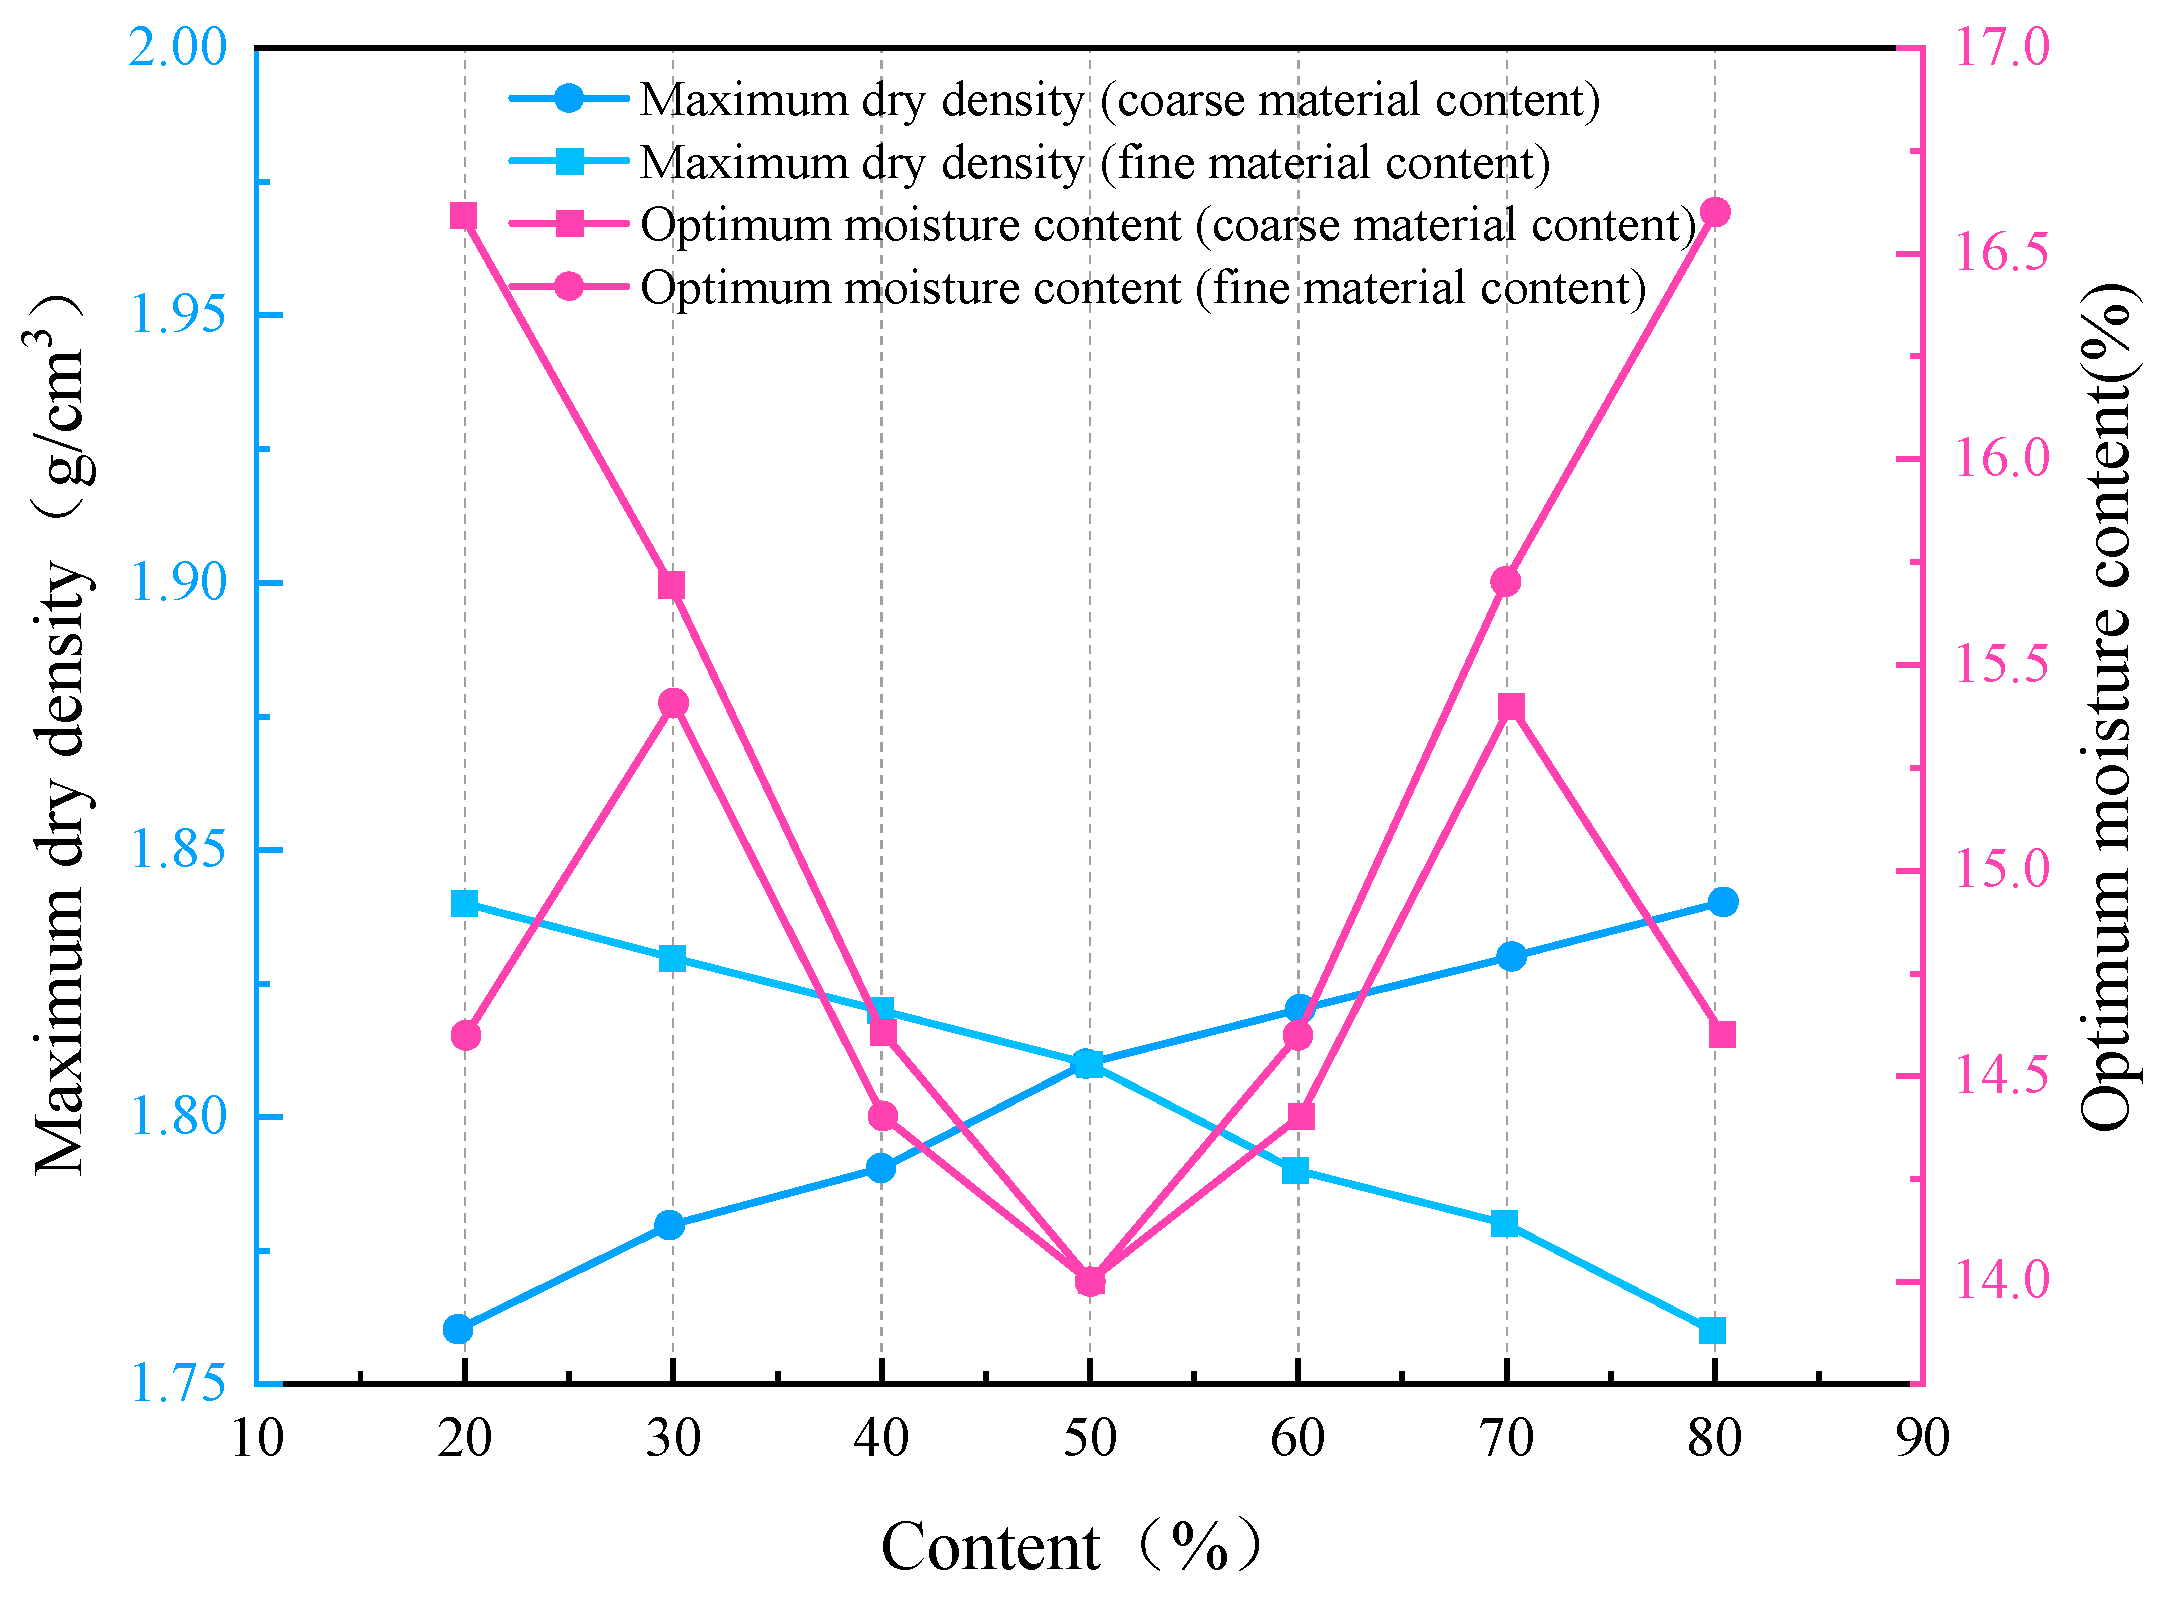
2.2.2. Maximum Dry Density and Optimum Moisture Content
- (1)
- Experimental design
- (2)
- Experimental process
- (3)
- Test results and analysis
2.2.3. California Bearing Ratio
- (1)
- Experimental process
- (2)
- Experimental results and analysis
3. Research on the Application of Recycled Construction Waste Filler in Roadbed
3.1. Preparatory Phase
3.2. Construction Techniques
3.3. Post-Construction Filling Quality Control
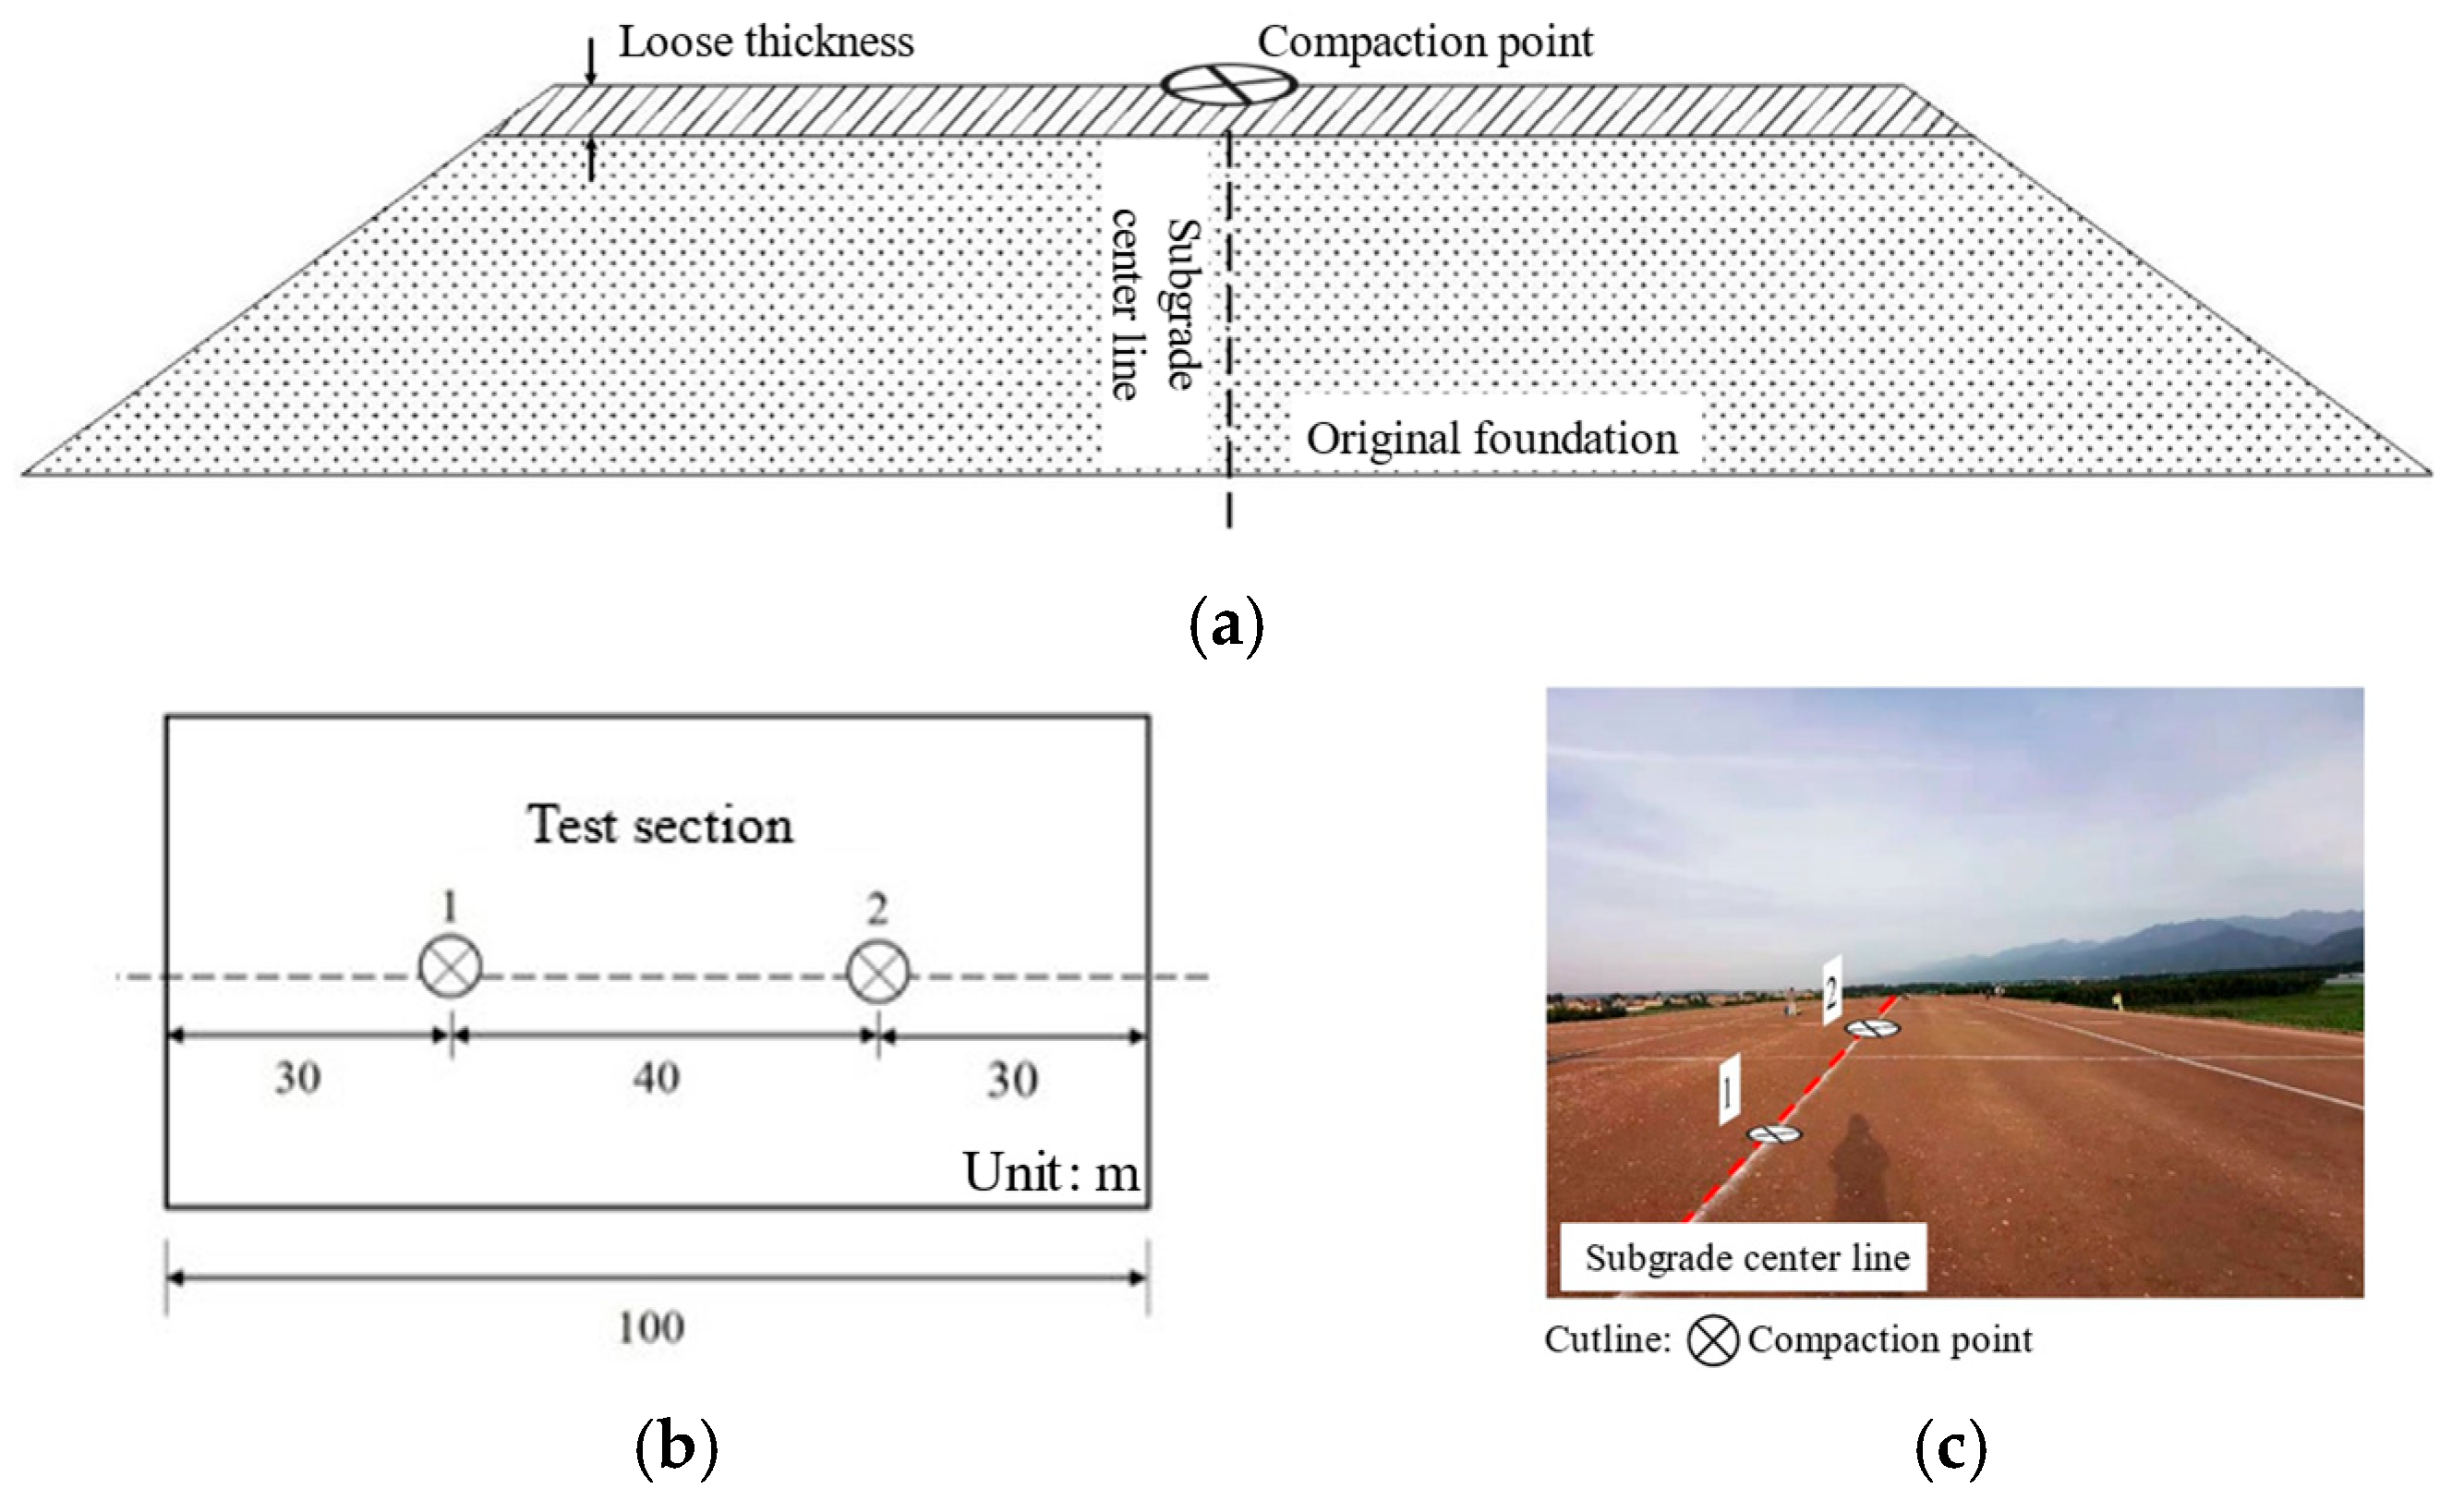
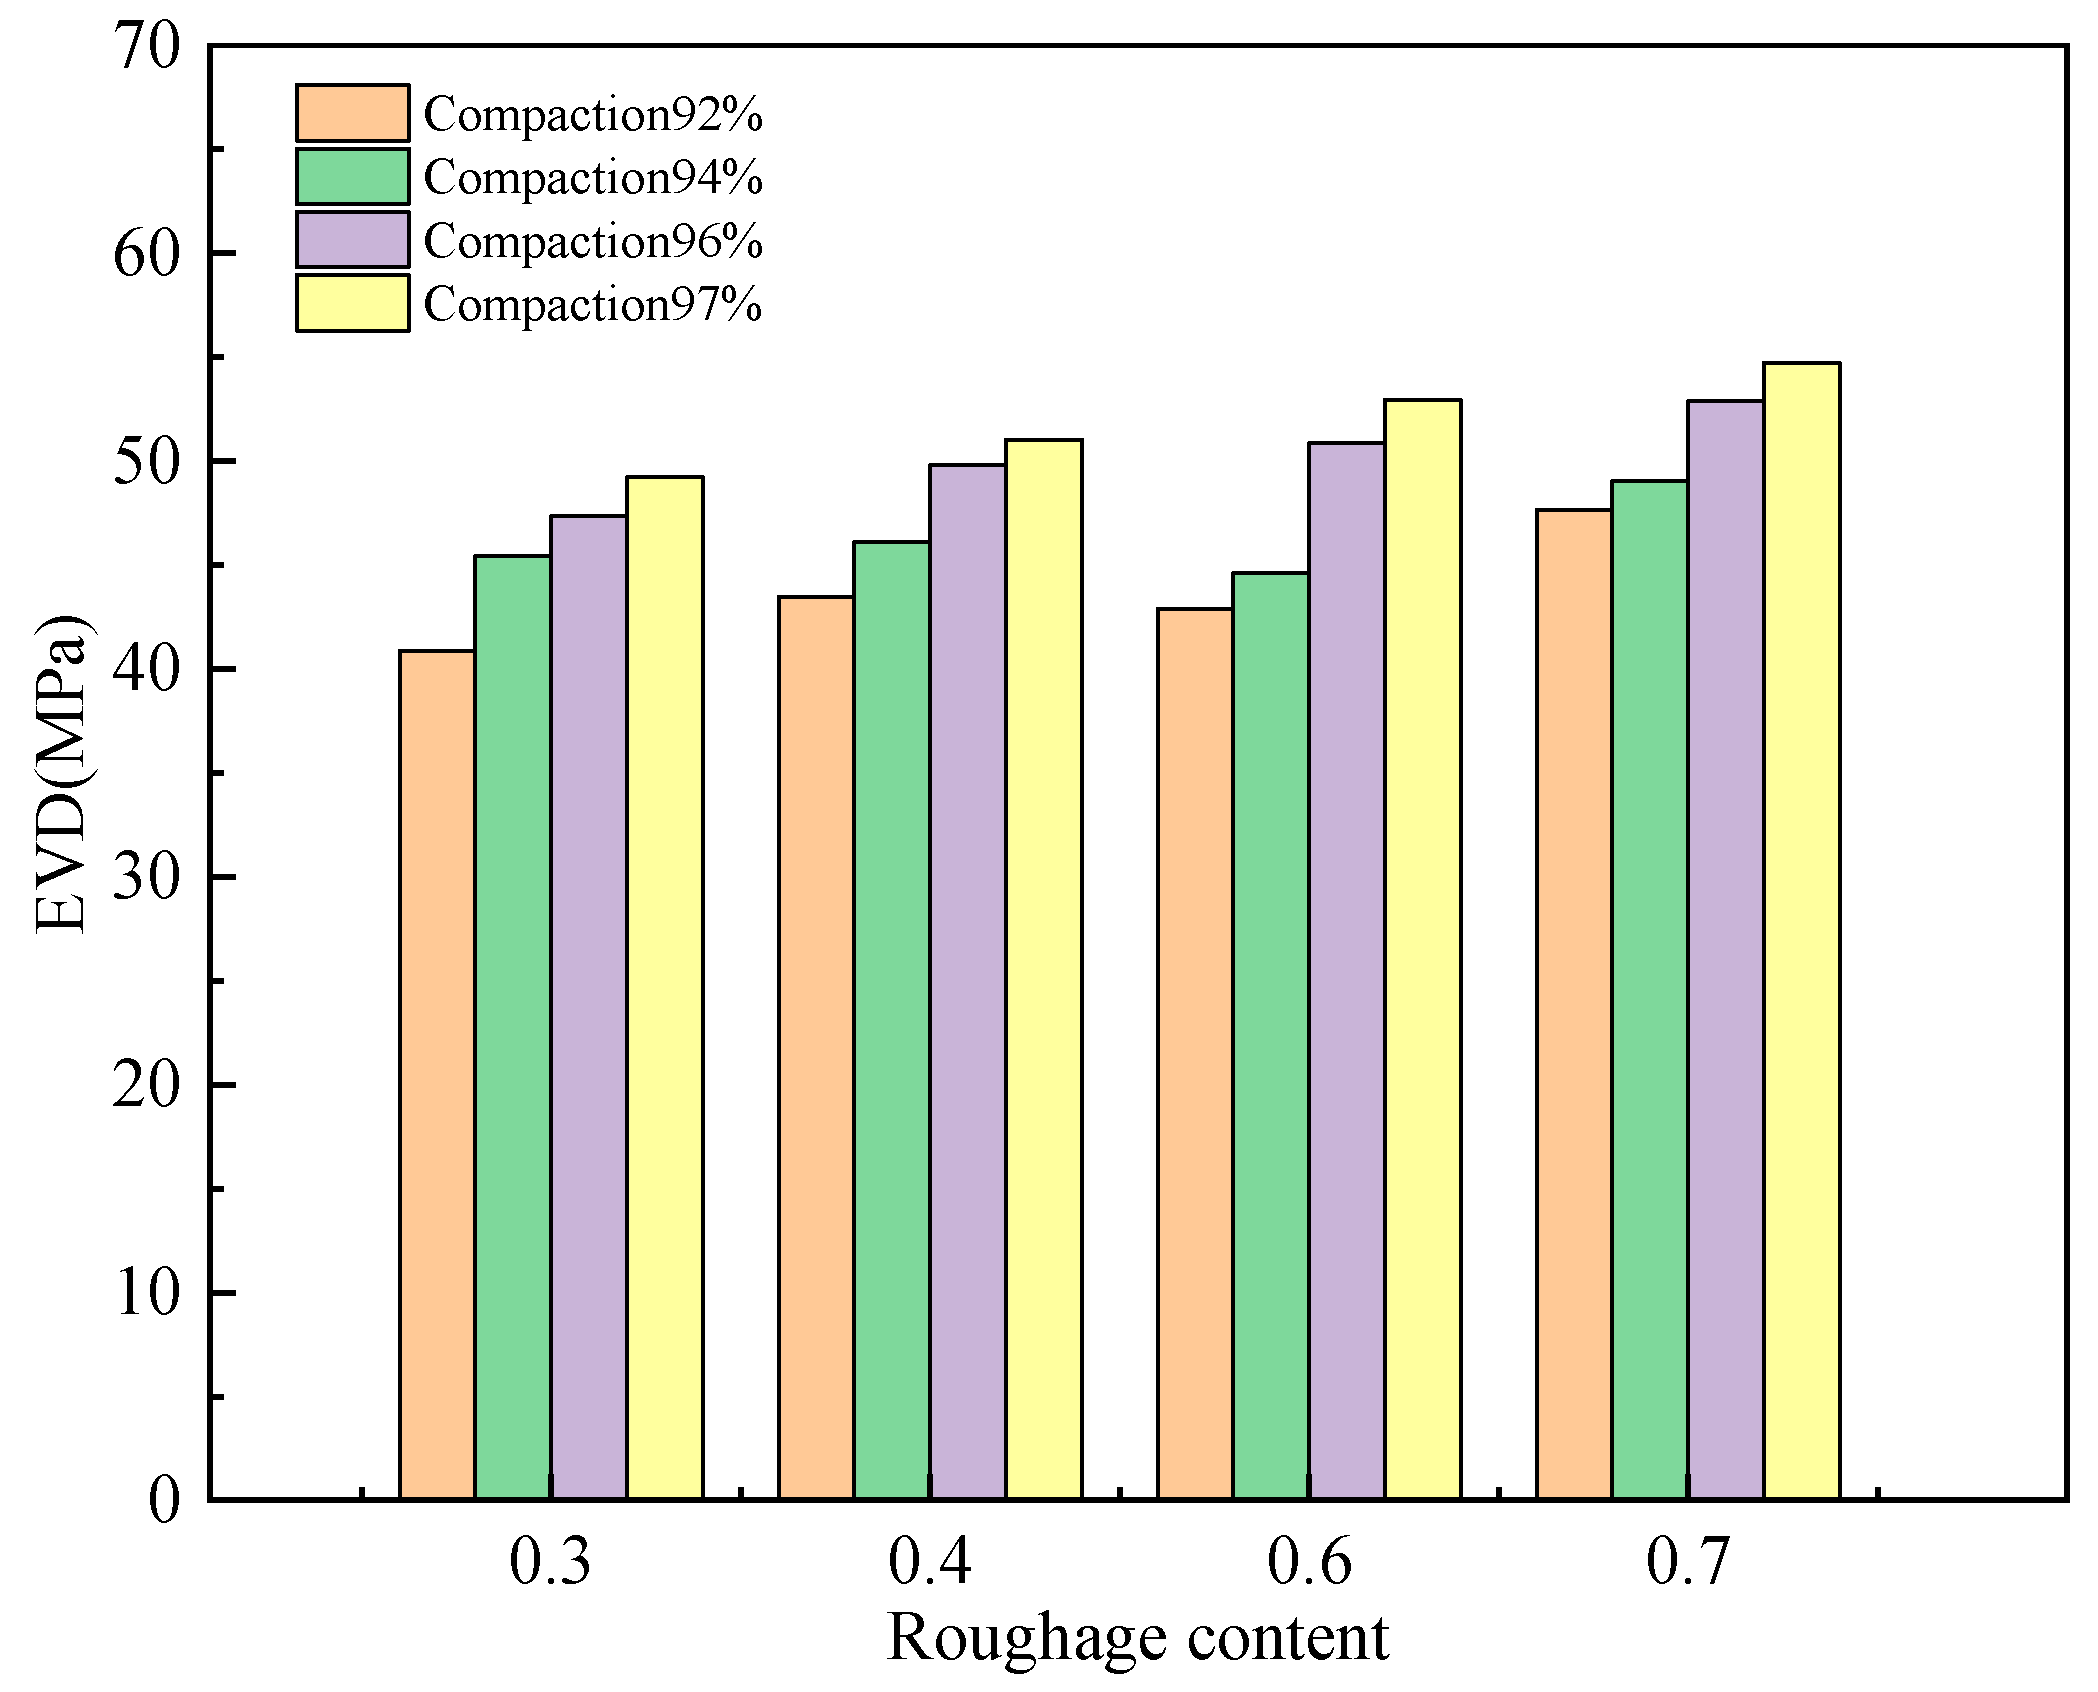
3.3.1. Dynamic Deformation Modulus and Compaction
3.3.2. Static Flexural Modulus
- (1)
- Measure the grounded area of tires by using duplicate paper or square paper, accurate to 0.1 cm2. Carry out sensitivity tests on the percentage meter. The temperature of the road surface is measured using a thermometer to obtain the average temperature in the last 5 days.
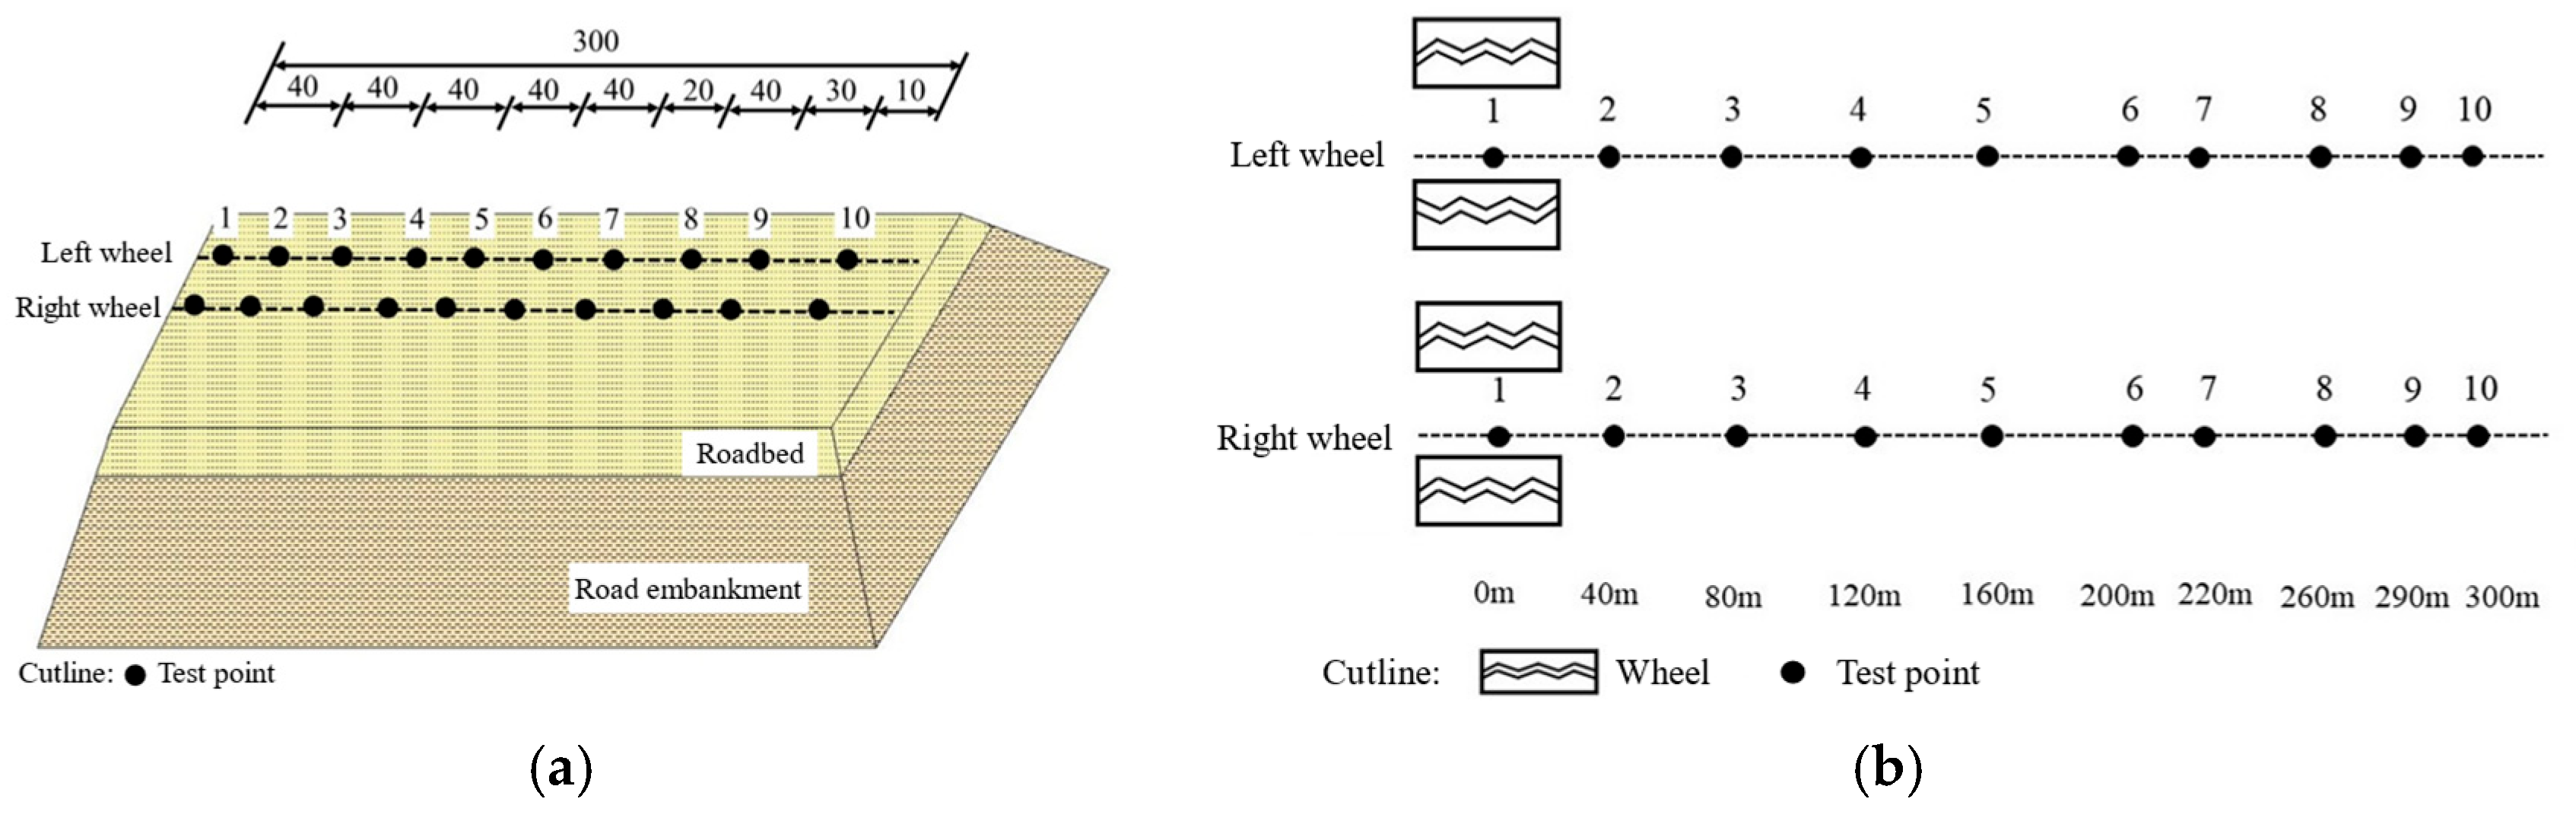
- (2)
- Set measurement points on the roadbed or road surface to be measured, and mark and number the wheel tracks on the roadway to be measured with white paint or chalk. A 300 m long road section is selected on site for bending settlement value detection, and one detection point is set every 10~40 m at the center of the line. Detection points are laid out as shown in Figure 13.
- (3)
- Insert the deflection gauge into the gap between the rear wheels of the deflection vehicle, ensuring that it is aligned with the direction of the vehicle. Position the deflection gauge at the measurement point, which is 3 to 5 m in front of the center of the wheel gap, while ensuring that the horizontal beam arm does not contact the tire. A dial gauge is installed on the measurement rod of the deflection gauge, and the gauge is zeroed. Gently tap the pressure gauge with a finger to check if the dial gauge is stable.
- (4)
- The inspector blows the whistle, commanding the vehicle to move forward slowly (with an optimal speed of around 5 km/h). As the road deforms, the dial gauge continues to rotate forward. When the needle reaches its maximum deflection, the initial reading (L1) is quickly recorded. The vehicle continues to move, and the needle begins to rotate in reverse. When the vehicle has traveled 3 m, the whistle is blown or a red flag is waved to signal the vehicle to stop. After the needle stabilizes, the final reading (L2) is recorded. The rebound deflection value at the measurement point is calculated using Equation (7).
4. Analysis on Deformation Law of Roadbed Backfilled with Construction Waste
4.1. Analysis of Roadbed Settlement and Deformation
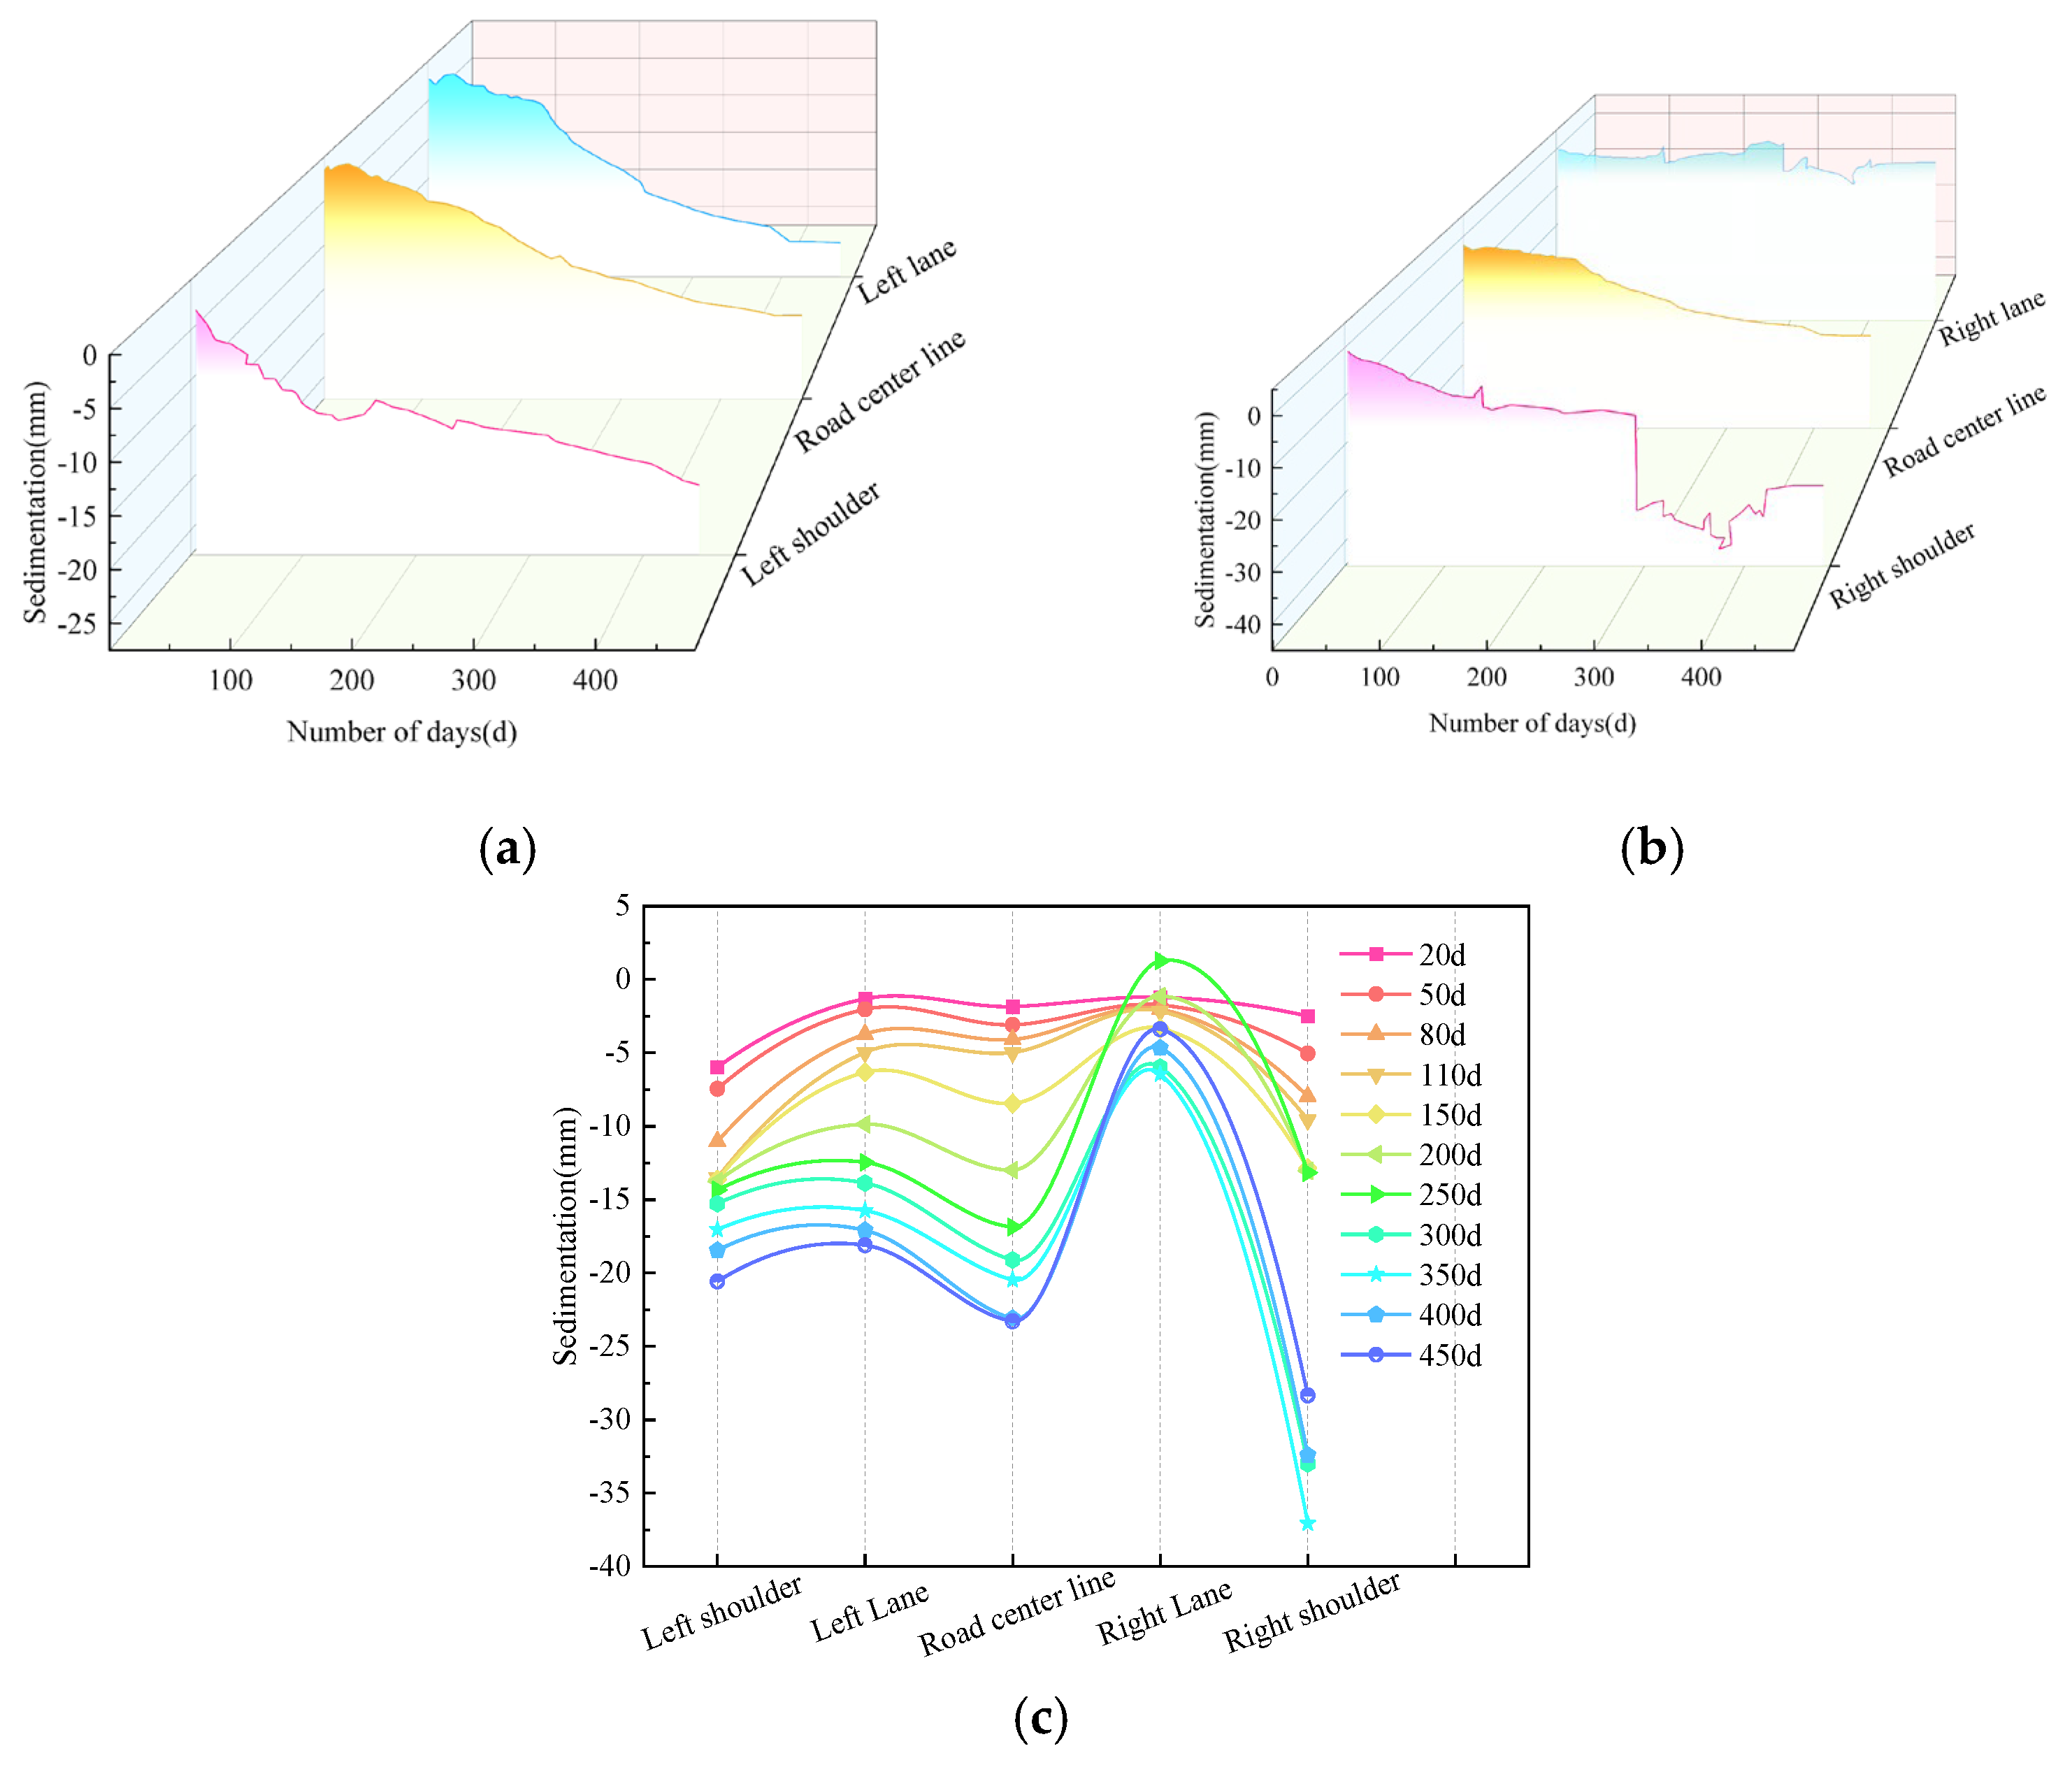
4.1.1. On-Site Monitoring of Roadbed Deformation
4.1.2. Monitoring Data Analysis
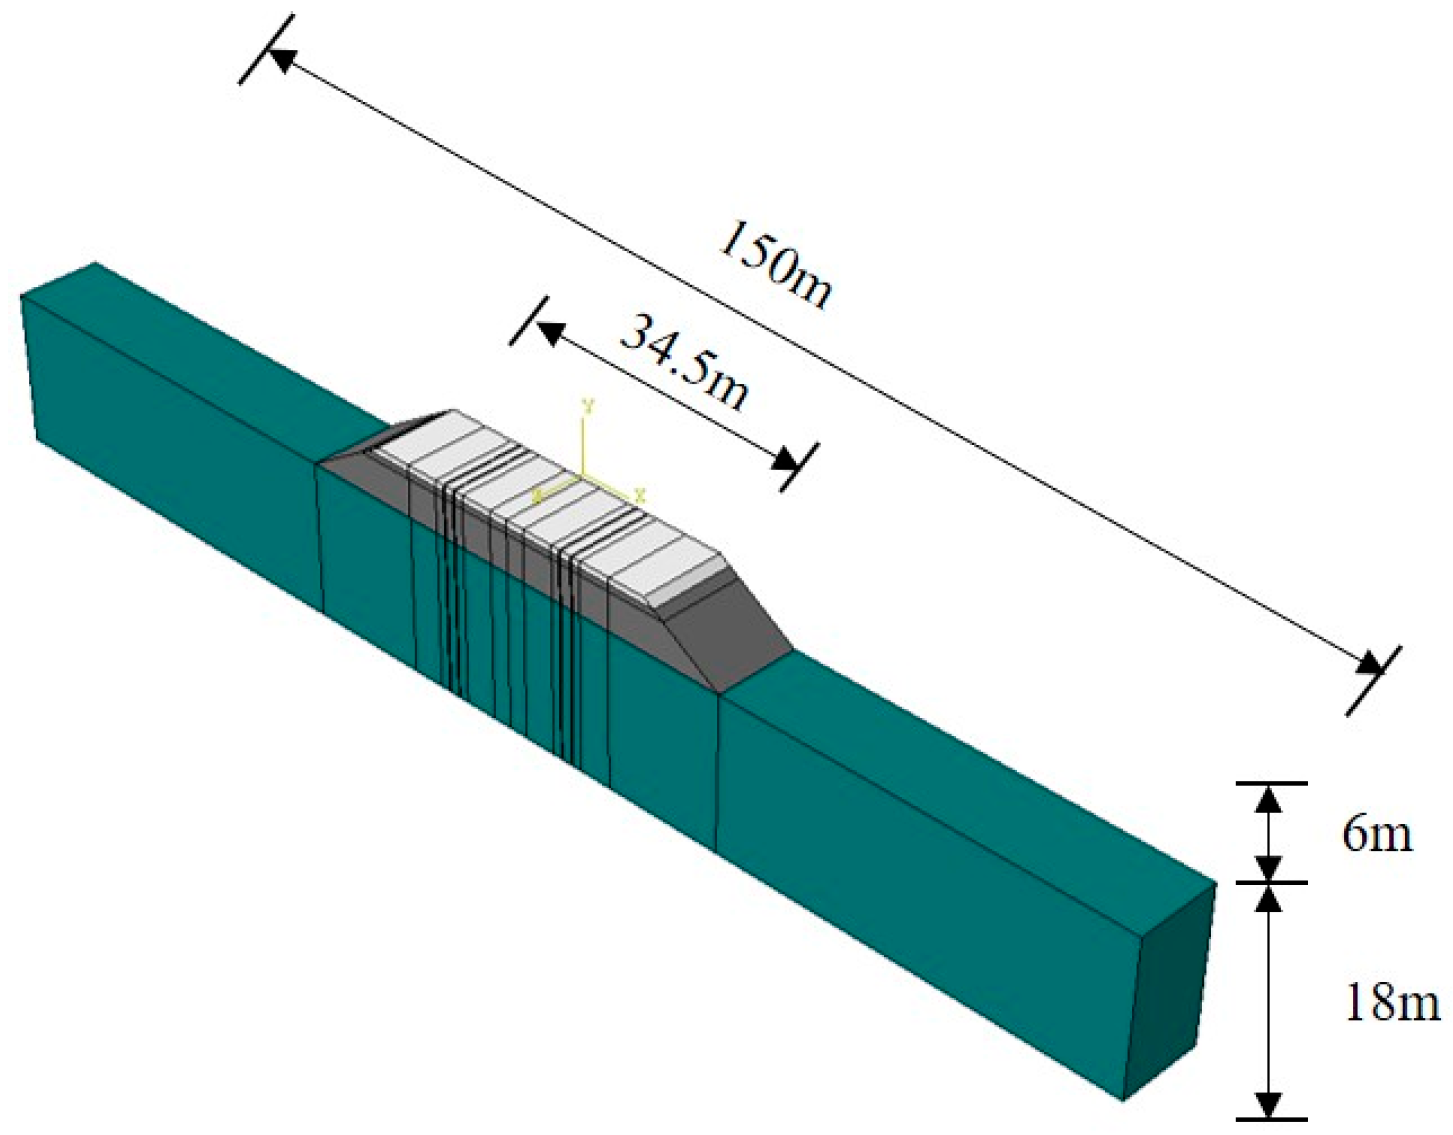
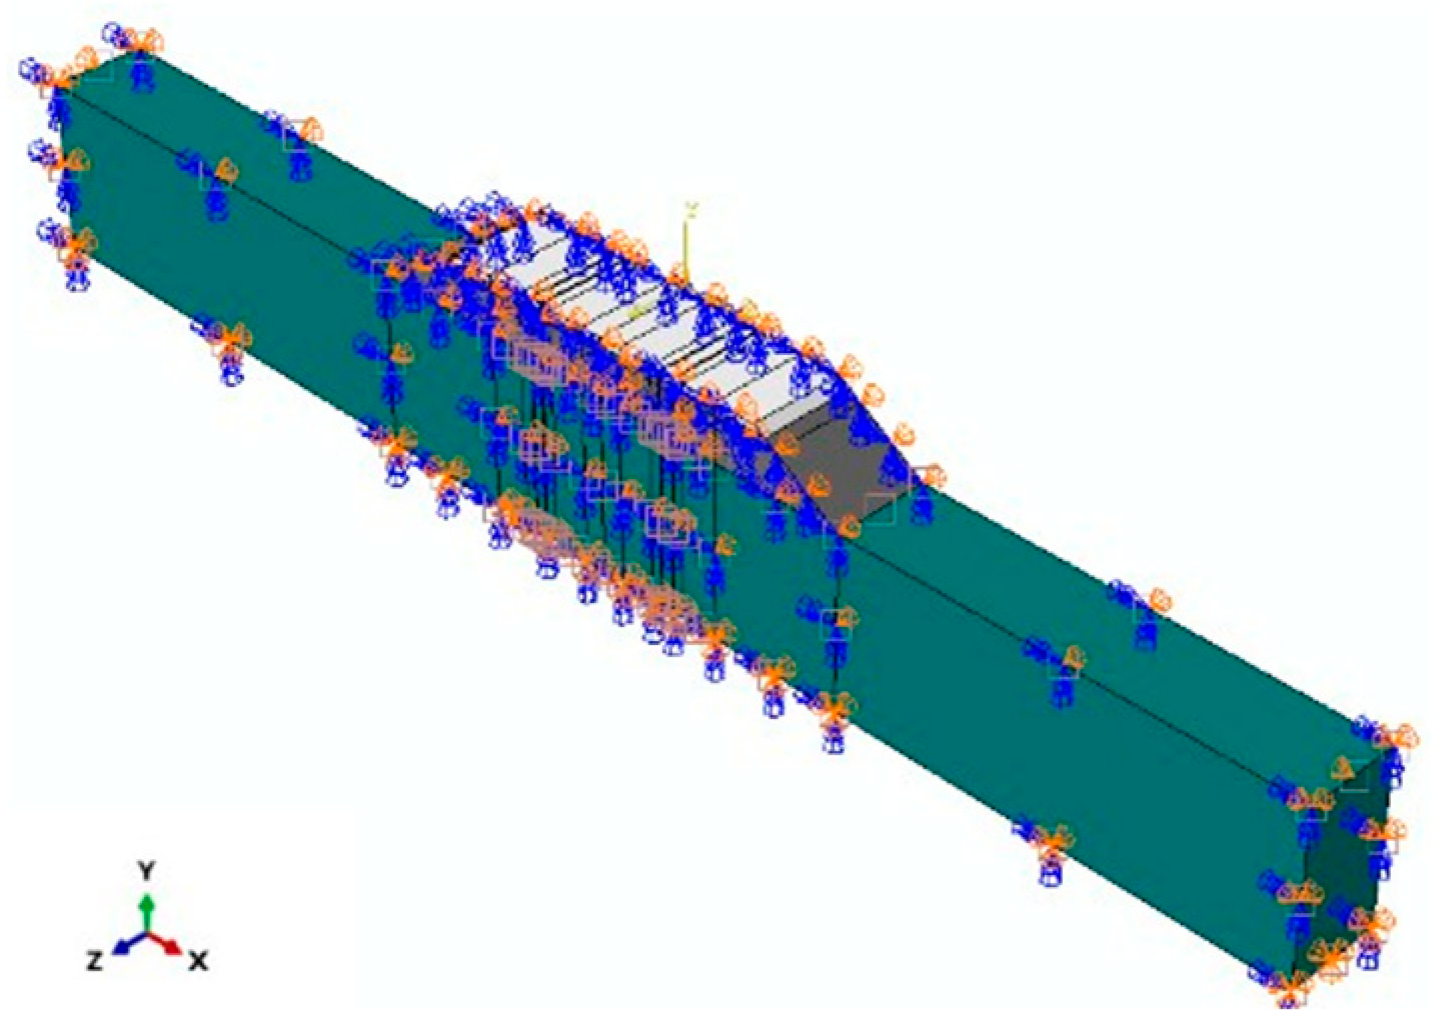
4.2. Finite Element Model Establishment
4.2.1. Finite Element Model of Roadbed
- (1)
- Deformation simulation during roadbed filling. The simulation results are compared with the actual monitoring settlement results to verify the validity of the model.
- (2)
- Deformation simulation of different roadbed compaction. The compaction degree is taken as 90%, 93%, and 96%, respectively, to analyze the effect of compaction degree on the settlement and deformation of roadbeds.
- (3)
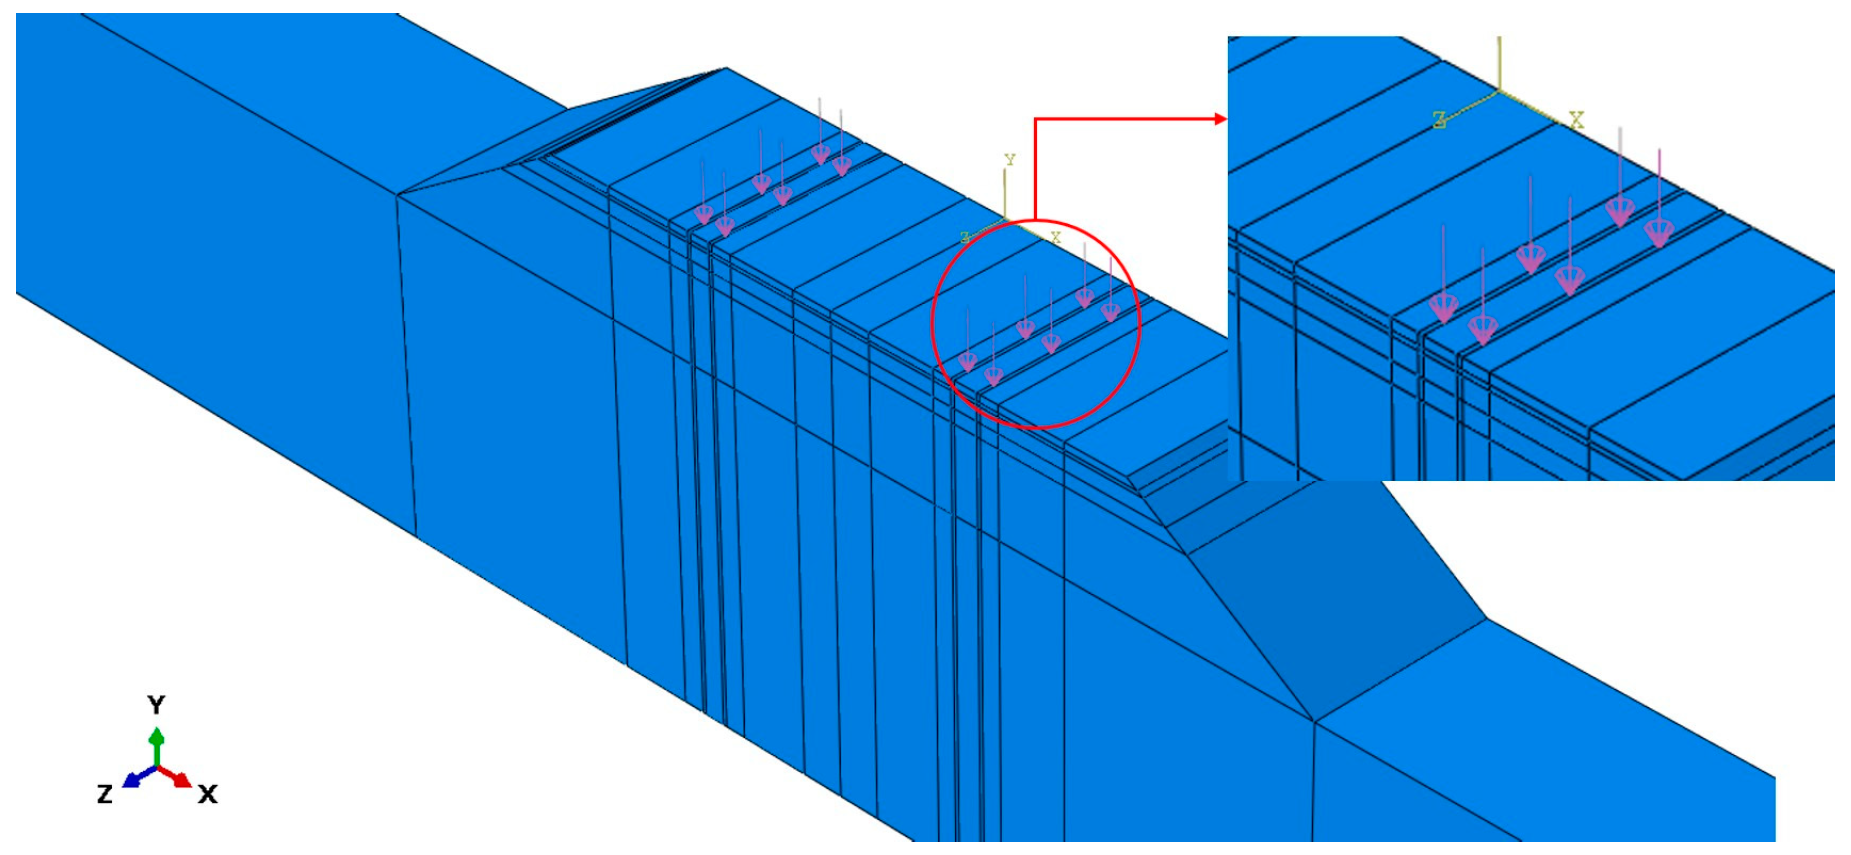
- Simulation of different vehicle loads. Based on the finite element model of the roadbed established during the construction period, 0.2 m subgrade and 0.38 m base layer are filled on the roadbed surface according to the design requirements, and the effects of different vehicle loads on vertical displacement and shear stress are studied. Regarding the load form, the vehicle load in this article adopts a steady-state sinusoidal fluctuation load, which can be calculated by using Formula (12):
4.2.2. Constitutive Relations
4.3. Analysis of Numerical Simulation Results
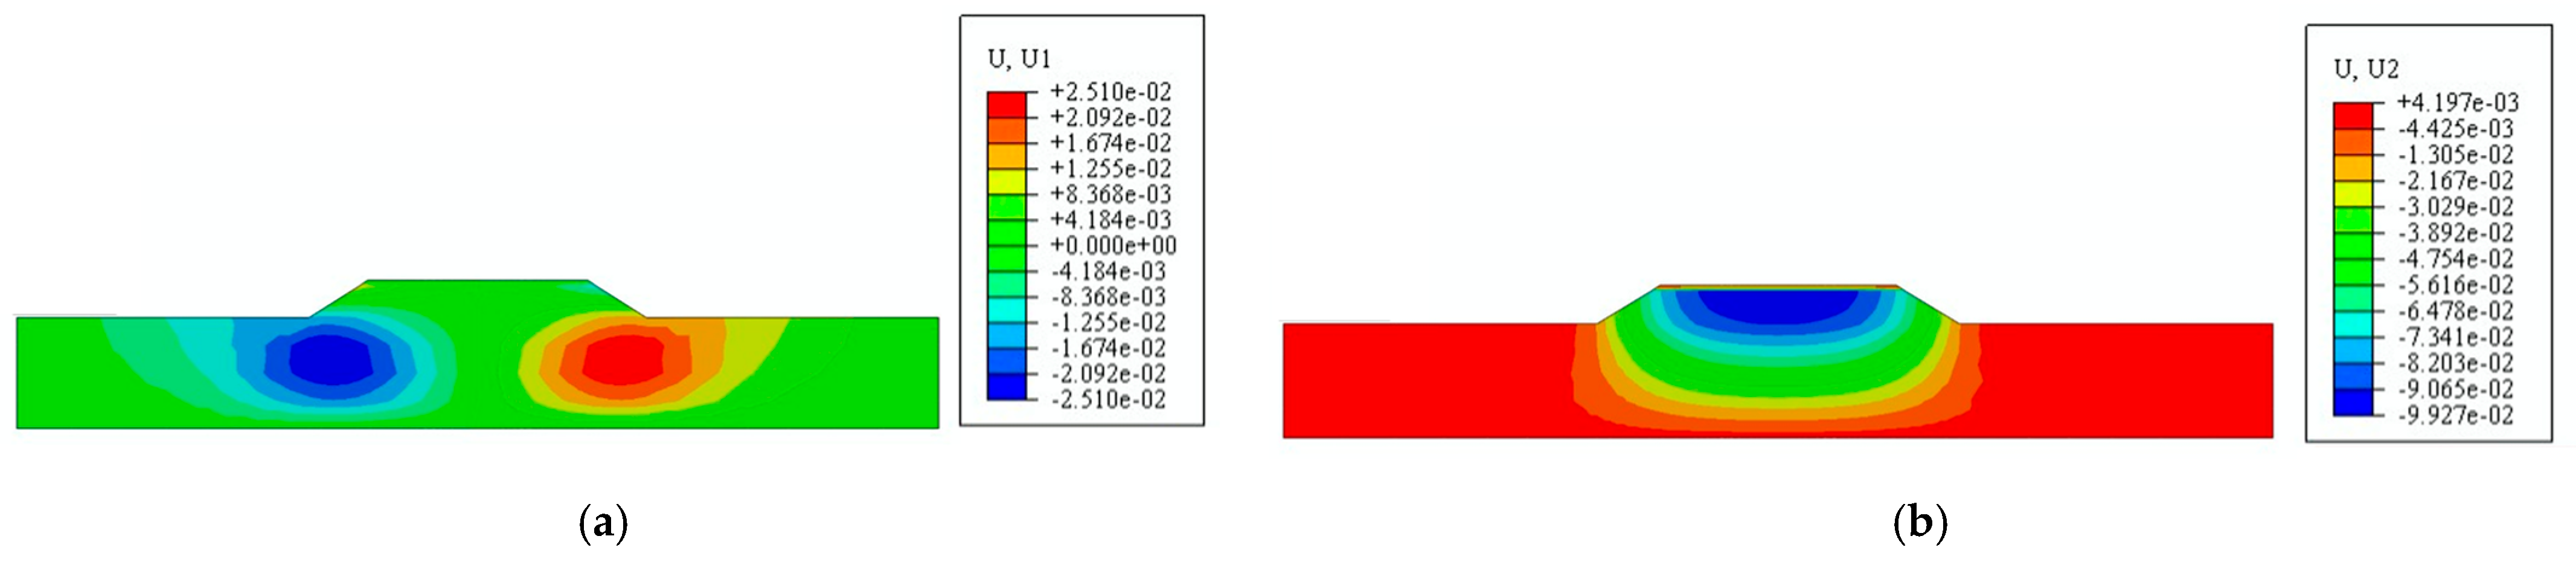
4.3.1. Simulation of Roadbed Layer Filling
- (1)
- The roadbed fill is an isotropic continuous medium and an ideal elastic-plastic body, and the contact between each soil layer is continuous;
- (2)
- When the roadbed is filled in layers, the deformation of the roadbed is mainly generated under the influence of its self-weight as the filling height changes;
- (3)
- The influence of environmental factors such as temperature and humidity on the deformation of the roadbed can be neglected.
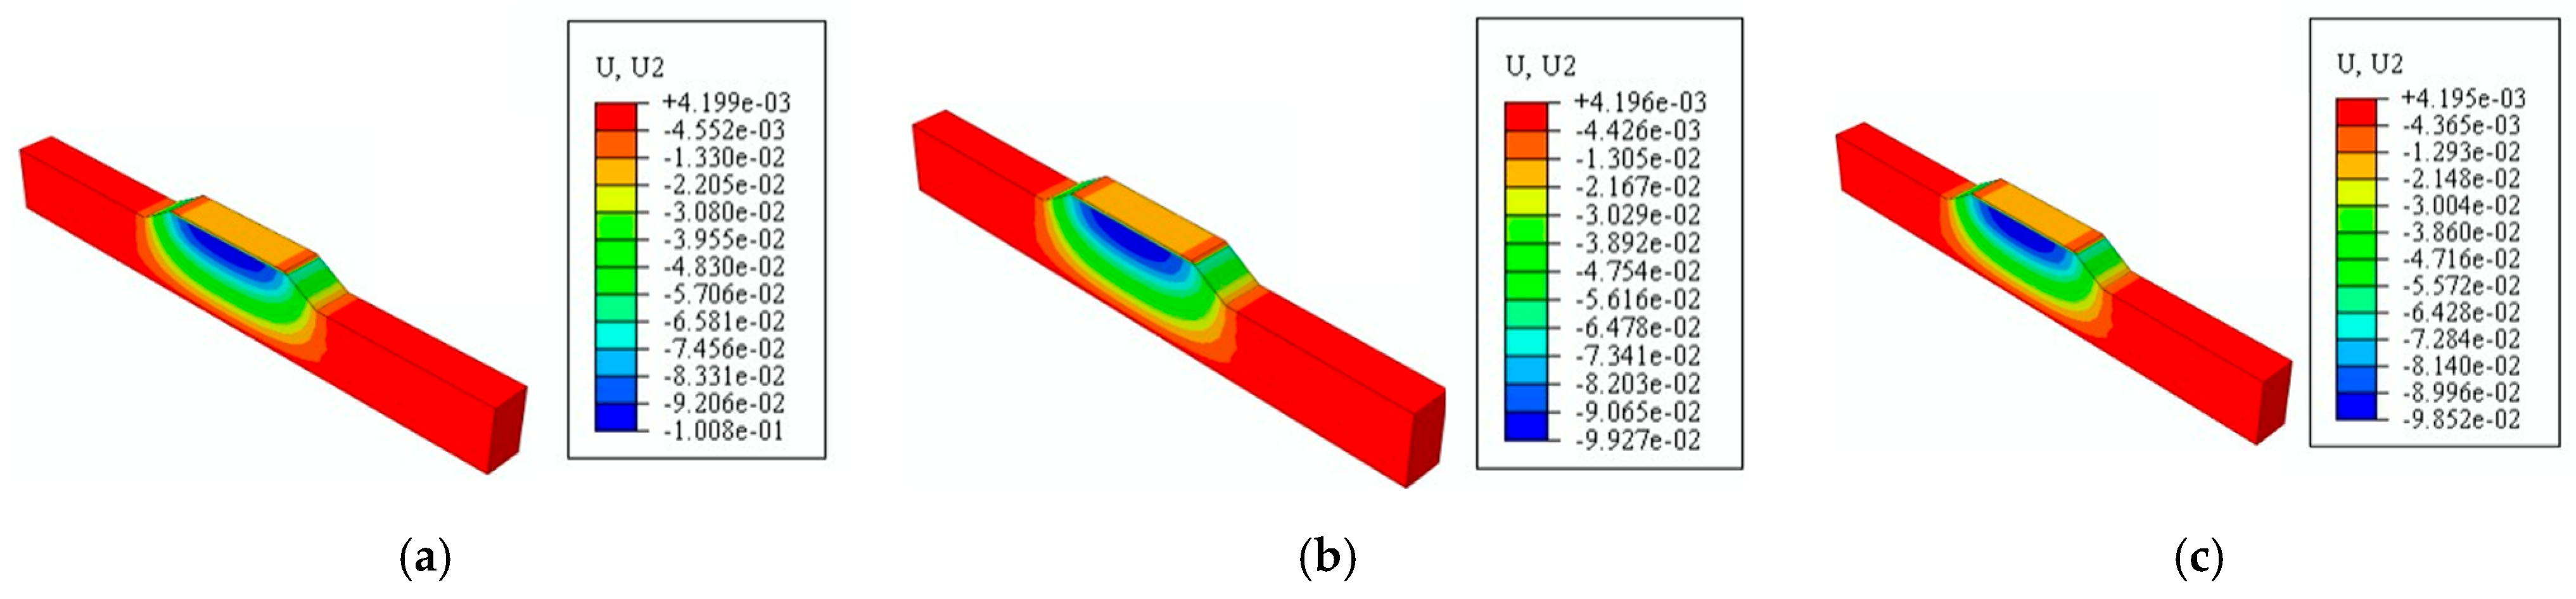
4.3.2. Simulation of Different Roadbed Compaction Degrees
4.3.3. Simulation of Different Vehicle Loads
- (1)
- Realization of vehicle load in ABAQUS
- (2)
- Grid division of the model
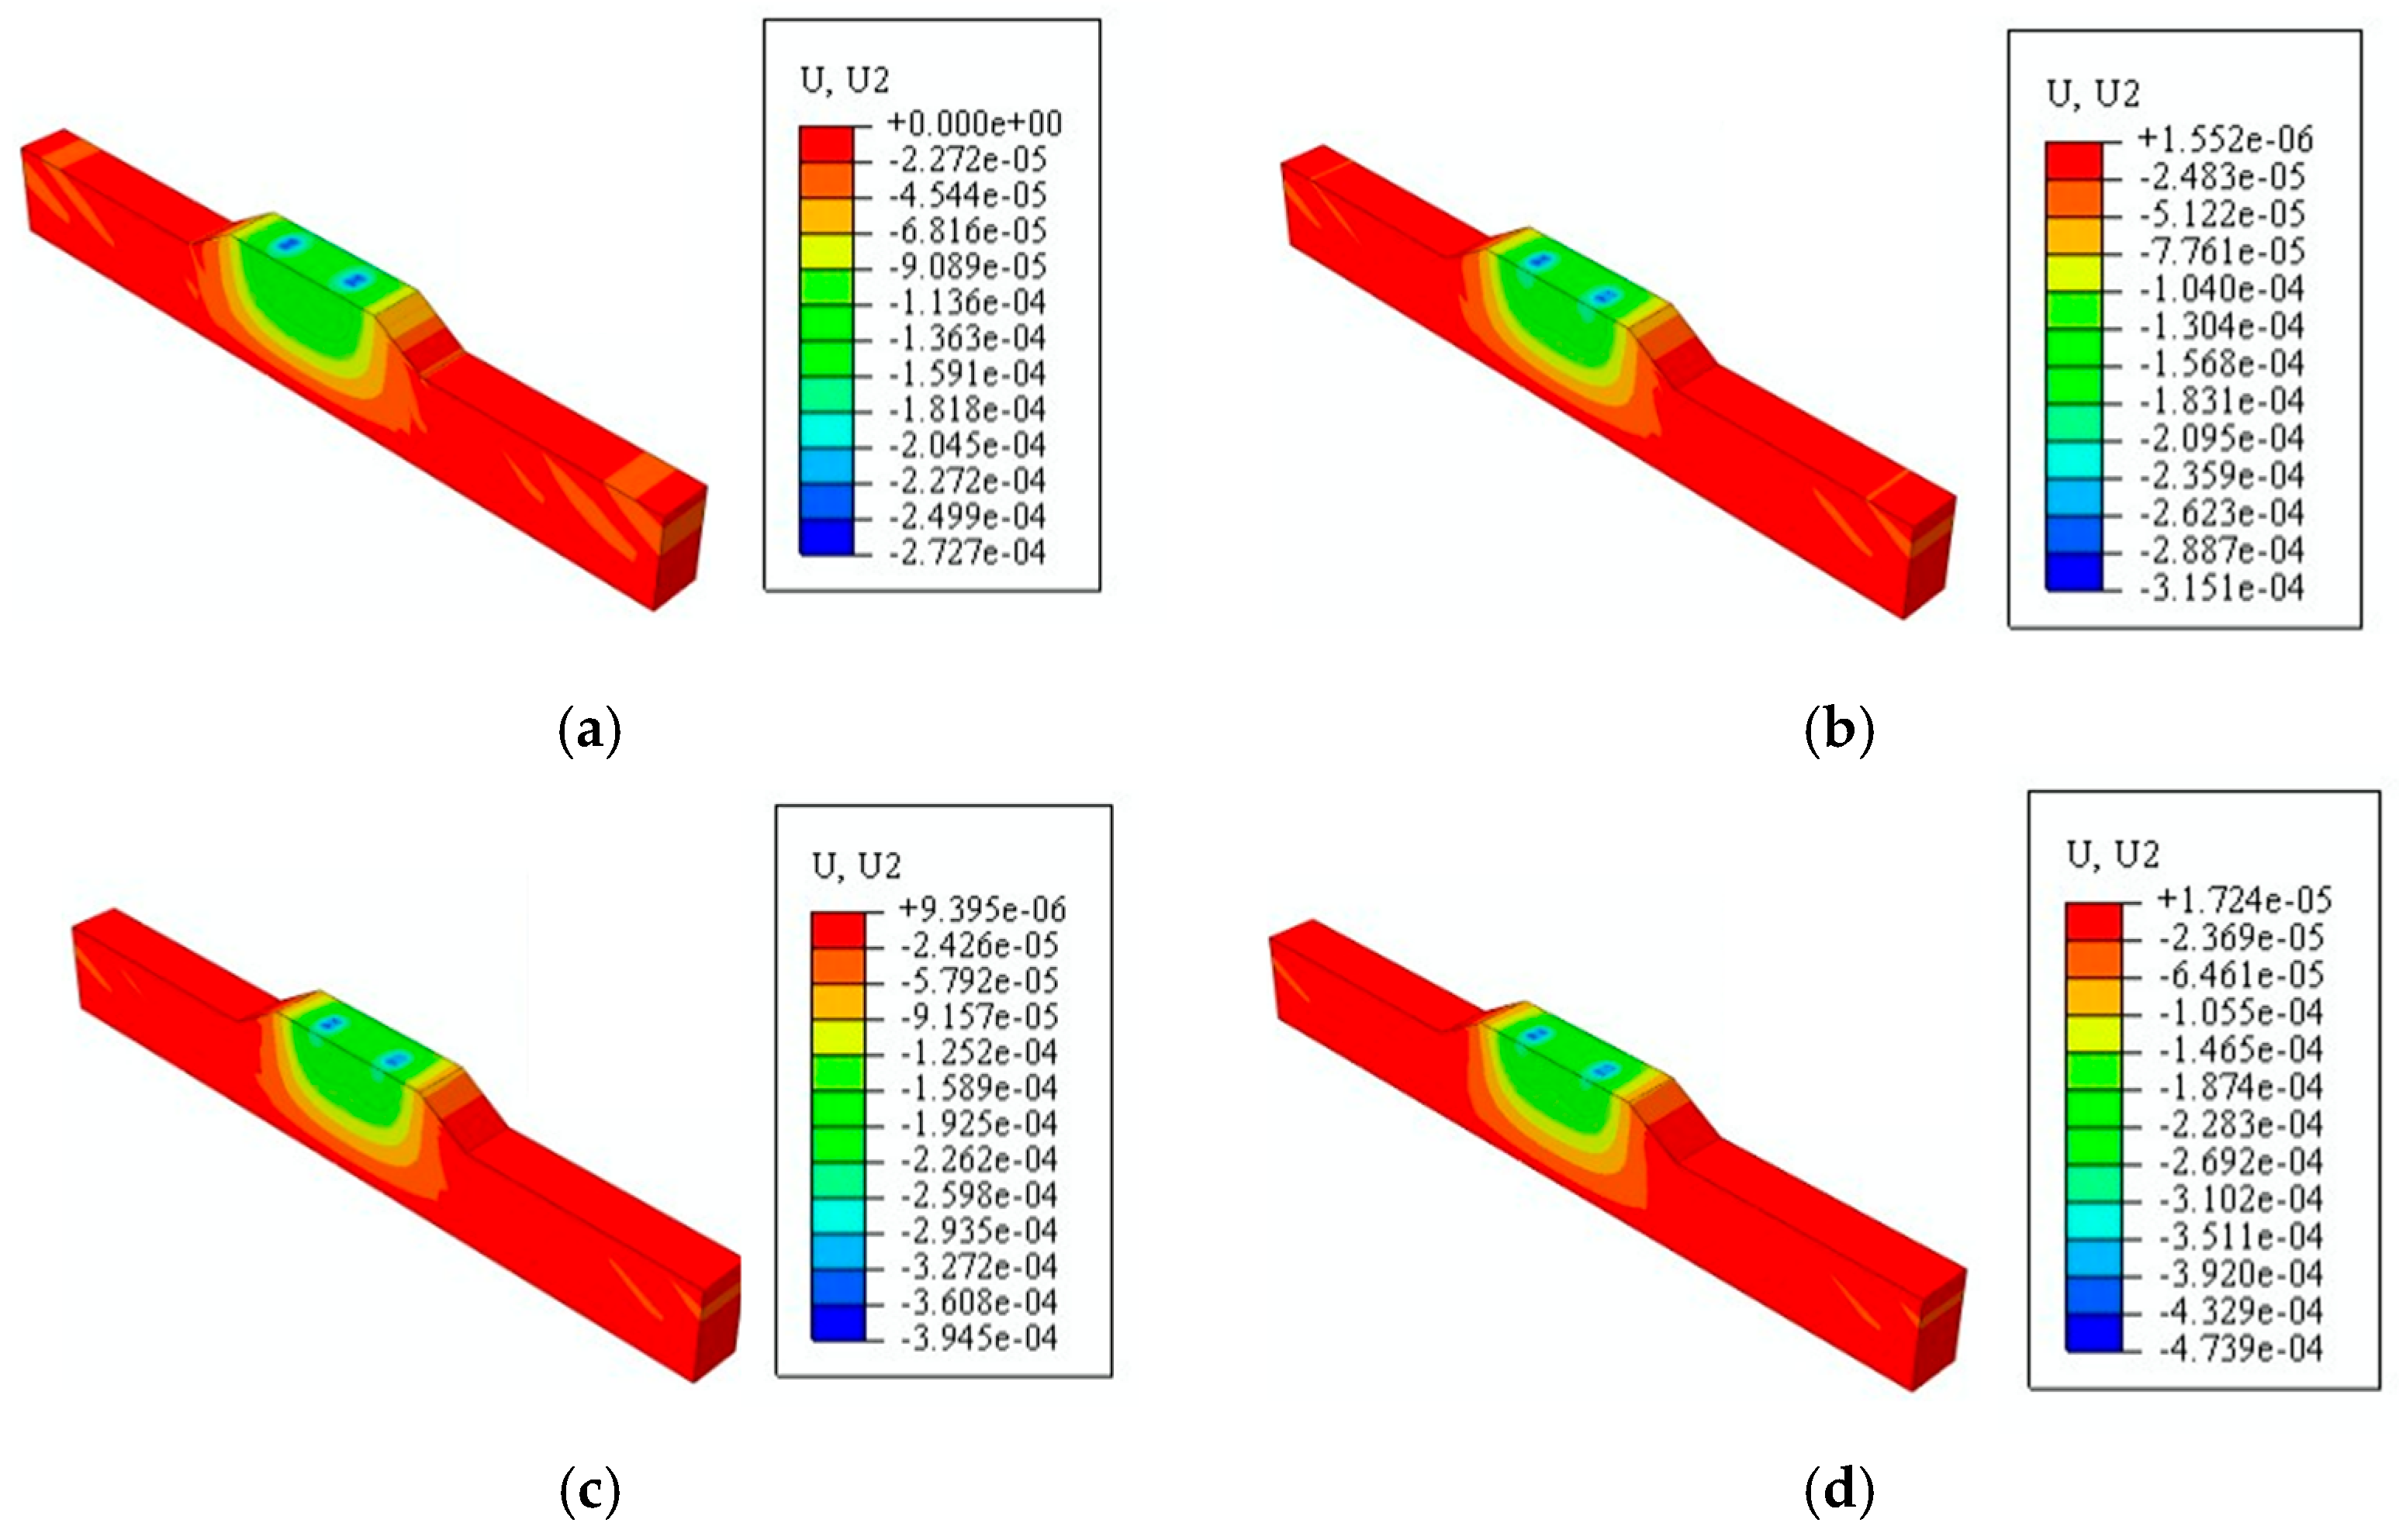
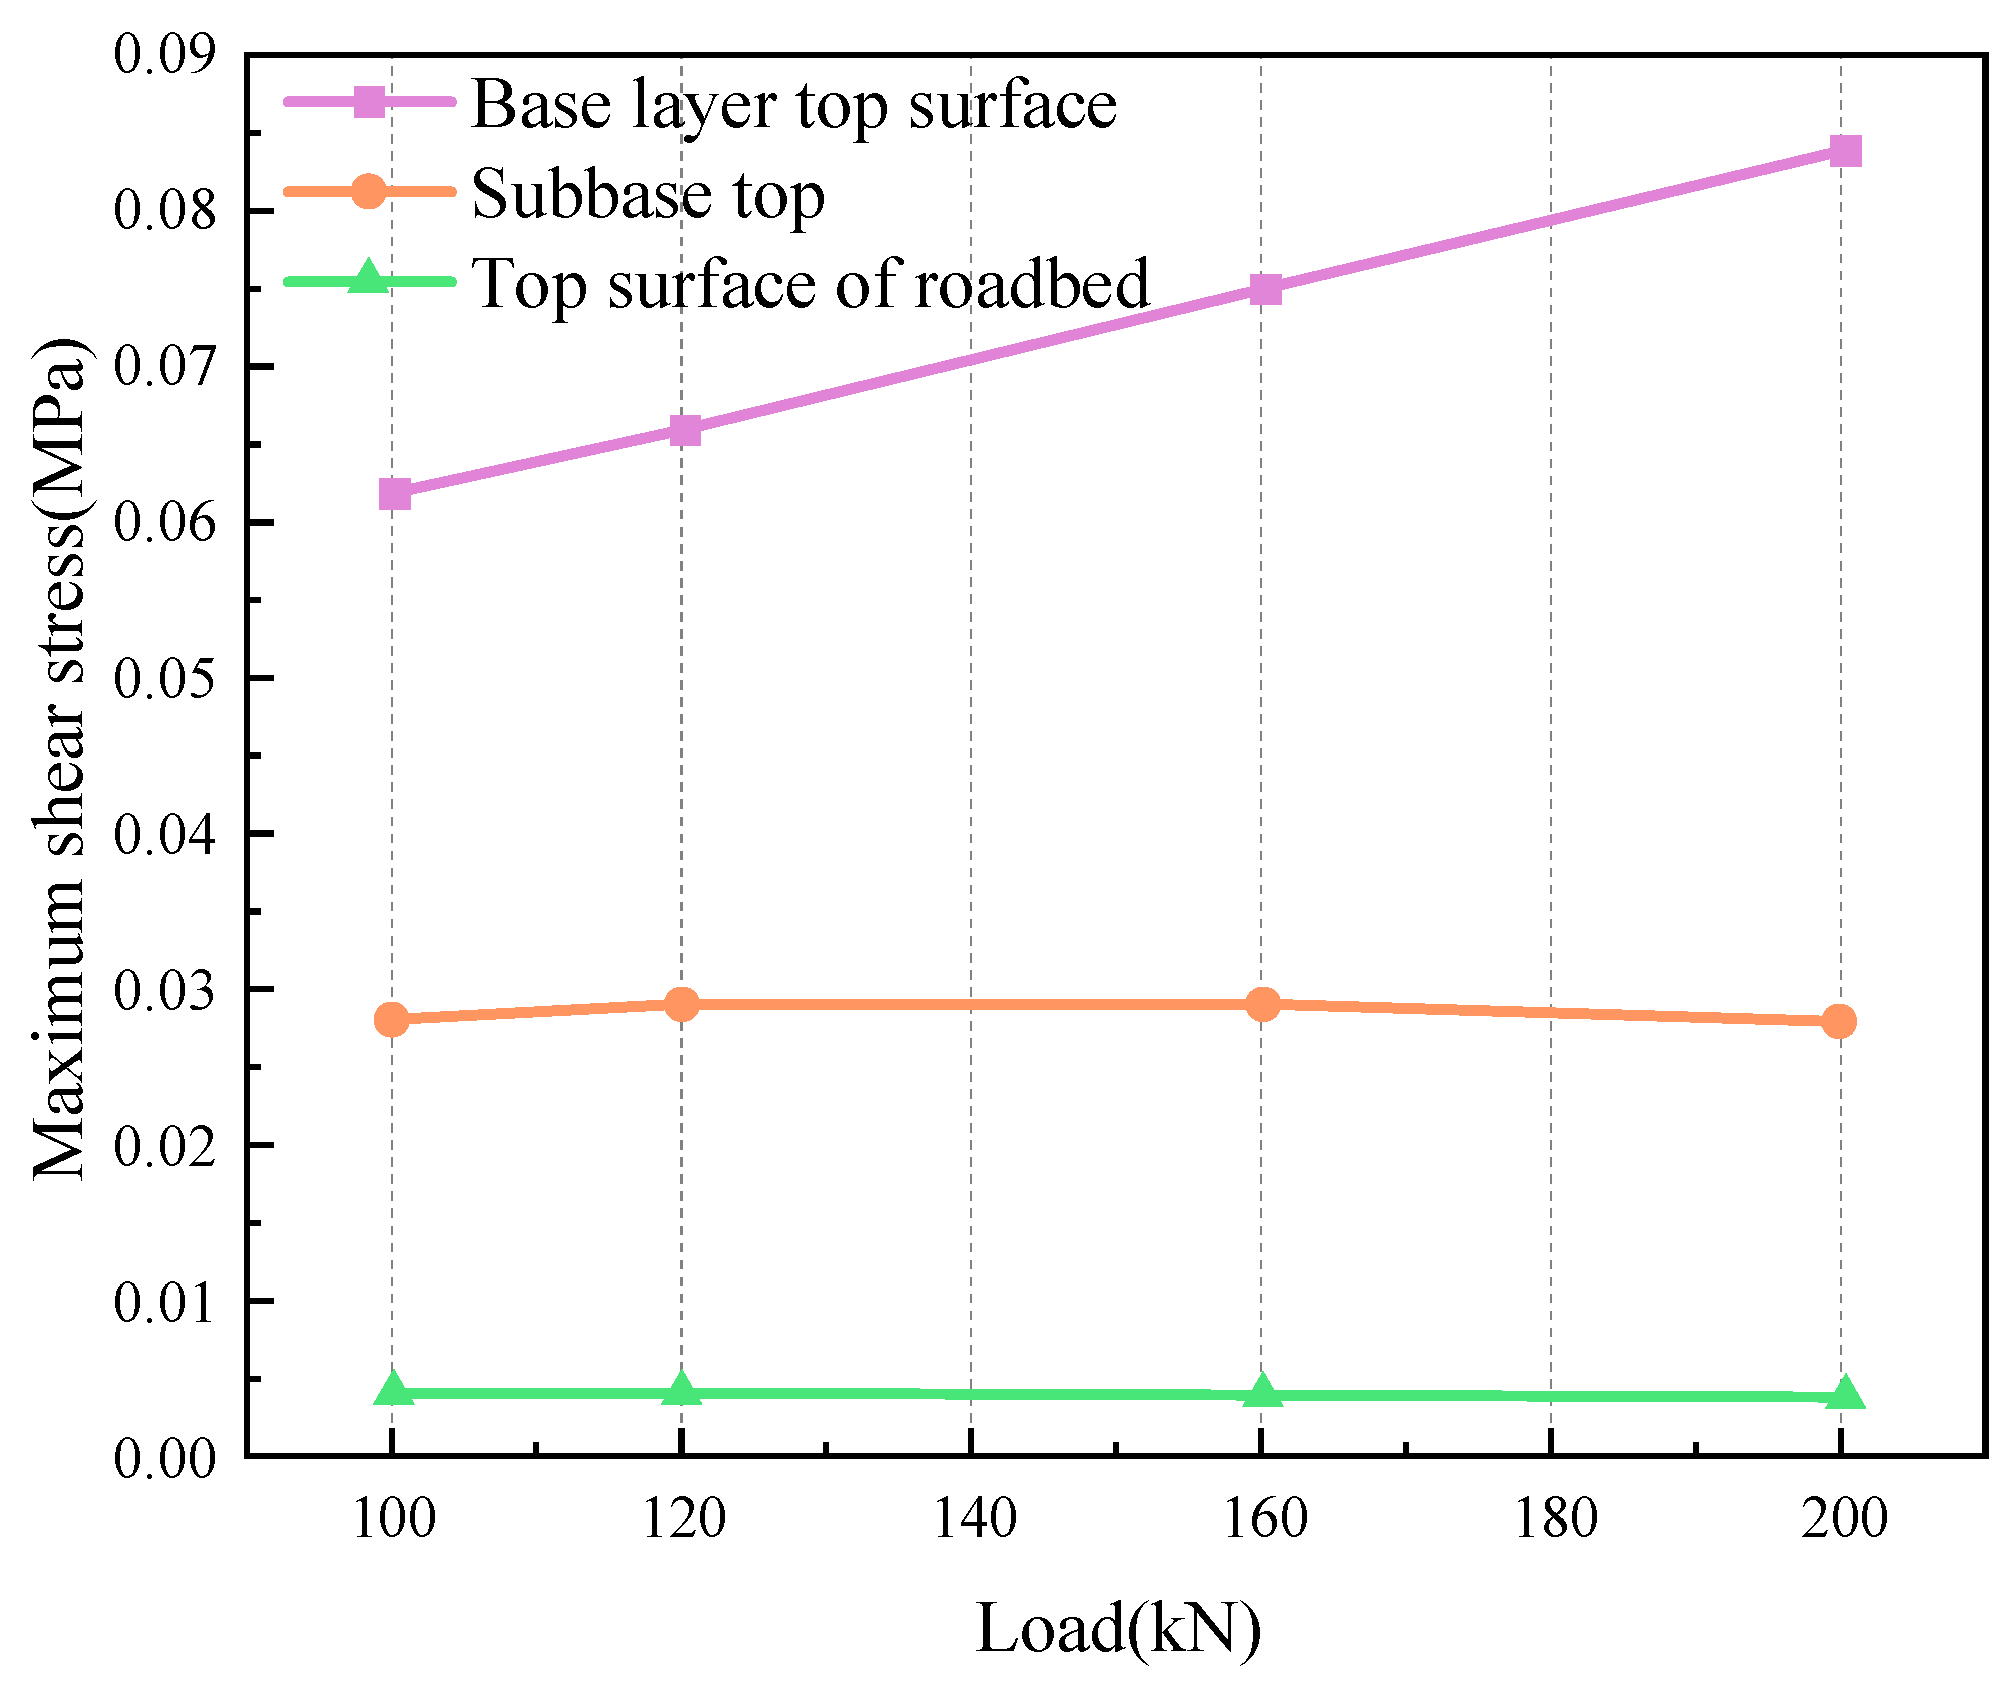
- (3)
- Analysis of calculation results
5. Conclusions
- (1)
- Recycled construction waste has irregular shapes, wide particle size distribution, rough surface and microcracks. Its natural moisture content is 8.5%, its water absorption is 11.73%, and its apparent density is 2.61 g/cm3. The liquid limit of recycled fine aggregate is 20%, the plasticity index is 5.4, and the relationship curve between coarse material content and maximum dry density is Y = 1.73821 + 0.00132X. Although its physical properties are not as good as natural aggregate, its load ratio (25–55%) and low expansion characteristics meet the requirements of highway subgrade filler specifications.
- (2)
- The loose paving thickness of the lower embankment, upper embankment, and roadbed is 350 mm, 350 mm and 250 mm, respectively. After multiple rolling, the compaction degree meets the requirements. After 6 to 8 times of vibration compaction of the loose paving thickness of 250 mm, the settlement difference is less than 5 mm and tends to be stable. When the loose paving thickness of the embankment is 350 mm and the compaction thickness after eight times performing vibration compaction is 291~301 mm. According to the results of finite element simulation, the settlement of the roadbed is stable at 20~30 mm. Under different loads, the vertical displacement is inversely proportional to the axle distance, and overloading significantly increases the vertical displacement and shear stress.
- (3)
- The complex composition and large strength differences in construction waste fillers lead to significant discreteness in their physical and mechanical properties, which may affect the universality of the simulation results. This study did not fully consider the performance differences in construction waste from different sources and lacked a systematic evaluation of long-term service performance. In the future, it is necessary to optimize material properties, improve numerical models, and conduct long-term performance tests.
Author Contributions
Funding
Data Availability Statement
Conflicts of Interest
References
- Luangcharoenrat, C.; Intrachooto, S.; Peansupap, V.; Sutthinarakorn, W. Factors Influencing Construction Waste Generation in Building Construction: Thailand’s Perspective. Sustainability 2019, 11, 3638. [Google Scholar] [CrossRef]
- Wang, Z.; Hu, T.; Liu, J. Decoupling Economic Growth from Construction Waste Generation: Comparative Analysis between the EU and China. J. Environ. Manag. 2024, 353, 120144. [Google Scholar] [CrossRef] [PubMed]
- Lv, H.; Li, Y.; Yan, H.-B.; Wu, D.; Shi, G.; Xu, Q. Examining Construction Waste Management Policies in Mainland China for Potential Performance Improvements. Clean Technol. Environ. Policy 2021, 23, 445–462. [Google Scholar] [CrossRef]
- Mei, Y.; Zhou, D.; Wang, H.; Ke, X.; Liu, Z.; Tian, X.; Wang, Z. Study on Carbon Emission Calculation during the Materialization Phase of Subway Stations and Comparative Analysis of Carbon Emissions from Various Construction Methods. Case Stud. Constr. Mater. 2024, 21, e03923. [Google Scholar] [CrossRef]
- Yuan, B.; Chen, W.; Li, Z.; Zhao, J.; Luo, Q.; Chen, W.; Chen, T. Sustainability of the Polymer SH Reinforced Recycled Granite Residual Soil: Properties, Physicochemical Mechanism, and Applications. J. Soils Sediments 2023, 23, 246–262. [Google Scholar] [CrossRef]
- Zhou, D.; Mei, Y.; Ke, X.; Liu, Z.; Xu, W. Study on the Structural Behavior and Reinforcement Design of Openings in Subway Station Floor Slabs. J. Build. Eng. 2024, 98, 110994. [Google Scholar] [CrossRef]
- Yuan, B.; Liang, J.; Huang, X.; Huang, Q.; Zhang, B.; Yang, G.; Wang, Y.; Yuan, J.; Wang, H.; Yuan, P. Eco-efficient recycling of engineering muck for manufacturing low-carbon geopolymers assessed through LCA: Exploring the impact of synthesis conditions on performance. Acta Geotech. 2024, 1–21. [Google Scholar] [CrossRef]
- Cui, C.; Wang, S.; Cui, W.; Zheng, X. Bearing Behavior of the Fly Ash Deposits on Expressway. Adv. Civ. Eng. 2019, 2019, 8450401. [Google Scholar] [CrossRef]
- Wang, Q.; Zhang, J.; Liu, K.; Xu, A.; Xu, H.; Yang, M.; Wang, C.; Yang, R.; Bao, G.; Liu, Y.; et al. Study on Performance Tests and the Application of Construction Waste as Subgrade Backfill. Materials 2021, 14, 2381. [Google Scholar] [CrossRef]
- Huang, Y.; Chen, J.; Tian, A.; Wu, H.; Zhang, Y.; Tang, Q. Mechanical Properties of Fiber and Cement Reinforced Heavy Metal-Contaminated Soils as Roadbed Filling. J. Cent. South Univ. 2020, 27, 2003–2016. [Google Scholar] [CrossRef]
- Wang, Q.; Kong, L.; Tseng, M.-L.; Song, Y.; Wang, H. Solid Waste Material Reuse Analysis: Filling the Road Subgrade with Riverway Silt and Sediment. Environ. Sci. Pollut. Res. 2022, 29, 35096–35109. [Google Scholar] [CrossRef] [PubMed]
- Gao, Q.; Ge, J.; Zhang, J.; Ren, Z.; Wu, D.; Cheng, G.; Zhang, K. Experimental Study on the Engineering Characteristics of Modified Silt in the Yellow River Alluvial Plain. Constr. Build. Mater. 2023, 398, 132491. [Google Scholar] [CrossRef]
- Chen, R.; Cai, G.; Dong, X.; Mi, D.; Puppala, A.J.; Duan, W. Mechanical Properties and Micro-Mechanism of Loess Roadbed Filling Using by-Product Red Mud as a Partial Alternative. Constr. Build. Mater. 2019, 216, 188–201. [Google Scholar] [CrossRef]
- Li, X.; Yan, P.; Yin, S.; Zhang, X.; Liu, P.; Wang, Y. Strength Characteristics and Micro-Mechanism of Silty Soil Modified by Red Mud Co-Cement. Sustainability 2023, 15, 8762. [Google Scholar] [CrossRef]
- Zhang, X.; Geng, J.; Hu, G.; Su, L.; Li, T.; Wang, Y.; Zheng, C.; Li, W.; Zhang, X. Toughening Characteristics of Rubber Granule-Improved Alkali-Activated Slag-Stabilized Aeolian Sand. Constr. Build. Mater. 2024, 438, 137059. [Google Scholar] [CrossRef]
- Yin, P.; Wang, J.; He, W.; Wang, S.; Li, X.; Jia, Z. Machine Learning-Based Study on the Mechanical Properties and Embankment Settlement Prediction Model of Nickel–Iron Slag Modified Soil. Constr. Build. Mater. 2024, 431, 136468. [Google Scholar] [CrossRef]
- Feng, Y.; Shi, L.; Ma, D.; Chai, X.; Lin, C.; Zhang, F. Road Performance Evaluation of Unburned Coal Gangue in Cold Regions. Sustainability 2023, 15, 13915. [Google Scholar] [CrossRef]
- Zhao, Y.; Li, Y.; Bi, J.; Wang, C.; Li, Y.; Zhong, X. Triaxial Compression Experiment and Damage Constitutive Model of Microbially Modified Strongly Weathered Phyllite. Constr. Build. Mater. 2023, 393, 131962. [Google Scholar] [CrossRef]
- Isa, M.H.; Koting, S.; Hashim, H.; Mo, K.H.; Aziz, S.A. Utilising Tile Waste as an Additive to Enhance Lime-Based Subgrade Stabilisation. Case Stud. Constr. Mater. 2024, 20, e03342. [Google Scholar] [CrossRef]
- Abukhettala, M.; Fall, M. Geotechnical Characterization of Plastic Waste Materials in Pavement Subgrade Applications. Transp. Geotech. 2021, 27, 100472. [Google Scholar] [CrossRef]
- Shamsi Sosahab, J.; Ardakani, A.; Hassanlourad, M. Resilient Response and Strength of Highly Expansive Clay Subgrade Stabilized with Recycled Concrete Aggregate and Granulated Blast Furnace Slag. Constr. Build. Mater. 2023, 408, 133816. [Google Scholar] [CrossRef]
- Hidalgo, C.; Carvajal, G.; Hincapie, A.; Muñoz, F.; Hernández, M. Ground Improvement by Construction and Demolition Waste (CDW) Soil Mixture Replacement. Buildings 2023, 13, 779. [Google Scholar] [CrossRef]
- Abriak, Y.; Maherzi, W.; Benzerzour, M.; Senouci, A.; Rivard, P. Valorization of Dredged Sediments and Recycled Concrete Aggregates in Road Subgrade Construction. Buildings 2023, 13, 646. [Google Scholar] [CrossRef]
- Ran, W.; Qiu, H.; Ai, X.; Zhang, S.; Wang, Y. Experimental Study on the Dynamic Modulus of an Asphalt Roadbed Grouting Mixture under the Influence of Complex and Multiple Factors. Buildings 2023, 13, 1969. [Google Scholar] [CrossRef]
- Zhi, X.; Yang, T.; Zhang, X.; Ren, Y.; Deng, P.; Chen, Y.; Xiao, Y. Experimental Study on the Mechanical Properties and Permeability of Cement-Stabilized Permeable Recycle Aggregate Materials. Sustainability 2023, 15, 14063. [Google Scholar] [CrossRef]
- Li, L.-H.; Liu, S.-S.; Xiao, H.-L.; Feng, W.-Q.; Li, J.-P.; Wu, P.-C. Experimental Investigation on Reinforcement Effect of Sustainable Materials for Different Subgrades. J. Clean. Prod. 2022, 343, 130944. [Google Scholar] [CrossRef]
- Li, Z.; Yan, S.; Liu, L.; Dai, B.; Dong, W. Long-term Deformation Analysis of Recycled Construction Waste Subgrade Filler. Adv. Civ. Eng. 2019, 2019, 5891759. [Google Scholar] [CrossRef]
- Zhang, J.; Ding, L.; Li, F.; Peng, J. Recycled Aggregates from Construction and Demolition Wastes as Alternative Filling Materials for Highway Subgrades in China. J. Clean. Prod. 2020, 255, 120223. [Google Scholar] [CrossRef]
- Shi, C.; Wang, Y.; Wu, C.; Song, W. Study on the Mechanical Properties and Design Parameters of Floor Slabs Waste Subgrade Filler. Adv. Mater. Sci. Eng. 2022, 2022, 4913825. [Google Scholar] [CrossRef]
- Wang, H.; She, H.; Xu, J.; Liang, L. A Three-Point Hyperbolic Combination Model for the Settlement Prediction of Subgrade Filled with Construction and Demolition Waste. Materials 2020, 13, 1959. [Google Scholar] [CrossRef]
- Ding, L.; Zhang, J.; Du, Q.; Zhou, C. Leaching Characteristic and Migration Simulation of Hazardous Elements in Recycled Aggregates as Subgrade Scenario. J. Clean. Prod. 2023, 420, 138270. [Google Scholar] [CrossRef]
- Yuan, B.; Liang, J.; Zhang, B.; Chen, W.; Huang, X.; Huang, Q.; Li, Y.; Yuan, P. Optimized Reinforcement of Granite Residual Soil Using a Cement and Alkaline Solution: A Coupling Effect. J. Rock Mech. Geotech. Eng. 2025, 17, 509–523. [Google Scholar] [CrossRef]
- JTG 3432-2024; Test Methods of Aggregate for Highway Engineering. China Communications Press: Beijing, China, 2024.
- JC/T 2281-2014; Inorganic Mixtures for Road Construction Using Recycled Construction Waste Aggregates. China Building Materials Industry Press: Beijing, China, 2014.
- JTG D30-2015; Specifications for Design of Highway Subgrades. China Communications Press: Beijing, China, 2015.
- JTG E40-2007; Test Methods of Soils for Highway Engineering. China Communications Press: Beijing, China, 2007.
- DB61/T 1149-2018; Technical Specification for Construction of Subgrade Using Recycled Construction Waste Materials. Shaanxi Provincial Institute of Standardization: Xi’an, China, 2018.
- JJG 198-2008; Verification Regulation of Velocity Flowmeter. National Technical Committee of Flow Capacity Measurement: Beijing, China, 2008.
- JTG E60-2008; Field Test Methods of Subgrade and Pavement for Highway Engineering. China Communications Press: Beijing, China, 2008.
- Jenck, O.; Dias, D.; Kastner, R. Three-Dimensional Numerical Modeling of a Piled Embankment. Int. J. Geomech. 2009, 9, 102–112. [Google Scholar] [CrossRef]
- Sun, Y.; Meng, S.; Wang, M.; Mu, H.; Tang, X. Deterioration Effect of Freeze-Thaw on Mechanical Properties of Roadbed Clay under Unfavorable Conditions. Bull. Eng. Geol. Environ. 2021, 80, 4773–4790. [Google Scholar] [CrossRef]
- Qi, H.; Yang, C.; Hu, C.; Rong, Y.; Yao, Z.; Jiang, H.; Yao, K.; Chen, L.; Li, H.; Teng, X. Analysis on Improvement Effect of Subgrade by Dynamic Compaction. Arab. J. Geosci. 2021, 14, 2281. [Google Scholar] [CrossRef]
- Garau, M.; Nieves, M.J.; Jones, I.S. Alternating Strain Regimes for Failure Propagation in Flexural Systems. Q. J. Mech. Appl. Math. 2019, 72, 305–339. [Google Scholar] [CrossRef]
- Wang, W.; Deng, Z.; Li, Y.; Huang, Z.; Niu, Y.; Xie, K. Numerical Analysis of Subgrade Behavior under a Dynamic Maglev Train Load. Adv. Civ. Eng. 2022, 2022, 2014376. [Google Scholar] [CrossRef]


| Materials | Apparent Density (g/cm3) | Packing Density (g/cm3) | Water Absorption (%) | Natural Moisture Content (%) |
|---|---|---|---|---|
| Natural aggregate | 2.77 | 1.62 | 5.90 | 1.90 |
| Recycled aggregate | 2.61 | 1.42 | 11.73 | 8.5 |
| Aggregate Type | Recycled Material (mm) | Natural Aggregate (mm) | ||
|---|---|---|---|---|
| 9.5~19.0 | 19.0~26.5 | 9.5~19.0 | 19.0~26.5 | |
| Recycled aggregate | 16.1 | 16.0 | 10.6 | 9.8 |
| Component Content (%) | Specimen Number | ||||||
|---|---|---|---|---|---|---|---|
| 1 | 2 | 3 | 4 | 5 | 6 | 7 | |
| Recycled Aggregate | 20 | 30 | 40 | 50 | 60 | 70 | 80 |
| Recycled fine aggregates | 80 | 70 | 60 | 50 | 40 | 30 | 20 |
| Typology | Number of Hits | Expansion (%) | Load Ratio Value (%) |
|---|---|---|---|
| Embankment fill | 30 | 0.004 | 25.11 |
| 50 | 0.025 | 31.52 | |
| 98 | 0.091 | 44.10 | |
| Roadbed Fill | 30 | 0.098 | 50.23 |
| 50 | 0.033 | 53.71 | |
| 98 | 0.026 | 54.15 |
| Testing Location | Number of Compaction Passes | Number of Testing Points | Compaction Test (%) | EVD (MPa) | ||||
|---|---|---|---|---|---|---|---|---|
| Minimum Value | Maximum Value | Average Value | Minimum Value | Maximum Value | Average Value | |||
| Lower Embankment | Sheep-foot roller 4 passes + vibrating roller 4 passes | 10 | 93.0 | 95.3 | 93.9 | 32 | 37 | 34.2 |
| Upper Embankment | Sheep-foot roller 4 passes + vibrating roller 6 passes | 10 | 94.3 | 95.9 | 94.9 | 45 | 50 | 47.9 |
| Subgrade | Sheep-foot roller 4 passes + vibrating roller 8 passes | 10 | 96.1 | 97.4 | 96.6 | 45 | 52 | 49.9 |
| Construction Waste Filler Type | Relationship Formula | R2 |
|---|---|---|
| 30% Coarse Aggregate | EVD = 15.53e1.501K | 0.962 |
| 40% Coarse Aggregate | EVD = 9.272e1.825K | 0.941 |
| 60% Coarse Aggregate | EVD = 6.671e2.245K | 0.984 |
| 70% Coarse Aggregate | EVD = 2.781e3.312K | 0.919 |
| Deflection Value (0.01 mm) | Measurement Point Number | |||||||||
|---|---|---|---|---|---|---|---|---|---|---|
| 1 | 2 | 3 | 4 | 5 | 6 | 7 | 8 | 9 | 10 | |
| Left Wheel | 210 | 200 | 140 | 180 | 190 | 230 | 90 | 160 | 40 | 200 |
| 210 | 200 | 220 | 230 | 160 | 200 | 180 | 174 | 180 | 170 | |
| Right Wheel | 30 | 100 | 52 | 52 | 120 | 140 | 90 | 70 | 80 | 100 |
| 120 | 110 | 90 | 40 | 160 | 60 | 100 | 130 | 68 | 80 | |
| Simulation Scenario | Materials | Thickness (m) | Density (kg/m3) | Elastic Modulus (MPa) | Poisson’s Ratio | Cohesion (kPa) | Internal Friction Angle (°) |
|---|---|---|---|---|---|---|---|
| Layered filling simulation | Silty clay (original foundation) | 18 | 1870 | 15.0 | 0.35 | 28.0 | 18.0 |
| Roadbed filler | 0.80 | 1810 | 40.7 | 0.22 | 25.0 | 35.6 | |
| Embankment filling | 5.20 | 1790 | 36.5 | 0.22 | 23.0 | 30.2 | |
| Simulation of different compaction levels | Roadbed filler (compaction degree 96%) | 6 | 1810 | 0.22 | 25.0 | 25.0 | 35.6 |
| Roadbed filler (compaction degree 93%) | 6 | 1790 | 0.22 | 23.0 | 23.0 | 30.2 | |
| Roadbed filler (compaction degree 90%) | 6 | 1720 | 0.22 | 20.0 | 20.0 | 28.7 | |
| Simulation under vehicle load | Cement stabilized base | 0.38 | 2400 | 800.0 | 0.25 | / | 40.0 |
| Cement stabilized base | 0.20 | 2400 | 700.0 | 0.25 | / | 35.0 |
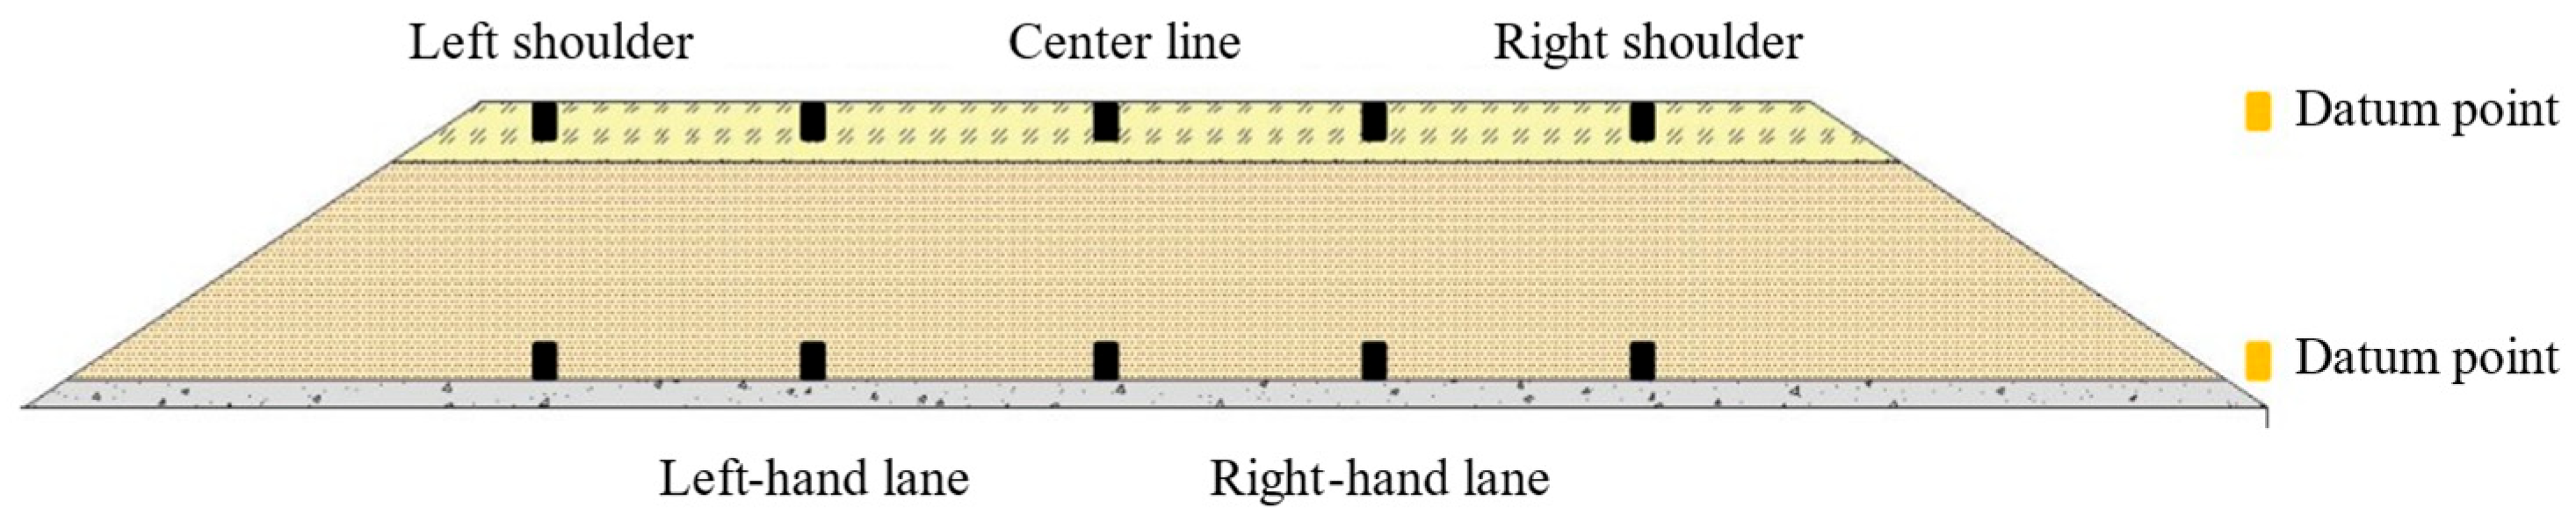
| Monitoring Points | Left Shoulder | Left Driving Lane | Subgrade Centerline | Right Driving Lane | Right Shoulder |
|---|---|---|---|---|---|
| Simulation results (mm) | 16.66 | 30.66 | 31.66 | 30.66 | 16.66 |
| Monitoring results (mm) | 24.29 | 23.46 | 25.00 | / | 29.00 |
| Residual (mm) | 7.63 | 7.20 | 6.72 | / | 12.34 |
| Settlement Point Location | Settlement Corresponding to Different Compaction Degrees (mm) | ||
|---|---|---|---|
| 90% | 93% | 96% | |
| Maximum settlement value of the model | 100.1 | 99.27 | 98.52 |
| Maximum horizontal displacement of the model | 25.18 | 25.10 | 25.05 |
| Subgrade surface center point settlement value | 18.15 | 17.69 | 17.46 |
| Settlement value at the foot of the roadbed | 13.38 | 13.52 | 13.61 |
| Horizontal displacement value at the foot of the embankment | 13.22 | 13.29 | 13.31 |
Disclaimer/Publisher’s Note: The statements, opinions and data contained in all publications are solely those of the individual author(s) and contributor(s) and not of MDPI and/or the editor(s). MDPI and/or the editor(s) disclaim responsibility for any injury to people or property resulting from any ideas, methods, instructions or products referred to in the content. |
© 2025 by the authors. Licensee MDPI, Basel, Switzerland. This article is an open access article distributed under the terms and conditions of the Creative Commons Attribution (CC BY) license (https://creativecommons.org/licenses/by/4.0/).
Share and Cite
Mei, Y.; Lu, H.; Wang, X.; Zhou, B.; Liu, Z.; Wang, L. Study on the Application and Deformation Characteristics of Construction Waste Recycled Materials in Highway Subgrade Engineering. Buildings 2025, 15, 835. https://doi.org/10.3390/buildings15050835
Mei Y, Lu H, Wang X, Zhou B, Liu Z, Wang L. Study on the Application and Deformation Characteristics of Construction Waste Recycled Materials in Highway Subgrade Engineering. Buildings. 2025; 15(5):835. https://doi.org/10.3390/buildings15050835
Chicago/Turabian StyleMei, Yuan, Hongping Lu, Xueyan Wang, Bingyu Zhou, Ziyang Liu, and Lu Wang. 2025. "Study on the Application and Deformation Characteristics of Construction Waste Recycled Materials in Highway Subgrade Engineering" Buildings 15, no. 5: 835. https://doi.org/10.3390/buildings15050835
APA StyleMei, Y., Lu, H., Wang, X., Zhou, B., Liu, Z., & Wang, L. (2025). Study on the Application and Deformation Characteristics of Construction Waste Recycled Materials in Highway Subgrade Engineering. Buildings, 15(5), 835. https://doi.org/10.3390/buildings15050835