Abstract
In this study, seven wet joint specimens of contact U-bars are designed in order to evaluate the flexural behavior of the wet joints in precast concrete slabs through four-point bending tests. This study investigates the effects of lap length, wet joint width, and water stop strips on the flexural behavior. The test results show that the ultimate bending capacity of the specimen with a lap length of 240 mm is 13.4% and 17.7% higher than that of the specimens with 160 mm and 80 mm. Water stop strips weaken the ductility of the specimen. The numerical model is established in ABAQUS finite element software and verified by the experimental results. Based on both test outcomes and finite element analysis, this study analyzes the deterioration effect of U-bars on the concrete within wet joints and proposes a calculation formula for flexural bending capacity that accounts for this deterioration. The proposed formula is shown to effectively predict the flexural capacity, since the theoretical predictions and the test results differ by less than 10%.
1. Introduction
The U-bar lapped connection is a structural configuration wherein closed U-shaped steel bars are overlapped to create a rectangular plane by extending precast concrete reinforcement bars, with transverse steel bars integrated within this plane. U-bar joints, as a type of precast concrete, have many advantages such as high bending capacity and stiffness, fast installation speed, short construction period, good seismic performance, and light weight, making them widely applicable in fields such as bridges and constructions. Introducing prefabricated concrete panels into the bridge deck system can also help reduce plastic shrinkage of concrete after construction and suppress tensile stress in the panels. Numerous scholars have investigated the mechanical properties of U-bar wet joints.
Leonhardt [1] designed 13 non-transverse steel specimens consisting of two pairs of non-gap U-bars bonded together. The test results showed that when the lap length is less than 15 times diameter of the longitudinal reinforcement, the transverse reinforcement should be placed in the core concrete area of the joint. Di [2] carried out joint flexural shear tests on rectangular and T-shaped joints with stainless steel ties. The results showed that the bearing capacity of the four joints was similar, but the ductility of the joints was reduced by stainless steel ties. Joergensen [3] proved three important design parameters that affected the tensile strength and failure mode of the wet joint of U-bars through experiments: transverse reinforcement ratio, overlap length, and wet joint width of U-bars. Zalesov [4] proposed the theory of superposition of internal forces. The joint bearing capacity is composed of concrete, the bite force between U-bars and concrete, and a transverse steel bar. And the joint steel bar was welded in the test. Peng Zhu [5] tested four U-bar joint plates and found that fatigue load had no effect on the tensile capacity of bridge panels. Under the action of fatigue load, more small cracks appeared in the joint area. The width of the crack in the joint depended on the applied load. Li [6] conducted an experimental study on six precast concrete slabs with lead bars and compared the test results with the STM. Han [7] designed six joints with different forms of connection. The test results show that the bending resistance and ductility of U-bars can be improved compared with that of a straight bar. Ou [8] carried out low hysteretic tests on U-bar joint specimens, revealing that their ultimate bearing capacity and ductility surpassed those of straight bar specimens. Ma [9] found that a reduction in concrete strength in the wet joint section would lead to a reduction in tensile strength of the specimen. Based on the STM, the ultimate bearing capacity formula of non-contact U-bar joints was proposed. Huang [10] compared the four-point bending test results of wet joints between a traditional welded U-bar and notch double-loop. It is suggested that the welded connection can be omitted without affecting the bending capacity of the joint. Chapman [11] conducted bending tests on a non-contact U-bar wet joint, investigated the influence of lap length and concrete strength on the bearing capacity of the U-bar wet joint, and put forward the limit of non-contact U-bar spacing to ensure equal strength connection. Shi [12] carried out an axial tensile test and finite element simulation on a non-contact circular steel bar wet joint and analyzed the failure form and bearing mechanism of the specimen. The formula for calculating the tensile strength of wet joints of non-contact circular steel bars was presented, taking into account the influence of adjacent loop steel bars and transverse steel bars. Villalba [13] proposed the design of wet joints for U-bars through loading tests of 16 U-bar wet joints and wet joints with straight bars. Asemi [14] analyzed shear buckling of functionally graded annular sector plates using a three-dimensional elasticity approach. Yao [15] investigated the failure mechanism of U-bar joints in precast concrete structures through numerical simulations and provided a thorough analysis of the load transfer mechanism within the core region. Andersen [16] analyzed the triaxial stress state of three-dimensional reinforced concrete structures using finite element limit analysis, simulating the stress state and load-carrying capacity under ultimate conditions. Savino [17] established finite element models to simulate the process of crack propagation along the interface in concrete. Ooi [18] conducted a finite element analysis of the slip and split failure mechanisms at the concrete–reinforcement interface. Sørensen [19] studied the failure mechanism of symmetric U-bar joints loaded in tension and established a rigid plastic model to analyze the differences in the internal angle of friction and softening behavior between concrete and mortar.
The above-mentioned research primarily concentrates on non-contact U-bar joints [5,6,9,10,11,12,13,15,16,19], while there are few studies on contact U-bars. In order to promote the calculation and design of contact U-bar joints, understanding the advantages and limitations of contact joints can provide information for the decision-making process of construction projects, which ultimately promote efficient and effective on-site assembly practices. In this paper, a comprehensive study of wet joints is conducted through both experimental and theoretical analyses. The influences of the lap length, wet joint length, and water stop strip are examined in detail. Based on experimental results and finite element analysis, we analyze the load–deflection curve, crack propagation patterns, and failure modes. Additionally, a calculation formula for the ultimate bending capacity of contact U-bar joints that accounts for concrete deterioration is proposed based on a strut-and-tie model.
2. Experimental Section
2.1. General
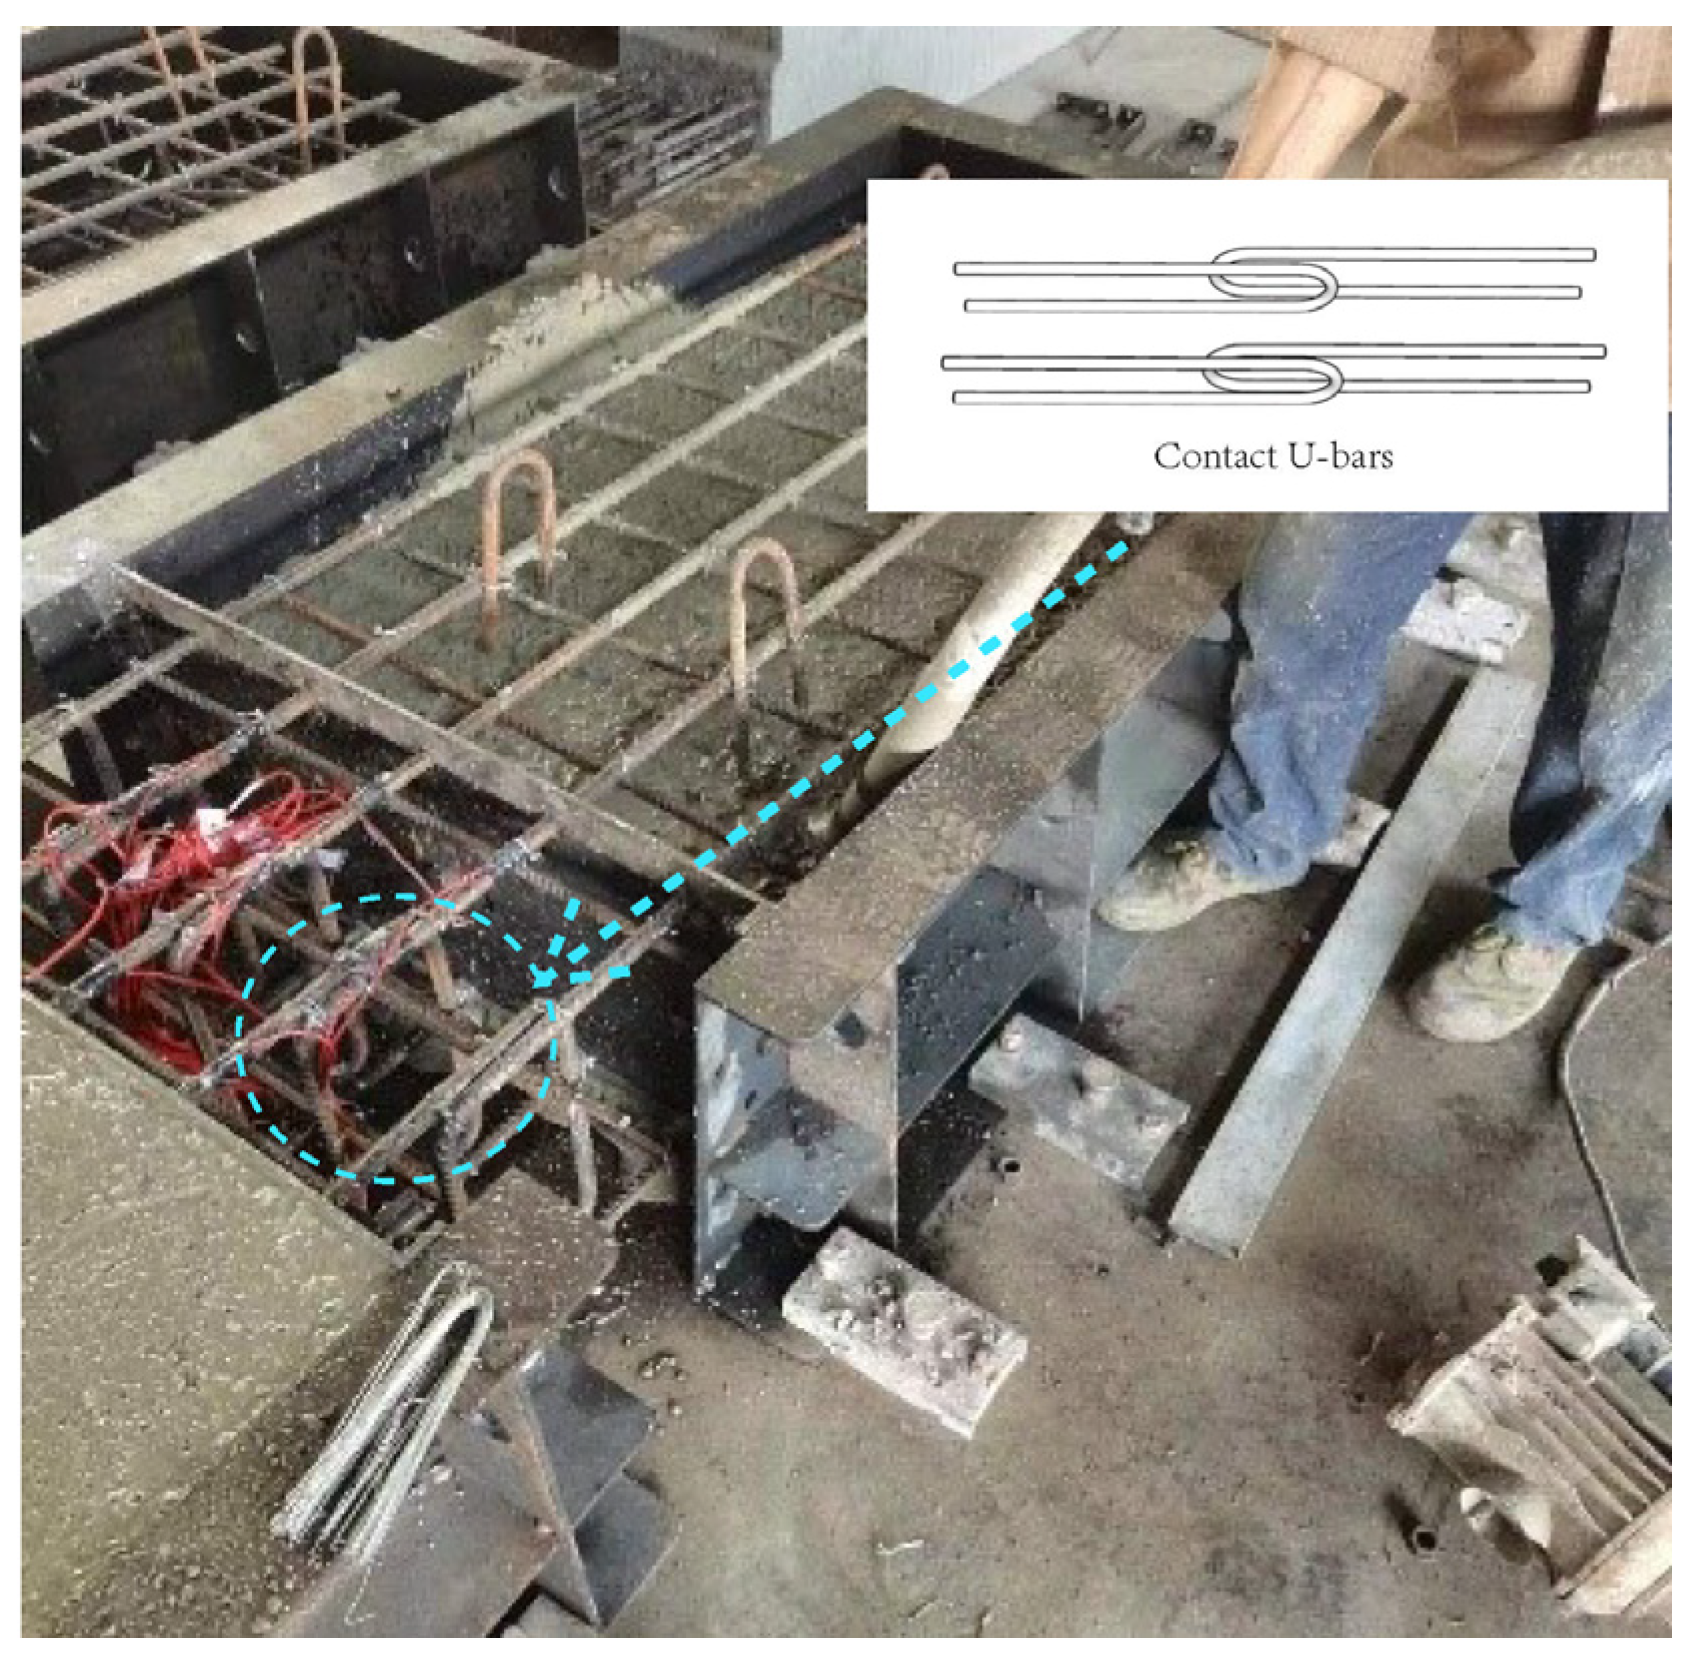
Compared to straight bar connections, U-bars (as shown in Figure 1) can avoid the binding and welding processes during the use of straight bar lap joints, which improves construction efficiency. Compared with non-contact U-bars, contact U-bars have higher installation efficiency and better durability. Therefore, it is essential to conduct experiments to study the mechanical properties of contact U-bar joints.
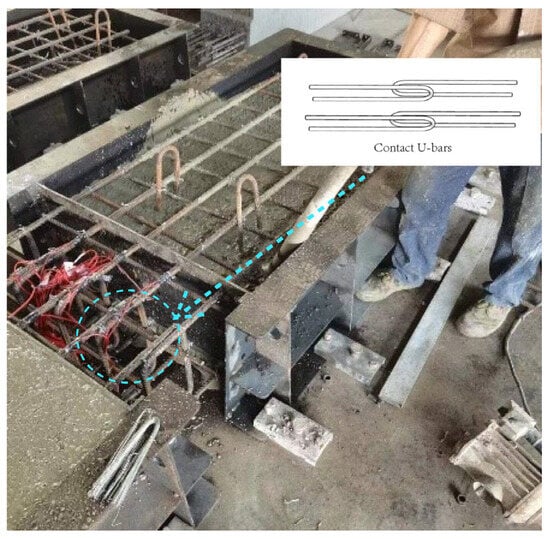
Figure 1.
Contacted U-bars.
2.2. Specimens Design
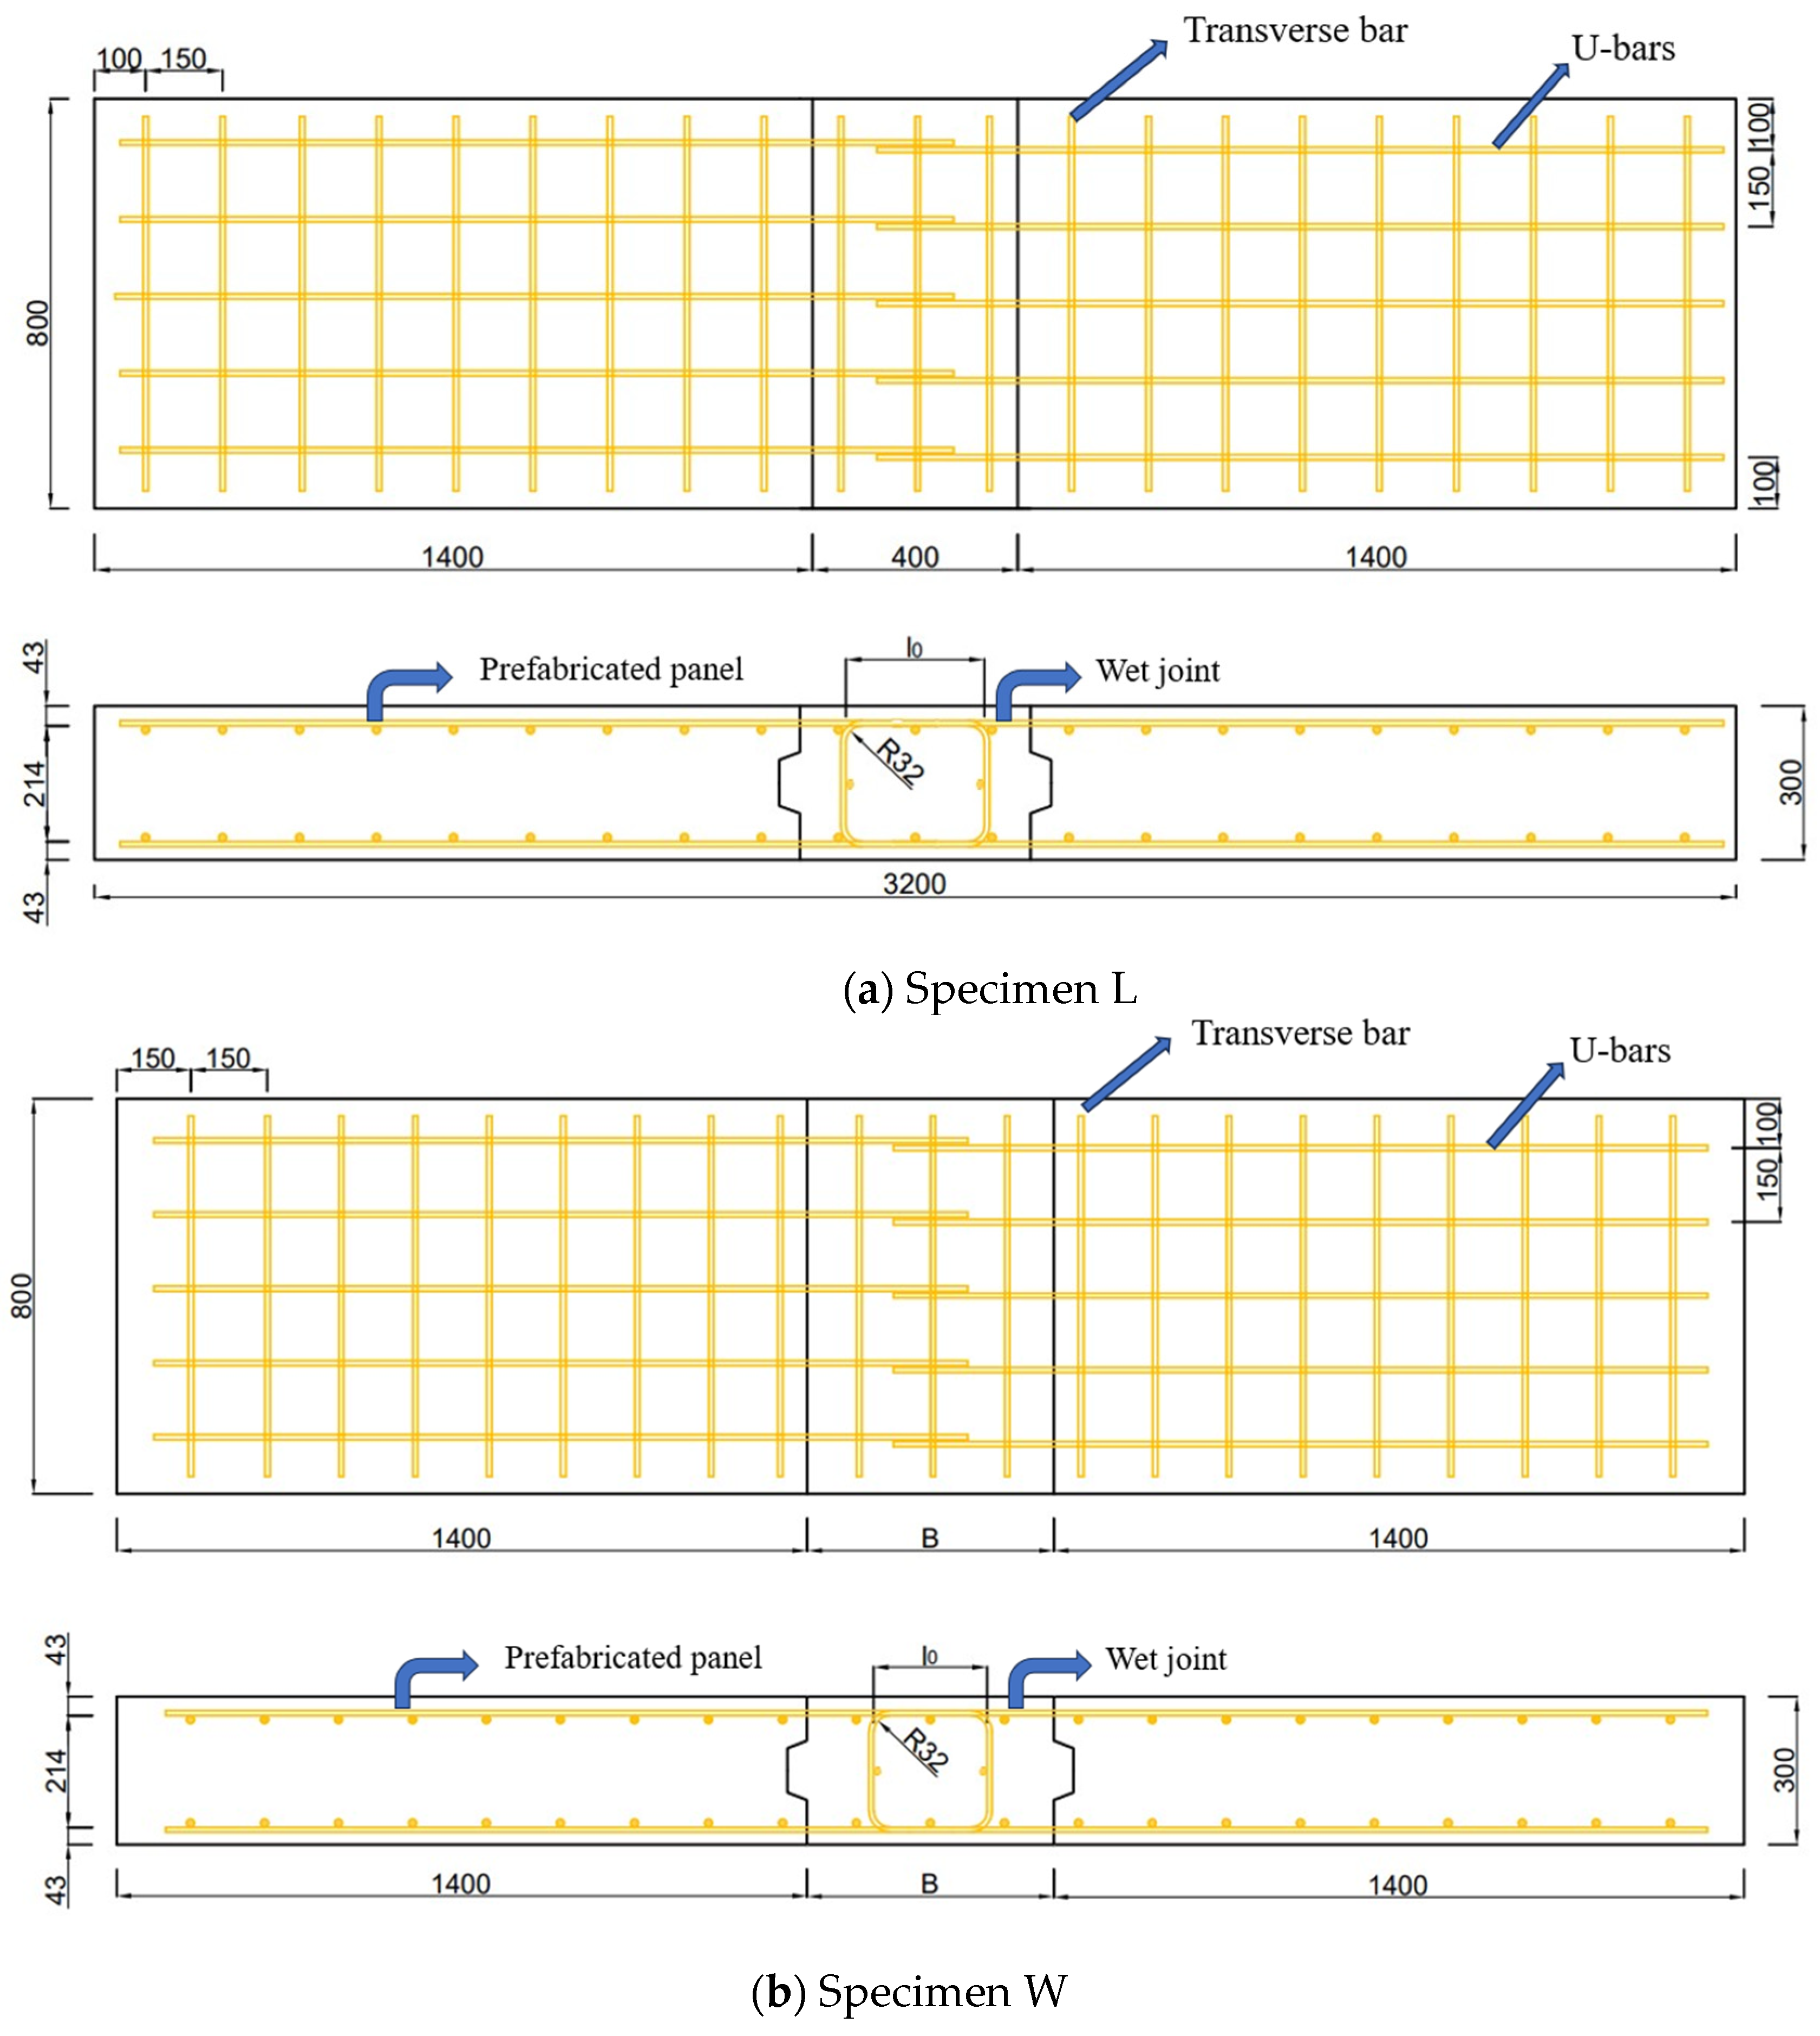
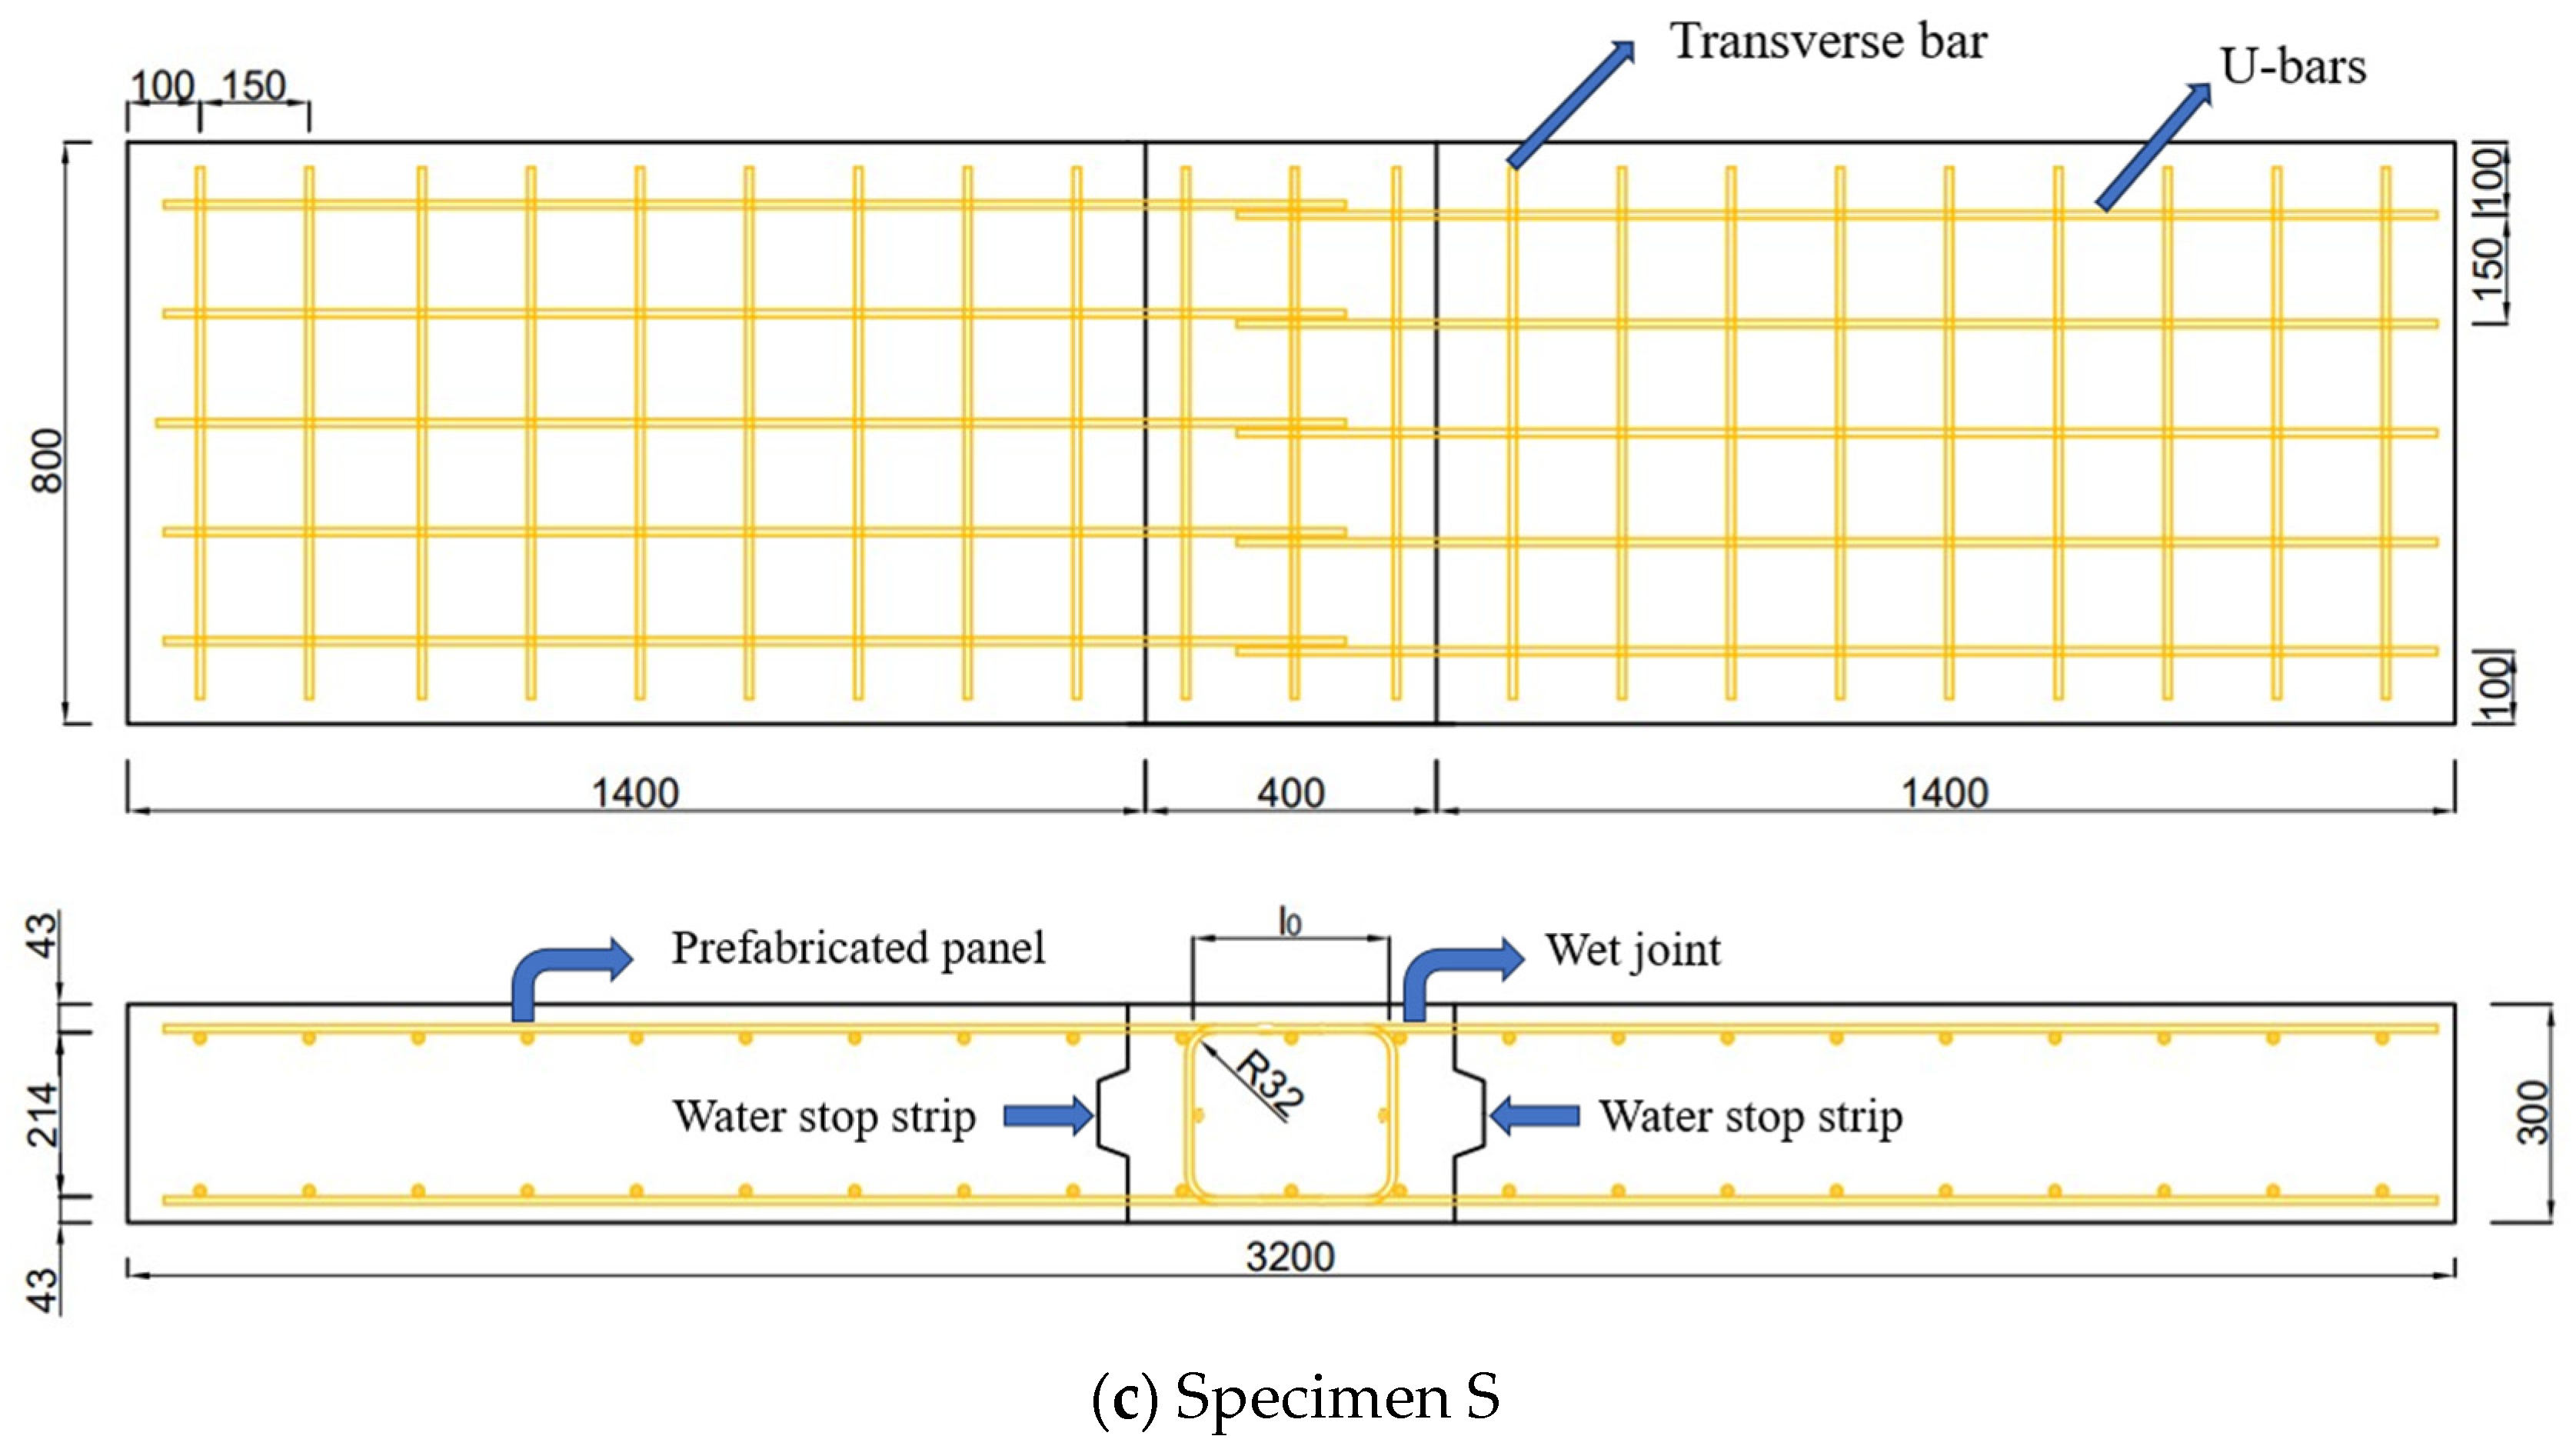
In this study, 7 U-bar wet joints were designed, and the effects of the lap length (L), wet joint width (W), and water stop strip (S) on the bearing capacity of the specimens were compared and analyzed. All specimens are contact U-bar wet joints. A detailed specimen design diagram is shown in Figure 2. Details of the specimens are shown in Table 1. The last parameter λ is the ratio of the overlap length to the diameter of the U-bars, as shown in Figure 3. The space between the U-bar and transverse bar was 150mm. The joint type was a tongue joint, featuring a protective layer thickness of 35 mm. The precast concrete was C30, and the wet joint concrete was C35. All specimens were poured through metal molds, and the concrete surface of the tongue joint was chiseled before the wet joint was poured.
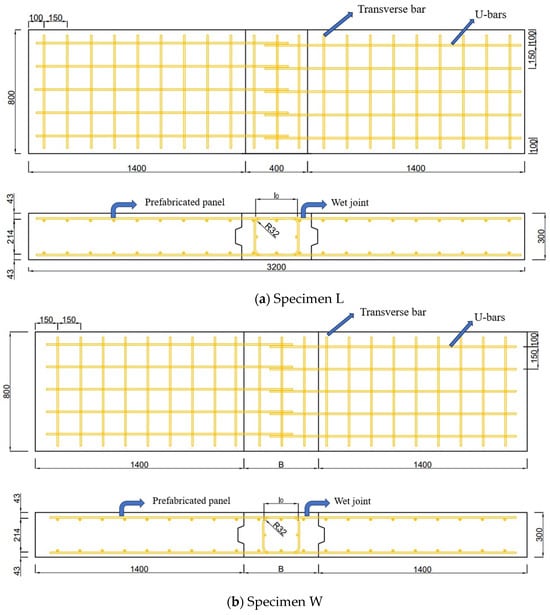

Figure 2.
Details of specimens (the unit of length is millimeters).

Table 1.
Features of the specimens.
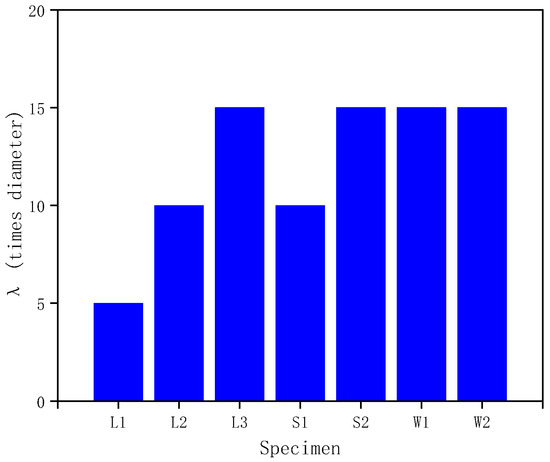
Figure 3.
The ratio λ (λ = overlap length/bar diameter).
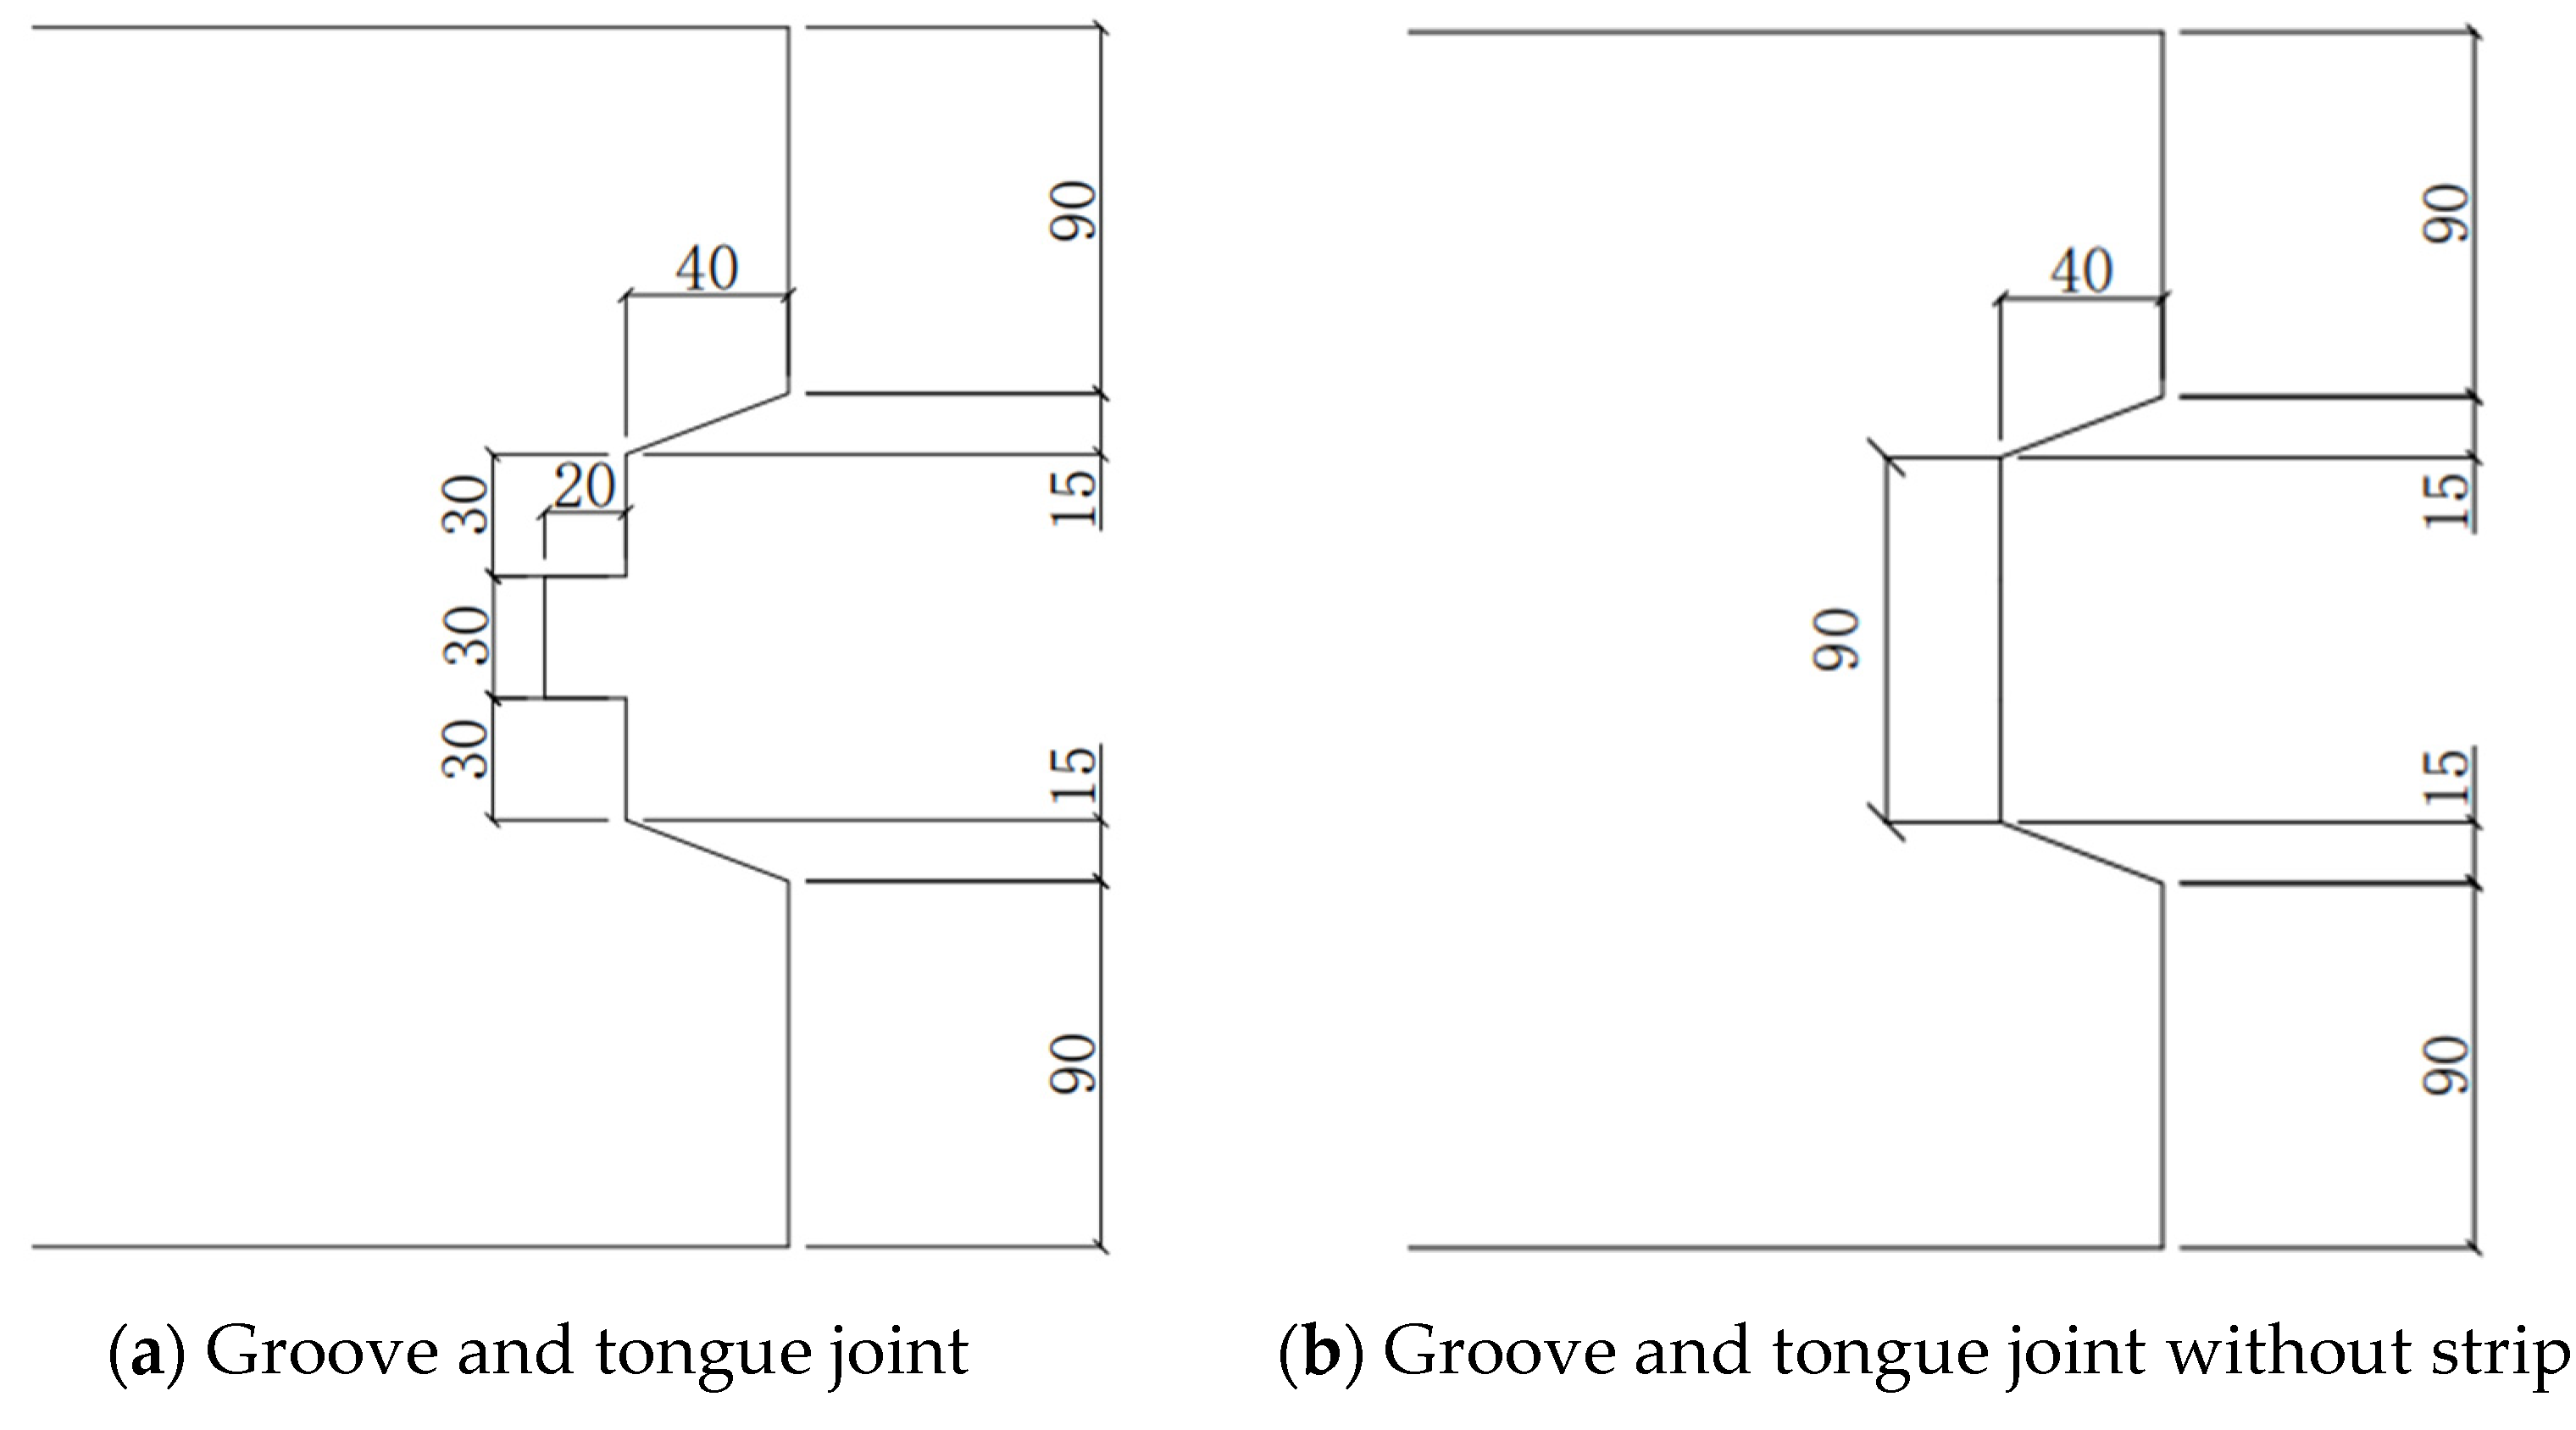
The specific structure of the joint section is shown in Figure 4. The depth of the sealing strip was 30mm and the thickness was 20mm. Except for specimens S1 and S2, other specimens were connected with grooves and tongues without water stop strips. The inner diameter of U-bar rounded corners was 32 mm.
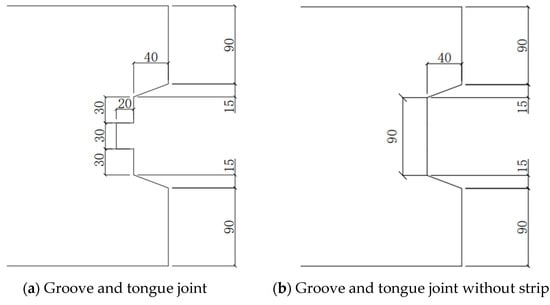
Figure 4.
Details of joint layout (the unit of length is millimeters).
2.3. Material Property
In the test, according to GB50010 [20], the compressive strength of the concrete was measured on a cube with a side length of 150 mm. The compressive strength of precast concrete is between 30 and 33 MPa, and the compressive strength of cast-in-place concrete is between 35 and 38 MPa. Therefore, these concretes met the requirements of compressive strength of C30 and C35 in the design code. The diameter of the U-bars was 16 mm, and the diameter of the transverse bar was 12 mm. The mechanical properties of the 16 mm and 12 mm bars are shown in Table 2, where the yield strain is 0.002.
Table 2.
Mechanical properties of steel.
2.4. Test Setup
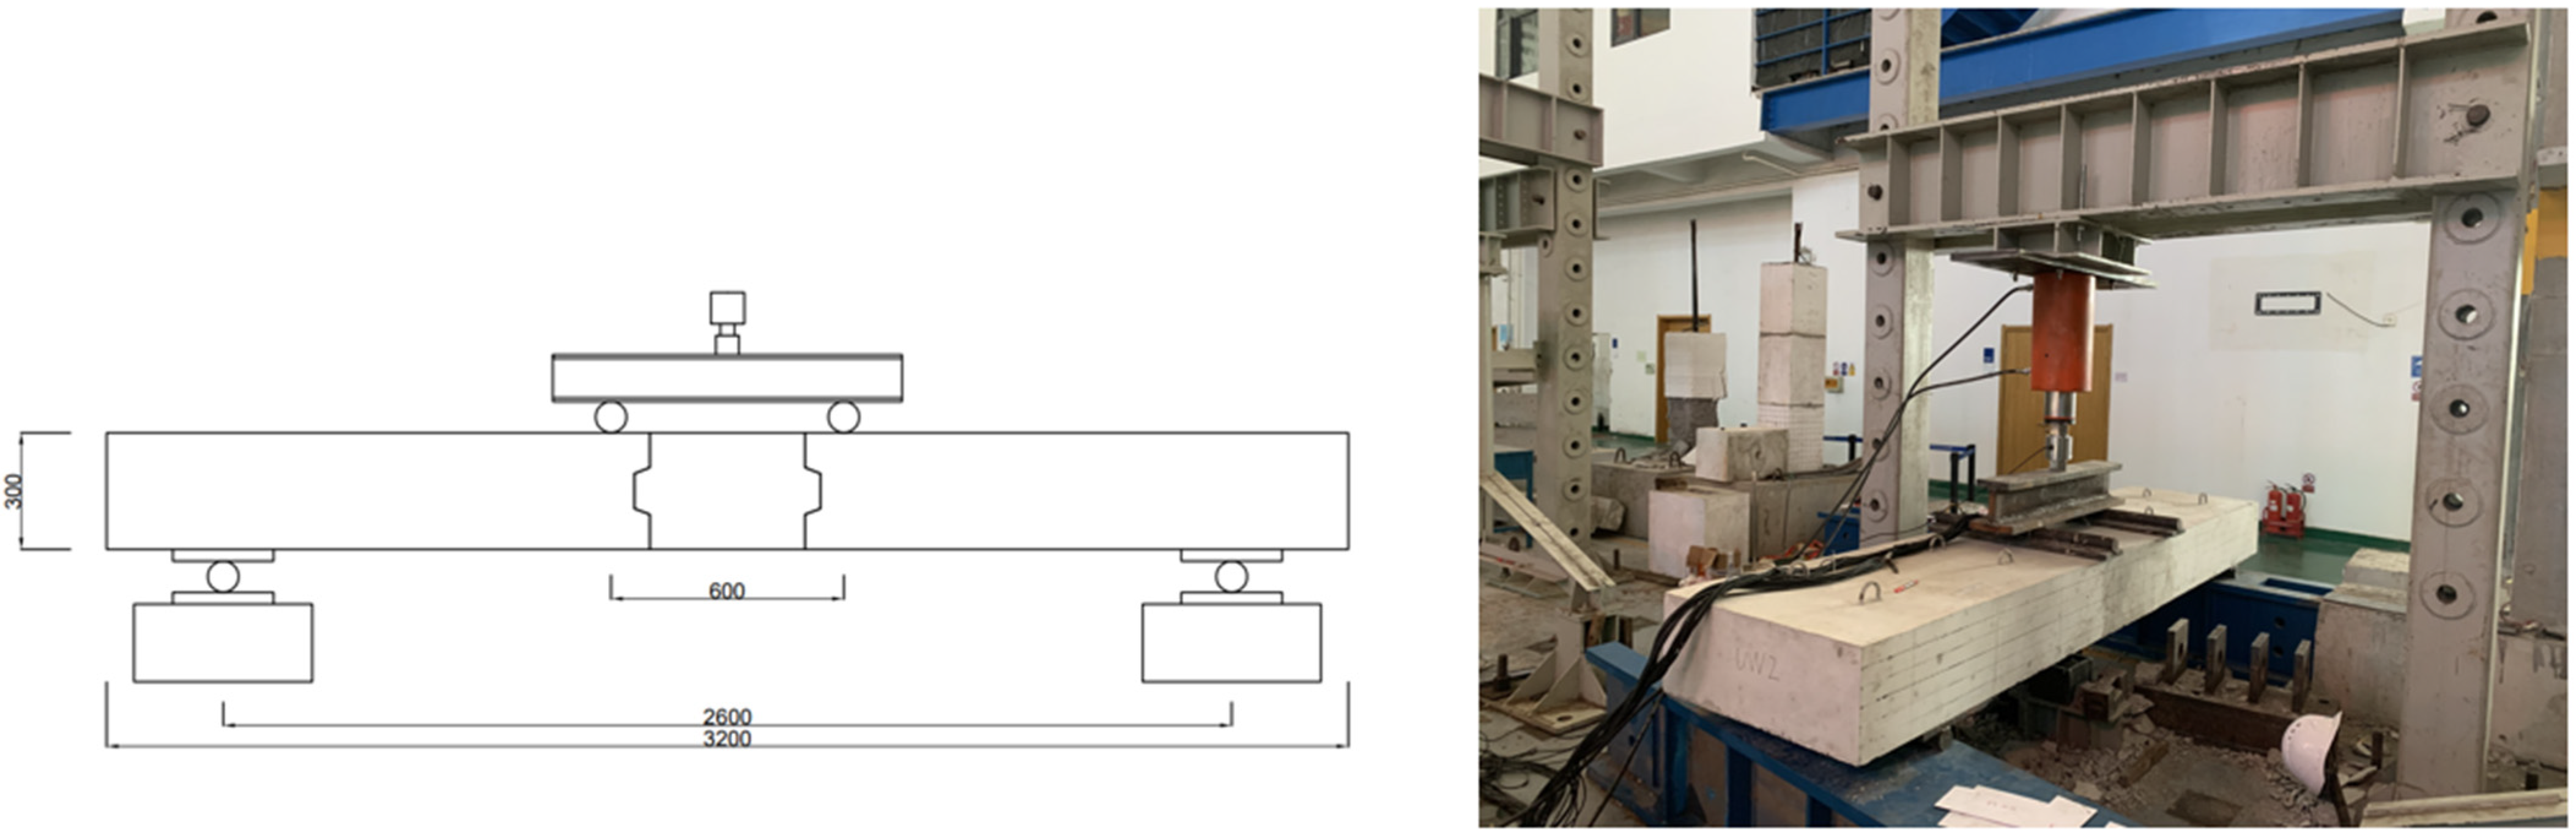
The design of the test device is shown in Figure 5. The span of the simply supported beam was 2600 mm, the thickness was 300 mm, and the width was 800 mm. The four-point bending loading method was used to carry out the test.

Figure 5.
Test setup (the unit of length is millimeters).
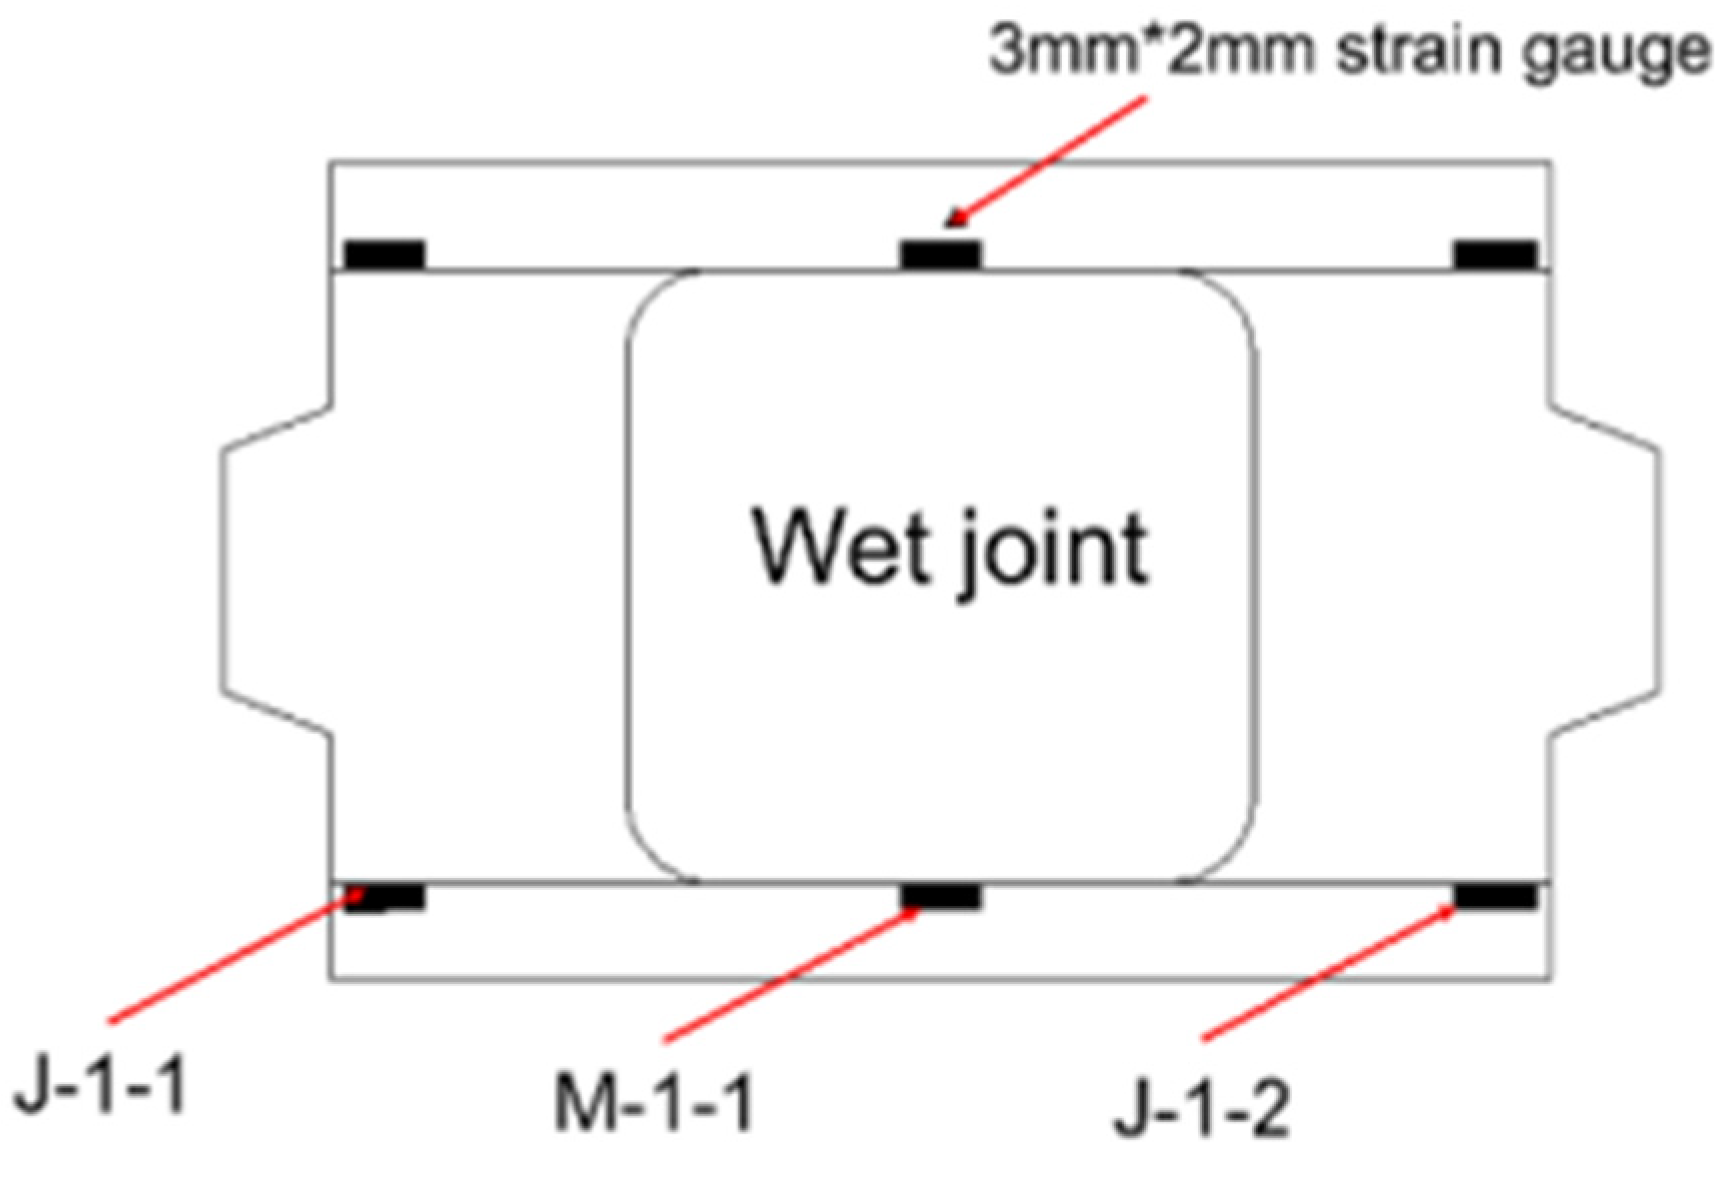
The load was applied to the distribution beam by jacks, and the two symmetrical loads were evenly transferred to the simple supported beam panel by hinge supports. The wet joint section was located in the pure bending section of the specimen. The pressure sensor was located between the distribution beam and the jack and was used to measure the load on the simply supported beam. The displacement meter was placed at the intersection of the mid-span and the wet joint and used to measure the displacement of these three points. Strain gauges were used to measure the strain of steel bars, and the specific arrangement is shown in Figure 6.
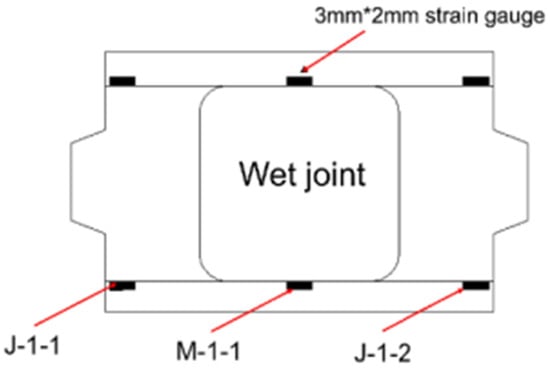
Figure 6.
Strain gauge arrangement.
Before formal loading, preloading was used to avoid any possible failure. The formal loading adopted the method of gradually applying the load at a step of 10 kN until 80% of the expected initial crack load was reached. After that, 5 kN steps were applied to induce cracking. Afterwards, the load was applied at a step of 20 kN until yield.
After each loading step, the load constant was held for 5 min and the mid-span displacement was measured. The formation and spread of cracks were marked using a pen. After the steel bar yielded, the loading program was changed from force control to 5 mm step displacement control.
3. Test Results and Comments
3.1. Bearing Capacity
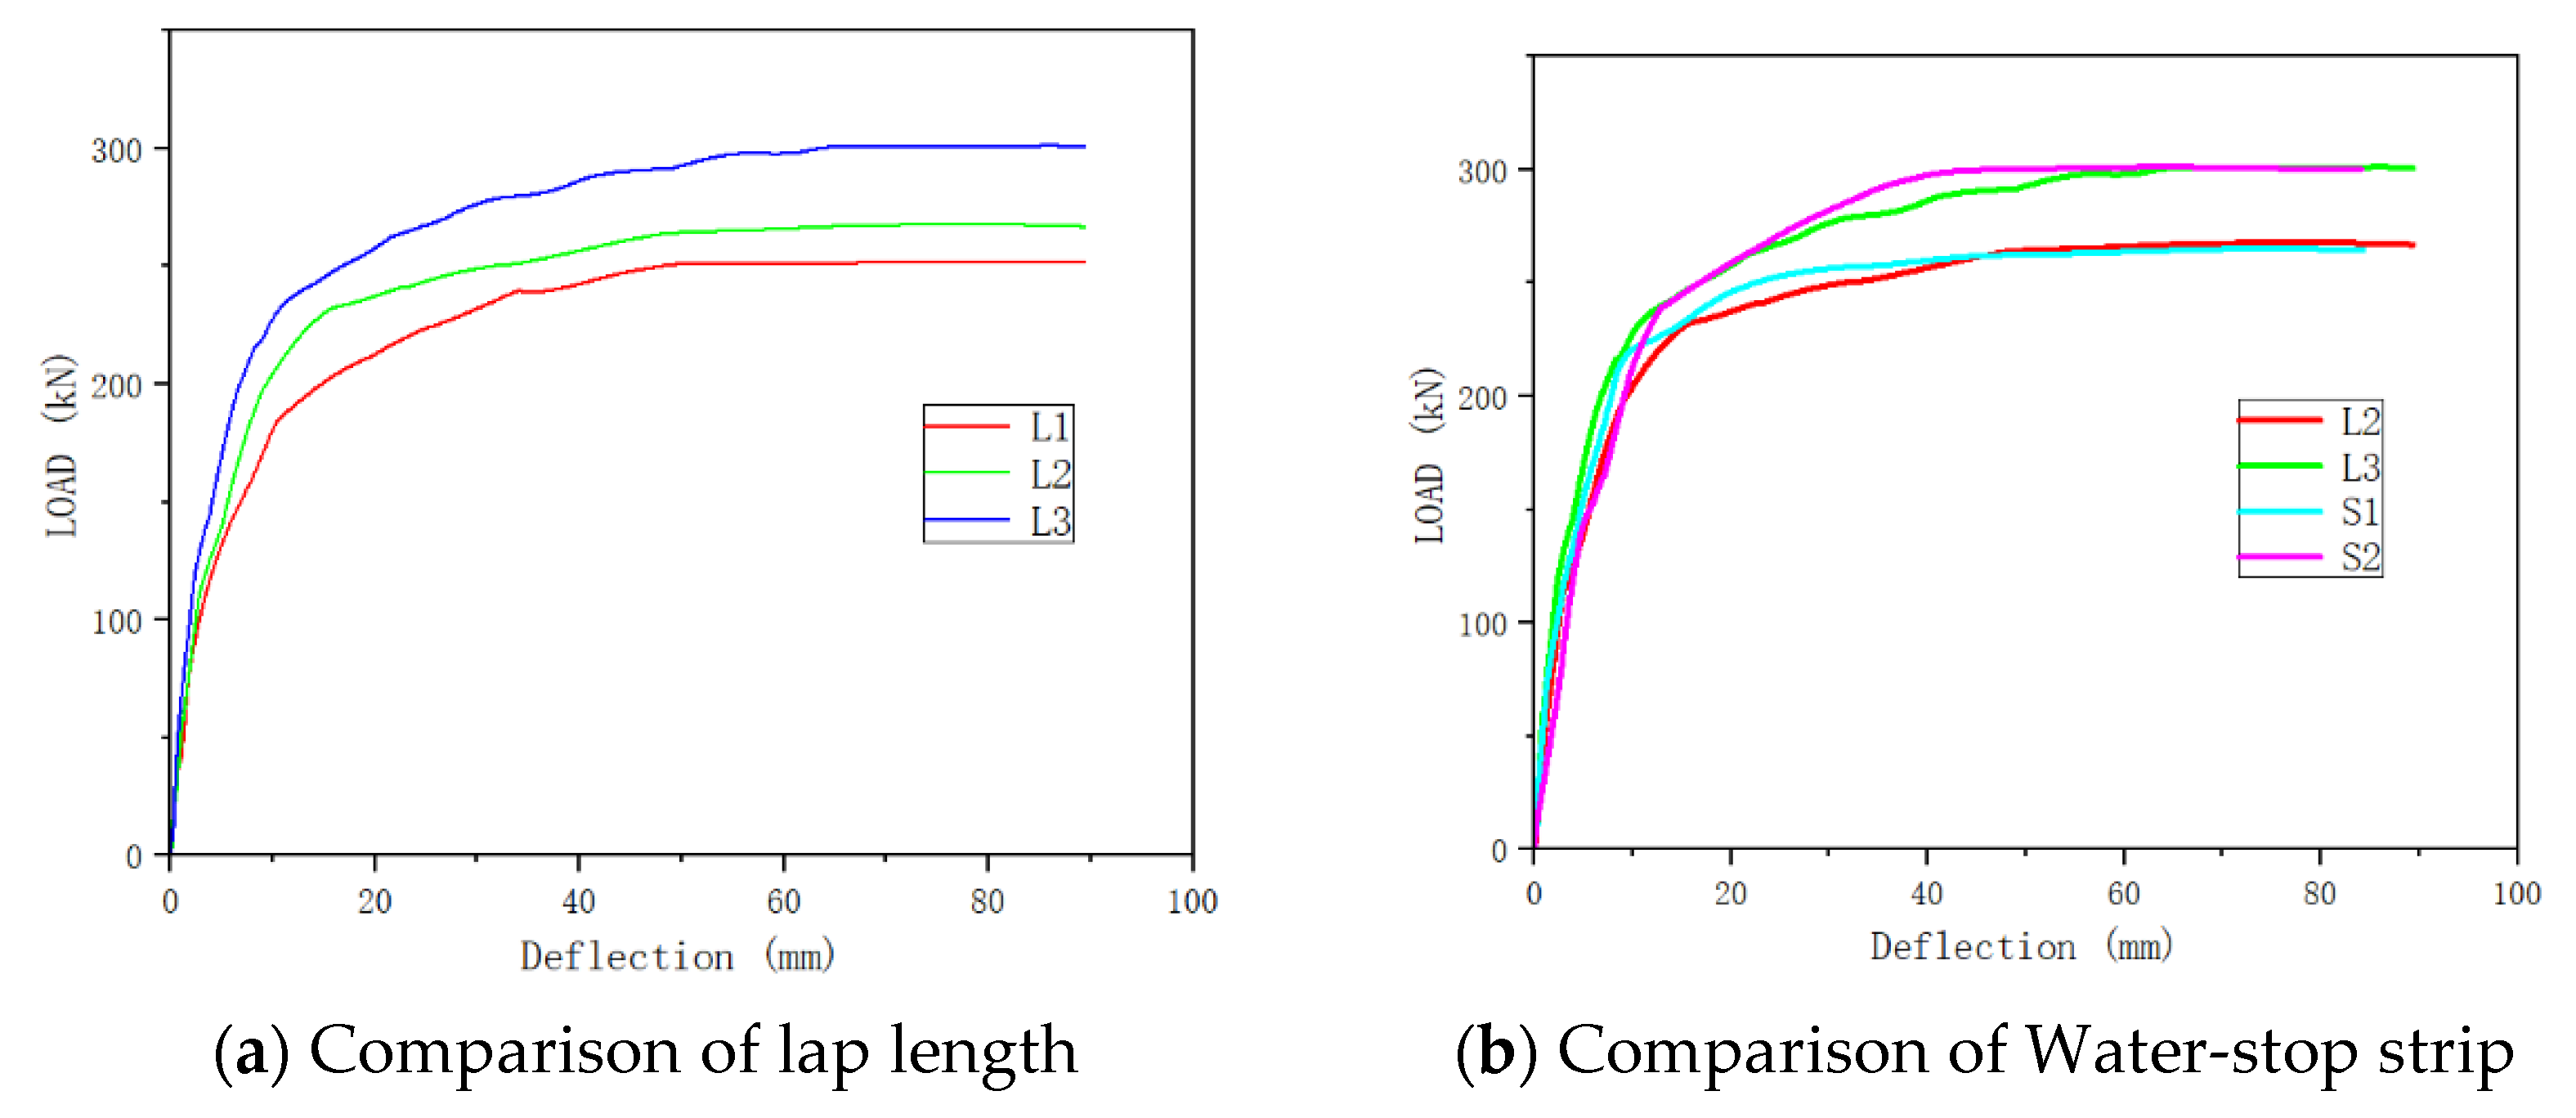
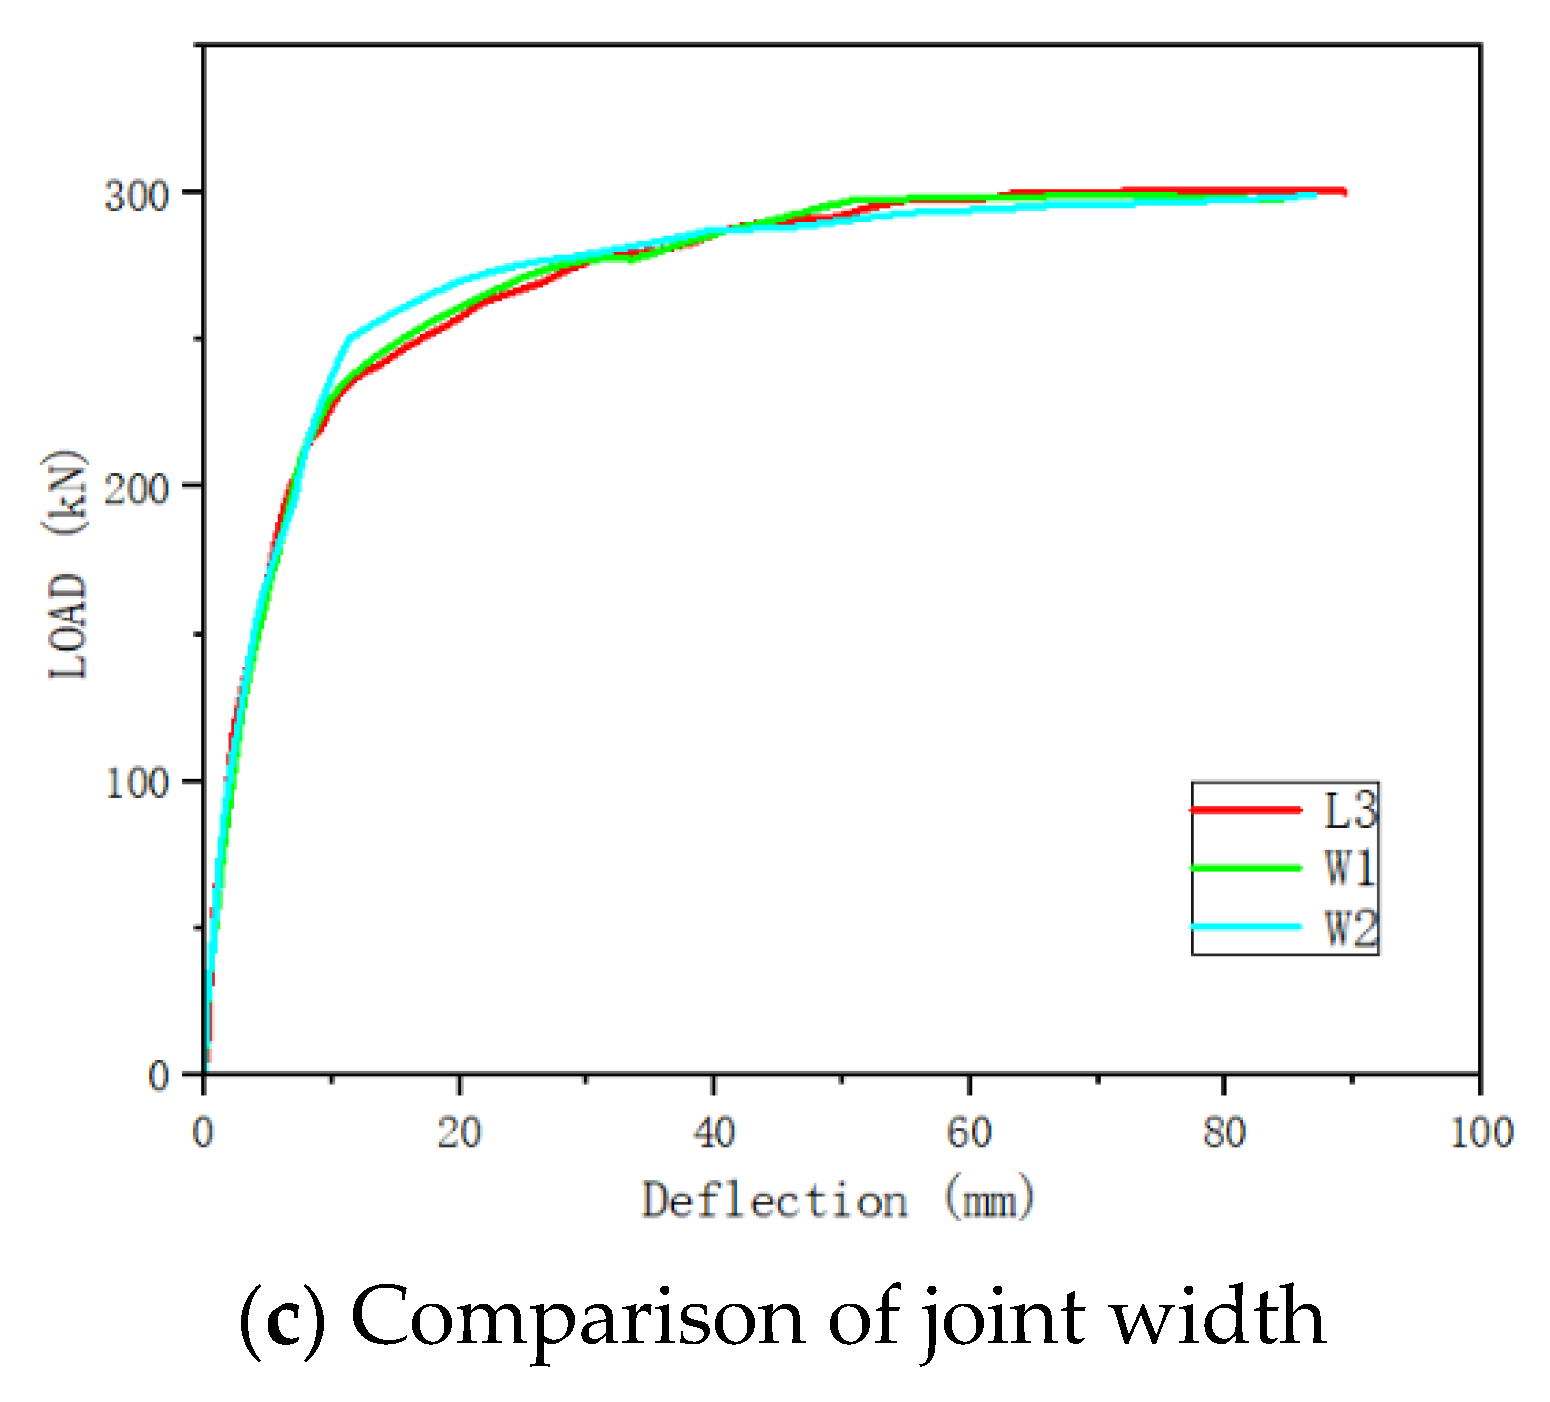
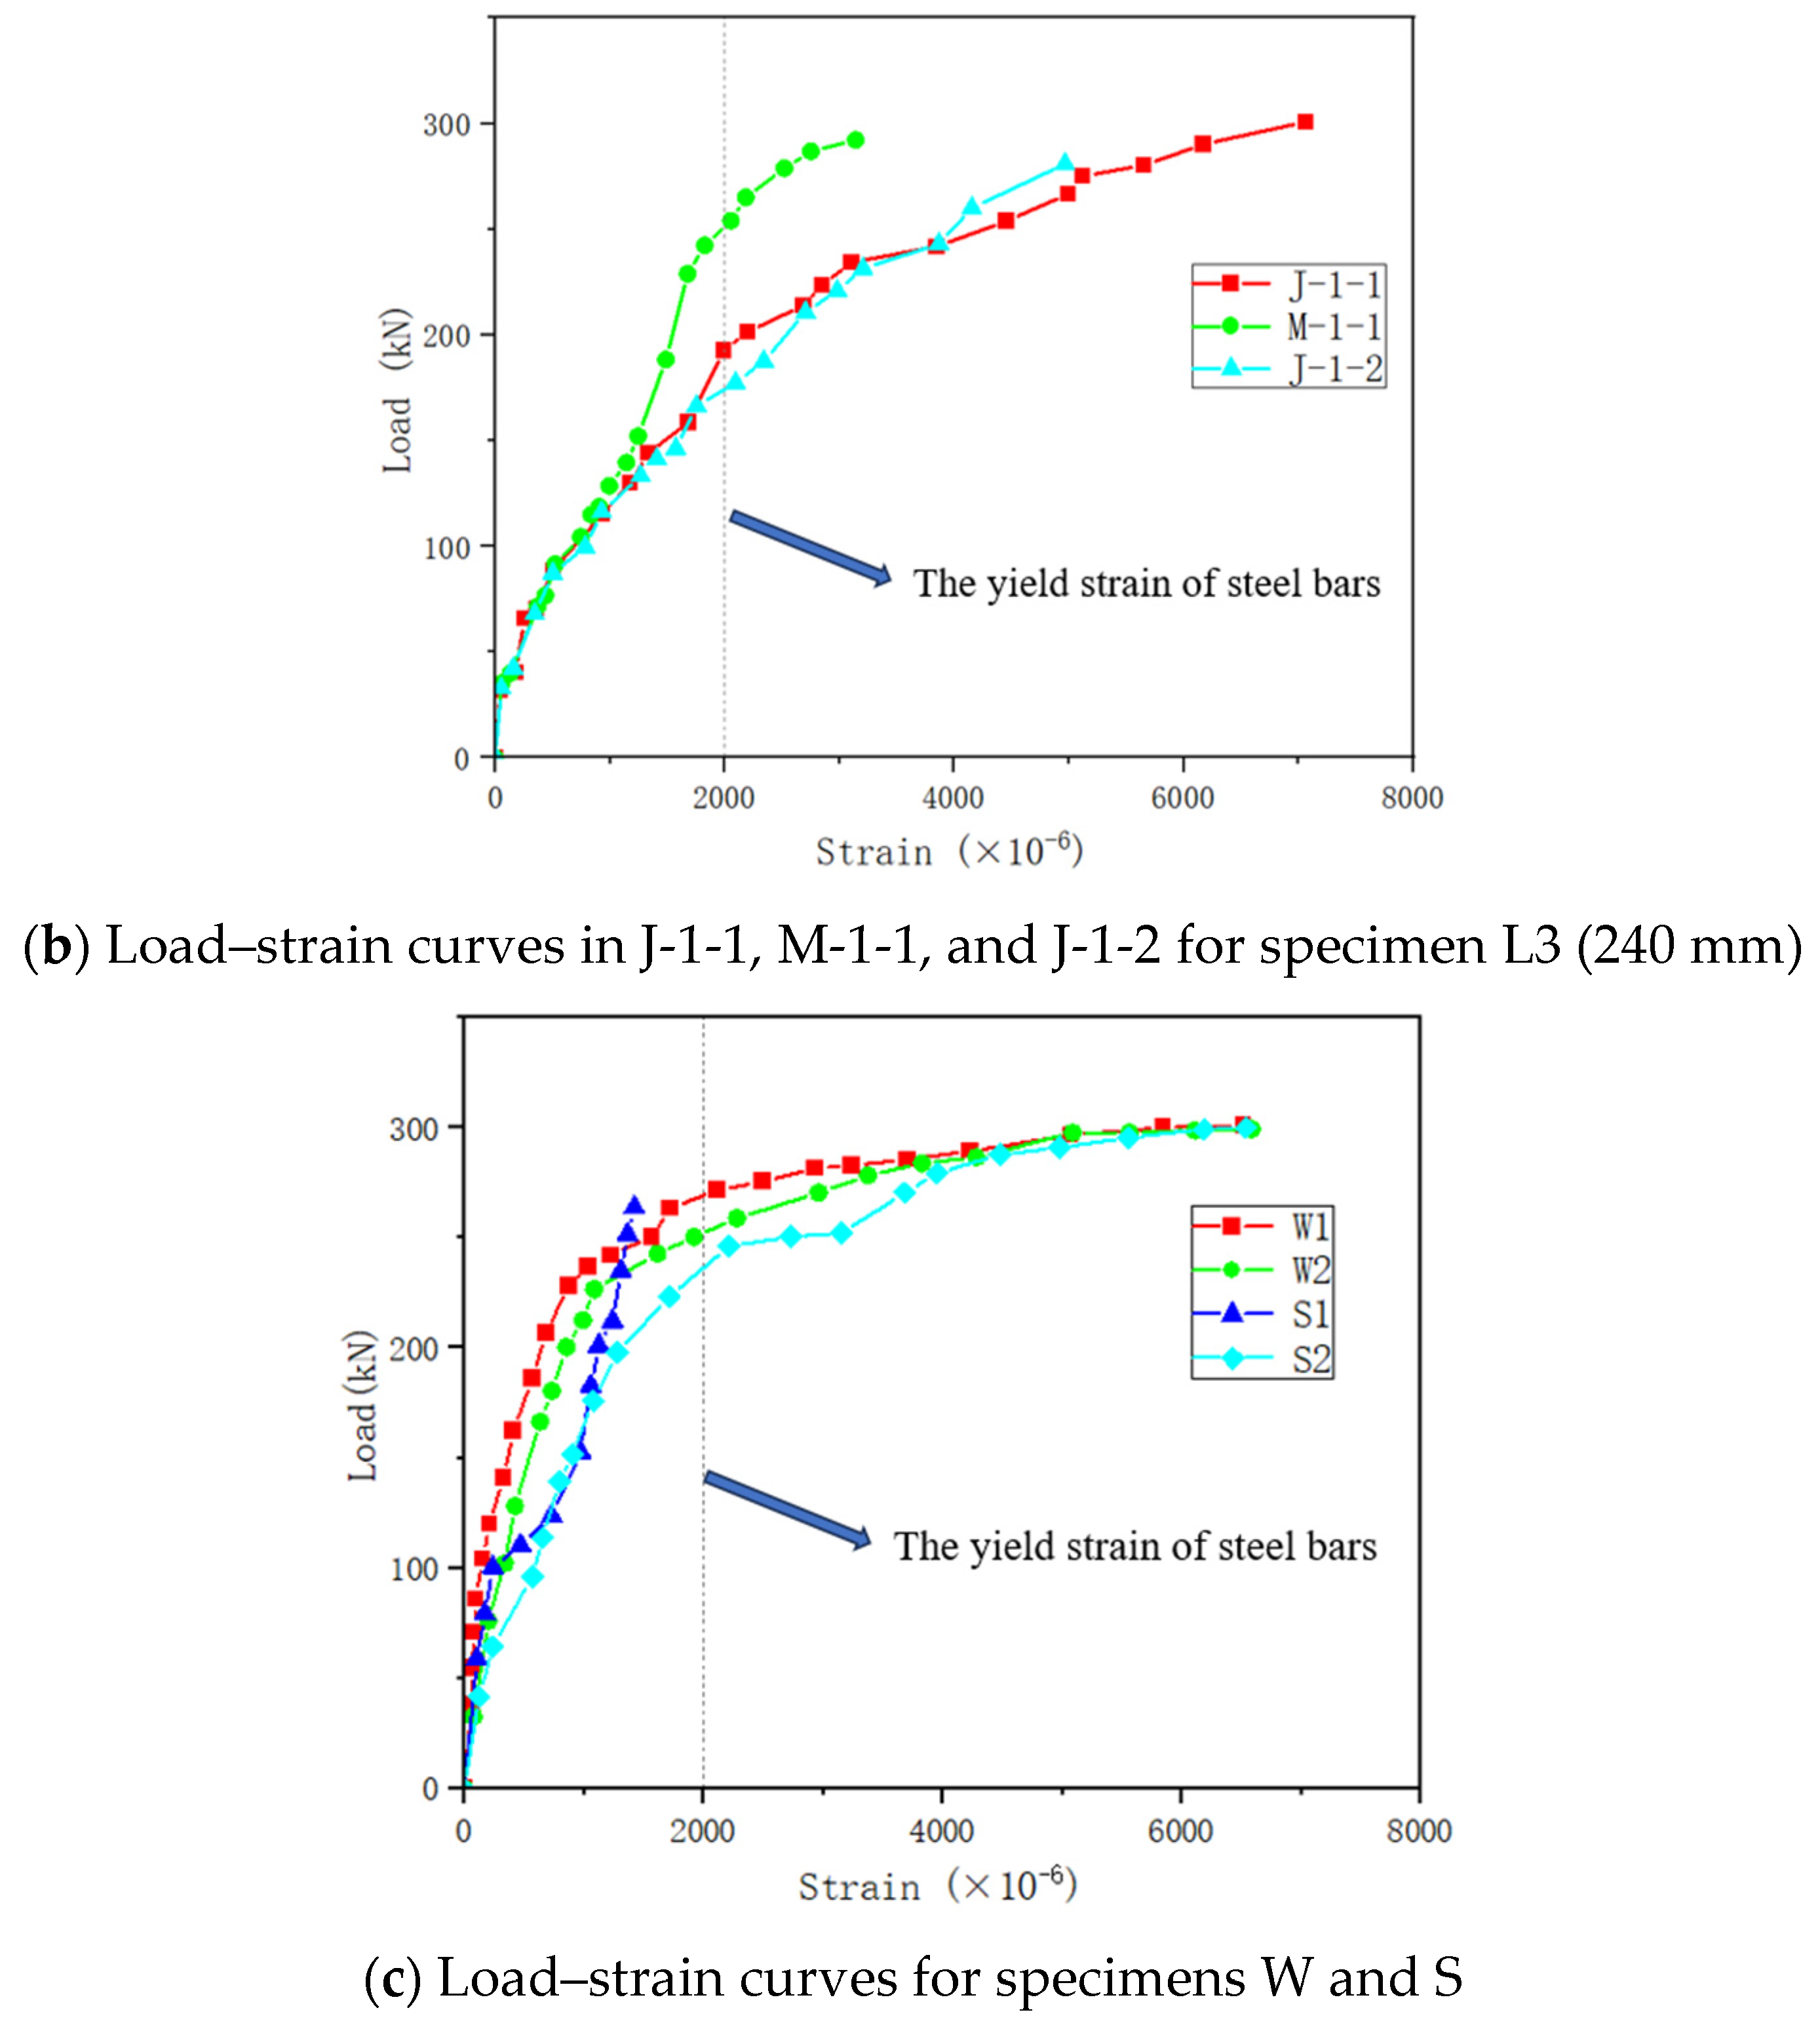
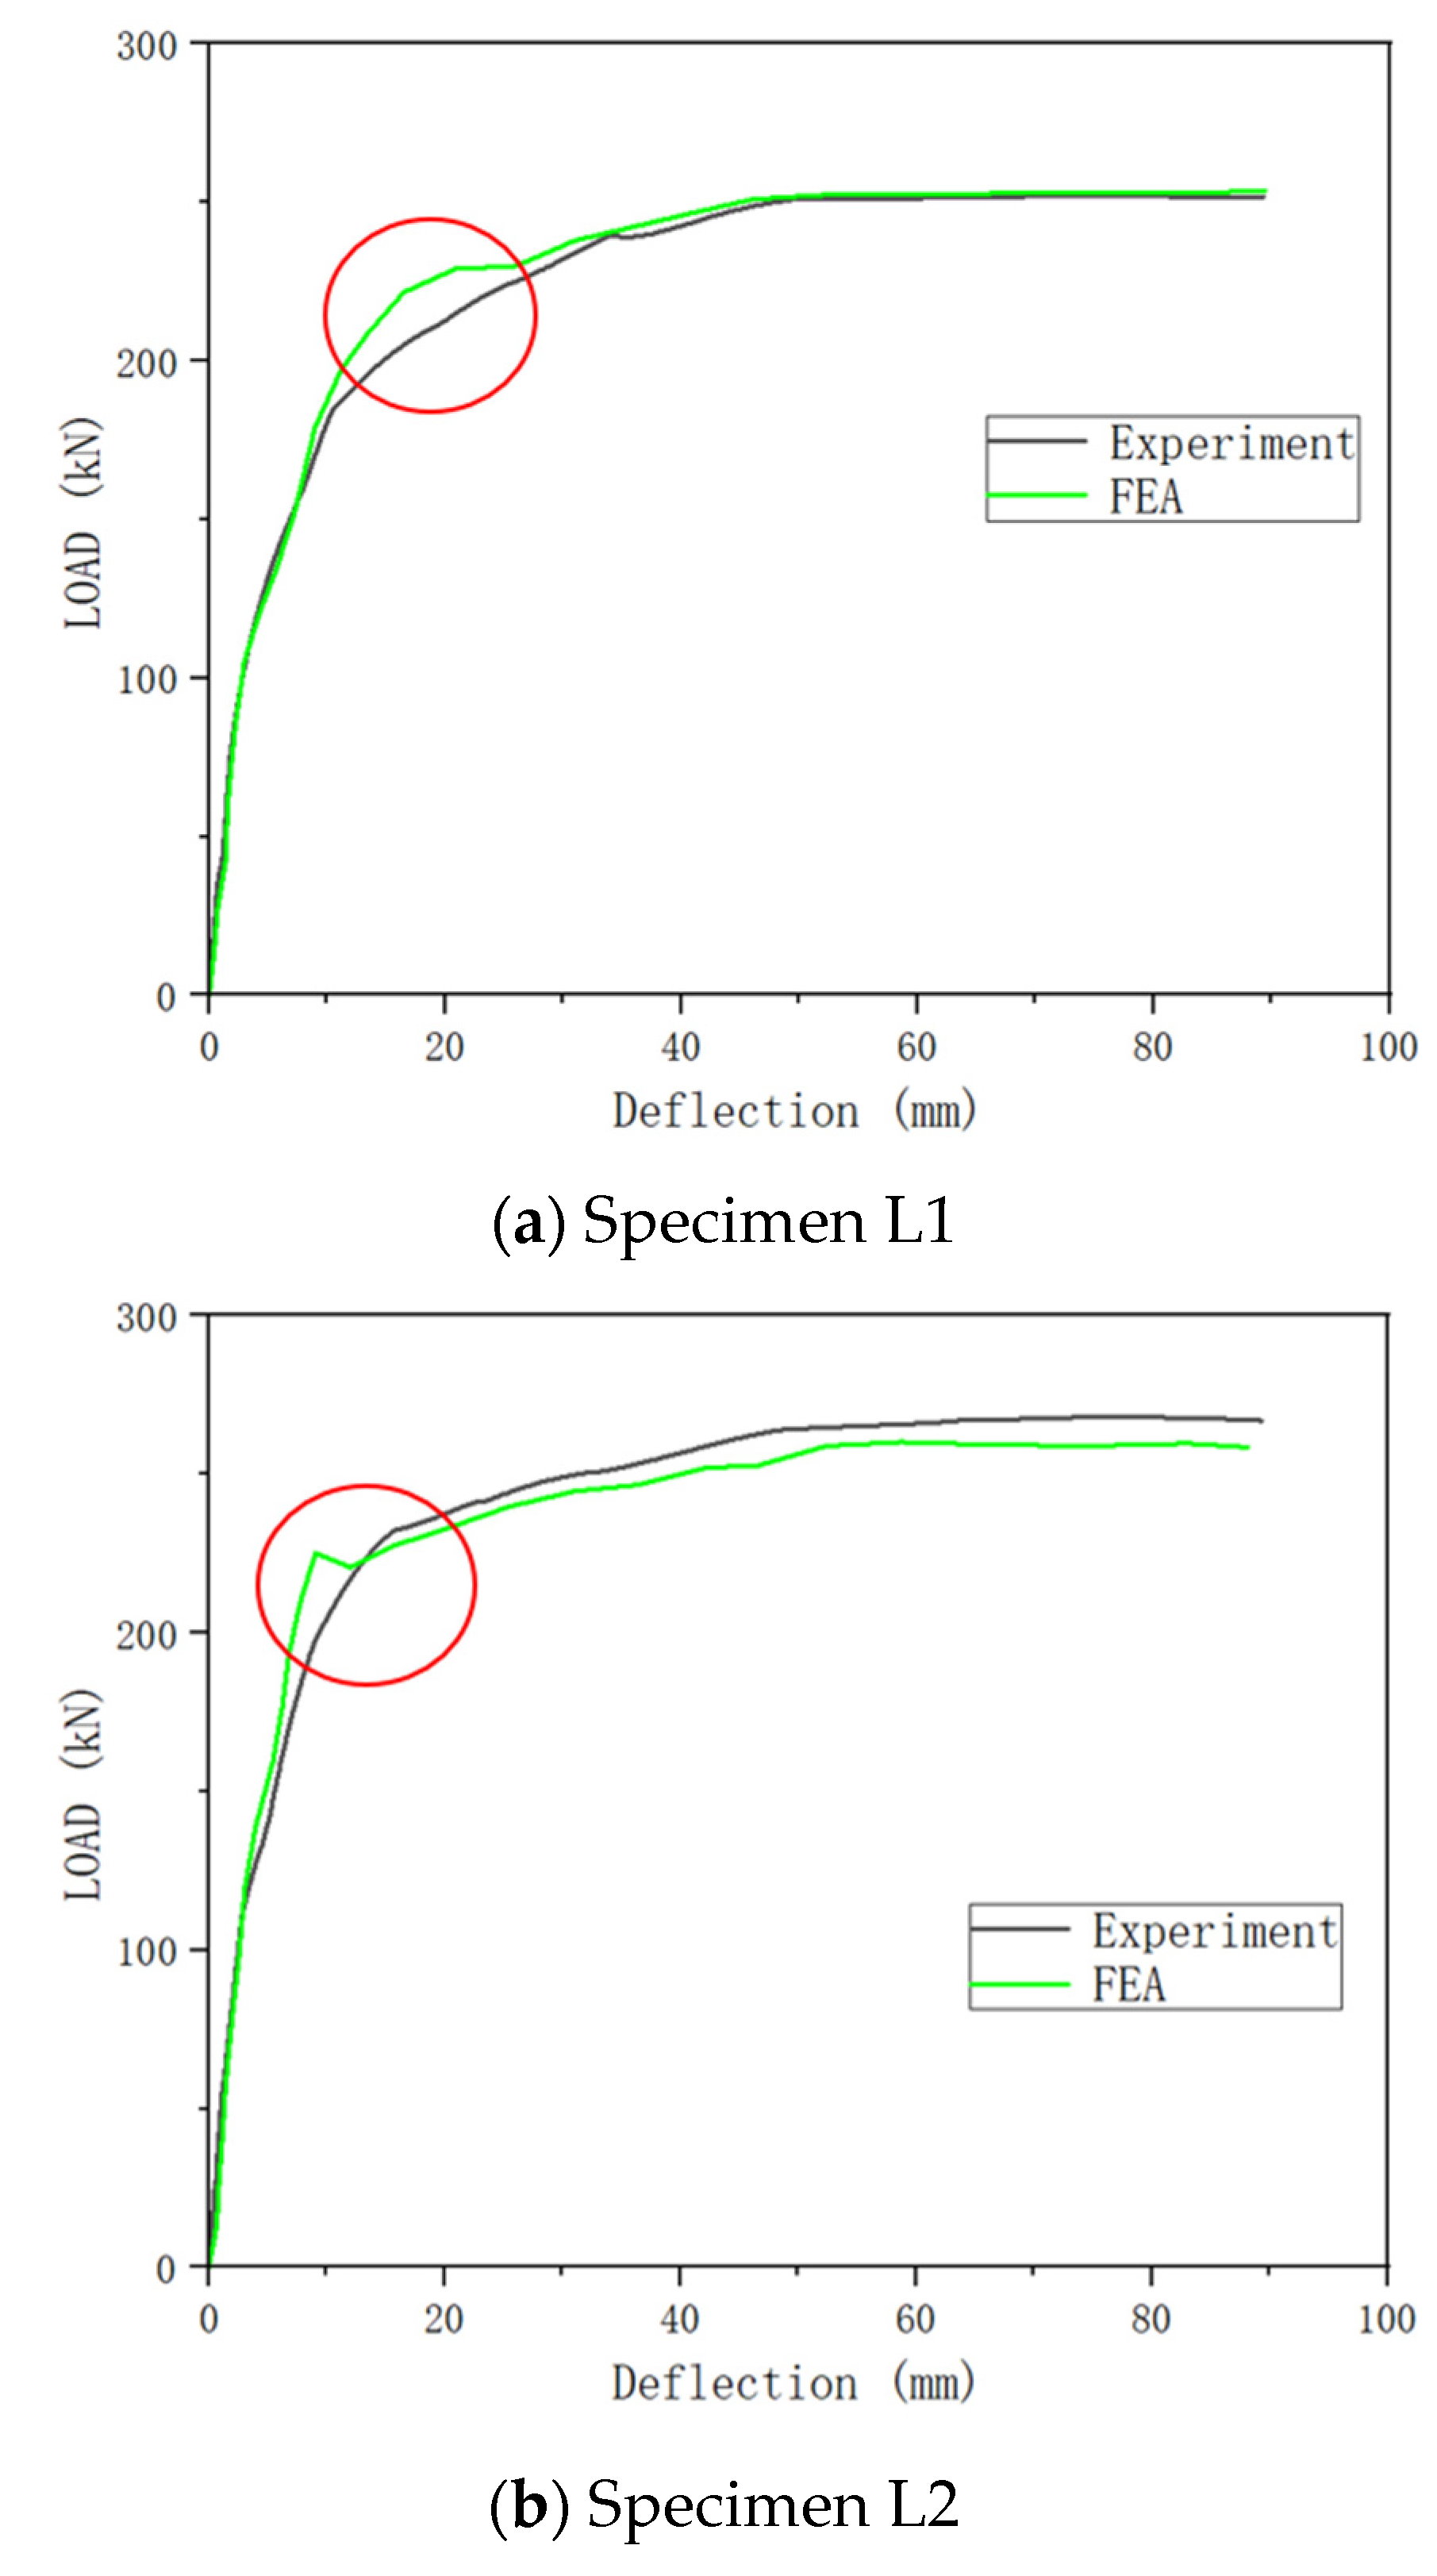
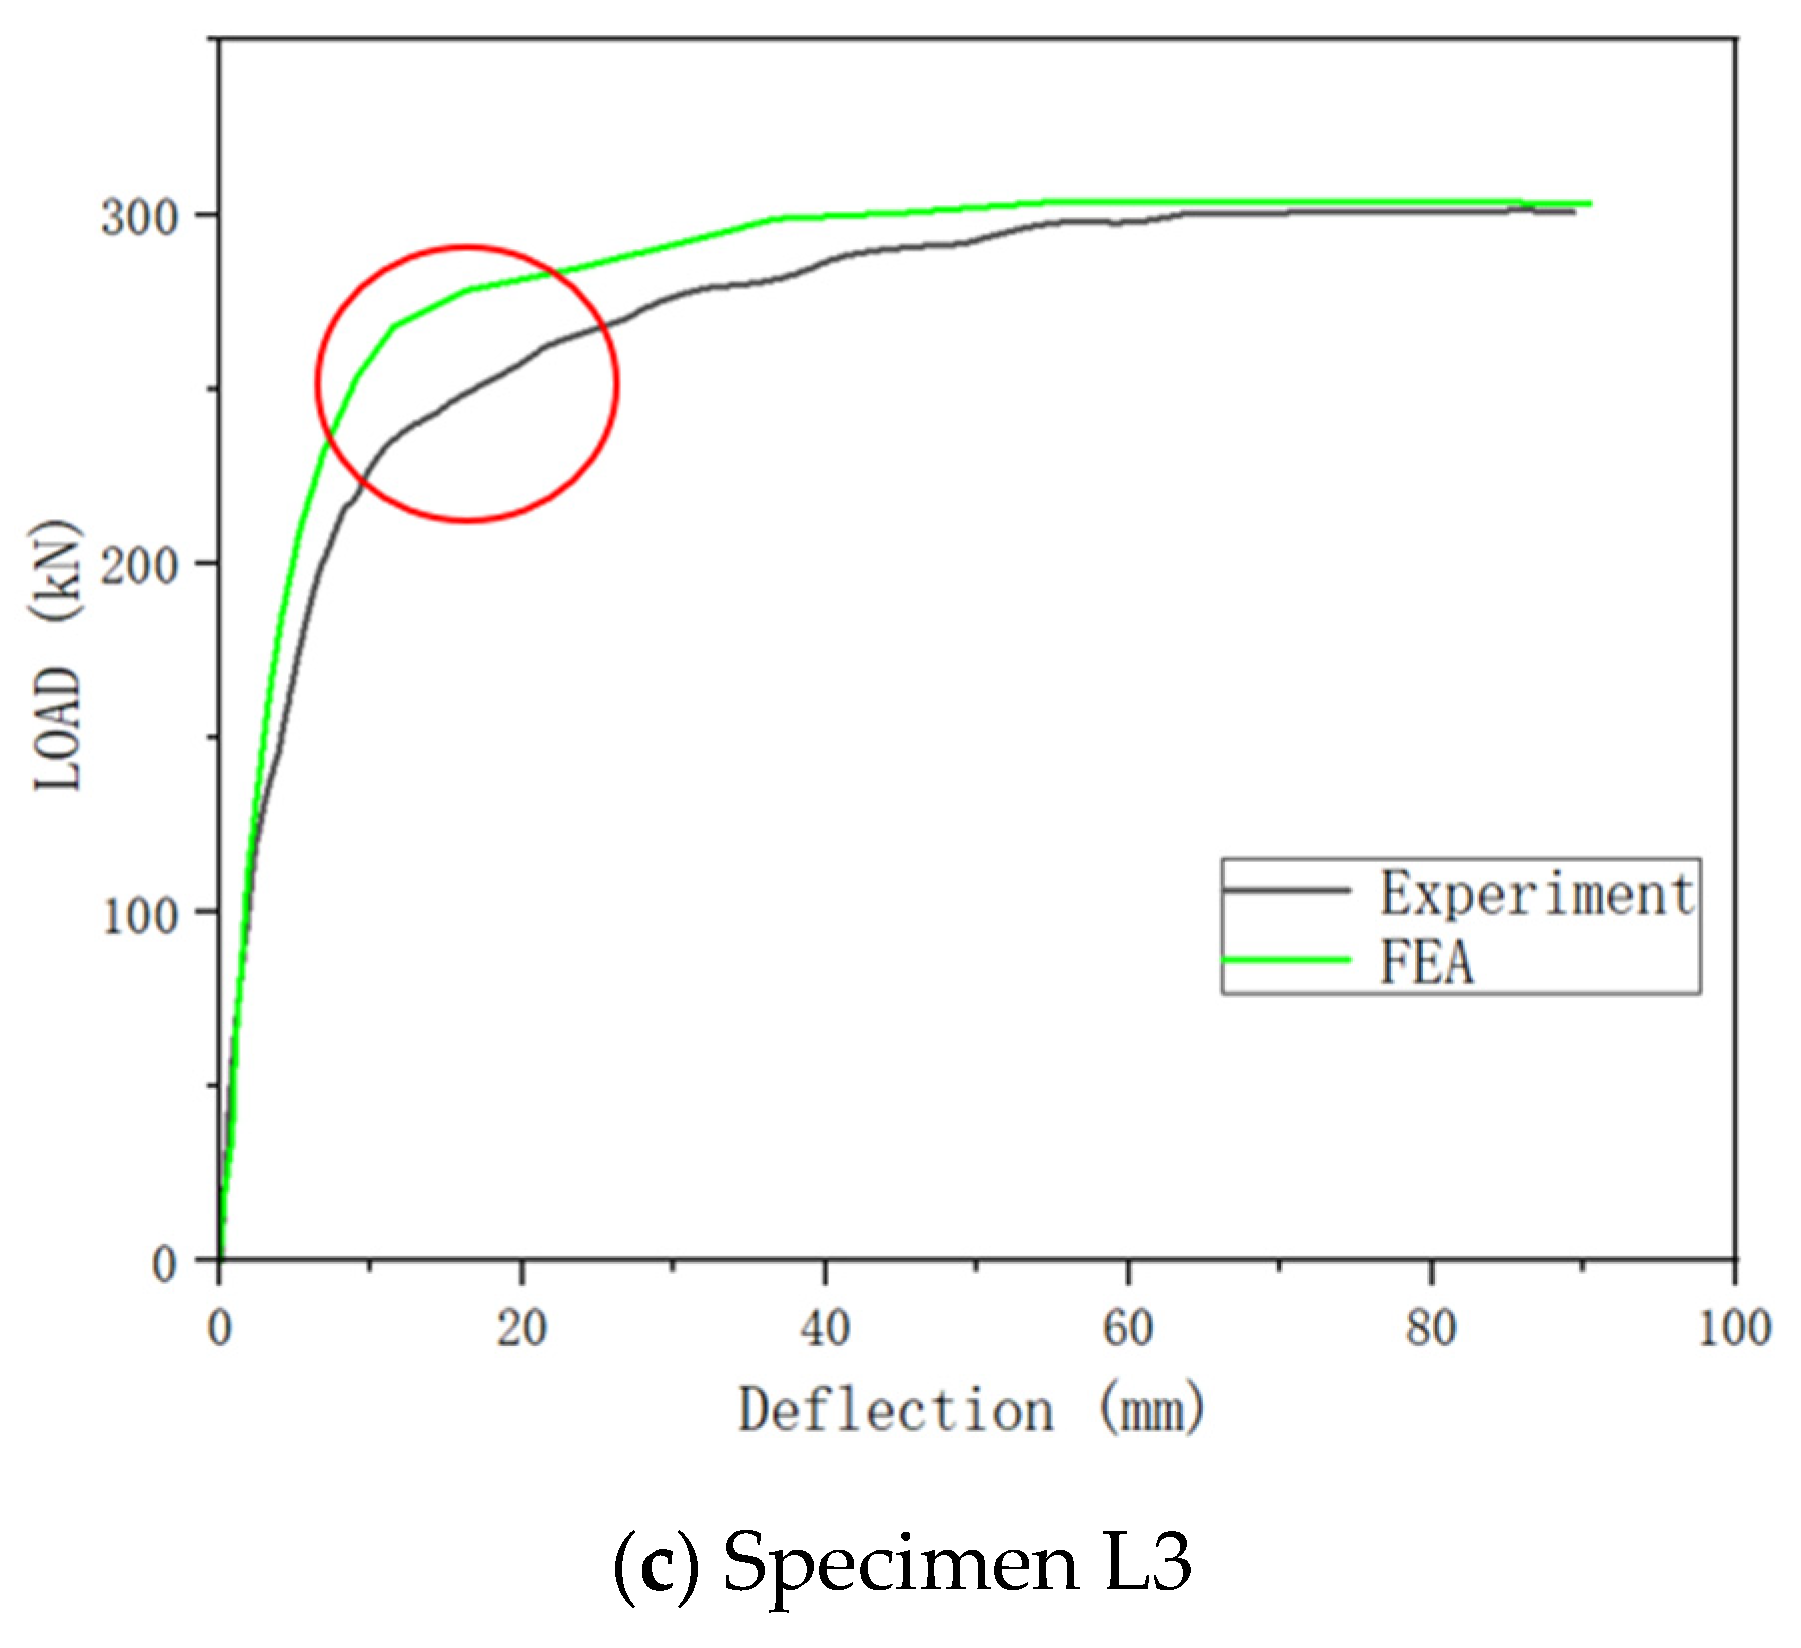
As shown in Figure 7a, the bearing capacity of the specimen increases with the increase in lap length. The ultimate bearing capacity of L3 (λ = 15) is 13.4% and 17.7% higher than that of L2 (λ = 10) and L1 (λ =5). The length of the lap has an important effect on the bearing capacity of the component. In addition, L1 does not meet the lap length requirements, nor does it meet the design load capacity requirements.
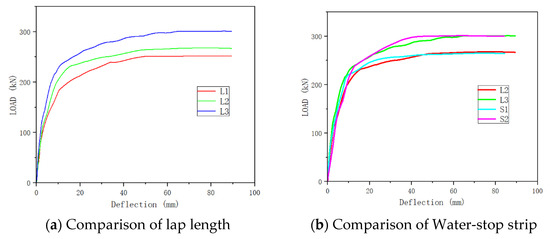
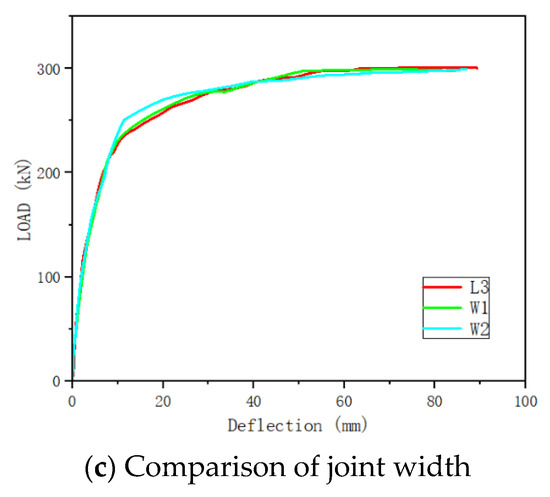
Figure 7.
Load–deflection curve.
As shown in Figure 7b, the water stop strip, as a dividing layer, forms a relatively loose contact area between the old and new concrete, which reduces the bonding performance between the interface of the new and old concrete. The bending capacity of the whole specimen is weakened to a certain extent, and the ductility decreases slightly.
As shown in Figure 7c, the wet joint width has little effect on the bearing capacity. Under the condition that the length of the lap joint is sufficient, the bending performance of the specimen is not affected by a certain width change in the U-bar wet joint.
The whole loading process of the specimen can be roughly divided into three stages: The first stage is the elastic stage, in which the specimen does not produce cracks. Due to the small initial load, concrete keeps in the elastic stage. When the concrete in the tensile zone reaches its ultimate tensile strain, it cracks soon after. The second stage is the elastoplastic stage. At this stage, as the concrete cracks, the section stiffness decreases, and the tension in the member is gradually borne by the steel bar. During the experiment, the specimen began to crack, and the load–deflection curve showed obvious nonlinear growth with the rise in the neutral axis. The third stage is the failure stage; when the steel bar yields, the concrete in the tension zone begins to fail, and the concrete in the compression zone is about to reach ultimate compressive stress. At this time, the stiffness of the specimen decreases rapidly. The number of cracks continues to increase, and the width of the cracks continues to widen. With continued loading, the bearing capacity increases slowly, but the displacement increases rapidly until the specimen completely fails.
3.2. Cracking and Failure Conditions
3.2.1. Specimen λ = 5
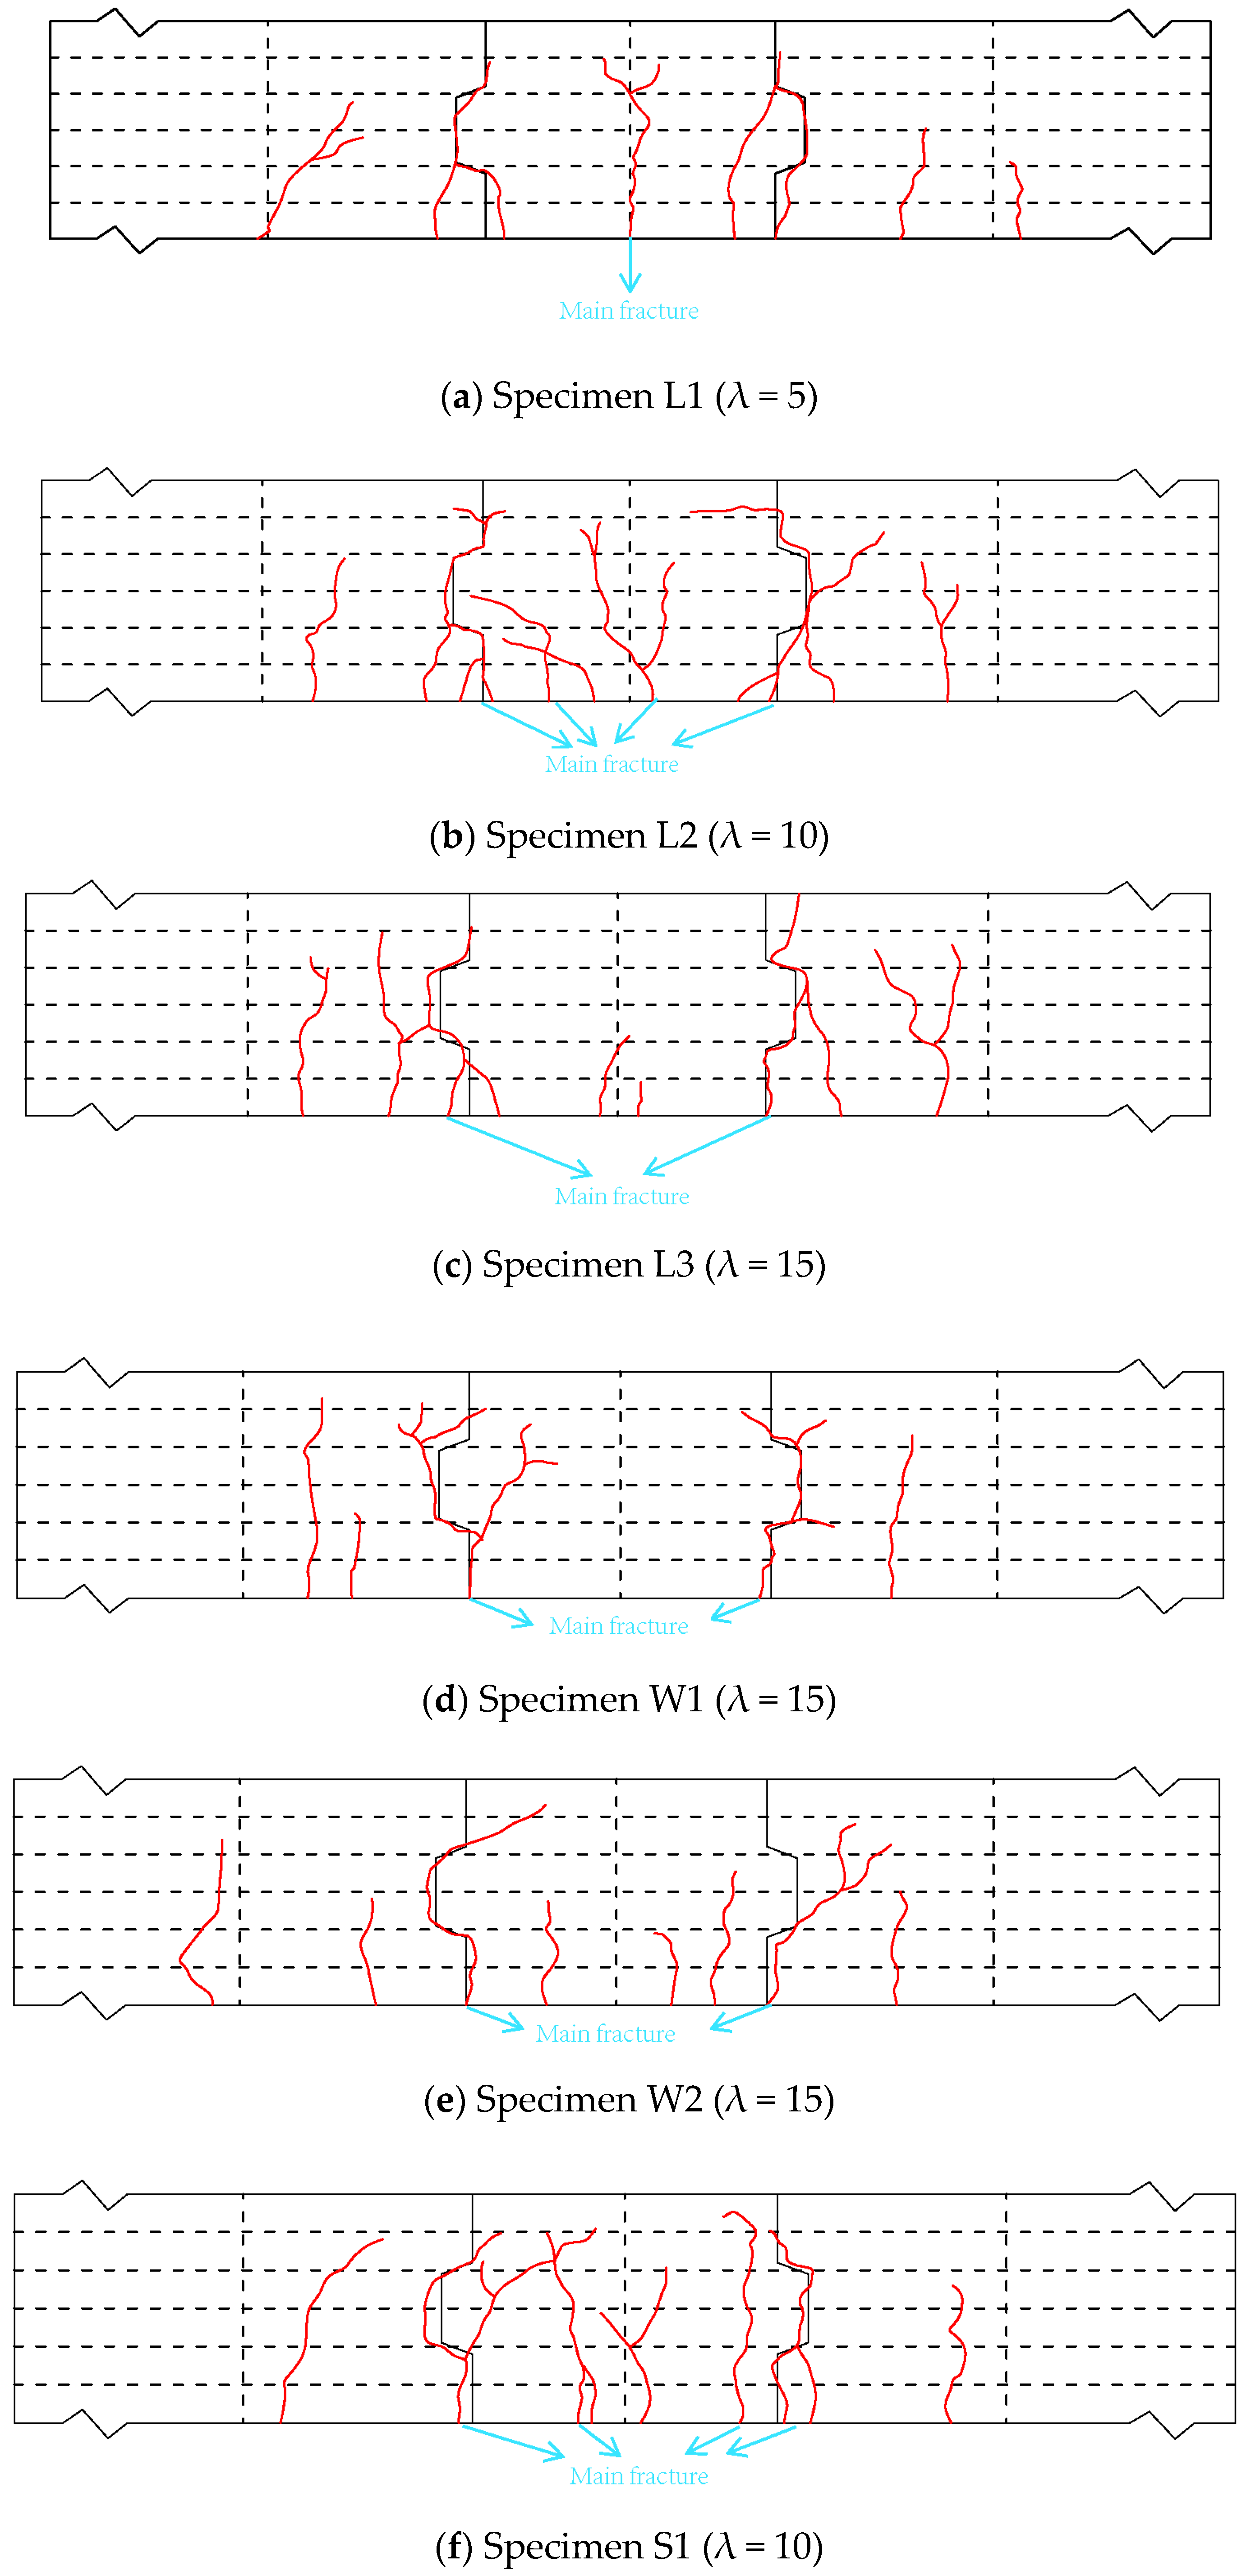
As shown in Figure 8a and Figure 9a, large vertical cracks appeared in the wet joint core concrete area. When loaded to 50 kN, cracks began to appear, with an initial crack height of 4 cm. As the loading continued, the crack height increased continuously, and the crack propagation speed was faster, between 60 kN and 120 kN. When the load reached around 100 kN, cracks began to appear at the junction of wet joints and almost no longer propagated in the later stage. The mid-span crack was expanding, and when loaded to 180 kN, the crack expansion height was 27 cm. As the loading continued, an obvious crushing phenomenon appeared in the core concrete area, as shown in Figure 9b. Observing the wet joint failure area, it was found that the steel bar and concrete had obvious misalignment. Although the steel bars could continue to bear the load, the core area of concrete was crushed. That is why the wet joints of the U-bars lost their bending capacity.
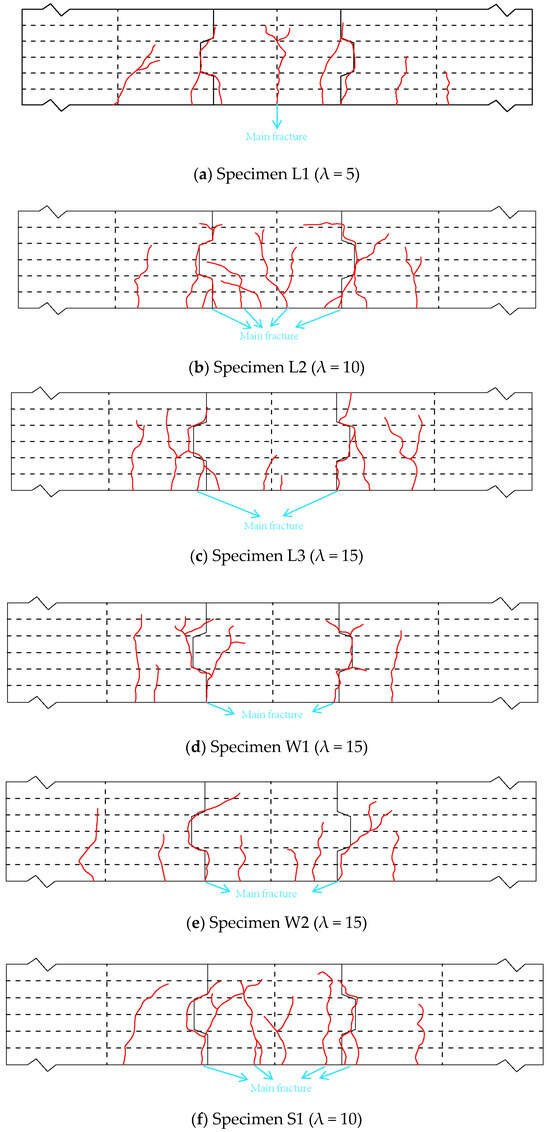
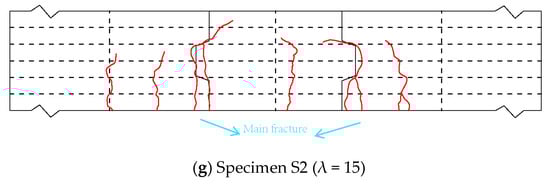
Figure 8.
Crack patterns.
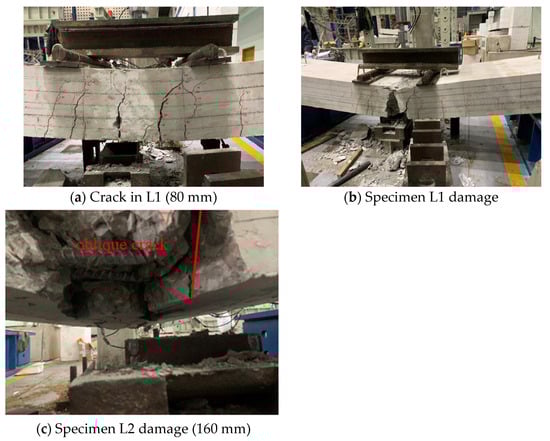
Figure 9.
Crack and damage in L1 and L2.
3.2.2. Specimen λ = 10
As shown in Figure 8b and Figure 9c, when loaded to around 60 kN, cracks began to appear at the interface between the new and old concrete. At this point, the crack height was 7 cm. When loaded to around 100 kN, the crack height at the interface between new and old concrete was 12 cm, and the crack height in the wet joint section was 5 cm. It could be clearly observed that the crack propagation speed of specimen L2 was significantly slower than that of specimen L1. It could be observed that during the process of crack propagation, the cracks at the interface between new and old concrete propagated along the groove. Obvious oblique cracks could be found at the bottom of the specimen L2, and it could be judged that the concrete appeared to show oblique extrusion during the loading of the specimen. The concrete in the U-bar core area was crushed and then the specimen failed. At this time, the steel bars did not break, and the specimens lost their bearing capacity due to the concrete crushing in the U-bar connection area.
As shown in Figure 9c, S1 shows different cracking types. When loaded to around 50 kN, cracks began to appear at the interface between the new and old concrete, with a crack height of 6 cm. When loaded to around 180 kN, the crack height at the interface between the new and old concrete was 24 cm, the crack height at the end of the U-bars was about 10 cm, and the crack height at the mid-span was about 5 cm. Furthermore, it could be clearly observed that the cracks at the end of the U-bars were significantly wider than the cracks at the interface between the new and old concrete in specimen S1. The cracks at the end of the steel bar were significantly wider than the cracks at the interface between the new and old concrete. There were a lot of vertical cracks and sub-vertical cracks in the wet joints. During the bending process of the specimen, the compression of the core concrete by the U-bars caused significant cracks in the concrete at the end of the U-bars owing to stress concentration. Due to insufficient bonding strength and differences in material properties on both sides of new and old concrete, there may still have been wide cracks propagating along the interface.
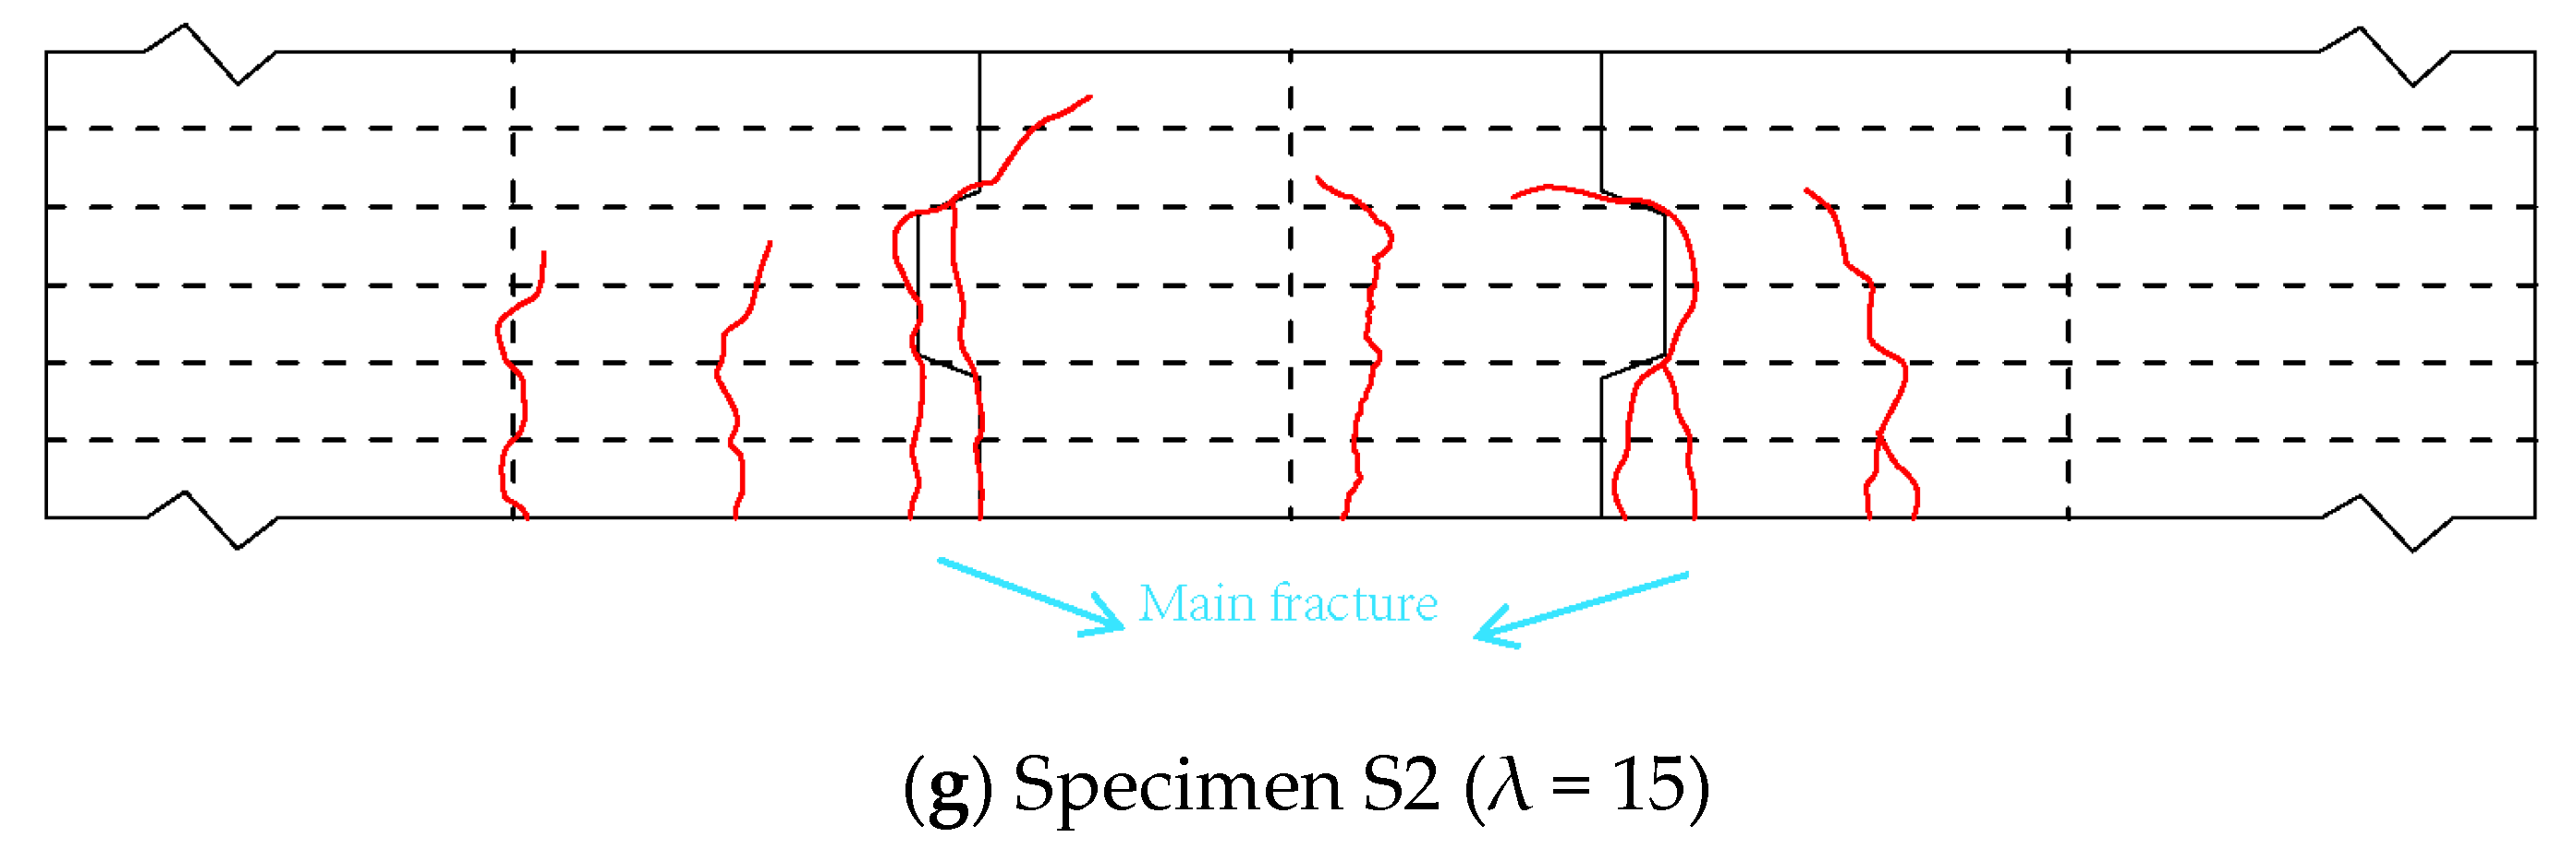
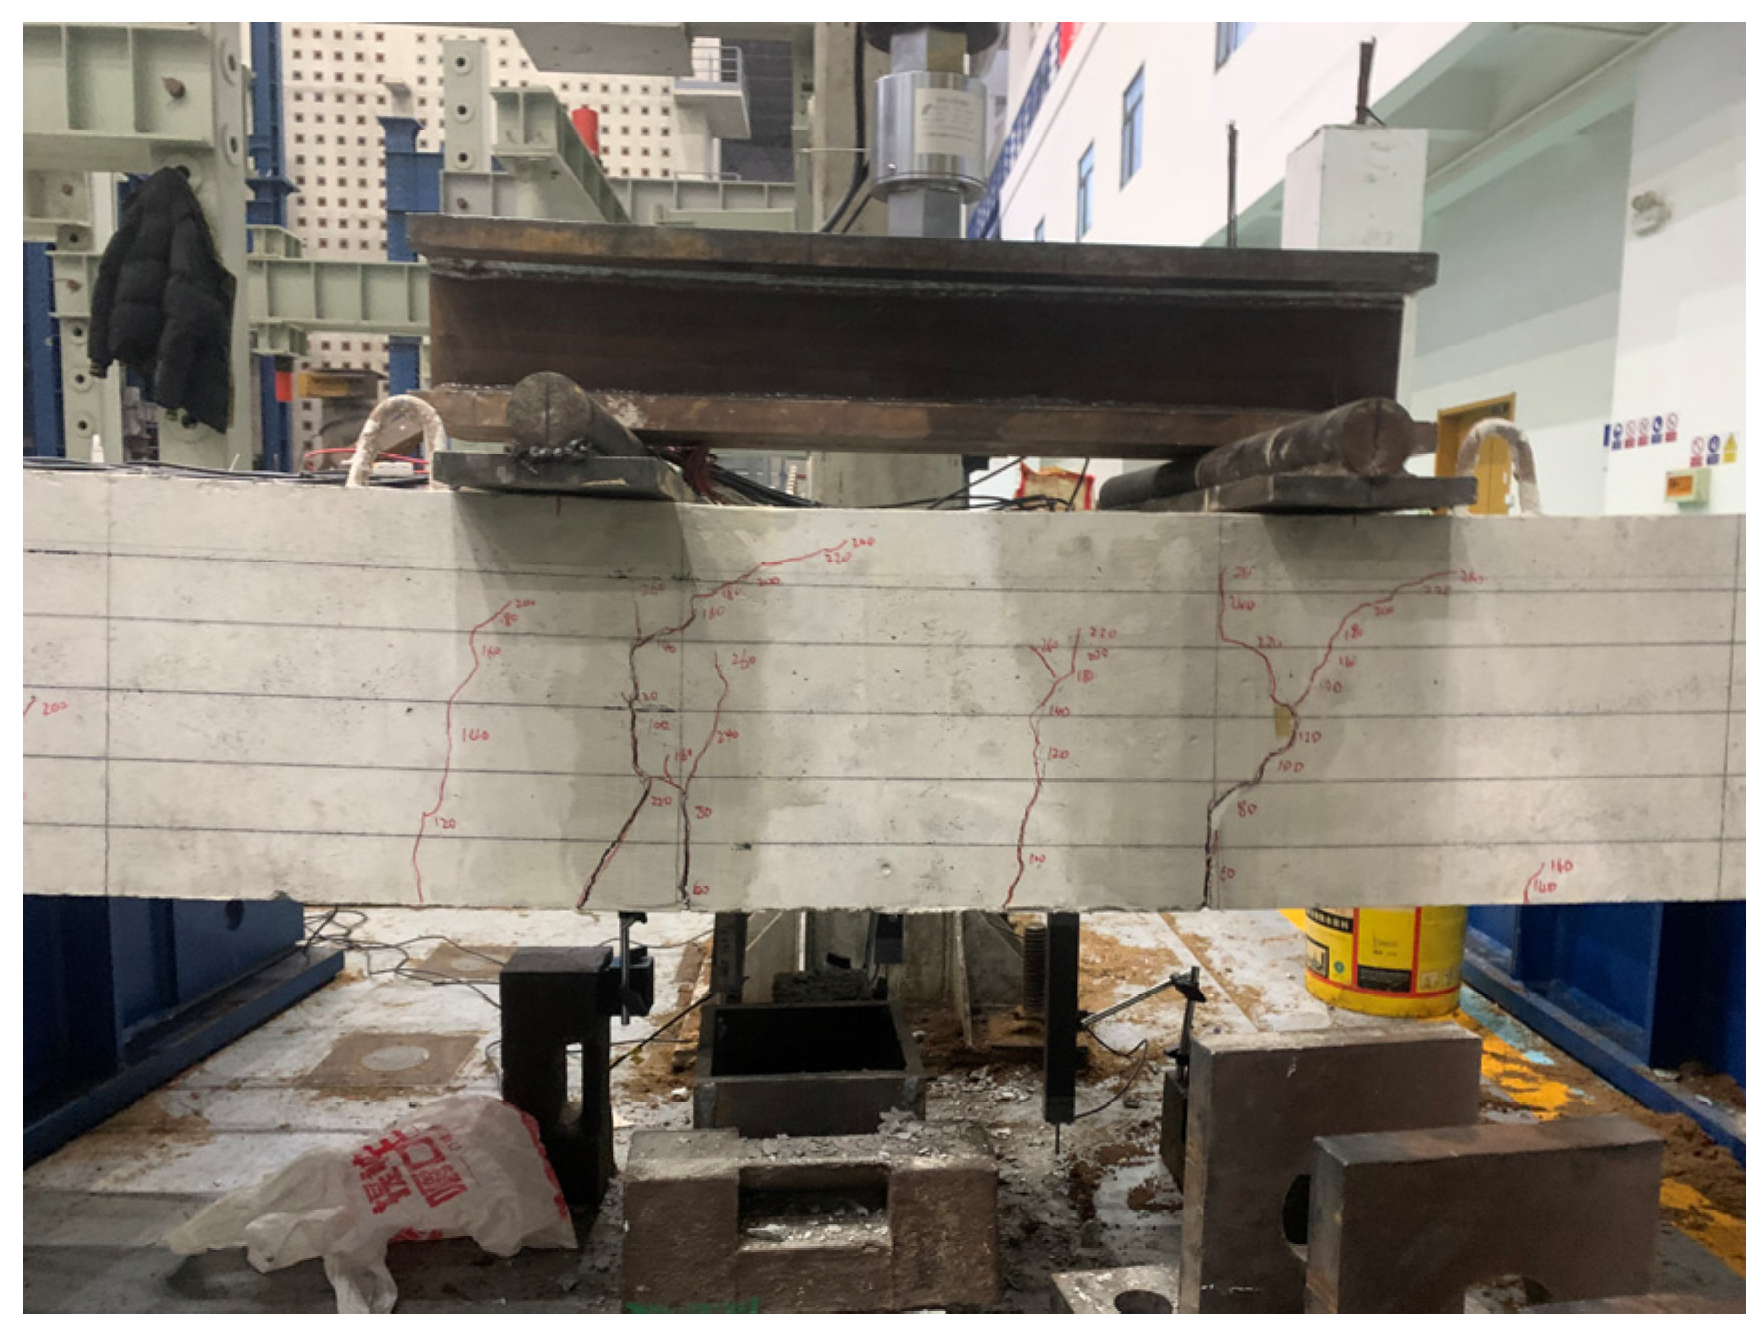
3.2.3. Specimen λ = 15
As shown in Figure 10, Figure 11 and Figure 12, L3, S2, W1, and W2 exhibited similar cracking patterns. During loading, cracks first appeared at the interface between the new and old concrete, followed by cracks in the precast section, and finally cracks in the wet joint. When loaded to 40 kN~80 kN, cracks began to appear at the interface between the new and old concrete, with a height of 8cm. Cracks only began to appear in the wet joint section when loaded to 200 kN. The main cracks mainly developed along the interface of the old and new concrete, in the form of vertical cracks. A small number of cracks were observed at the wet joints, as shown in Figure 9, and the core concrete remained intact. As shown in Figure 10, the fracture of U-bar ends resulted in the overall structural damage. During the bending deformation process of the structure, the ends of the U-bars were subjected to significant tensile forces. As the load increased, the tensile stress exceeded the design tensile strength of the steel. Therefore, the U-bar ends fractured and failed, resulting in a decrease in overall bending capacity.
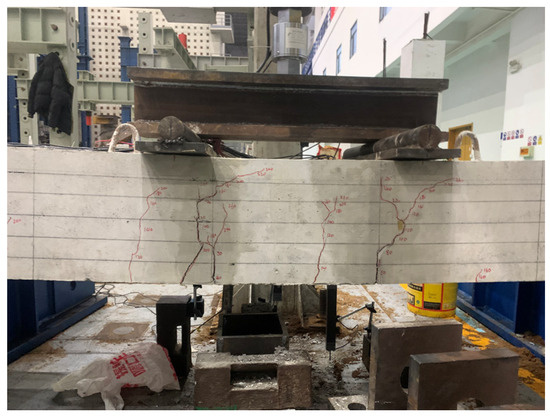
Figure 10.
Crack in S2 (240 mm).
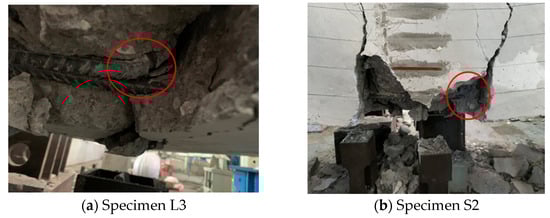
Figure 11.
Steel fracture (240 mm).
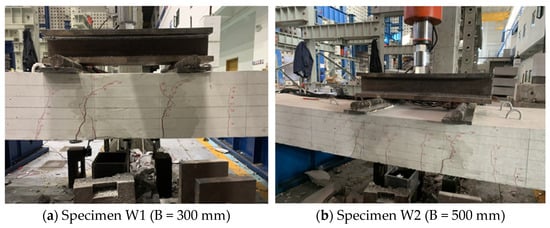
Figure 12.
Crack in specimen W.
3.3. Strain
Figure 13 shows the change in strain of the longitudinal steel bar at the lower layer of the specimen. When the load reached about 50 kN, the strain changed significantly, and at that time, it remained in the stage of crack expansion. As shown in Figure 13a, with the increase in load, the longitudinal steel bar of specimen L1 did not reach yield, the longitudinal steel bar of specimen L2 was about to yield, and the longitudinal steel bar of specimen L3 reached yield, which was consistent with the test. Specimens L1 and L2 were due to the failure of the joint core area, resulting in large cracks in the concrete; the load could not be transmitted to the steel bar; and the specimens could not continue to bear the load. The failure of specimen L3 was caused by the yielding of the steel bar, and no obvious failure occurred in the core area of the joint. In the late loading period, the failure of the specimen was caused by the cracking of the interface between the new and old concrete and the yielding of the steel bar.
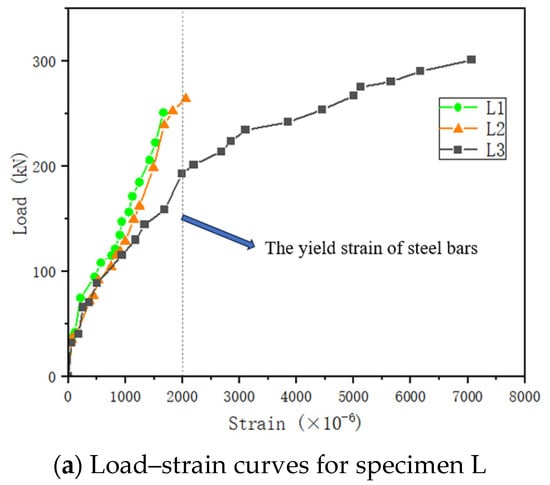
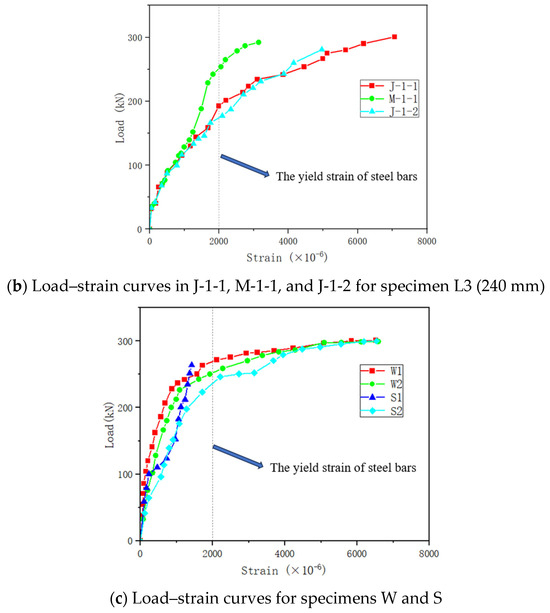
Figure 13.
The steel strain in the U-bars inside the joint.
Figure 13b shows the reinforcement strain of the longitudinal steel bar of the lower layer of specimen L3 located in the middle of the span and at the joint of the new and old concrete; that is, the strain at the joint of the new and old concrete was greater than that at the middle of the span compared with the strain in M-1-1, J-1-1, and J-1-2, indicating that the bearing capacity of the specimen depends on the bearing capacity of the steel bar at the joint under this bond length. It is less affected by the reinforcement in the core area.
4. Finite Element Analysis
4.1. Modelling and Meshing
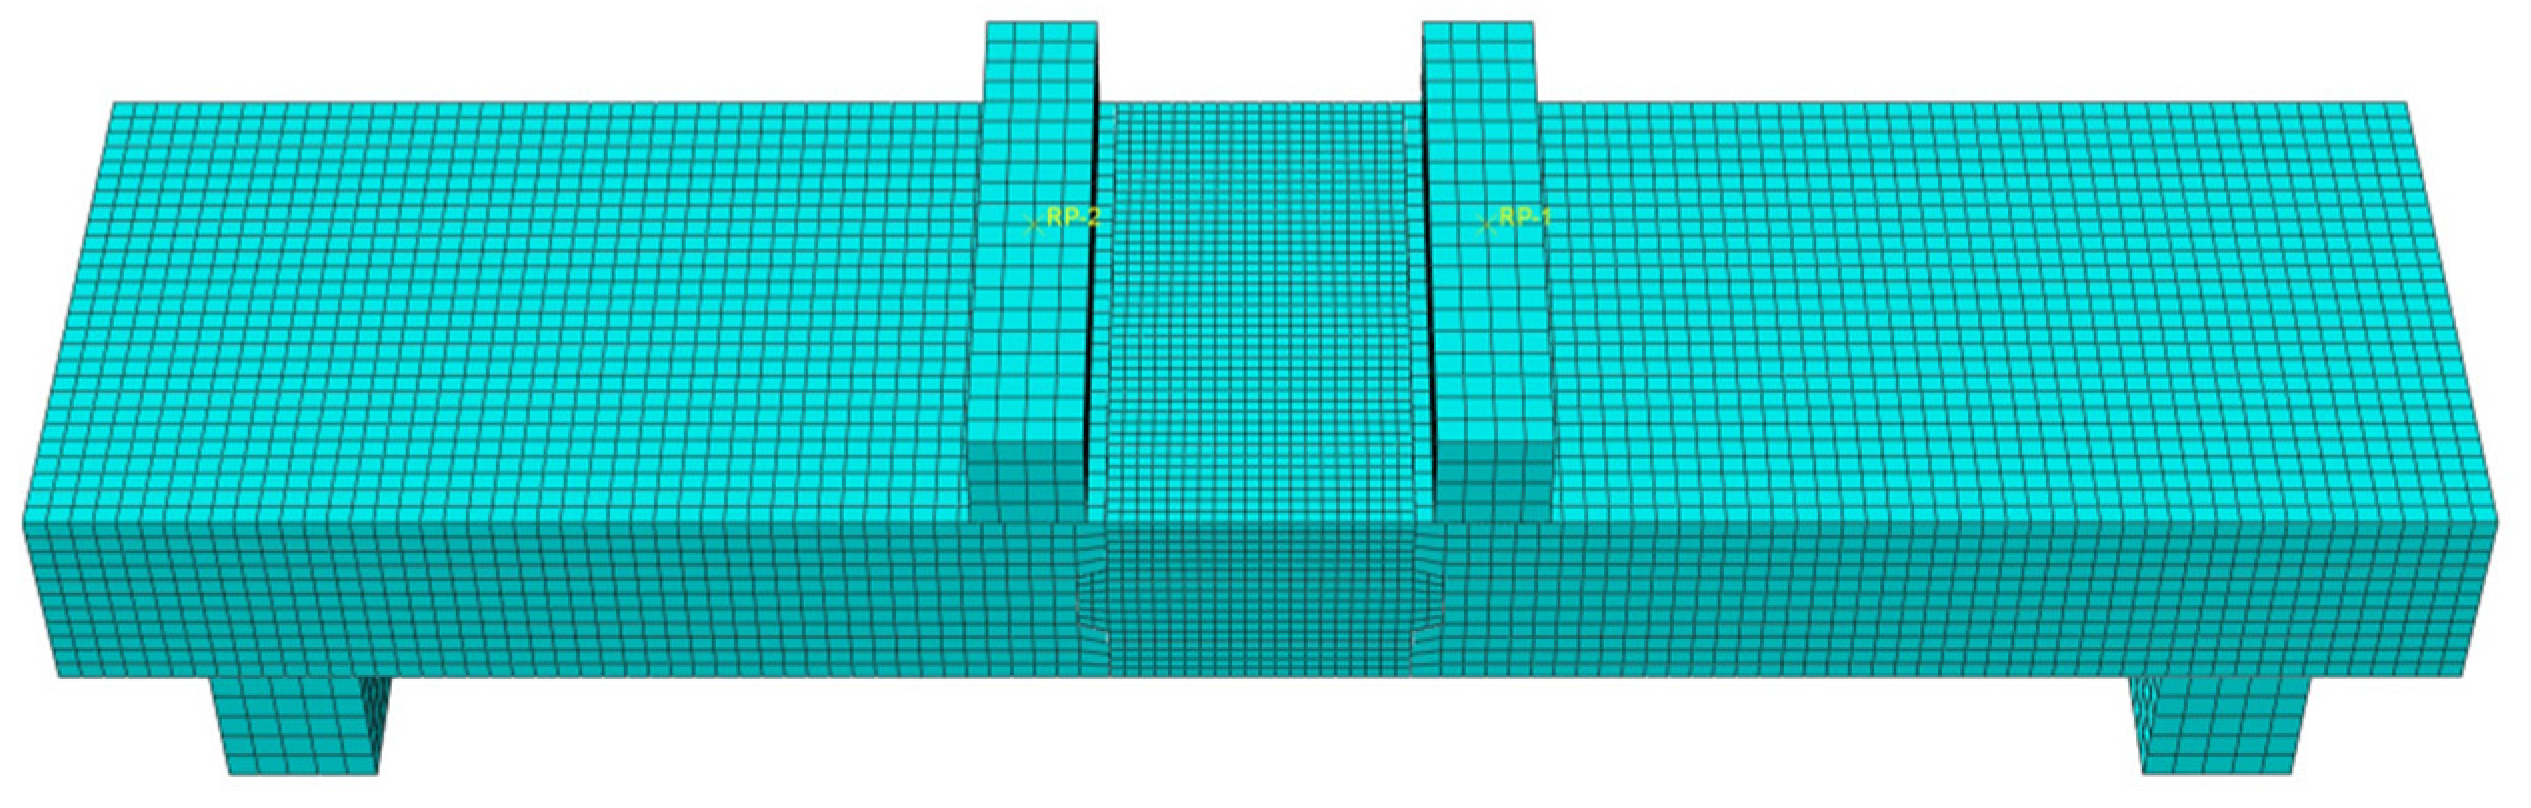
ABAQUS software was employed to the U-bars model, transverse steel bars, cast-in-place concrete, and precast concrete elements. The concrete was represented using the C3D8R element, which utilizes a more precise uniform strain formulation to accurately simulate displacement outcomes. Steel was simulated using a linear beam T3D2 element. The mesh size for precast concrete was set at 30 mm × 30 mm, while that of the wet joints was 20 mm × 20 mm; both the longitudinal and transverse steel bars were also modeled with a mesh size of 30 mm × 30 mm, and the pad dimensions were specified as 50 mm × 50 mm. A visual representation of this model is provided in Figure 14. This grid partitioning scheme aims to balance the accuracy and computational efficiency of the model, while ensuring that the analysis results are accurate and reliable within an acceptable range.
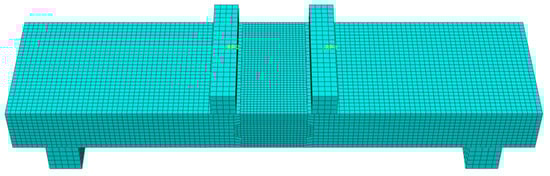
Figure 14.
Finite element model.
4.2. Boundary Conditions and Load
A steel pad with high stiffness was employed to simulate the support and loading pad. The load was transmitted to the specimen’s panel via the loading pad, where a reference point was established on its upper surface, facilitating motion coupling with the pad. The steel pads were positioned at two fulcrum locations of the specimen, constraining three degrees of freedom—X, Y, and Z—along the centerline on one side. Additionally, constraints were applied to the X and Y degrees of freedom along the centerline of the right plate to establish supporting boundary conditions. Embedded constraints were used to embed steel bars into concrete. We simulated the joint surface using friction, with hard contact for friction and a friction coefficient of 0.4. During experimentation, static loads were simulated by applying displacement to the reference point.
4.3. Material Constitutive Model and Parameters
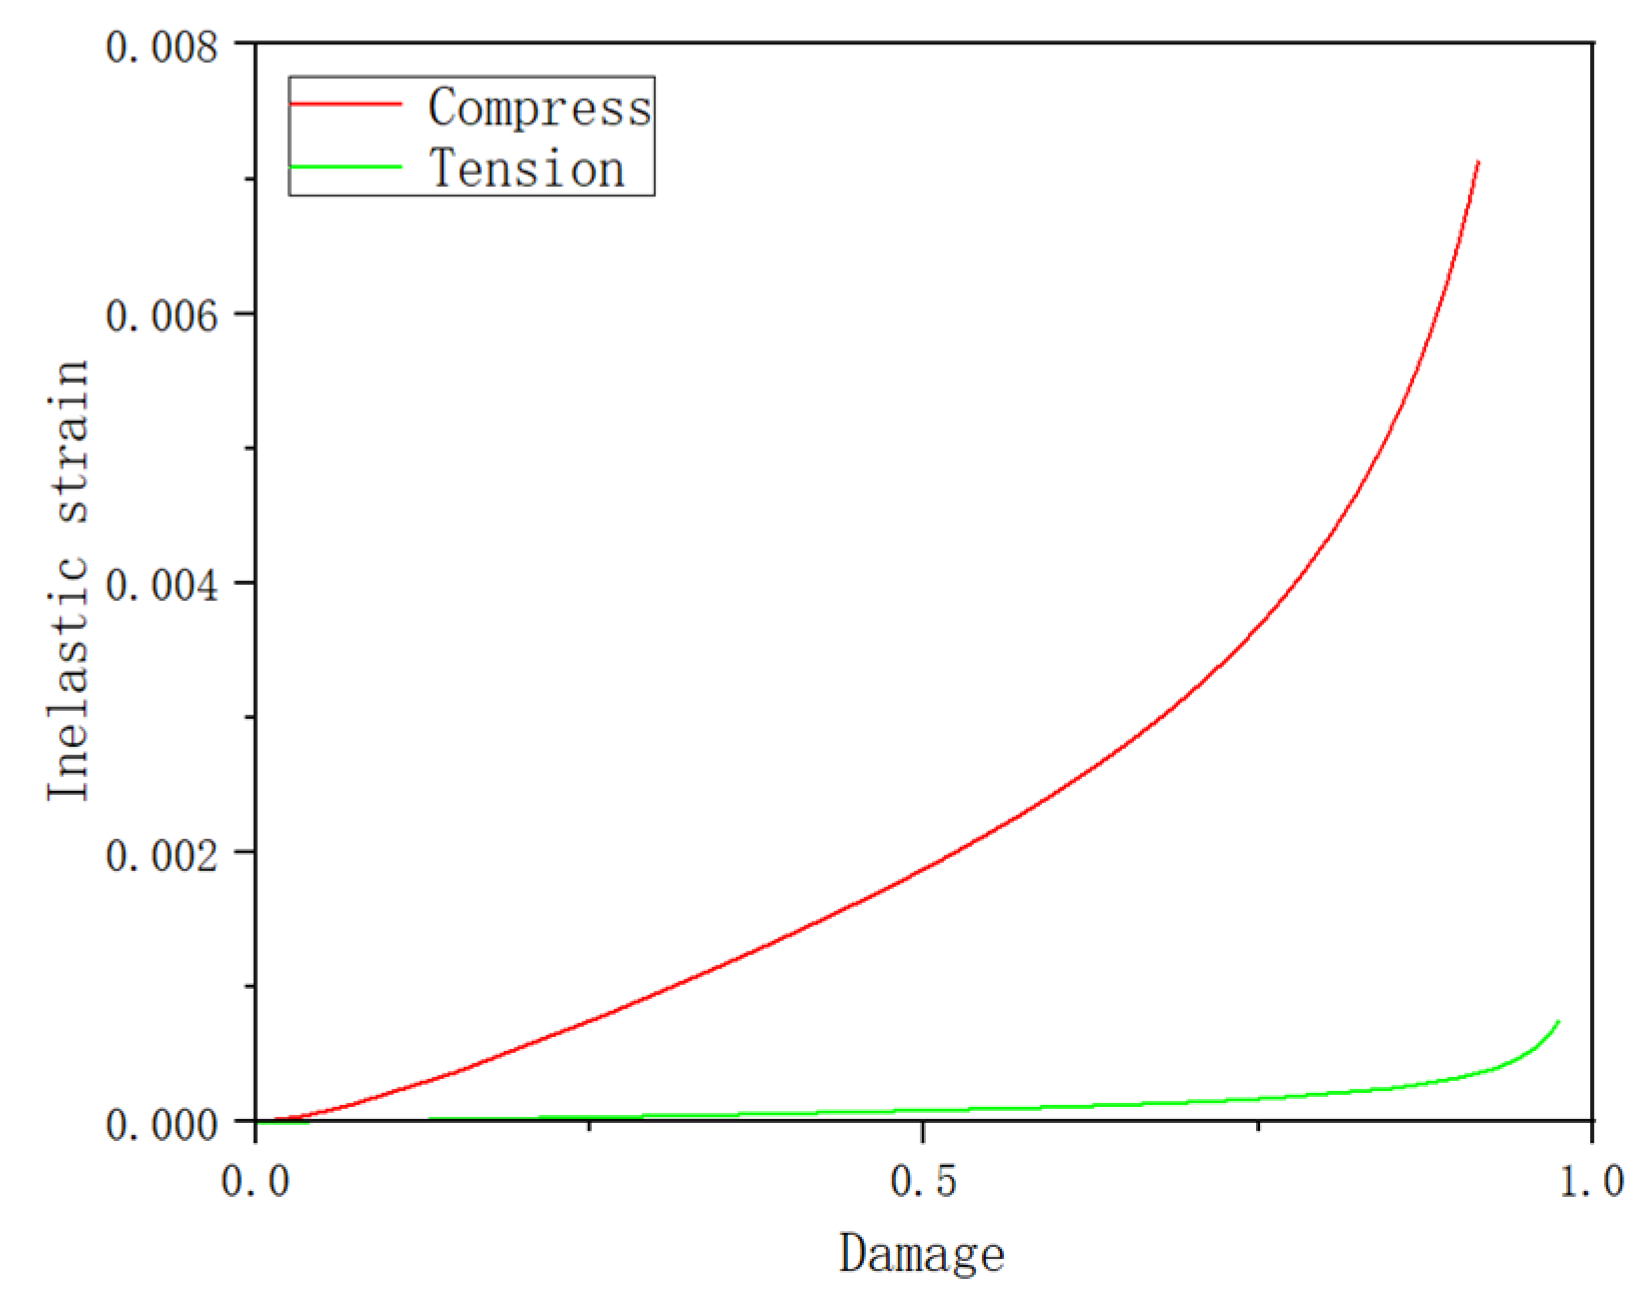
ABAQUS software provides three concrete unit models: a plastic model, concrete damage plastic model, and concrete daub crack model. The material parameters of concrete and steels are obtained from the material test and expressed by the mean value of the material parameters. The concrete damage plastic model was adopted in this paper, as shown in Figure 15. The parameters of the concrete constitutive model were determined according to the formula in Code for Design of Concrete Structures (GB50010-2010), as shown in Figure 16a, and the material parameters are shown in Table 3. The reinforcement constitutive model was a bilinear model based on the model specified by GB50010, as shown in Figure 16b.
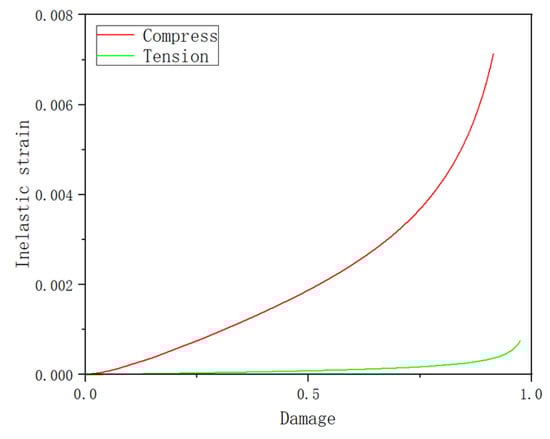
Figure 15.
The concrete damage plastic model.
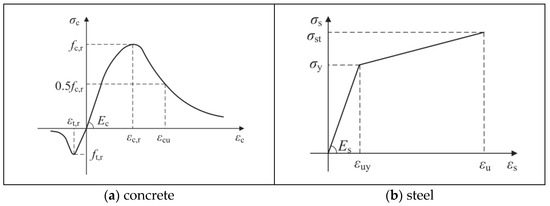
Figure 16.
Stress–strain laws.
Table 3.
Parameters of concrete in ABAQUS.
4.4. Finite Element Analysis Results
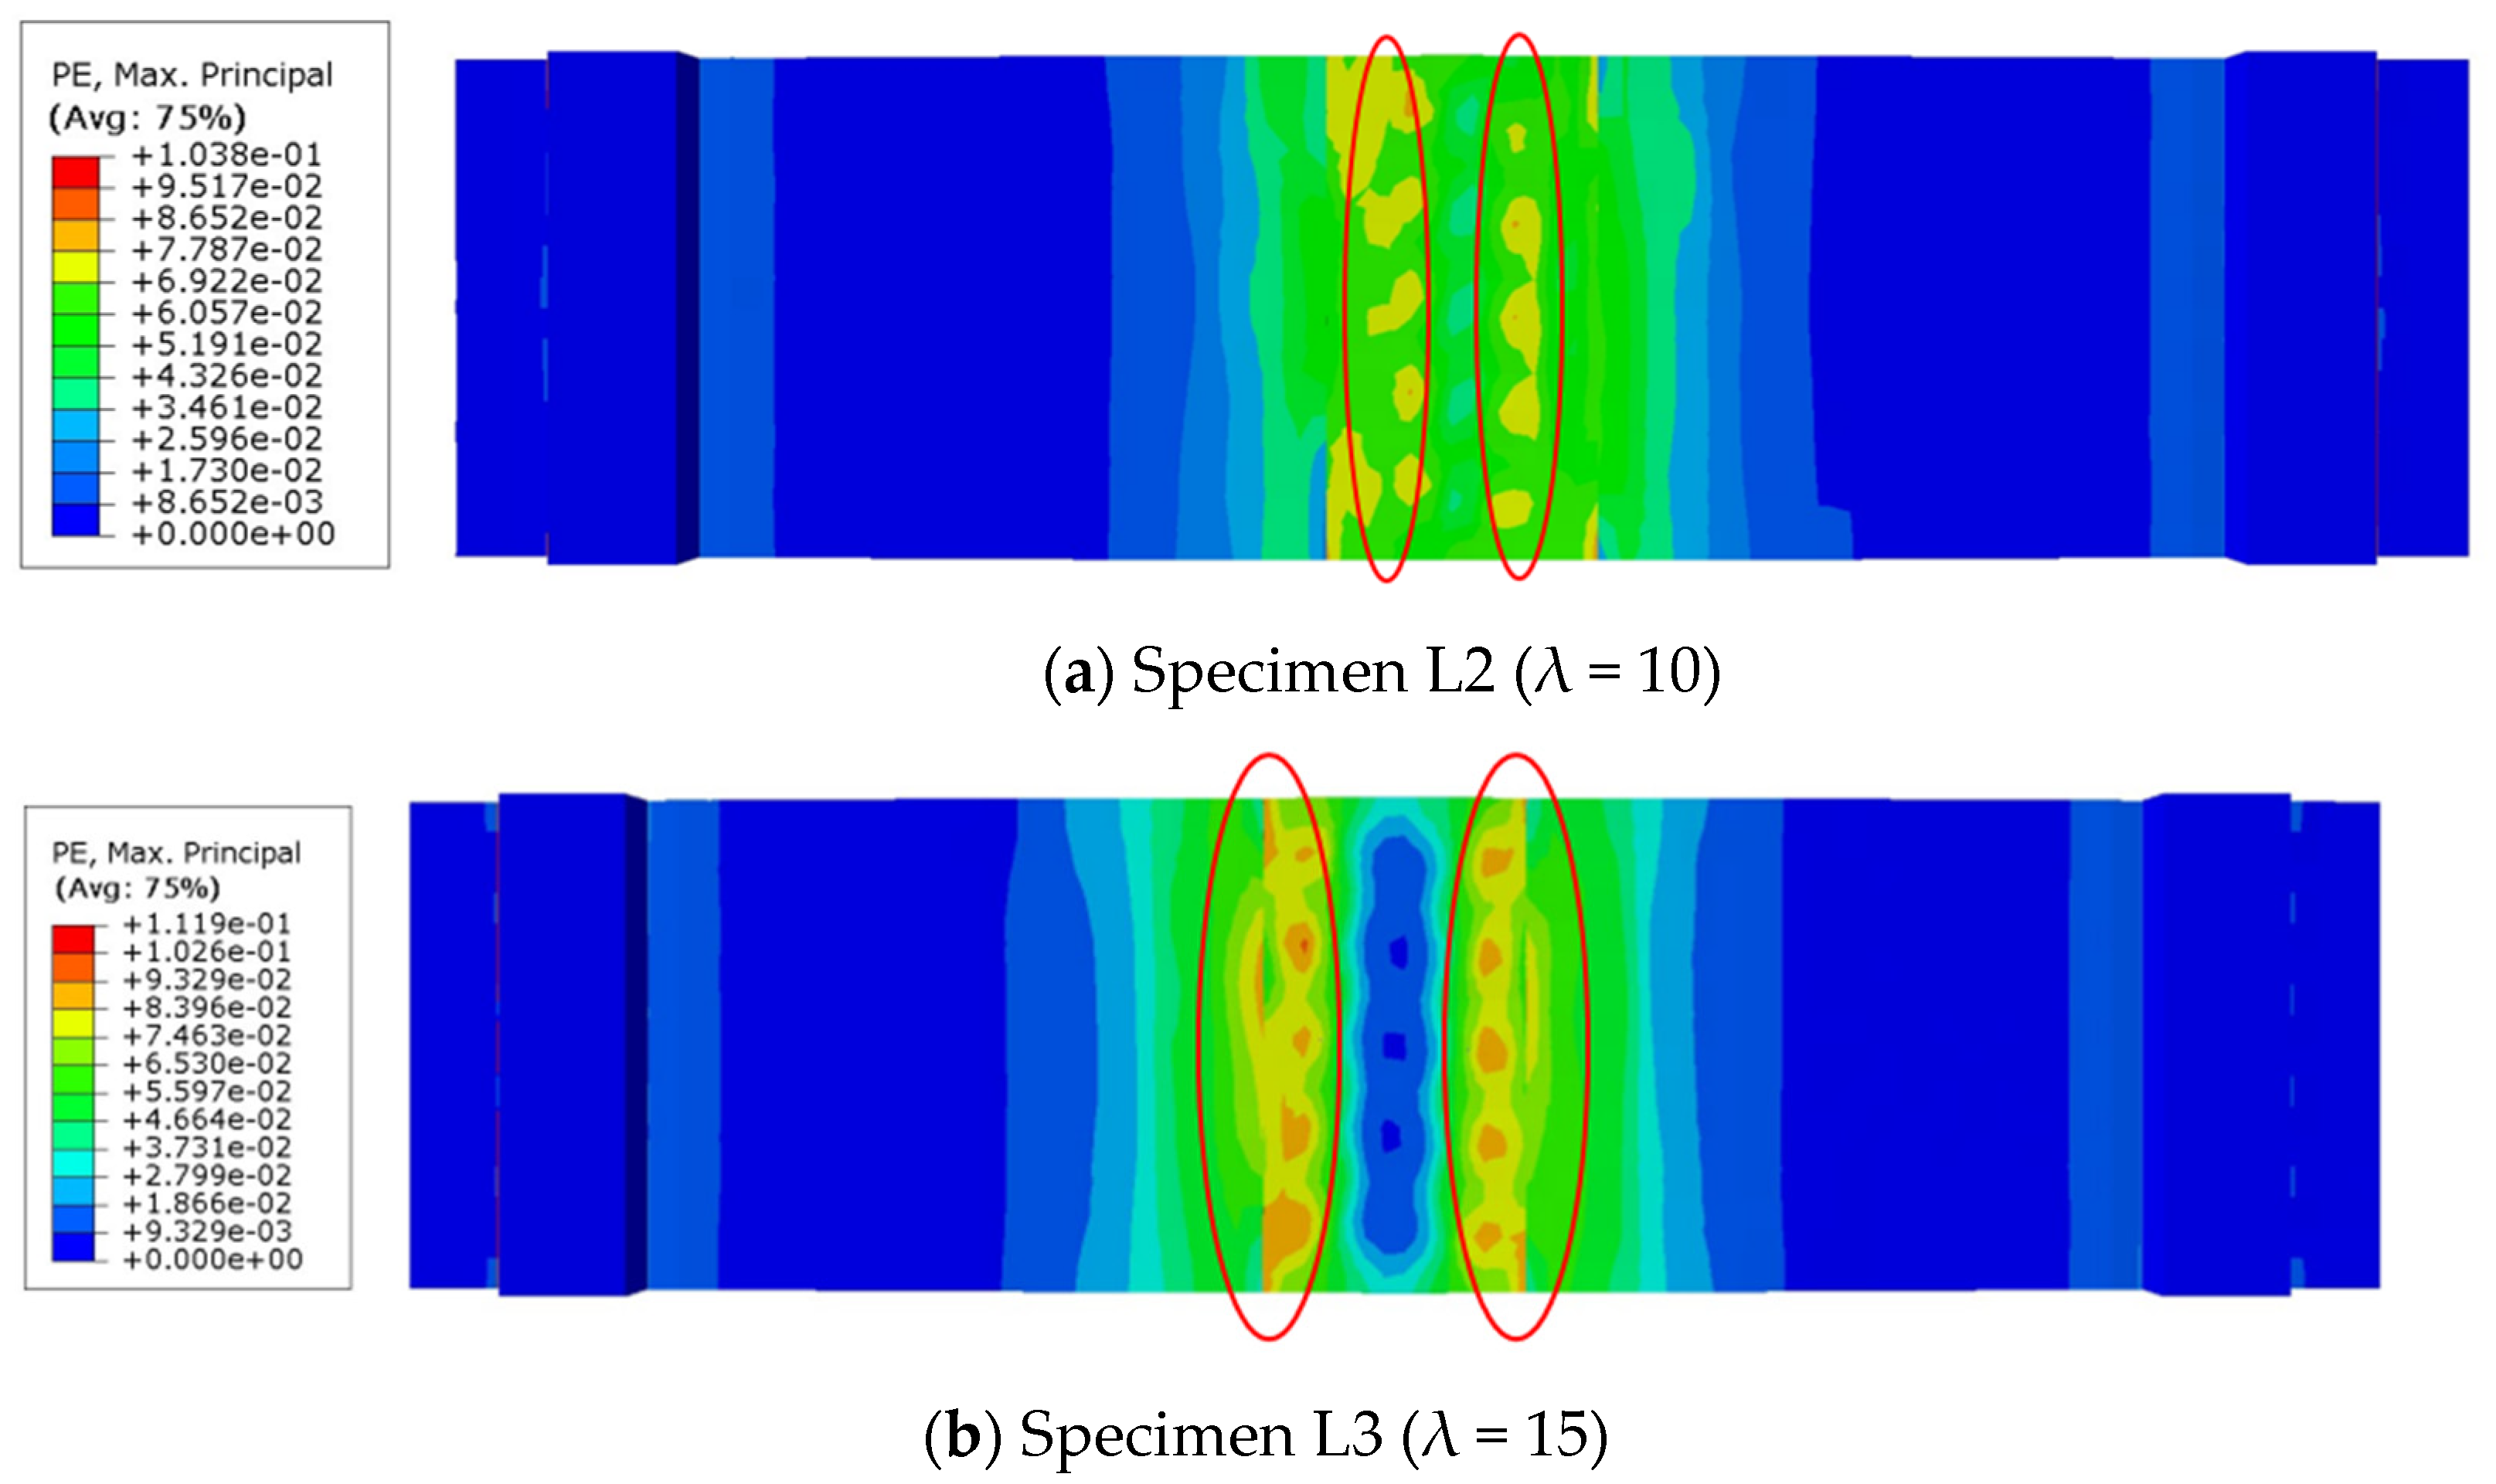
The load–deflection curves of the finite element and the test were compared, as shown in Figure 17. The calculated results of the finite element are in agreement with the test results. However, in the elastoplastic stage, the cross-section stiffness is inconsistent. This is because at the initial stage of loading, the deformation of the specimen is in the elastic stage. The finite element is consistent with the stiffness of the test specimen. There is no crack in the concrete, and the stiffness of the concrete section is calculated according to the full section, which is consistent with the finite element analysis results. In the elastoplastic stage, due to the continuous cracking of concrete, a large number of cracks are generated, resulting in a decrease in section stiffness. But the finite element model cannot effectively simulate the development of cracks in the test process, so the stiffness is still calculated according to the full section. Therefore, the stiffness of the result in the elastoplastic stage is greater than that of the test specimen. The maximum bearing capacity of components analyzed by finite element method and the test comparison are shown in Table 4. The error between the test results and the numerical analysis results is always less than 5%. As shown in Figure 18 and Figure 19, the fracture mode is very similar to the experiment, and the crack development is consistent with the experiment. This proves the accuracy of numerical analysis. Meanwhile, the strain results of numerical simulation are also similar to those of the experiments.
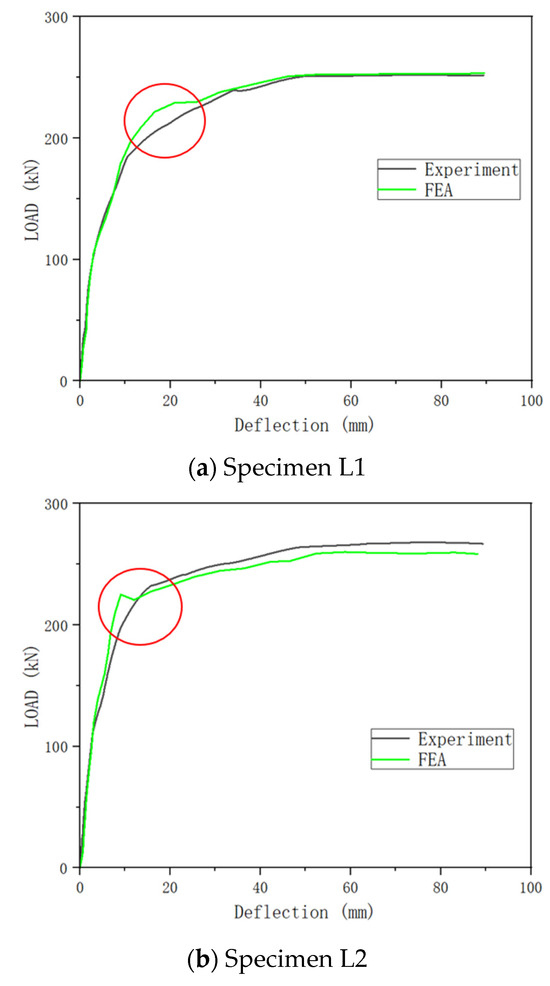

Figure 17.
Deflection–load curves of finite element analysis compared to experiment.
Table 4.
Comparison of finite element analysis and experimental results.
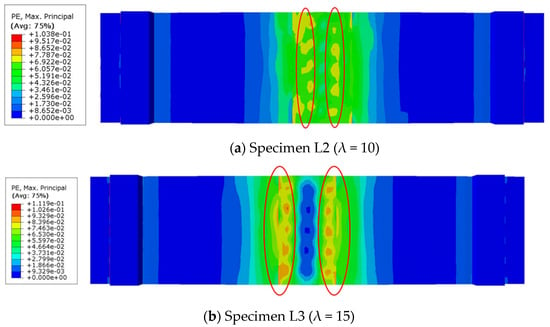
Figure 18.
Crack pattern of finite element analysis.

Figure 19.
Comparison of strain between experiment and FEM.
Based on the above model, a parametric analysis was conducted on the overlap length, and the results are shown in the Figure 20. As the overlap length increased, the bending capacity of U-bar wet joints became higher. After 240 mm, bending capacity growth slowed down and tended to stabilize. At the same time, the main crack segments also moved from the core area to the wet joint junctions.
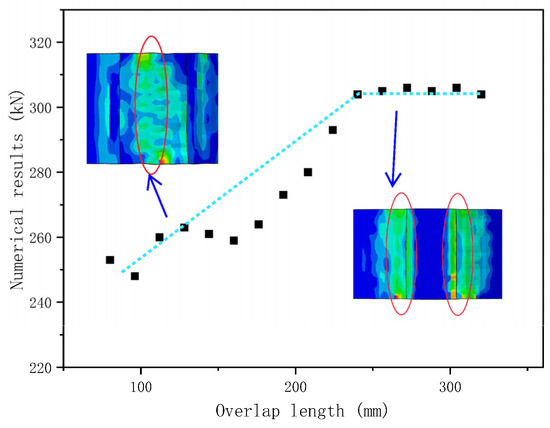
Figure 20.
Parameterized analysis results.
5. Analysis of Ultimate Bending Capacity
The failure mode, proposed by Franz and Timm [21], through the bending test of the U-bar connection assembly is shown in Figure 21. Han proposed a strut–tie model in which the transverse and U-bars are used as tension bars and the concrete supports in the triangular area are used as compressive bars. U-bar joints are controlled by U-bar, cross-bar and concrete support. When any part of the U-bar, transverse bar, or concrete fails, the whole joint fails. As shown in Figure 22, according to the principle of force balance, the internal forces of each member in the tie rod model can be calculated according to the following formulae:
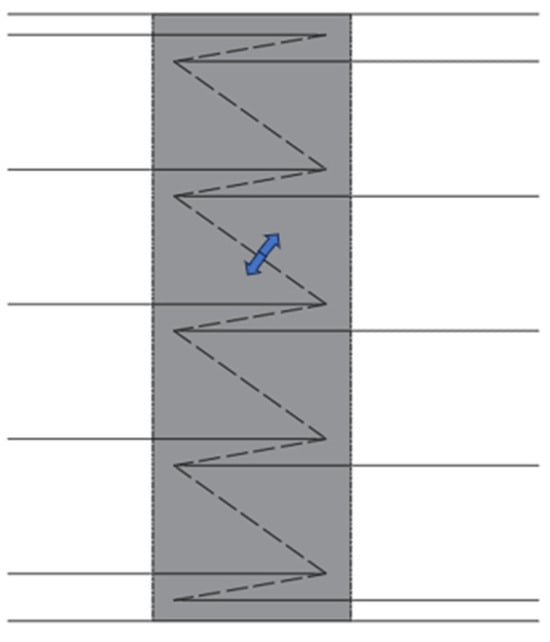
Figure 21.
Failure model.

Figure 22.
Strut-and-tie model.
In the formulae, is the tension force in the U-bars, is the tension force in the transverse bar, is the compression force in the concrete support plate, T is the bearing capacity of the triangular tie rod, and α is the angle between the U-bars and the concrete support plate. When calculating the ultimate bearing capacity of the joint, it is assumed that only the U-bars on the tension side have yielded. According to ACI 318-19 [22], the effective compressive strength formula of concrete is as follows:
where is the effective compressive strength of concrete and is the standard compressive strength of concrete cube.
The ultimate bearing capacity of U-bars, transverse bars, and concrete is as follows:
where is the tensile force of the U-bar, is the tensile force of the transverse bar, is the compressive force of the concrete support rod, is the yield strength of the U-bars, is the yield strength of the transverse bar, is the cross-sectional area of the U-bars, and is the cross-sectional area of the transverse bar. is the cross-sectional area of the concrete support and is the spacing between the U-bars. The concrete support section width , where is the support length and α is the angle between the concrete tie rod and the horizontal axis.
Therefore, the tensile capacity of the wet joint is shown as
where n represents the number of triangles. In this study, the STM has two triangles.
The equal effect diagram of the specimen is shown in Figure 23. When the sum of internal forces in the horizontal direction of the section is 0, Equation (9) can be obtained. By equivalent stress, Equation (10) can be obtained.
where is the ultimate pressure resultant force in the compression zone; is the height of the neutral axis; is the ratio of the stress value of the concrete rectangular stress diagram in the compression zone to the compressive strength of the concrete axis. According to the concrete structure design code GB50010, the specimen used in this paper is taken as 1.
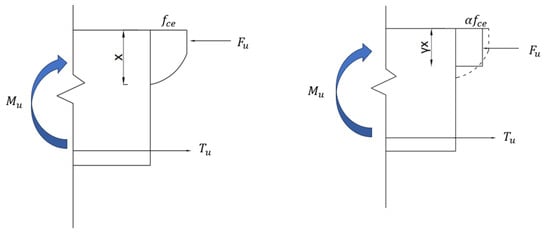
Figure 23.
Equivalent stress.
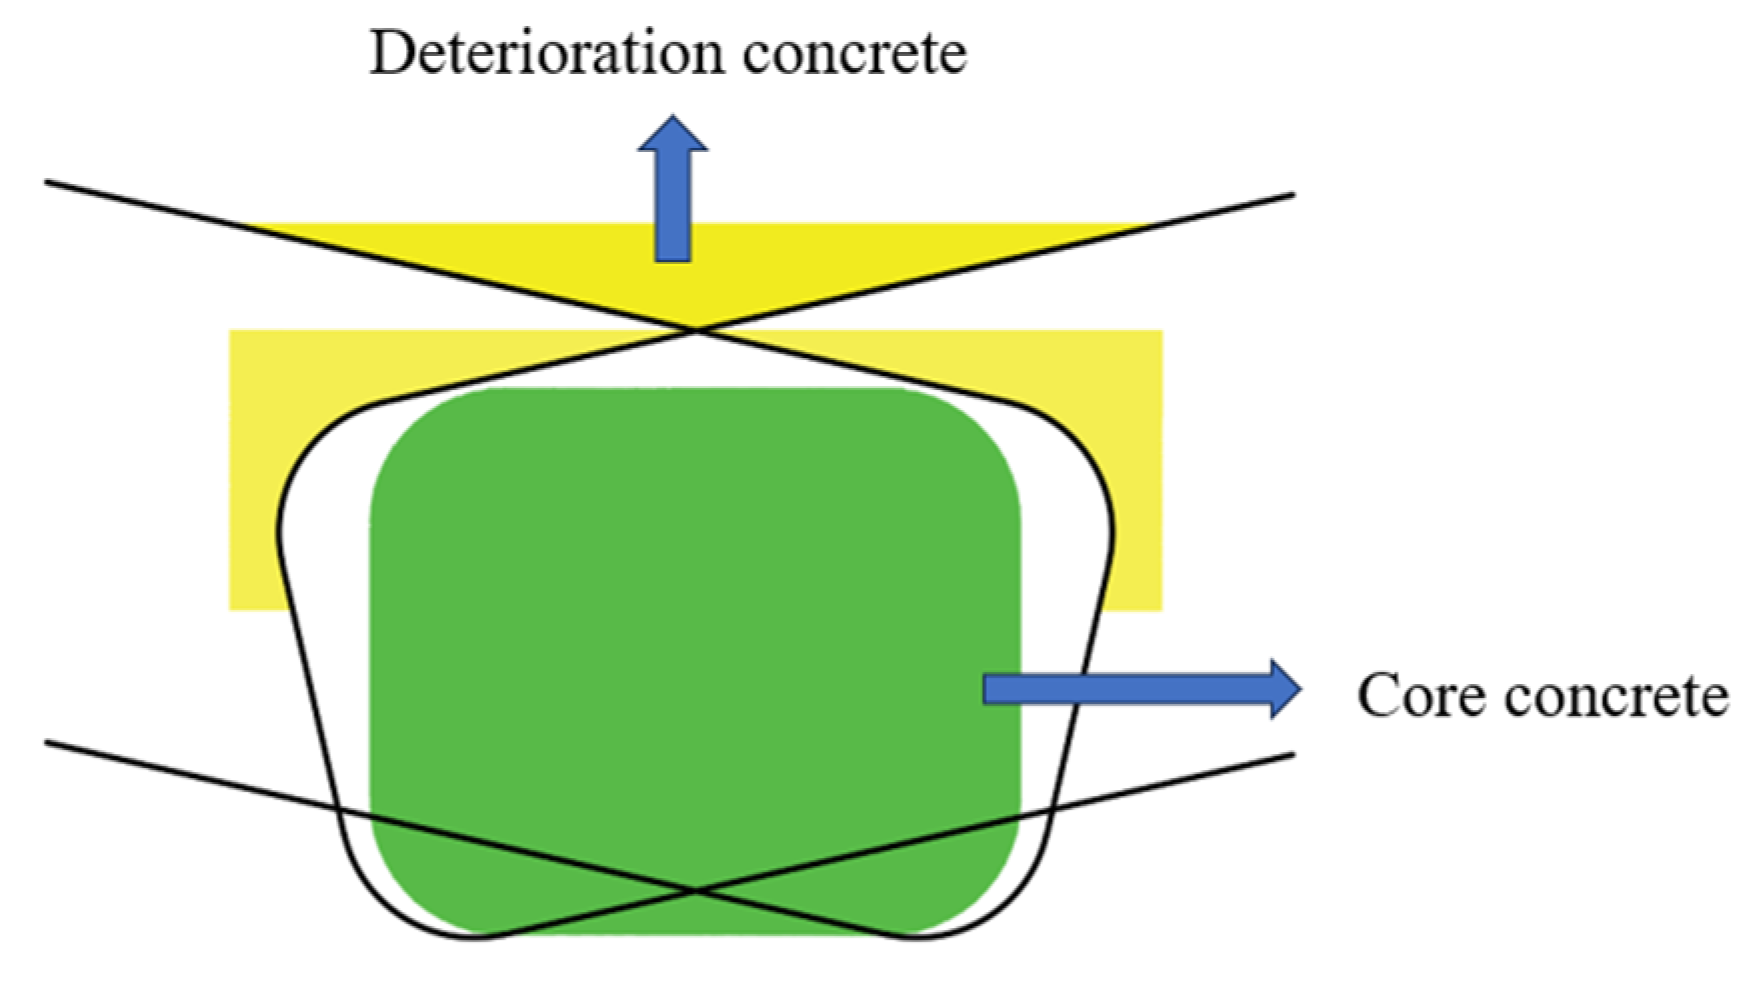
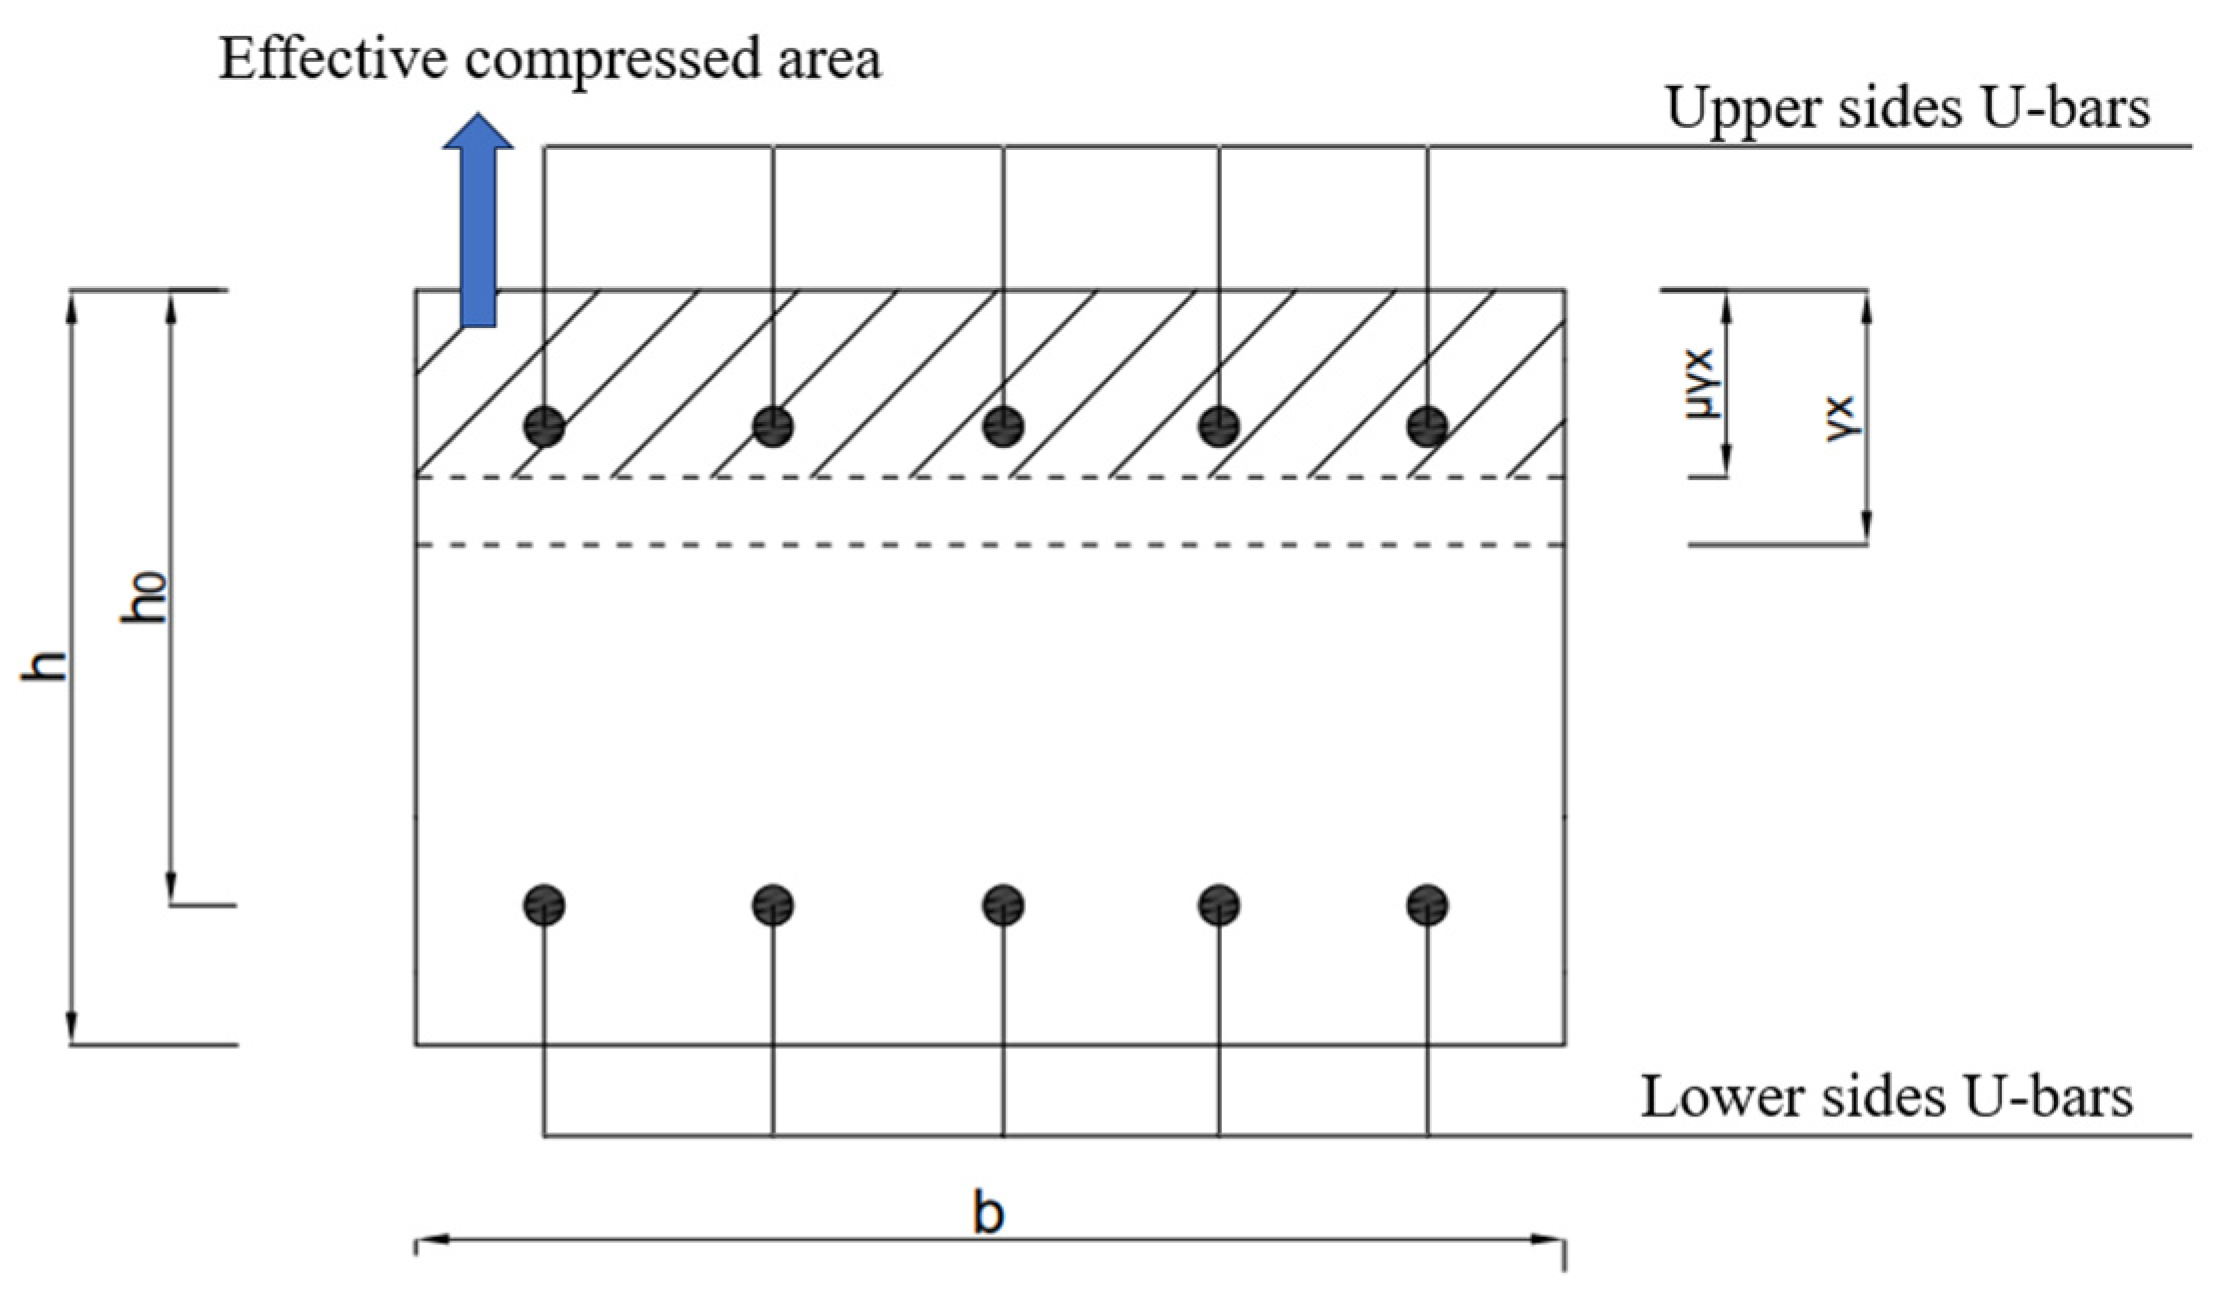
In contrast to a straight bar connection, lap joint U-bars mainly withstand the pressure through the friction between the steel bar and the concrete. As shown in Figure 24, with the increase in load on the wet joint of the U-bars, the U-bars are relatively dislocated, which degrades the concrete around the steel bar to a certain extent and weakens the bearing capacity of the concrete in the compression zone. In the calculation process, the deterioration phenomenon of concrete caused by the dislocation of lap steel bars was taken into account, and the concrete deterioration coefficient was set to effectively reflect the deterioration degree of concrete, as shown in Figure 25. The height of the effective compression zone of the section is , and the deterioration coefficient of concrete should be determined by testing. After fitting with the test data:

Figure 24.
Deterioration concrete model.

Figure 25.
Effective compressed height.
The following formula can be obtained to calculate the bending moment of the section:
where is the effective height of the section; is specimen cross-section width.
The calculation results and comparisons with the experimental results conducted by Han are shown in Table 5. The difference between the calculated results is less than 6%, which indicates that the theoretical results agree well with the experimental results.
Table 5.
Comparison of theoretical and experimental results.
6. Conclusions
Through the experiments, finite element numerical analysis, and mechanical model based on the STM, the following conclusions can be drawn:
(1) The lapping length of U-bars is the main factor affecting the flexural performance of joints. The test results show that the ultimate bearing capacity of the specimen with a lap length of 240 mm is 13.4% and 17.7% higher than that of the specimens with 160 mm and 80 mm. According to the parameterized analysis results of the finite element model, the bending capacity first increases, then slows down with the increase in overlap length, and finally tends to stabilize. The main crack segment gradually moves from the core area to the wet joint junction.
(2) When the lap length is sufficient, the increase or decrease in width of the wet joint has little effect on the flexural performance of the joint. In the case of sufficient lap length, the arrangement of the water stop strip does not affect the flexural performance of the joint.
(3) The dislocation of U-bars degrades the concrete and weaken the flexural performance of wet joints. However, the degradation mechanism of concrete is still unclear, and further research is needed to determine whether reinforcement measures can weaken the degradation effect of concrete.
Author Contributions
Y.W.: Conceptualization, Data curation, Formal analysis, Funding acquisition, Investigation, Methodology, Project administration, Software, Validation, Visualization, Writing—original draft, Writing—review and editing. S.H.: Project administration, Supervision, Resources, Conceptualization. M.L.: Project administration, Supervision, Resources, Conceptualization. B.R.: Conceptualization, Resources, Supervision. All authors have read and agreed to the published version of the manuscript.
Funding
Jiangxi Institute of Water Sciences Open Fund: 2023SKSG05.
Data Availability Statement
The data presented in this study are available on request from the corresponding author. The data are not publicly available due to the requirements of academic funding.
Conflicts of Interest
The authors declare no conflicts of interest.
References
- Leonhardt, F.; Walther, R.; Dieterle, H. Empirical Tests for Determination of Ultimate Strength of U-Bar Splices. Dtsch. Aussch. Stahlbeton 1973, 1–22. Available online: https://www.scopus.com/record/display.uri?eid=2-s2.0-0015728280&origin=inward&txGid=87b1a6f9858bdbab7511b5d14d53c742 (accessed on 12 February 2025).
- Di, J.; Han, B.; Qin, F. Investigation of U-bar joints between precast bridge decks loaded in combined bending and shear. Structures 2020, 27, 37–45. [Google Scholar] [CrossRef]
- Jørgensen, H.B. Strength of Loop Connections Between Precast Concrete Elements. Ph.D. Thesis, Department of Technology and Innovation, SDU Civil and Architectural Engineering, Jinan, China, 2014. [Google Scholar]
- Zalesov, A.S.; Kirillov, A.P.; Rubin, O.D.; Sleznev, S.V. Calculation of the strength and design of welding loops and linear anchor joints in combined precast-in situ reinforced concrete members. Hydrotech. Constr. 1989, 23, 120–124. [Google Scholar] [CrossRef]
- Zhu, P.; Ma, Z.J.; French, C.E. Fatigue Evaluation of Longitudinal U-Bar Joint Details for Accelerated Bridge Construction. J. Bridge Eng. 2012, 17, 201–210. [Google Scholar] [CrossRef]
- Li, L.; Jiang, Z. Flexural behavior and strut-and-tie model of joints with headed bar details connecting precast members. Perspect. Sci. 2016, 7, 253–260. [Google Scholar] [CrossRef]
- Han, B.; Zuo, Z.; Di, J.; Qin, F. Flexural behavior of improved joint details connecting pre-cast bridge decks. Eng. Struct. 2021, 245, 112948. [Google Scholar] [CrossRef]
- Ou, Y.-C.; Sutejo, H.; Huang, J.-L.; Yen, S.-I. Seismic Performance of Reinforced Concrete Beams with Proposed Lap-Spliced Intermediate Hoops. J. Struct. Eng. 2024, 150, 04023239. [Google Scholar] [CrossRef]
- Ma, Z.J.; Lewis, S.; Cao, Q.; He, Z.; Burdette, E.G.; French, C.E.W. Transverse Joint Details with Tight Bend Diameter U-Bars for Accelerated Bridge Construction. J. Struct. Eng. 2012, 138, 697–707. [Google Scholar] [CrossRef]
- Huang, D.; Nie, X.; Zeng, J.; Jiang, Y. Experimental and numerical analysis on flexural behavior of improved U-bar joint details for accelerated bridge construction. Eng. Struct. 2023, 289, 116328. [Google Scholar] [CrossRef]
- Chapman, C.E. Behavior of Precast Bridge Deck Joints with Small Bend Diameter Ubars. Master’s Thesis, University of Tennessee, Knoxville, TN, USA, 2010. [Google Scholar]
- Shi, X.; Zhong, Y.; Ma, H.; Hu, K.; Xie, P.; Zeng, C. Numerical analysis on tensile capacity of loop connections. Eng. Struct. 2021, 246, 113022. [Google Scholar] [CrossRef]
- Villalba-Herrero, S.; Casas, J.R. New structural joint by rebar looping applied to staged box girder bridge construction. Static tests. Struct. Concr. J. FIB 2016, 17, 824–835. [Google Scholar] [CrossRef]
- Asemi, K.; Salehi, M.; Akhlaghi, M. Three dimensional graded finite element elasticity shear buckling analysis of FGM annular sector plates. Aerosp. Sci. Technol. 2015, 43, 1–13. [Google Scholar] [CrossRef]
- Yao, J.; Luo, J.; Ren, D.; Nagai, K. Mesoscopic simulation of interface and loop connections of precast concrete structures by 3D RBSM. Structures 2024, 70, 107749. [Google Scholar] [CrossRef]
- Andersen, M.E.M.; Poulsen, P.N.; Olesen, J.F. Finite-Element Limit Analysis for Solid Modeling of Reinforced Concrete. J. Struct. Eng. 2021, 147, 04021051. [Google Scholar] [CrossRef]
- Savino, V.; Lanzoni, L.; Tarantino, A.; Viviani, M. A cohesive FE model for simulating the cracking/debonding pattern of composite NSC-HPFRC/UHPFRC members. Constr. Build. Mater. 2020, 258, 119516. [Google Scholar] [CrossRef]
- Ooi, E.T.; Yang, Z.J. Modelling crack propagation in reinforced concrete using a hybrid finite element–scaled boundary finite element method. Eng. Fract. Mech. 2011, 78, 252–273. [Google Scholar] [CrossRef]
- Sørensen, J.H.; Hoang, L.C.; Olesen, J.F.; Fischer, G. Tensile capacity of loop connections grouted with concrete or mortar. Mag. Concr. Res. 2017, 69, 892–904. [Google Scholar] [CrossRef]
- GB 50010-2010; Code for Design of Concrete Structures. John Wiley & Sons: Hoboken, NJ, USA, 2010.
- Franz, G.; Timm, G. Tests on the flexural behavior of slab with hook and loop connection. Dtsch. Aussch. Stahlbeton 1973, 23–54. Available online: https://www.scopus.com/record/display.uri?eid=2-s2.0-0015744285&origin=inward&txGid=92762a32103e97ed60e89f58ab31b275 (accessed on 12 February 2025).
- ACI 318-19; Building Code Requirements for Structural Concrete and Commentary. ACI (American Concrete Institute): Indianapolis, IN, USA, 2019.


Disclaimer/Publisher’s Note: The statements, opinions and data contained in all publications are solely those of the individual author(s) and contributor(s) and not of MDPI and/or the editor(s). MDPI and/or the editor(s) disclaim responsibility for any injury to people or property resulting from any ideas, methods, instructions or products referred to in the content. |
© 2025 by the authors. Licensee MDPI, Basel, Switzerland. This article is an open access article distributed under the terms and conditions of the Creative Commons Attribution (CC BY) license (https://creativecommons.org/licenses/by/4.0/).