Abstract
This study presents experimental investigations of the flexural bearing capacity of the lower load-bearing structures of pull-up cantilever scaffolds with adjustable steel tie rods. First, load-bearing structures with three different specifications are tested to analyze their primary failure modes and failure mechanisms. The experimental results are then simulated and validated using a finite element analysis (FEA) method. Subsequently, an extended parametric analysis is performed numerically, and a simplified calculation formula is derived through nonlinear curve fitting to evaluate the load-bearing capacity. Finally, the effects of the transverse spacing of the vertical rods, the length of the cantilever beams, and the spacing of the hanging ears on the flexural bearing capacity of the structures are analyzed.
1. Introduction
Scaffolding plays a critical role in building construction [1]. Traditional scaffolding systems, such as floor-standing scaffolding and door-type scaffolding [2,3], provide a certain degree of stability and load-bearing capacity. However, they face issues such as occupying considerable space, long construction periods, high labor costs, and severe material losses. Additionally, due to height limitations, traditional floor-standing scaffolding also involves high risks and complex erection and dismantling processes. In contrast, cantilever scaffolding offers better adaptability and ease of operation, making it more suitable for the complex construction requirements of high-rise buildings [4,5]. Nevertheless, due to technical, organizational, and human factors [6], various accidents frequently occur during the erection and dismantling processes of scaffolding [7]. At present, the normative documents and application standards related to scaffolding remain incomplete [8,9], and standards specifically addressing cantilever scaffolding are particularly scarce. Therefore, further systematic research is urgently needed to lay the foundation for the development of comprehensive technical specifications.
At present, researchers have made advancements in many aspects of scaffolding, such as theoretical modeling, mechanical property determination, engineering monitoring, and construction management methods. In the study of theoretical models of scaffolding, some scholars have provided suggestions for the design of scaffolding through an algorithm for modeling scaffold behavior [10], a method of numerical analysis [11], a approach for topology optimization [12], and an optimization methodology based on genetic algorithms [13]. Zhang et al. [14] and Beale et al. [15] analyzed the reliability of scaffolding systems via a second-order inelastic structural analysis model of scaffolding and a nonlinear model of scaffolding. In a study of the mechanical properties of scaffolding, Peng et al. [16] investigated the effect of eccentric loading on the scaffolding system. Zhang et al. [17] investigated the effects of failure modes and different stochastic variables on the variation in the strength of scaffolding structures. The mechanical properties of special types of scaffolds, such as the mortise–tenon steel-tube scaffold [18], the frame-type steel scaffold [19], the pull-up cantilever scaffold [20], the socket-type keyway steel-pipe scaffold [21], and the large-span steel cantilever beam [22], have been studied. In terms of engineering monitoring and construction management methods for scaffolding, Yan et al. [23] explored the construction process and requirements of ultrahigh-tower overhanging scaffolds. Peng et al. [24] investigated and discussed the factors influencing the bearing capacity of single-row steel scaffolds under isolation beams and the strength of steel scaffolds with defects. Zhao et al. [2] systematically investigated the effects of member imperfection and joint stiffness on the ultimate load of door-type modular steel scaffolds. Additionally, scholars have built inspection systems to help inspectors perform scaffold quality assessment through computer vision [25], deep learning [26], and point clouds [27]. In addition, scholars have made limited progress in the study of cantilever scaffolds [28,29,30,31], but there is still a large gap in the study of their bearing capacity and other practical applications.
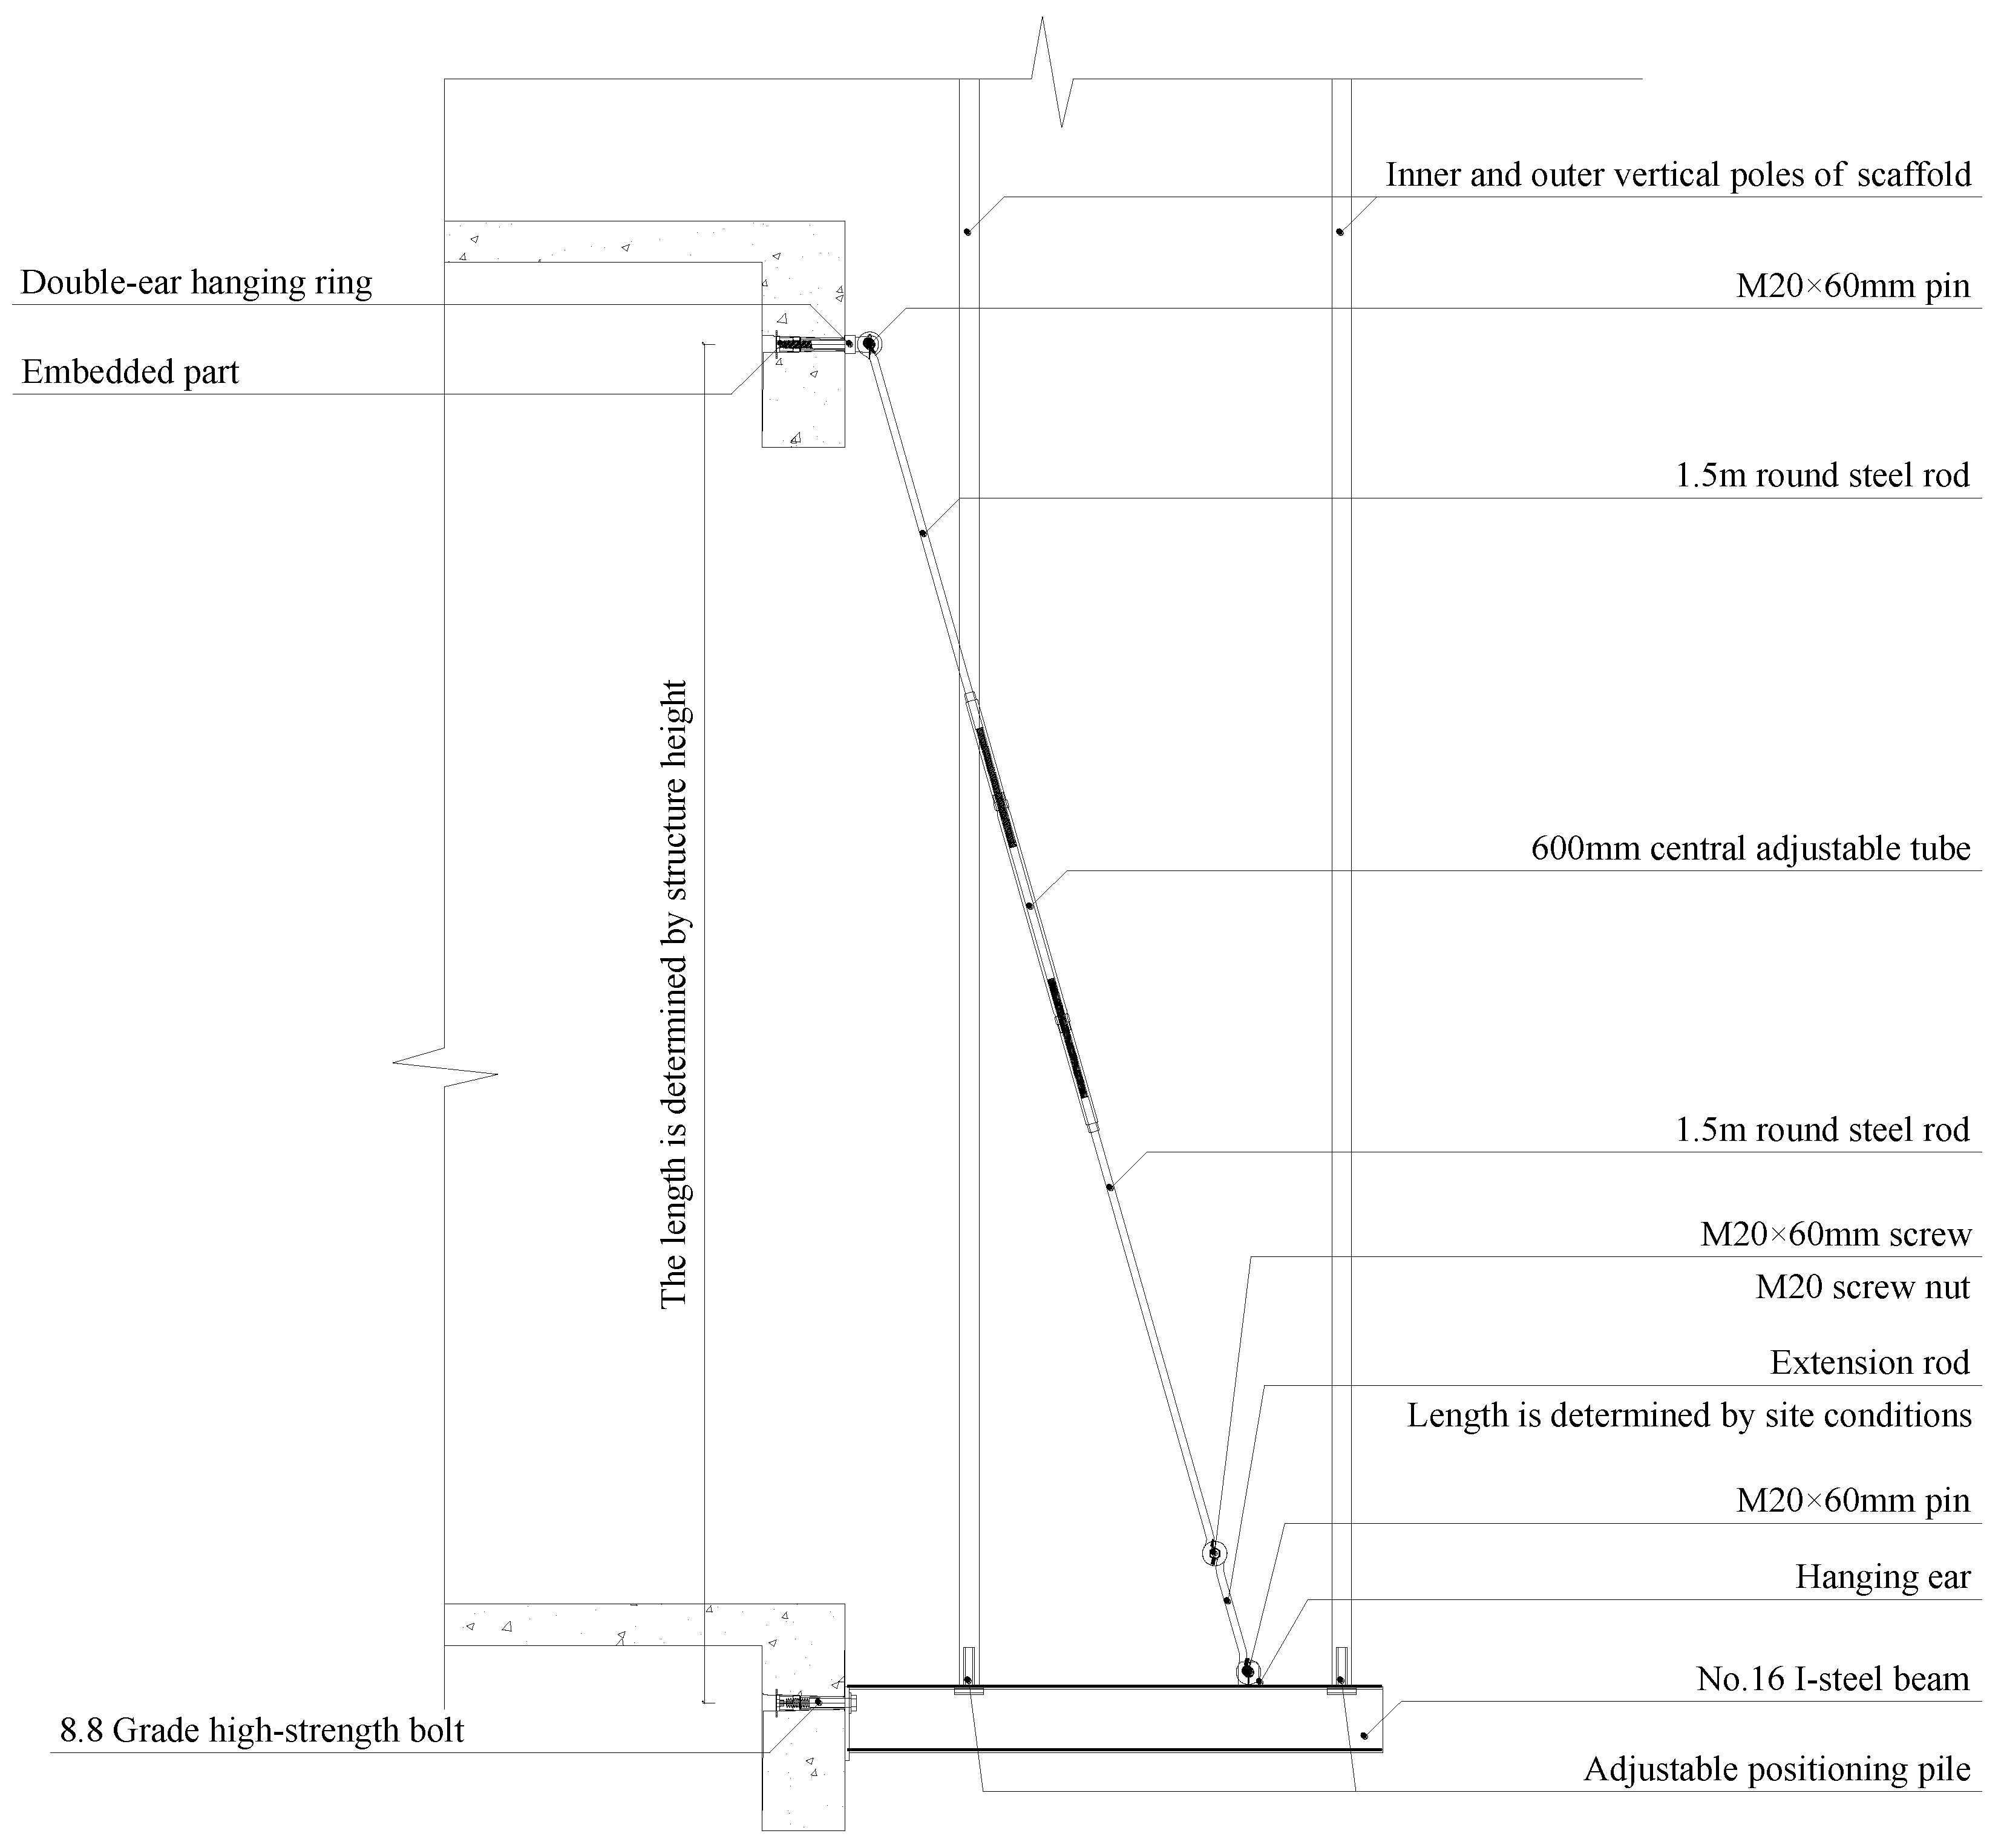
In this paper, a new cantilever scaffold—specifically, a pull-up cantilever scaffold with adjustable steel tie rods—is proposed, building upon traditional cantilever scaffold designs, as shown in Figure 1. The new cantilever scaffold consists of a lower load-bearing structure and an upper scaffold. Its main structural characteristics are as follows:
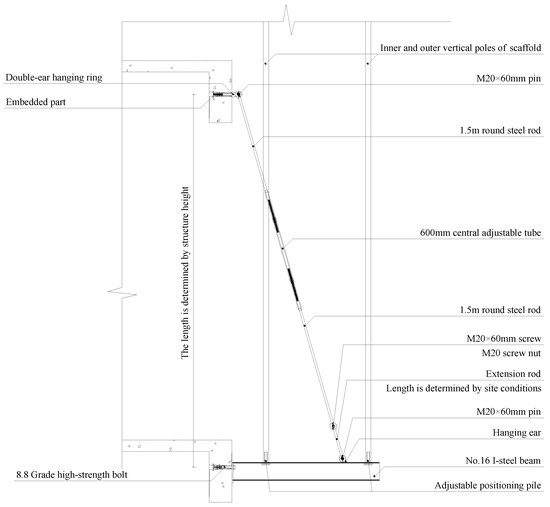
Figure 1.
A construction diagram of the pull-up cantilever scaffold with adjustable steel tie rods.
- (1)
- Lower load-bearing structure: Comprising a cantilevered I-steel beam, oblique tie rods, and adjustable positioning piles, this structure supports and stabilizes the scaffold, transferring the load to the building’s load-bearing system.
- (2)
- Cantilever I-steel beam: Connected to the building’s load-bearing structure with high-strength bolts and embedded parts, it forms the primary load-bearing element of the scaffold.
- (3)
- Oblique tie rods: These steel rods, positioned between the building’s load-bearing structure and the cantilever beam, provide structural stability. The tie rods are adjustable in length to accommodate varying construction requirements.
- (4)
- Adjustable positioning piles and embedded parts: These components anchor the scaffold to the building’s load-bearing structure and provide additional stability.
- (5)
- Double-ear hanging rings and hanging ears: Used to connect the oblique tie rods to the building’s load-bearing structure and the cantilever beam.
This new pull-up cantilever scaffold with adjustable steel tie rods surpasses traditional cantilever scaffold systems in construction efficiency, cost control, adaptability, and safety, showcasing considerable potential for application. Furthermore, it aligns with the broader principles of sustainable development by promoting more efficient resource use, reducing waste, and improving safety. These advancements not only enhance the operational efficiency of construction projects but also support the goals of sustainability in the construction industry, as detailed in the following advantages [32,33]:
- (1)
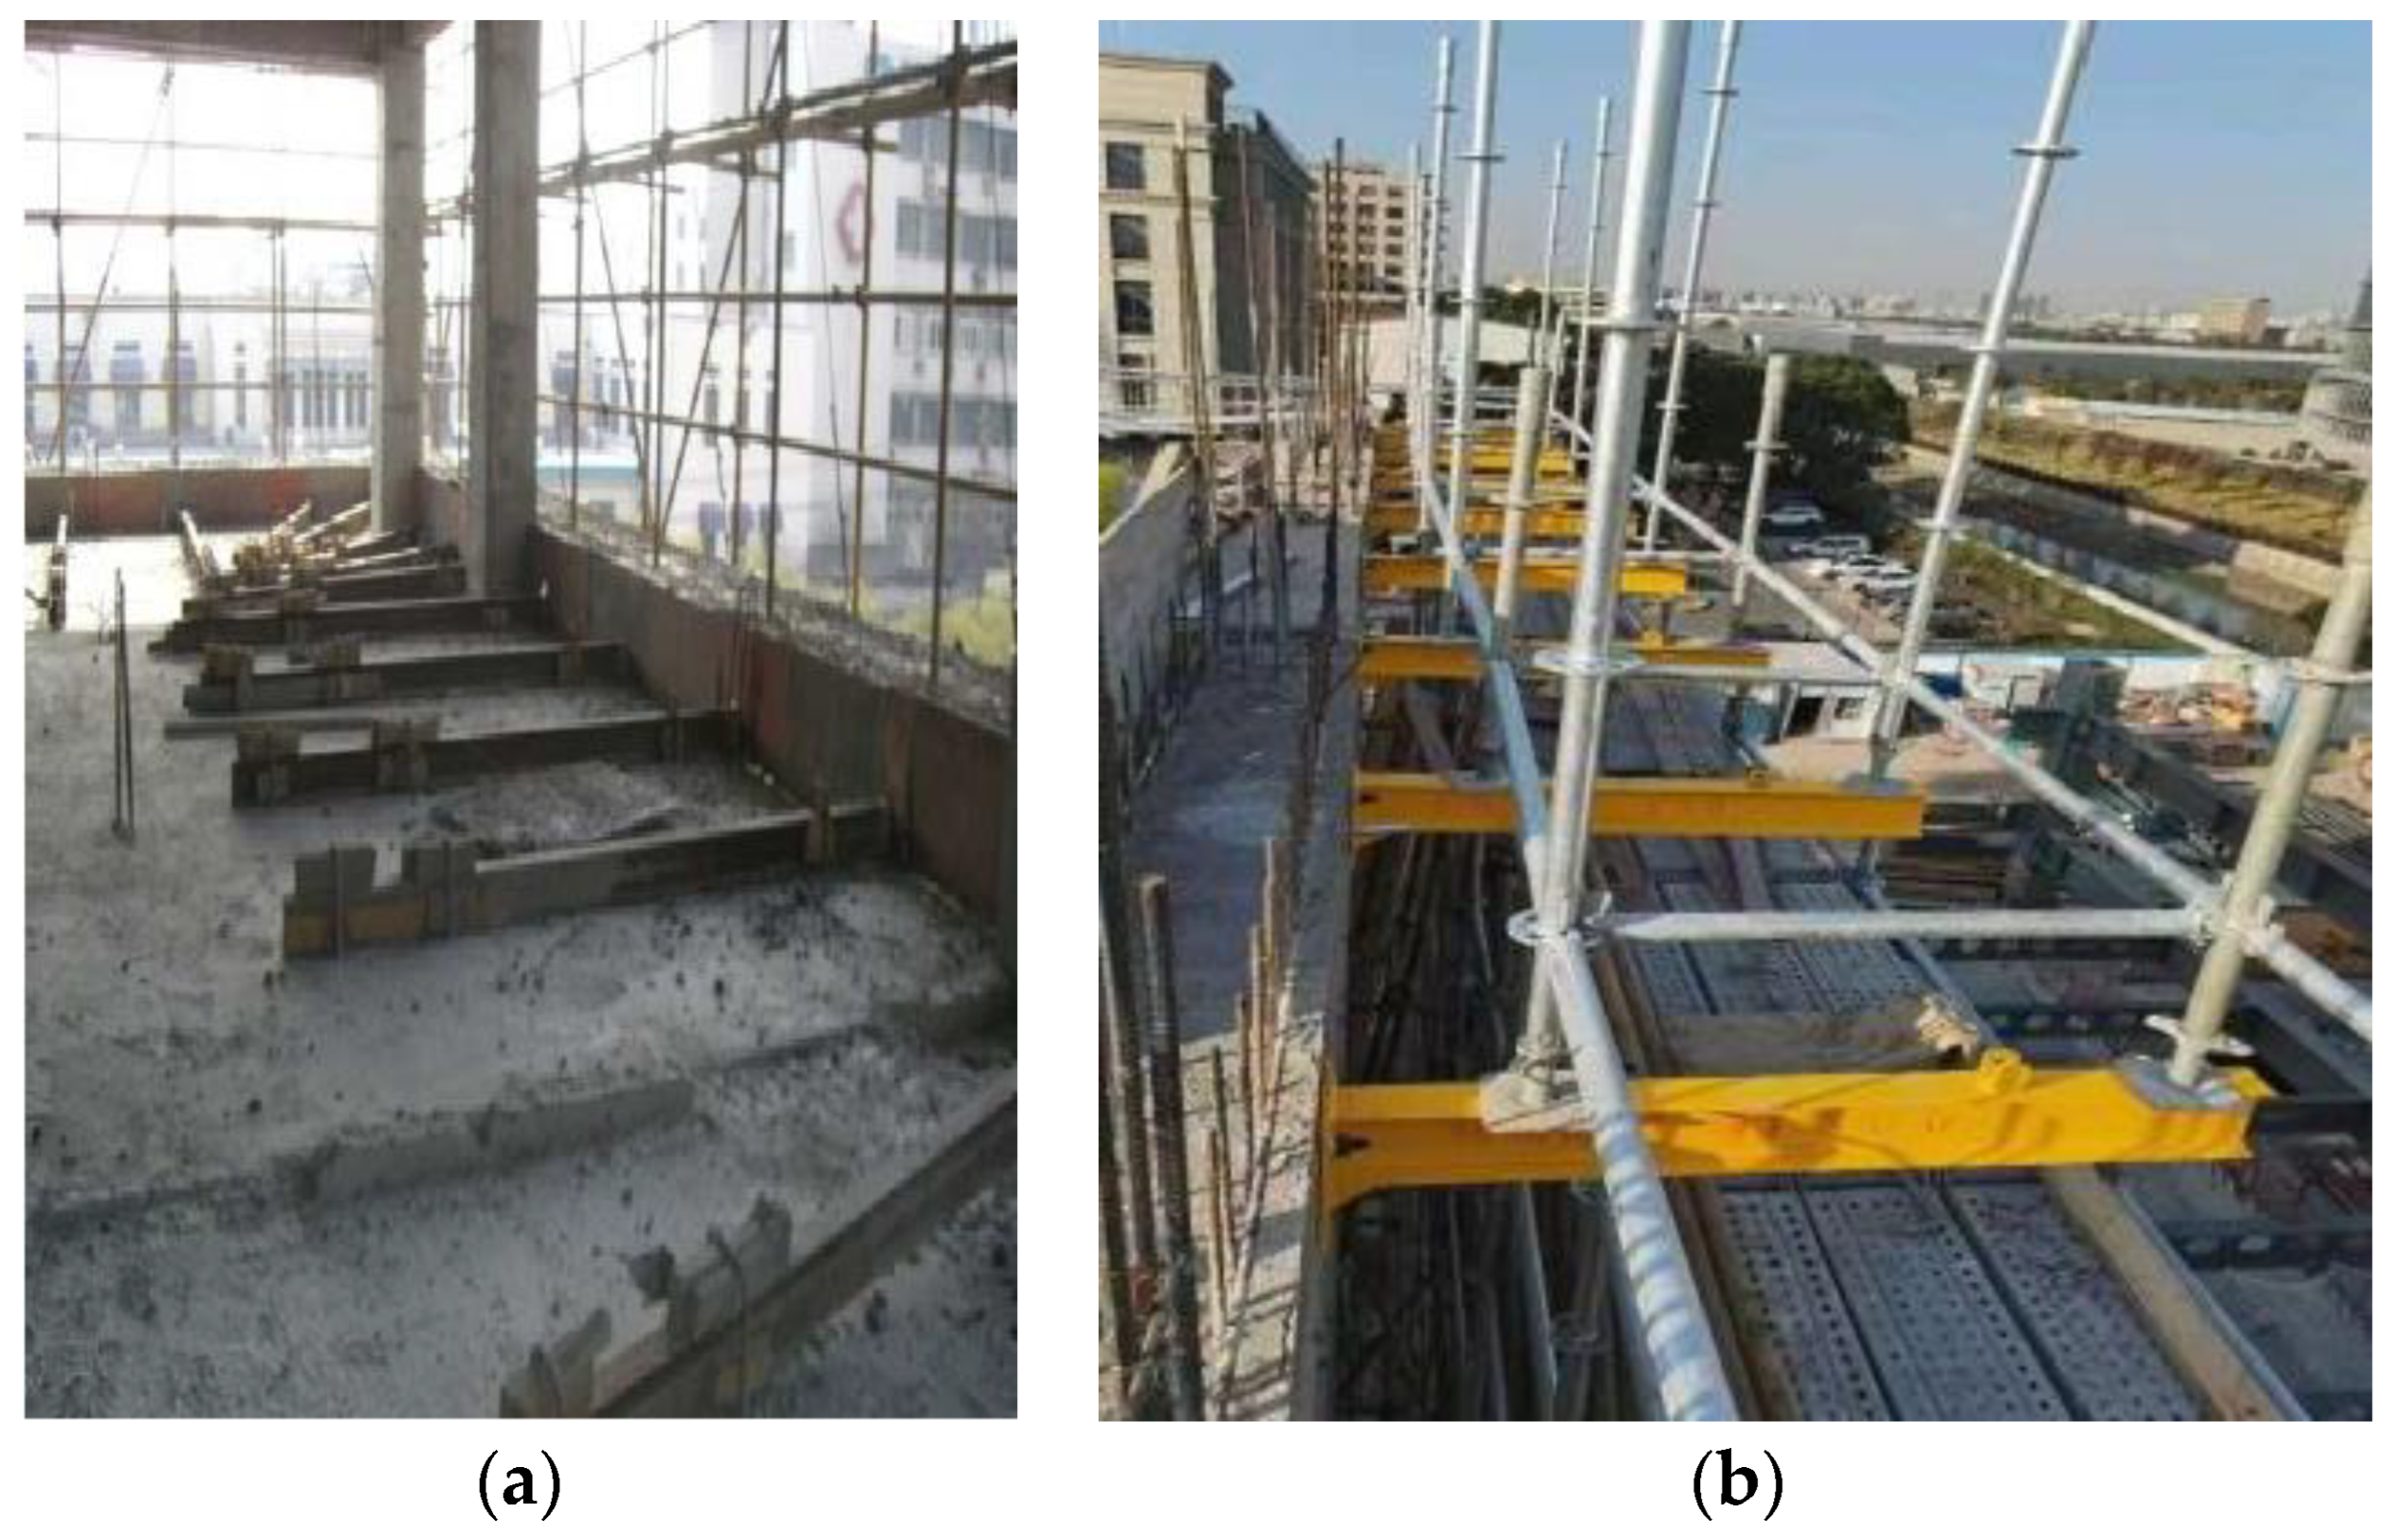
- The pull-up cantilever scaffold with adjustable steel tie rods is directly connected to the building’s external facade using bolts and double-ear hanging rings, eliminating the need for wall penetration, as shown in Figure 2. This eliminates interference with interior construction, allowing both interior and exterior work to proceed simultaneously. The adjustable rods facilitate flexible modifications according to specific construction needs, allowing workers to rapidly assemble, adjust, and dismantle the scaffold, thereby significantly enhancing overall efficiency.
 Figure 2. On-site construction diagrams of the cantilevered scaffold: (a) a traditional cantilevered scaffold; (b) the novel cantilever scaffold, the construction phase in the figure does not yet include the diagonal rod.
 - (2)
- The steel frame length of the new cantilever scaffold is reduced by more than 50% compared to traditional designs. This not only improves construction efficiency but also shortens project timelines, resulting in substantial cost savings.
- (3)
- The new cantilever scaffold is highly adaptable, enabling rapid adjustments to different construction environments and stages. This flexibility facilitates efficient transitions between stages, enhancing turnover rates and reducing the overall construction cycle.
- (4)
- The robust steel tie rod structure and secure suspension design enhance the stability of the new cantilever scaffold, enabling it to support greater loads while reducing accident risks, thereby improving on-site safety.
Building upon the current state of research, this study investigates the flexural bearing capacity of the lower load-bearing structure of this new cantilever scaffold through experiments and FEA. First, three groups of load-bearing structures with different specifications are subjected to flexural bearing capacity experiments to analyze their failure modes and bearing mechanisms systematically, with the experimental results simulated and verified using ABAQUS FEA software (version 2023). An extended FEA is subsequently performed to analyze the flexural bearing capacity of various sizes of load-bearing structures commonly used in actual projects, and a simplified formula is derived to calculate their flexural bearing capacity. The effects of the transverse spacing of vertical rods, the lengths of cantilever beams, and the spacing of hanging ears on the flexural bearing capacity of load-bearing structures are also analyzed in this paper. This study lays a theoretical foundation for the application and standardization of pull-up cantilever scaffolds with adjustable steel tie rods and contributes to advancing safety research on temporary structures [9].
2. Flexural Bearing Capacity Experiment
2.1. Experiment Preparation
Three distinct sizes of load-bearing structures were used in the experiments, primarily consisting of components such as cantilever I-beams, oblique tie rods, double-ear hanging rings, high-strength bolts, pins, and gaskets. With the exception of the high-strength bolts, which were made from No. 45 steel [34], all the other components were fabricated from Q235 steel [35]. The cantilever I-beam was fabricated from No. 16 hot-rolled I-steel [36], and its fixed end featured a flat end plate with a thickness of 12 mm. The cantilever lengths of the I-beams for the three test specimens were set at 1.3 m, 2.1 m, and 3.1 m, designated as the L13, L21, and L31 test groups, respectively, with two specimens in each group.
In engineering applications, ten distinct cantilever I-beam lengths, ranging from 1.3 m to 3.1 m, are available for use. Structural differences were observed for cantilever I-beams of varying lengths. Specifically, the test specimens with cantilever lengths of 1.3 m, 1.5 m, and 1.7 m were single tie rod specimens, without extension rods at the ends of the tie rods. The test specimens with cantilever lengths of 1.9 m and 2.1 m were double tie rod specimens, where the inner tie rod lacked an extension rod, but an extension rod was added at the end of the outer tie rod. The test specimens with cantilever lengths of 2.3 m, 2.5 m, 2.7 m, 2.9 m, and 3.1 m were also double tie rod specimens, both of which featured extension rods for the inner and outer tie rods. Due to the constraints of the experimental scale, this study focused on specimens with cantilever lengths of 1.3 m, 2.1 m, and 3.1 m, which were designated as the L13, L21, and L31 test groups, respectively. The selection of these three cantilever lengths was closely aligned with construction practices. The 1.3 m cantilever length is commonly used for single tie rod cantilever scaffolds, typically applied in construction for locations such as balconies, canopies, and bay windows. The 2.1 m and 3.1 m cantilever lengths are commonly used for double tie rod cantilever scaffolds in building projects. Meanwhile, the relative positioning of the inner and outer vertical poles, along with the tie rods, varies for 2.1 m and 3.1 m cantilever scaffolds. Consequently, these two cantilever lengths must be considered separately. Additionally, the 3.1 m cantilever length is the longest used in construction applications. Thus, the three cantilever lengths selected for this study are closely aligned with real-world engineering applications, providing a theoretical foundation for practical use.
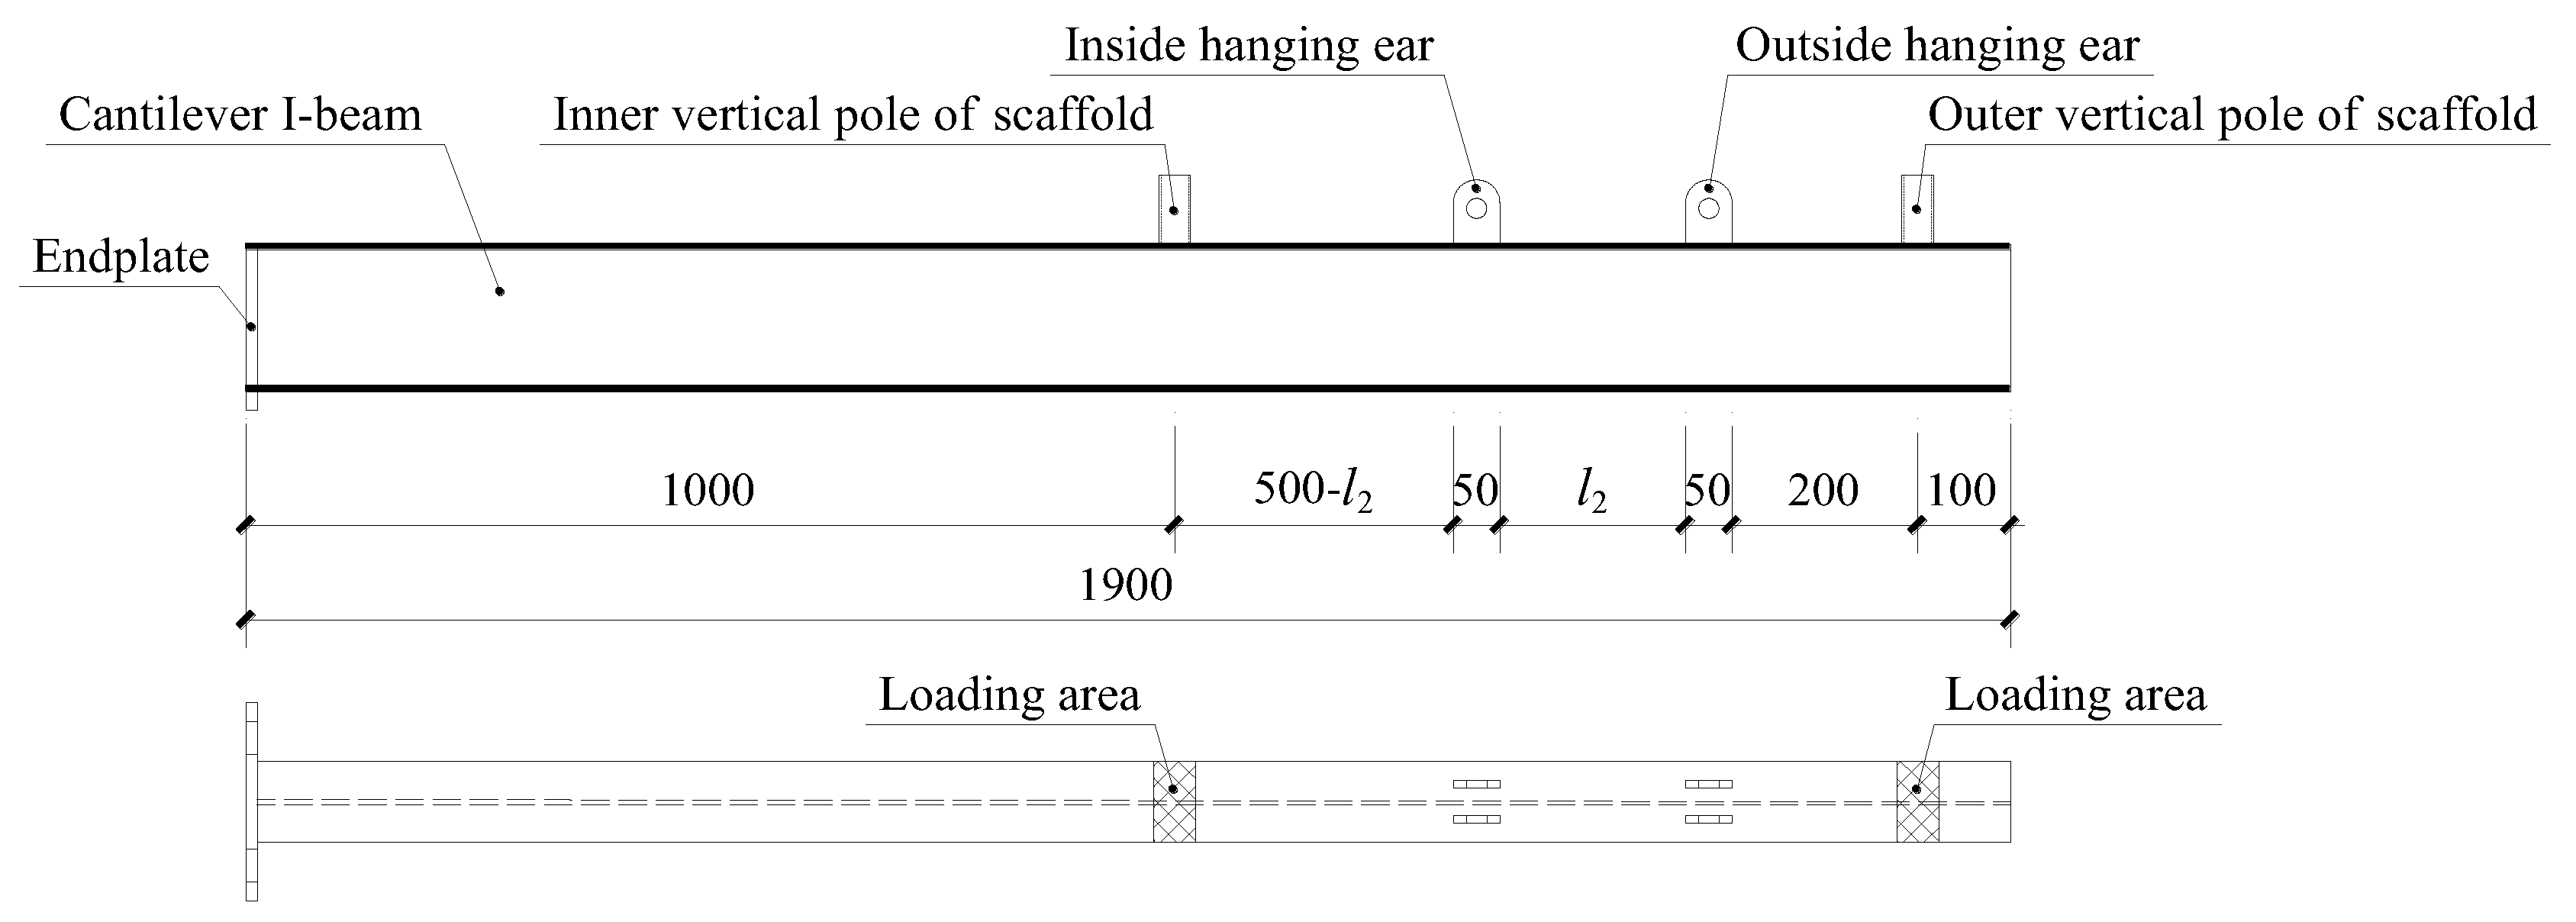
Additionally, the relative positions of the hanging ears and vertical poles on the cantilever I-beams with lengths of 1.3 m, 2.1 m, and 3.1 m also differed spatially. The specific structural details are illustrated in Figure 3, where l0 denotes the length of the cantilever beams, which corresponds to 1.3 m, 2.1 m, and 3.1 m in test groups L13, L21 and L31, respectively; l1 denotes the transverse spacing of vertical poles, inside and outside, which is set to be 800 mm in all the three groups of specimens. Figure 1 shows that the inner and outer vertical poles are integral components of the upper scaffold structure. During the flexural bearing capacity test of the lower load-bearing structure, the inner and outer vertical poles were replaced with two loading areas at the landing position on the cantilever I-beam to simulate their loading effect, as shown in Figure 3.
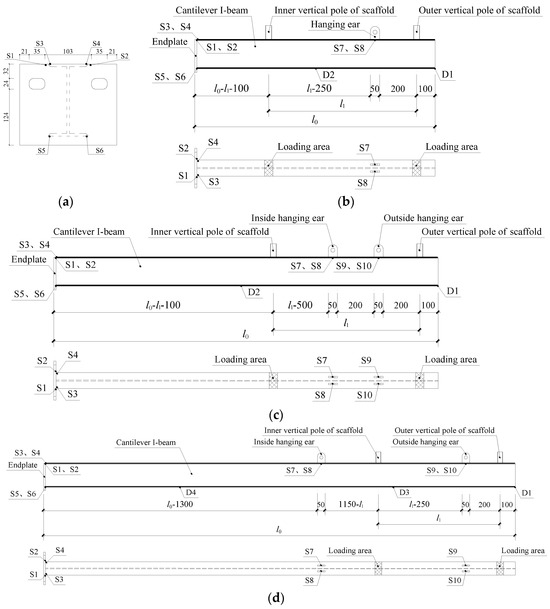
Figure 3.
The structure, dimensions, and arrangement of measurement points for the cantilever I-beams of the three test groups. (a) The end plates of L13, L21, and L31; (b) the cantilever I-beam of L13; (c) the cantilever I-beam of L21; (d) and the cantilever I-beam of L31.
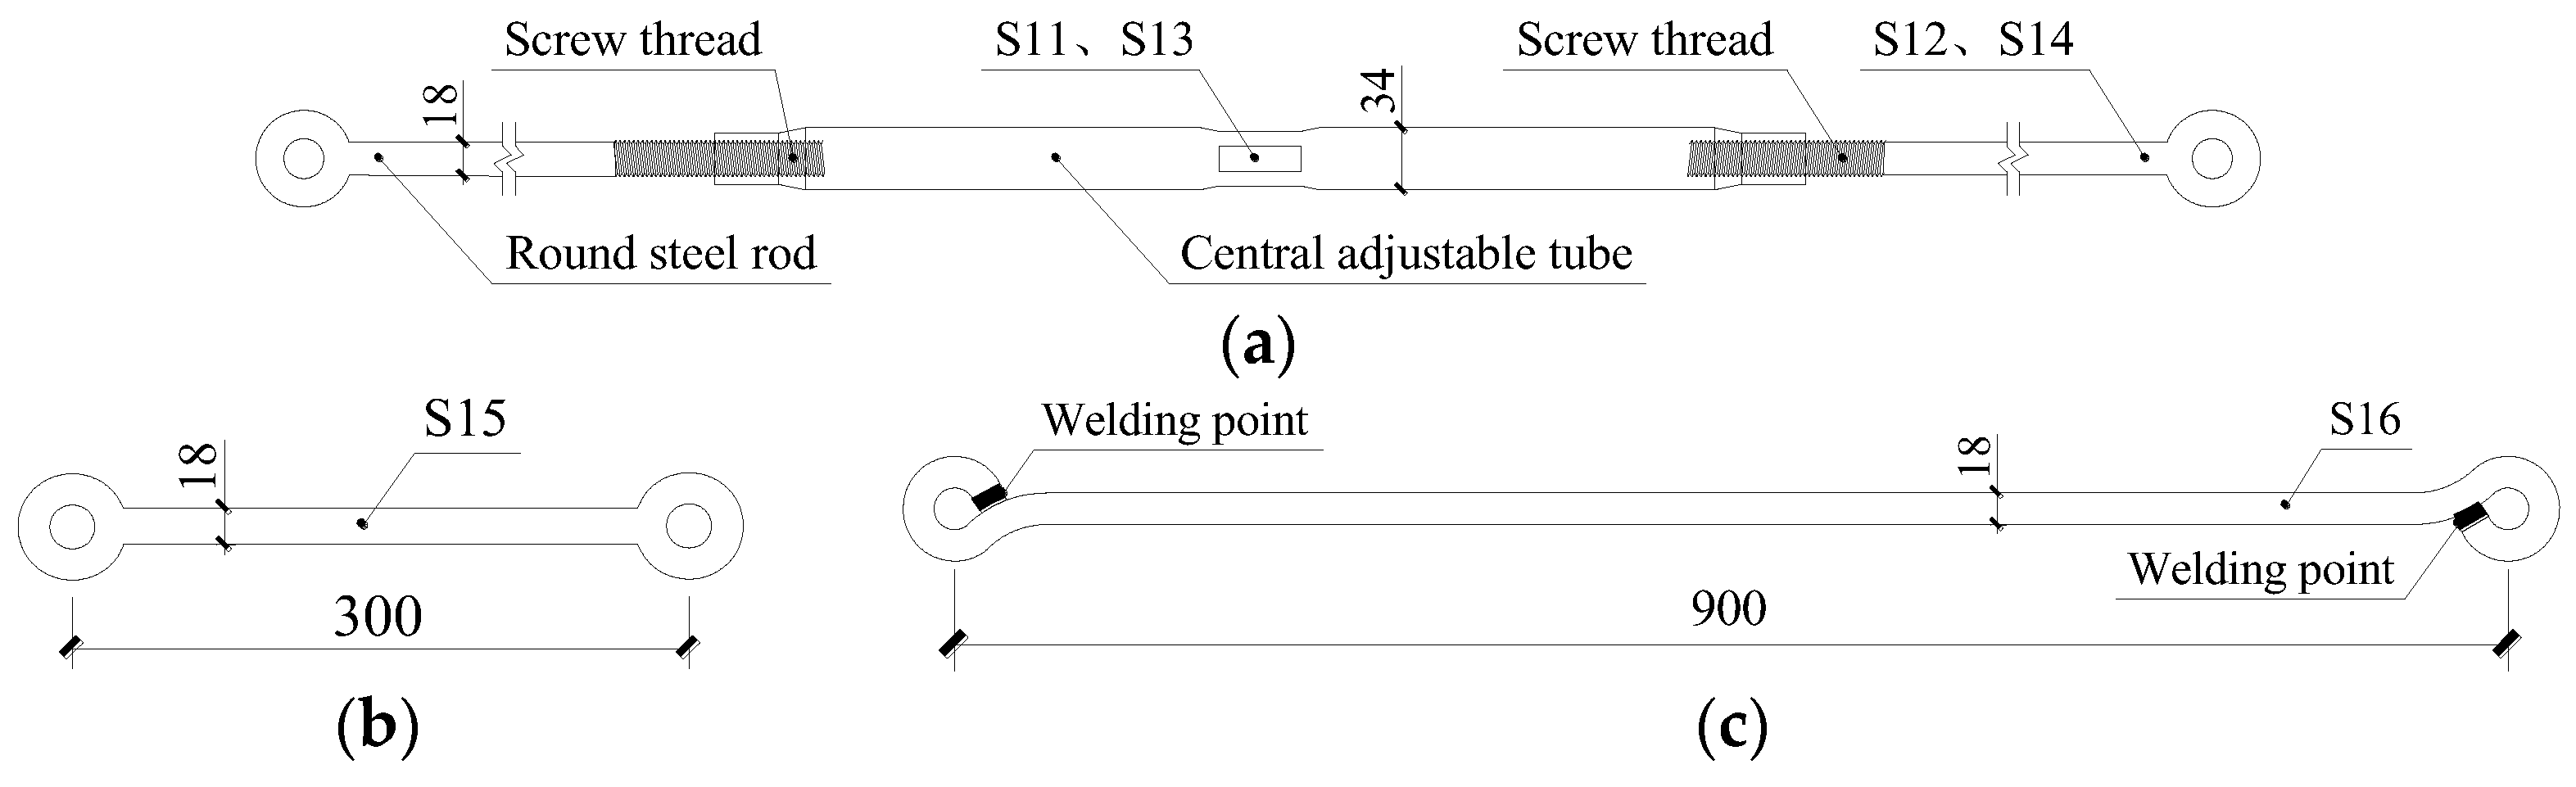
The oblique tie rod includes three components: a solid round steel rod with a hanging ring at one end and an externally threaded solid round steel rod at the other; a central adjustable steel tube with internal threads at both ends; and an extension rod with solid round steel rods and hanging rings at both ends. The structure of the oblique tie rod is illustrated in Figure 4.
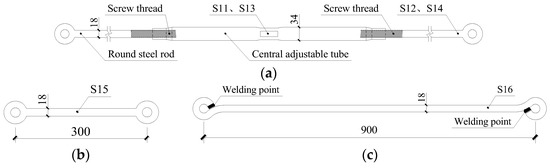
Figure 4.
Structure, dimensions, and arrangement of measurement points for the oblique tie rods of the three test groups. (a) Adjustable steel tie rod; (b) 300 mm extension rod; (c) 900 mm extension rod.
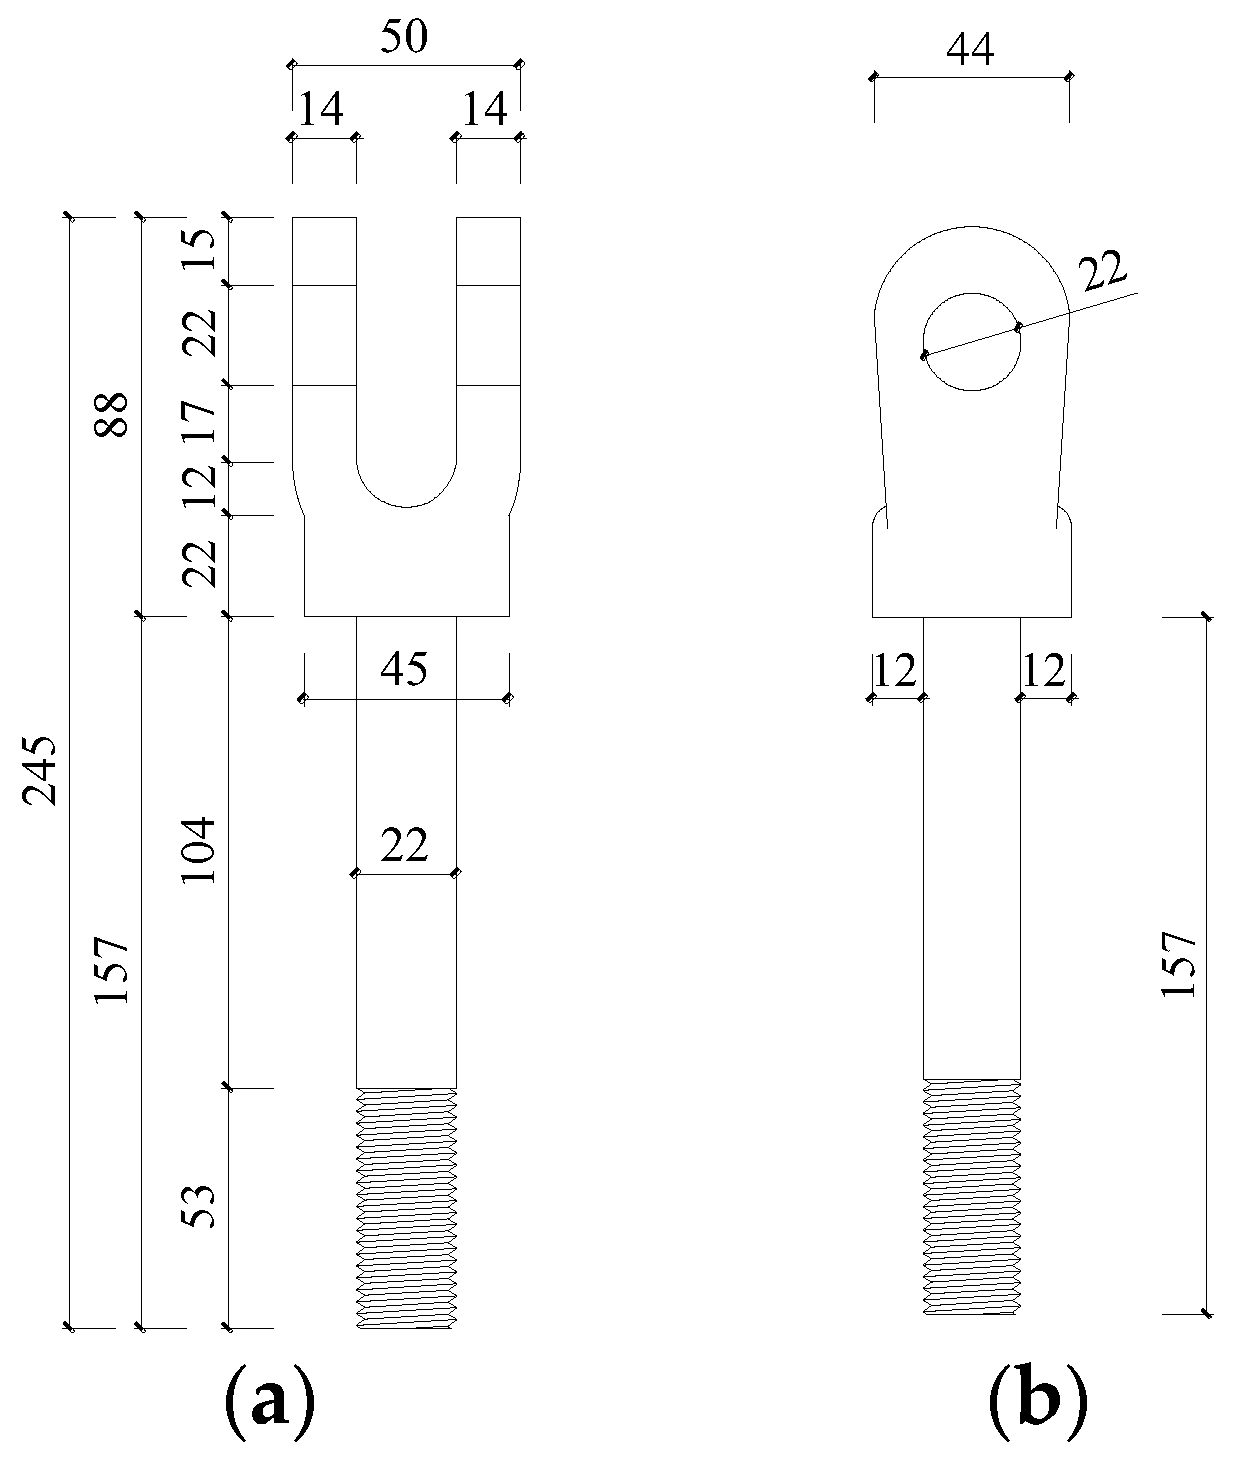
The main components of the double-ear hanging ring were two pieces of hanging ear plates and a round steel rod with a diameter of 22 mm, and its construction diagram is shown in Figure 5. The additional accessories used in the experiment included high-strength bolts (22 mm thread diameter), pins (20 mm and 30 mm diameters), and gaskets.
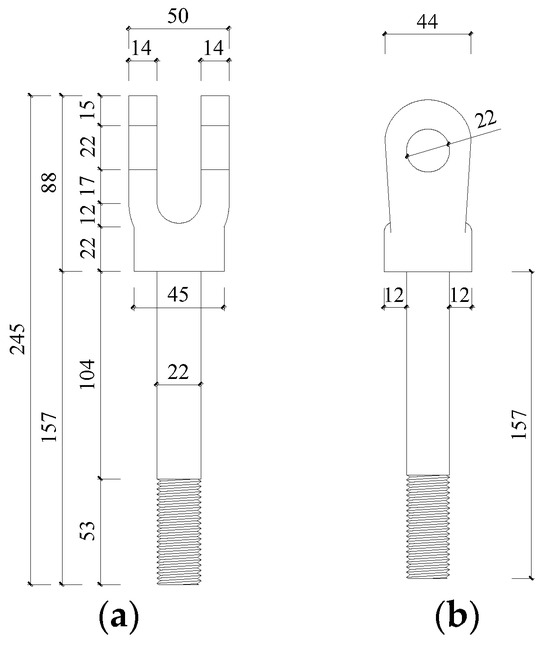
Figure 5.
A dimensional diagram of the double-ear hanging ring. (a) Front view; (b) side view.
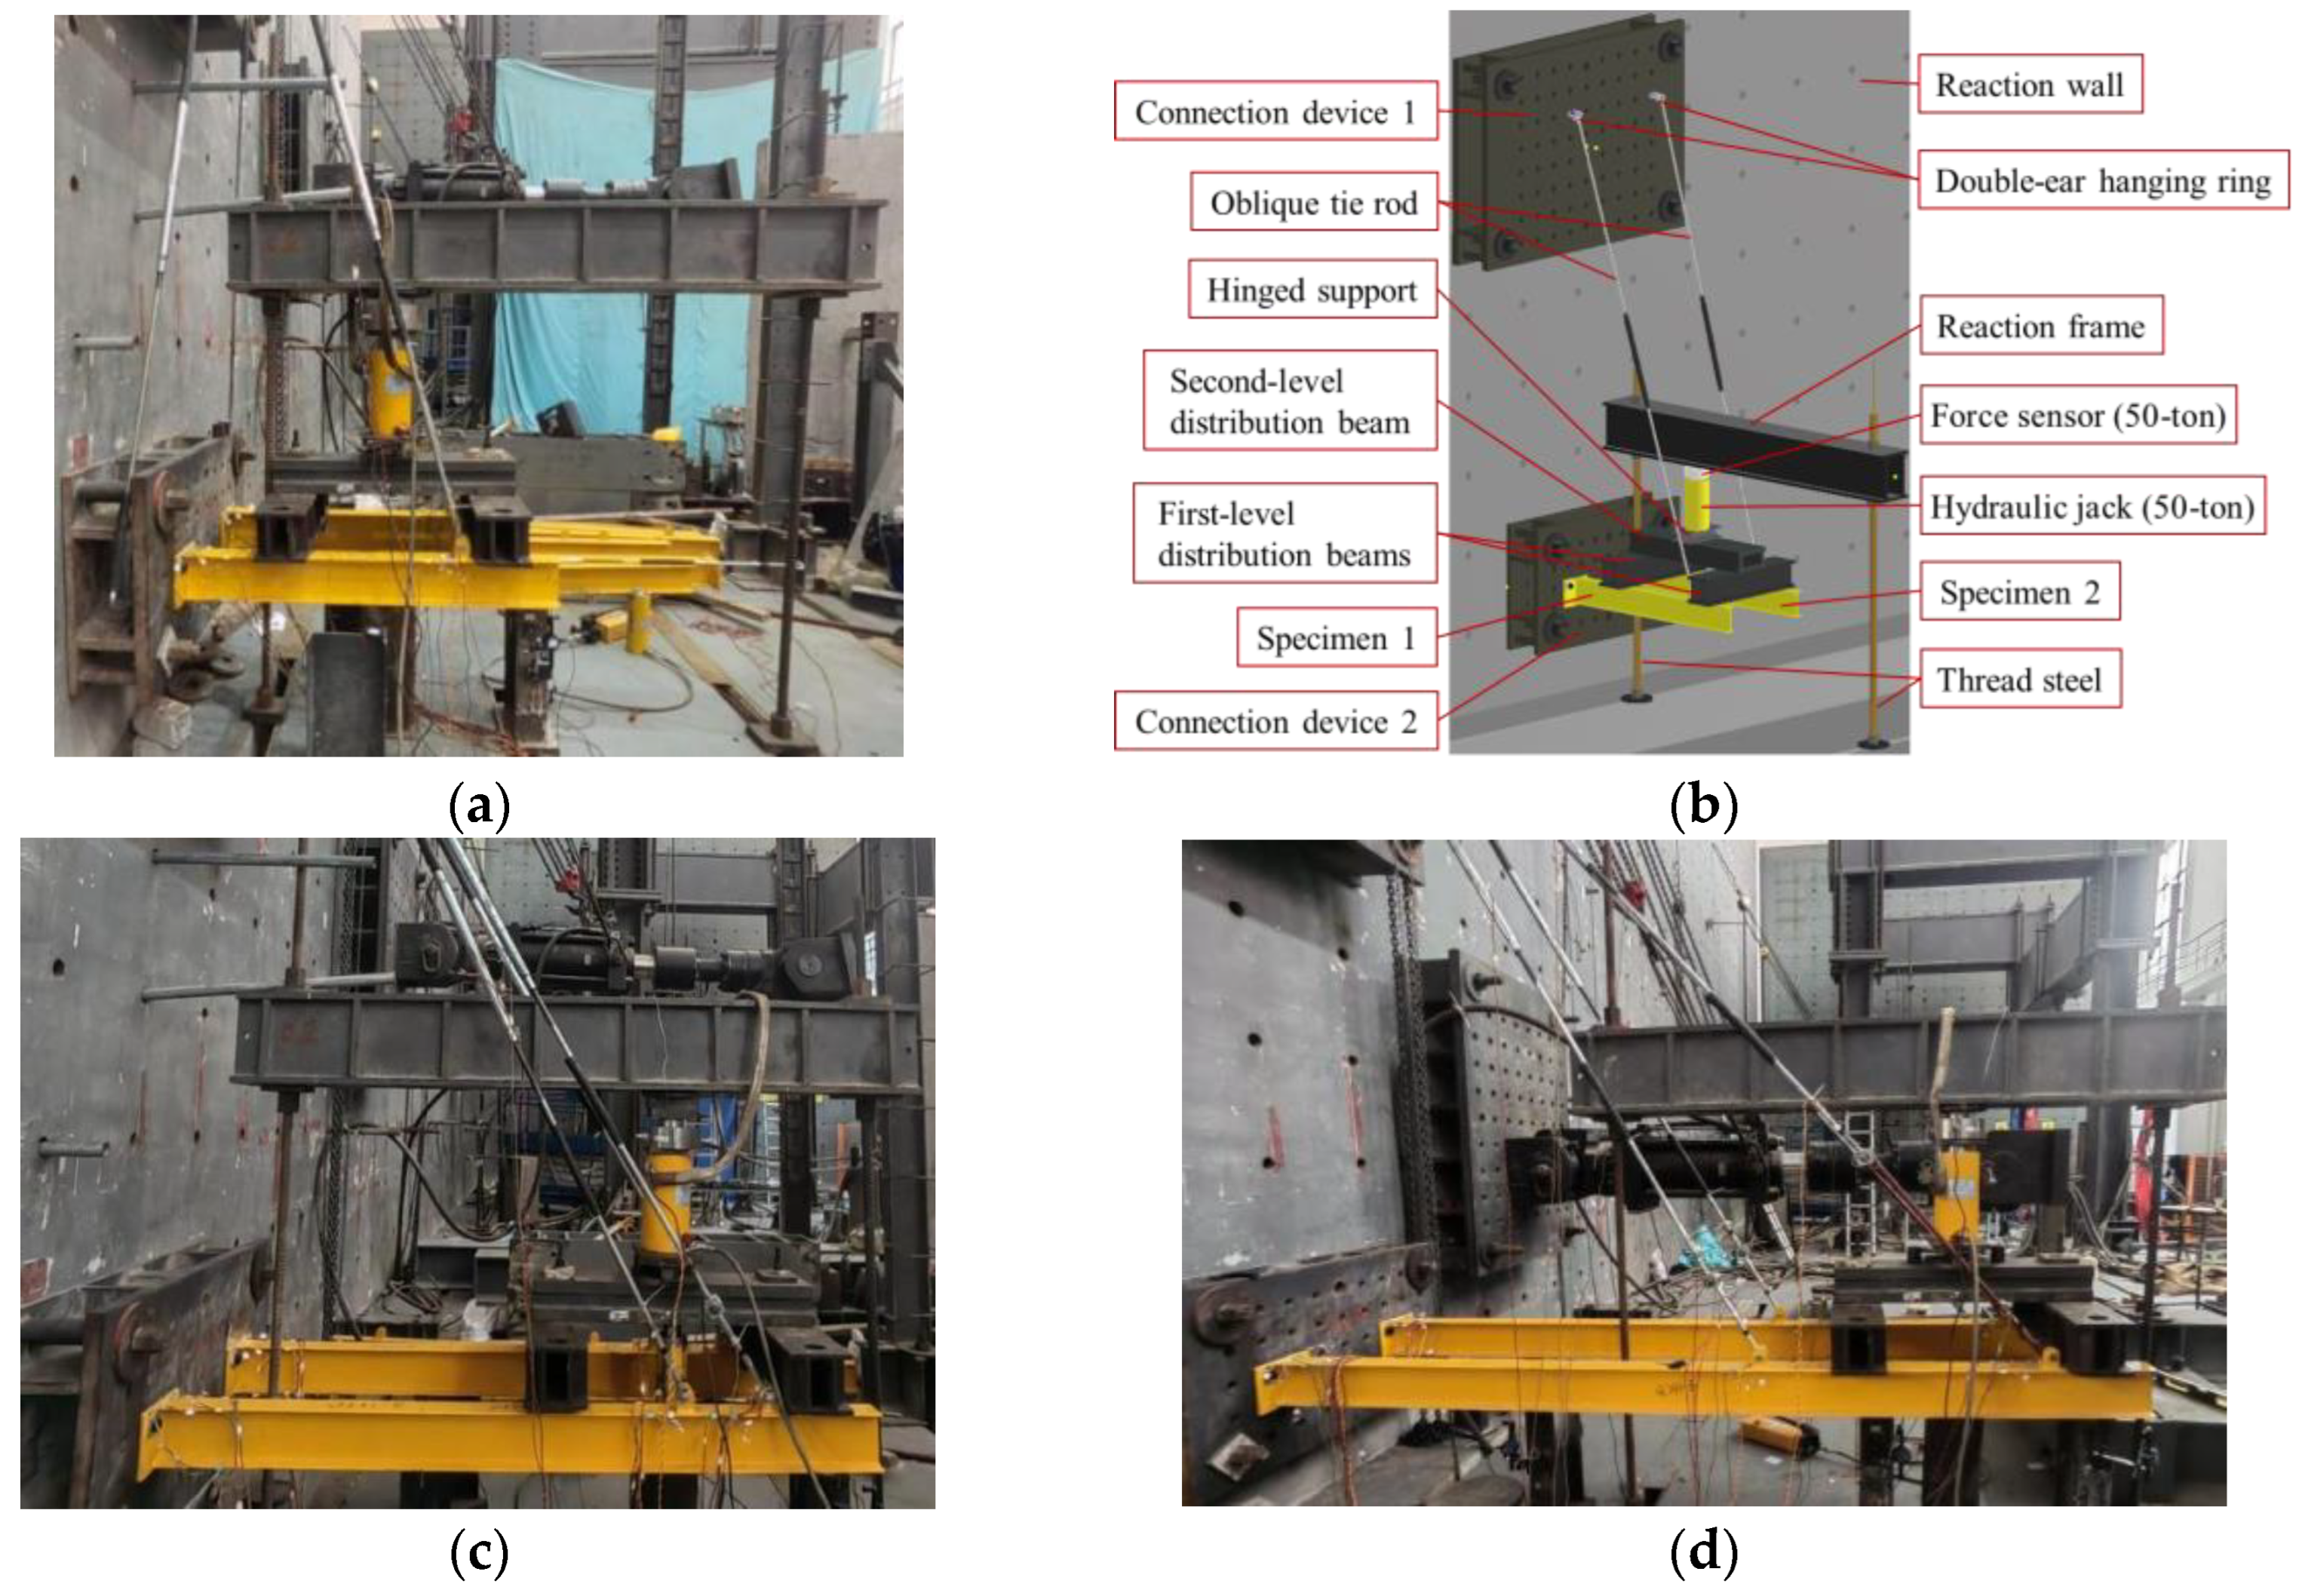
From the on-site construction diagram of the new cantilever scaffold shown in Figure 2b, it can be observed that the lower load-bearing structure of the scaffold is arranged continuously in accordance with the layout requirements of the construction site. Due to the constraints of the experimental scale, this study simultaneously tested two load-bearing structures, which closely simulated the actual conditions of the new cantilever scaffold in the construction field. Additionally, there were other considerations for selecting two load-bearing structures for concurrent loading in this experiment. Prior to the experiment, an attempt was made to load a single load-bearing structure. It was found that as the upper load increased, the deflection of the cantilever scaffold also increased, leading to some sliding of the experimental devices fixed at the upper part of the specimen. Moreover, because the tie rods and vertical poles could not be aligned in the same vertical plane and needed to be staggered, the upper fixed end of the tie rods was not directly above the cantilever I-beam, resulting in some out-of-plane deformation of the cantilever I-beam during the experiment. These factors not only led to larger experimental errors but also introduced significant safety risks. Therefore, prior to the formal experiment, improvements were made to the experimental setup. The experiment used three distribution beams to load two specimens of the same specification simultaneously, thereby minimizing the impact of these factors on the experiment and ensuring the proper loading of the specimens.
The experimental device layout for each test group is shown in Figure 6, with two specimens from each test group being loaded simultaneously. Prior to testing, the cantilever I-beam was aligned horizontally in both the width and length directions during installation. Next, the first- and second-level distribution beams were positioned. The two first-level distribution beams were placed on the inner and outer loading areas of the cantilever I-beams, oriented perpendicular to them. The second-level distribution beam was then placed atop the two first-level distribution beams, centered between the cantilever I-beams. Finally, the hinge support, jack, and force sensor were installed at the center of the second-level distribution beam.
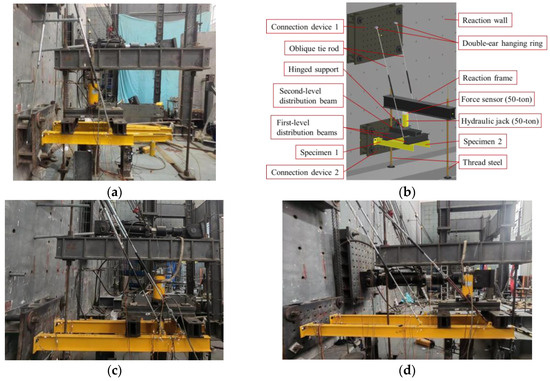
Figure 6.
Experimental device layout. (a) L13 test group; (b) 3D model visualization of the L13 test group; (c) L21 test group; (d) L31 test group.
The specimen was secured to the laboratory reaction wall by connecting devices 1 and 2. The double-ear hanging rings were affixed to connecting device 1. The end plates of the cantilever I-beams in each test group were secured to connecting device 2 using high-strength bolts. The hanging rings at one end of the tie rods in each test set were connected to the double-ear hanging rings with pins, while the rings at the other end were attached to the hanging ears on the cantilever I-beams with pins.
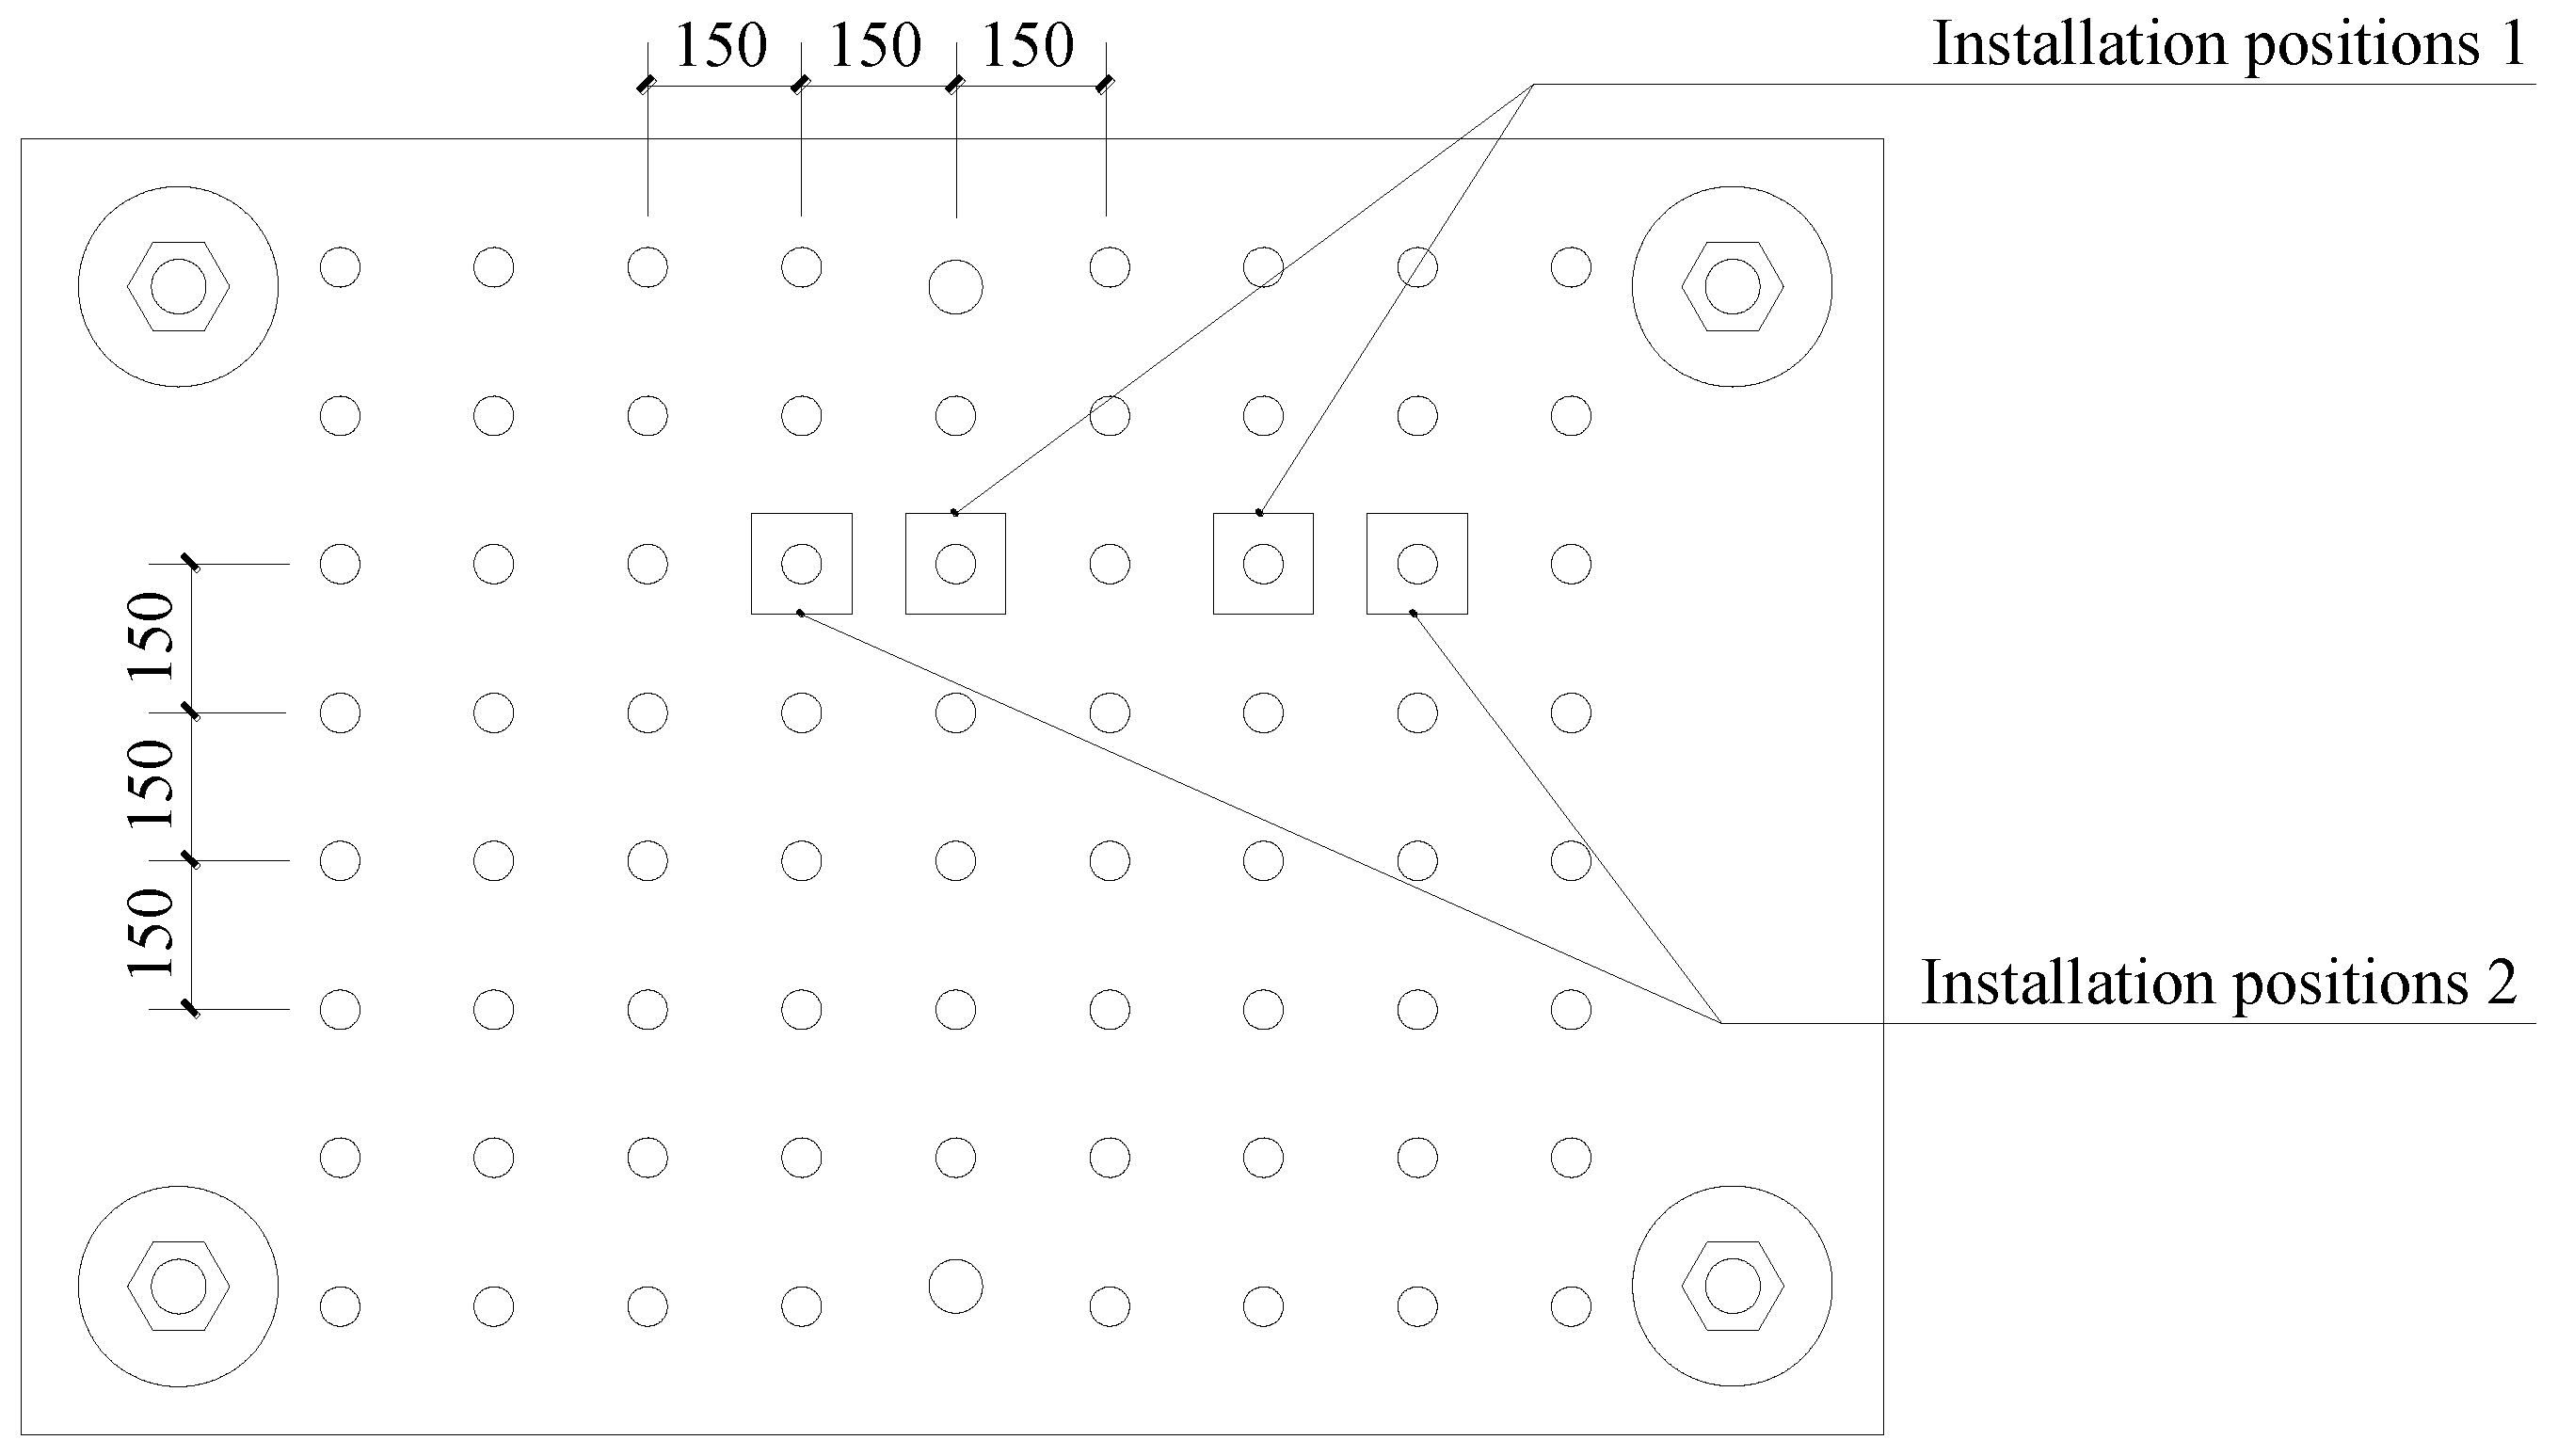
As the inner and outer vertical poles were erected on the load-bearing frame, the attachment points at the upper ends of the tie rods were typically staggered relative to the vertical poles. As shown in Figure 7, installation position 1 corresponds to the double-ear hanging rings of the L13 test group and the double-ear hanging rings at the upper ends of the outer tie rods in the L21 and L31 test groups, while installation position 2 corresponds to the double-ear hanging rings at the upper ends of the inner tie rods in the L21 and L31 test groups. The distance from the double-ear hanging ring installation position to the end plate installation position was 3 m, approximately corresponding to the height of a single building floor.
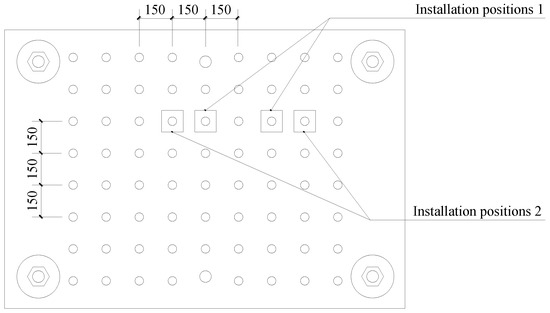
Figure 7.
Installation positions of the double-ear hanging rings for each test group on connection device 1.
Each specimen in test group L13 was equipped with a single tie rod directly connected to the hanging ear on the I-beam. Each specimen in test group L21 was equipped with two tie rods: the inner tie rod was connected directly to the inside hanging ear, while the outer tie rod was connected to the outside hanging ear via a 300 mm long extension rod. Each specimen in test group L31 was equipped with two tie rods: the inner tie rods connected to the inside hanging ear via a 300 mm long extension rod, while the outer tie rods connected to the outside hanging ear via a 900 mm long extension rod. The tie rods and extension rods were joined using pins.
Before testing, the material properties of the flanges, end plates, and tie rods were individually evaluated using three specimens for each component type. The tensile test results for the cantilever I-beam flange and end plate revealed an average yield strength of 323.3 MPa and an average ultimate strength of 452.7 MPa. However, the stress–strain curves of the tie rods did not show a distinct yielding plateau, with an average ultimate strength of 548.1 MPa.
2.2. Experimental Loading System
FEAs were performed prior to the experiments to estimate the specimens’ ultimate flexural bearing capacity. Table 1 lists the loading stages for the three specimen groups, with values representing the loads applied by the hydraulic jack.

Table 1.
Load at graded loading of the specimens for each test group (unit: kN).
Prior to each set of tests, preloading was conducted to assess the loading conditions of the two specimens. The tie rods were adjusted to ensure both specimens experienced identical loading conditions. Thus, during the experiment, the loading conditions for both specimens were nearly identical, and it was uncommon for one specimen to fail while the other did not. If one specimen failed, no further load could be applied, and the test was deemed a failure. The specimens were then re-prepared for another round of testing. The experimental load was applied using a manual hydraulic pump. The specimens were preloaded to minimize the effect of mounting voids on the experimental results. The formal loading process followed a force-controlled staged procedure. When yielding at strain measurement points or bending of the double-ear hanging rings occurred during the experiment, the applied load was reduced to 5 kN at each subsequent stage until specimen failure. The load application rate at the jack was controlled to 5 ± 1 kN per minute during both the preloading and formal loading phases of the experiments.
2.3. Arrangement of Measurement Points
Figure 3 and Figure 4 illustrate the arrangement of the displacement meters and strain gauges for each test group. Displacement meters, labeled D1 through D4, were installed below the lower flange of the cantilever I-beam in each test group. Specifically, displacement meter D1 was positioned at the cantilever end of the I-beam, D2 at the mid-span, D3 between the inner and outer hanging ears, and D4 between the inner hanging ear and the end plate.
Strain gauges, labeled S1 to S8, were affixed to the cantilever I-beams of the specimens in each test group. S1 and S2 were mounted on the end plate, near the left and right sides of the upper flange. S3 and S4 were positioned on the left and right sides of the upper surface of the upper flange, close to the end plate. S5 and S6 were affixed to the left and right sides of the lower surface of the lower flange, near the end plate. S7 to S10 were positioned on the left and right sides of the lower surface of the upper flange, close to the locations of the hanging ears.
Strain gauges S11 to S14 were affixed to the oblique tie rods in each test group. Specifically, S11 and S13 were mounted at the midpoint of the central adjustable rod, while S12 and S14 were placed on the round steel rod near the end of its hanging ring. Additionally, S15 was affixed at the midpoint of the 300 mm extension rod, and S16 was mounted on the 900 mm extension rod near the end of its hanging ring.
2.4. Experimental Observations
Each test group comprised two specimens, resulting in a total of four loading areas. The load applied by the hydraulic jack was referred to as the total load, while the load applied to the loading areas was referred to as the single-point load.
During testing for test group L13, at the fourth loading stage (with a total load of 93.6 kN and a single-point load of 23.4 kN), the double-ear hanging rings began to bend downward, which corresponds to the normal serviceability limit state of the specimens, as shown in Figure 8a. In the subsequent loading stages, the total load was reduced to 5 kN. When the total load reached 143.6 kN, the center of the end plate of the cantilever I-beam exhibited outward bending in the transverse direction, as shown in Figure 8b. As the loading continued, no additional significant phenomena occurred other than increased bending deformation of the double-ear hanging rings and the end plates. The loading process continued until the total load reached 263.6 kN (with a single-point load of 65.9 kN), at which point the double-ear hanging rings completely failed, marking the load-bearing capacity limit state of the specimen. The specimens could no longer sustain the load, marking the end of the experiment.
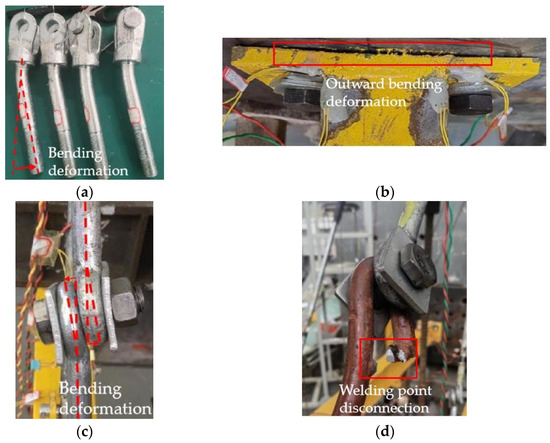
Figure 8.
Failure diagrams for each test group. (a) The force bending of the double-ear hanging ring in test group L13; (b) the force bending of the end plate of test group L13; (c) the force bending of the hanging ring connecting the outer tie rod to the extension rod in test group L21; (d) disconnection at the welding point on the hanging ring of the extension rod of test group L31.
During testing for test group L21, at the fifth loading stage (with a total load of 123.6 kN and a single-point load of 30.9 kN), the double-ear hanging rings at the upper end of the outer tie rods began to bend downward, which corresponds to the normal serviceability limit state of the specimens, as shown in Figure 8a. When the total load reached 183.6 kN, the double-ear hanging rings at the upper end of the inner tie rods also began to bend downward. Simultaneously, the hanging rings connecting the outer tie rods to the extension rods deformed, as shown in Figure 8c. The loading process continued until the total load reached 288.6 kN (with a single-point load of 72.15 kN), at which point the double-ear hanging rings completely failed, marking the load-bearing capacity limit state of the specimen. The specimens could no longer sustain the load, marking the end of the experiment.
During testing for test group L31, at the fifth loading stage (with a total load of 83.6 kN and a single-point load of 20.9 kN), the double-ear hanging rings began to bend downward, which corresponds to the normal serviceability limit state of the specimens, as shown in Figure 8a. When the total load reached 123.6 kN, the hanging rings where the tie rods connected to the extension rods experienced bending deformation. At a total load of 178.6 kN (with a single-point load of 44.65 kN), a welding point at the hanging rings of the 900 mm long extension rods disconnected, as shown in Figure 8d. This marked the load-bearing capacity limit state of the specimen. The specimens could no longer sustain the load, marking the end of the experiment.
The failure modes of the specimens from the three test groups reveal that the double-ear hanging rings and extension rods are the weakest components in the lower load-bearing structures of pull-up cantilever scaffolds with adjustable steel tie rods. Specifically, the bending of the double-ear hanging rings, as shown in Figure 8a, results in increased vertical displacement of the cantilever I-beams, thereby elevating the stress at both the fixed end of the I-beam and the double-ear hanging ring attached to the wall. This creates stress concentrations, which, in turn, reduce the ultimate load-bearing capacity of the lower load-bearing structures under the serviceability limit state. During testing, the welded joint of the 900 mm extension rod failed, as shown in Figure 8d, resulting in a brittle failure that poses a considerable risk to the safe use of this novel cantilever scaffold. Furthermore, during testing, the 300 mm extension rod exhibited bending at the end ring, as shown in Figure 8c, which caused stress concentration at the connection between the tie rod and the extension rod, thereby diminishing the load-bearing capacity of the tie rods.
2.5. Stress Analysis
Based on data from the material property tests, the average yield strength of the specimens was 323.3 MPa, with similar stress trends observed across all test groups. Within the same test group, the highest stresses were recorded at the end plate measurement points, followed by those on the oblique tie rods, with the lowest stresses observed near the hanging ear locations. Since the specimens in these three test groups had different structural arrangements, primarily differing in the positions of the hanging ears (i.e., the connection points of the tie rods to the cantilever I-beams) and the vertical poles, this led to differences in the distribution of load on the end plates and tie rods during the load-bearing process. For test groups L21 and L31, the stresses at the outer tie rods consistently exceeded those at the inner tie rods. The highest stresses among measurement points S1 to S6 on the end plates occurred at S1 and S2. Among measurement points S11 to S16 for each test group, the highest stresses were observed at points S13 and S14 on the 18 mm round steel rods of the outer tie rods. The maximum stress data from the end plate and tie rod measurement points of the two specimens in each test group were used to construct the load–stress diagrams presented in Figure 9.
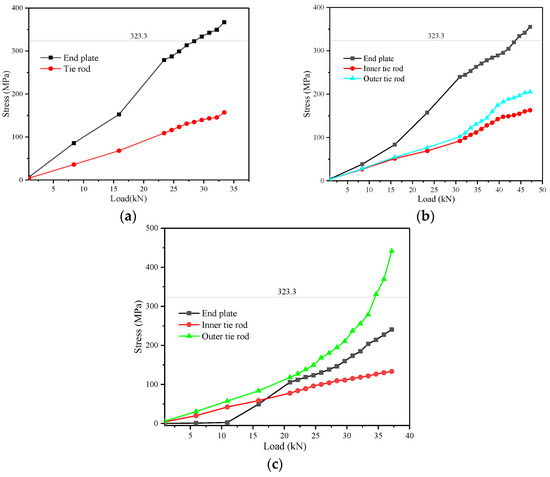
Figure 9.
Load–stress diagrams representing the maximum stress measurement points on the end plates and the tie rods for each test group. (a) Test group L13; (b) test group L21; (c) test group L31.
At the fixed ends of each test group, the cantilever I-beams were welded to the end plates, which provided effective restraints. As shown in Figure 9, in test groups L13 and L21 the end plates of the cantilever I-beams yielded first, with yield loads of 29.65 kN and 44.65 kN, respectively. In test group L31, the specimens yielded first at the outer tie rods with a yield load of 35.9 kN. The load–stress curves at the maximum stress measurement points of the end plates for all three test groups are shown in Figure 10a. The maximum stress at the end plates decreased as the length of the cantilever I-beams increased under equal loading conditions.
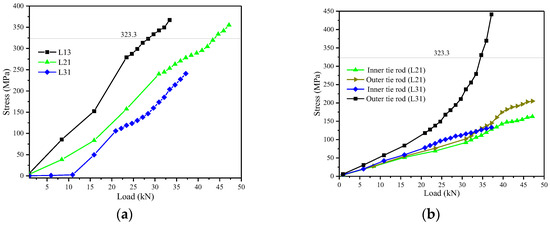
Figure 10.
Comparison of load–stress curves. (a) Load–stress curves for the maximum stress measurement points at the end plates of the cantilever I-beams for each test group; (b) load–stress curves for the maximum stress measurement points at the tie rods for test groups L21 and L31.
A comparison of the load–stress curves at the maximum stress measurement points for the inner and outer tie rods in test groups L21 and L31 is shown in Figure 10b. The maximum stresses of the tie rods gradually increased with increasing length of the cantilever I-beams under the same applied load. Moreover, the stresses of the outer tie rods always exceeded those of the inner tie rods. The spacing between the lower suspension points of the inner and outer tie rods, which was also the spacing between the inside and outside hanging ears, was greater in test group L31 than in test group L21, resulting in a more noticeable difference in the stresses of the inner and outer tie rods between the two test groups.
Analysis of the stress data at the cantilever I-beam ends and tie rods revealed that with longer cantilever I-beams, the load borne by the cantilever I-beam ends decreased, while the load needed to yield the ends increased. Concurrently, the load shared by the tie rods increased, and the stress at the tie rods increased when the specimens yielded. Throughout the loading process, the stresses at the outer tie rods consistently exceeded those at the inner tie rods. Additionally, as the distance between the inside and outside hanging ears increased, the stress difference between the inner and outer tie rods also increased.
2.6. Displacement Analysis
The maximum displacement was recorded at the D1 displacement meter positioned at the cantilever end of the cantilever I-beam among the four displacement meters (D1–D4). As the applied load increased during the test, the bending deformation of the double-ear hanging ring caused a significant increase in the vertical displacement of the cantilever I-beam. Therefore, the vertical displacement analysis for each test group utilized data from the D1 displacement meter, focusing on measurements recorded prior to the bending deformation of the double-ear hanging rings.
The curves showing the relationship between the maximum displacement and applied load for the two specimens in each test group are presented in Figure 11a. As shown in Figure 11a, the vertical displacement at the cantilever end progressively increased with increasing cantilever I-beam length across the test groups, with maximum displacements of 4.31 mm, 9.03 mm, and 14.65 mm for test groups L13, L21, and L31, respectively.
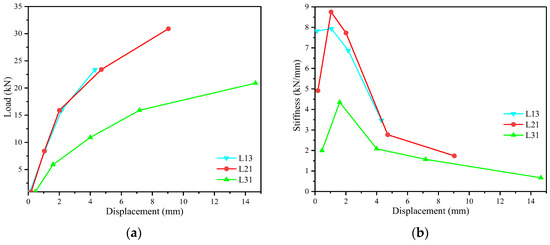
Figure 11.
The relationship diagram of the displacement, load, and stiffness of the cantilever end of the cantilevered I-beam in each test group. (a) Displacement–load curves; (b) displacement–stiffness curves.
The stiffness degradation curve was measured using secant stiffness. Figure 11b illustrates the relationship between the maximum displacement and secant stiffness. The specimen in the L13 test group initially maintained a relatively stable stiffness of approximately 7.8 kN/mm, which then decreased to 5.42 kN/mm before the double-ear hanging ring experienced bending deformation. In the L21 and L31 test groups, the stiffness of the specimens initially increased, reaching 8.077 kN/mm and 3.69 kN/mm, respectively. Subsequently, the stiffness gradually decreased, and before the double-ear hanging ring underwent bending deformation, the stiffness reduced to 3.42 kN/mm and 1.43 kN/mm, respectively.
3. Finite Element Analysis
3.1. Finite Element Modeling
The load-bearing structure of the pull-up cantilever scaffold with adjustable steel tie rods is analyzed using ABAQUS FEA software. In the finite element model, the analysis step was selected as “Static, General,” and the geometric nonlinearity option (NLGEOM = ON) was enabled to account for large deformation effects in the structure. Figure 12 shows the finite element model (FEM) for the L13 test group.
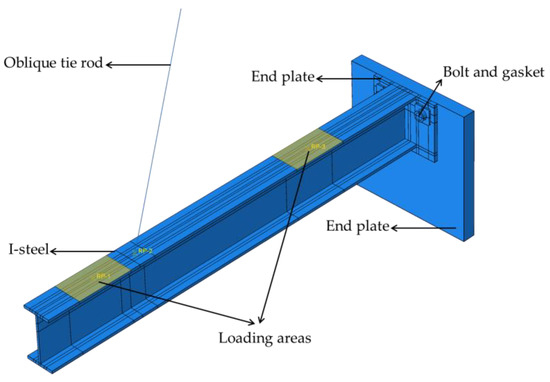
Figure 12.
FEM for the L13 test group.
3.1.1. Material Properties
Based on the results of the material property test, the specimen’s yield strength is 323.3 MPa, its Poisson’s ratio is 0.3, the elastic modulus is 206 GPa, and the mass density of the steel is 7850 kN/m³. The material model selected was an isotropic hardening elasto-plastic model. The stress–strain relationship of the steel follows a bilinear model, as shown in Figure 13.
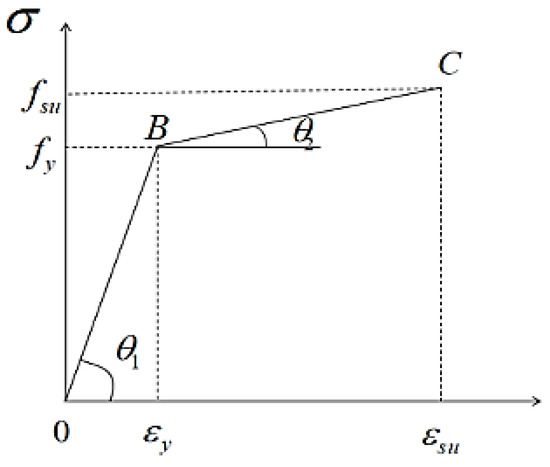
Figure 13.
Stress–strain curve of Q235 steel.
3.1.2. Element Selection
The main components of the FEM include I-beams, end plates, tie rods, double-ear hanging rings, bolts, and gaskets. The I-beams, end plates, bolts, and gaskets were modeled using the solid element C3D8R. The tie rods, subjected only to axial forces, were modeled using the truss element T3D2. The double-ear hanging rings, subjected to a combination of downward shear and outward tensile forces, were modeled using the beam element B31. The reaction wall, which is primarily used to restrain the end plate without participating in stress or displacement analysis, was modeled as a rigid body.
3.1.3. Interaction, Contact, and Boundary Condition
The components of the FEMs were assembled to replicate the experimental setup. Tie constraints were applied between the I-beams and the end plates, as well as between the bolts and the reaction wall. The interactions between the end plates, bolts, gaskets, and reaction wall were defined by face-to-face contact constraints, with “hard contact” in the normal direction and a “penalty” function friction model in the tangential direction, with a friction coefficient of 0.4. The constraints between the hanging rings on the tie rods and the hanging ears of the I-beams, as well as between the hanging rings on the tie rods and the double-ear hanging rings on the reaction wall, were modeled as hinged connections (MPC-pin). The reaction wall and the double-ear hanging rings on it are fully fixed as shown in Figure 14.

Figure 14.
Load application and boundary condition diagram.
3.1.4. Mesh Division
The FEM utilized a structured adaptive meshing technique. Based on the proportions of the overall model size, the global mesh size was set to 25 mm, while a local mesh size of 2 mm was applied to critical areas.
3.1.5. Load Application
The load application method in the FEM followed the same methodology as in the experiments, employing a force-controlled staged loading approach. The magnitudes of the loads at each stage were identical to those applied in the experiments, as specified in Table 1. Two loading areas were coupled at their midpoints, referred to as coupling points. Downward concentrated forces were subsequently applied to these coupling points, as shown in Figure 14. The simulated loading was terminated when the FEMs for each test group reached their ultimate flexural bearing capacity under normal use conditions, corresponding to the bending deformation of the double-ear hanging rings observed in the experiments.
3.2. Finite Element Analysis Results
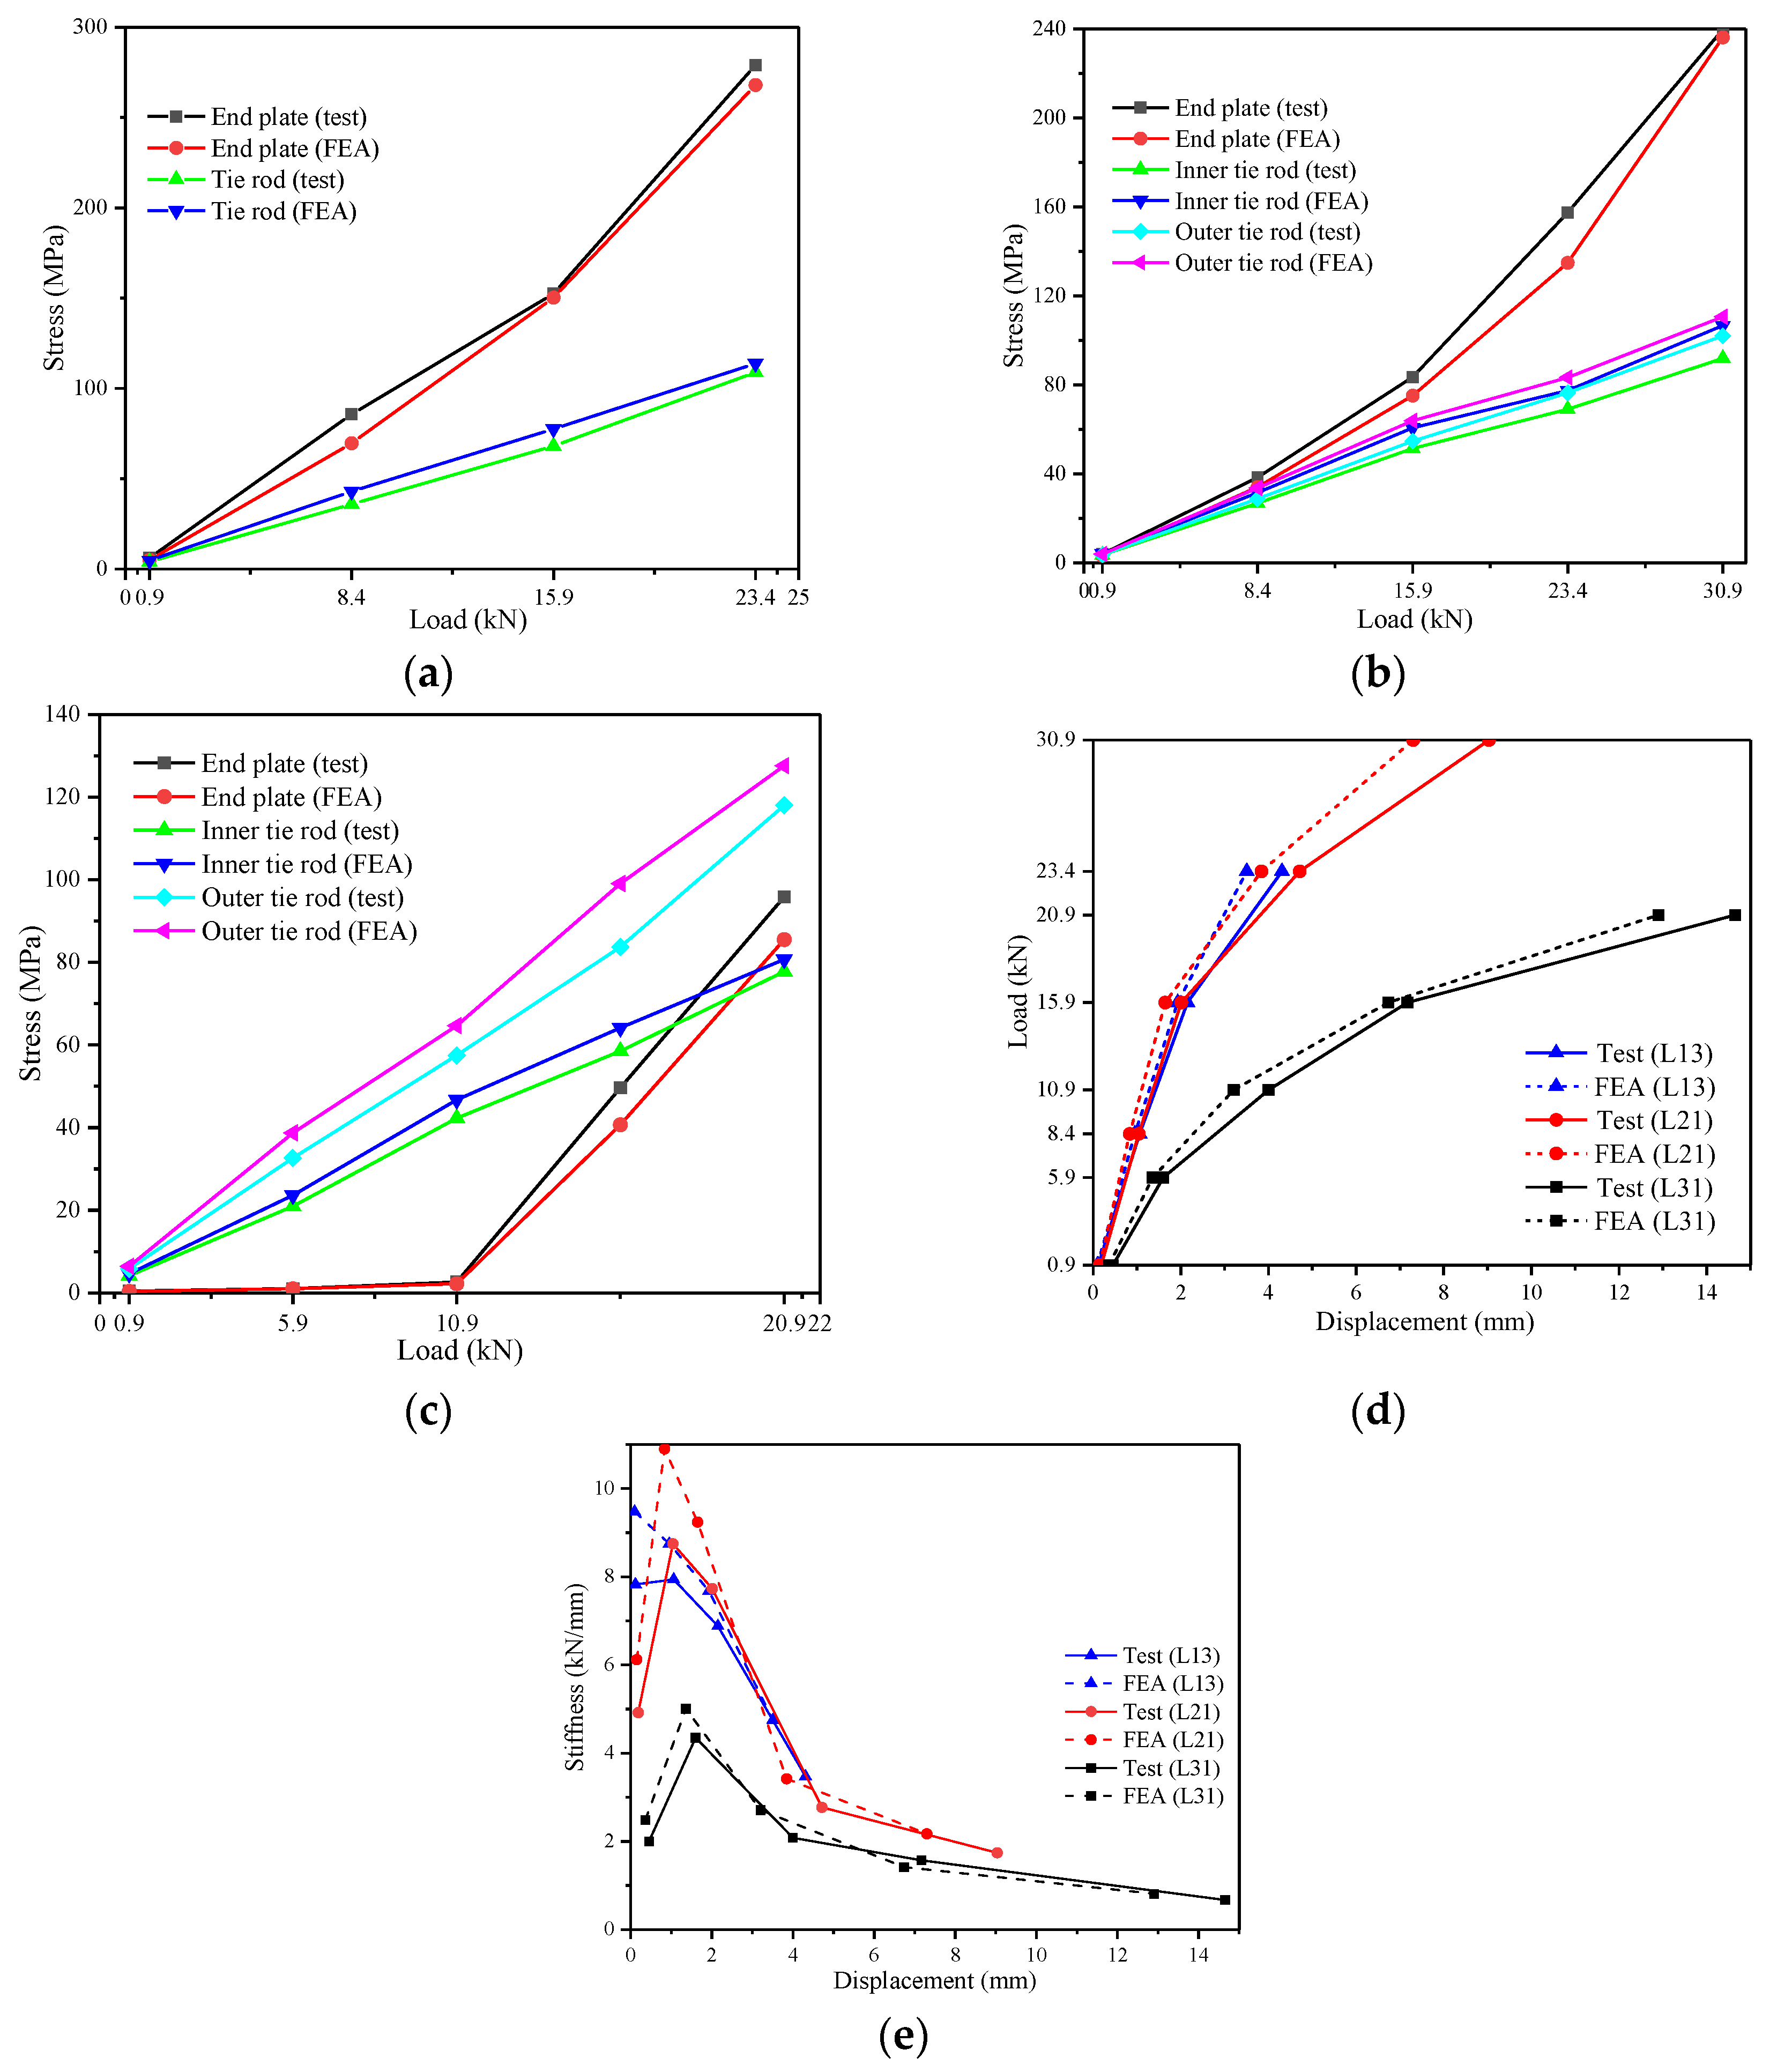
A comparative analysis between the FEM data and experimental results is presented in this section. To ensure consistency, the FEM maximum stress and displacement values were evaluated at locations corresponding to the maximum strain and displacement measurement points in the experimental model. The experimental results indicated that the maximum stress on the cantilever I-beams for each test group occurred on the end plates near the left and right sides of the upper flange, the maximum stress on the inner and outer tie rods occurred on the 18 mm round tie rods, and the maximum vertical displacement for each test group was observed at the cantilever end of the cantilever I-beams.
The load–stress and load–displacement comparison curves for the experiment and FEA were derived from data collected before the bending deformation of the double-ear hanging rings in each test group, as shown in Figure 15. When the double-ear hanging rings began to bend in each test group, the single-point loads on the loading areas were 23.40 kN, 30.90 kN, and 20.90 kN for test groups L13, L21, and L31, respectively.
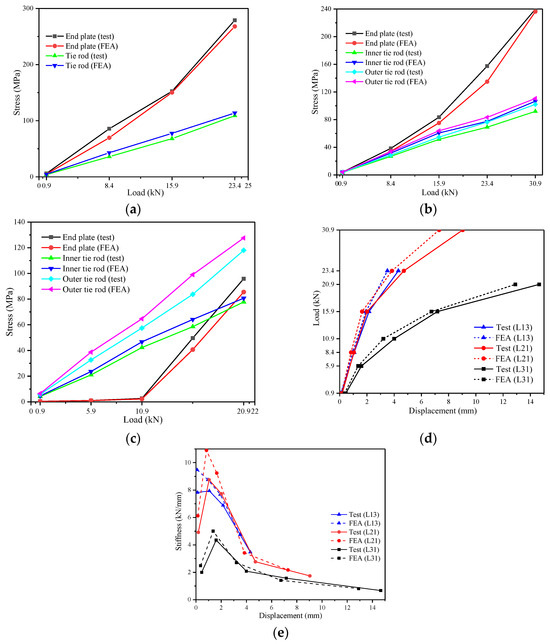
Figure 15.
Comparison of test results and FEA results for each test group. (a) L13 stress comparison; (b) L21 stress comparison; (c) L31 stress comparison; (d) L13, L21, and L31 displacement comparison; (e) L13, L21, and L31 secant stiffness comparison.
At this stage, the maximum stress values on the end plates and tie rods, the maximum displacement values at the cantilever ends, and the secant stiffness were compared, as summarized in Table 2. The stress values are expressed in MPa, and the displacement values are expressed in mm; the secant stiffness values are expressed in kN/mm.
Table 2.
Comparison of the stress and displacement results between the experimental and FEA results for each test group.
3.3. Error Analysis
Figure 15a–c and Table 2 indicate that the stresses at the end plates of the test models slightly exceeded those predicted by the FEMs, while the stresses at the tie rods of the test models were slightly lower. The maximum error in the stress comparison was 10.76%. Similarly, Figure 15d and Table 2 show that the vertical displacements of the test models were marginally larger than those of the FEMs, with a maximum displacement error of 19.17%. Figure 15e and Table 2 indicate that the stiffness variation in the test models in each group closely corresponded to that of the FEMs throughout the entire test process (before the bending deformation of the double-ear hanging rings). However, during the early loading stage, a noticeable discrepancy was observed between the two.
The primary reason for the differences between the FEA results and the experimental results is the idealization of components and interactions in the FEMs, which neglects certain influencing factors present in the actual test models. For example, bending deformations of the double-ear hanging rings were observed during the tests, and relative displacements might have occurred between the central adjustable steel tie rods and the round steel rods. Additionally, localized stresses on the hanging ears and hanging rings, as well as gaps in component contact, might have been present during the tests.
These factors contributed to an increase in the displacement at the cantilever ends of the cantilever I-beams. The increase in vertical displacement at the cantilever ends resulted in higher stresses at the end plates of the cantilever I-beams. The increased stress at the end plates indicated that the load carried by the fixed ends of the cantilever I-beams increased, thereby reducing the load carried by the tie rods and lowering the stress at the tie rods. This explains why the experimental results revealed higher stresses at the end plates, lower stresses at the tie rods, and greater vertical displacements at the cantilever ends than did the FEA results.
Despite some differences between the experimental data and the FEA results, the data trends remained consistent, with relatively small errors observed. Therefore, the load application, boundary conditions, and constraints on the interactions between different components in the FEM were considered reasonable. This demonstrates that the FEA closely aligns with the experimental process, ensuring high reliability and accuracy.
4. Flexural Bearing Capacity Analysis
The specimens with three different cantilever lengths in the experimental section cannot be directly compared due to the varying arrangements of tie rods and hanging ears. Therefore, in this section, finite element simulations were conducted using Abaqus software (version 2023) for cantilever I-beams with ten distinct lengths, ranging from 1.3 m to 3.1 m, commonly used in practical engineering. The simulations aimed to determine the maximum flexural bearing capacity of the entire structure at the point of yield. Additionally, a comparative analysis of relevant parameters, such as cantilever length, vertical pole spacing, and hanging ear spacing, was performed to assess their impact on the flexural bearing capacity of the load-bearing structure. This also provides valuable insights for the research and enhancement of similar cantilever scaffolds.
Five types of inner and outer vertical pole spacings are commonly used: 700 mm, 750 mm, 800 mm, 850 mm, and 900 mm. For clarity, the FEM with a cantilever beam length of 1300 mm and an inner and outer vertical pole spacing of 750 mm is labeled F2-1300-750, with other models following the same naming convention.
4.1. Load-Bearing Structures with Cantilever Lengths of 1.3, 1.5, and 1.7 m
The load-bearing structures with cantilever lengths of 1.3 m, 1.5 m, and 1.7 m were three distinct types of structures, each equipped with a single tie rod. A simplified diagram illustrating these models is presented in Figure 3a as an example. In the figure, l0 denotes the cantilever length of the cantilevered I-beams for different models: 1.3 m, 1.5 m, and 1.7 m, respectively. For each model, the distance from the hanging ear to the cantilever end of the I-beam was 325 mm, and the distance from the outer vertical pole to the cantilever end was 100 mm. The inner and outer vertical pole spacings, l1, were assigned five values ranging from 700 mm to 900 mm, as previously described.
In the FEMs discussed in this section, the end plates at the fixed ends of the cantilevered I-beams yielded first. At the yielding point, the maximum flexural bearing capacity of the load-bearing structure (F0) was equal to the maximum flexural bearing capacity of the I-beam (F1). The results, summarized in Table 3, indicate that the load-bearing structure F2-1300-900 exhibited the highest flexural bearing capacity, sustaining a single-point load of 28.06 kN.
Table 3.
Maximum flexural bearing capacity of load-bearing structures with cantilever beam lengths of 1.3 m, 1.5 m, and 1.7 m.
4.2. Load-Bearing Structures with Cantilever Lengths of 1.9 and 2.1 m
The load-bearing structures with cantilever lengths of 1.9 m and 2.1 m were two distinct types of structures, each equipped with double tie rods. A simplified diagram illustrating these models is presented in Figure 3b as an example. In the figure, l0 denotes the cantilever length of the cantilevered I-beams for different models: 1.9 m and 2.1 m, respectively. For each model, the distance from the outer hanging ear to the cantilever end of the I-beam was 325 mm, and the distance between the inner and outer hanging ears was 250 mm. The inner and outer vertical pole spacings, l1, were assigned five values ranging from 700 mm to 900 mm, as previously described.
In the FEMs discussed in this section, the outer tie rods yielded first. At the yielding point, the maximum flexural bearing capacity of the load-bearing structure (F0) was equal to the maximum flexural bearing capacity of the outer tie rod (F2). The results, summarized in Table 4, indicate that the load-bearing structure F2-1900-900 exhibited the highest flexural bearing capacity, sustaining a single-point load of 55.73 kN.
Table 4.
Maximum flexural bearing capacity of load-bearing structures with cantilever beam lengths of 1.9 m and 2.1 m.
4.3. Load-Bearing Structures with Cantilever Lengths of 2.3, 2.5, 2.7, 2.9, and 3.1 m
The load-bearing structures with cantilever lengths of 2.3 m, 2.5 m, 2.7 m, 2.9 m, and 3.1 m were five distinct types of structures, each equipped with double tie rods. A simplified diagram illustrating these models is presented in Figure 3c as an example. In the figure, l0 denotes the cantilever length of the cantilevered I-beams for different models: 2.3 m, 2.5 m, 2.7 m, 2.9 m, and 3.1 m, respectively. For each model, the distance from the outer hanging ear to the cantilever end of the I-beam was 325 mm, and the distance between the inner and outer hanging ears was 950 mm. The inner and outer vertical pole spacings, l1, were assigned five values ranging from 700 mm to 900 mm, as previously described.
In the FEMs discussed in this section, the outer tie rods were the first to yield. At the yielding point, the maximum flexural bearing capacity of the load-bearing structure (F0) was equal to the maximum flexural bearing capacity of the outer tie rod (F2). The results, summarized in Table 5, indicate that the load-bearing structure F2-2300-900 exhibited the highest flexural bearing capacity, sustaining a single-point load of 37.28 kN.
Table 5.
Maximum flexural bearing capacity of load-bearing structures with cantilever beam lengths of 2.3 m, 2.5 m, 2.7 m, 2.9 m, and 3.1 m.
4.4. Flexural Bearing Capacity Calculation Formula
In this subsection, data from extended FEAs were nonlinearly curve-fitted using Origin (version 2021) data analysis software to derive a simplified formula for calculating the flexural bearing capacity of load-bearing structures. The fitting was conducted using the Levenberg–Marquardt [37] iterative algorithm, which is a widely used nonlinear least squares method. By combining the experimental and simulation results, three key variables were identified: the length of the cantilever beams, the spacing of the hanging ears, and the transverse spacing of the vertical poles, as these significantly influenced the flexural bearing capacity.
The variables were defined as follows: x1 (mm) was the length of the cantilever beams; x2 (mm) was the spacing of the hanging ears, where x2 = 0 for structures with a single tie rod; x3 (mm) was the transverse spacing of the vertical poles; FG (N) was the flexural bearing capacity of the load-bearing structures derived from the fitting; and F0 (N) was the flexural bearing capacity of the load-bearing structures obtained from the FEA. Additionally, in each model, the distance from the outer vertical pole to the cantilever end was 100 mm, and the distance from the outside hanging ear to the cantilever end was 325 mm. The fitting process started by analyzing the relationships between any two variables and the flexural bearing capacity before incorporating all three variables together.
Finally, the simplified formula for the flexural bearing capacity of load-bearing structures derived from the fitting is presented in Equation (1). As shown in Table 6, the ratio of the fitted values to the FEA values for the flexural bearing capacity of the structures ranged from 0.94 to 1.04, with an average of 1.00 and a standard deviation of 0.02. The small error between the fitted and FEA values demonstrates that the derived formula predicts the flexural bearing capacity of load-bearing structures with high accuracy.
Table 6.
Comparison between the FEA results and fitting results for the flexural bearing capacity of load-bearing structures.
5. Parametric Finite Element Analysis
Based on experimental studies and finite element analyses, this section presents a parametric FEA of key parameters influencing the mechanical performance of pull-up cantilever scaffolds with adjustable steel tie rods. The analysis employs the one-variable method and focuses on load-bearing structures commonly used in engineering applications. Specifically, the effects of the transverse spacing of vertical poles, the length of cantilever beams, and the spacing of hanging ears on the mechanical properties of load-bearing structures were investigated. During the parametric FEA, the steel yield strength was uniformly set to 215 MPa. Through simulation loading, load–stress and load–displacement curves for each model were obtained and analyzed, providing a reference for the design, calculation, and further research of cantilever scaffolds.
5.1. Influence of the Transverse Spacing of Vertical Rods on the Mechanical Properties of Load-Bearing Structures
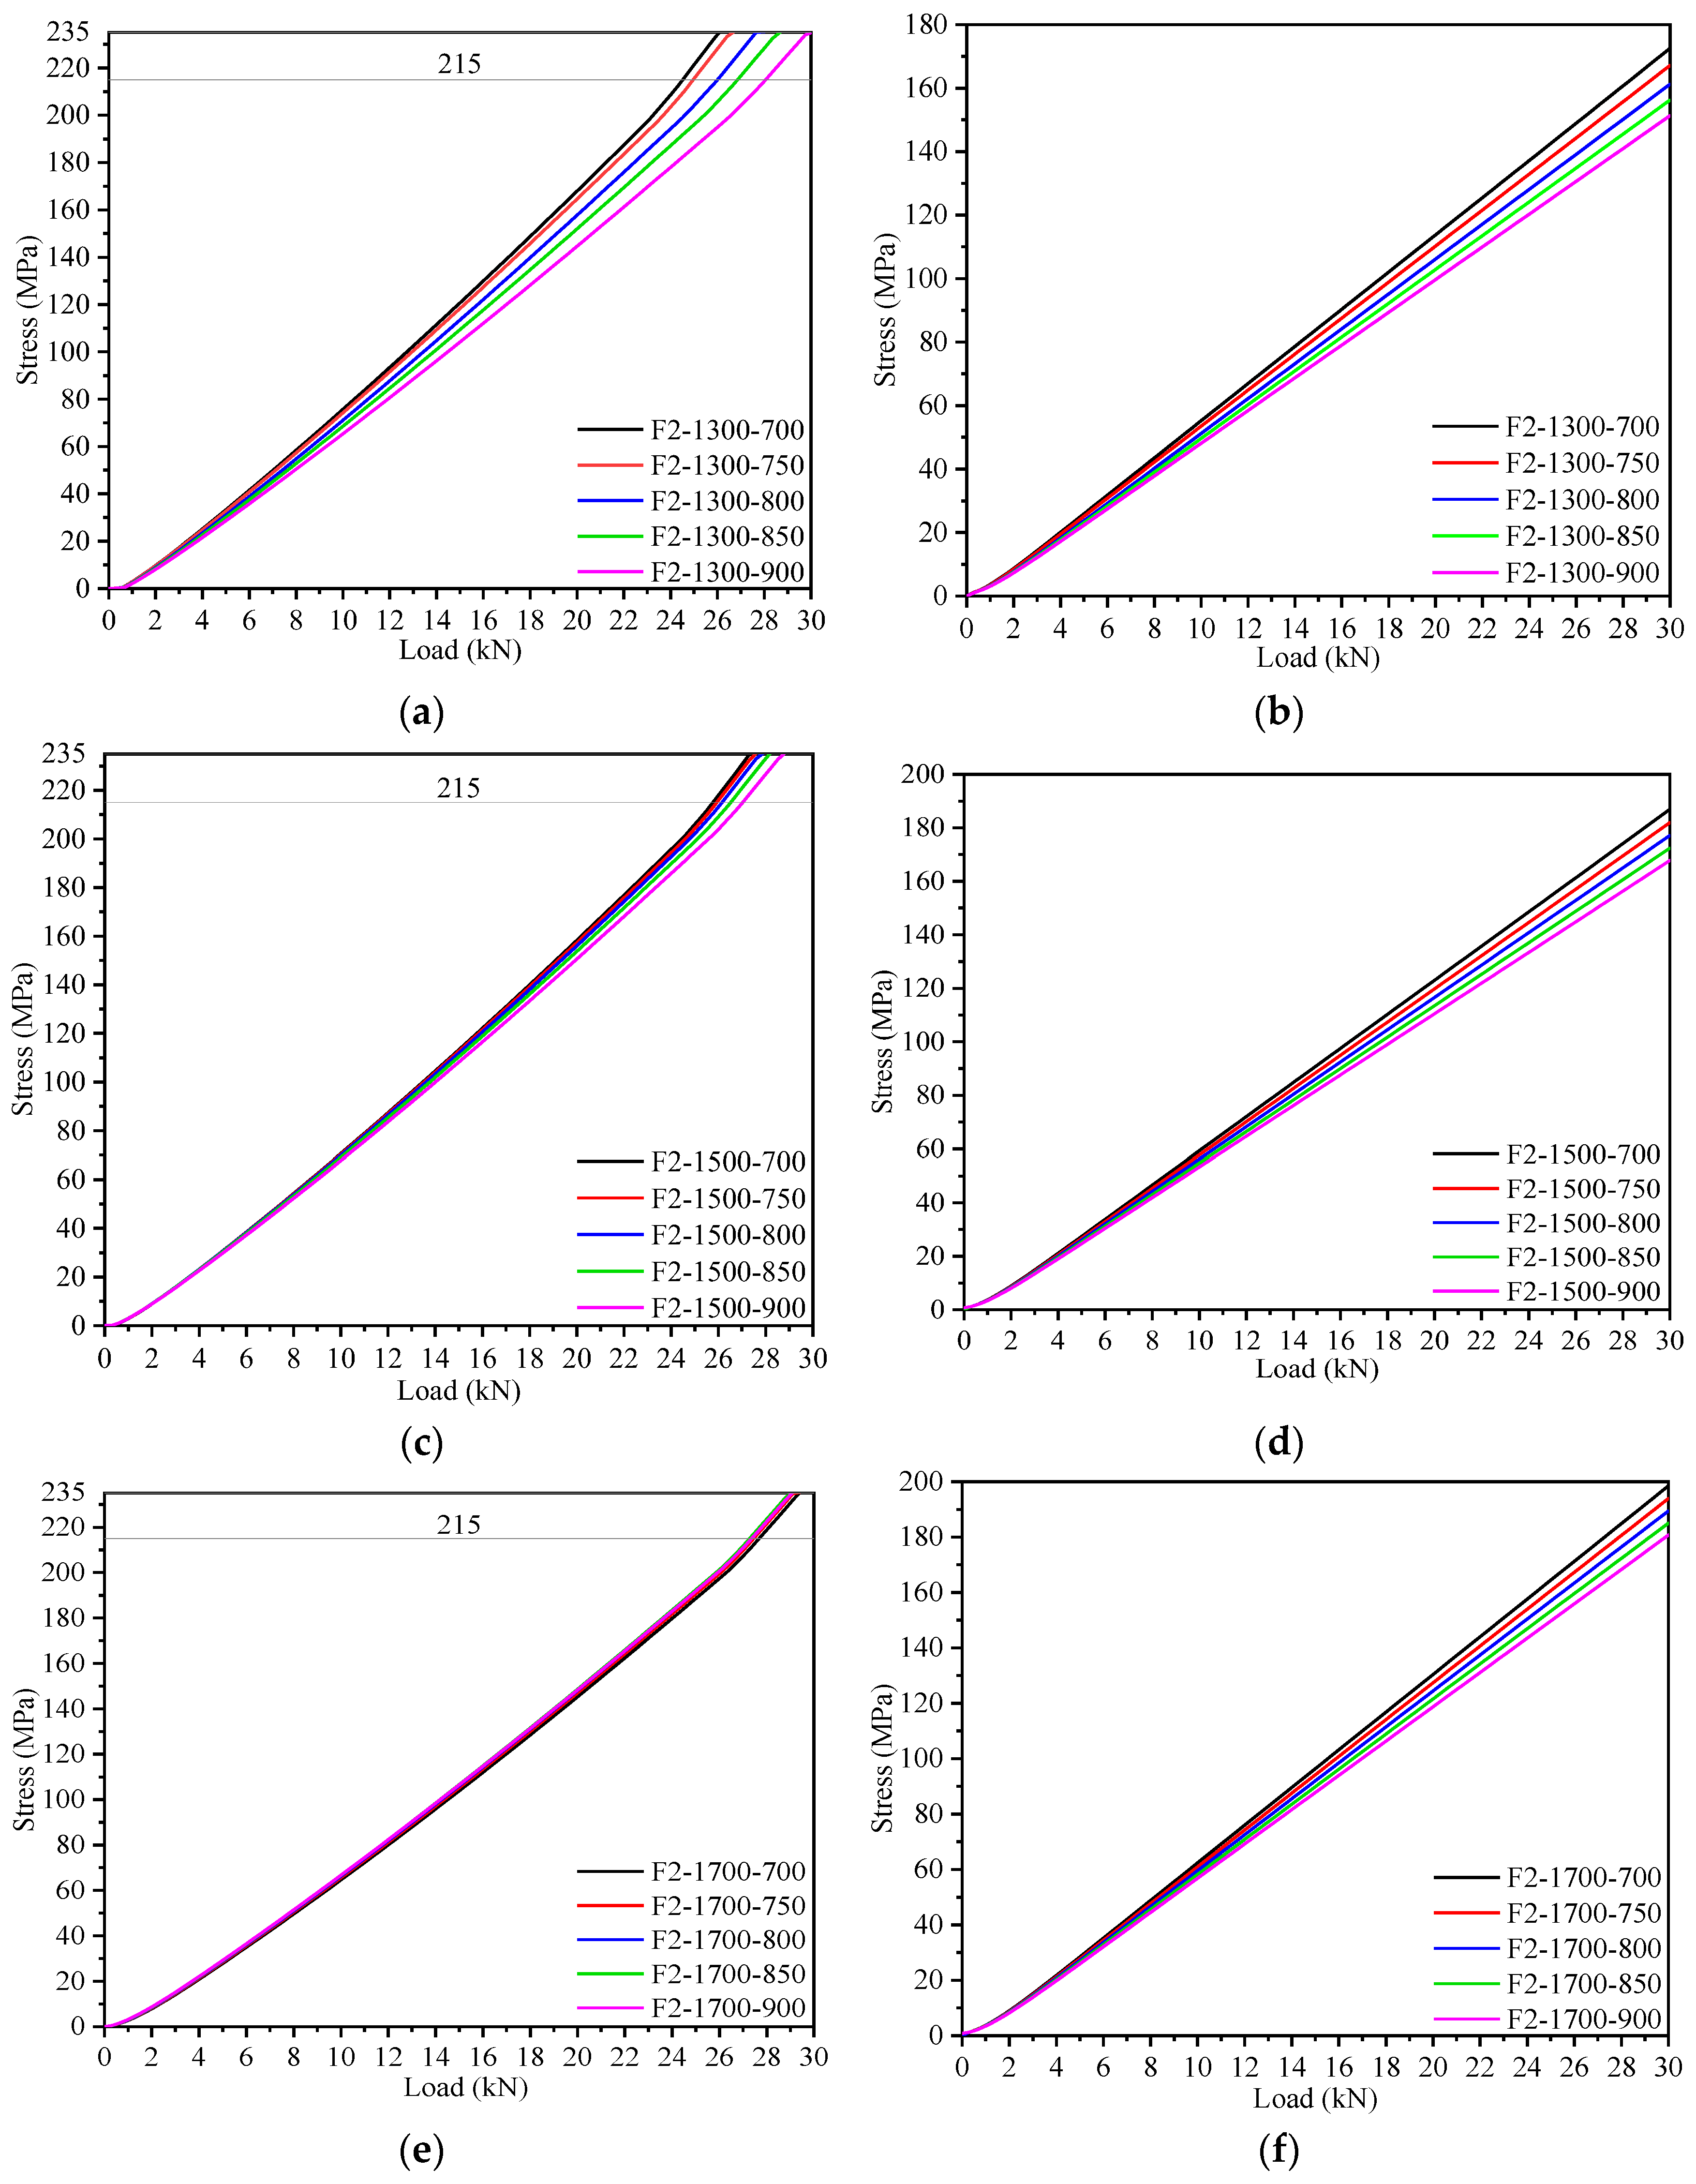
Load-bearing structures with cantilever lengths of 1.3 m, 1.5 m, and 1.7 m from Section 4.1 were selected to study the influence of transverse spacing on their mechanical properties. In these models, the transverse spacing of the vertical poles was varied, while all other parameters remained constant. The load–stress curves are shown in Figure 16, and the load–displacement curves are shown in Figure 17. The simulation results are summarized in Table 7, where F0, σ2, and D1 denote the maximum flexural bearing capacity of the load-bearing structure, the maximum stress on the tie rod, and the maximum displacement at the cantilever end, respectively, at the yielding point of the end plate.
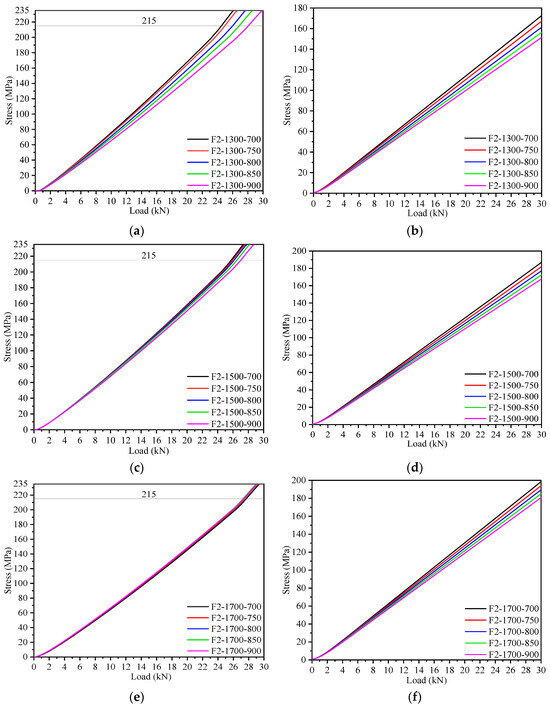
Figure 16.
Load–stress curves for load-bearing structures with cantilever lengths of 1.3 m, 1.5 m, and 1.7 m. (a) End plate for the 1.3 m model; (b) tie rod for the 1.3 m model; (c) end plate for the 1.5 m model; (d) tie rod for the 1.5 m model; (e) end plate for the 1.7 m model; (f) tie rod for the 1.7 m model.
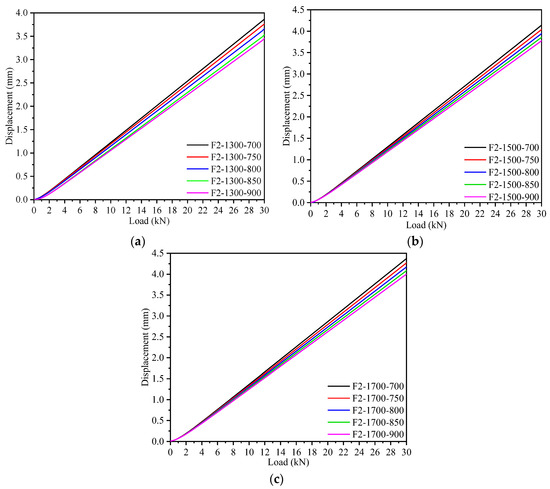
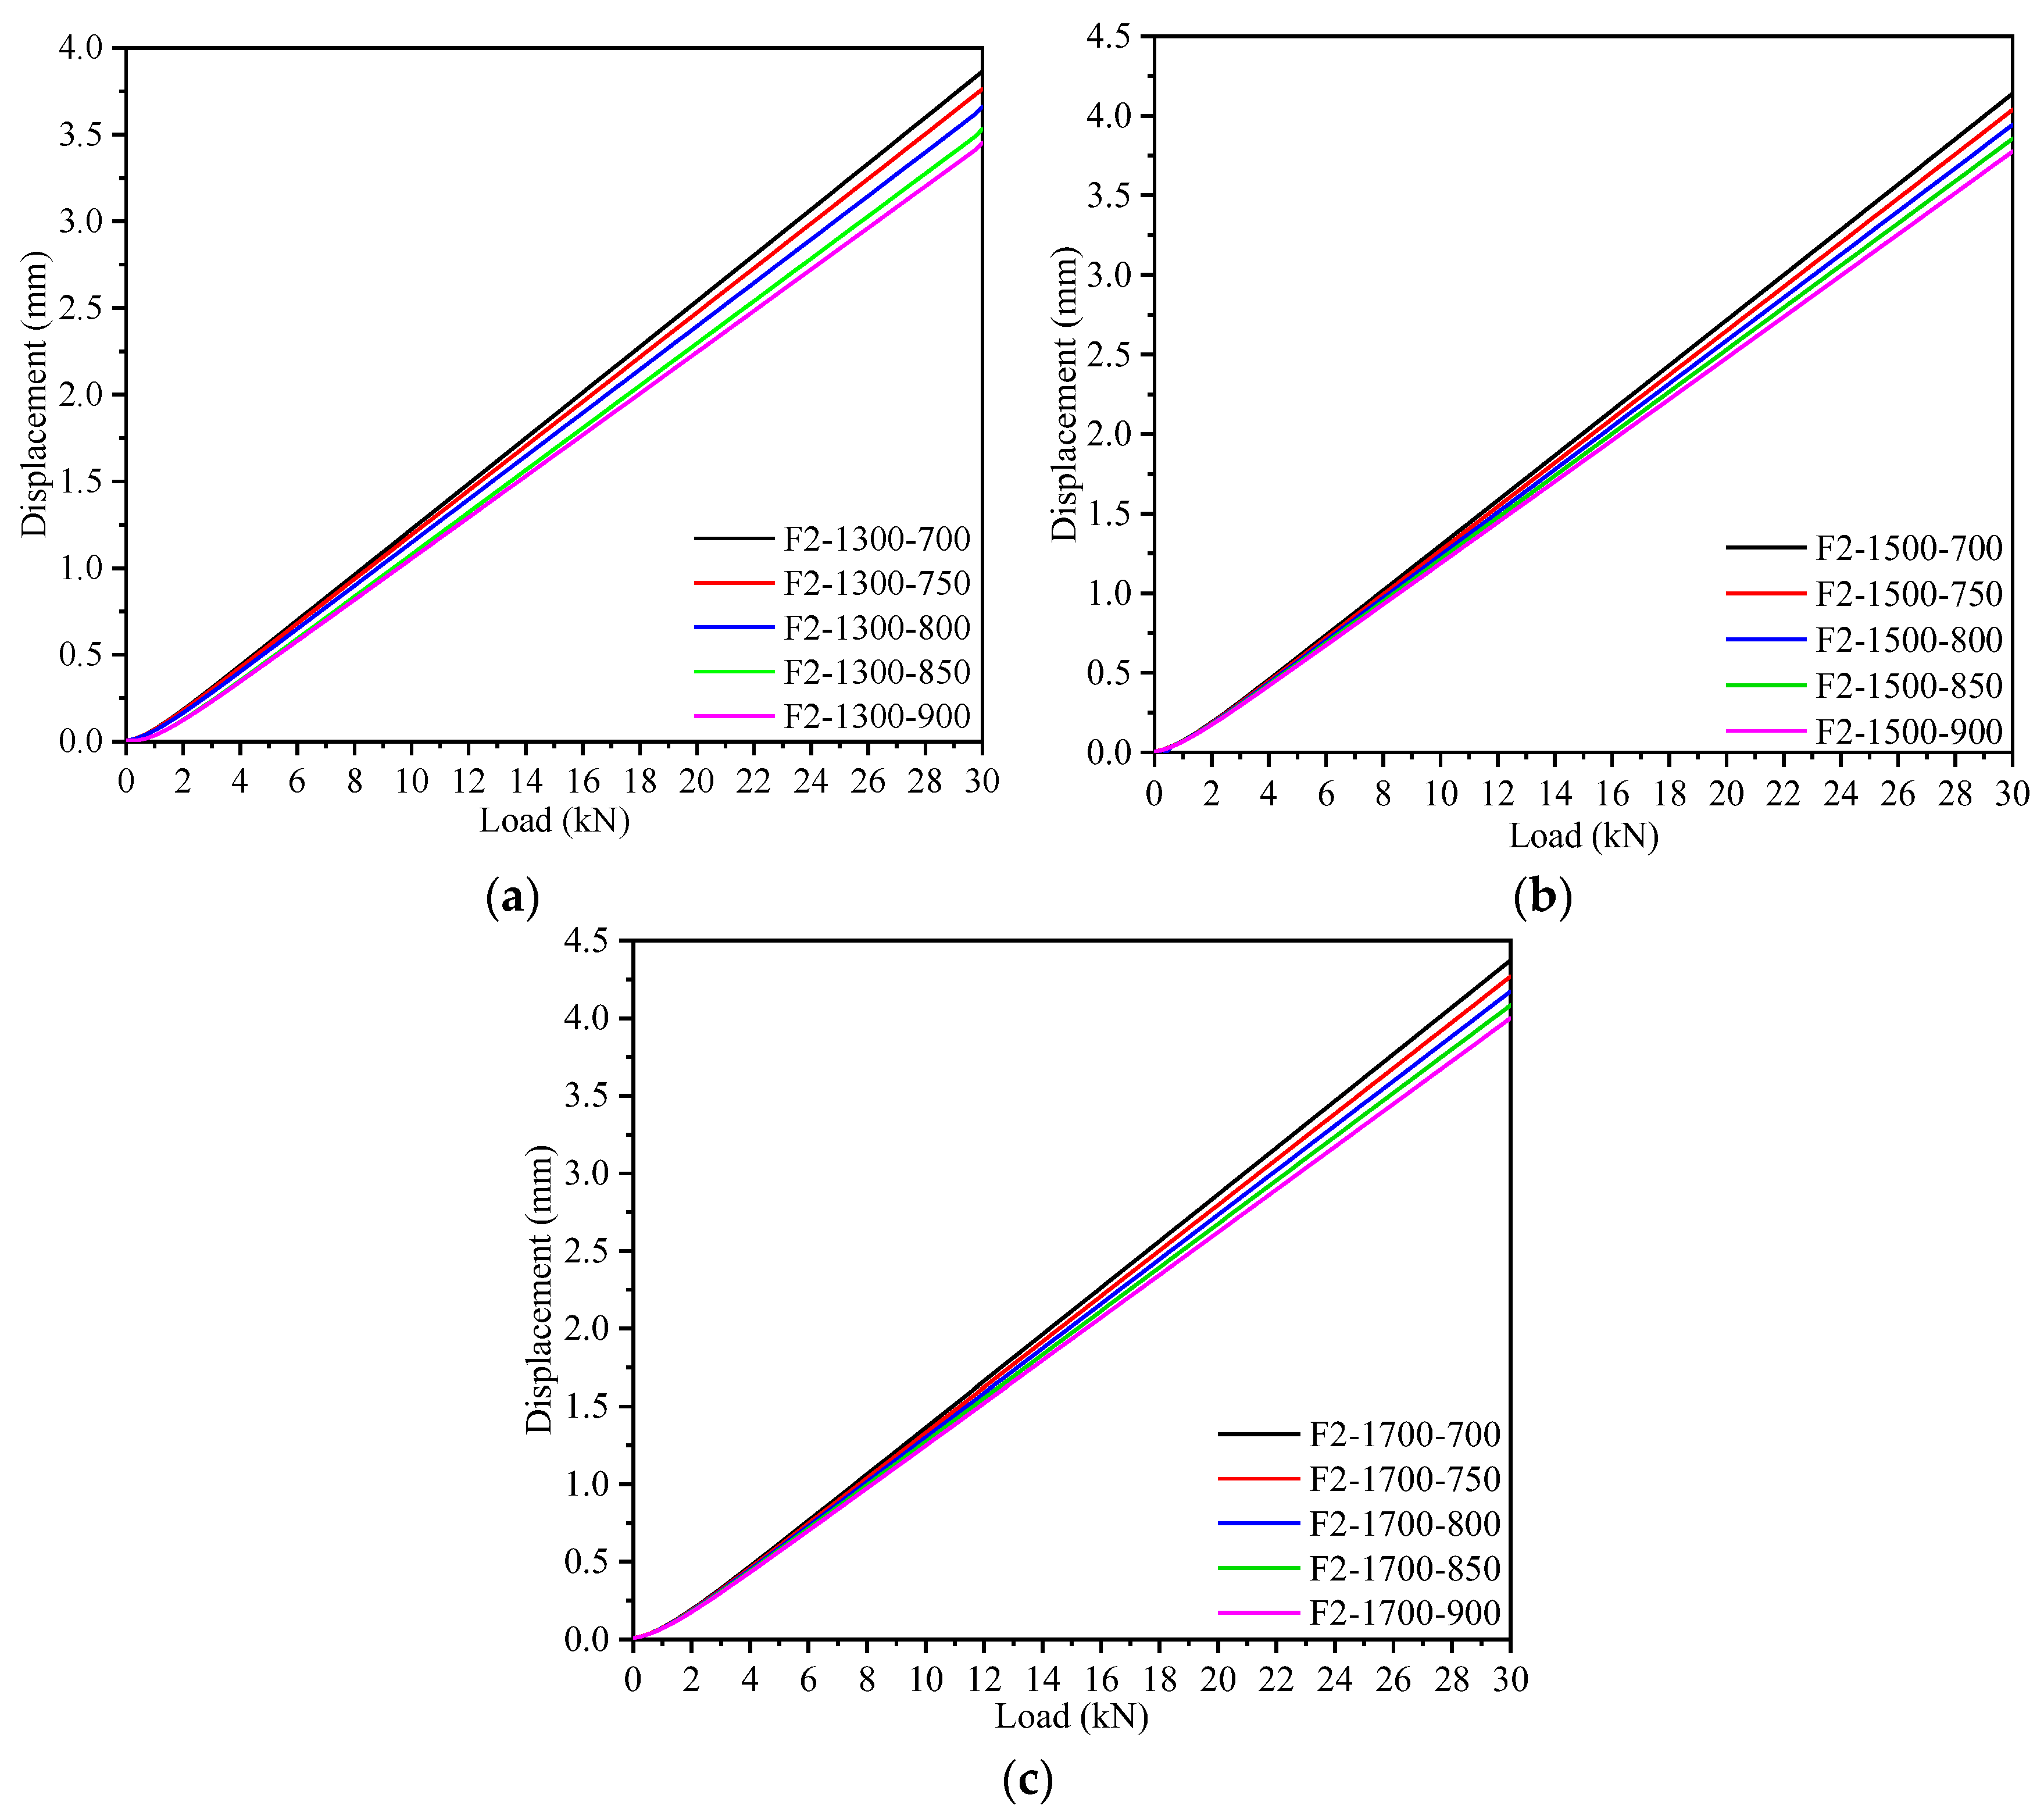
Figure 17.
Load–displacement curves at the cantilever ends of load-bearing structures with cantilever lengths of 1.3 m, 1.5 m, and 1.7 m. (a) The 1.3 m model; (b) the 1.5 m model; (c) the 1.7 m model.
Table 7.
FEA results for load-bearing structures with different transverse spacings of vertical poles.
The results in Figure 16 and Figure 17 and Table 7 show that, for load-bearing structures with the same cantilever length, an increase in the transverse spacing of vertical poles improved the flexural bearing capacity. Among these, the structure F2-1300-900 exhibited the highest flexural bearing capacity, sustaining a single-point load of 28.06 kN.
Additionally, for load-bearing structures with identical cantilever lengths and applied loads, an increase in transverse spacing reduced the tie rod stress and decreased the cantilever end displacement. These results indicated that, within a certain range of transverse spacing, smaller spacings (i.e., closer inner vertical poles to the cantilever beam’s fixed ends) decreased the load shared by tie rods and increased the load borne by end plates.
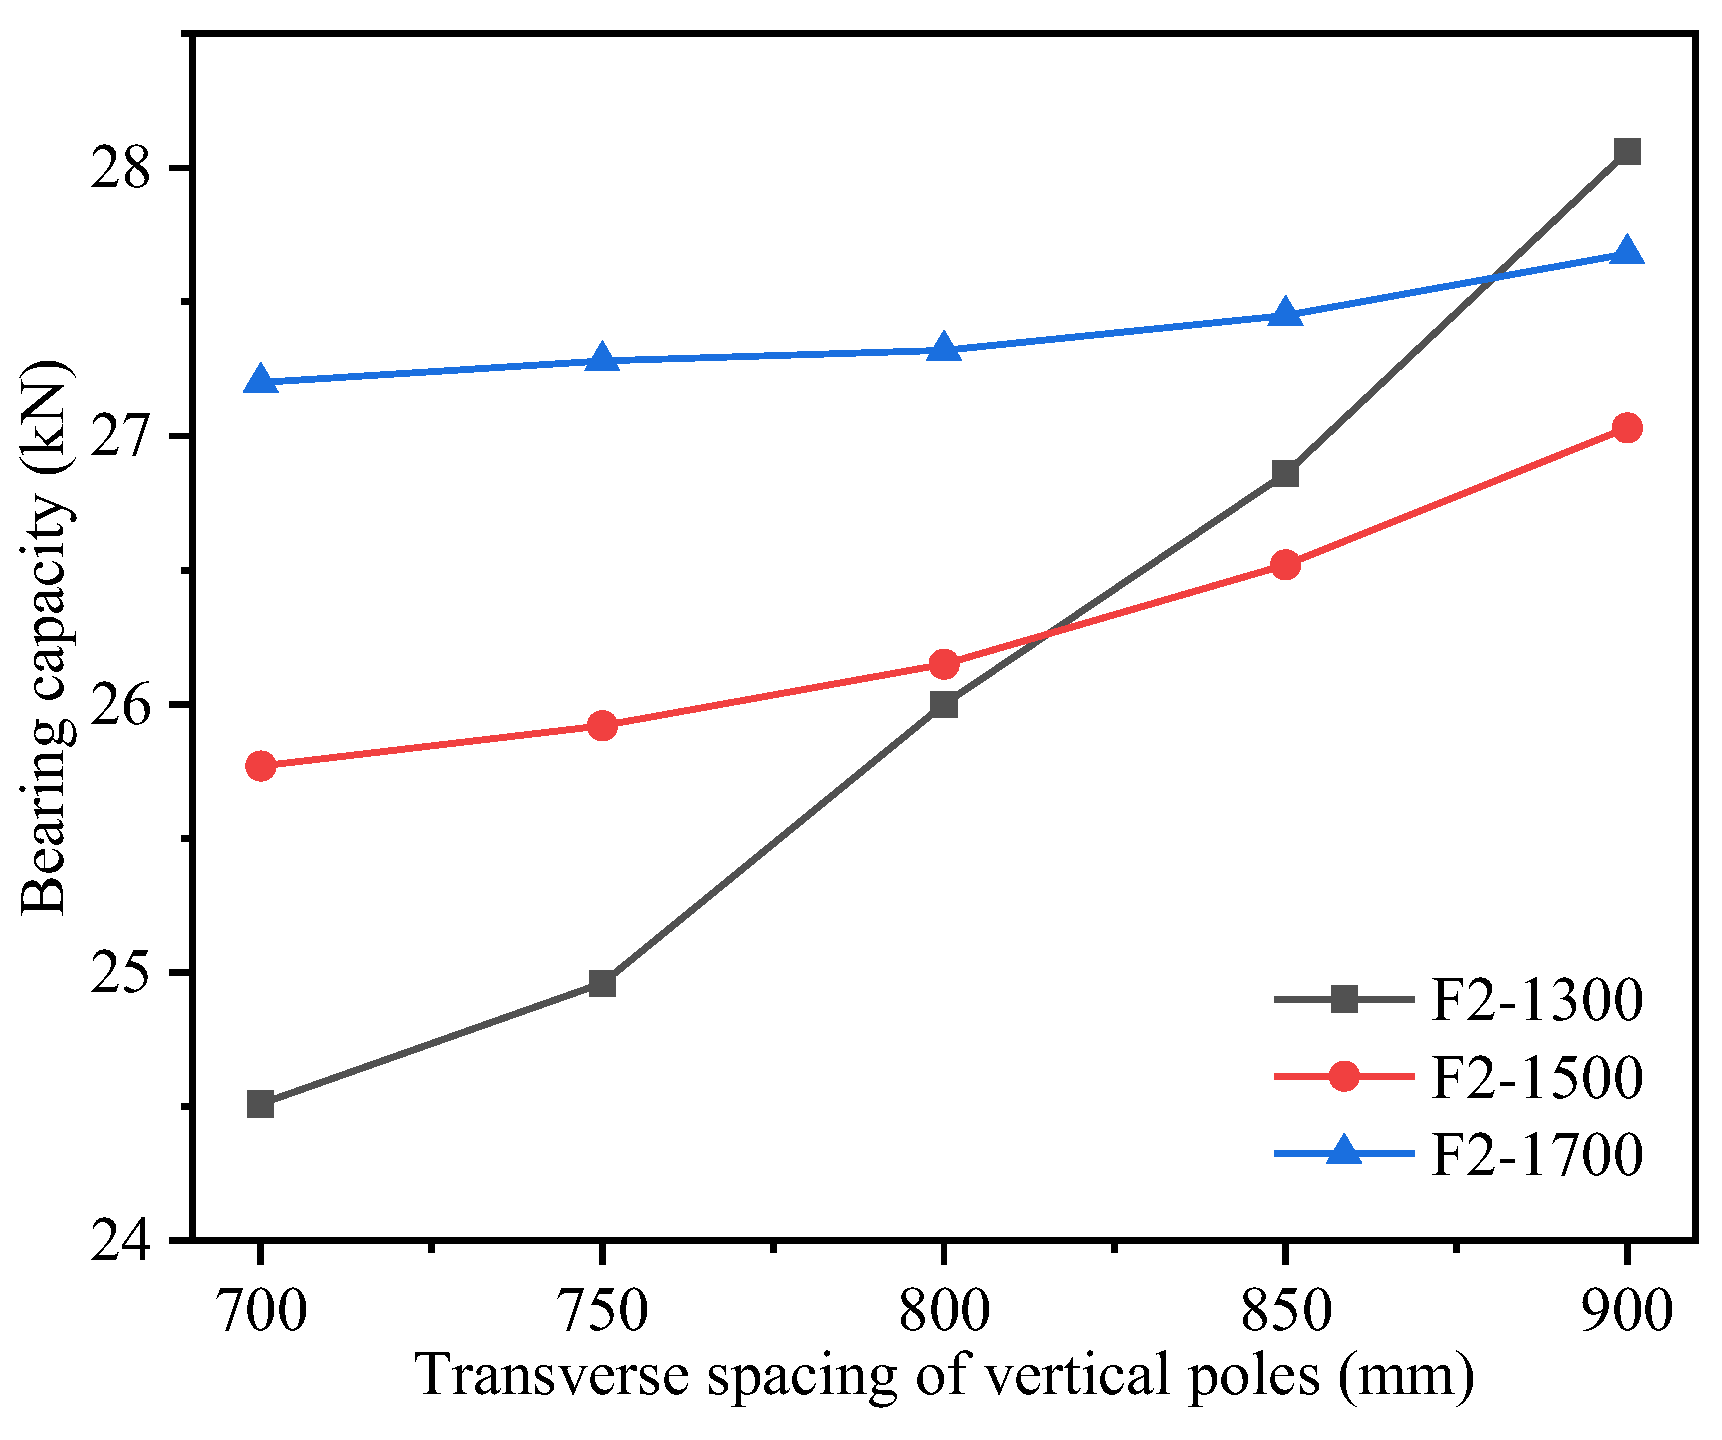
In addition, Table 7 and Figure 18 show that with an increase in the transverse spacing of the vertical poles under the same applied load, the flexural bearing capacity of the load-bearing structure with a 1.3 m cantilever length increased by 14.5%. In comparison, the flexural bearing capacity of the 1.7 m model increased by only 1.8%, indicating that variations in the transverse spacing had a greater effect on the flexural bearing capacity of the 1.3 m cantilever structure than on that of the 1.7 m cantilever structure.
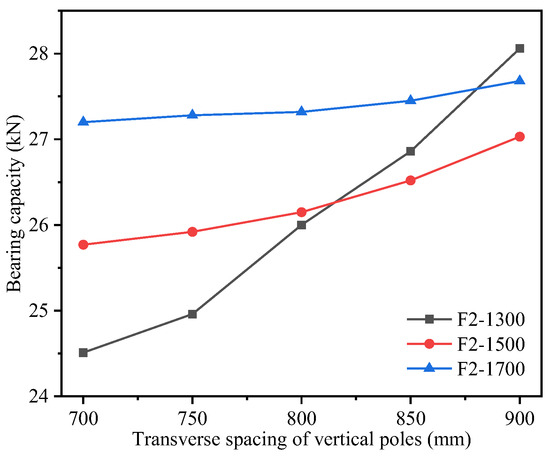
Figure 18.
Comparison of the flexural bearing capacity of load-bearing structures with cantilever lengths of 1.3 m, 1.5 m, and 1.7 m.
5.2. The Influence of the Length of Cantilever Beams on the Mechanical Properties of the Load-Bearing Structures
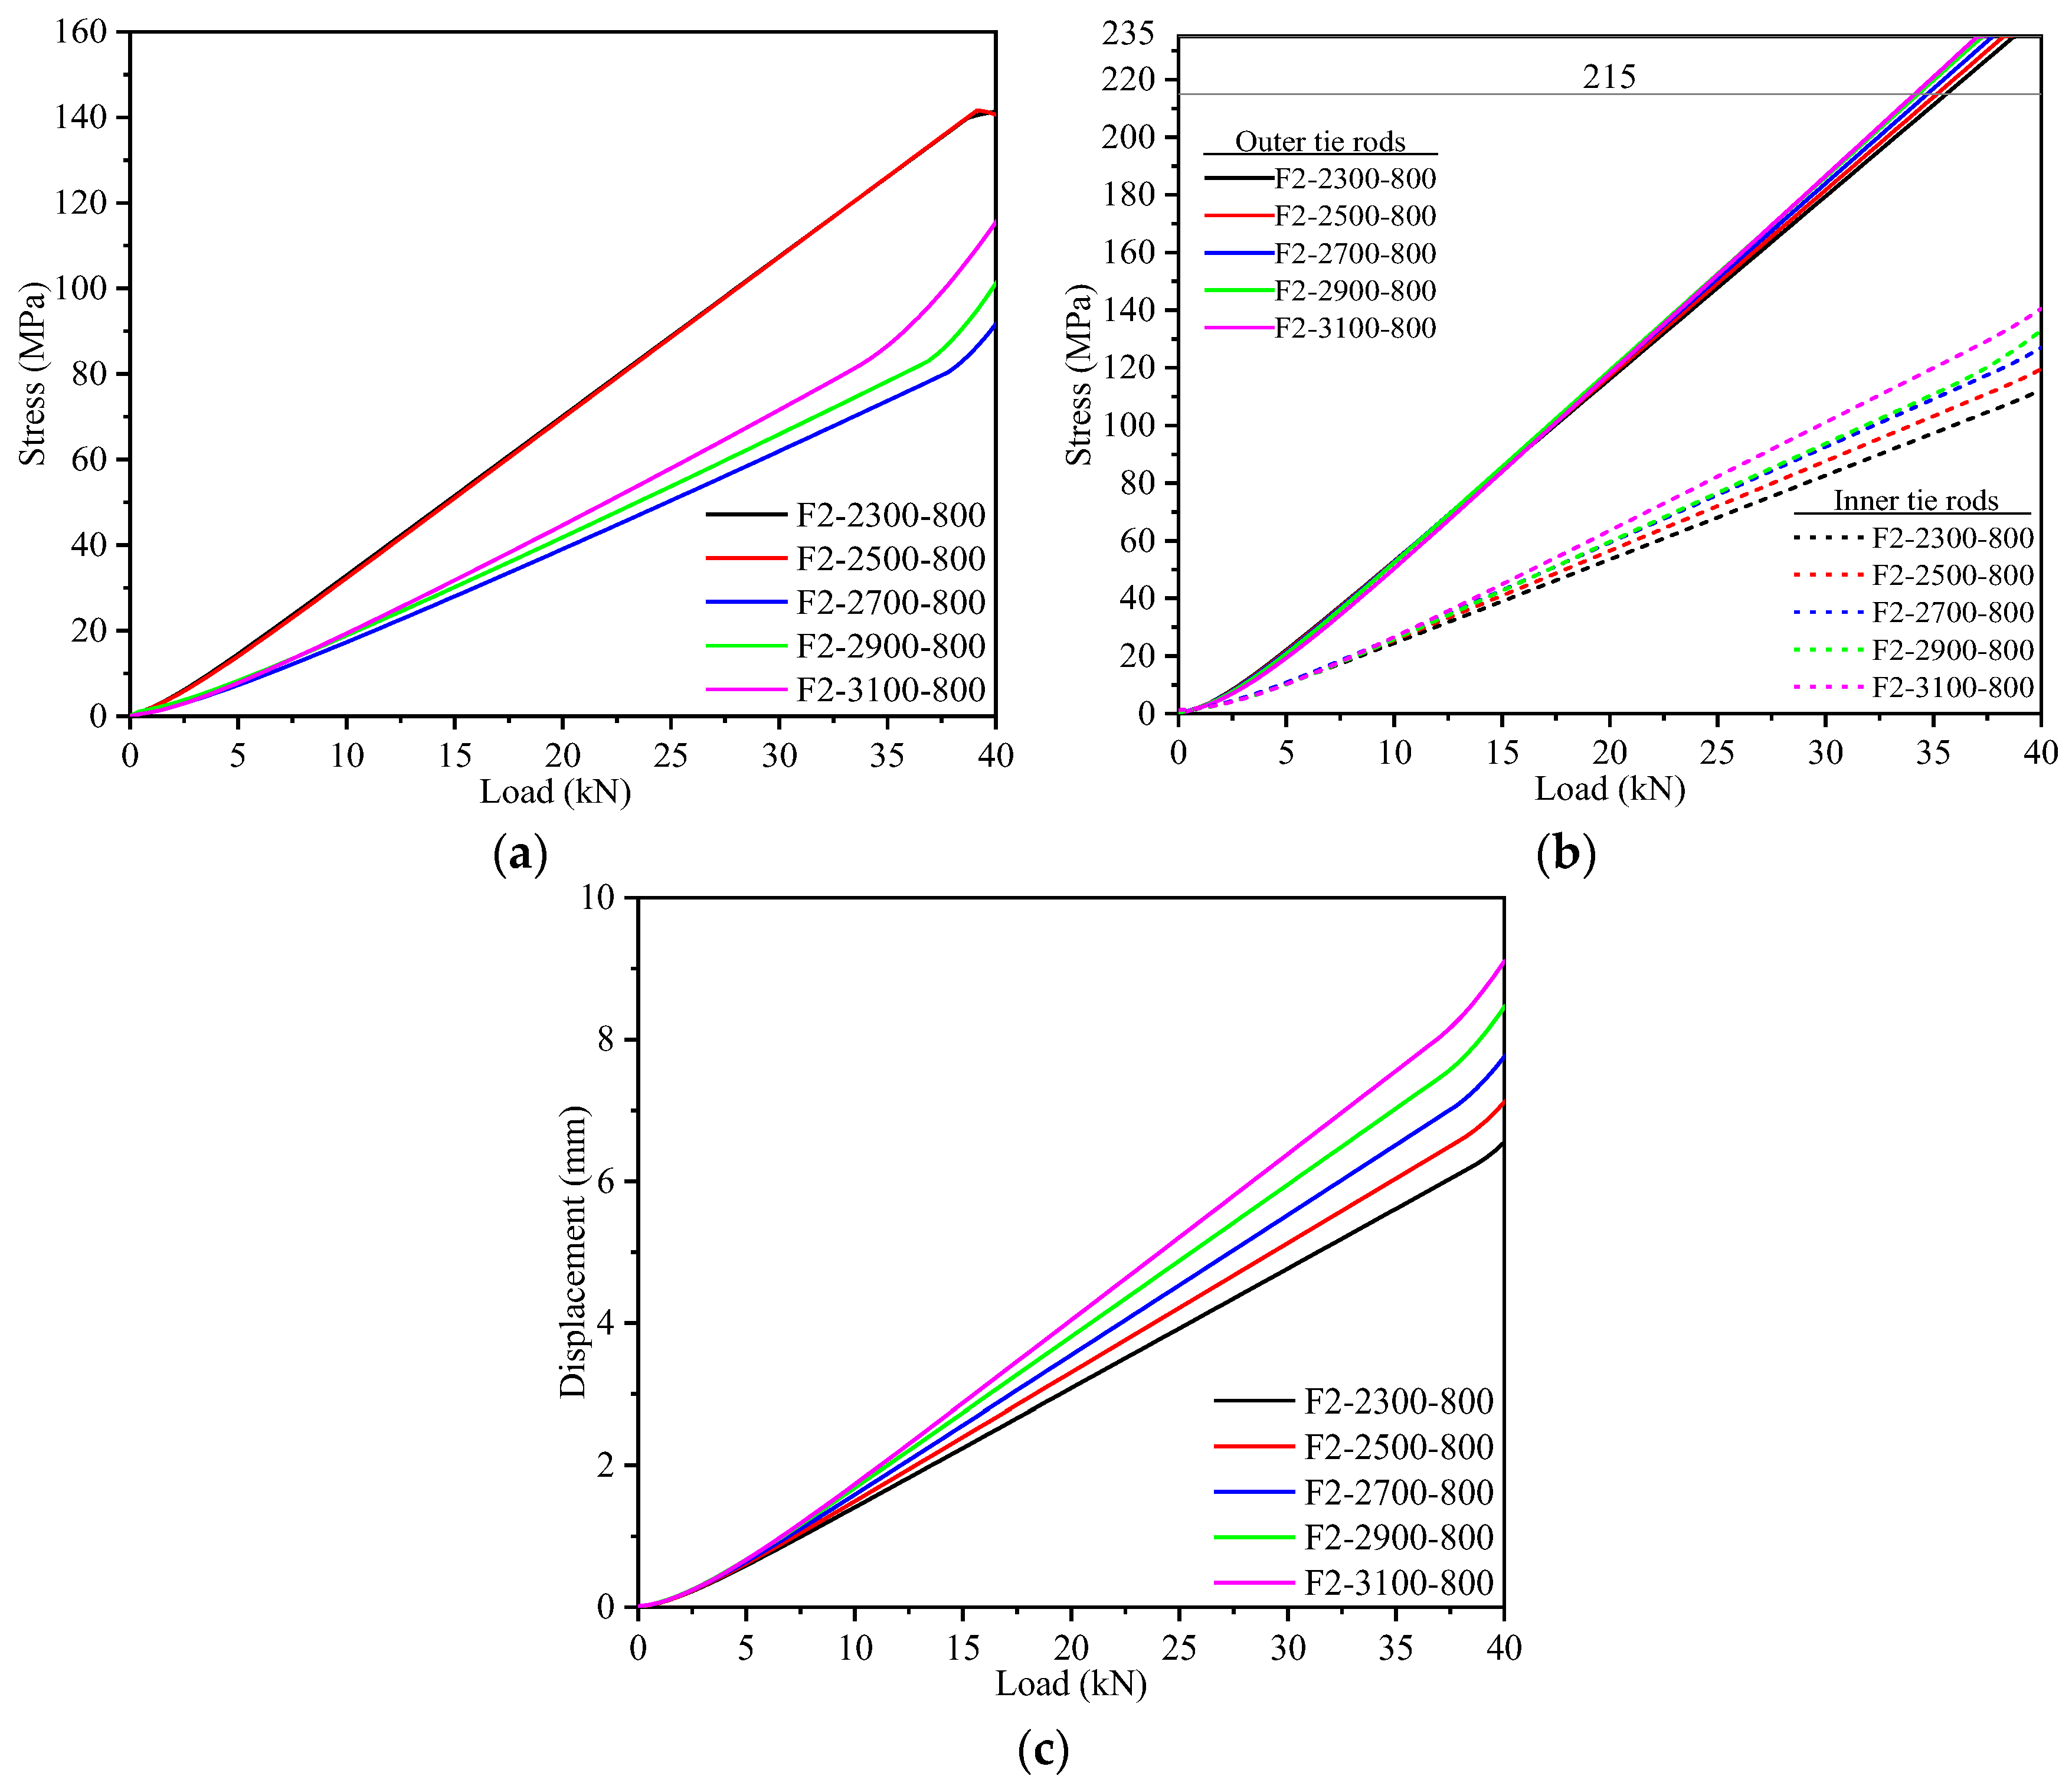
The load-bearing structures with cantilever lengths of 2.3 m, 2.5 m, 2.7 m, 2.9 m, and 3.1 m from Section 4.3 were selected to investigate the effects of cantilever beam length on the mechanical properties of the load-bearing structures. In these models, all the parameters except the cantilever beam length were kept constant, with the transverse spacing of the vertical poles set to 800 mm. The maximum stresses on the I-beams in models F2-2300-800 and F2-2500-800 occurred at the outside hanging ears, while in the other models, they occurred at the inside hanging ears.
Figure 19a shows that the maximum stresses on the I-beams for cantilever lengths of 2.3 m and 2.5 m were nearly identical under the same load, whereas those for cantilever lengths of 2.7 m, 2.9 m, and 3.1 m increased with increasing cantilever length. Figure 19b shows that the outer tie rods yielded first during the loading process, bearing greater loads than the inner tie rods did. Additionally, as cantilever beam length increased under the same applied load, the loads borne by both the inner and outer tie rods increased, with the load increase on the outer tie rods being smaller than that on the inner tie rods. Figure 19c shows that under the same applied load, as the cantilever beam length increased, the displacements at the cantilever ends increased, and the slopes of the load–displacement curves showed an increasing trend at the yielding points of the outer tie rods.
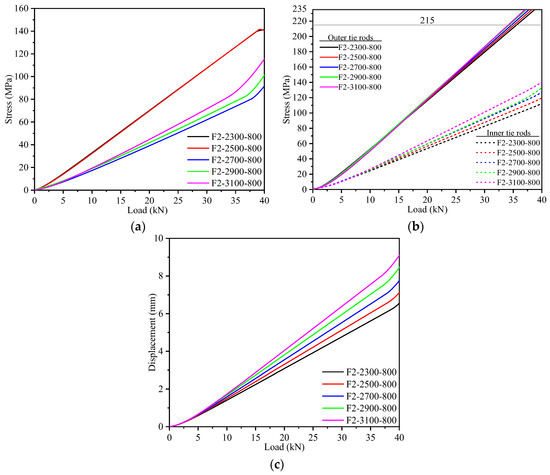
Figure 19.
Load–stress and load–displacement curves for load–bearing structures with cantilever beams of different lengths. (a) Load–stress curves for the I-beams; (b) load–stress curves for the inner and outer tie rods; (c) load–displacement curves for the cantilever ends.
A further analysis of the results is shown in Table 8, where F0, σ3, σ1, and D1 represent the maximum flexural bearing capacity of the load-bearing structure, the maximum stress on the inner tie rod, the maximum stress on the end plate, and the maximum displacement at the cantilever end, respectively, at the yielding point of the outer tie rod. Table 8 reveals that increasing the cantilever beam length from 2.3 m to 3.1 m had a minimal effect on the flexural bearing capacity of the load-bearing structure, which decreased by 3.6%. The change in length had a smaller effect on the stresses on the outer tie rods but a greater effect on the stresses on the inner tie rods. Additionally, the increase in cantilever length significantly influenced the positions of the maximum stresses on the I-beams and noticeably increased the displacements at the cantilever ends, which rose by 37.8%.
Table 8.
FEA results for load-bearing structures with cantilever beams of different lengths.
5.3. The Influence of the Spacing of Hanging Ears on the Mechanical Properties of Load-Bearing Structures
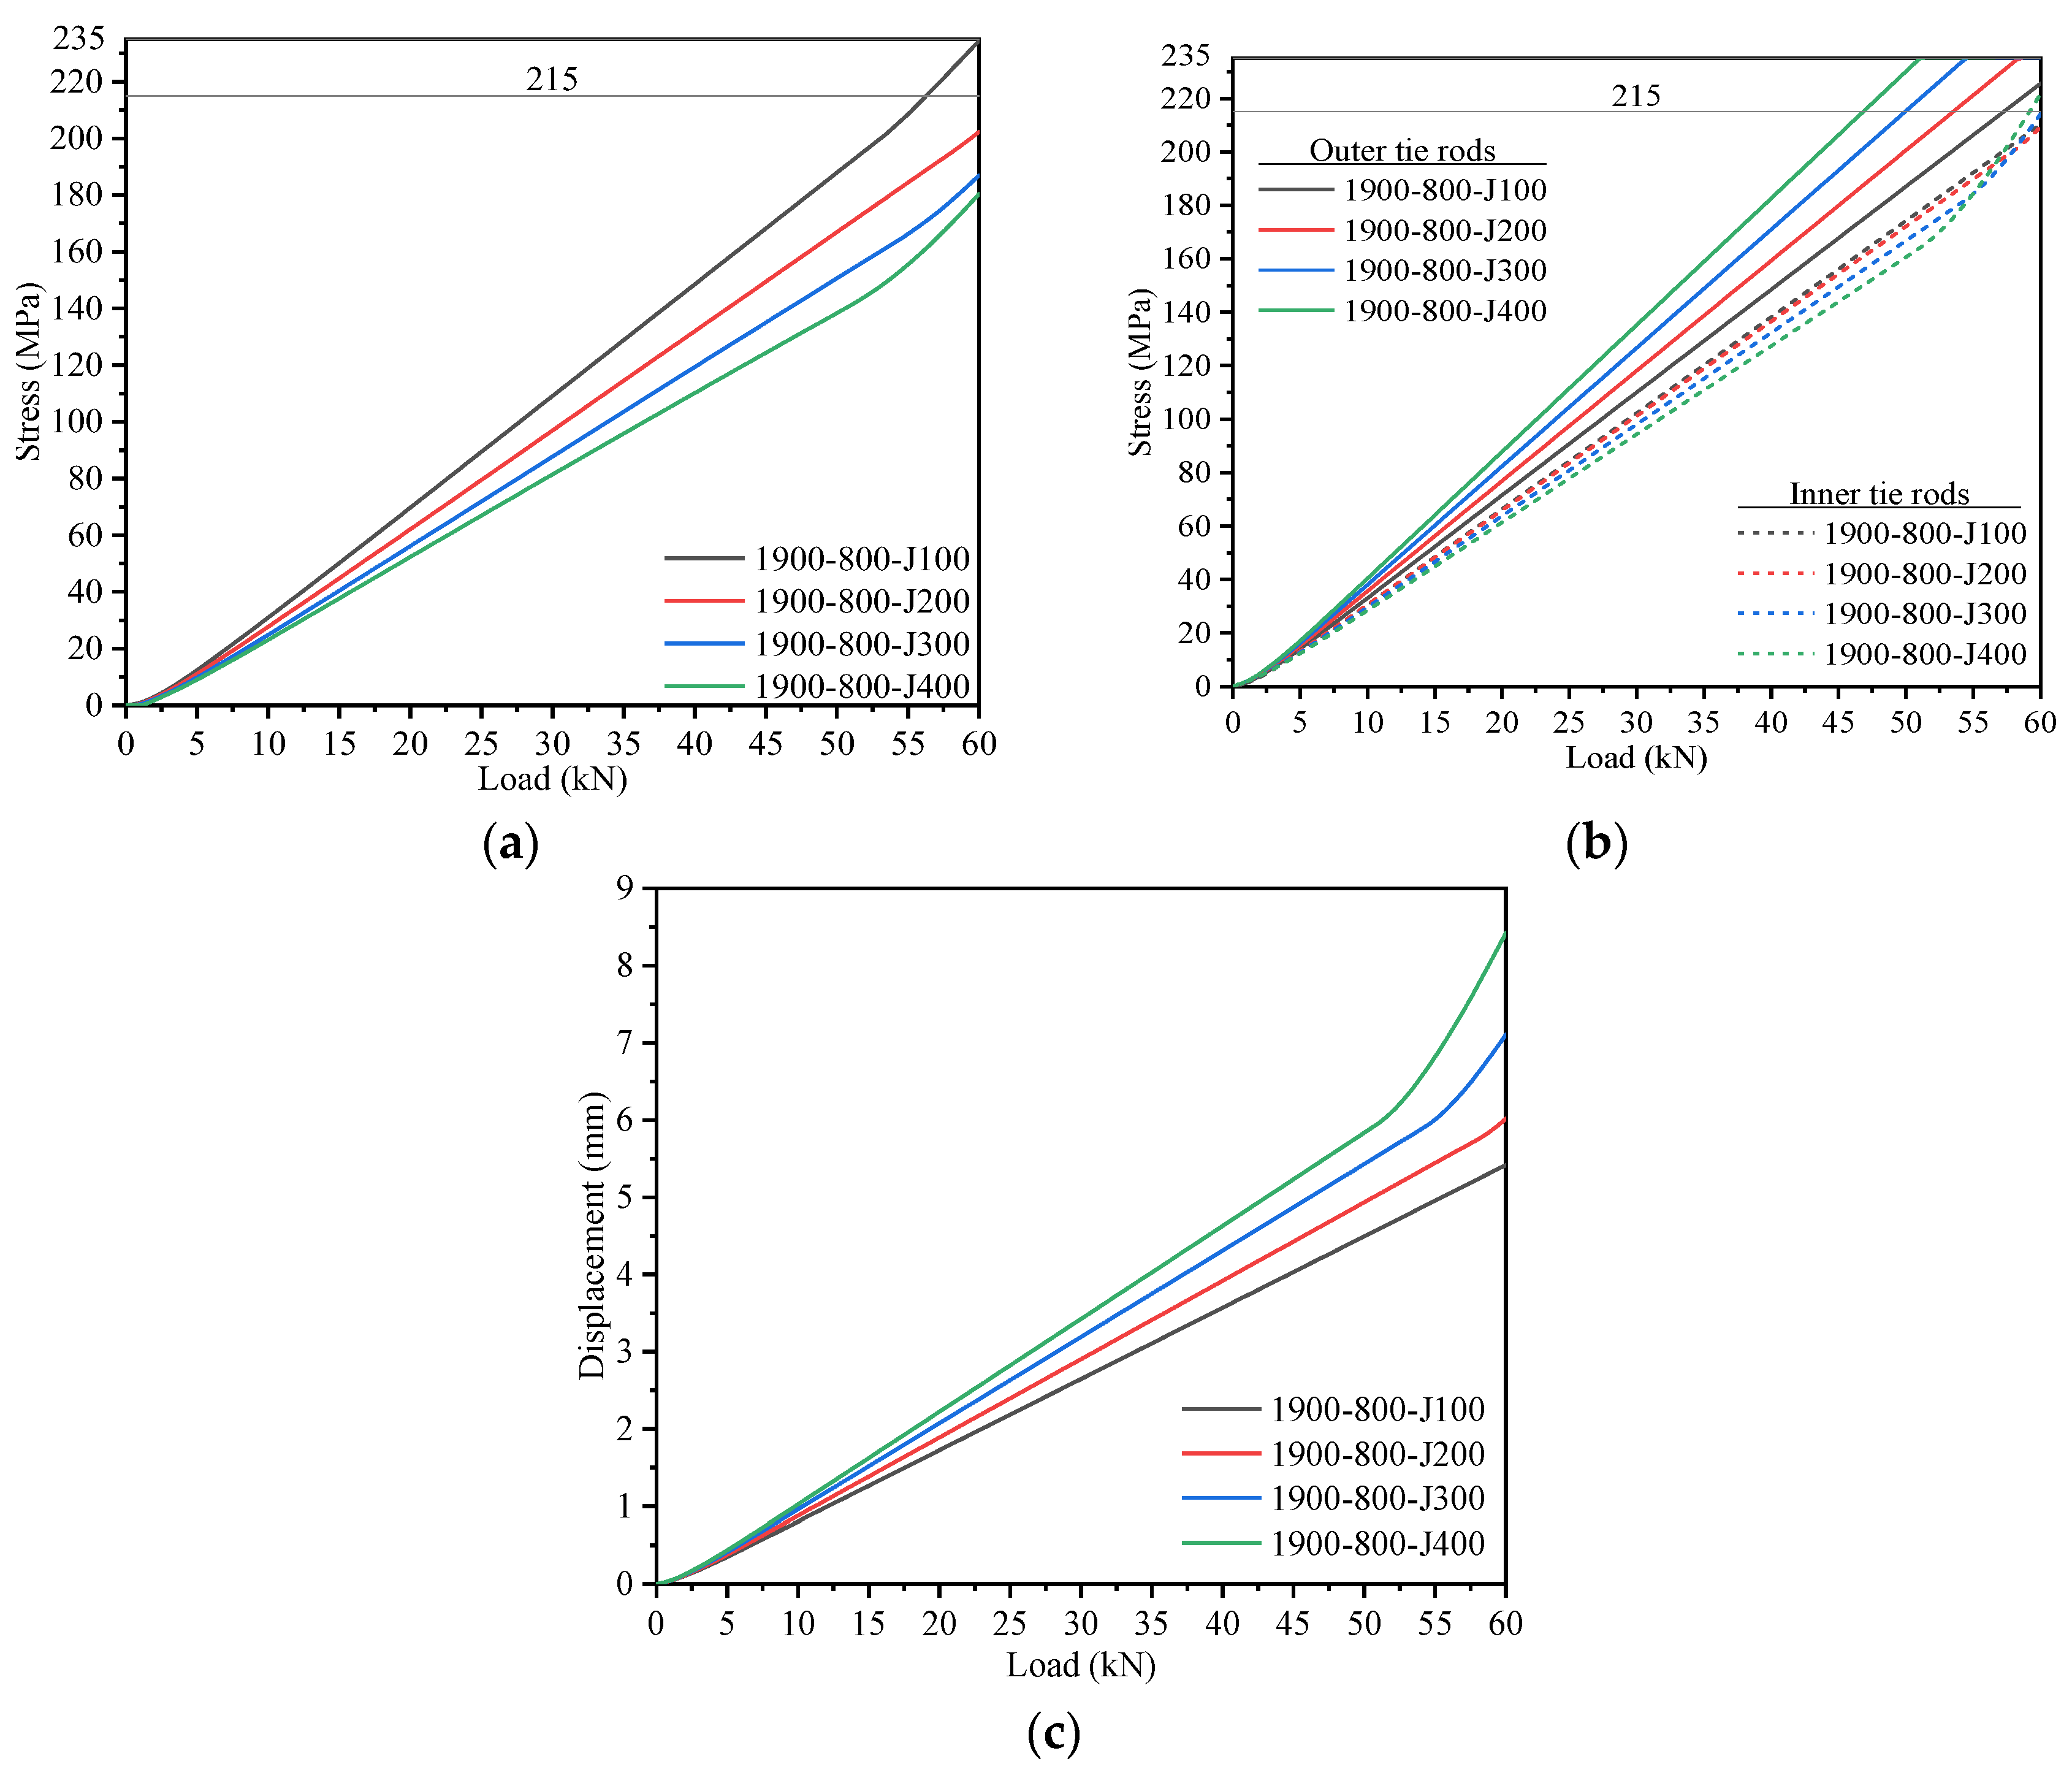
A load-bearing structure with a cantilever length of 1.9 m was selected to study the effects of the spacing of the hanging ears on the mechanical properties of load-bearing structures. The structural layout diagram is shown in Figure 20, where l2 represented the distance between the inside and outside hanging ears, which was set to 100 mm, 200 mm, 300 mm, and 400 mm in the FEMs. Meanwhile, the distances from the outside hanging ears to the cantilever ends were fixed at 325 mm, with all other parameters unchanged. The four models were named 1900-800-J100, 1900-800-J200, 1900-800-J300, and 1900-800-J400. The FEA results are presented in Figure 21 and Table 9.

Figure 20.
Structural diagram of cantilever I-beams with different spacing of hanging ears.
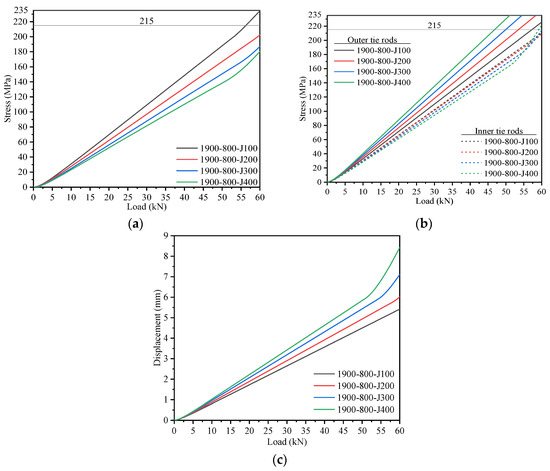
Figure 21.
Load–stress curves and load–displacement curves for load-bearing structures with different spacings of hanging ears. (a) The load–stress curves of the I-beams; (b) the load–stress curves of the inner and outer tie rods; (c) the load–displacement curves of the cantilever ends.
Table 9.
FEA results of the load-bearing structures with different spacings of hanging ears.
Figure 21 shows that during the loading process, the outer tie rods consistently carried more load than did the inner tie rods. Under the same applied load, as the spacing between the inside and outside hanging ears increased, the load shared by the inner tie rods decreased, the load carried by the outer tie rods increased, the difference in the loads shared by the two tie rods increased, and the displacement at the cantilever ends gradually increased. When the outer tie rods yielded, the load–stress curves of the inner tie rods experienced abrupt changes with significant stress increases, indicating stress redistribution throughout the entire structural system.
The FEA results for load-bearing structures with different spacings of hanging ears are presented in Table 9, where F0, σ1, and D1 represent the maximum flexural bearing capacity of the load-bearing structure, the maximum stress on the end plate, and the maximum displacement at the cantilever end, respectively, at the yielding point of either the outer tie rods or the end plates. For the load-bearing structure with a hanging ear spacing of 100 mm (1900-800-J100), the end plate yielded first, whereas for the other three load-bearing structures, the outer tie rods were the first to yield. The flexural bearing capacity of the load-bearing structure with a spacing of 100 mm between the inner and outer hanging ears was 20.4% greater than that of the structure with a spacing of 400 mm.
In summary, within a certain range of spacing between the inside and outside hanging ears, a smaller spacing led to a more balanced load distribution between the inner and outer tie rods, ensuring better utilization of the tensile capacities of both tie rods. This also increased the overall flexural bearing capacity of the load-bearing structures and reduced the displacement at the cantilever ends.
6. Conclusions
In this paper, the mechanical properties of three sets of pull-up cantilever scaffolds with adjustable steel tie rods of varying specifications were investigated through both experimental and numerical methods. Based on experimental validation, the study investigated the transverse spacing of vertical rods, length of cantilever beams, and spacing of hanging ears on the load-bearing capacity of structural systems. The primary findings are outlined as follows:
- (1)
- The main damage modes of three sets of pull-up cantilever scaffolds include bending damage to the double-ear hanging ring, outward bending at the center of the end plate, bending deformation of the hanging ring connecting the tie rod and the extension rod, and disconnection at the welding point on the hanging ring of the extension rod. As the cantilever beam length increases, the loads borne by the tie rods progressively increase, whereas those carried by the end plates decrease correspondingly. In load-bearing structures featuring two tie rods, the outer tie rod consistently bears a greater load than the inner tie rod does. Additionally, increasing the spacing of the hanging ears amplifies the stress differences between the two tie rods.
- (2)
- The results of the finite element model closely match the experimental results, demonstrating the high reliability of the FEM. An extended FEA is subsequently conducted using ABAQUS to evaluate the bearing capacities of 10 different specifications of load-bearing structures commonly used in practical engineering. The nonlinear curve fitting of the extended FEA data simplifies the formula for estimating the bearing capacities of load-bearing structures. The minimal discrepancy between the fitted and FEA values demonstrates the high accuracy of the derived formula in predicting the flexural bearing capacity of load-bearing structures.
- (3)
- Parametric FEA is employed to further investigate the effects of the transverse spacing of vertical rods, the length of cantilever beams, and the spacing of hanging ears on the flexural bearing capacity of load-bearing structures. For the load-bearing structures with cantilever lengths of 1.3 m, 1.5 m, and 1.7 m featuring single tie rods, the flexural bearing capacity increases as the transverse spacing of the vertical poles widens within a specific range. For the load-bearing structures with cantilever lengths of 2.3 m to 3.1 m featuring double tie rods, increasing the cantilever beam length within a specific range slightly reduces the flexural bearing capacity while significantly increasing the maximum displacement at the cantilever ends. For the load-bearing structures with a cantilever length of 1.9 m featuring double tie rods, reducing the spacing of the hanging ears results in a more balanced load distribution between the inner and outer tie rods, ensuring the better utilization of their tensile capacities, increasing their overall flexural bearing capacity, and reducing deflections at the cantilever ends.
Author Contributions
Z.H., conceptualization, methodology, software, formal analysis, investigation, writing—original draft preparation, and writing—review and editing. J.Y. (Jianjun Yang)., conceptualization, methodology, validation, resources, funding acquisition, and Writing—review and editing. S.Z., conceptualization, supervision, and writing—review and editing. C.Z. and J.Y. (Jintao Yang), investigation, validation, and supervision. All authors have read and agreed to the published version of the manuscript.
Funding
This research was financially supported by the Hunan Province Engineering Construction Local Standard Making (Revision) Plan Project (Grant number: BZ20220005). The sponsor is Hunan Pankou Leasing Co., Ltd.
Data Availability Statement
Data are contained within the article.
Acknowledgments
The authors wish to acknowledge the National Engineering Laboratory’s technical support for High-Speed Railway Construction of the School of Civil Engineering, Central South University.
Conflicts of Interest
The authors declare no conflicts of interest. The authors declare that this study received funding from Hunan Pankou Leasing Co., Ltd. The funder designed and provided the original test specimens but was not involved in the study design, collection, analysis, interpretation of data, the writing of this article or the decision to submit it for publication.
References
- Sakhakarmi, S.; Park, J.; Asce, A.M.; Cho, C.; Student, P.D. Enhanced Machine Learning Classification Accuracy for Scaffolding Safety Using Increased Features. J. Constr. Eng. Manag. 2019, 145, 04018133. [Google Scholar] [CrossRef]
- Zhao, Z.; Chen, Z. Analysis of Door-Type Modular Steel Scaffolds Based on a Novel Numerical Method. Adv. Steel. Constr. 2016, 12, 316–327. [Google Scholar] [CrossRef]
- Bin, L.; Bo, Z. Parameterized Computing System on Structure of Lift Scaffolding Attached to the Wall. Appl. Mech. Mater. 2012, 130–134, 3972–3977. [Google Scholar]
- Wu, K.; de Soto, B.G.; Adey, B.T.; Zhang, F. BIM-Based Estimation of Vertical Transportation Demands during the Construction of High-Rise Buildings. Autom. Constr. 2020, 110, 102985. [Google Scholar] [CrossRef]
- Laleicke, P.F.; Cimino-Hurt, A.; Gardner, D.; Sinha, A. Comparative Carbon Footprint Analysis of Bamboo and Steel Scaffolding. J. Green Build. 2015, 10, 114–126. [Google Scholar] [CrossRef]
- Hoła, B.; Nowobilski, T.; Woźniak, Z.; Białko, M. Qualitative and Quantitative Analysis of the Causes of Occupational Accidents Related to the Use of Construction Scaffoldings. Appl. Sci. 2022, 12, 5514. [Google Scholar] [CrossRef]
- Cho, C.; Kim, K.; Park, J.; Cho, Y.K. Data-Driven Monitoring System for Preventing the Collapse of Scaffolding Structures. J. Constr. Eng. Manag. 2018, 144, 04018077. [Google Scholar] [CrossRef]
- Chuang, K.-Y.; Tserng, H.-P. A Study of Automated Intelligent Monitoring of Scaffolding Safety for Construction Projects. J. Chin. Inst. Eng. 2024, 47, 626–642. [Google Scholar] [CrossRef]
- Jin, Z.; Gambatese, J. Exploring the Potential of Technological Innovations for Temporary Structures: A Survey Study. J. Constr. Eng. Manag. 2020, 146, 04020049. [Google Scholar] [CrossRef]
- Prabhakaran, U.; Beale, R.G.; Godley, M.H.R. Analysis of Scaffolds with Connections Containing Looseness. Comput. Struct. 2011, 89, 1944–1955. [Google Scholar] [CrossRef]
- Pieńko, M.; Błazik-Borowa, E. Numerical Analysis of Load-Bearing Capacity of Modular Scaffolding Nodes. Eng. Struct. 2013, 48, 1–9. [Google Scholar] [CrossRef]
- Cai, Q.; Ma, J.; Xie, Y.M.; San, B.; Zhou, Y. Topology Optimization and Diverse Truss Designs Considering Nodal Stability and Bar Buckling. J. Constr. Steel Res. 2025, 224, 109128. [Google Scholar] [CrossRef]
- Song, S.; Zhao, Y.; Liang, F.; Guo, H.; Zhang, T.; Li, P.; Xiong, G. Optimization of Lower Suspension Point Position in Attached Cantilever Scaffold. Buildings 2024, 14, 2592. [Google Scholar] [CrossRef]
- Zhang, H.; Chandrangsu, T.; Rasmussen, K.J.R. Probabilistic Study of the Strength of Steel Scaffold Systems. Struct. Saf. 2010, 32, 393–401. [Google Scholar] [CrossRef]
- Beale, R.G. Scaffold Research—A Review. J. Constr. Steel Res. 2014, 98, 188–200. [Google Scholar] [CrossRef]
- Peng, J.-L.; Chen, K.-H.; Chan, S.-L.; Chen, W.T. Experimental and Analytical Studies on Steel Scaffolds under Eccentric Loads. J. Constr. Steel Res. 2009, 65, 422–435. [Google Scholar] [CrossRef]
- Zhang, H.; Rasmussen, K.J.R.; Ellingwood, B.R. Reliability Assessment of Steel Scaffold Shoring Structures for Concrete Formwork. Eng. Struct. 2012, 36, 81–89. [Google Scholar] [CrossRef]
- Hongbo, L.; Yuan, Z.; Zhiua, C.; Qun, L. Structural Performance and Design Method of New Mortise–Tenon Full Steel-Tube Scaffold. Adv. Steel Constr. 2018, 14, 291–307. [Google Scholar]
- Peng, J.-L.; Wang, P.-L.; Chan, S.-L.; Wu, P.-K. Experimental Study on Load-Bearing Capacities of Frame-Type Scaffolds Used in Precast Construction. Int. J. Steel Struct. 2020, 20, 400–414. [Google Scholar] [CrossRef]
- Liu, H.; Wang, X.; Li, Z.; Zhong, Z. Comparative Study on Ultimate Stress Test and COMSOL Analysis of Steel Beam of Pull-Up Cantilever Scaffold. Adv. Transdisc. Eng. 2022, 31, 525–531. [Google Scholar]
- Zhang, C.; Yang, J.; Jiang, L.; He, Y. Experimental Studies and Finite Element Analysis of Socket-Type Keyway Steel Pipe Scaffolding. Buildings 2024, 14, 245. [Google Scholar] [CrossRef]
- Liu, F.; Yang, J.; Wang, J.; Hu, C. Study on Application of Long Cantilever Support Frame. Constr. Technol. 2013, 42, 25–27. (In Chinese) [Google Scholar]
- Yan, X.M. Upper Cantilevered Scaffold Construction Technology Analysis of Ultra-High Tower. Adv. Mater. Res. 2012, 446–449, 3698–3701. [Google Scholar] [CrossRef]
- Peng, J.-L.; Ho, C.-M.; Lin, C.-C.; Chen, W.-F. Load-Carrying Capacity of Single-Row Steel Scaffolds with Various Setups. Adv. Steel Constr. 2015, 11, 185–210. [Google Scholar]
- Kim, A.; Lee, K.; Lee, S.; Song, J.; Kwon, S.; Chung, S. Synthetic Data and Computer-Vision-Based Automated Quality Inspection System for Reused Scaffolding. Appl. Sci. 2022, 12, 10097. [Google Scholar] [CrossRef]
- Dzeng, R.-J.; Cheng, C.-W.; Cheng, C.-Y. A Scaffolding Assembly Deficiency Detection System with Deep Learning and Augmented Reality. Buildings 2024, 14, 385. [Google Scholar] [CrossRef]
- Zhao, J.; Chen, J.; Liang, Y.; Xu, Z. Feature Selection-Based Method for Scaffolding Assembly Quality Inspection Using Point Cloud Data. Buildings 2024, 14, 2518. [Google Scholar] [CrossRef]
- Chen, L.; Zhao, Q. The Application Comparison of Bottom Anchored Cable-Stayed Cantilever Scaffold in Building Assembly. In Proceedings of the 2018 7th International Conference on Energy and Environmental Protection (ICEEP 2018), Shenzhen, China, 4–15 July 2018; Atlantis Press: Shenzhen, China, 2018. [Google Scholar]
- Huang, Z.; Chen, Q.; Ran, X.; Lan, S.; Wang, Z. Construction Technology of Cantilever Scaffold of Bolt Connection. Constr. Technol. 2018, 47, 419–425. (In Chinese) [Google Scholar]
- Chen, N.; Yin, F.; Shi, W. Construction Technology of the Support Frame with Combination of I Steel Inclined Support and Steel Cantilever Beam. Constr. Technol. 2015, 44, 88–90. (In Chinese) [Google Scholar]
- Wang, S.; Wu, Z.; Liu, Y. Study on the Design and Calculation of Cantilever Scaffold-Type Steel Cantilever Beam. Build. Struct. 2023, 53, 1150–1154. (In Chinese) [Google Scholar]
- Qi, J.; Shi, J.; Huang, H.; Wu, H. Application of Suspended Section Steel Scaffold Buckled with Lever TypeBasket to High-Rise Building Construction. Build. Constr. 2012, 34, 435–437. (In Chinese) [Google Scholar]
- Mao, J.; Guo, X.; Wu, F.; Wang, D.; Li, H. Research and Application of Basket Pull Rod Cantilever Scaffold Construction. Build. Constr. 2021, 43, 2101–2103. (In Chinese) [Google Scholar]
- GB/T 699-2015; Quality Carbon Structure Steels. Chinese Standards Institution: Beijing, China, 2015.
- GB/T 700-2006; Carbon Structural Steels. Chinese Standards Institution: Beijing, China, 2006.
- GB/T 706-2016; Hot Rolled Section Steel. Chinese Standards Institution: Beijing, China, 2016.
- Ranganathan, A. The Levenberg-Marquardt Algorithm. Tutorial LM Alg. 2004, 11, 101–110. [Google Scholar]


Disclaimer/Publisher’s Note: The statements, opinions and data contained in all publications are solely those of the individual author(s) and contributor(s) and not of MDPI and/or the editor(s). MDPI and/or the editor(s) disclaim responsibility for any injury to people or property resulting from any ideas, methods, instructions or products referred to in the content. |
© 2025 by the authors. Licensee MDPI, Basel, Switzerland. This article is an open access article distributed under the terms and conditions of the Creative Commons Attribution (CC BY) license (https://creativecommons.org/licenses/by/4.0/).