Abstract
Residential buildings are turning out to be huge power-consumption units that accommodate multiple families. To limit energy consumption and environmental impacts, conventional buildings are being retrofitted as green buildings. However, due to the lack of awareness among residents and construction agencies, the adoption pace of green building retrofitting is slow. Under current retrofitting procedures, the building envelopes have been given great attention, which is an expensive and complex process. However, the sizing of lighting and cooling loads has not been considered in the retrofitting process, and careful attention is needed as they are major building loads. In this research, an appropriate sizing of lighting and cooling loads, along with optimized water consumption, is performed. The sizing is obtained using the parametric variations, i.e., varying the coefficient of utilization (CU) factor of lighting and the wall-to-window ratio (WWR) of different rooms to quantify their impact on power consumption. The optimization of water consumption is performed using particle swarm optimization. A case study of a residential building was taken, and a residential unit was considered in the study. It was found that parametric variations can reduce sizing, which has a significant impact on the overall power consumption, whereas optimizing the water consumption can significantly reduce the utilization of water in the building. Finally, the comparison is made in terms of power consumption for the current practices and the optimal analysis. It was found that with the proposed sizing and subsequent retrofitting, the lighting consumption was reduced to 34%, whereas the space cooling requirements were reduced to 19%.
1. Introduction
Green buildings play an important role in energy sustainability in urban areas [1]. With the rapid growth in urban areas around the world, the construction of the building has massively increased [2]. The building’s construction impacts dynamically range from construction material utilization to massive energy consumption, encompassing water requirements [3]. The exponential increase in building construction drives the attention of researchers towards green building constructions and retrofitting to reduce energy consumption and utilize sustainable construction materials.
There are several factors that account for sustainable green building transition. From building envelope retrofit [4] to electrical [5] and water retrofitting [6], there are several parameters that may be changed or transformed in order to achieve green building certification. With several parameters in the list, the economic parameters that may return higher savings must be highlighted in order to provide a better understanding of the transition from conventional to green building.
Currently, the research is more focused on developing frameworks or step-by-step guides for the transition to green buildings. The focus and attention are more on developing frameworks that may reduce building energy consumption. However, the cost and complexity involved in retrofitting practices have not been given much attention. Researchers in ref. [7] have analyzed the green building performance in terms of water and energy savings in Dalian, China, with a focus on building materials and orientation impact on energy consumption. Similarly, Researchers in ref. [8] have comprehensively developed a green building assessment framework to identify the factors influencing the building envelope while analyzing the Life Cycle Cost analysis. Though researchers have comprehensively designed a framework for building, the main focus is related to the building envelope and associated building material, which is a complex process in terms of practical application and implementation.
Another focus of research in the current framework development is the implementation of optimization and Artificial Intelligence based algorithms. These algorithms help researchers in many ways with effective retrofitting. Research studies in ref. [9] have integrated Artificial Intelligence (AI) based algorithms to forecast the energy consumption needs in the buildings while providing an opportunity to analyze the forecasting results in order to reduce the overall energy consumption. The authors claim that there will be 9% energy savings by 2050 when AI-based algorithms are used in green buildings. The research study in ref. [10] has developed a model to identify the parameters that critically impact thermal comfort. The optimization algorithm is used to identify the crucial parameters of thermal comfort and alternative retrofits according to green building standards. It was found that wall-to-window ratio, insulation, and external wall thickness are the critical parameters that may impact energy consumption and thermal comfort. A framework comprising Building Information Management (BIM) is developed to identify the steps needed for the retrofitting of the buildings [11]. Authors in ref. [12] have introduced green façade for industrial buildings in order to reduce the overall cooling load power consumption. It was found that while introducing the proposed retrofitting technique, the cooling requirement was reduced to 14%. The study mainly focused on the walls, windows, and external building envelope retrofitting. Researchers in ref. [13] have conducted a study to develop an optimization framework for building thermal comfort using a machine learning algorithm and Petri Net control system; the main focus of this study was on the building envelope, windows, the material of walls, and their thickness. The research study in ref. [14] has conducted a retrofitting analysis on the Mosque. The research study comprehensively develops a framework for analyzing the actions that could be taken while retrofitting the building. Using the TOPSIS model, the best possible retrofitting options are taken into account. In a similar study [15], a genetic algorithm was utilized with energy simulations and computational fluid dynamics (CFD) to optimize building design for different regions. The study was conducted in an actual building in Kabul, Afghanistan. The research study in ref. [16] used multi-objective optimization to retrofit office buildings in Indonesia. The environmental and social criteria were used for implementing the retrofitting strategy using multi-objective optimization, where the parameters were façade type, cooling set point, wall-to-window ratio, glazing type, façade type, and HVAC template.
Apart from Optimization techniques for construction, architecture, and building materials, some research studies have also focused on highlighting the impact of lighting, cooling, and heating systems in their framework. Authors in ref. [17] have identified that the passive design of buildings can help in reducing energy consumption. Building thermal mass, natural ventilation, daylighting, and site orientation are some key factors that help in reducing energy consumption in green buildings through passive designs. The research study in ref. [18] has identified factors that should be taken care of while designing green buildings in the urban sector. Several factors, including energy efficiency, lighting, and energy consumption in cooling and heating, were identified; however, the associated economic impact or retrofitting costs were missing. The researchers in ref. [19] have developed a comprehensive framework for retrofitting office buildings. Researchers have identified the parameters such as lighting, HVAC, cooling, heating, and building envelope as key indicators for retrofitting along with the economics involved. The research study conducted in ref. [20] has estimated the impact of retrofitting on the environment in relation to urban density. In the proposed model, the retrofitting material of the building construction has been evaluated in terms of embodied energy and embodied carbon.
It is evident from the literature review that frameworks, methodologies, and design considerations for retrofitting the old building for its transition to green building mainly revolve around the building envelope while optimizing its cooling and thermal performance. However, the techniques used in the literature review show encouraging results. However, the realistic implementation of advanced materials has high initial costs, implementation issues, and long-term performance uncertainties [21].
There is a research gap in identifying the low-cost and easy-to-implement retrofitting measures in old buildings. One proposed way is to re-evaluate the sizing of cooling and lighting loads while appropriately selecting the parameters affecting it. Up to the author’s knowledge, a few research studies have been conducted to optimally size the lighting, cooling, and water consumption requirements as part of the retrofitting process, and often, the appropriate sizing is left unattended.
There is a need to explore low-cost retrofitting solutions through appropriate sizing that may be achieved without expensive retrofitting procedures while having impactful results on power consumption.
Taking this motivation, this research study evaluates the appropriate sizing of lighting and cooling load and quantifies the impact using the lighting coefficient of utilization and window ratio of residential units. The water consumption is optimized using the PSO optimization algorithm while considering the water usage in all major utilization areas of the residential unit. The integrated lighting, building envelope, and water-optimized retrofitting are performed, but they have not been studied together as per the knowledge of the authors. This research study will encourage the stakeholders to initiate low-budget retrofitting and gain high-impact savings, reducing the overall cost of high-retrofitting implementation frameworks.
2. Methodology
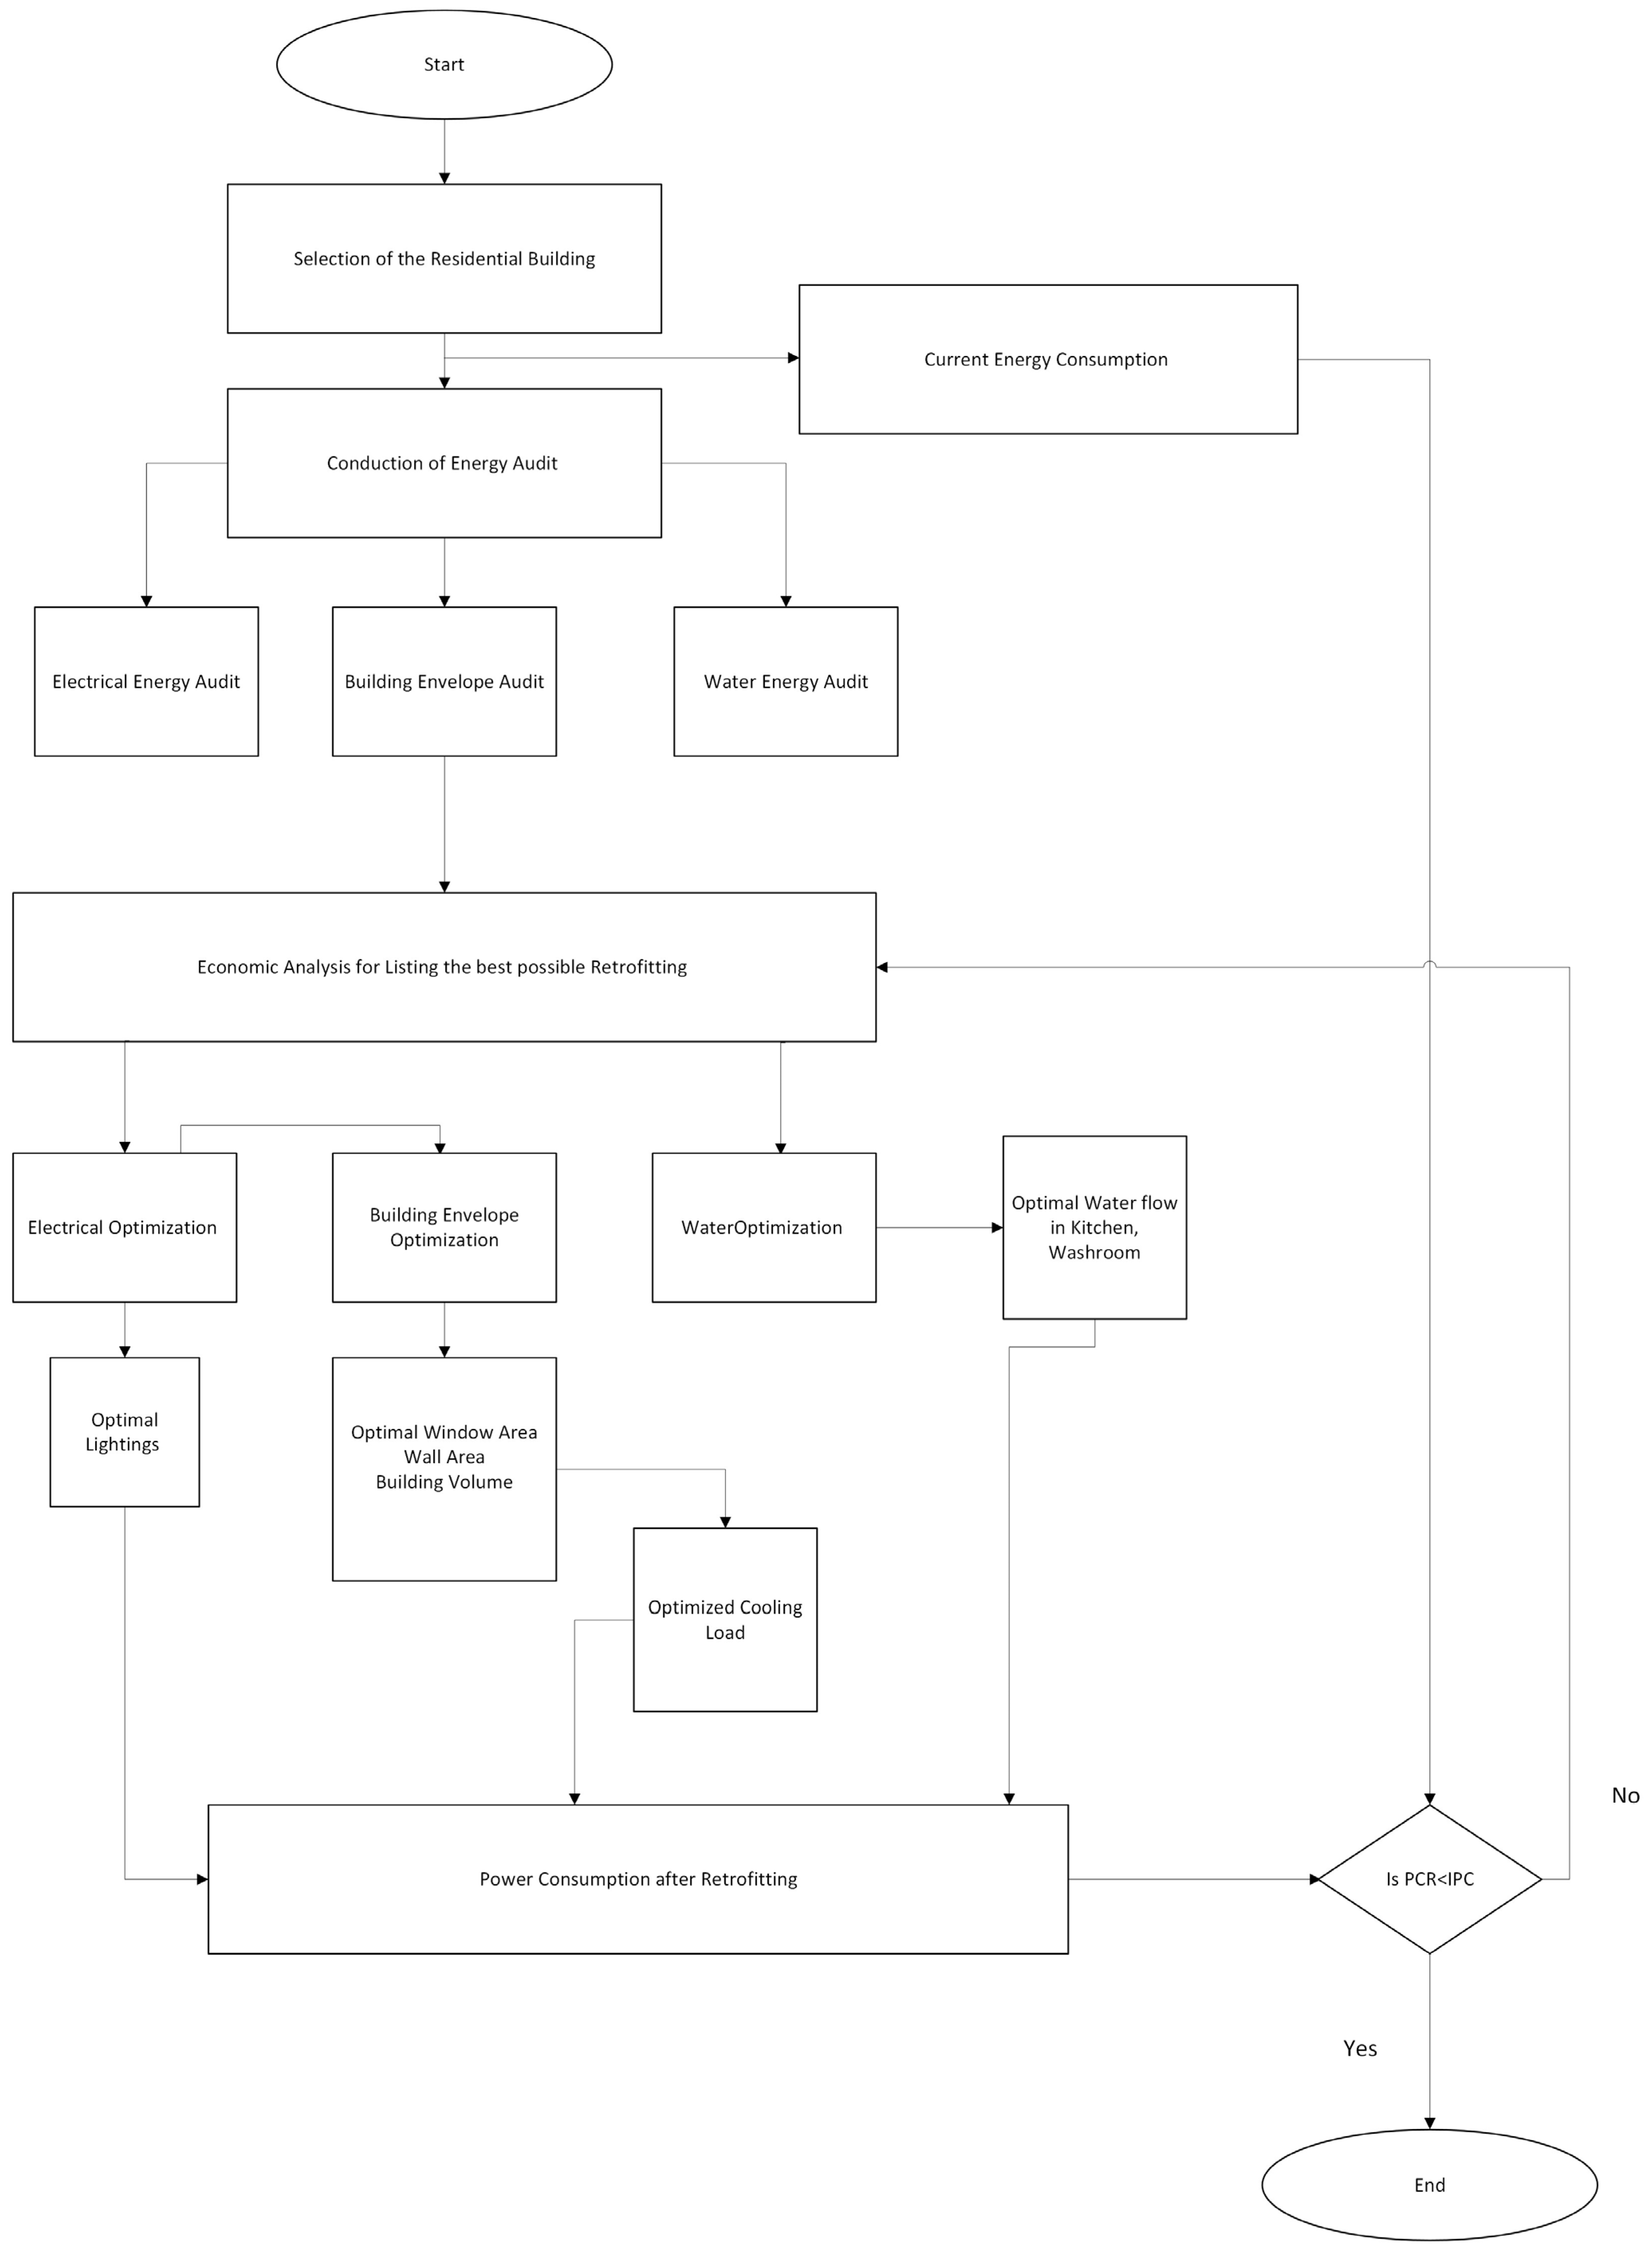
The methodology flowchart is shown in Figure 1, where the first step is parametric evaluation through the conduction of specific energy audits and subsequent sizing of the lighting, cooling, and water requirements. The second step is to employ retrofitting practices, i.e., reducing the load or changing the orientation of rooms according to economic sizing. The third step is to quantify the energy saved.
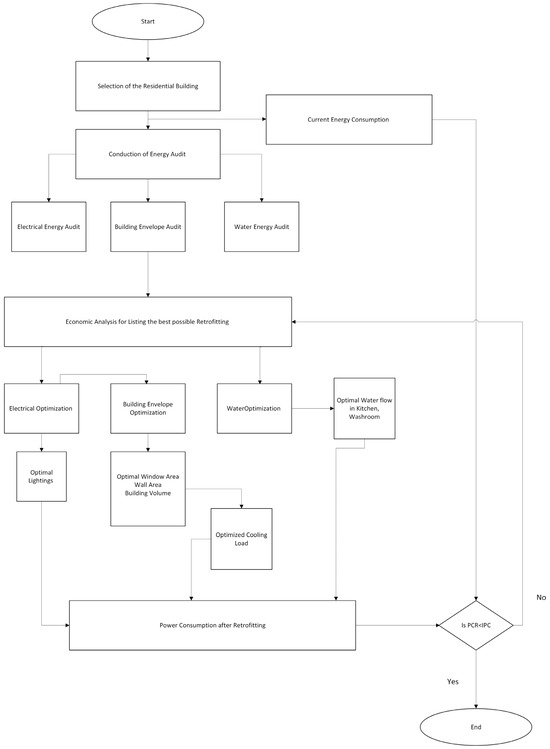
Figure 1.
Green building sizing and retrofitting assessment framework.
2.1. Energy Profiling of the Residential Unit
In this research article, the residential building data in Lahore, Pakistan, were used.
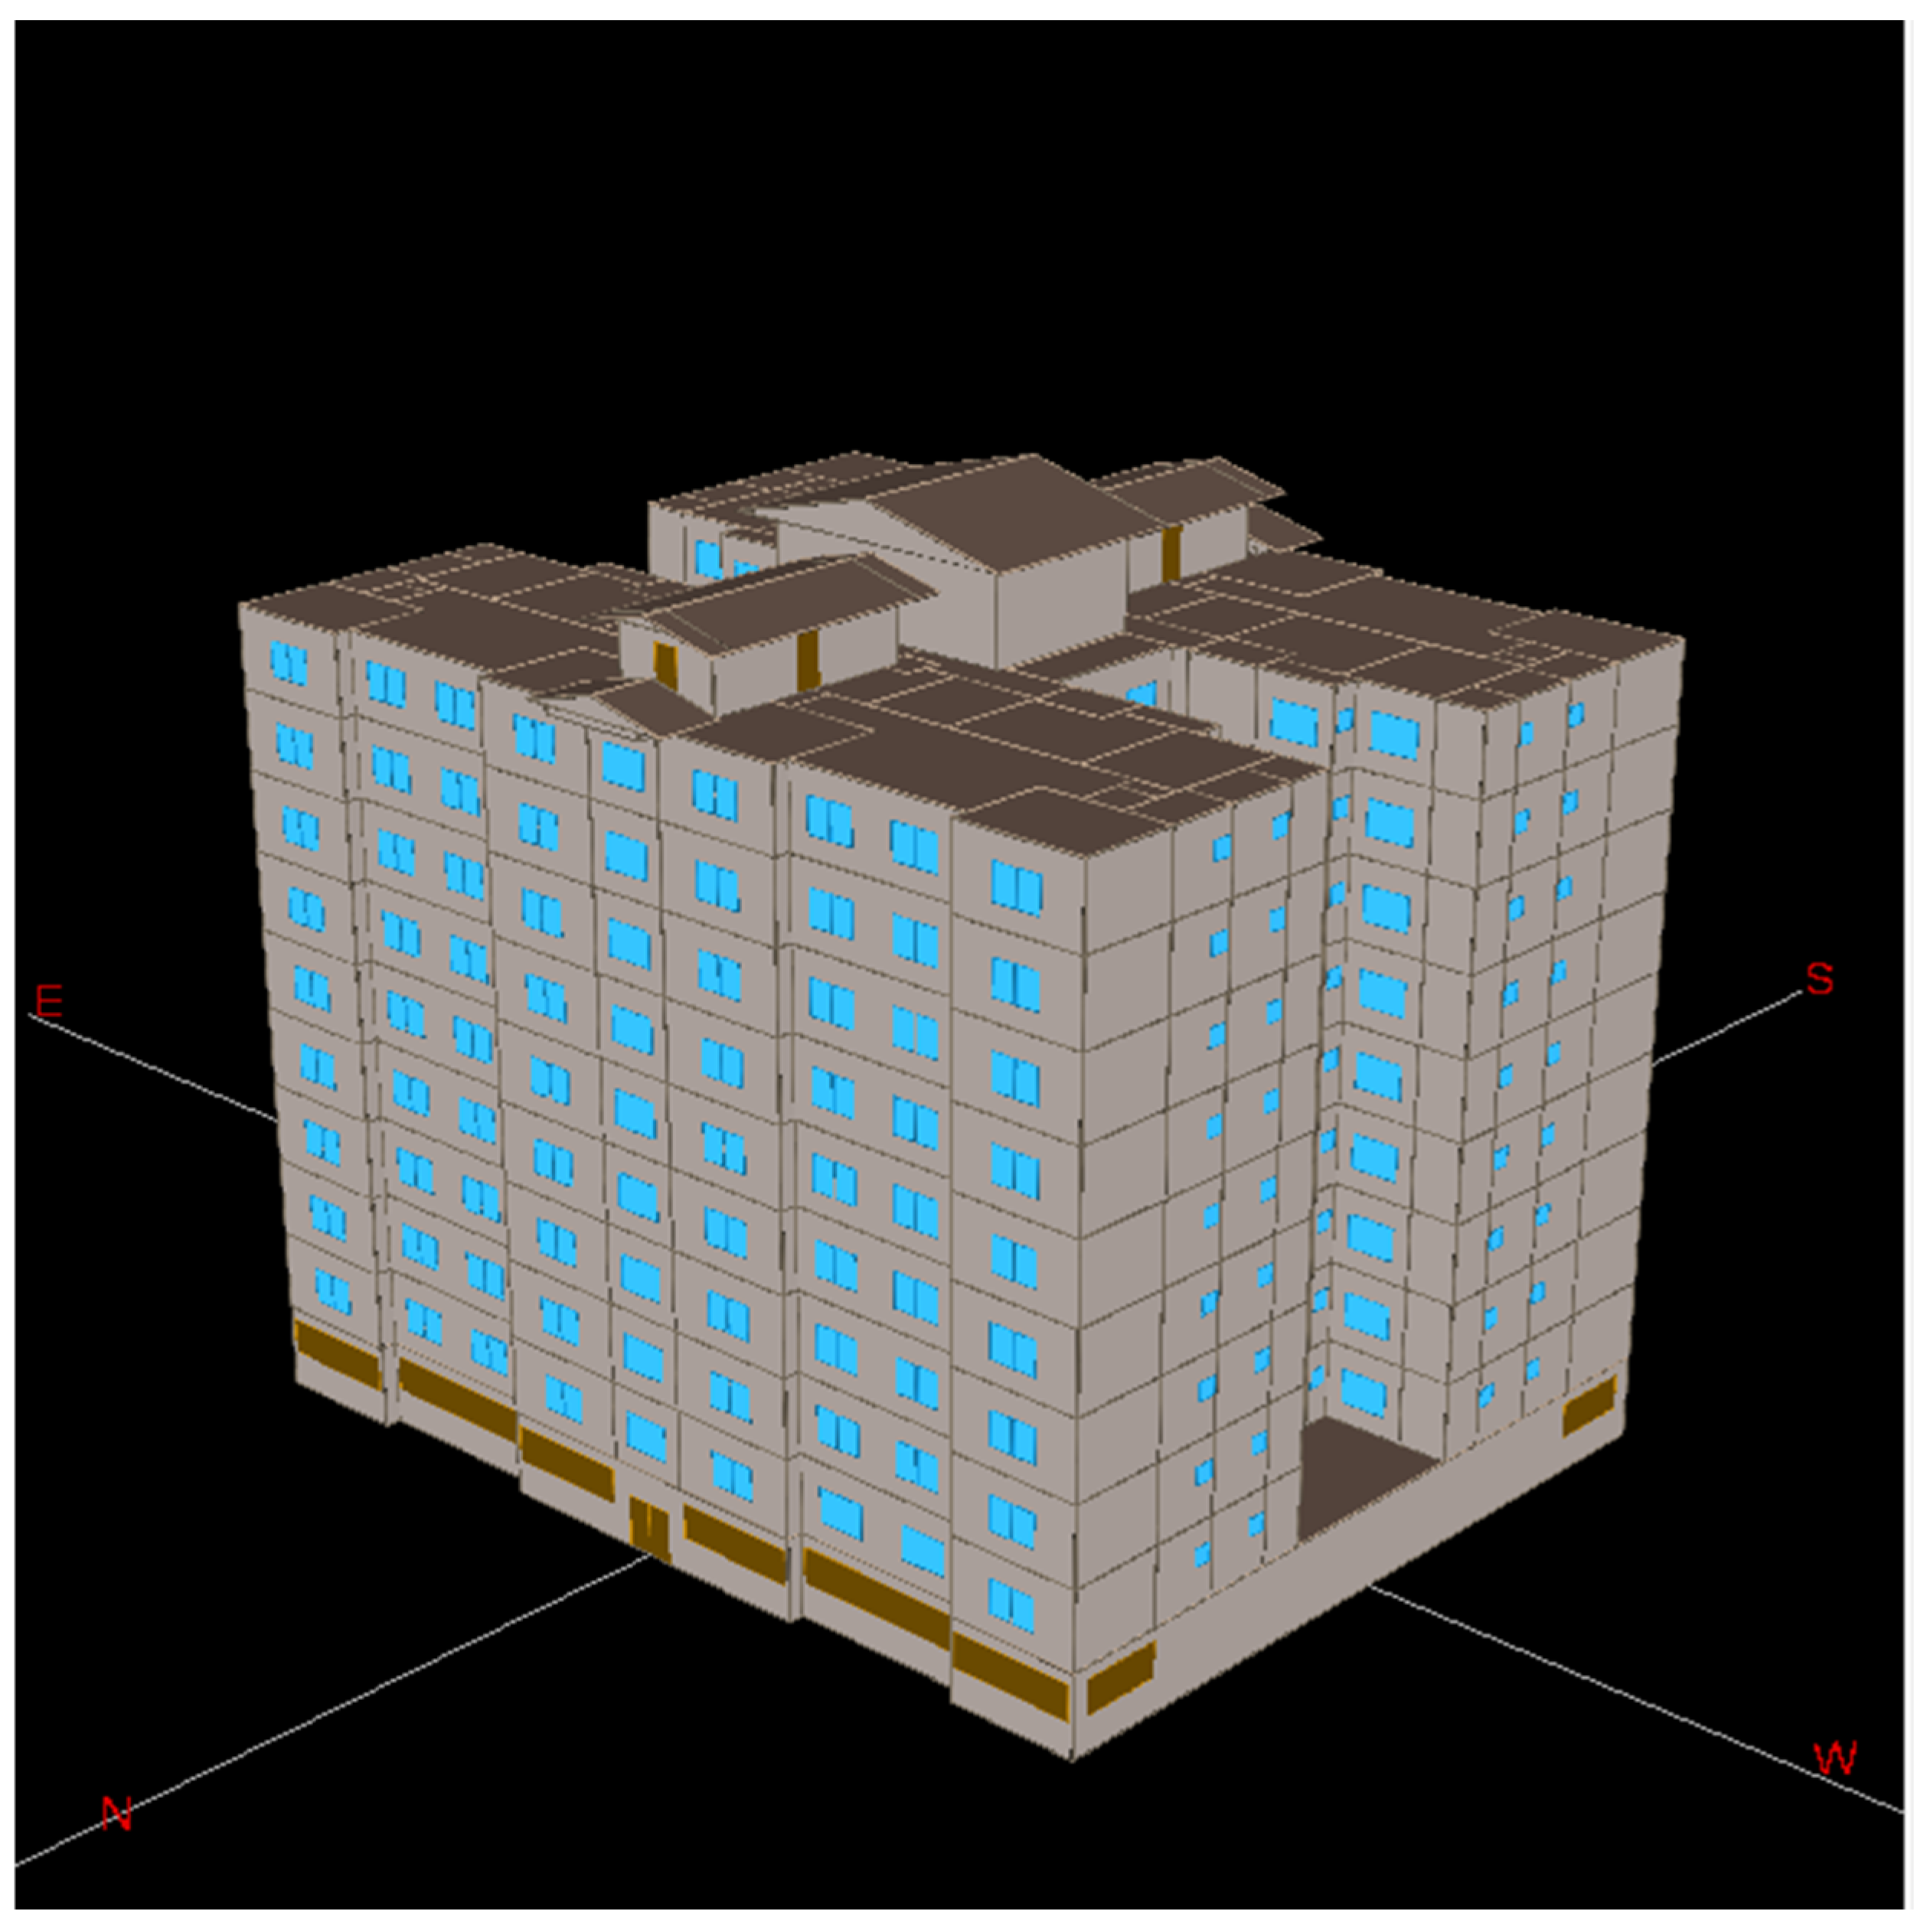
The building layout drawings were used to evaluate the room orientation and sizes, and the size of the windows was used to evaluate the WWR. For lighting load, the researcher physically inspected the building. Furthermore, the data on lighting were also taken from the building administration, including the types and wattages of lights being installed. To evaluate the overall consumption of the residential building, one unit of the building was studied in detail. The bill was analyzed to evaluate the building’s effective load consumption during the summer season. Moreover, interviews with residents were conducted to evaluate the timings of running the heating and cooling loads. The interviews of the consumption patterns were then used to develop a building model in software to analyze the overall consumption trends by developing a load profile. The building model was developed using the Energy Plus software, as shown in Figure 2. Through the questionnaire, the total approximated load in each residential unit was estimated, which is shown in Table 1.

Figure 2.
Energy plus model of the residential building.

Table 1.
Details of room-wise appliances in the residential unit.
The following assumptions were made while developing the energy plus building software:
- The type of lights installed in the residential units are the same to keep the illuminance level simpler for analysis, which will help to evaluate the number of fixtures.
- The WWR of all windows in the residential building was kept the same.
Table 1 shows the type of load installed in a 12-floor residential building of 14,750 sq. ft. There are mainly three bedrooms in the residential building with a drawing room, dining room, kitchen, and servant room. The biggest room is the dining room, followed by the drawing room and kitchen. All the residential units are provided with balconies with a fixed WWR ratio of bedrooms. The building envelope is made of concrete blocks, and there are no energy consumption measures in terms of thermal insulation, such as insulation of the roof, walls, shades on the windows, and double-glazed windows that have been performed so far that may improve the building’s thermal condition. The windows installed are single-glazed, and there is no central heating or cooling system in the buildings.
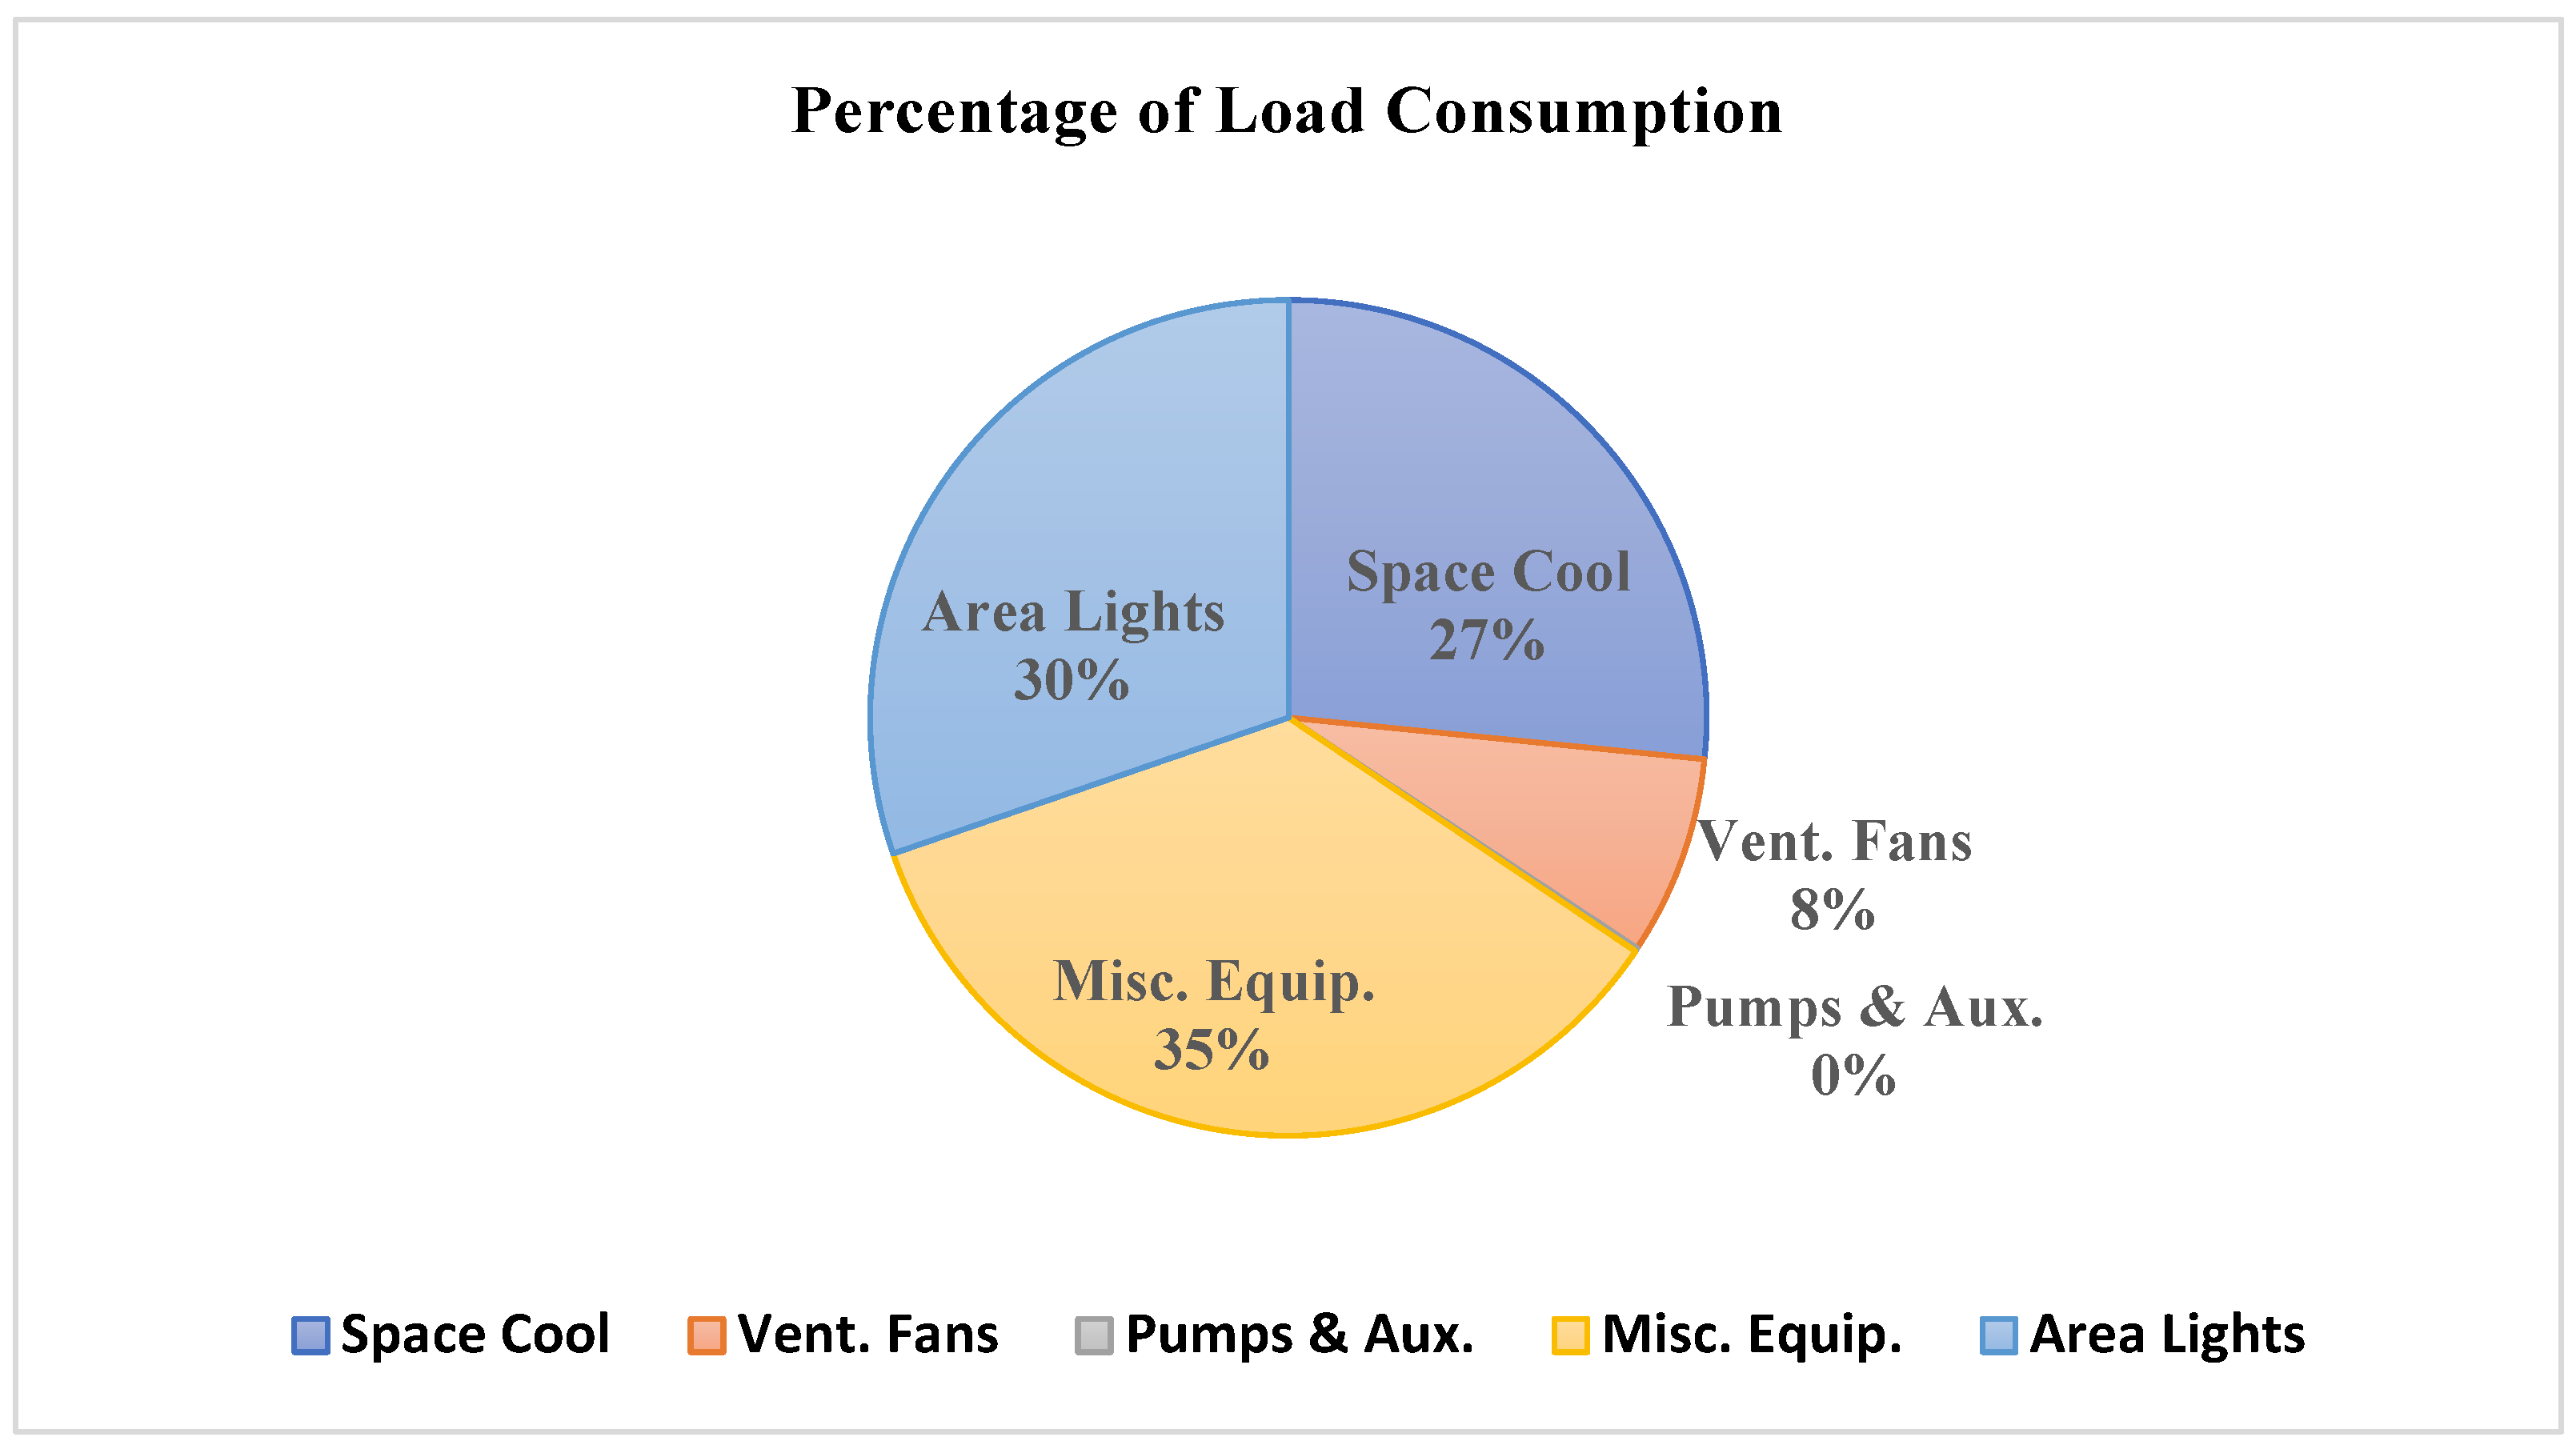
It can be seen in Figure 3 that the highest load for the entire 24-h cycle comprises the miscellaneous load followed by the cooling and lighting loads that account for significant contribution. As shown in Figure 3, the lighting load accounts for 30% and space cooling with vent fans accounts for 35%. The accumulative impact of cooling and lighting load is 65%. The miscellaneous load that includes pumps, heating loads, washing machines, microwave ovens, TVs, Refrigerators, etc., accounts for 30%.
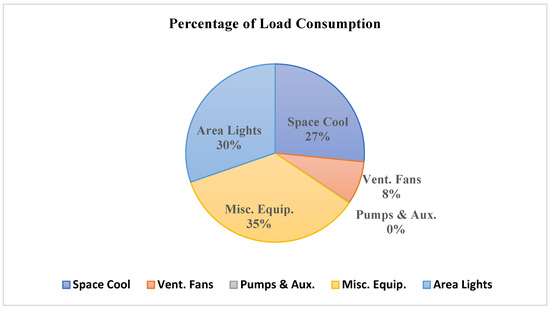
Figure 3.
Percentage of load consumption.
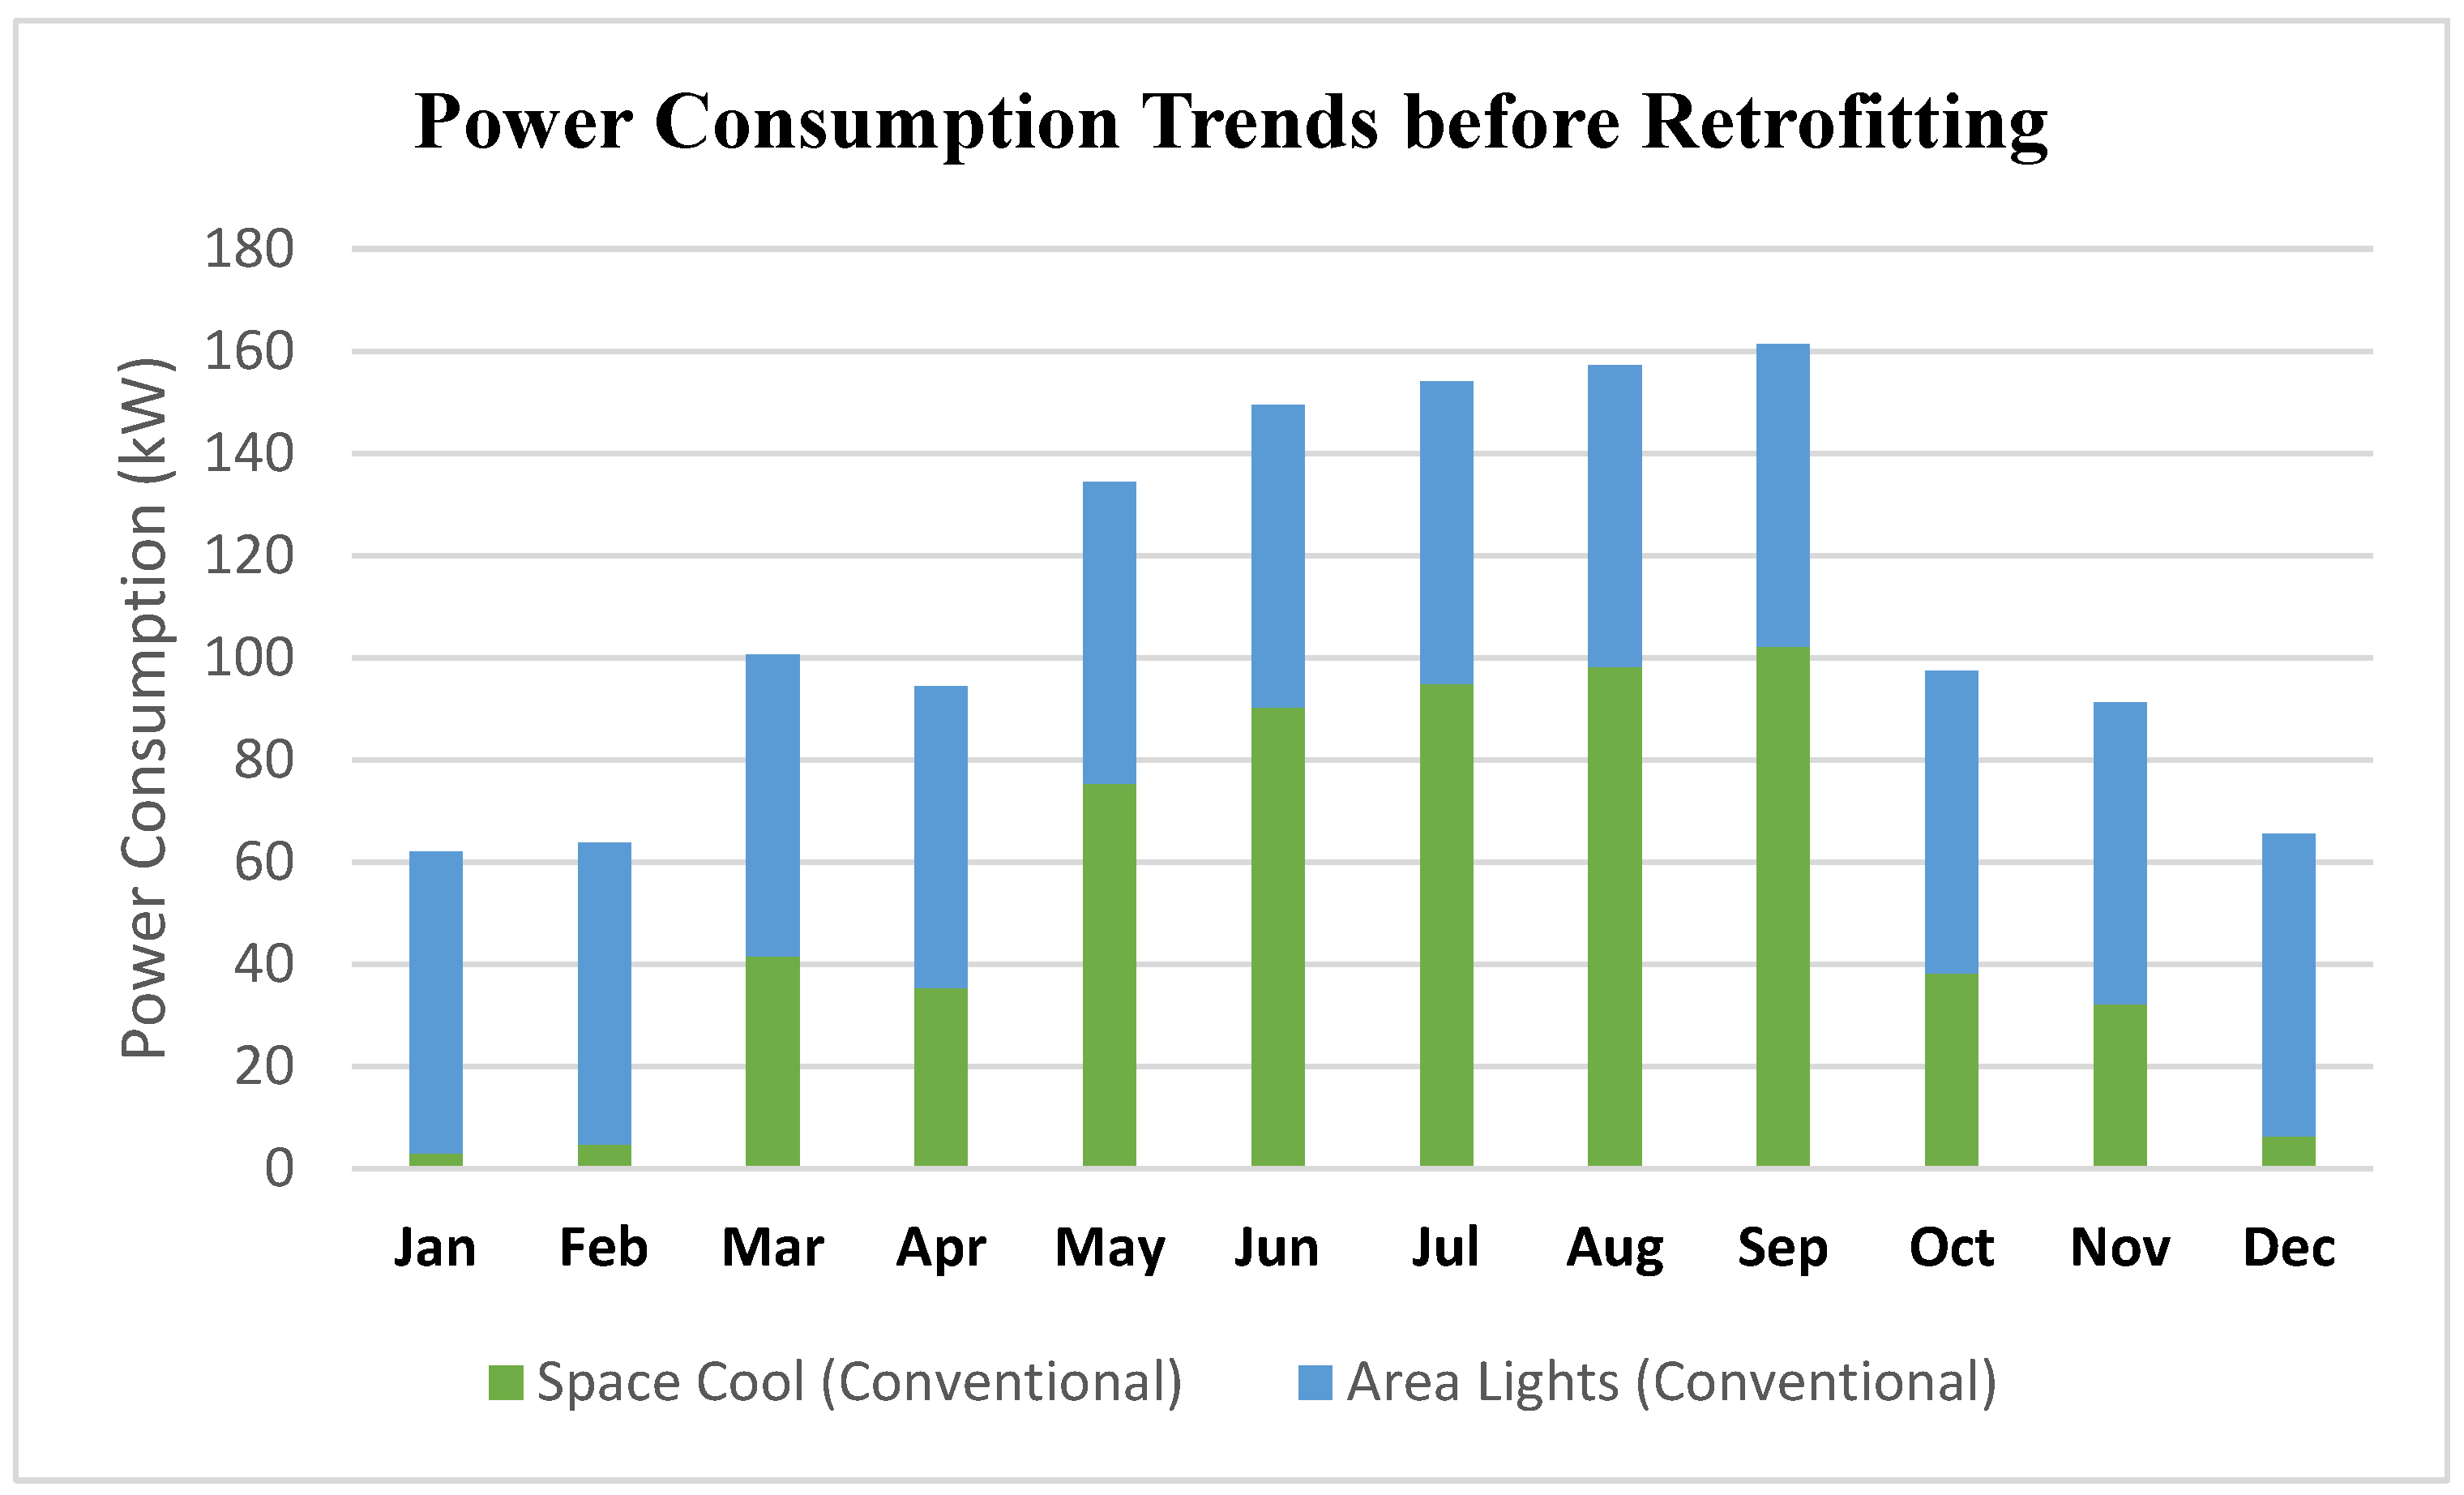
It is evident from the single apartment analysis that cooling and lighting loads have a significant impact on the overall load consumption. In this research, the cooling and lighting loads have been considered major load consumption units, and their annual profile has been developed based on the available load profiling through interviews and bill analysis. Figure 4 shows the monthly load profiling of the lighting and cooling loads. The heating loads have not been considered due to the climatic factor of the location, which remains hot during the 9 months of the year. The cooling load of the single residential unit accounts for 622 kWh per year. At the same time, the lighting load of a single residential unit accounts for 709 kWh in a year, and 81 Watts of light operate during the 24 h. The lighting load is higher due to the fact that the cooling load does not operate for 3 months in a year.
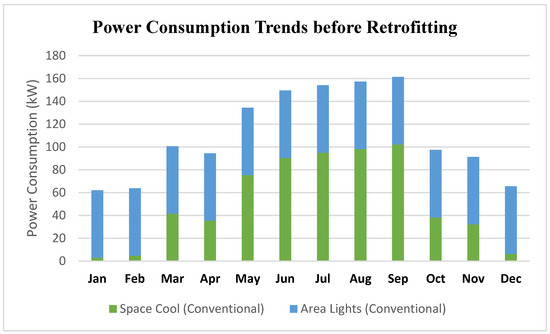
Figure 4.
Power consumption trend before retrofitting.
Since cooling and lighting loads are the key loads of the residential sector [22], this study will focus on reducing the load that may be helpful in the transition from conventional buildings to green buildings during retrofitting procedures.
In this research work, some key factors that may have a higher impact on reducing energy with almost zero investments will be highlighted and validated via quantified analysis. In the first step, parametric sizing shall be performed to focus on targeted factors for improvement.
2.2. Parametric Sizing in a Residential Unit
Unlike conventional sizing methodologies that involve the size of the room [23], the proposed sizing methodology concentrates on parametric sizing where the parameters such as CU and WRR are varied, and their impact on cooling is quantified and based on the area, the CU and WRR the cooling requirements are found. In this research study, the different values of CU and WWR were taken into account, and their impact on power consumption was observed. For CU, the values 0.8 and 0.5 were taken for the study. Similarly, for WWR, the multiple values of 5, 10, 15, and 20 were taken, and their impact on cooling was observed. It was assumed that lighting lumens and wattages were the same, whereas WWR for the different rooms was also the same for the sake of simplified analysis.
2.3. Lighting Energy Audit
This section mathematically evaluates the lighting and cooling loads’ external parameters that impact the electrical load consumption of these loads. The lighting load in any sector can be evaluated by first evaluating the number of fixtures required in the particular location. The number of fixtures can then be used to evaluate the total lighting consumption of that particular location. The number of fixtures can be evaluated using Equation (1) as follows:
where N is the number of fixtures, A is the area, F is the lumens output per fixture, E is the required lux level for specific task CU is the coefficient LLF is the combined loss factor.
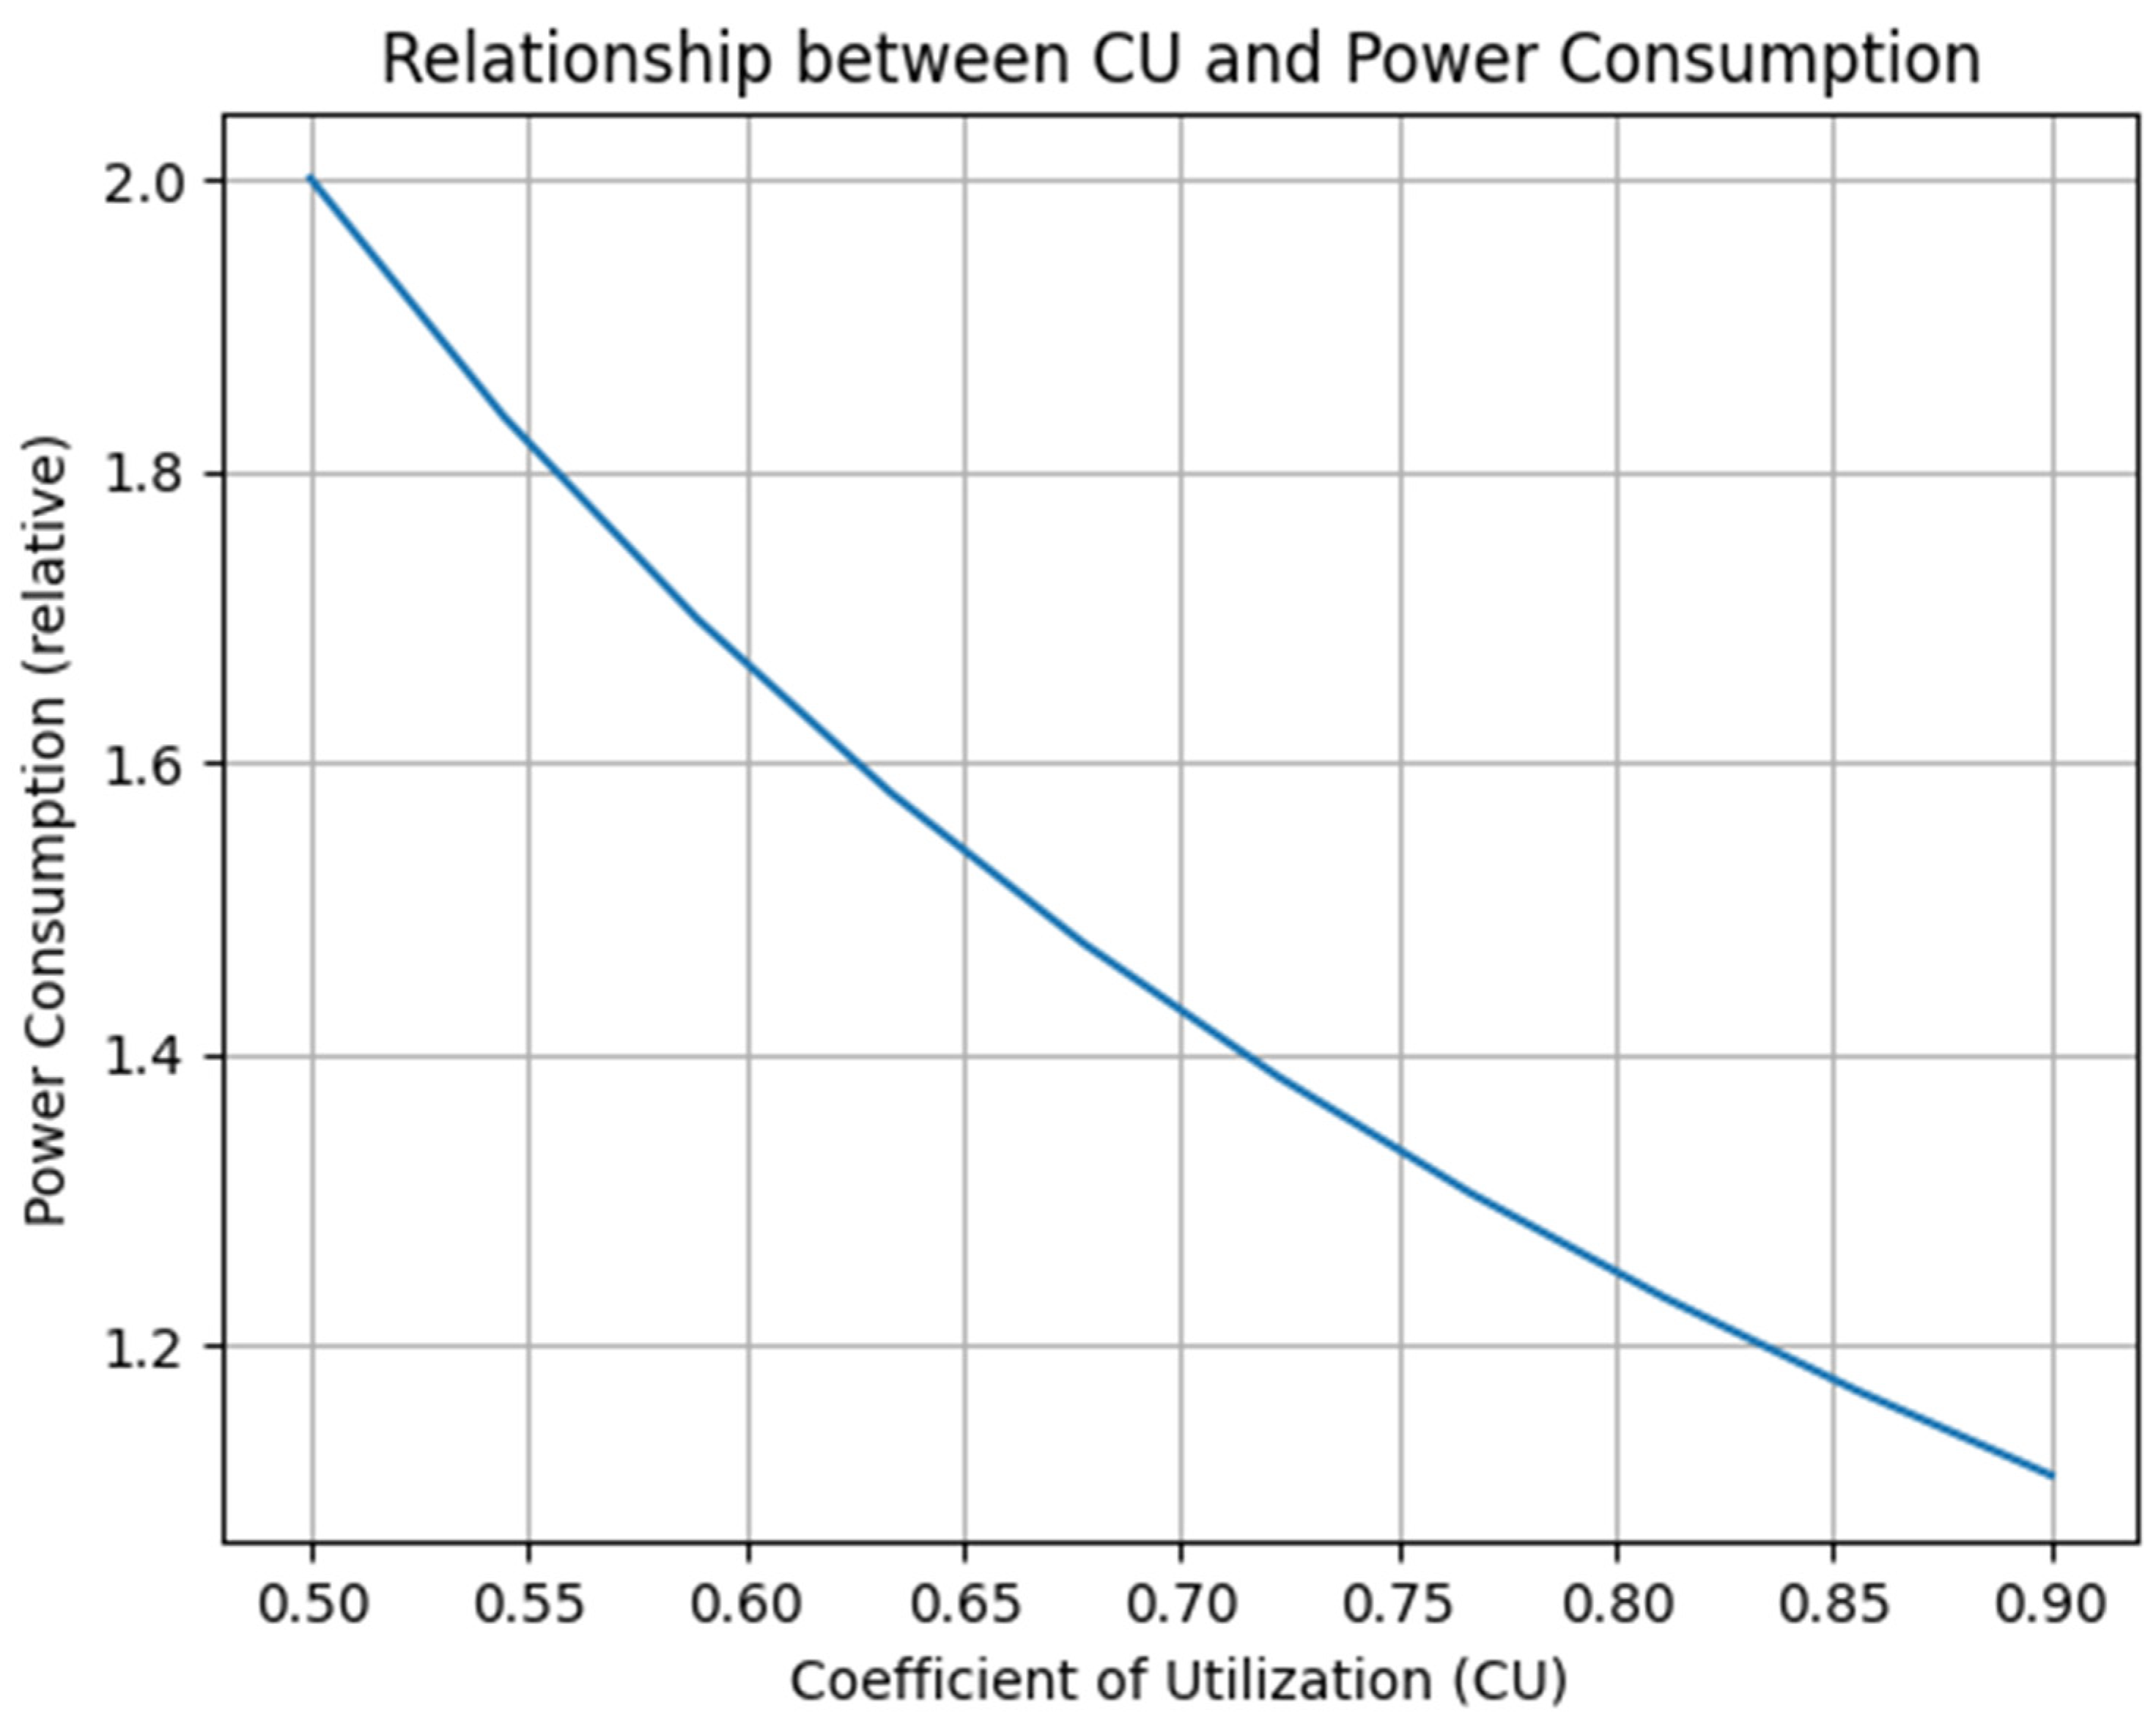
From Equation (1), it can be seen that the number of fixtures depends on the nature of the task, the area, the lumens, and the lux levels. All of the above parameters directly impact the number of fixtures that eventually impact the electrical power requirements. One of the very important factors that is often neglected is CU, i.e., the utilization factor of light. The light that directly reaches the target without any disturbances is the utilization factor. The utilization factor of light depends upon various parameters, the orientation of the furniture placed in the room, and floor type and color. Equation (1) is related to the calculation of the number of fixtures required in any location based on the area of the location, the required lumens, the CU value, and the loss factor. It is worth noting that CU is the factor that is directly linked with the amount of light that reaches the target. The more the light reaches the target, the closer the CU value is to 1 and vice versa. This makes the basis of increasing the CU while just installing the lights where it is required the most; for instance, a light fixture on the study table and above the bed can increase the CU instead of random placement that reduces the CU increases the loss factor eventually increasing the number of fixtures that ultimately increase the wattages. The coefficient of utilization impacts the number of fixtures to be installed, which eventually impacts the power consumption. The blow graph in Figure 5 shows the power consumption trend with a coefficient of utilization. It can be seen that as the CU increases, the power consumption decreases, keeping the loss factor constant.
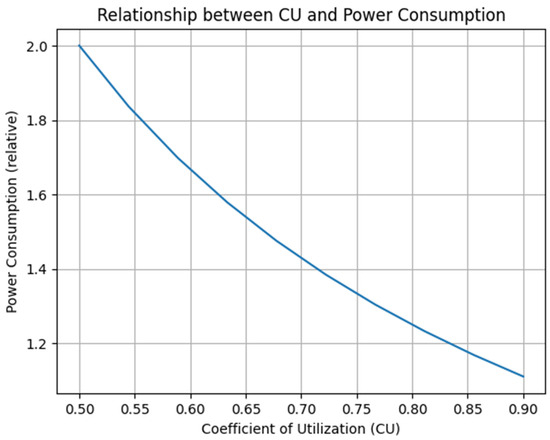
Figure 5.
Relationship between CU and power consumption.
2.4. Building Cooling Load
The cooling load, i.e., cooling required in any room, is dependent on the amount of heat that can be extracted from the area [24]. The heat extracted is equal to the amount of cooling that is injected through the air conditioning. Therefore, the cooling required q is dependent on the area, the temperature difference of the inside room, and ambient temperature, i.e., ΔTand the overall heat transfer coefficient. Mathematically, this can be written as shown in Equation (2) [25] as follows:
where U is the overall heat transfer coefficient as follows:
q = U·A·ΔT
The total area can be divided into the area of the wall and the area of the window as follows:
where Awall is the area of the wall and A_winow is the total area of the window.
From Equation (4), it can be seen that the area of the window is one of the factors that has a direct relation with the impact on cooling. The larger the area, the higher the cooling load requirements. The window area is also dependent on the area of the walls. With a larger wall area, the windows can be adjusted, which eventually leads to cooling requirements. With a proper understanding of the wall area, the optimal window area can be selected to reduce the cooling loads and optimally enhance the lighting requirements. The wall-to-window ratio selection is significant in reducing the cooling requirements. The wall-to-window ratio is given in Equation (5) [26] as follows:
Equation (6) shows the cooling requirements with respect to the wall-to-window ratio [27] as follows:
where;
Qc = (WWR × SHGC × SC) + (UA × ΔT)
- Qc = cooling requirements (W/m2)
- WWR = wall-to-window ratio (dimensionless)
- SHGC = solar heat gain coefficient (dimensionless)
- SC = shading coefficient (dimensionless)
- UA = overall thermal transmittance (W/m2K)
- ΔT = temperature difference between indoors and outdoors (K)
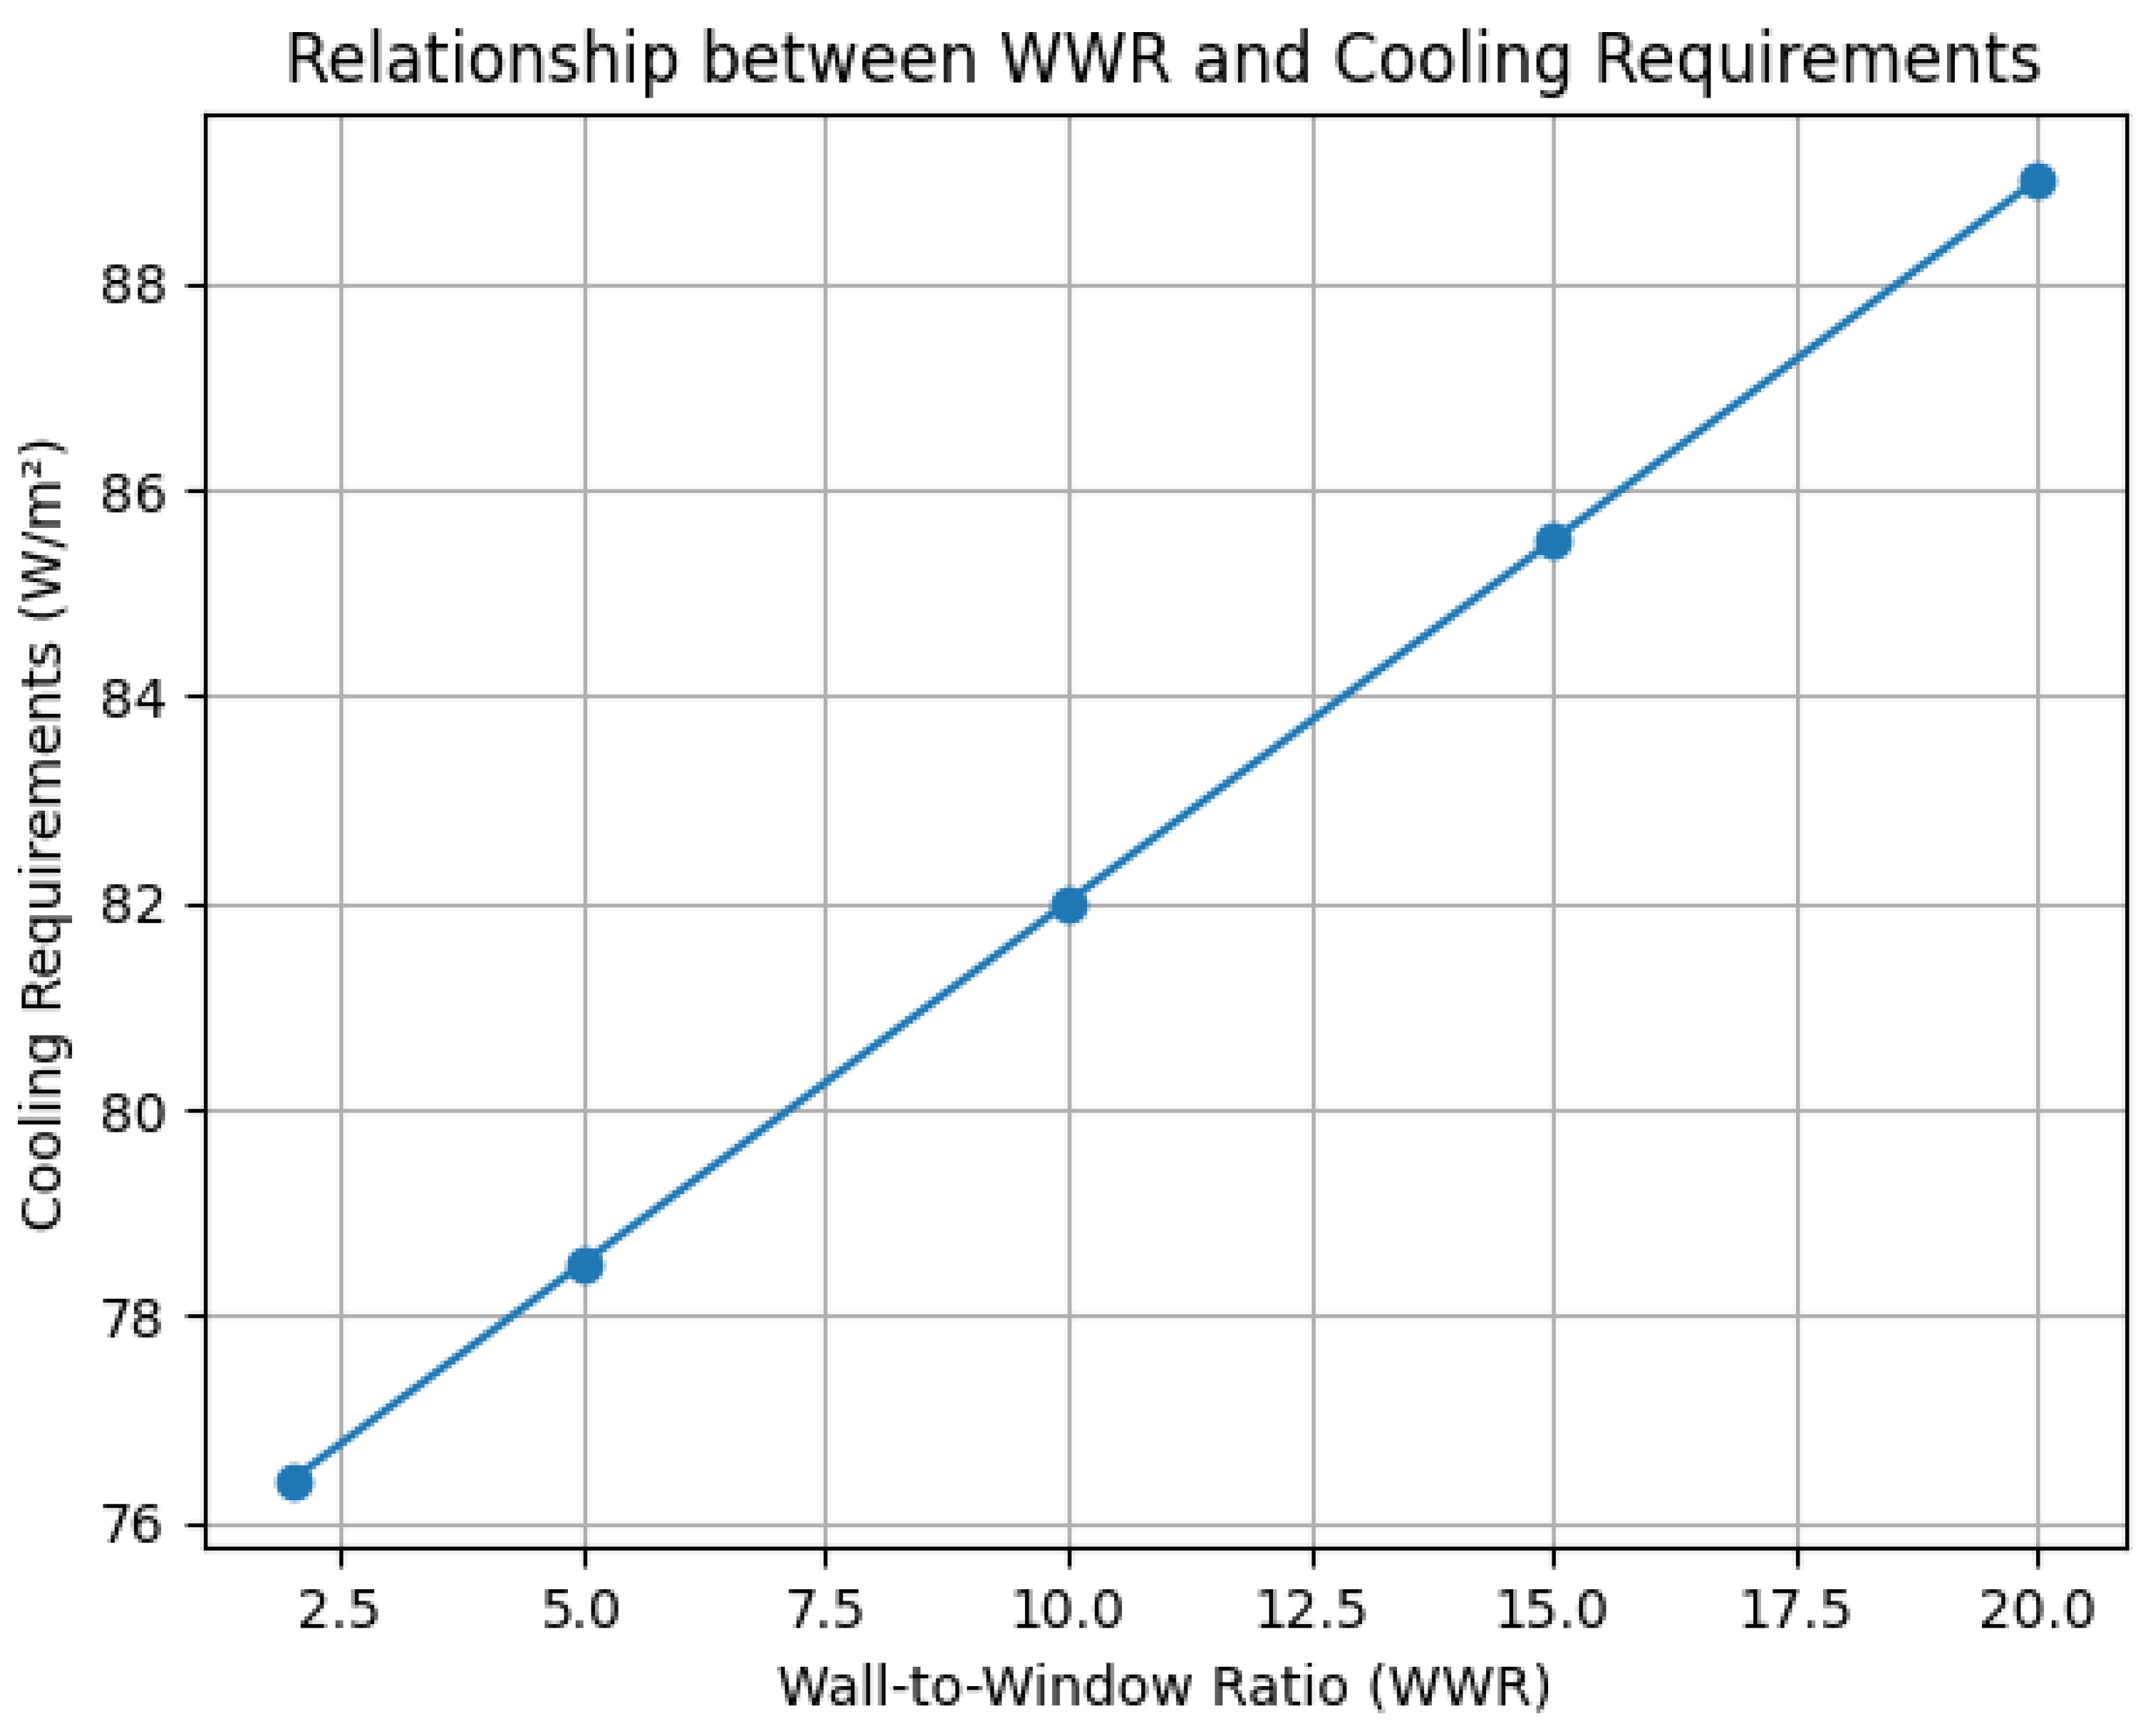
The relation of window-to-wall ratio and cooling is shown in Figure 6 under the varying WWR. Under the current case study, the WWR of the building is 5. Therefore, a comparison of WWR with respect to various rooms in the residential unit is conducted. The SHGC is kept at 0.7, whereas the ΔT is considered to be 15 K, UA 5, SC1,
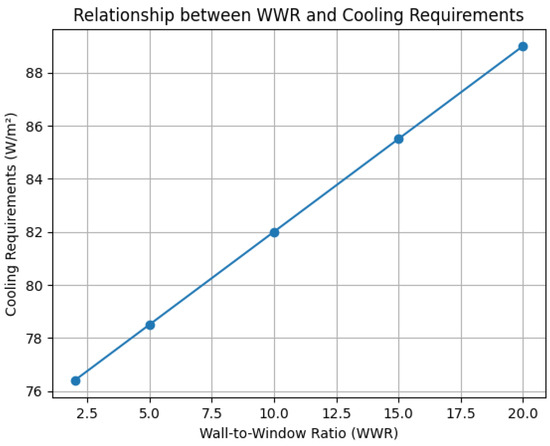
Figure 6.
Wall-to-window ratio relationship with cooling requirements.
2.5. Water Audit
For the water requirements, particle swarm optimization (PSO) was implemented with the objective of reducing the overall water usage in the kitchen, shower, faucets of the kitchen, washrooms, and washroom flush. The particle swarm optimization algorithm is used to find the optimal point under the set of constraints. The PSO algorithm has a fast convergence rate, and so far, reliable results have been reported under different optimization schemes [28]. In this study, as water utilization in a particular residential unit has a number of water consumption areas, such as the kitchen and bathroom, with further division of water application in the bathroom, such as showerheads and faucets, the minimum water utilization can be achieved while imposing constraints as per the water efficiency guidelines given in ref. [29]. To find the overall optimal water requirements and to impose constraints, the particle swarm optimization algorithm with the objective function and constraints has been used in this research. The objective function is given in Equation (7).
The constraints mentioned in Equations (8)–(11) limit the water utilization for each application, keeping the water utilization as per green building standards.
2.6. Objective Function
The objective is to minimize the overall water requirements. The overall water requirements in the residential unit include water utilization using showers, washroom flush, washroom faucets, and kitchen faucets. The residential unit under study has four major water utilization applications: (1) use in water showers, (2) use in kitchen faucets, (3) use in washroom faucets, and (4) washroom flush. For simplicity, three points have been considered for optimization as these three points are used the most in residential units. The optimization can be achieved while reducing the overall water requirements on all four water utilization points. That is why the objective function is the addition of water utilization on all the points, which should be reduced subject to the given constraints. The duration of utilization of different applications has been assumed to be not more than 5 min to 30 s for all faucets other than the shower faucet, which has been considered 10 min long.
W_total = (Wshower + Wkitchen_faucet + Wwashroom_flush + Wwashroom_faucet)
Currently, the water utilization in the building under study has no set standards; however, to limit the water utilization, it is necessary to set water utilization standards as per the green building standards. For this, constraints as per the guidelines of water utilization of green buildings has been modeled [29].
The flow rate of the shower is kept between 7 to 10 L/min to limit the utilization in Equation (8) as follows:
7 ≤ W_shower_flow_rate ≤ 10
Similarly, the flowrate utilization for kitchen and washroom faucet and washroom flush flow is given in Equations (9)–(11) [29] as follows:
where;
5 ≤ W_kitchen_faucet_flow_rate ≤ 10
5 ≤ W_washroom_flush_flow_rate ≤ 15
5 ≤ W_washroom_faucet_flow_rate ≤ 10
- W_shower_flow_rate is the water flow rate for the shower (L/min);
- W_kitchen_faucet_flow_rate is the water flow rate for the kitchen faucet (L/min);
- W_washroom_flush_flow_rate is the water flow rate for washroom flush (L/min);
- W_washroom_faucet_flow_rate is the water flow rate for the washroom faucet (L/min).
3. Results
In the Section 3, the impact of CU and WWR is quantified in terms of their power consumption. Finally, the comparison of the load conventional load profile and the achievable load profile after retrofitting of CU and WWR can be achieved is discussed.
Lighting
Table 2 shows the number of fixtures that are evaluated based on the type of room and required lux levels as per the lighting standards. The highest number of fixtures are required in the dining room area as the areas of the dining room are the biggest. The coefficient of utilization in Table 2 was taken as 0.5, whereas in Table 3, the coefficient of utilization was considered to be 0.8. Based on Equation (1), the number of fixtures is evaluated, and it can be seen in Table 3 that dining room fixtures have been reduced to 21 with 0.8 CU compared to 26 fixtures with 0.5 CU, as also proven in Figure 7.
Table 2.
Lighting load requirements and number of fixtures with 0.5 CU.
Table 3.
Lighting load requirements and number of fixtures with 0.8 CU.
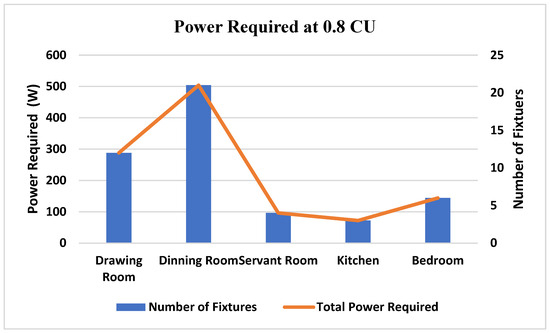
Figure 7.
Power is required at 0.8 CU.
Figure 7 shows the power consumption patterns with 0.8 CU, as the dining room has the highest number of fixtures; the overall power consumption is highest in the dining room, reaching up to 500 Watts while keeping the 24-watt LED as standard. Similarly, the drawing room, which has the second highest room area, contains 12 fixtures that have almost 300 watts of power, followed by the bedroom, kitchen, and servant room, which have a power utilization under 100 watts.
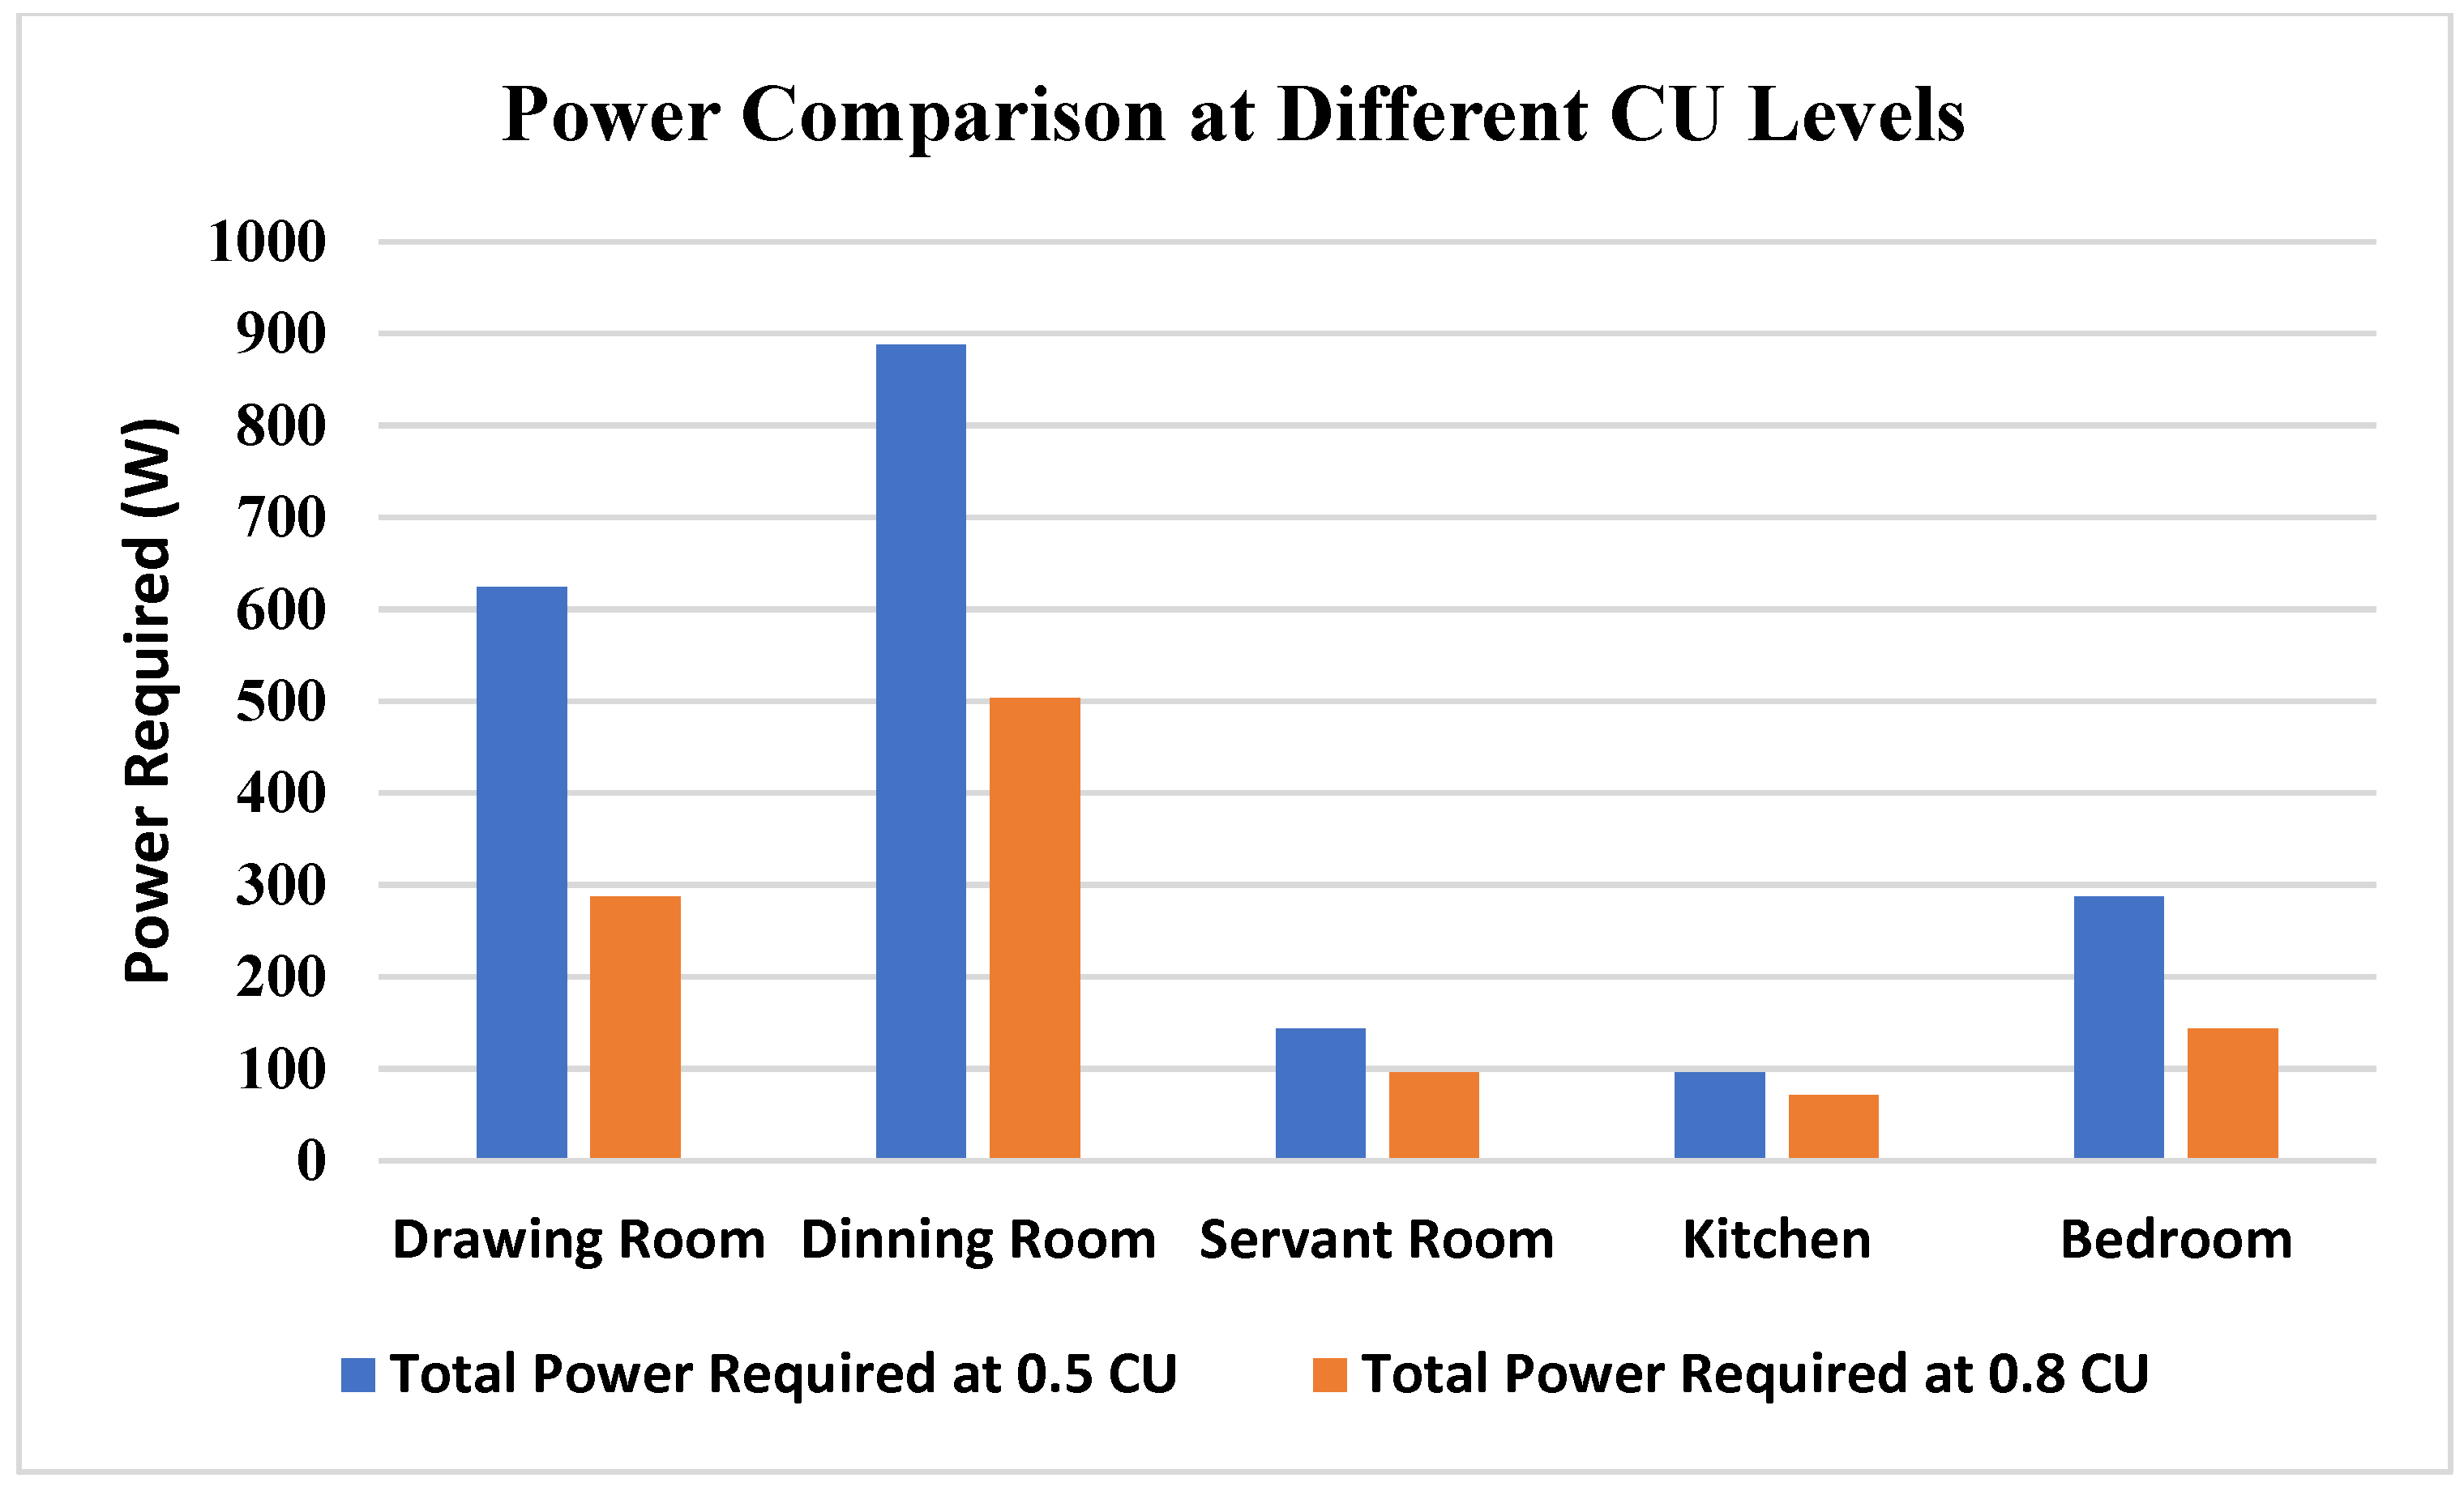
Compared to 0.8 CU, the power consumption of 0.5 CU while having all other parameters same as 0.8, the dining room wattage reaches up to 900 watts with 35 fixtures, which is almost 400 watts higher than that of 0.8 CU. Similarly, the drawing room wattage reaches up to 620 watts, which is 300 Watts higher than 0.8 CU, which is 50% higher, as shown in Figure 8. Figure 9 shows the overall comparative analysis of 0.5 and 0.8 CU.
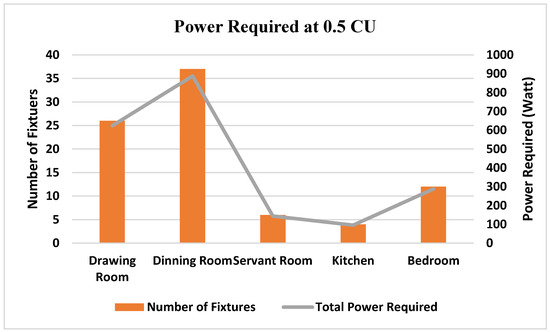
Figure 8.
Power Required at 0.5 CU.

Figure 9.
Comparison of different CU levels.
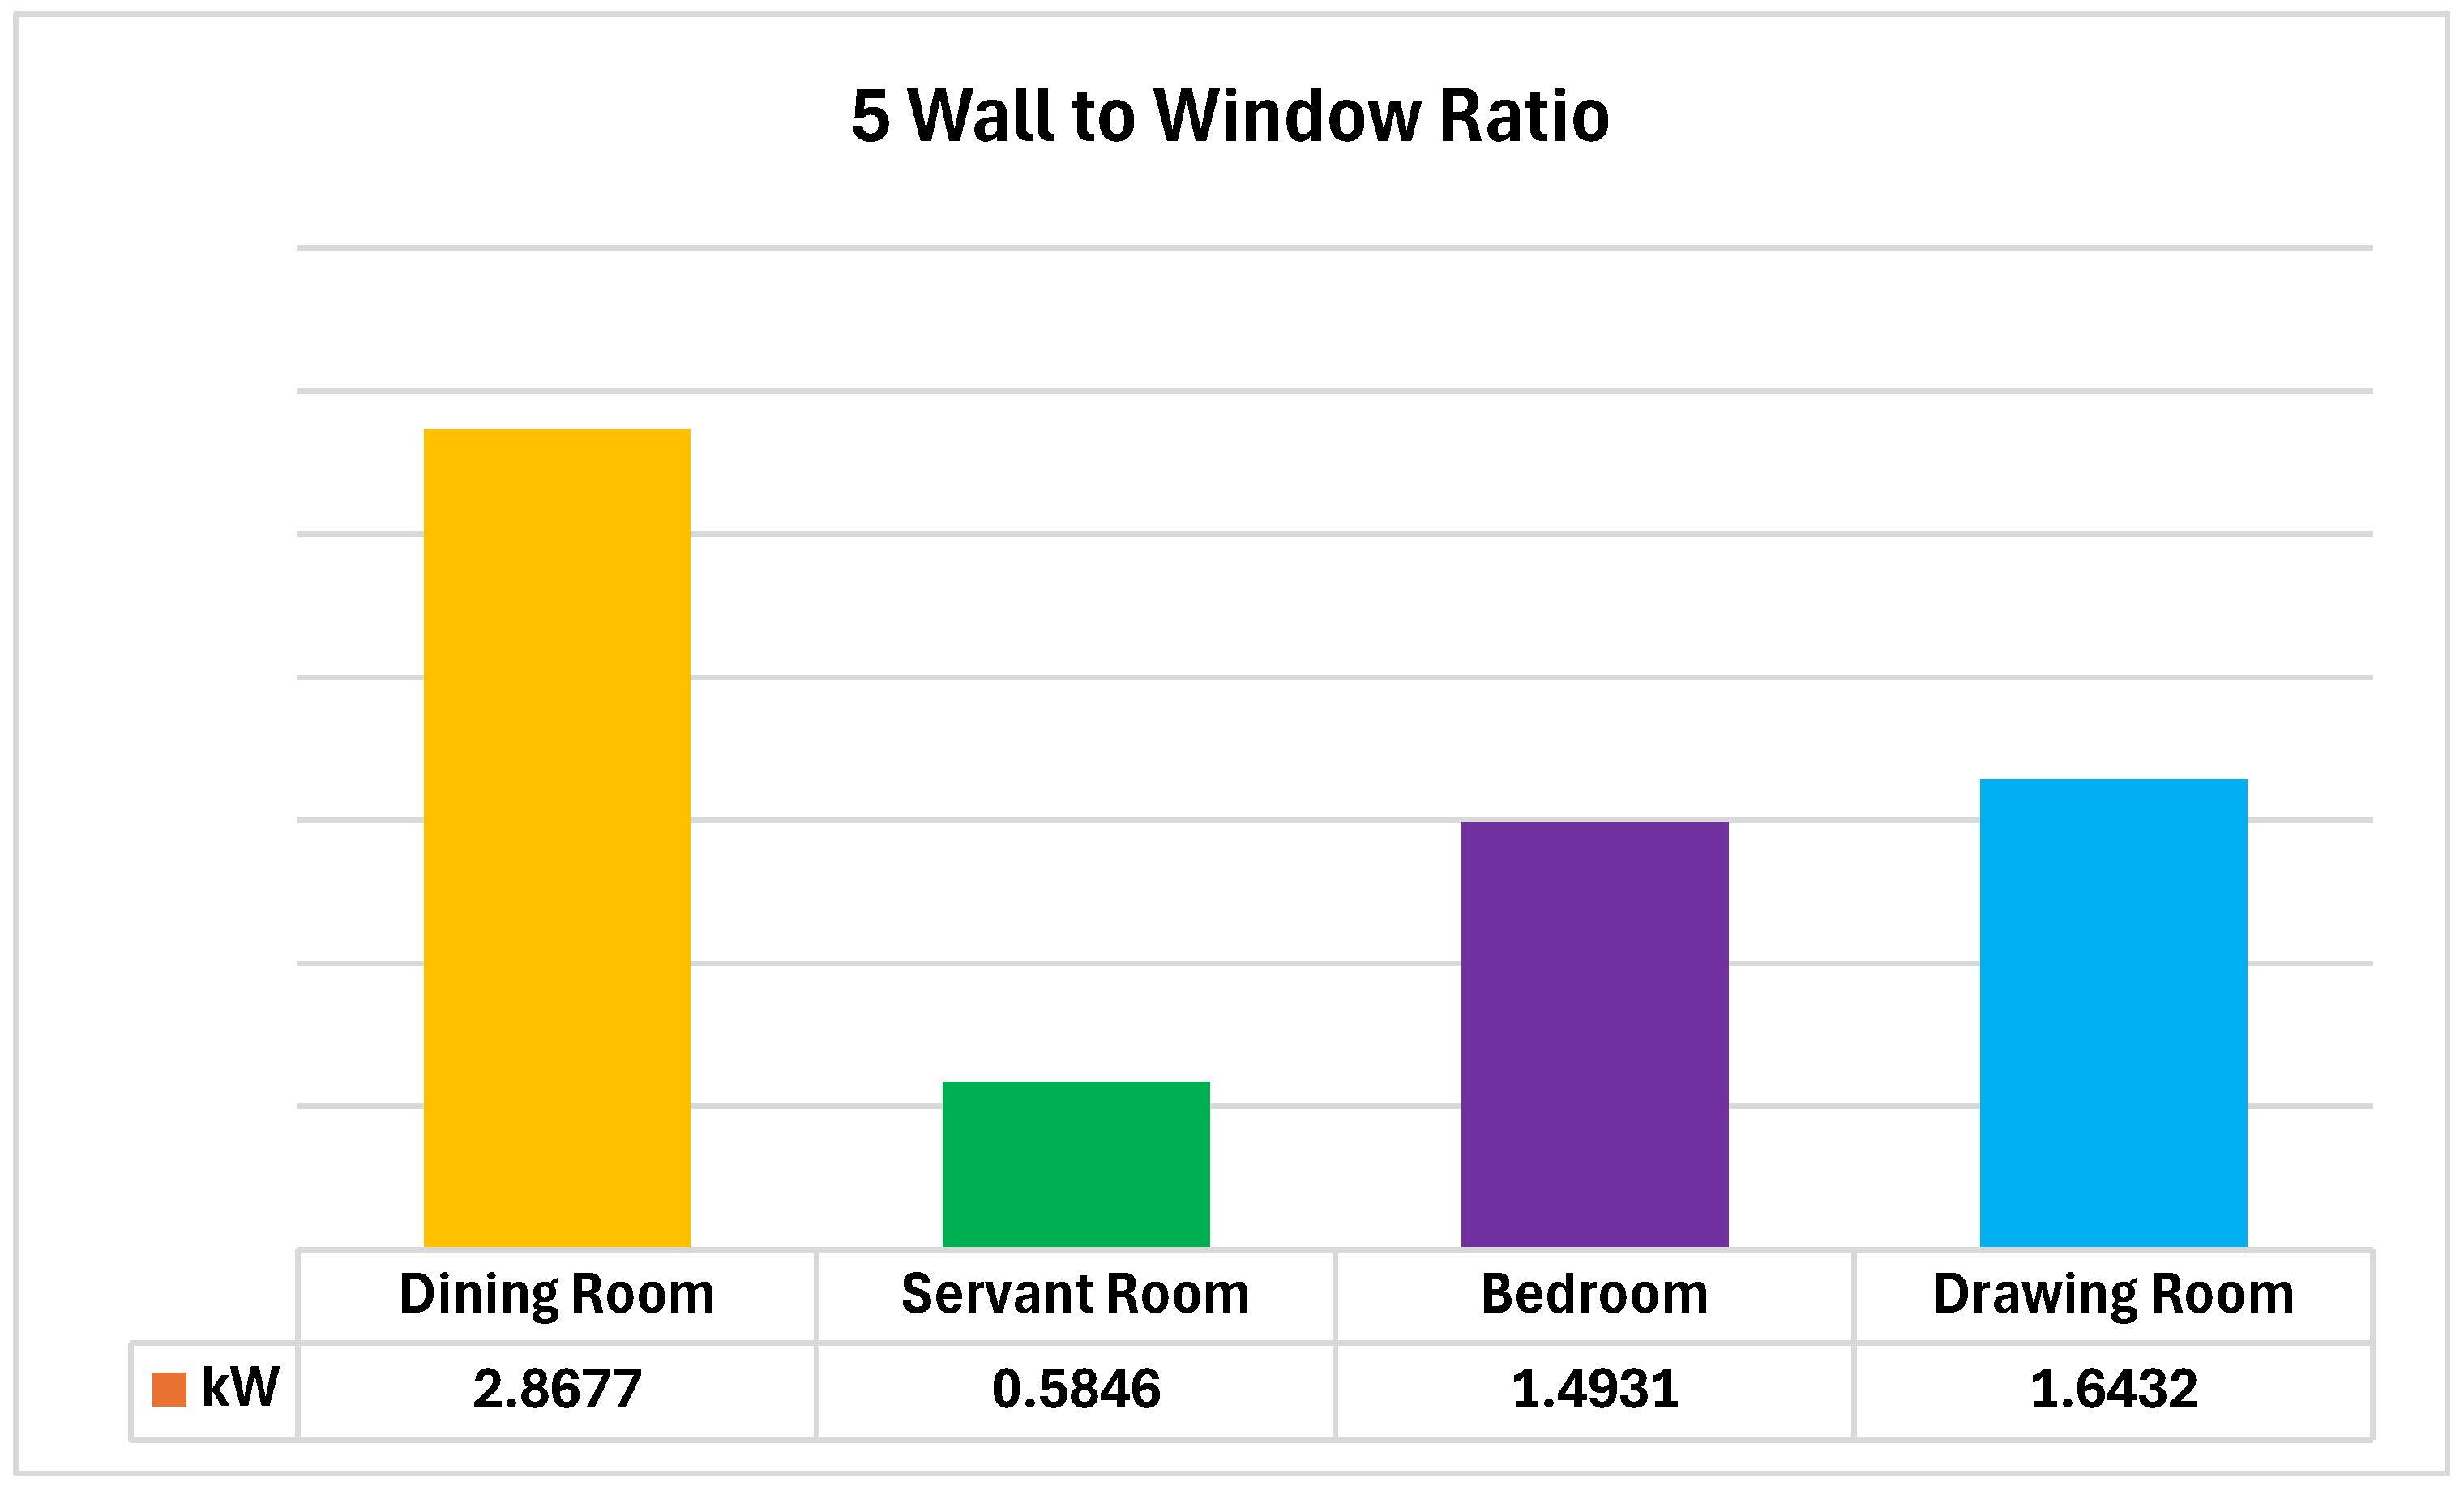
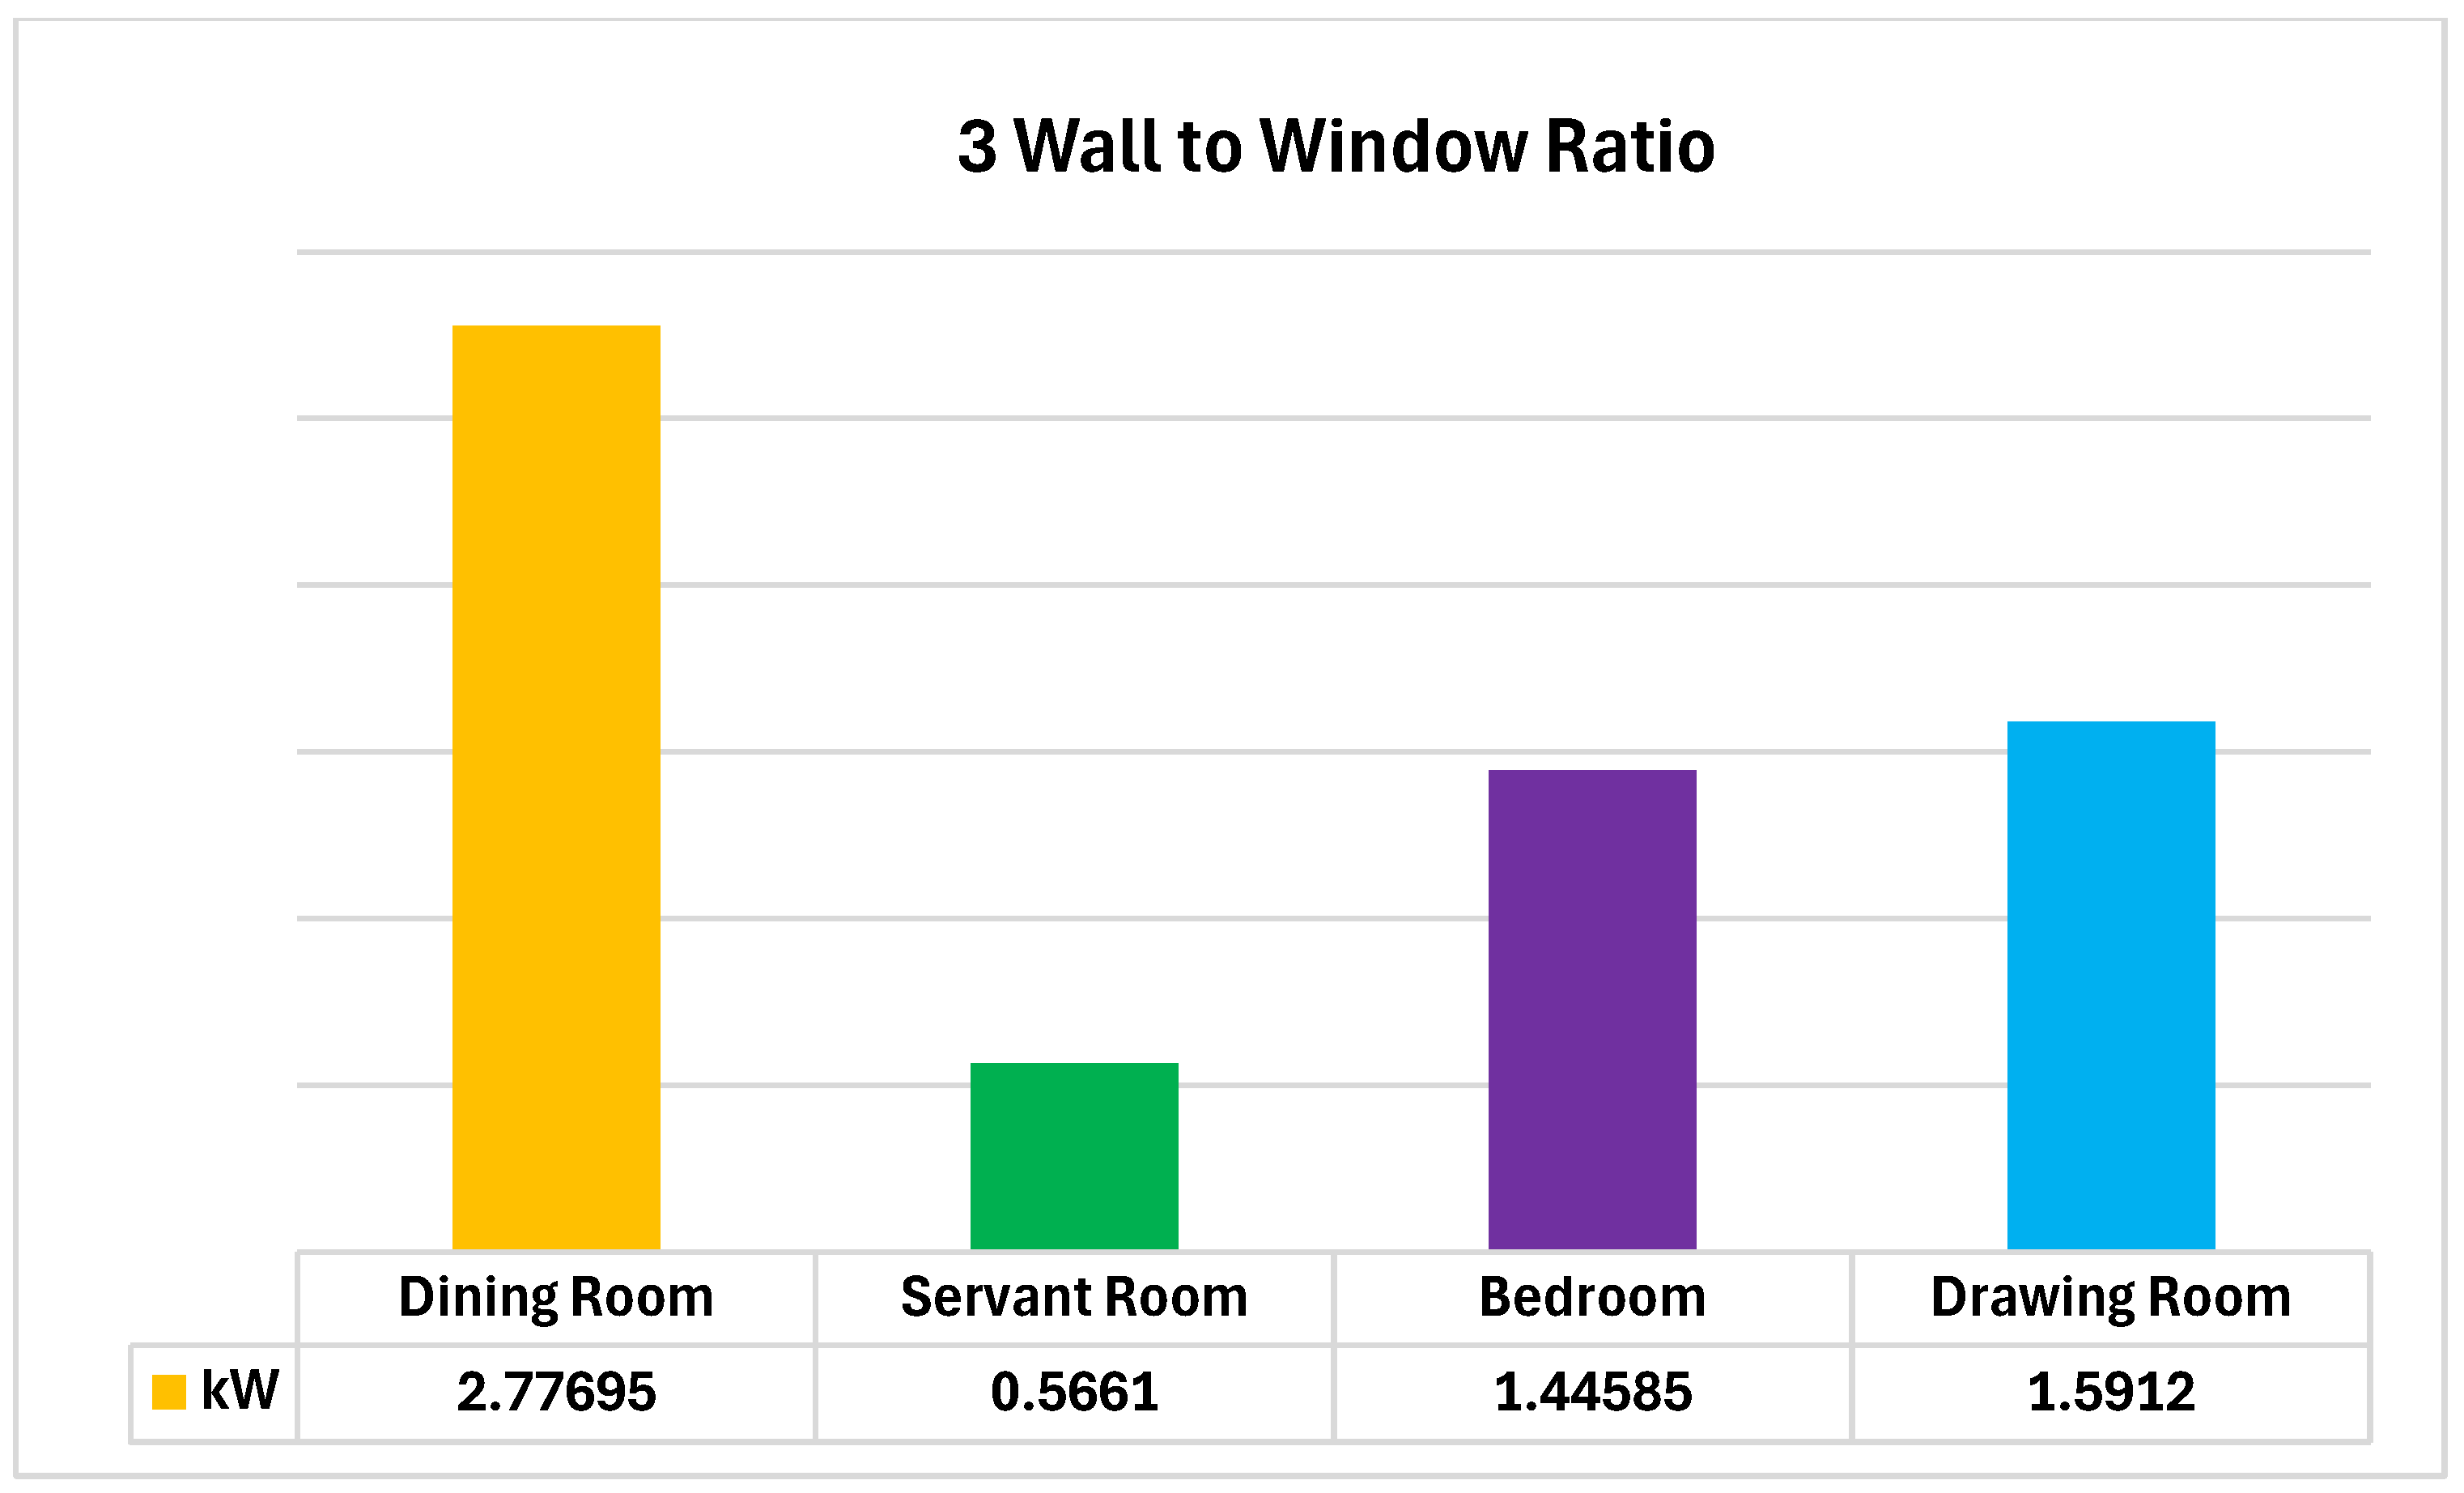
Since the cooling requirement is the product of room area and cooling load in W/m2, which has been calculated from Equations (2)–(6) and under varying WWR, the calculations are made under two WWR values that are 3 and 5 for the residential unit and power required for cooling is calculated as shown in Table 4 and Table 5. It can be seen that for the dining room having 5 WWR, the cooling requirement is 2.86 kW. Similarly, the servant room, drawing room, and bedroom have different cooling requirements compared to the relevant under 5 WWR. In the same way, for 3 WWR, the cooling requirements gradually decrease, proving the impact of the cooling requirements that decrease while decreasing the WWR ratio. Figure 10 and Figure 11 show the graphical representation of the cooling requirements, whereas Figure 12 shows the power requirement for the dining room under the varying WWR. It can be seen that with 10 to 12.5 WWR, the power requirement for the dining room increases to 7 kW, which is 3.8 kW higher than the WWR of 5.
Cooling Requirement (W) = Room Area (m2) × Cooling Load (W/m2)
Table 4.
Cooling requirements in kWh with 5 WWR.
Table 5.
Cooling requirements in kWh with 3 WWR.
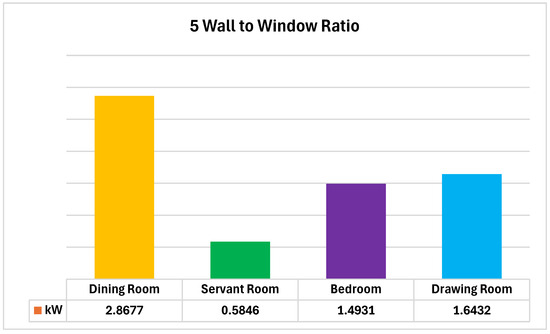
Figure 10.
Cooling requirements with the wall-to-window ratio of five.

Figure 11.
Cooling requirements with wall-to-window ratios of three.
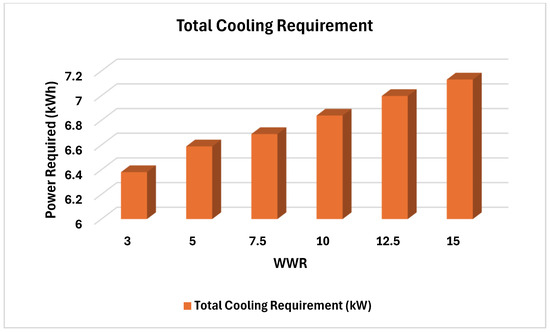
Figure 12.
Comparison of cooling requirements with different wall-to-window ratios.
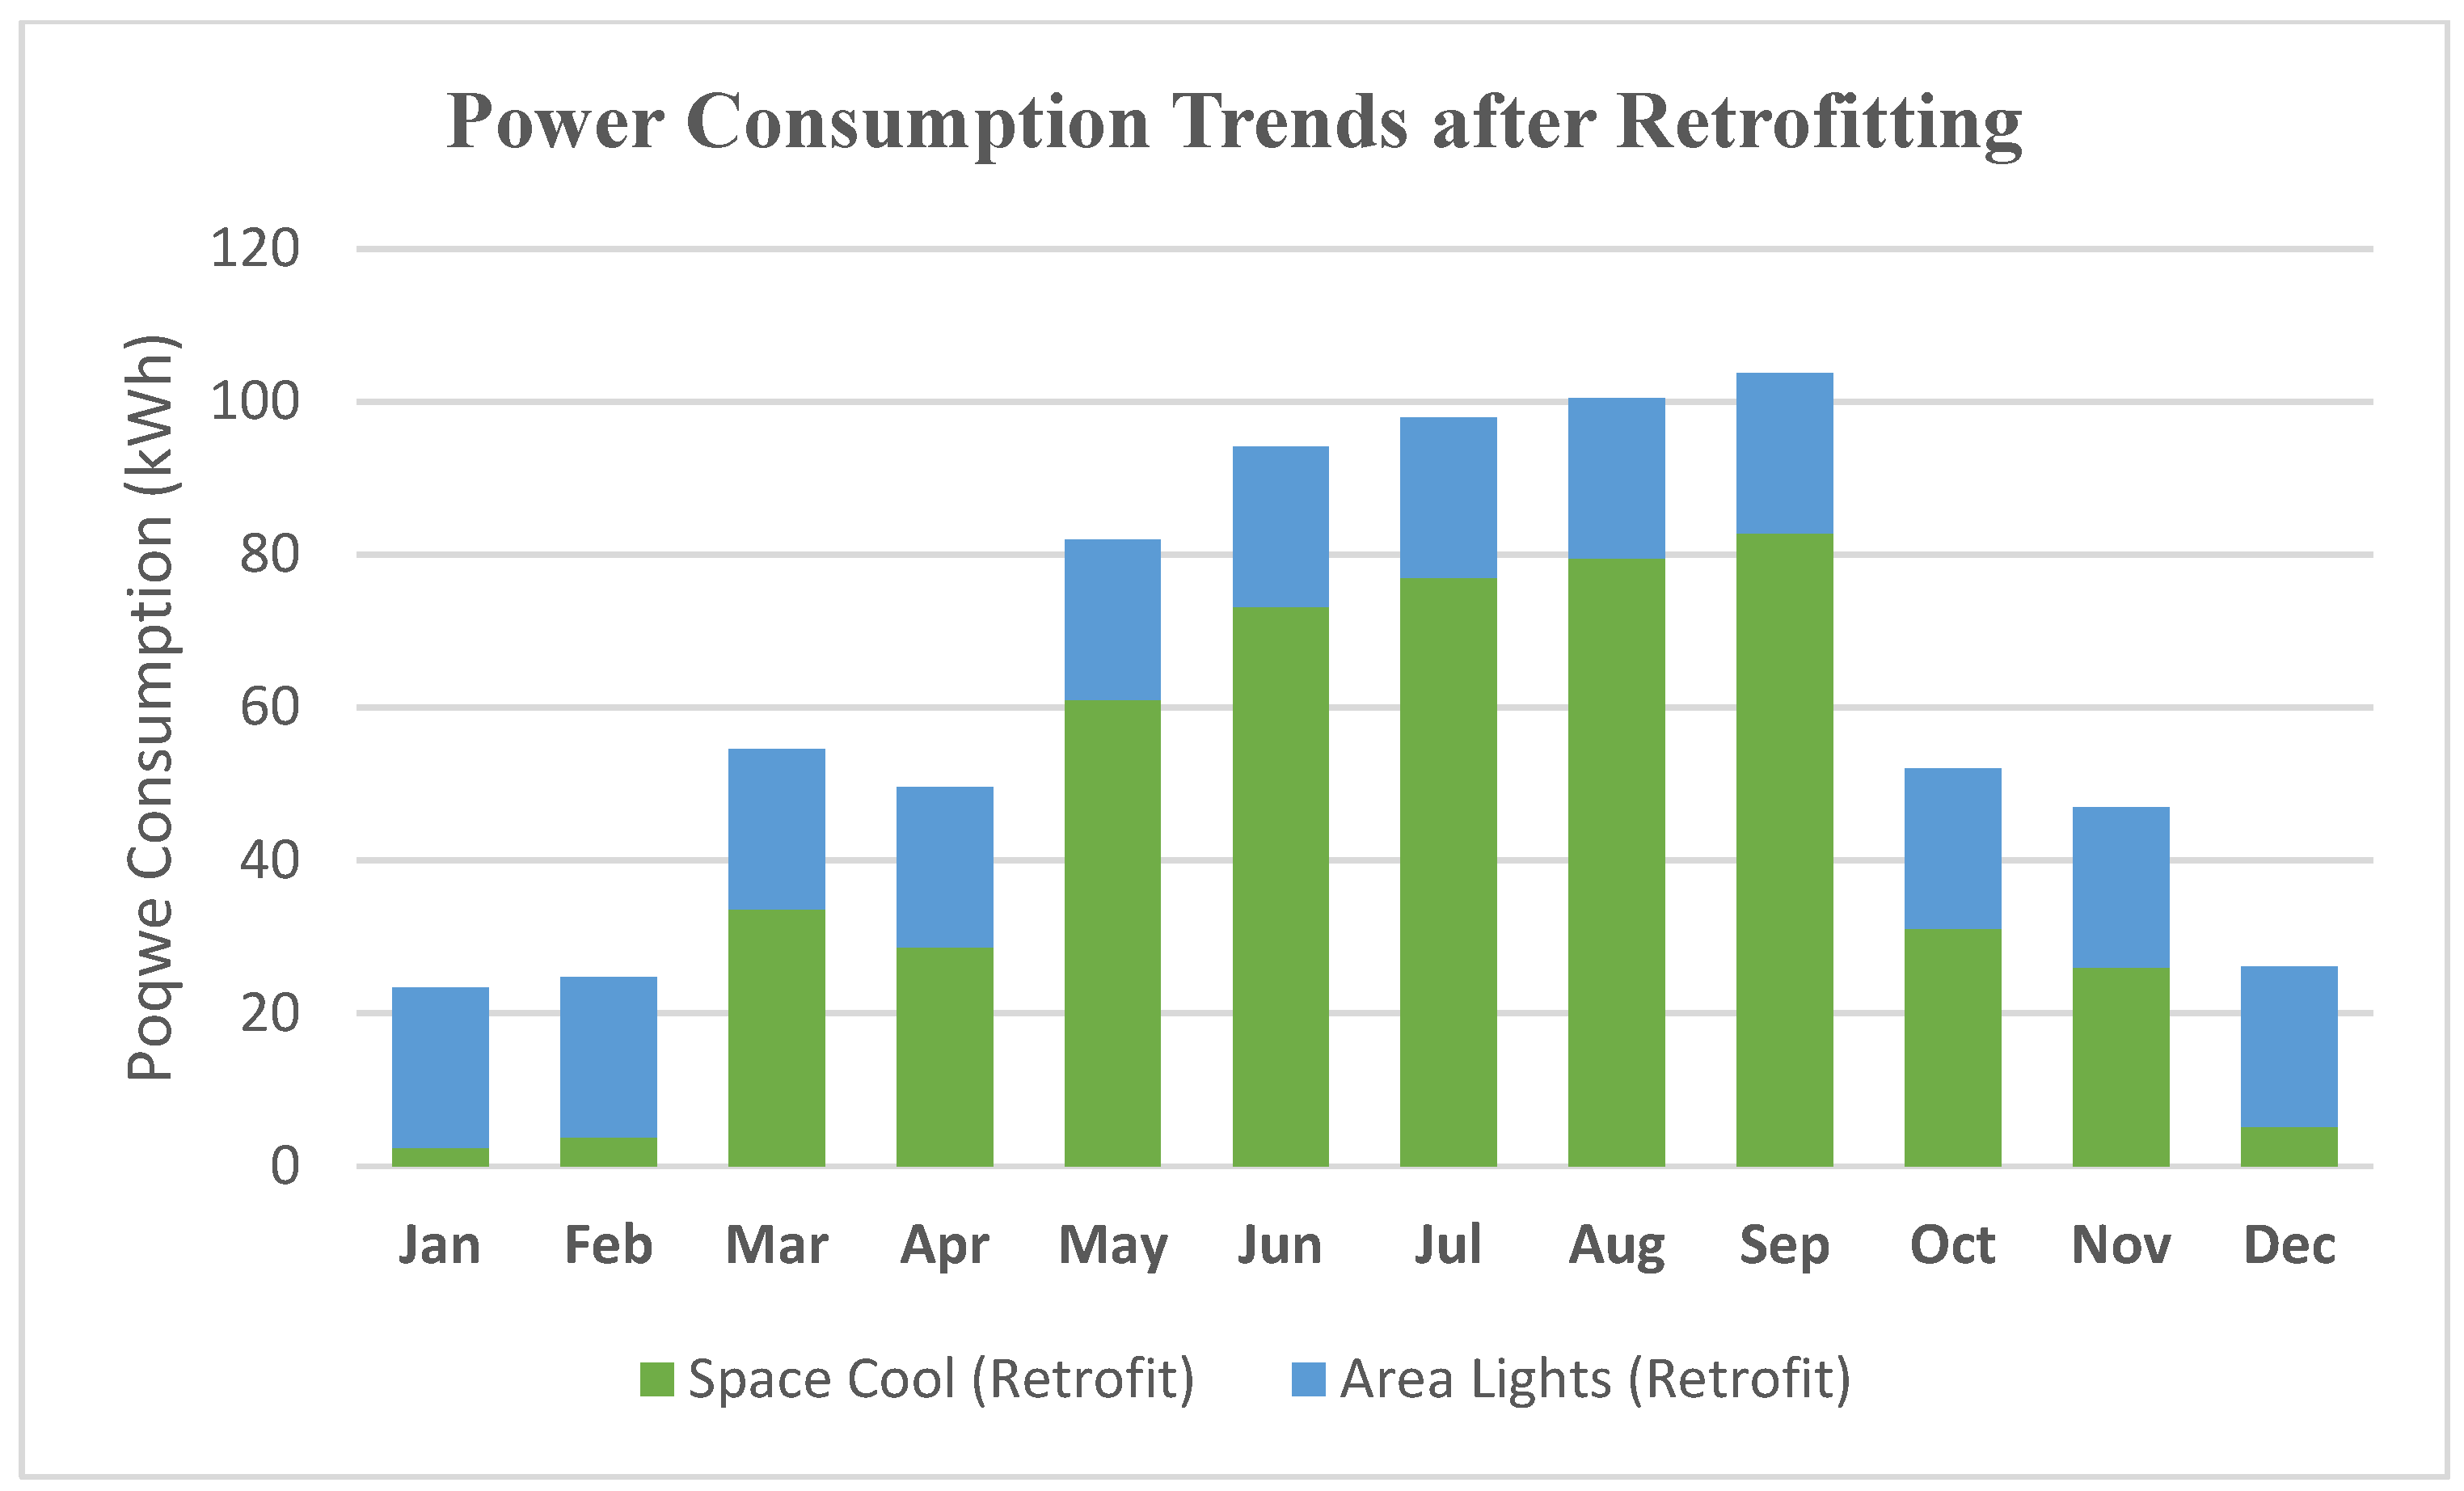
Figure 13 shows the power consumption trends of lighting and cooling load after varying the WWR, and it can be seen that after appropriate sizing, the cooling and lighting requirements reduced significantly compared to the previous practices. The lighting requirement reduces from 59 kW to 20.94 kWh monthly and from 709 kW to 25 kWh annually. Similarly, the space cooling has been reduced from 622 kWh to 504 kWh annually.
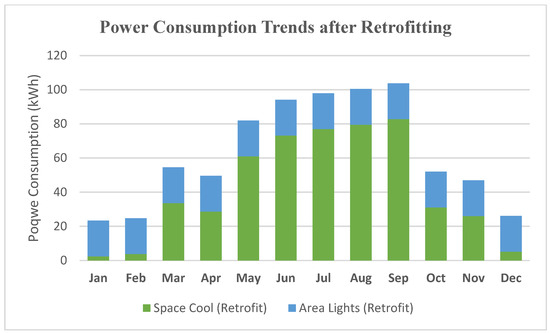
Figure 13.
Power consumption trends after retrofitting.
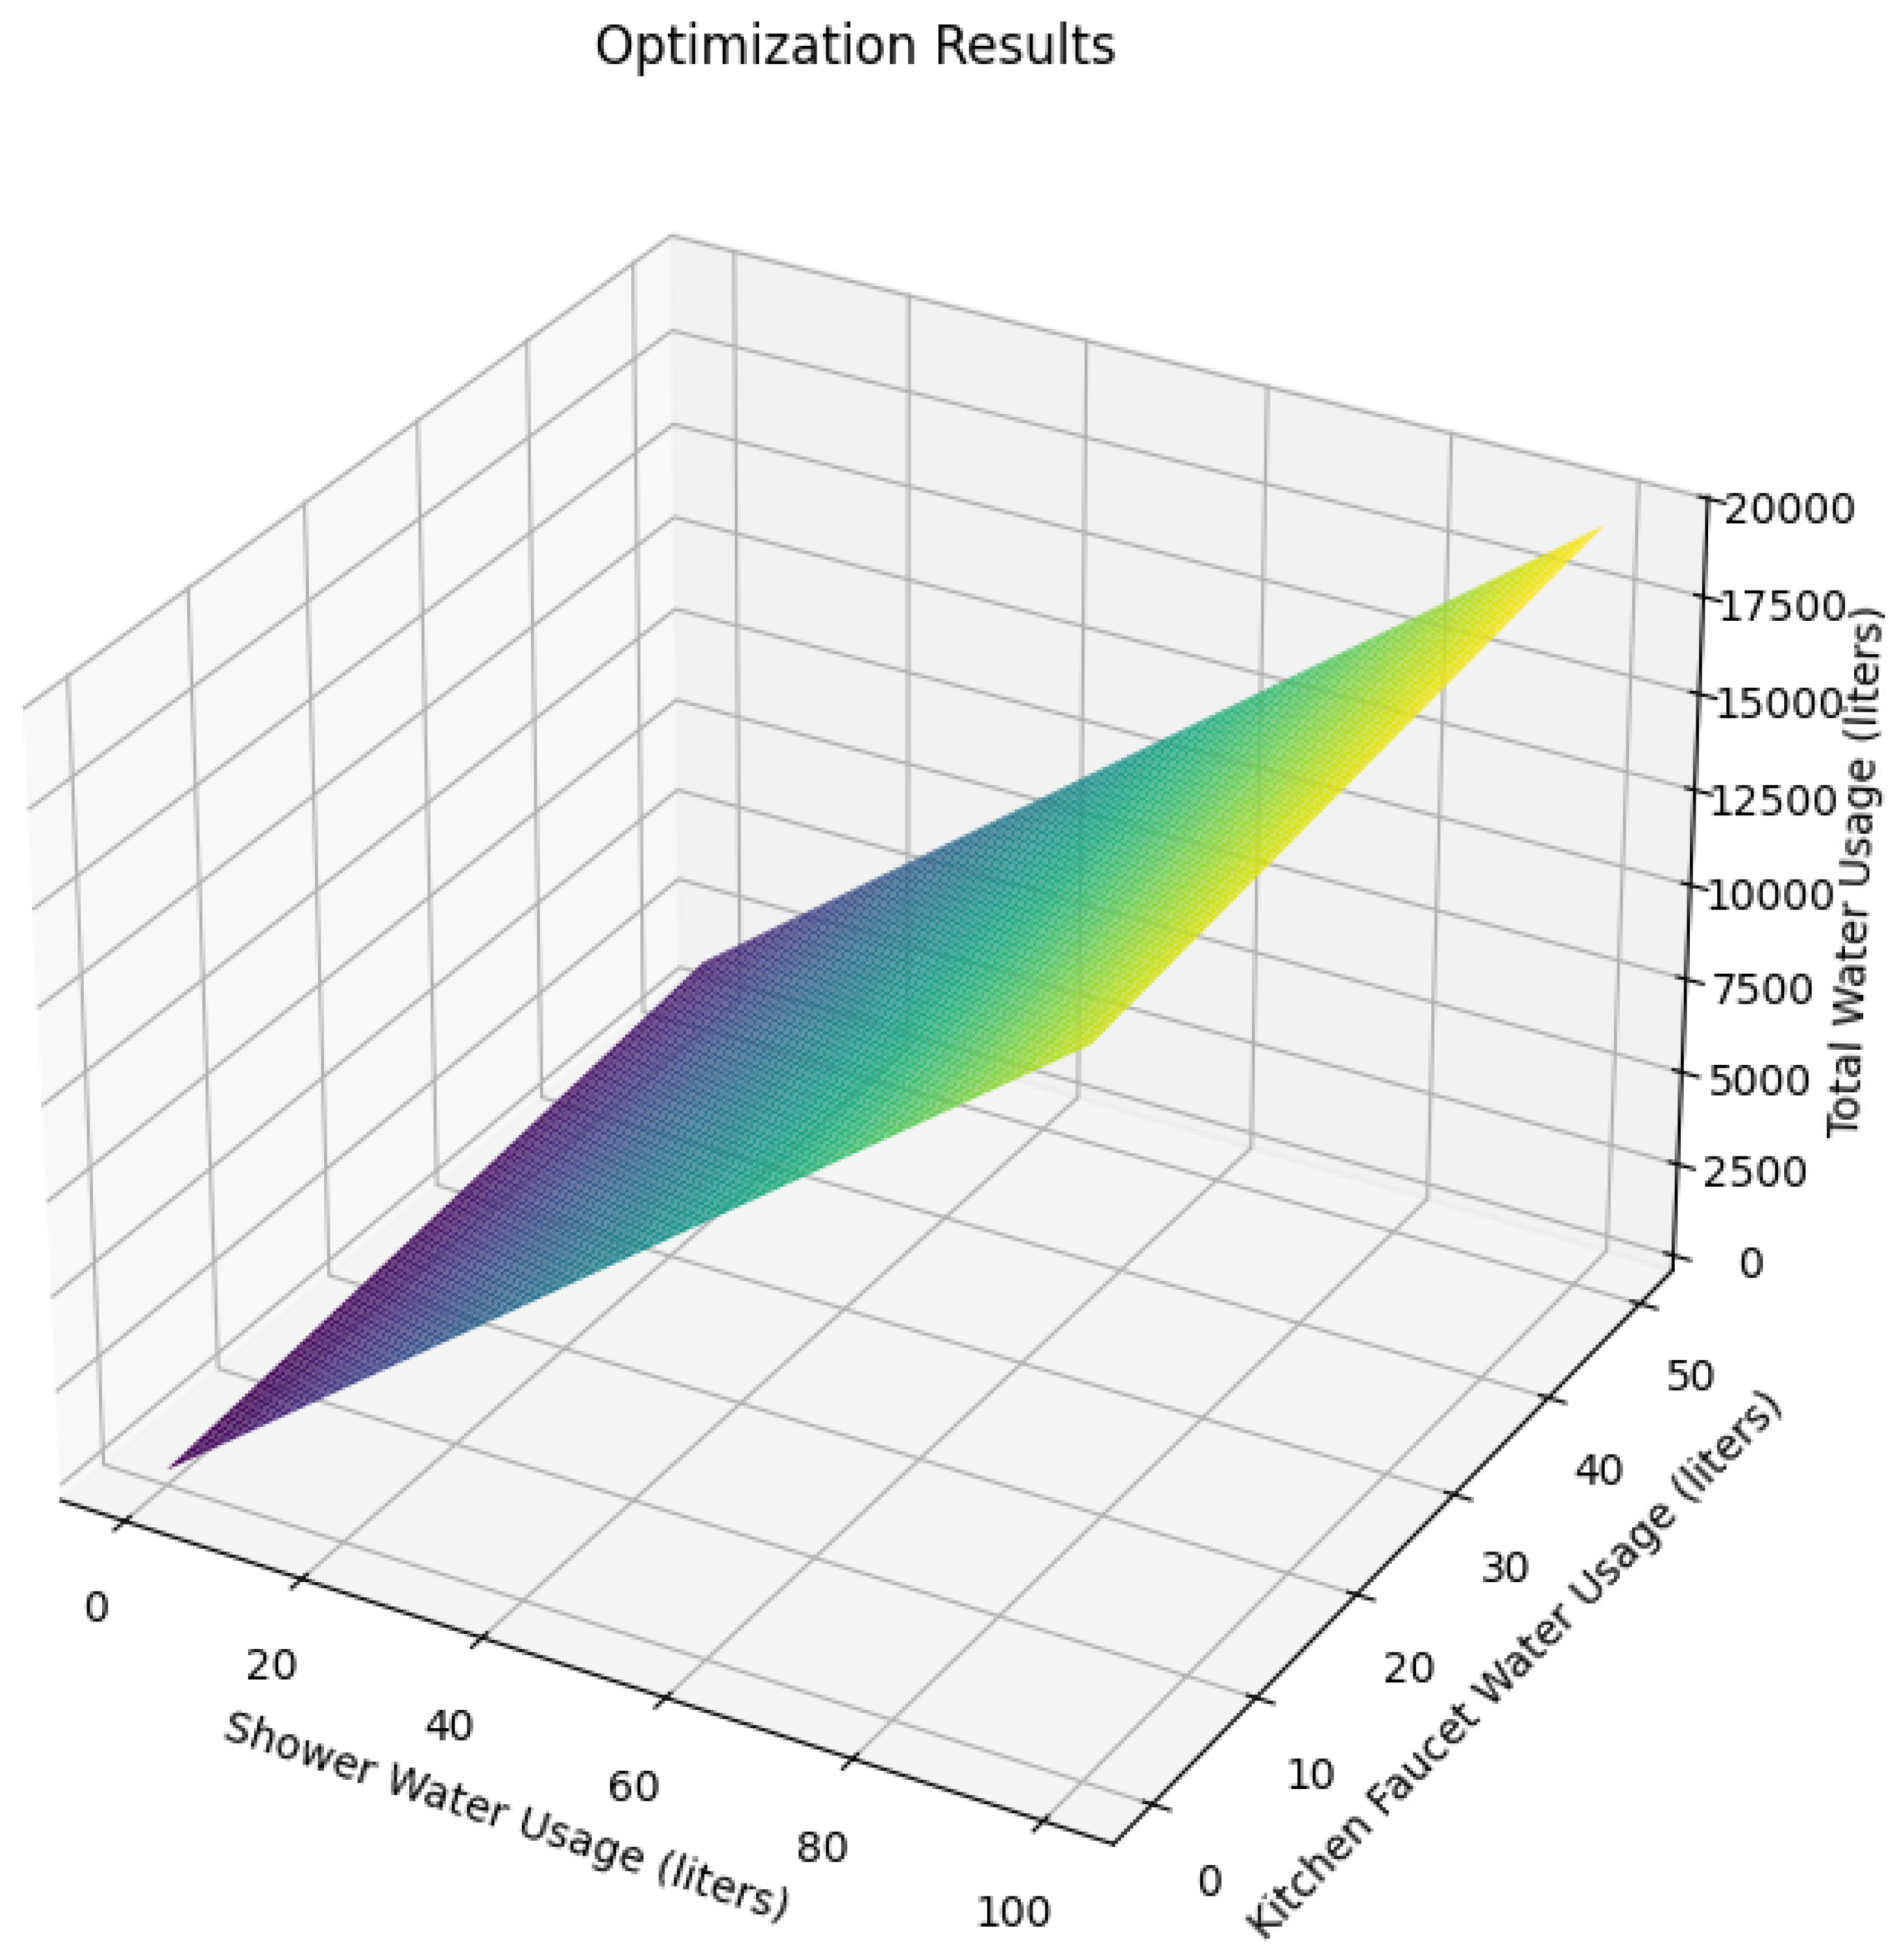
Figure 14 shows the overall water utility in liters. The surface graphs use kitchen and washroom water utility. The optimization results shown in the table below show the optimal water utilization in Liters. The estimated utilization of water in residential households in Pakistan is taken from ref. [30]. The data for water consumption in different points of the household have been taken from refs. [30,31]. In this research, it is assumed that the water tap open for taking a shower is optimally no more than 8 min as shown results in Table 6. Taking this into account, the total water required with 7.42 L/min will give 59.36 L/day, whereas the estimated shower usage recorded in ref. [31] was 60 L/cycle, which is an optimal utilization. The kitchen faucet utilization could be no more than 1 min/cycle, which gives 10 L of utilization. However, this can be reduced while using optimal faucets. The achieved optimal value for the water faucet in this study was 5.21 L, which is 50% less than the water required for kitchen usage. Similarly, in ref. [31], flush water was estimated as 26 L for two cycles, i.e., 13 L for one cycle. The optimal value for water flush in this study is supposed to be 5.03 L, which is again 50% less than used in ref. [31]. The washroom faucet used is 22 L seven times, which is 3.4 L/cycle. Since the water utilization in the washroom faucet could not be more than 30 s, it gives 2.54 L; in this way, a substantial amount of water can be saved while using the optimal values.
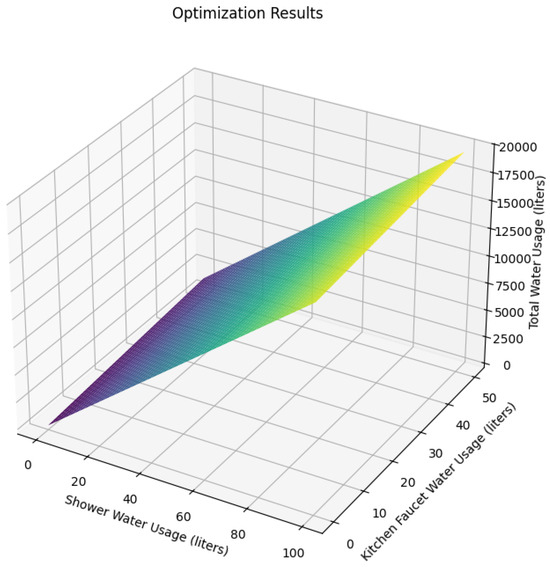
Figure 14.
Optimization results of overall water usage.
Table 6.
Comparison of conventional power utilization with the optimal achieved results.
4. Conclusions
This research study quantifies the parametric sizing of the cooling and lighting loads using CU, WWR, and optimization of water utilization. The research results show that while changing the WWR from 5 to 3, the 3% of overall cooling load consumption is reduced. Similarly, the lighting load sizing of the entire residential unit requires 85 fixtures with 0.5 CU, which reduces to 46 fixtures with 0.8 CU, which accounts for a 46% reduction in power requirements of lighting load, i.e., from 2040 kWh to 1104 kWh. In the same way, 15 Liters/cycle of water can be saved while using efficient faucets. In conventional buildings that are to be converted to green buildings, the lighting loads retrofitting can be performed while re-sizing in accordance with the CU of the lighting that significantly impacts the number of fixtures that are required to be installed, which eventually impacts the power consumption. Similarly, sizing the cooling load required in accordance with the WWR can significantly reduce the power consumption requirements. Furthermore, the optimization of water through PSO can reduce overall water consumption requirements. This research provides the directions for effective utilization of the cooling and lighting loads while re-sizing them in accordance with CU and WWR, which can contribute to retrofitting conventional buildings into green buildings. Moreover, the loss factor in lighting and shading of windows can be taken into consideration as a future work that is supposed to further impact the reduction of the sizing of lighting and cooling loads.
Author Contributions
Conceptualization, F.A. and Z.M.; Methodology, F.A.; Validation, A.A.; Formal analysis, F.A. and Z.M.; Investigation, Z.M.; Resources, Z.M.; Data curation, A.A.; Project administration, A.A. All authors have read and agreed to the published version of the manuscript.
Funding
This research received no external funding.
Data Availability Statement
The data presented in this study are available on request from the corresponding author.
Acknowledgments
This research is a joint collaborative effort between COMSATS University and Ajman University (2024-IRG-ENIT-24).
Conflicts of Interest
The authors declare no conflict of interest.
References
- Wen, B.; Musa, S.N.; Onn, C.C.; Ramesh, S.; Liang, L.; Wang, W.; Ma, K. The role and contribution of green buildings on sustainable development goals. Build. Environ. 2020, 185, 107091. [Google Scholar] [CrossRef]
- Hanzala, M.; Memon, Z.; Hussain, M.I.; Azeem, F.; Shahzad, N.; Kim, J.T. Fuzzy-Logic-Based Cascaded Decentralized Control and Power Quantification of Residential Buildings for Effective Energy Load Management. Buildings 2024, 14, 2896. [Google Scholar] [CrossRef]
- Scheuer, C.; Keoleian, G.A.; Reppe, P. Life cycle energy and environmental performance of a new university building: Modeling challenges and design implications. Energy Build. 2003, 35, 1049–1064. [Google Scholar] [CrossRef]
- Güçyeter, B.; Günaydın, H.M. Optimization of an envelope retrofit strategy for an existing office building. Energy Build. 2012, 55, 647–659. [Google Scholar] [CrossRef]
- Ma, Z.; Cooper, P.; Daly, D.; Ledo, L. Existing building retrofits: Methodology and state-of-the-art. Energy Build. 2012, 55, 889–902. [Google Scholar] [CrossRef]
- Bertone, E.; Stewart, R.A.; Sahin, O.; Alam, M.; Zou, P.X.; Buntine, C.; Marshall, C. Guidelines, barriers and strategies for energy and water retrofits of public buildings. J. Clean. Prod. 2018, 174, 1064–1078. [Google Scholar] [CrossRef]
- Su, Y.; Wang, L.; Feng, W.; Zhou, N.; Wang, L. Analysis of green building performance in cold coastal climates: An in-depth evaluation of green buildings in Dalian, China. Renew. Sustain. Energy Rev. 2021, 146, 111149. [Google Scholar] [CrossRef]
- Li, X.; Lin, M.; Jiang, M.; Jim, C.Y.; Liu, K.; Tserng, H. BIM and orthogonal test methods to optimize the energy consumption of green buildings. J. Civ. Eng. Manag. 2024, 30, 670–690. [Google Scholar] [CrossRef]
- Feng, Z.; Ge, M.; Meng, Q. Enhancing Energy Efficiency in Green Buildings Through Artificial Intelligence. Appl. Sci. Eng. J. Adv. Res. 2024, 3, 10–17. [Google Scholar] [CrossRef]
- Gil-Ozoudeh, I.; Iwuanyanwu, O.; Okwandu, A.C.; Ike, C.S. The role of passive design strategies in enhancing energy efficiency in green buildings. Eng. Sci. Technol. J. 2022, 3, 71–91. [Google Scholar] [CrossRef]
- Razmjoo, A.; Nezhad, M.M.; Kaigutha, L.G.; Marzband, M.; Mirjalili, S.; Pazhoohesh, M.; Memon, S.; Ehyaei, M.A.; Piras, G. Investigating smart city development based on green buildings, electrical vehicles and feasible indicators. Sustainability 2021, 13, 7808. [Google Scholar] [CrossRef]
- Wan, S.; Ding, G.; Runeson, G.; Liu, Y. Sustainable buildings’ energy-efficient retrofitting: A study of large office buildings in Beijing. Sustainability 2022, 14, 1021. [Google Scholar] [CrossRef]
- Li, Q.; Zhang, L.; Zhang, L.; Wu, X. Optimizing energy efficiency and thermal comfort in building green retrofit. Energy 2021, 237, 121509. [Google Scholar] [CrossRef]
- Danial, C.E.; Mahmoud, A.H.A.; Tawfik, M.Y. Methodology for retrofitting energy in existing office buildings using building information modelling programs. Ain Shams Eng. J. 2023, 14, 102175. [Google Scholar] [CrossRef]
- Banti, N.; Ciacci, C.; Di Naso, V.; Bazzocchi, F. Green walls as retrofitting measure: Influence on energy performance of existing industrial buildings in Central Italy. Buildings 2023, 13, 369. [Google Scholar] [CrossRef]
- Mousavi, S.; Gheibi, M.; Wacławek, S.; Smith, N.R.; Hajiaghaei-Keshteli, M.; Behzadian, K. Low-energy residential building optimisation for energy and comfort enhancement in semi-arid climate conditions. Energy Convers. Manag. 2023, 291, 117264. [Google Scholar] [CrossRef]
- Marzouk, M.; El-Maraghy, M.; Metawie, M. Assessing retrofit strategies for mosque buildings using TOPSIS. Energy Rep. 2023, 9, 1397–1414. [Google Scholar] [CrossRef]
- Ayoobi, A.W.; Inceoğlu, M. Developing an Optimized Energy-Efficient Sustainable Building Design Model in an Arid and Semi-Arid Region: A Genetic Algorithm Approach. Energies 2024, 17, 6095. [Google Scholar] [CrossRef]
- Pacheco-Torres, R.; Etxebarria-Berrizbeitia, S.; Gago, E.J. Influence of urban density on energy retrofit of building stock: Case study of Spain. Archit. Eng. Des. Manag. 2024, 26, 1832–1855. [Google Scholar] [CrossRef]
- Ardiani, N.; Sharples, S.; Mohammadpourkarbasi, H. Multi-objective optimisation of energy retrofit in hot-humid climates’ office building. In Proceeding of the 10th International Conference S.ARCH-2023, Berlin, Germany, 4–6 April 2023. [Google Scholar]
- Ghazwani, K.; Beach, T.; Rezgui, Y. Energy Retrofitting Using Advanced Building Envelope Materials for Sustainable Housing: A review. Build. Environ. 2024, 267, 112243. [Google Scholar] [CrossRef]
- Gago, E.J.; Muneer, T.; Knez, M.; Köster, H. Natural light controls and guides in buildings. Energy saving for electrical lighting, reduction of cooling load. Renew. Sustain. Energy Rev. 2015, 41, 1–13. [Google Scholar] [CrossRef]
- Lin, Z.; Deng, S. Sizing room air conditioners used in sleeping environments in the subtropics. Energy Convers. Manag. 2006, 47, 1851–1856. [Google Scholar] [CrossRef]
- Sahu, S.K. Cooling Load Estimation for a Multi-Story Office Building. Ph.D. Thesis, Department of Mechanical Engineering, National Institute of Technology Rourkel, Rourkel, India, 2014. [Google Scholar]
- Singh, S.K. Thermal design guidelines for optimizing shell-and-tube heat exchangers. Chem. Eng. 2015, 122, 54. [Google Scholar]
- Troup, L.; Phillips, R.; Eckelman, M.J.; Fannon, D. Effect of window-to-wall ratio on measured energy consumption in US office buildings. Energy Build. 2019, 203, 109434. [Google Scholar] [CrossRef]
- Lechner, N. Heating, Cooling, Lighting: Sustainable Design Methods for Architects; John Wiley & Sons: Hoboken, NJ, USA, 2015; ISBN 978-1118988196. [Google Scholar]
- Sattar, M.; Azeem, F.; Memon, Z.; Zidan, H.; Baig, S. Feasibility Assessment of Rural Hybrid Microgrid Using Canal-Based Microhydel Resources: A Case Study of Renala Khurd Pakistan. Sustainability 2022, 14, 15417. [Google Scholar] [CrossRef]
- EDGE. EDGE User Guide Part 1: Building Certification Guidance, version 3; International Finance Corporation: Washington, DC, USA, 2024. [Google Scholar]
- Khan, H.F.; Arif, M.A.; Intikhab, S.; Arshad, S.A. Quantifying Household Water Use and Its Determinants in Low-Income, Water-Scarce Households in Karachi. Water 2023, 15, 3400. [Google Scholar] [CrossRef]
- Sana, Y. Determining Basic Household Water Consumption Pattern Estimation of Piped Water Coverage of Rawal Town. Master’s Thesis, International Islamic University, Islamabad, Pakistan, 2010. [Google Scholar]


Disclaimer/Publisher’s Note: The statements, opinions and data contained in all publications are solely those of the individual author(s) and contributor(s) and not of MDPI and/or the editor(s). MDPI and/or the editor(s) disclaim responsibility for any injury to people or property resulting from any ideas, methods, instructions or products referred to in the content. |
© 2025 by the authors. Licensee MDPI, Basel, Switzerland. This article is an open access article distributed under the terms and conditions of the Creative Commons Attribution (CC BY) license (https://creativecommons.org/licenses/by/4.0/).