Article

A Novel Vulnerability Evaluation Model of a Public Service Building Based on Structural Equation Modeling and Matter-Element Extension

1
School of Architectural Engineering, Xinyang Vocational and Technical College, Xinyang 464000, China
2
Zhongqianliyuan Engineering Consulting Co., Ltd., Wuhan 430000, China
3
School of Civil Engineering and Architecture, Wuhan University of Technology, Wuhan 430000, China
4
School of Infrastructure Engineering, Nanchang University, Nanchang 330000, China
*
Author to whom correspondence should be addressed.
Buildings 2025, 15(6), 948; https://doi.org/10.3390/buildings15060948
Submission received: 17 July 2024 / Revised: 23 February 2025 / Accepted: 5 March 2025 / Published: 17 March 2025
(This article belongs to the Special Issue Advances in Life Cycle Management of Buildings)

Abstract

:
Vulnerability assessments of public service buildings (PSBs) are critical to life cycle management. An accurate evaluation can substantially improve the quality of public services and reduce the government’s financial burden. We proposed a WBS-VBS framework to build a vulnerability decomposition matrix for PSBs. A Chinese vocational education center relocation case study validated the method. Structural equation modeling (SEM) was used to normalize the path coefficients and obtain the index weights. The matter-element extension method was utilized to calculate correlation functions and determine the vulnerability levels of different indicators. The case study results demonstrate the effectiveness of the model.

1. Introduction

Public service buildings (PSBs) serve public needs through accessible and sustainable designs. However, their long operational cycles impose high financial burdens on governments.
During the implementation of PSBs projects, it is inevitable to face certain vulnerabilities related to some long-term relationships, as well as high complexity and uncertainty due to environmental changes (i.e., policy changes, capital chain disruptions, and credit risks of partners), which affect the stability of the project. Assessing the vulnerability of PSBs is not only key to ensuring the smooth progress of PSB projects, but also a necessary prerequisite for maintaining public value and improving service quality and efficiency.
Many scholars have analyzed the construction risks of projects such as hospitals, schools, and stations under PSBs and provided informative results. Qin et al. [1] evaluated the risk factors of the National Wetland Park project through 132 questionnaires, effectively solved the financing dilemma of the supply of ecological products, and improved the efficiency of project management. Tugba et al. [2] identified five of the most critical risk factors in urban hospital construction projects in Turkey: “exchange rate fluctuations”, “inflation rate fluctuations”, “high financing costs”, “fiscal problems”, and “economic crisis”. Hui et al. [3] summarized the obstacles to the development of hydrogen energy transportation, highlighted the potential of hydrogen energy development, and solved urgent problems such as the risks of hydrogen refueling station construction in China.
Vulnerability assessment is required for risk management. It systematically analyzes a system, network, or program to identify, classify, and evaluate security vulnerabilities or defects that may cause system damage. The concept of vulnerability has been refined over time. Yuan et al. [4] conducted a systematic vulnerability analysis of China’s purchasing power parity, focusing on the risk of surplus value. Yoon-jung Kim [5] analyzed the source of the vulnerability of urban projects by referring to the theories related to contractual cooperation and relational cooperation. Biygautane et al. [6] conducted an in-depth analysis of the financial and procedural value of the Enfida Airport project that failed to meet expectations and found that political factors had a significant impact on the fragility of the project. Urbina et al. [7] comprehensively analyzed the fire vulnerability and risks of the key infrastructure in the historical city center of Guimarães through the GIS system. Although several topics have been analyzed, no studies focused on the vulnerability of PSBs.
System vulnerability assessment is a typical multiple attribute evaluation (MAE) problem. McLeod et al. [8] proposed a subway network vulnerability model based on the shortest path passenger flow and compared different vulnerability assessment methods. They found that a quantitative method had higher applicability and rationality. Yang et al. [9] used the fuzzy set theory to construct three urban environmental vulnerability assessment models. Nam et al. [10] constructed a vulnerability assessment model for agricultural water resources based on the fuzzy matter-element method, providing a sound basis for our research. Iolanda [11] proposed a method for assessing the vulnerability of critical water supply infrastructure based on multiple indicators, which involve land characteristics, user service inefficiencies due to infrastructure failures, and pipeline route characteristics.
The analytic hierarchy process (AHP) [12] or entropy weight method (EWM) [13] is often used to calculate the indicator weights in MAEs. However, the AHP has shortcomings, such as difficulty passing the consistency test, being influenced by the subjective opinions of experts, and strong subjectivity. The EWM results are difficult to interpret. In structural equation modeling (SEM), the square of the path coefficient is explained variance. Thus, it can be regarded as the contribution rate of the index to vulnerability (i.e., the index weight). Unlike the AHP, the weight calculation method based on the path coefficient considers subjective information in the vulnerability assessment. It generally passes the consistency test, is not affected by subjective expert information, and is objective. Its results are easy to interpret, unlike those of the EWM.
Risk assessment methods (such as fuzzy comprehensive evaluation [14], fuzzy closeness degree [15], and other fuzzy methods) or calculation methods based on operational research [16] are often used to assess system vulnerability. Although fuzzy methods are straightforward and highly applicable, they have disadvantages, such as an a priori membership function and difficulty in describing fuzzy uncertainty. The calculation method based on operational research requires high professional expertise because the modeling is complex. Thus, this method is not widely used. Matter-element extension (MEE) is a comprehensive method integrating applied statistics, system engineering, and logic. It is mostly used to solve complex problems and is suitable for MAE. The vulnerability assessment of PSBs requires many incompatible indicators. MEE can solve this problem and evaluate multiple indicators at different levels.
We conduct in-depth theoretical and empirical research on the vulnerability evaluation of PSBs. The potential contributions of this study are as follows: (1) The work breakdown structure-vulnerability breakdown structure (WBS-VBS) method is proposed, and a vulnerability evaluation index system for PSBs is constructed, providing a new approach and a solid foundation for research in related fields. (2) The proposed model normalizes the path coefficients derived from SEM to obtain science-based and appropriate index weights. MEE is used to deal with the fuzziness, diversity, and indicator incompatibility in the vulnerability evaluation of PSBs, resulting in accurate results.
The remainder of this article is structured as follows: Section 2 describes the vulnerability evaluation index system and proposed evaluation model. Section 3 presents the case study. Section 4 discusses the case study results. Section 5 concludes the paper.

2. Materials and Methods

2.1. Establishment of Vulnerability Assessment Index System

The vulnerability of PSBs is defined as the ability of the project system to cope with the adverse effects of sudden risks and adapt and recover from them rapidly during the project’s life cycle.
The WBS divides projects into independent yet interactive tasks based on logical principles. The resource breakdown structure (RBS) is used to identify and analyze resources and risk factors [17].
In the proposed WBS-VBS framework, the RBS is replaced by the VBS. The WBS-VBS for the PSBs is shown in Figure 1.
The vulnerability decomposition matrix for PSBs was developed through a systematic integration of the WBS and VBS. The WBS-VBS framework decomposes the PSB project into hierarchical components, aligning engineering tasks with vulnerability factors. The selection of dimensions was guided by three criteria:
(1)
Lifecycle Coverage: Dimensions were chosen to address vulnerabilities across the entire project lifecycle (design, construction, and operation). For instance, the technical system ensures robustness during construction, while the funding system addresses operational stability.
(2)
Literature Validation: Key dimensions were derived from prior studies on PSB risks. For example, the contract system importance aligns with Yuan et al. [4], who emphasized contractual clarity in PPP projects.
(3)
Expert Consensus: A Delphi survey with 20 PSB experts validated the relevance of dimensions. For example, the organizational management system was prioritized due to its role in mitigating coordination failures.
The WBS-VBS can identify project risks comprehensively but has some disadvantages, such as duplicate risk indicators and few non-critical indicators. We used the relocation of the Qianjiang Vocational Education Center as a case study. A questionnaire survey was used to select preliminary vulnerability indicators and delete duplicate or non-critical indicators to reduce the workload of the follow-up research.
The participants in the questionnaire survey were university researchers, professional technicians, and managers of construction units. A five-level scale was used, with the highest importance for level 1 and the lowest for level 5. Only indicators with an importance score exceeding 3 were retained. We distributed 200 questionnaires, received 127 questionnaires, and obtained 93 valid questionnaires. The data of the 93 valid questionnaires were processed by SPSS 19.0 software. The Cronbach’s α coefficients of all secondary indicators exceeded 0.7, indicating the high reliability of the questionnaire. The Kaiser–Meyer–Olkin (KMO) test statistic of the variables was greater than 0.6, and the significance level was less than 0.001. The results demonstrated the questionnaire’s validity. The influencing factors after screening are listed in Table 1.

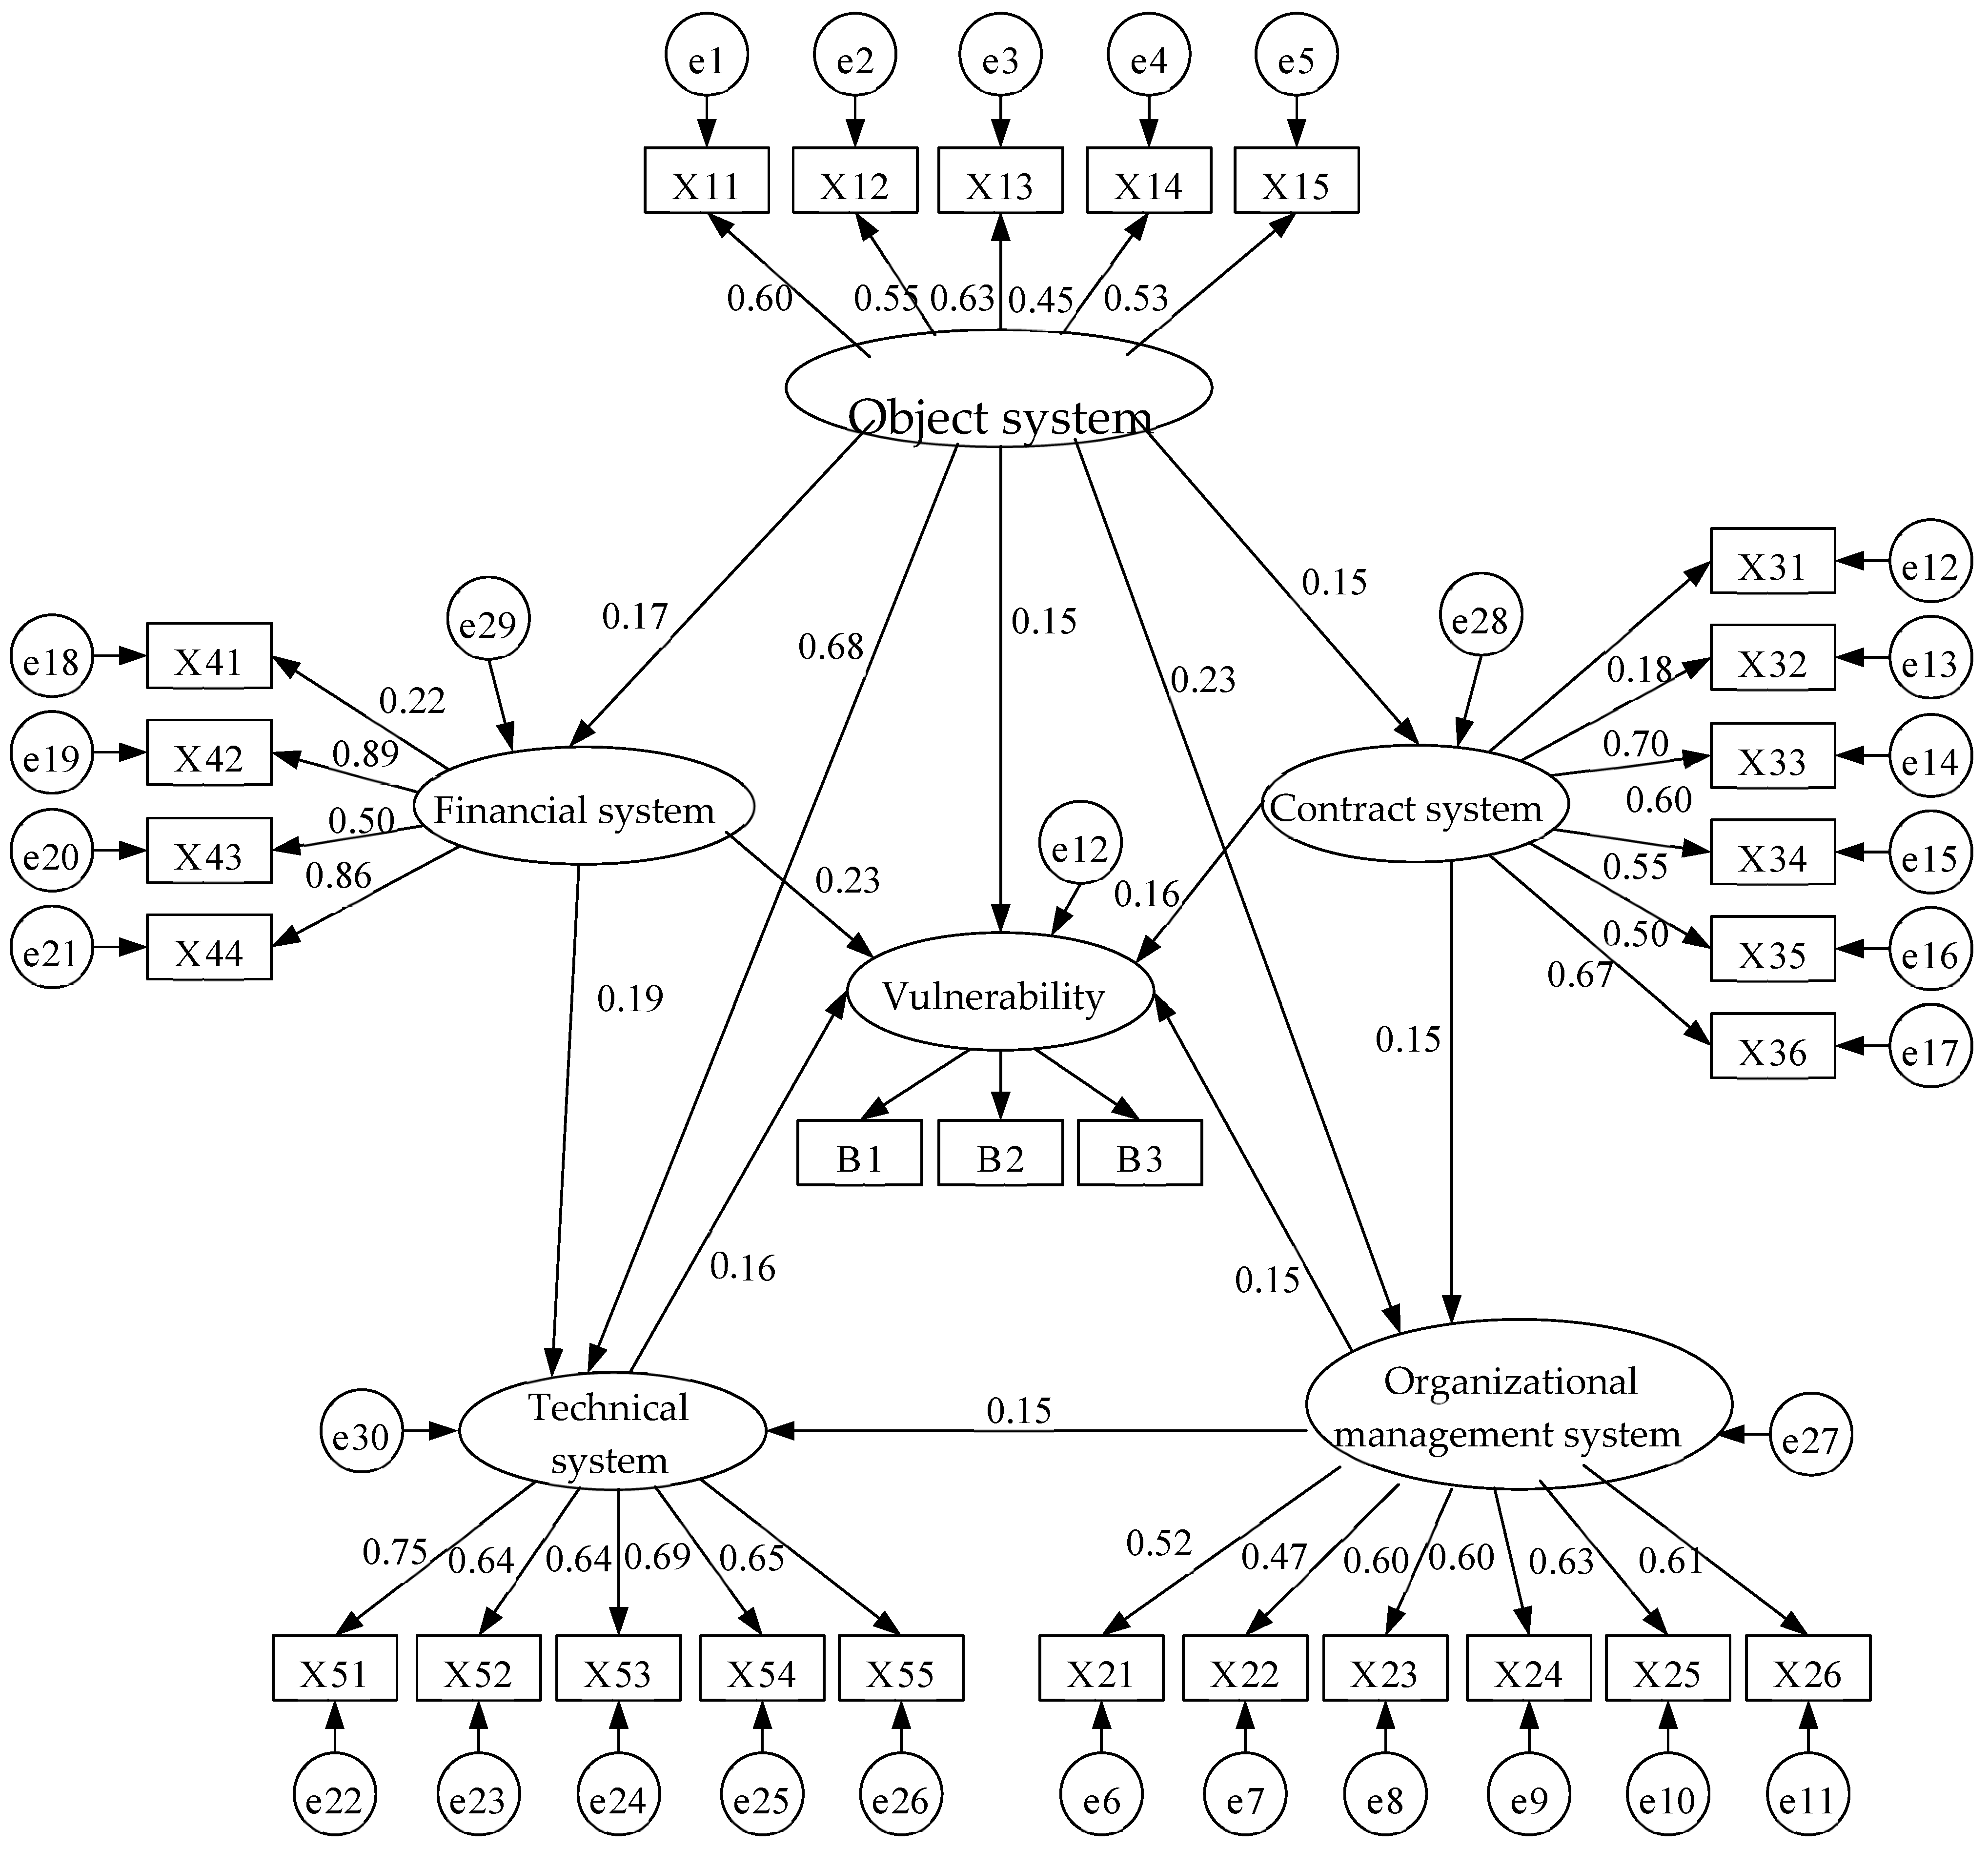
2.2. Vulnerability Analysis of PSBs Using SEM

SEM is a multivariate statistical analysis method that uses a covariance matrix to analyze structural relationships between multiple variables [22]. Latent variables cannot be measured directly but must be inferred indirectly using observed variables. Observed variables can be directly measured and are used to determine latent variables [23,24].
According to previous research on the vulnerability of PSBs systems, the following assumptions are made [25,26,27,28,29,30]:
H1. 
The object system affects vulnerability: The object system encompasses physical attributes such as project scale, land availability, and service substitutability. These factors directly influence structural resilience and operational adaptability. For instance, Qin et al. [1] emphasized that rational project sizing reduces exposure to environmental risks, aligning with our assumption. By addressing vulnerabilities at the design stage (e.g., optimizing land use), PSBs can achieve long-term sustainability [4].
H2. 
The organizational management system affects vulnerability: Effective organizational structures mitigate coordination failures and decision-making delays. Tugba et al. [2] identified poor management as a critical risk in urban projects. A hierarchical management framework ensures accountability and a rapid response to disruptions, thereby reducing systemic fragility.
H3. 
The contract system affects vulnerability: Contracts define roles, responsibilities, and dispute resolution mechanisms. Incomplete contracts often lead to stakeholder conflicts, escalating project risks [6]. Our framework aligns with Yuan et al. [4], who highlighted contractual clarity as a safeguard against financial and operational uncertainties in PPP projects.
H4. 
The financial system affects vulnerability: Financial stability determines resource allocation and risk absorption capacity. Capital cost rates and financing models directly impact project feasibility. Soomro [7] demonstrated that fiscal mismanagement accounts for 68% of transportation PPP failures, validating the need to scrutinize financial systems.
H5. 
The technical system affects vulnerability: Technical robustness, including design accuracy and maintenance plans, underpins operational reliability. Yang et al. [9] linked technical deficiencies to increased vulnerability in urban wetlands, reinforcing our assumption that technological adaptability enhances resilience.
H6. 
Object system: Government investment ratios inversely correlate with private capital risks. Higher public funding reduces private sector exposure to cost overruns, as evidenced in Biygautane et al. [6]. This balance optimizes risk-sharing and financial viability.
H7. 
Object system: Project scale dictates technical requirements. Overly ambitious designs strain organizational capacities, while undersized projects waste resources. Wang et al. [17] confirmed that scalable technical solutions align with realistic organizational frameworks.
H8. 
Object system: Public service characteristics (e.g., educational vs. healthcare facilities) necessitate tailored contracts. For example, operation contracts for vocational centers must address long-term maintenance, differing from short-term infrastructure projects [20].
H9. 
Object system: Land availability and substitutability influence risk allocation. Scarce land intensifies stakeholder competition, while unique services reduce substitutability, amplifying risk concentration.
H10. 
Contract system: Equitable rights/obligations distribution fosters stakeholder collaboration. Cruz and Marques [20] demonstrated that unbalanced contracts erode trust, increasing project fragility. Clear terms mitigate conflicts, ensuring smoother implementation.
H11. 
Organizational management: Collaborative stakeholder partnerships enhance preliminary planning quality. Hui et al. [3] found that early-stage coordination improves design accuracy, reducing construction-phase vulnerabilities.
H12. 
Capital system: Capital cost rates constrain technical choices. High costs may force compromises on material quality or innovation, as noted in Nam et al. [10]. Optimizing financial-technical alignment ensures economically viable yet resilient solutions. The structural model to assess the vulnerability of PSBs was established based on the 12 assumptions. A quantitative study was conducted to assess the model’s validity.
(1) Fitting the structural equation model
The data from the 93 valid questionnaires that passed the reliability and validity tests were imported into the AMSO software 26 to establish the structural equation model (Figure 2).
The model fitting results are listed in Table 2, indicating good model performance.
(2) Structural equation model results
The utility values of the factors influencing the vulnerability influencing factor obtained from the path coefficients are listed in Table 3.
The influences of the systems on the vulnerability of the PSBs projects are listed in Table 4.
(3) Weight calculation based on path coefficient.
The path coefficients of the vulnerability variables in SEM are normalized to determine the objective weight ω i of the i -th index:
ω i = r i i = 1 n r i ,

2.3. Vulnerability Evaluation Model for PSBs Based on MEE

The steps of the MEE model to conduct the vulnerability assessment of PSBs are as follows:
(1) Determine the classes and nodes
According to the required management measures [31], the vulnerability of PSBs is categorized into four levels: high (I), medium (II), low (III), and extremely low (IV) vulnerability (Table 5). The vulnerability levels are defined based on a combination of expert consensus and historical risk thresholds observed in Chinese PSB projects. The value ranges for each level (Table 5) were calibrated through iterative workshops with 20 industry experts, ensuring alignment with practical risk management standards. For instance, Level I corresponds to scenarios requiring immediate intervention, as derived from case studies of failed PSB projects where vulnerability scores fell below 60. Levels II–IV progressively reflect reduced risk exposure, validated through the sensitivity analysis of 30 historical PSB projects in China
According to Table 5, the nodes R are defined as follows [32]:
R = p , C , V = p c 1 [ 0 , 100 ) c 2 [ 0 , 100 ) c i [ 0 , 100 ) .
The vulnerability levels of the secondary indicators must be determined. The vulnerability classes R 0 x are defined as follows [32]:
R 0 x = p c 1 [ W j x c 1 , W k x c 1 ) c 2 [ W j x c 2 , W k x c 2 ) c i [ W x c i , W k x c i ) ,
where R 0 x denotes the vulnerability classes, c 1 to c i are the secondary indicators, W j x c 1 is the lower limit of the vulnerability range of the c 1 indicator, and W k x c 1 is the upper limit of the vulnerability range of the c 1 indicator.
(2) Calculating the correlation function
The following steps are used to calculate the correlation function:
(1)
Find the distance ρ v t , v o t i between the score and the nodal region [ W j o , W k 0 ) [33]:
ρ v t , v o t i = v t W k 0 + W j o 2 W k 0 W j o 2 .
(2)
Find the distance   ρ v t , v p i between the score and the classes [ W j , W k ) [33]:
ρ v t , v p i = v t W k + W j 2 W k W j 2
(3)
The correlation function is defined as follows [33]:
k t i v i = ρ v i , v o t i v o t i   i f   v i v o t i ,
k t i v i = ρ v i , v o t i ρ v i , v p i ρ v i , v o t i   i f   v i v o t i .
(3) Determine the vulnerability level
(1)
Calculating the vulnerability levels of the indicators
The vulnerability levels of the secondary indices are determined. The weighted sum of the correlation functions of the secondary indicators is calculated to obtain the correlation function k t N of the primary indicators for different classes [33]:
k t N = i = 1 l w i k t i v i ,
where w i is the weight of the i -th secondary index.
The vulnerability levels of the primary indices are determined using the maximum membership function.
(2)
Determine the evaluation level
The weighted sum of the correlation functions of the primary indicators is calculated to obtain the correlation functions of the evaluation object for different classes:
K i ( U ) = i = 1 m W i K j ( v i ) ,
where W i is the weight of the i -th primary indicator.
The vulnerability levels of the evaluation object are determined as follows using the maximum membership function:
K j ( U ) = max 1 j n K j ( U ) .

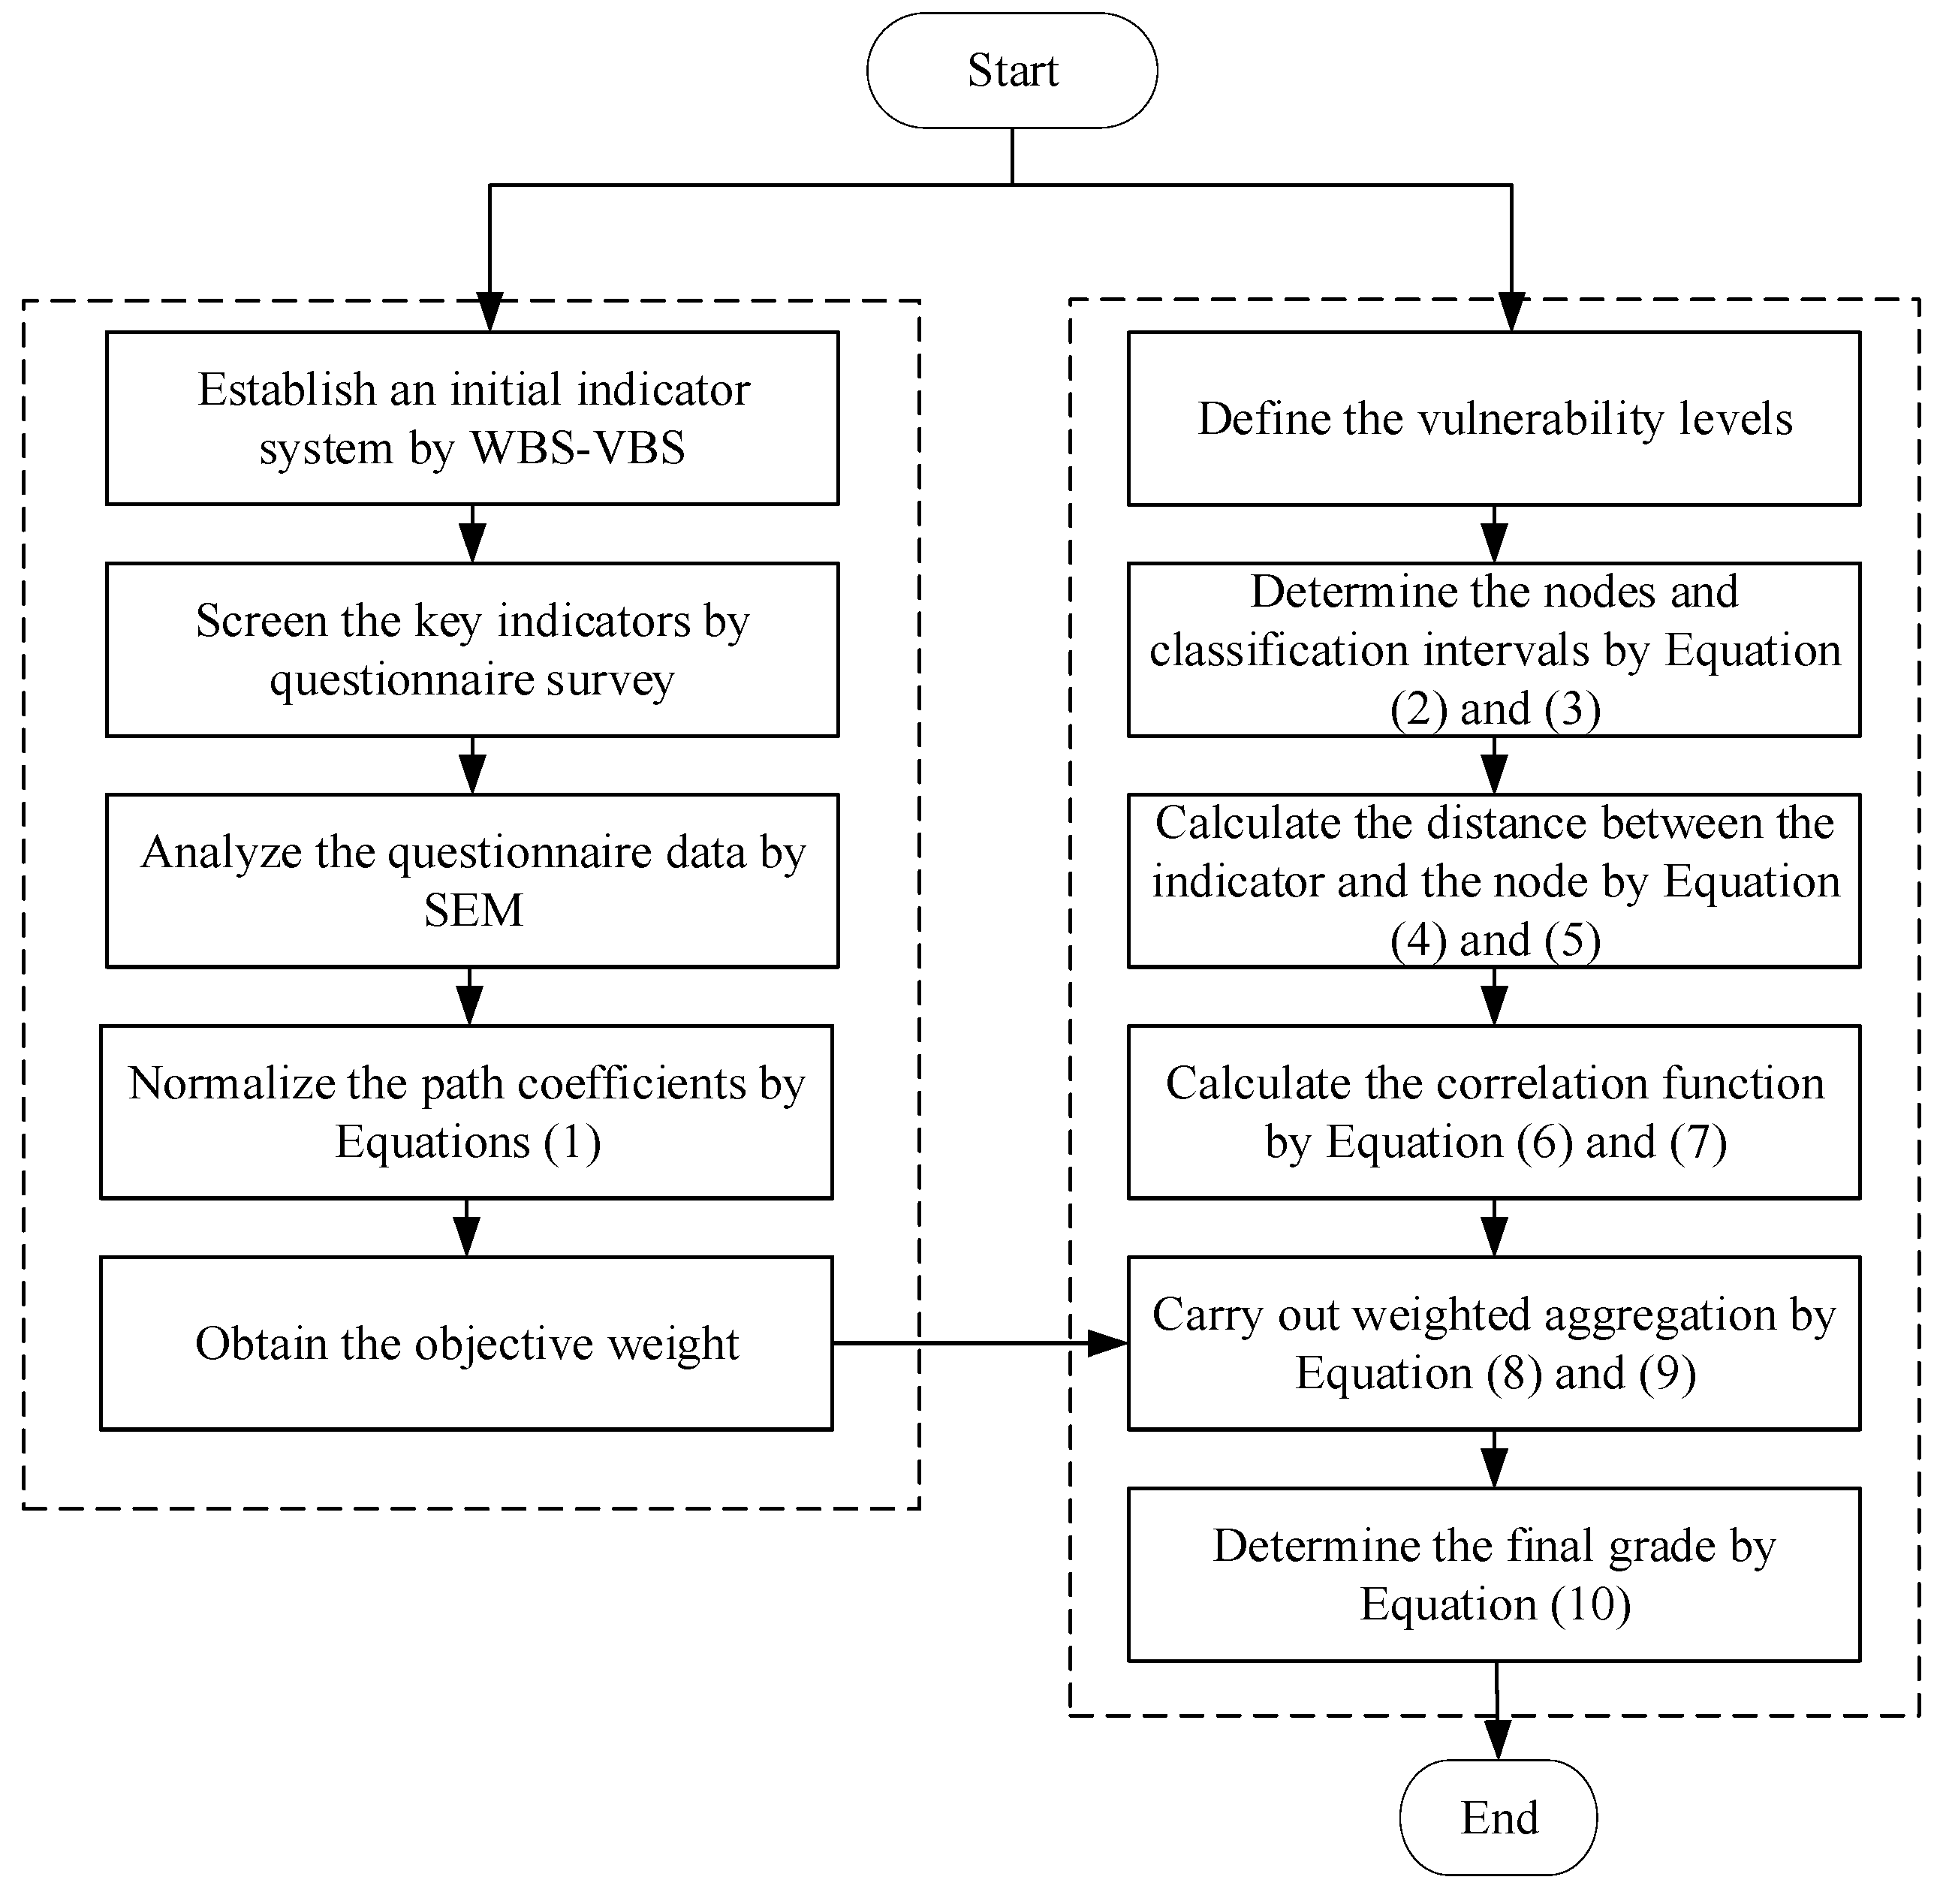
2.4. Implementation of the Proposed Framework

The flow chart of the model proposed in this paper is shown in Figure 3.
The implementation steps of the proposed model are as follows:
Step 1. Establish the evaluation index system.
The initial evaluation index system is established based on the framework of the vulnerability decomposition matrix for the PSBs (Figure 1). The initial indicators were obtained from a questionnaire survey, and the key indicators were extracted to reduce the model’s complexity.
Step 2. Calculate the index weights.
SEM is used to analyze the questionnaire survey results to determine the indicators’ importance values. Equation (1) is used to normalize the path coefficients of the variables to determine the factor weights.
Step 3. Determine the evaluation levels.
Equations (2) and (3) are used to determine the classes and nodes of the evaluation objects. Equations (4) and (5) are used to calculate the distances between the indices, classes, and nodes. The indicators’ correlation functions are calculated using Equations (6) or (7). Equations (8) and (9) are utilized to calculate the weighted correlation function, and Equation (10) is used to determine the vulnerability levels.

3. Case Study

3.1. Project Overview and Data Collection

The Qianjiang Vocational Education Center relocation project involved a total investment of 380 million RMB, with 80 million RMB (21.07%) allocated as capital. The construction period is 1 year, and the operation period is 15 years. During the operation period, the following services are provided by the project company established by the government and social capitalists: (1) 6000 person-times/year of non-academic vocational education and training services for Qianjiang City; (2) logistics support, security services, and property services for students and faculty; and (3) operation and maintenance services of supermarkets and canteens in campus buildings and canteens in vocational education centers.
(1) Acquisition and reliability analysis of qualitative index data.
Table 1 indicates that 20 secondary indicators, such as X 11 , are qualitative indicators; their index data were obtained by a questionnaire survey. Twenty experts were invited to score the 20 qualitative indicators to assess the vulnerability of the Qianjiang Vocational Education Center’s relocation project. The selection of 20 experts was based on the Delphi method principles. Experts were purposively sampled to include representatives from academia (40%), industry (40%), and government (20%), ensuring multidisciplinary perspectives. All experts had ≥10 years of PSB project management experience. Potential biases include homogeneity in expertise and self-selection bias. To mitigate this, we anonymized responses and cross-validated quantitative data with project records.
(2) Data acquisition and reliability analysis of quantitative indicators.
Vulnerability was evaluated by the index system of the PSBs which had six quantitative indicators (Table 2). Their scores and calculation methods are listed in Table 6.
(3) Calculating the scores of the secondary indicators.
The vulnerability levels of the qualitative indicators are listed in Table 7.
The average scores of the secondary indicators obtained from expert opinion are listed in Table 8.
The scores of secondary indicators (Table 8) reflect expert assessments and quantitative data. For qualitative indicators (e.g., X 11 , rationality of project scale), scores above 90 denote minimal vulnerability due to optimal planning, while scores below 60 signal high vulnerability. Quantitative indicators like X 52 (accuracy of bill of quantities) are scaled proportionally; a score of 0.7727 indicates moderate accuracy, aligning with Class III. Notably, X 44 (capital risk level) scored 79.25, highlighting manageable financial risks but underscoring the need for proactive measures to prevent capital chain disruptions.

3.2. Calculating the Indicator Weights Based on the Path Coefficient

Equation (1) is used to obtain the weights of primary indicators (Table 9).
The index weight of primary indicator X 1 (object system) is 0.336. This indicator has the largest weight, showing it is critical in determining the vulnerability of the PSBs. This result is consistent with previous research results on PSBs project risk. In most PSBs project risk studies, external influences and system vulnerability affected risk. This consistency demonstrates the validity of the proposed weight calculation method and the need to assess vulnerability risk.
The weights of the secondary indicators are listed in Table 10.
X 44 has the largest weight (0.0830), indicating the importance of risk and vulnerability management. PSBs have many risk factors because of large investments and long operation and maintenance times. Assessing the capital risk is critical to the project’s success. The main reasons for the failure of PSBs projects are risk events. Lowering capital risk is crucial in PSBs.

3.3. Vulnerability Assessment by the MEE

The distances from the secondary indicators to the nodes and classes are listed in Table 11.
The correlations between the scores and the evaluation levels were calculated as follows using Equation (6) to obtain the correlation matrices for the primary indicators:
k X 1 = 0.780 0.648 0.120 0.158 0.585 0.336 0.660 0.284 0.608 0.372 0.570 0.266 0.688 0.500 0.250 0.167 0.623 0.396 0.510 0.252 ,
k X 2 = 0.458 0.132 0.179 0.350 0.343 0.052 0.047 0.383 0.518 0.228 0.419 0.325 0.660 0.456 0.360 0.209 0.308 0.108 0.089 0.390 0.590 0.344 0.640 0.281 ,
k X 3 = 0.753 0.604 0.010 0.010 0.460 0.136 0.187 0.349 0.480 0.168 0.253 0.342 0.275 0.160 0.121 0.396 0.183 0.287 0.191 0.410 0.820 0.712 0.280 0.636 ,
k X 4 = 0.835 0.736 0.340 1.063 0.715 0.544 0.140 0.109 0.543 0.268 0.578 0.312 0.480 0.168 0.253 0.342 ,
k X 5 = 0.638 0.420 0.450 0.237 0.568 0.308 0.730 0.297 0.373 0.004 0.004 0.376 0.618 0.388 0.530 0.257 0.745 0.592 0.020 0.019 .
The correlation coefficients for the primary indices were calculated using Equation (8) and the data in Table 10 and Table 11. Equation (9) was used to determine the vulnerability levels (Table 12).
The results show a vulnerability level of the PSBs project of III, indicating low vulnerability with some shortcomings. The results are consistent with actual conditions. Project managers should decide whether measures are required to reduce the project’s vulnerability.

4. Discussion

4.1. Discussion of Weight Calculation Results

(1) Analysis of calculation results of primary indicators
According to the calculation results in Table 9 in Section 3.2, the index weight of X 1 is 0.336, which is the first-class index with the largest weight, indicating the core position of the object system in the vulnerability of public service buildings, which is similar to the previous research results on PSB project risks [1]. It should be emphasized that the object of the previous research was PSB project risk, and risk is generally equal to the collection of external disturbance and system vulnerability. The research results still emphasize that the system object is the most important first-level indicator of PSB project risk [3]. This consistency, on the one hand, proves the scientific nature of the weight calculation results in this paper; on the other hand, it also proves the importance of studying vulnerability (refined risk concept) in this paper.
Although this paper used the objective weight calculation method to calculate the index weight, the weight of the object system is the largest and has good interpretability. Object system analysis is one of the most important links in project management, and both risk analysis and vulnerability analysis should pay full attention to the object system of PSBs project. Only by defining the system of the research object can the scientific and effective analysis results be guaranteed. At present, in the practice of PSB project management, it is often found that the analysis conclusions and suggestions take temporary measures instead of permanent solutions. The main reason is that the project managers did not have a clear understanding of the project in the project preparation stage and did not accurately define the object system before the risk analysis (vulnerability analysis).
The weight of X 4 ranks second, with 0.219. Combined with the practice of PSB projects, it can be seen that when the capital system faces unfavorable conditions, it directly affects the success of the project. In the past practice of PSB projects, government departments often did not have a deep understanding of the project’s funding system and simply understood the funding system as the investment amount of social capital; they also did not do a good job of supervising and controlling the process, which led to many minor problems in the funding system, which may have directly led to the collapse of a project. That is, the weight of the capital system ranks second, which is also well interpretable.
In all secondary indicators, X 5 and X 2 have less weight. The reason for its willingness lies in the fact that the PSB project has been developed for many years, its technical solution has been relatively perfect, and its organizational management framework is relatively clear, so its impact on vulnerability is not significant.
(2) Analysis of calculation results of secondary indicators
According to the calculation results in Table 10 in Section 3.2, the weight of X 44 is the largest among all secondary indicators, which is 0.0830. This calculation result highlights the importance of risk management and vulnerability management. As a project management mode, the PSB mode has many risk factors because of its large investment and long operation and maintenance time, and the anti-risk ability of capital is an important guarantee for the project to continue. At present, the main reasons for the failure of PSB projects are various risk events [5]. How to improve the capital’s ability to resist risks is a key task for the participants in PSB projects.   X 13 has the second weight of 0.0766, indicating that it is different.
(3) Comparative analysis of different weighting algorithms
To sum up, although the weight calculation method adopted in this paper is an objective weight calculation method, it is still well interpretable.
According to the literature research, this paper selects the most commonly used AHP in the field of risk assessment and vulnerability assessment and compares it with the weight calculation results in this paper. The calculation principle and steps of AHP can be found in reference [12].
Experts from this questionnaire survey of qualitative indicators for empirical analysis were invited to rate the importance of 26 indicators, and the opinions of these 20 experts were divided into four groups on average. The importance scoring data of the four groups of experts were processed by the AHP method, and the calculated weight results are shown in Table 13.
As can be seen from Table 13, the calculation results of the AHP weights based on the importance scores of four groups of experts are obviously different. Experts in the first and second groups think that the index X 11 is the most important index, while experts in the third and fourth groups think that the index X 13 is the most important index. This is due to the strong subjectivity of AHP, and some experts with level opinions have great influence on the weight calculation results of the AHP. In addition, a consistency check is needed when the AHP is used to calculate the index weight. If you fail to pass the consistency test, you need to adjust the questionnaire and the expert group many times, which has the disadvantage of a heavy workload.
Our findings align with and extend prior studies on PSB vulnerability. For instance, the dominance of the X 1 in vulnerability resonates with Qin et al. [1], who identified project scale as a critical risk factor in wetland PPP projects. Similarly, Tugba et al. [2] emphasized organizational mismanagement as a key vulnerability driver in Turkish hospital projects, which supports our ranking of X 2 as a secondary priority. However, our results diverge from Biygautane et al. [6], who prioritized political factors over financial systems in failed PPPs. This discrepancy may stem from our focus on intrinsic systemic vulnerabilities (e.g., X 44 ) rather than external political risks.

4.2. Discussion on the Results of Vulnerability Assessment

Analysis of Calculation Results of Vulnerability Evaluation

From the results of vulnerability evaluation of this PSBs project, the vulnerability level of the whole project and each system dimension is low, which is basically consistent with the actual situation. Among them, the comprehensive correlation degree between the contract system and grade III is negative, which needs to be paid enough attention. The specific summary is as follows:
(1) Object system
According to the results of vulnerability extension evaluation, we can see that the vulnerability level of the object system is III, which basically meets the objective conditions of the project. The scale of the project is small, the vulnerability management is generally controllable, and the sensitivity to external disturbances is small. Sufficient investment ensures that the project can have sufficient adjustment ability in the face of an unfavorable environment. The public services provided by the project are relatively stable in prospect, so they will not be exposed to unfavorable environment too much. The substitutability of the project is greatly influenced by the policy and needs to be paid attention to. The availability of the project land has not been hindered in the process of project promotion, so it will not cause too much interference to the exposure. It is suggested that the project should pay attention to the projects that coincide with its own functions in the subsequent operation process and make corresponding adjustments.
(2) Organization management system
According to the results of vulnerability extension evaluation, we can see that the vulnerability level of the organization management system is III, which basically meets the objective conditions of the project. The organizational structure of the project is insufficient, which will affect the recovery of the project. In management decision-making, the decision-making may not achieve the best result because of the conflict of interests of managers. In the process of project promotion, the relationship between private capital and government departments is generally good, but occasionally there will be differences, which may increase the exposure of the project. The degree of information sharing is high, the problem is handled efficiently, and the recovery is improved obviously. The risk sharing mechanism is not perfect, and if there is a big risk, the project may not be able to adapt and cause a big loss. Stakeholders have rich experience in developing PSBs projects and have certain treatment and preventive measures against the interference of adverse events. Generally speaking, attention should be paid to improving the risk sharing mechanism of the project to ensure recovery at a high level.
(3) Contract system
The vulnerability level of the contract system is III, but the comprehensive correlation with level III is negative. The overall construction contract is relatively perfect, and the project rarely faces adverse events caused by the construction contract during the construction process. At present, there is great uncertainty in the operation contract, which may increase the exposure of the project. There are some loopholes in the performance guarantee, which may greatly affect the recovery if there is interference. Imperfect restrictions on equity change will also make the recovery performance poor. There is no clear way and method to compensate for early termination. If we really face the situation of early termination, the project may not be resumed and end in failure. The distribution of rights and obligations is relatively clear, and there will be no greater sensitivity due to the division of labor in the process of project promotion. Therefore, there are many shortcomings in the contract system, and it is necessary to further learn from the experience and lessons of past projects to form a complete contract system and improve the vulnerability of the contract system.
(4) Funding system
The vulnerability level of the capital system is III, which shows good performance. The capital cost of the project is low and will not fluctuate greatly due to changes in the external financial environment. The financing mode is also relatively mature and less affected by the outside world. The payment mechanism is relatively perfect, but it still needs to improve the convenience and timeliness of payment. The ability of capital to resist risks is weak because of private capital, which will lead to the crisis of private capital and affect the recovery of the project. Therefore, the fund system management improves the predictability of capital risks and ensures the stability of capital sources.
(5) Technical system
The vulnerability level of the capital system is III, which shows good performance. The technical and economic rationality of the project scheme is high, which improves the recovery of the project. The bill of quantities is also relatively accurate, and it has a certain degree of acceptance of the response to the change in engineering quantity. The quality of the preliminary work is poor, and the foresight of possible problems is not enough, which increases the exposure of project I. The design of the construction organization is comprehensive and scientific, which reduces the influence of external disturbance. The operation and maintenance are relatively simple, and the recoverability is good. In the management of technical systems, the quality of preliminary work is poor, which can be continuously supplemented and improved in the actual promotion process.
In this paper, fuzzy comprehensive evaluation, gray clustering, and TOPSIS are selected to calculate the vulnerability grade of the empirical research object. The calculation method and principle of fuzzy comprehensive evaluation refer to the previous research results [14], the calculation method and principle of gray clustering refer to the previous research results [34], and the calculation method and principle of TOPSIS refer to the previous research results [35]. In order to avoid the influence of the weight calculation results, the fuzzy comprehensive evaluation method, gray clustering method, and TOPSIS all adopt the weight based on the path coefficient.
Fuzzy comprehensive evaluation is used to evaluate the vulnerability of the overall relocation project of the Qianjiang Vocational Education Center. The results of the vulnerability evaluation of this project are [0.005,0.210,0.403,0.382], and the vulnerability evaluation grade of this project belongs to III, which has the highest degree of membership. Although the results of fuzzy comprehensive evaluation and MEE are similar, the membership degree of Ⅲ and Ⅳ comments is close when fuzzy comprehensive evaluation is adopted, which may lead to inaccurate evaluation results. According to the Section 3.3, when the MEE is adopted, the membership degree of the vulnerability of the project to the four vulnerability grades is obviously different. This method can effectively avoid this situation, reflect the differences in each evaluation unit, and better deal with the certainty and uncertainty of the project construction risk evaluation system.
The vulnerability of the whole relocation project of Qianjiang Vocational Education Center is evaluated by gray clustering. The gray correlation degree of the vulnerability of the project is 0.7456, and the vulnerability grade is III, which is the same as the results of the fuzzy comprehensive evaluation and MEE. However, the gray relational analysis needs to determine the optimal value of each secondary index in advance, so the method is too subjective when it is used in this paper. The MEE does not need to determine the optimal value of the index, which avoids the disadvantages of gray correlation degree and has good reliability and operability.
TOPSIS is used to evaluate the vulnerability of the whole relocation project of Qianjiang Vocational Education Center. The relative closeness of the vulnerability of the project is 0.3468, and the risk level is III. The evaluation results are the same as those obtained by other evaluation methods. Although TOPSIS has the advantages of simple principle and simple calculation, it is difficult to determine the optimal values of some indexes in the calculation process, and the traditional Euclidean distance algorithm may also have special cases of the closeness of positive and negative ideal solutions. Therefore, TOPSIS is not suitable for this study.

5. Conclusions

(1)
This paper established a WBS-VBS framework for a PSB and conducted a case study of the Qianjiang Vocational Education Center relocation. A questionnaire survey was used to obtain data for creating a vulnerability evaluation index system. SEM was used to perform a quantitative analysis of the factors influencing vulnerability. Objective weights were obtained by normalizing the path coefficients between variables.
(2)
The MEE method was used to determine the vulnerability levels of the PSBs. Correlation functions were established to determine the classes and nodes and derive the projects’ vulnerability level.
(3)
The case study results indicated a vulnerability level of III (low vulnerability), which was consistent with the project’s actual operational conditions. This finding underscores the necessity for adaptive management strategies tailored to systemic interdependencies identified in the model.
The proposed WBS-VBS-SEM-MEE framework equips project managers with a proactive tool to prioritize risk mitigation. Additionally, the contract system’s negative correlation with vulnerability level III highlights the need for dynamic contractual clauses. Managers should integrate periodic vulnerability assessments into project lifecycles, leveraging SEM to update path coefficients as external conditions evolve. Governments and regulatory bodies should mandate vulnerability assessments as a prerequisite for PSB project approvals, ensuring alignment with public value goals. For example, the dominance of the object system suggests that policymakers must enforce rigorous feasibility studies to clarify project scale and substitutability during planning phases. Furthermore, the financial system’s critical role calls for standardized risk-sharing mechanisms in PPPs, reducing fiscal burdens on local governments. Lessons from the Qianjiang case—such as optimizing land availability to mitigate delays—could inform national guidelines for PSB sustainability.
This study has some limitations:
(1)
This manuscript analyzes the vulnerability of public service buildings by taking an educational public service building as an example. However, different types of public service buildings may have different limitations. In the future, more case studies are required to verify the research findings of this paper and promote more efficient public service provisions by various public service buildings globally.
(2)
Vulnerability is an inherent attribute of the public service building system. The failure of public service buildings is caused by the combined effect of external risk factors and their own vulnerability. In the future, the interaction mechanism between external risk factors and self-vulnerability can be analyzed in more detail to summarize more management strategies worthy of engineering guidance for the public service building system.
(3)
Future research should generalize this framework to diverse PSB types and integrate machine learning to automate data-driven vulnerability updates. Beyond academia, this approach can guide policymakers in formulating standardized risk assessment protocols for public infrastructure, ensuring long-term service continuity. Additionally, the model’s adaptability to different cultural and economic contexts could enhance global resilience in public service delivery.

Author Contributions

Conceptualization, H.P. and X.W.; methodology, H.P. and X.W.; software, J.Z.; validation, H.P., J.Z., C.P. and X.W.; formal analysis, H.P. and X.W.; investigation, C.P. and J.Z.; resources, J.Z.; data curation, J.Z.; writing—original draft preparation, H.P., X.W., J.Z. and C.P.; writing—review and editing, H.P., X.W., J.Z. and C.P.; visualization, H.P.; supervision, H.P.; project administration, H.P.; funding acquisition, H.P. and X.W. All authors have read and agreed to the published version of the manuscript.

Funding

This research was funded by Science and Technology R&D Project of China Construction Fourth Bureau (HX202212140002).

Data Availability Statement

The case analysis data used to support the findings of this study are available from the corresponding author upon request.

Conflicts of Interest

Author Jin Zhang is employed by the Zhongqianliyuan Engineering Consulting Co., Ltd. The remaining authors declare that the research was conducted in the absence of any commercial or financial relationships that could be construed as a potential conflict of interest.

References

  1. Qin, T.; Song, R.; Jin, C.Z. Risk Identification and Analysis of National Wetland Park Public-private Partnership Project Based on Grey Correlation Model. J. Ecol. Rural Environ. 2023, 39, 429–435. [Google Scholar]
  2. Erdem, T.D.; Birgonul, Z.; Bilgin, G.; Akcay, E.C. Exploring the Critical Risk Factors of Public–Private Partnership City Hospital Projects in Turkey. Buildings 2024, 14, 498. [Google Scholar] [CrossRef]
  3. Zhao, H.; Yu, G.; Cheng, X. Risk management of hydrogenation station PPP project based on 3D framework-A case study in China. PLoS ONE 2023, 18, e0293348. [Google Scholar] [CrossRef]
  4. Yuan, J.F.; Li, X.; Chen, K.W.; Skibniewski, M.J. Modelling residual value risk through ontology to address vulnerability of PPP project system. Adv. Eng. Inform. 2018, 38, 776–793. [Google Scholar] [CrossRef]
  5. Kim, Y.-J. Public–private Partnerships for Urban Projects: A Korean Case of Partnership Failure. Int. J. Public Adm. 2022, 45, 499–510. [Google Scholar] [CrossRef]
  6. Mhamed, B.; Omar, A. When the institutional context thwarts public-private partnerships: The role of political factors in the failure of PPPs. J. Infrastruct. Policy Dev. 2023, 7, 1937. [Google Scholar] [CrossRef]
  7. Urbina, O.; Sousa, H.S.; Fekete, A.; Matos, J.C.; Teixeira, E. Spatial Vulnerability Assessment of Critical Infrastructure Based on Fire Risk through GIS Systems—Case Study: Historic City Center of Guimarães, Portugal. Appl. Sci. 2023, 13, 8881. [Google Scholar] [CrossRef]
  8. M’Cleod, L.; Vecsler, R.; Shi, Y.; Levitskaya, E.; Kulkarni, S.; Malinchik, S.; Sobolevsky, S. Vulnerability of Transportation Networks: The New York City Subway System under Simultaneous Disruptive Events. In Proceedings of the 6th Annual International Young Scientists Conference on HPC and Computational Science (YSC), Kotka, Finland, 1–3 November 2017; pp. 42–50. [Google Scholar]
  9. Yang, X.; Liu, S.; Jia, C.; Liu, Y.; Yu, C. Vulnerability assessment and management planning for the ecological environment in urban wetlands. J. Environ. Manag. 2021, 298, 113540. [Google Scholar] [CrossRef]
  10. Nam, W.-H.; Choi, J.-Y.; Hong, E.-M. Irrigation vulnerability assessment on agricultural water supply risk for adaptive management of climate change in South Korea. Agric. Water Manag. 2015, 152, 173–187. [Google Scholar] [CrossRef]
  11. Borzì, I. Vulnerability assessment of water supply infrastructures through multiple indicator methodology. J. Water Clim. Change 2023, 14, 3967–3984. [Google Scholar] [CrossRef]
  12. David, E.-E.R.; Mauricio, L.-B.; Gerardo, M.; Carlos, O.-G.J. Selection of software agile practices using Analytic hierarchy process. Heliyon. 2024, 10, e22948. [Google Scholar]
  13. Na, S.; Cailin, L.; Baoyun, G.; Xiaokai, S.; Yukai, Y.; Yue, W. Urban flooding risk assessment based on FAHP–EWM combination weighting: A case study of Beijing. Geomat. Nat. Hazards Risk 2023, 14, 2240943. [Google Scholar]
  14. Zhong, J.; Li, Z.; Zhang, D.; Yang, J.; Zhu, J. An evaluation framework for urban ecological compensation priority in China based on meta-analysis and fuzzy comprehensive evaluation. Ecol. Indic. 2024, 158, 111284. [Google Scholar] [CrossRef]
  15. Mishra, A.R.; Rani, P.; Cavallaro, F.; Hezam, I.M.; Lakshmi, J. An Integrated Intuitionistic Fuzzy Closeness Coefficient-Based OCRA Method for Sustainable Urban Transportation Options Selection. Axioms 2023, 12, 144. [Google Scholar] [CrossRef]
  16. Brotcorne, L.; Guajardo, M.; Ribeiro, C.C.; Speranza, M.G. Tutorials and Reviews in Operations Research. Int. Trans. Oper. Res. 2023, 30, 2707–2708. [Google Scholar] [CrossRef]
  17. Wang, J. Construction of Risk Evaluation Index System for Power Grid Engineering Cost by Applying WBS-RBS and Membership Degree Methods. Math. Probl. Eng. 2020, 2020, 6217872. [Google Scholar] [CrossRef]
  18. Afieroho, U.E.; Li, Y.K.; Han, Y.L.; Soomro, M.A.; Radujkovic, M. Transformational Community Engagement in Urban Infrastructure Public-Private Partnerships: A Governmentality Approach to Create Social Value. Buildings 2023, 13, 1225. [Google Scholar] [CrossRef]
  19. Bogovac, J.; Lugaric, T.R.; Dodig, D. Public-private partnership in Croatia—Students’ attitudes. Ekon. Misao Praksa-Econ. Thought Pract. 2021, 30, 121–144. [Google Scholar] [CrossRef]
  20. Cruz, C.O.; Marques, R.C. Revisiting the Portuguese experience with public-private partnerships. Afr. J. Bus. Manag. 2011, 5, 4023–4032. [Google Scholar]
  21. Ghasemi, M.; Amini-Rarani, M.; Zadeh, N.S.; Karimi, S. Role of Public-Private Partnerships in Primary Healthcare Services Worldwide: A Scoping Review. Health Scope 2022, 11, e129176. [Google Scholar] [CrossRef]
  22. Hadiuzzaman, M.; Farazi, N.P.; Hossain, S.; Barua, S.; Rahman, F. Structural equation approach to investigate trip-chaining and mode choice relationships in the context of developing countries. Transp. Plan. Technol. 2019, 42, 391–415. [Google Scholar] [CrossRef]
  23. Gim, T.-H.T. SEM application to the household travel survey on weekends versus weekdays: The case of Seoul, South Korea. Eur. Transp. Res. Rev. 2018, 10, 11. [Google Scholar] [CrossRef]
  24. Wang, Y.; Yan, X.; Zhou, Y.; Xue, Q. Influencing Mechanism of Potential Factors on Passengers’ Long-Distance Travel Mode Choices Based on Structural Equation Modeling. Sustainability 2017, 9, 1943. [Google Scholar] [CrossRef]
  25. Hodge, G.A.; Greve, C. On Public-Private Partnership Performance: A Contemporary Review. Public Work Manag. Policy 2017, 22, 55–78. [Google Scholar] [CrossRef]
  26. Klunko, N.S.; Lobanova, A.E. Interaction System of the State and Business in the Regime of Public-Private Partnership in the Pharmaceutical Complex of the Russian Federation. J. Pharm. Res. Int. 2021, 33, 16–22. [Google Scholar] [CrossRef]
  27. Krumm, T.; Mause, K. Public-private partnerships as object of political sciences. Polit. Vierteljahresschr. 2009, 50, 105–129. [Google Scholar] [CrossRef]
  28. Tariq, S.; Zhang, X.Q.; Leung, R.H.M. An analytical review of failed water public-private partnerships in developing countries. Proc. Inst. Civ. Eng.-Manag. Procure. Law 2019, 172, 60–69. [Google Scholar] [CrossRef]
  29. Wang, H.M.; Xiong, W.; Wu, G.D.; Zhu, D.J. Public-private partnership in Public Administration discipline: A literature review. Public Manag. Rev. 2018, 20, 293–316. [Google Scholar] [CrossRef]
  30. Zuvela, A.; Dragija, M.S.; Jelincic, D.A. Partnerships in Heritage Governance and Management: Review Study of Public-Civil, Public-Private and Public-Private-Community Partnerships. Heritage 2023, 6, 6862–6880. [Google Scholar] [CrossRef]
  31. Wu, H.; Wang, J. Assessment of Waterlogging Risk in the Deep Foundation Pit Projects Based on Projection Pursuit Model. Adv. Civ. Eng. 2020, 2020, 2569531. [Google Scholar] [CrossRef]
  32. Xiao, Q.; He, R.; Ma, C.; Zhang, W. Evaluation of urban taxi-carpooling matching schemes based on entropy weight fuzzy matter-element. Appl. Soft Comput. 2019, 81, 105493. [Google Scholar] [CrossRef]
  33. Tang, J.; Wang, C. Comprehensive Evaluation of Safety Risk of Air Traffic Management System Based on Matter Element Model: Take the Air Traffic Management Unit of a Coastal City in China as an Example. J. Coast. Res. 2020, 104, 328–332. [Google Scholar] [CrossRef]
  34. Liu, S.F.; Yang, Y.J.; Xie, N.M.; Forrest, J. New progress of Grey System Theory in the new millennium. Grey Syst.-Theory Appl. 2016, 6, 2–31. [Google Scholar] [CrossRef]
  35. Behzadian, M.; Otaghsara, S.K.; Yazdani, M.; Ignatius, J. A state-of the-art survey of TOPSIS applications. Expert Syst. Appl. 2012, 39, 13051–13069. [Google Scholar] [CrossRef]
Figure 1. Framework of the vulnerability decomposition matrix for the PSBs.
Buildings 15 00948 g001
Figure 2. Structural equation model to assess the vulnerability of PSBs.
Buildings 15 00948 g002
Figure 3. Roadmap for model implementation.
Buildings 15 00948 g003
Table 1. Influencing factors of vulnerability of the PSBs.
Primary IndicesSecondary IndicesReferences
Object system: X 1 Rationality of project scale: X 11 [1,2]
Total investment ratio of the government: X 12 [1,2,3]
Features of public services: X 13 [1,4]
The substitutability of the project: X 14 [1,5,6]
Availability of land for the project: X 15 [2,6]
Organization management system: X 2 Rationality of organizational structure: X 21 [1,3,4]
Rationality of management decisions: X 22 [18]
Stakeholder partnership: X 23 [3,4,5,6]
Information sharing degree: X 24 [5,6]
Degree of risk sharing: X 25 [1,3,4]
Experience of stakeholders in developing PSBs projects: X 26 [1,2,3,4]
Contract system: X 3 Completeness of construction contract: X 31 [4,6]
Completeness of operation contract: X 32 [1,6]
Performance bond ratio: X 33 [3,5,6]
Rationality of equity change restrictions: X 34 [1,2,5]
Rationality of early termination compensation: X 35 [19]
Rationality of distribution of rights and obligations: X 36 [2,6]
Funding system: X 4 Capital cost rate: X 41 [5,6]
Applicability of financing model: X 42 [1,3,4]
Applicability of payment mechanism: X 43 [20]
Capital risk level: X 44 [4,5,6]
Technical system: X 5 Technical and economic rationality of the scheme: X 51 [21]
Accuracy of bill of quantities: X 52 [1,2,3,4]
Quality of preliminary work: X 53 [1,4,6]
Rationality of construction organization design: X 54 [1,3,4]
Operation and maintenance complexity: X 55 [2,4,5,6]
Table 2. Model fitting results.
Absolute Fitting INDEXIncremental Fitting IndexReduced Fitting Index
CMIN/DFRMRRMSEAGFINFITLICFIPGFIPNFIPCFI
<2<0.05<0.05>0.90>0.90>0.90>0.90>0.50>0.50>0.50
1.1090.0240.0220.9230.9130.9880.9900.7250.7780.853
PassedPassedPassedPassedPassedPassedPassedPassedPassedPassed
Table 3. Utility values of factors influencing vulnerability.
Factors Affecting Vulnerability Utility ValueFactors Affecting Vulnerability Utility Value
X 11 0.60 X 33 0.60
X 12 0.55 X 34 0.55
X 13 0.63 X 35 0.50
X 14 0.45 X 36 0.67
X 15 0.53 X 41 0.22
X 21 0.52 X 42 0.69
X 22 0.47 X 43 0.50
X 23 0.60 X 44 0.86
X 24 0.60 X 51 0.75
X 25 0.63 X 52 0.64
X 26 0.61 X 53 0.64
X 31 0.18 X 54 0.69
X 32 0.70 X 56 0.65
Table 4. Influences of the systems on vulnerability.
PathDirect InfluenceIndirect InfluenceComprehensive InfluenceRank
Object system Vulnerability0.1490.2440.3931
Organizational management system Vulnerability0.1450.0290.1744
Contract system Vulnerability0.1630.0260.1893
Financial system Vulnerability0.2260.030.2562
Technical system Vulnerability0.15600.1565
Table 5. Vulnerability classification.
Vulnerability ClassificationDefinition Value Range
The vulnerability is high and unacceptable. [ 0 , 60
The vulnerability is moderate and must be improved. [ 60 , 75
The vulnerability is low and acceptable. [ 75 , 90
The vulnerability is extremely low and acceptable. [ 90 , 100 ]
Table 6. Calculations of quantitative index scores in the case study.
IndexCalculation Method
X 12 Obtain the project management data, consisting of 8 million data points, accounting for 10% of the project capital.
X 24 Shared information/total information = 341 files/731 files = 0.466.
X 33 Th performance bond ratio during the operation period is 3%.
X 41 The fund occupation fee/net fund raising is 6.49%.
X 52 Correct bill of quantities/all bills of quantities = 13,596.55 (ten thousand yuan)/17,596.55 (ten thousand yuan) = 0.7727.
X 55 Actual operation and maintenance costs/planned operation and maintenance costs = 3451.42 (ten thousand yuan/year)/25,502,800 yuan/year = 1.353.
Table 7. Vulnerability levels of secondary indicators.
IndicatorIIIIIIIV
X 11 [ 0 , 60 [ 60 , 75 [ 75 , 90 [ 90 , 100 ]
X 12 [ 20 % , 100 % ] [ 10 % , 20 % [ 5 % , 10 % [ 0 , 5 % )
X 13 [ 0 , 60 [ 60 , 75 [ 75 , 90 [ 90 , 100 ]
X 14 [ 0 , 60 [ 60 , 75 [ 75 , 90 [ 90 , 100 ]
X 15 [ 0 , 60 [ 60 , 75 [ 75 , 90 [ 90 , 100 ]
X 21 [ 0 , 60 [ 60 , 75 [ 75 , 90 [ 90 , 100 ]
X 22 [ 0 , 60 [ 60 , 75 [ 75 , 90 [ 90 , 100 ]
X 23 [ 0 , 60 [ 60 , 75 [ 75 , 90 [ 90 , 100 ]
X 24 [ 0.75 , 1 ] [ 0.5 , 0.75 [ 0.25 , 0.5 [ 0 , 0.25
X 25 [ 0 , 60 [ 60 , 75 [ 75 , 90 [ 90 , 100 ]
X 26 [ 0 , 60 [ 60 , 75 [ 75 , 90 [ 90 , 100 ]
X 31 [ 0 , 60 [ 60 , 75 [ 75 , 90 [ 90 , 100 ]
X 32 [ 0 , 60 [ 60 , 75 [ 75 , 90 [ 90 , 100 ]
X 33 [ 3 % , 10 % [ 2 % , 3 % [ 1 % , 2 % [ 0 , 1 % ]
X 34 [ 0 , 60 [ 60 , 75 [ 75 , 90 [ 90 , 100 ]
X 35 [ 0 , 60 [ 60 , 75 [ 75 , 90 [ 90 , 100 ]
X 36 [ 0 , 60 [ 60 , 75 [ 75 , 90 [ 90 , 100 ]
X 41 [ 20 % , 100 % ] [ 10 % , 20 % [ 5 % , 10 % [ 0 , 5 %
X 42 [ 0 , 60 [ 60 , 75 [ 75 , 90 [ 90 , 100 ]
X 43 [ 0 , 60 [ 60 , 75 [ 75 , 90 [ 90 , 100 ]
X 44 [ 0 , 60 [ 60 , 75 [ 75 , 90 [ 90 , 100 ]
X 51 [ 0 , 60 [ 60 , 75 [ 75 , 90 [ 90 , 100 ]
X 52 ( 0.9 , 1 ] ( 0.8 , 0.9 ] ( 0.7 , 0.8 ] [ 0 , 0.7 ]
X 53 [ 0 , 60 [ 60 , 75 [ 75 , 90 [ 90 , 100 ]
X 54 [ 0 , 60 [ 60 , 75 [ 75 , 90 [ 90 , 100 ]
X 55 [ 1.2 , 2 [ 1.1 , 1.2 [ 1 , 1.1 [ 0.8 , 1 )
Table 8. Scores of secondary indicators.
Secondary IndicatorsScoresSecondary IndicatorsScores
X 11 91.25 X 33 3%
X 12 10% X 34 71.05
X 13 84.30 X 35 67.35
X 14 87.55 X 36 92.85
X 15 84.95 X 41 6.49%
X 21 78.30 X 42 88.60
X 22 73.75 X 43 81.70
X 23 80.75 X 44 79.25
X 24 0.466 X 51 85.55
X 25 72.35 X 52 0.7727
X 26 83.60 X 53 74.90
X 31 90.10 X 54 84.75
X 32 78.45 X 55 1.353
Table 9. Weights of primary indicators.
Primary IndicatorsComprehensive Influence Comprehensive Weight
X 1 0.3930.336
X 2 0.1740.149
X 3 0.1890.162
X 4 0.2560.219
X 5 0.1560.134
Table 10. Weights of secondary indicators.
IndicatorsWeightComprehensive WeightRankIndicators WeightComprehensive WeightRank
X 11 0.2170.07293 X 33 0.1880.030511
X 12 0.1990.06694 X 34 0.1720.027913
X 13 0.2280.07662 X 35 0.1560.025322
X 14 0.1630.05487 X 36 0.2090.033910
X 15 0.1920.06456 X 41 0.0970.021224
X 21 0.1520.022623 X 42 0.3040.06665
X 22 0.1370.020425 X 43 0.2200.04828
X 23 0.1750.026117 X 44 0.3790.08301
X 24 0.1750.026118 X 51 0.2230.029912
X 25 0.1840.027415 X 52 0.1900.025520
X 26 0.1780.026516 X 53 0.1900.025521
X 31 0.0560.009126 X 54 0.2050.027514
X 32 0.2190.03559 X 55 0.1930.025919
Table 11. Distances from secondary indicators to nodes and classes.
IndicatorNodesClass ⅠClass ⅡClass ⅢClass Ⅳ
X 11 16.25−16.2543.7558.7573.75
X 12 24.9023.9024.7024.8024.85
X 13 9.30−9.3050.7065.7080.70
X 14 12.55−12.5547.4562.4577.45
X 15 9.95−9.9550.0565.0580.05
X 21 3.30−3.3056.7071.7086.70
X 22 −1.251.2561.2576.2591.25
X 23 5.75−5.7554.2569.2584.25
X 24 24.5323.5323.7824.0324.28
X 25 −2.652.6562.6577.6592.65
X 26 8.60−8.6051.4066.4081.40
X 31 15.10−15.1044.9059.9074.90
X 32 3.45−3.4556.5571.5586.55
X 33 24.9724.8724.9424.9524.96
X 34 −3.953.9563.9578.9593.95
X 35 −7.657.6567.6582.6597.65
X 36 17.85−17.8542.1557.1572.15
X 41 24.9423.9424.7424.8424.89
X 42 13.60−13.6046.4061.4076.40
X 43 6.70−6.7053.3068.3083.30
X 44 4.25−4.2555.7570.7585.75
X 51 10.55−10.5549.4564.4579.45
X 52 24.2323.2323.3323.4323.53
X 53 −0.100.1060.1075.1090.10
X 54 9.75−9.7550.2565.2580.25
X 55 23.6521.6522.4522.5522.65
Table 12. Vulnerability assessment results of primary indicators.
System DimensionPrimary IndicatorsCorrelation CoefficientsVulnerability Level
X 1 [0.217, 0.199, 0.228, 0.163, 0.192][−0.656, −0.450, 0.373, −0.159]
X 2 [0.152, 0.137, 0.175, 0.175, 0.184, 0.178][−0.484, −0.174, 0.255, −0.321]
X 3 [0.056, 0.219, 0.188, 0.172, 0.156, 0.209][−0.480, −0.172, −0.021, −0.139]
X 4 [0.097, 0.304, 0.22, 0.379][−0.600, −0.359, 0.233, −0.128]
X 5 [0.223, 0.19, 0.19, 0.205, 0.193][−0.591, −0.345, 0.351, −0.237]
Table 13. Weight calculation results based on the AHP.
IndexGroup 1Group 2Group 3Group 4
WeightSortWeightSortWeightSortWeightSort
X 11 0.088110.095410.081530.08963
X 12 0.057870.0233220.067550.06814
X 13 0.077920.0341100.158210.18291
X 14 0.0195230.0244210.0125180.010319
X 15 0.0208210.091420.051970.05058
X 21 0.0210200.0261180.0411110.031612
X 22 0.0189240.0200240.0406120.028214
X 23 0.0254170.0256200.121520.10772
X 24 0.0246180.035690.0134160.011918
X 25 0.0089260.0322120.049780.000926
X 26 0.0200220.065950.048190.013517
X 31 0.0216190.0073260.0166150.002425
X 32 0.077630.0256190.068140.06156
X 33 0.066450.0282160.0452100.030913
X 34 0.043980.0295140.055460.008322
X 35 0.068640.0228230.0325130.009121
X 36 0.0331120.0306130.0085230.002824
X 41 0.0131250.0198250.0118190.009720
X 42 0.0411100.053260.0041250.016216
X 43 0.041490.081430.0109210.003523
X 44 0.061360.066340.0182140.043410
X 51 0.0330130.035780.0037260.018815
X 52 0.0255160.0276170.0129170.06565
X 53 0.0341110.037070.0086220.04359
X 54 0.0299140.0323110.0114200.05767
X 55 0.0265150.0287150.0063240.031811
Disclaimer/Publisher’s Note: The statements, opinions and data contained in all publications are solely those of the individual author(s) and contributor(s) and not of MDPI and/or the editor(s). MDPI and/or the editor(s) disclaim responsibility for any injury to people or property resulting from any ideas, methods, instructions or products referred to in the content.

