Article

A Load Estimation Method Based on Surface Crack Distribution Images of Reinforced Concrete Beams

1
School of Infrastructure Engineering, Nanchang University, Nanchang 330031, China
2
School of Transportation and Engineering, Jiangxi Flight University, Nanchang 330031, China
*
Author to whom correspondence should be addressed.
Buildings 2025, 15(6), 922; https://doi.org/10.3390/buildings15060922
Submission received: 28 February 2025 / Revised: 12 March 2025 / Accepted: 13 March 2025 / Published: 14 March 2025
(This article belongs to the Special Issue Advances in Life Cycle Management of Buildings)

Abstract

:
The preliminary assessment of structural status in reinforced concrete (RC) using visual indicators like surface cracks serves as the primary step in formulating maintenance and reinforcement strategies. To enhance the efficiency of load identification and damage assessment, this study proposes a novel method for determining external load levels on RC beams using structural surface crack distribution images. First, crack distribution characteristics are extracted using image segmentation techniques. Subsequently, mechanical responses of the beam under different load levels are acquired through the finite element method (FEM). Then, this study develops a novel correlation index model by analyzing the relationships between crack distribution images and strain distribution images from the FEM, enabling accurate identification of the load level that best matches the actual crack distribution. Finally, a preliminary assessment of the damage state is conducted through elastoplastic analysis of the RC beam under the optimal load level. Verification analysis based on multiple experimental beam datasets under different load levels demonstrates that the mean absolute percentage error of the method is 10.98%, and the damage assessment results are in good agreement with the crack distribution images.

1. Introduction

Surface cracks in structures are external manifestations of damage caused by loading, and indicators such as crack length, width, and spatial distribution are crucial for assessing the damage state of the structure. Accurately detecting the characteristics of surface cracks is fundamental for structural safety evaluation and health monitoring. Furthermore, using surface crack images of beams for rapid and quantitative load level assessment can aid in determining the degree of damage and guiding subsequent maintenance strategies.
During the process of acquiring crack images at engineering or experimental sites, inspection personnel can quickly capture crack photos using devices such as cameras or smartphones. With the development of artificial intelligence and machine vision technologies, image segmentation techniques based on deep learning [1,2,3,4] have become mainstream methods for structural crack detection and feature extraction. With accurate information on structural cracks obtained, researchers have analyzed the relationship between structural crack features and load levels.
For concrete beams subjected to standard loads, the fact that cracks on the beam surface extend as the load level increases suggests a clear correspondence between load levels and crack development [5]. To objectively assess the load level of a structural component, some studies have focused on the relationship between observable crack features and load levels. For example, Zhang et al. [6] investigated the regression relationship between crack height, width, and load level through bending failure experiments on test beams. Similarly, Li et al. [7] conducted experiments by applying different loads onto the mid-span of concrete beams and fitted the functional relationship between crack width and load level using experimental data.
Due to the limitations of traditional measurement techniques, early studies primarily focused on manually selected key features such as crack height and width, and the regression analysis was used to predict the load level of the structure. With the progress in machine vision and image processing technologies, the capability to quickly obtain detailed full-field crack information on structural surfaces (including crack morphology, location, orientation, and so on) has delivered more precise and comprehensive data for load assessment and structural health monitoring.
Analysis of surface damage information can further infer the potential load level that a structure may be subjected to. Xu et al. [8] utilized a multi-layer backpropagation (BP) neural network model to establish a mapping relationship between the maximum load in the load history and four-dimensional features (boundary constraints, system parameters, cracks, and deformation) with structural responses under incremental loading. The results reveal that the model exhibits prediction errors on both the training and testing sets, with average absolute percentage errors of 16.46 % and 19.56 %. Davoudi et al. [9,10,11], based on the experimental results from RC beams and slabs under monotonic loads, extracted crack image features using image processing techniques and successfully established the relationship between crack features and load levels through machine learning methods. Among load-level estimations for all specimens together, the best normalized root mean square error (NRMSE) value observed was 17% [9]. Zhang et al. [12] made a correlation analysis between surface cracks of structures and external loads using machine vision and numerical simulation, and the mean absolute percentage error (MAPE) for load estimation based solely on a single measured structural crack image is 20.68%. However, the relationship between crack image features and load levels is difficult to describe with simple regression models and, as a result, these studies employed machine learning models to address this complexity. Nonetheless, machine learning models (especially deep learning models) require large and accurate datasets, which are difficult to obtain due to the high cost of experimental data. To address this issue, the use of finite element simulations to generate large datasets has become an effective way to compensate for the lack of experimental data and establish the relationship between load levels and crack features.
Finite element simulations provide strain distributions and theoretical crack development trends under different load levels, thus supplying sufficient mechanical information for load identification. Although the strain maps derived from dispersed finite element calculations may not precisely align with the actual crack maps, there is a significant correlation between the two. Therefore, it is feasible to establish a rapid mapping relationship between structural crack distribution and load levels by constructing a correlation model. Under the premise that the crack distribution and direction are strongly correlated with the finite element mechanical information, comparing the crack angles and distribution positions in the crack image with finite element results can effectively evaluate the structural load state.
Based on machine vision technology and numerical simulation calculations, this paper proposes a rapid load and damage evaluation method for RC beams, guided by an image correlation indicator. The surface crack distribution map is obtained through image segmentation techniques, and the strain distribution maps of the RC beam under different load levels are derived using finite element analysis. Furthermore, by incorporating crack positions and orientations, a novel image correlation evaluation model is proposed to quantitatively analyze the relationship between the crack distribution map and the strain distribution map. By utilizing the correlation indicator at different load levels, the most probable structural load information can be identified, enabling a detailed analysis of the structural damage state under the corresponding load. The results of this rapid damage state assessment will provide valuable technical support for structural maintenance and reinforcement strategies.

2. Methodology

2.1. Basic Framework

The load estimation framework based on image processing is shown in Figure 1. First, as shown in Figure 1a, image segmentation techniques were employed to obtain a binary image of surface cracks and extract the skeleton of the cracks, providing precise crack morphology information for subsequent analysis and processing. Second, as shown in Figure 1b, in the load identification module, strain distributions under different load levels for bending components were determined through finite element elastoplastic analysis. Using the proposed correlation model, the correlation between crack distribution location, crack direction, and the magnitude and direction of structural strain was comprehensively compared, as shown in Figure 1c; the extreme values of correlation at different load levels indicate the load level that best matches the current crack distribution, as shown in Figure 1d. Finally, elastoplastic finite element analysis was applied to assess the structural damage state under the optimal predicted load, as shown in Figure 1e.

2.2. Image Segmentation

A crack segmentation model was trained using U-Net with EfficientNet-B7 as the backbone network to extract crack features. The labeled crack mask images served as the ground truth to train the model to distinguish between background pixels and crack pixels. A flowchart of image segmentation is shown in Figure 2.
The U-Net architecture consists of an encoder–decoder structure with skip connections in a U-shape. The encoder progressively compresses the spatial information of the input image through a series of convolutional and pooling operations, extracting high-level features. The decoder progressively restores the spatial resolution of the image through upsampling operations. Skip connections link feature maps from intermediate layers of the encoder with corresponding upsampled feature maps from the decoder, preventing information loss during the downsampling process. EfficientNet optimizes the network structure in multiple dimensions using a compound scaling method, resulting in a smaller model with higher efficiency and improved performance. Compared to other versions of EfficientNet, EfficientNet-B7 achieves higher accuracy and stronger feature representation capability.
After performing semantic segmentation of cracks, a binary image containing only crack information is generated. The Sigmoid function at the output layer maps each pixel value to either 0 or 1, representing ‘no crack’ or ‘crack present’, respectively. Since crack pixels occupy a small proportion of the entire image, Dice loss is used as the loss function to improve the segmentation accuracy of small objects [13]. Additionally, to enhance the handling of small objects and complex backgrounds, focal loss [14] is introduced. The total loss can be expressed as
L t o t a l = L D i c e + L F o c a l = 1 2 T P 2 T P + F P + F N 1 N i y i l o g y ^ i + 1 y i log 1 y ^ i
where TP represents true positive, and FP and FN represent false positive and false negative, respectively. y i is the target value at the i-th input, y ^ i is the predicted value at the i-th input, and N represents the number of labels.
After obtaining the binary crack image, the crack skeleton can be further extracted. Skeleton extraction methods are well established, with common algorithms including ZS algorithm [15], LW [16], WT [17], and deep learning-based skeleton extraction methods [18].

2.3. Load Evaluation Model Based on Crack Image

When the load level of a finite element model approaches the real load, the strain distribution exhibits a strong correlation with the actual crack distribution. Therefore, when the actual load is unknown, the load on the beam can be inferred by comparing the finite element strain distributions at different load levels with the crack distribution and identifying the best-matching strain pattern.

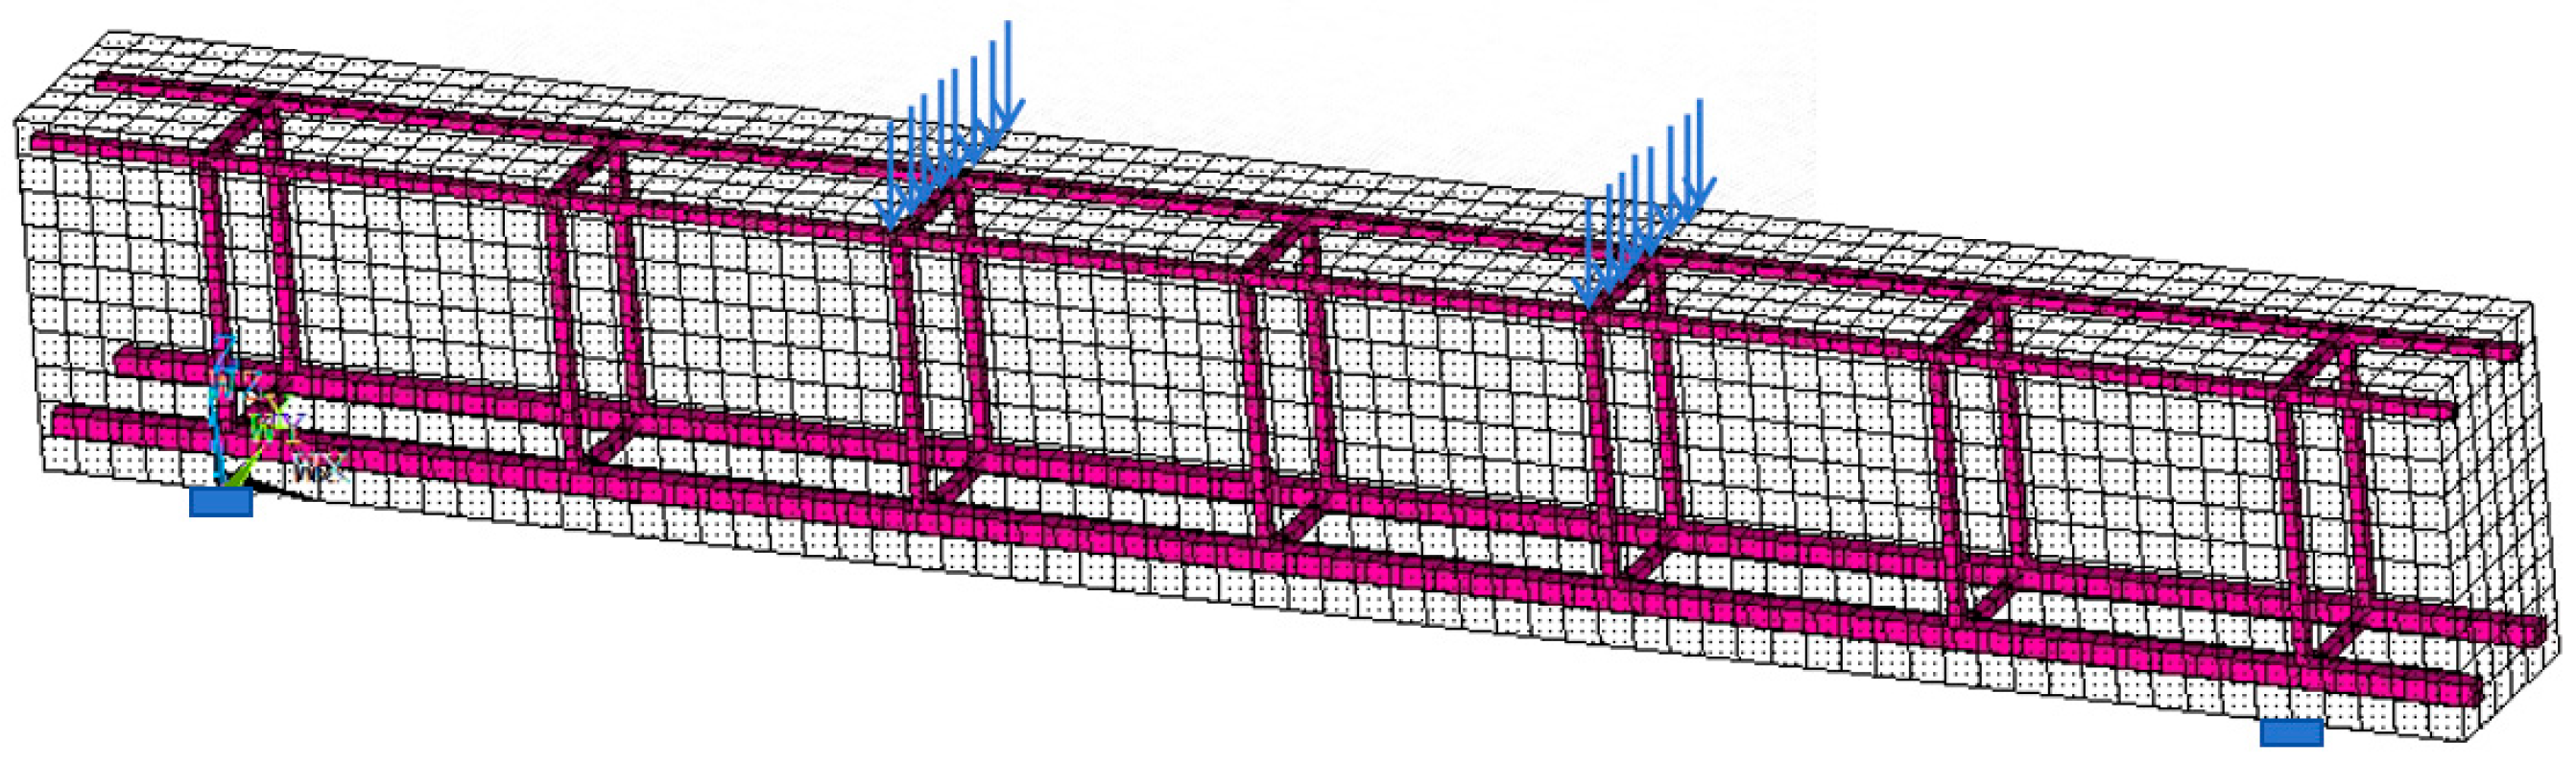
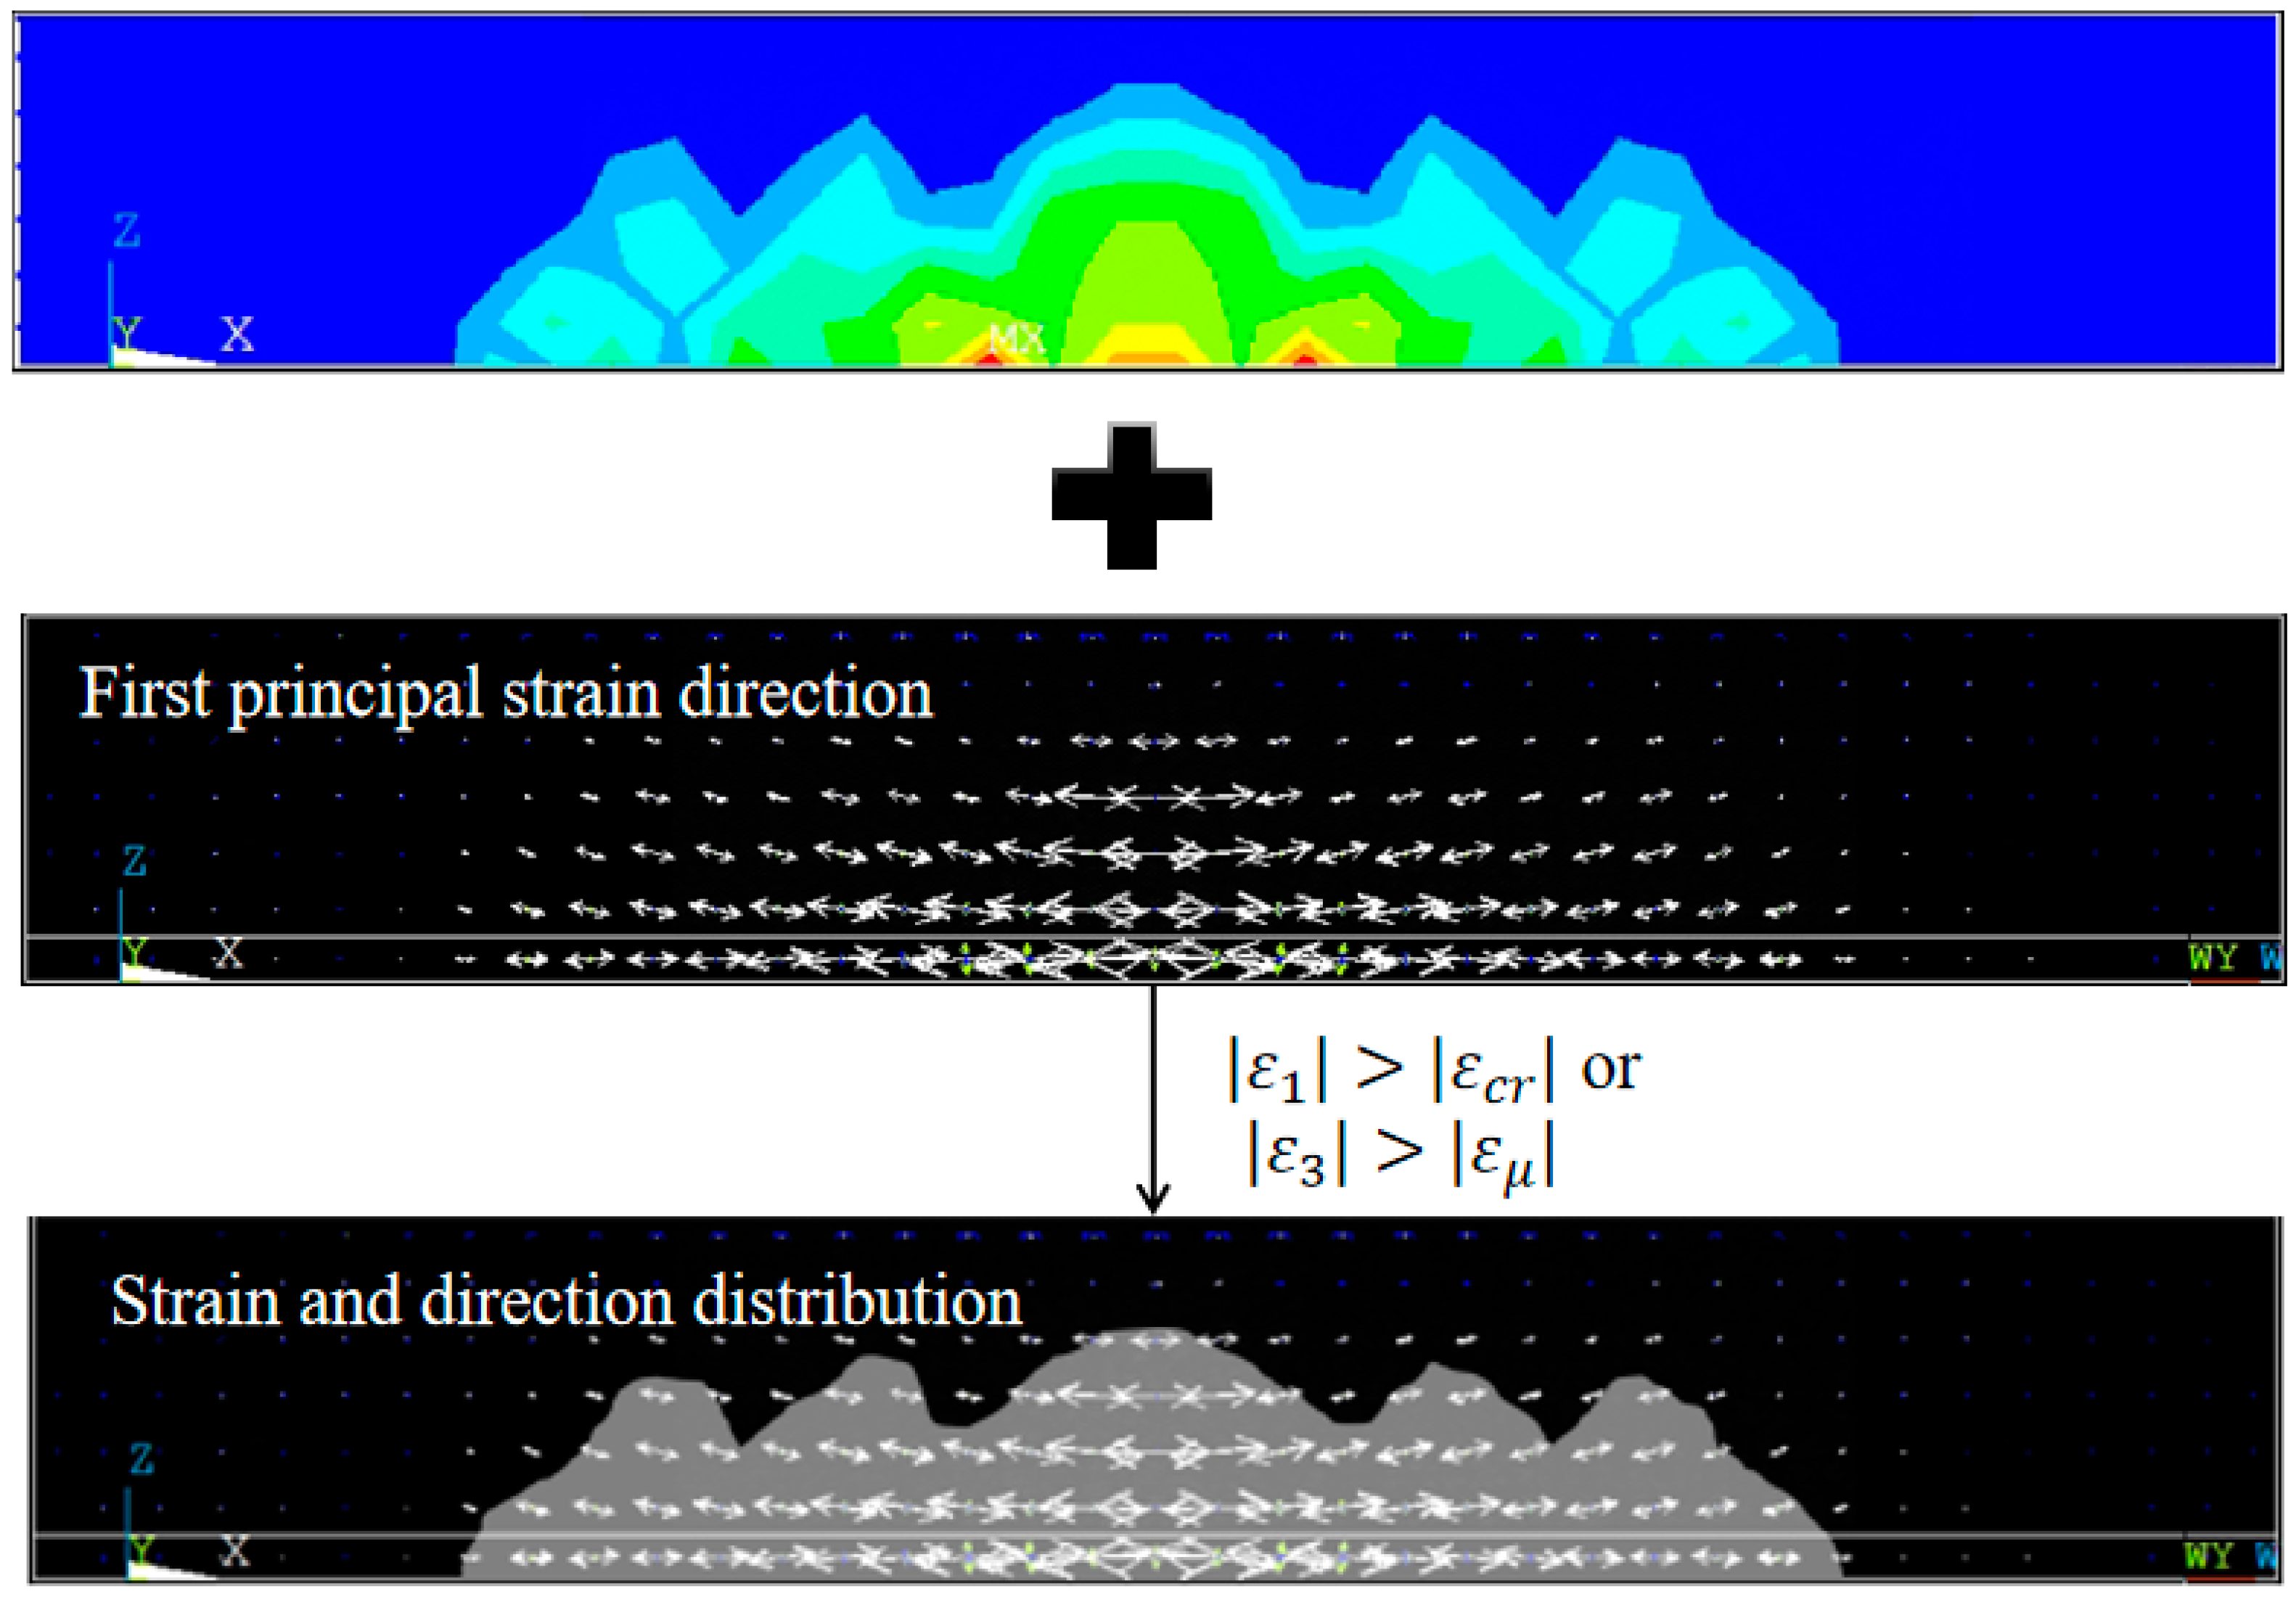
2.3.1. Finite Element-Based Structural Strain Distribution Calculation

The structural strain field of an RC beam under different load levels can be obtained through numerical simulation methods, such as finite element analysis.
A typical finite element model of an RC beam is shown in Figure 3. The white solid elements represent the concrete, the red rod elements represent the reinforcement, and the blue arrows indicate the application points of the loads. Using functions of the ultimate load from Concrete Structure Design Code GB 55008-2021 [19], finite element elastoplastic analysis is performed to obtain the stress and strain states at the surface nodes of the structure under different load levels.
According to strength theory, the location and direction of cracks are closely related to the magnitude and direction of the primary principal strain in the structure. To simplify the analysis, the strain field obtained from finite element analysis is further classified into high-strain and low-strain regions. Based on the concrete failure criteria, nodes within the high-strain region are classified according to the following standards: the first principal strain ε 1 exceeds the concrete’s ultimate tensile strain ε c r , or the third principal strain ε 3 exceeds the concrete’s ultimate compressive strain ε u . According to Concrete Structure Design Code GB 55008-2021 [19], the values of ε c r = 0.0001 and ε u = 0.0033 are used.
For ease of correlating the crack image with the strain calculation results, the structural surface strain field is converted to a strain field with physical positions consistent with the pixel locations in the crack image using linear interpolation. A binary image of the high-strain region, which includes the first principal strain direction information, is shown in Figure 4. In this image, the gray region represents the high-strain area, the black region represents the low-strain area, and the white arrows represent the first principal strain directions.

2.3.2. Image-Based Correlation Evaluation Model

The physical quantities represented by the crack distribution image and the strain distribution image obtained from finite element calculations are different and cannot be directly compared. However, the formation and propagation of cracks in an RC beam are closely related to the magnitudes and directions of strains. Therefore, establishing an accurate correlation model between these two types of information is crucial for predicting the load based on crack distribution.
According to strength theory, the magnitude of the first principal strain is an important indicator for determining whether cracks will form in a concrete structure. The probability of crack formation is highly positively correlated with the magnitude of the first principal strain at a given location. Furthermore, when simplifying the concrete material as an isotropic, homogeneous material, cracks typically propagate along a direction perpendicular to the first principal strain. Therefore, the correlation between the mechanical information distribution and the structural crack distribution will be quantified from two aspects: (1) the correlation between the position of crack points and the magnitude of the first principal strain, and (2) the correlation between the crack direction and the perpendicular direction of the first principal strain. Mathematical models are established for each of these two types of correlations.
To describe the correlation between the position of crack points and the magnitude of the first principal strain, the pixels in different strain regions are first classified. For crack point A and high-strain region B , non-crack points and low-strain regions are represented as A ¯ and B ¯ , respectively. Therefore, crack points located in the high-strain region can be represented as A B , while crack points in the low-strain region can be represented as A B ¯ , as shown in Figure 5. N a denotes the total number of pixels in the image, N h is the number of crack pixels in the high-strain region, and N l is the number of crack pixels in the low-strain region. N h a is the number of all pixels in the high-strain region, and N l a is the number of all pixels in the low-strain region. The correction factor β 1 = N h / N h a is defined as the proportion of the cracked area in the high-strain region relative to the total area. Similarly, β 2 = N l / N l a represents the proportion of the cracked area in the low-strain region.
Since this correlation model selects the maximum value of the correlation results, crack points located in the high-strain region, which align with the theoretical expectation, will have their impact improved. For crack points located in the low-strain region, where the theoretical and actual conditions differ, the influence of these points needs to be reduced. Therefore, the correlation index s ( i , j ) for different pixel points is expressed as shown in Equation (2).
s ( i , j ) = β 1 ,     ( x i , y j ) A B β 2 , x i , y j A B ¯
To measure the correlation between the crack direction and the perpendicular direction of the first principal strain, it is first necessary to calculate the crack inclination angle at each point along the crack skeleton. A square analysis window is defined for each crack point along the skeleton of the crack image, and in this study, the window size is 20 × 20 pixels. Then, the spatial coordinates of all the crack points within this square window are linearly fitted, and the inclination angle of the fitted line is taken as the inclination angle θ c i , j     0 , 180 ° at that crack point, where i and j represent the row and column of the crack point in the crack image, respectively, and θ f i , j   0 , 180 ° . Further, the first principal strain direction at that crack point is determined from the finite element calculation results, denoted as θ f i , j   0 , 180 ° . Thus, the absolute value of the minimum angle difference | θ i , j | between the crack inclination angle and the perpendicular direction of the first principal strain at each crack point can be expressed as
| θ i , j | = m i n ( θ c i , j   θ f i , j 90 ° , | 180 ° θ c i , j   + ( θ f i , j 90 ° ) | )
After considering both the magnitude and direction as the two key factors, the correlation index S between the actual crack distribution image and the structural strain distribution image is defined as
S = i = 1 m j = 1 n s i , j · ( c o s ( | θ i , j | ) ) N h + N l
where m and n represent the numbers of rows and columns of the pixel matrix, respectively.
To simplify the calculation and improve the efficiency of load identification, a finite-dimensional set of load levels I is considered in this paper:
I = F k = k P u / N , k = 1 , , N
where N is taken as 10 . In general, the predicted load differentiation of 0.1   P u can meet the requirements for preliminary diagnosis of engineering structures.
The maximum correlation load levels F k * can be indicated by the correlation index between strain distribution and crack distribution under different load levels:
F k * = arg m ax F k I S k
where S k is the correlation index between the strain distribution diagram and the crack distribution diagram under the k -th load level.

3. Experiment and Analysis
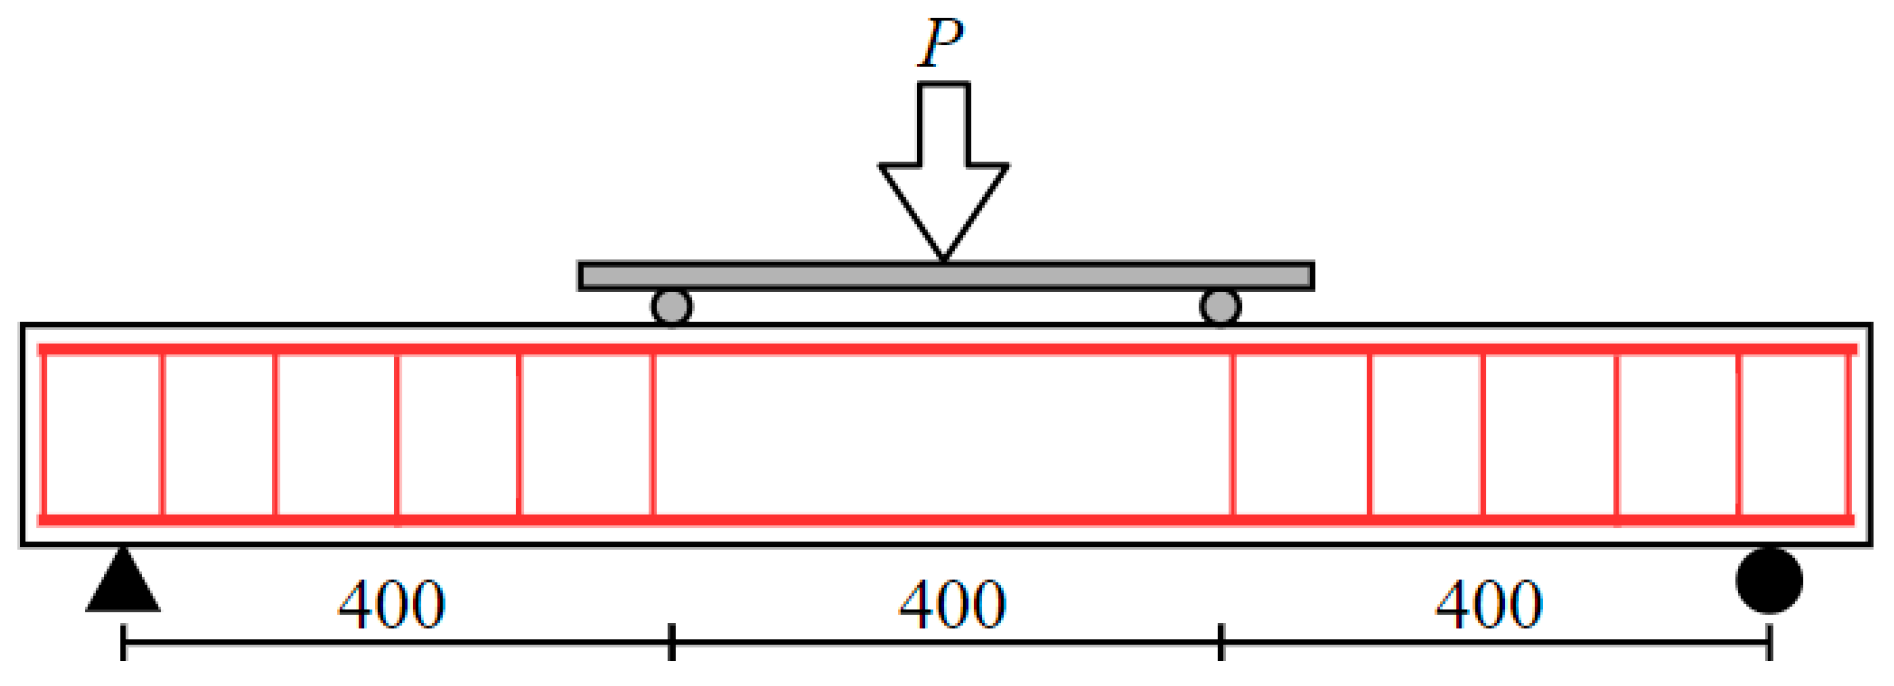
3.1. Data Sources

The data are derived from two sources: (1) destructive tests of six different RC beams reported in previously published research [20,21,22,23,24], which includes crack distribution characteristics under different load levels, material strengths, reinforcement ratios, and loading modes; and (2) simply supported beam four-point bending tests conducted in a mechanical laboratory. The literature and experimental data together constitute seven analysis cases, with two experiments conducted under three-point bending and five under four-point bending. In the seven selected analysis cases, experimental results under different load levels were recorded and used to construct 25 experimental conditions. The specific material and structural parameters of each experimental beam are shown in Table 1, including the cross-sectional width b , height h , total span l , reinforcement ratio ρ , concrete elastic modulus E c , steel elastic modulus E s , concrete compressive strength f c , steel yield strength f y , and ultimate load P u . Table 2 shows the reinforcement details for each RC beam.
The experimental data collected from different loading stages provide the basis for validating the load and image coupling method. Figure 6 illustrates the experimental setup for the four-point bending test beams. The structural dimensions and loading configuration of the test beams are shown in Figure 7. The surface damage information of the beams at different load levels was recorded by photographing the beams. Image segmentation and feature extraction methods were then used to generate crack maps. The crack skeleton distributions of the test beam at different load levels of 0.6   P u , 0.8   P u , and 1.0   P u are shown in Figure 8. When the load reached 0.6   P u , the test beam exhibited noticeable cracking. As the load increased, the number of cracks gradually increased, the length of the cracks extended outward, and the crack inclination angles gradually reflected the bending characteristics of the beam. The number of crack pixels in the crack distribution map also gradually increased. These continuously changing crack features provide important evaluation criteria for the load estimation.

3.2. Load Identification Results

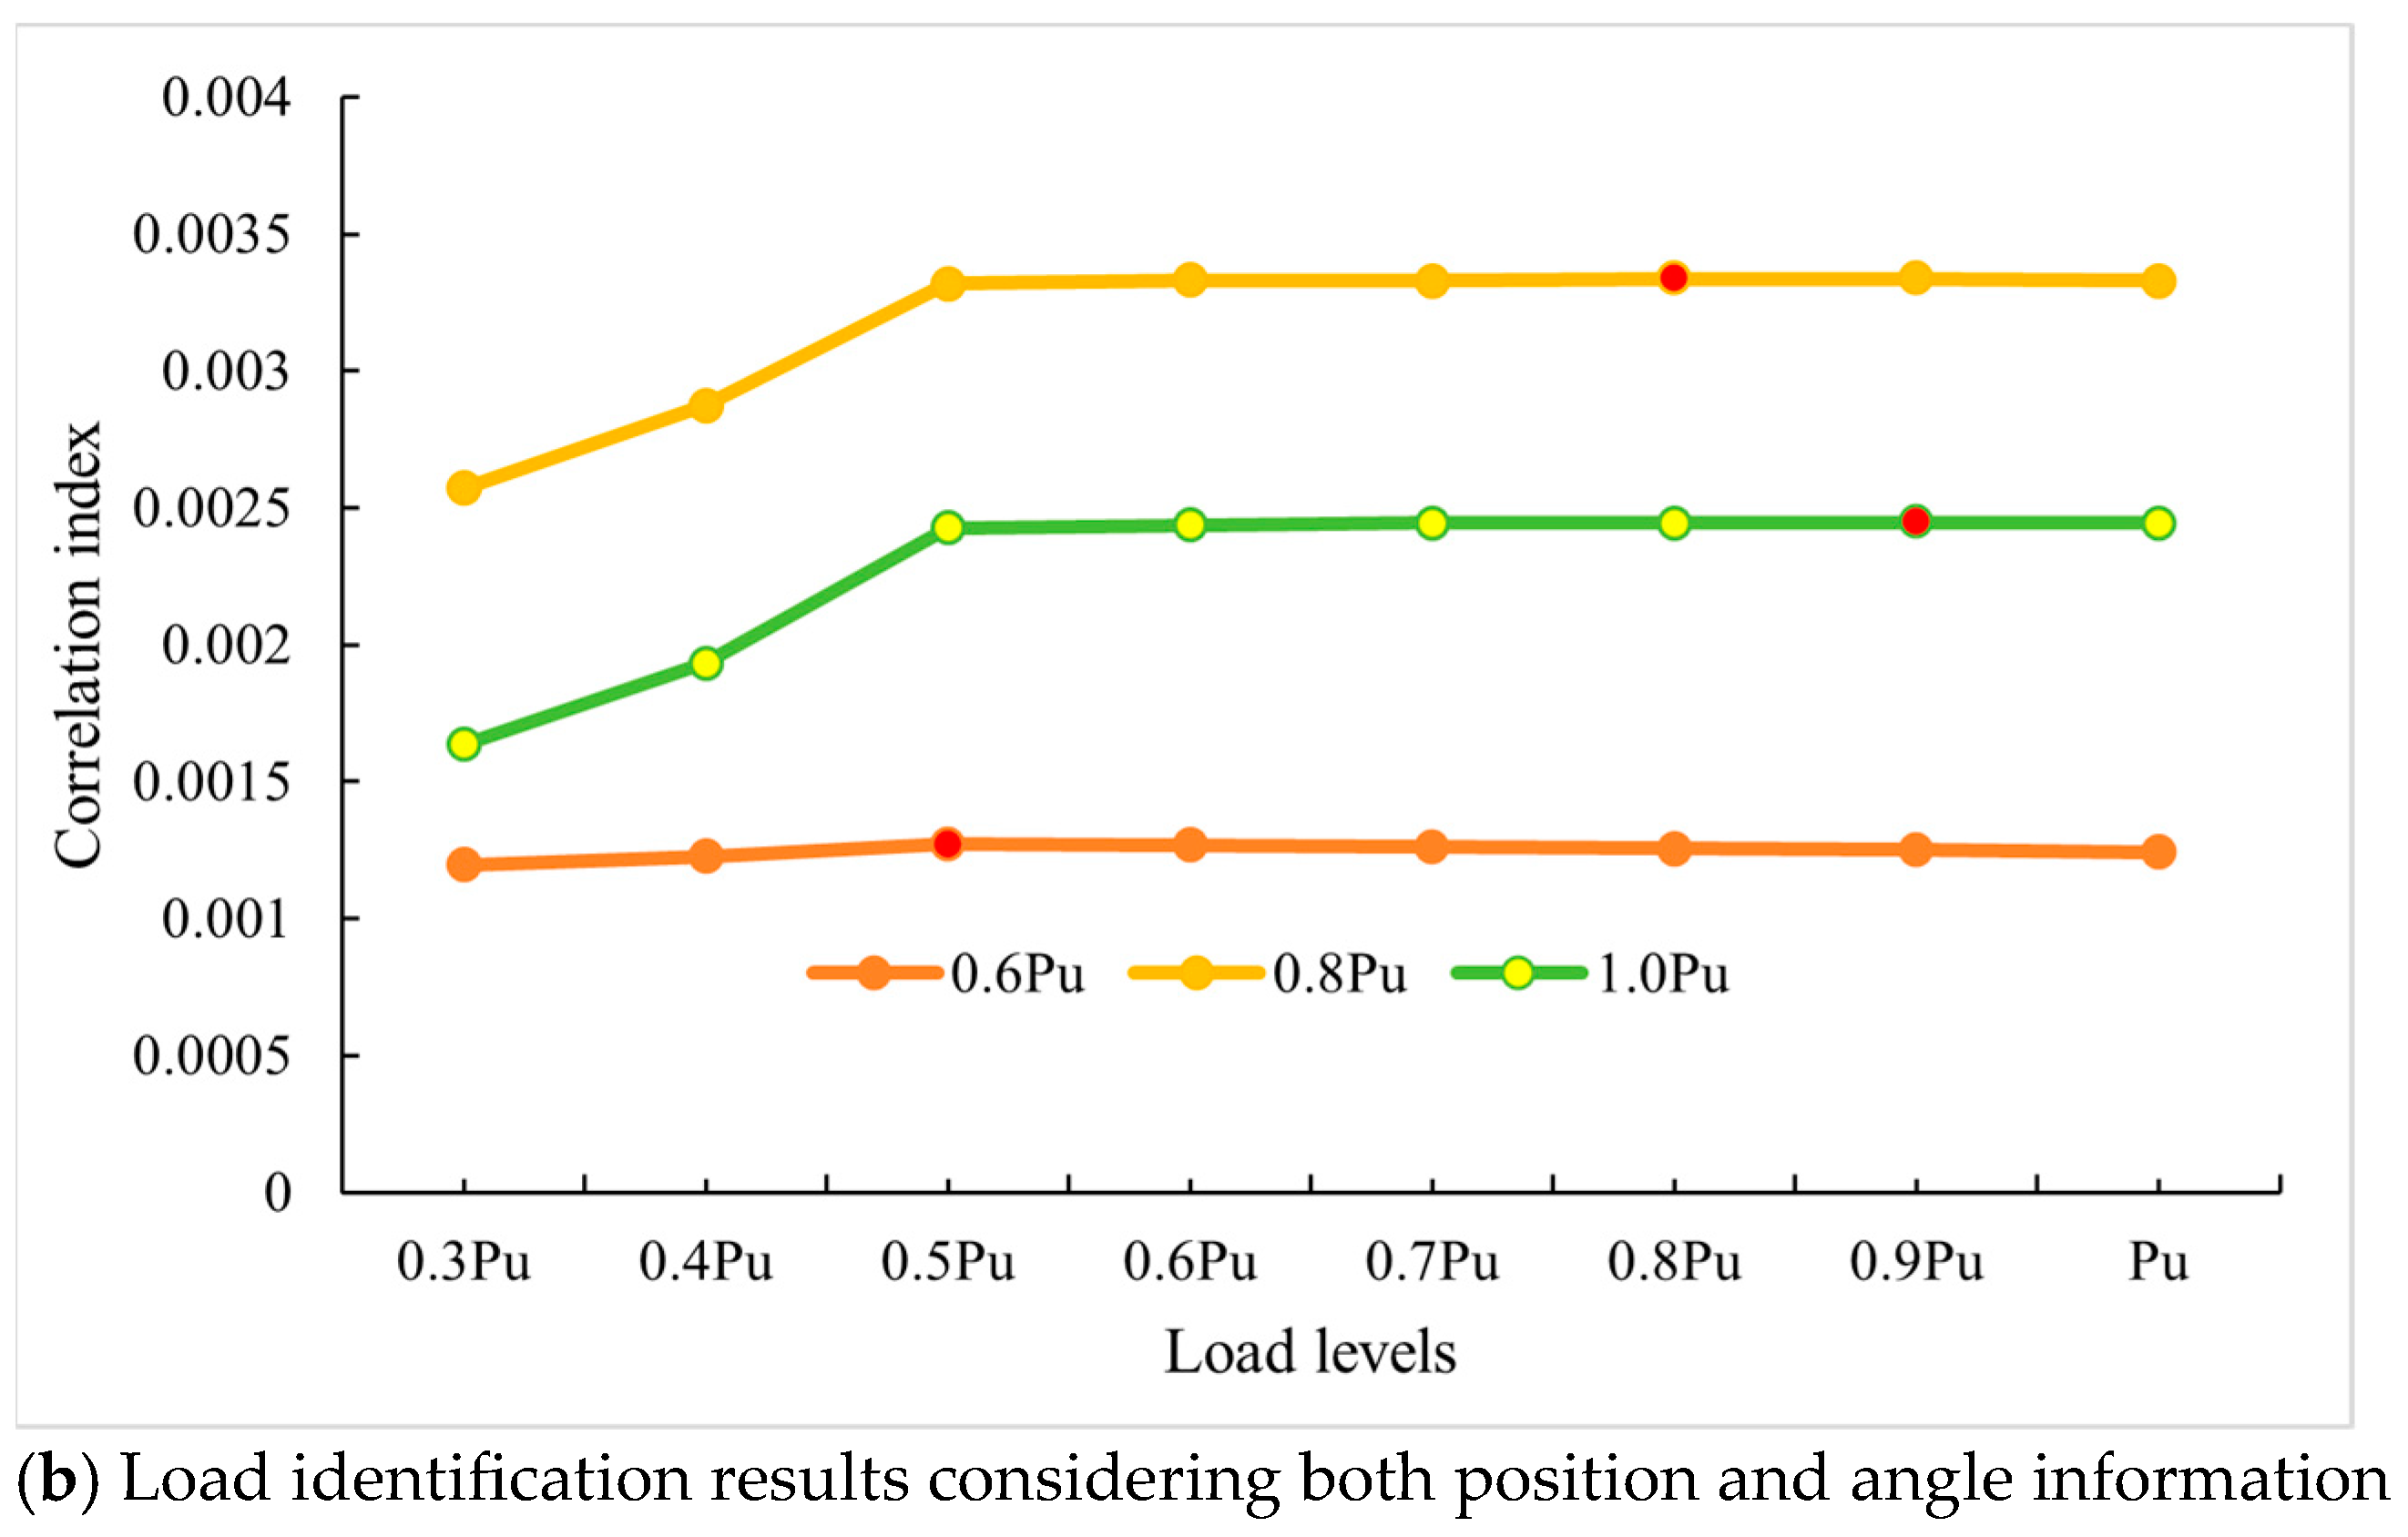
3.2.1. Analysis of the Impact of Positional and Angular Information on Load Identification Results

The crack height and angle from the crack information were both used as reference indicators for load assessment through the correlation model. To evaluate the significance of crack position and crack angle information, calculations were performed separately for two scenarios: considering only location information and comprehensively considering both location and angle information. The differences between these two approaches are compared to evaluate the impacts of angle on load assessment accuracy, as illustrated in Figure 9.
In Figure 9, the X-axis represents ten load levels in the finite element analysis, and the Y-axis represents the correlation coefficient results. The three curves represent the crack images under three different load cases. The crack images are matched with the ten finite element analysis results, and the load with the highest correlation coefficient is selected as the optimal load estimate for that image. The optimal load is marked with red dots in the figure.
When only positional information is considered, the load identification results for the crack map under different load levels are as follows: for 0.6   P u , the identified load is 0.5   P u ; for 0.8   P u , the identified load is 0.5   P u ; and for 1.0   P u , the identified load is 0.7   P u , with an average error of 28.05 % . When both positional and angular results are considered together, the load identification results for the crack map are as follows: for 0.6   P u , the identified load is 0.5   P u ; for 0.8   P u , the identified load is 0.8   P u ; and for 1.0   P u , the identified load is 0.9   P u , with an average error of 8.89 % . These results show that when both positional and angular results are considered together, the accuracy of load identification is significantly improved.

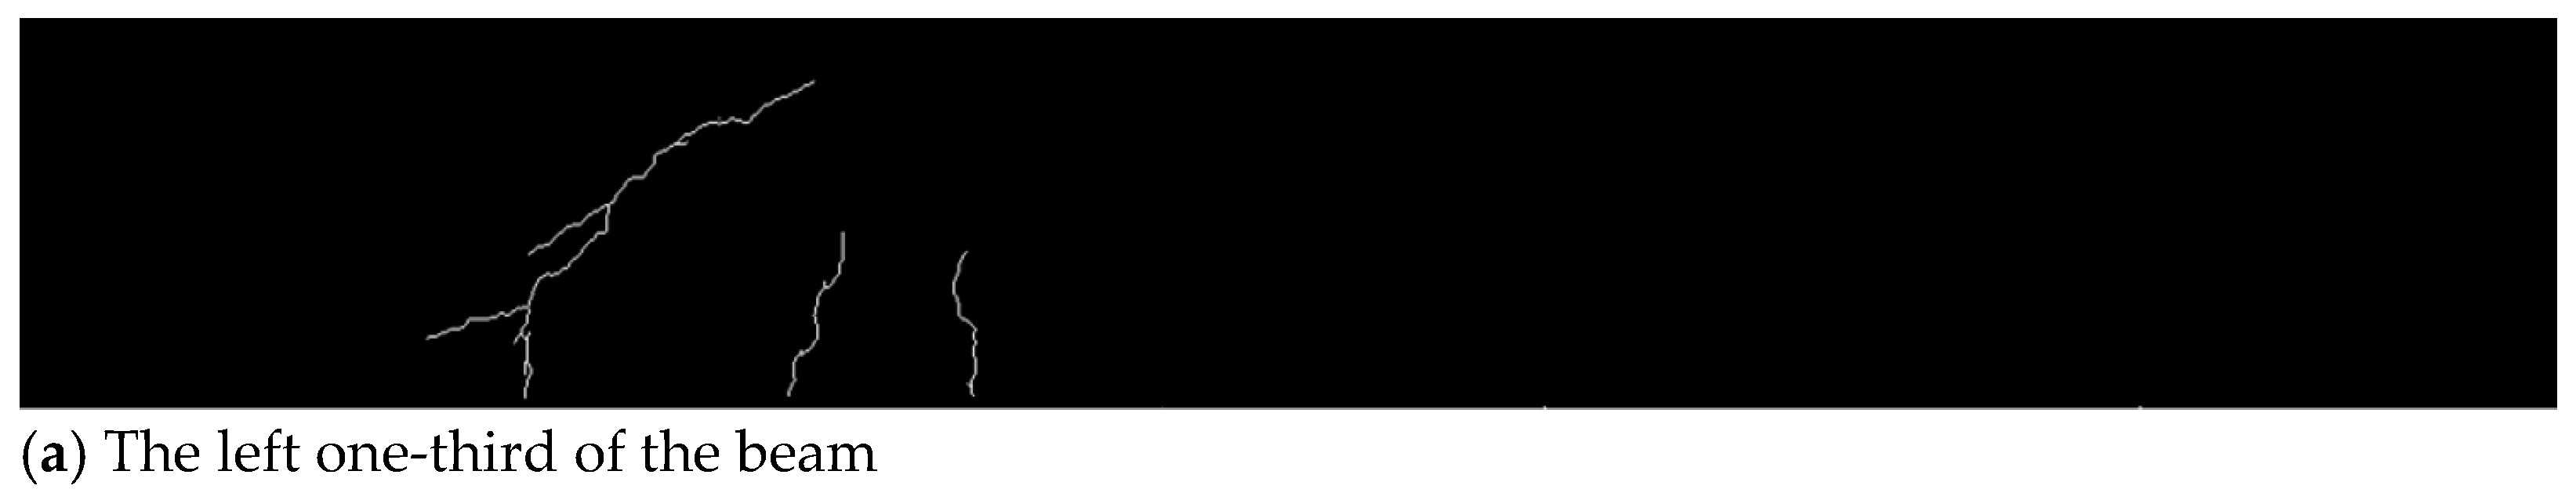
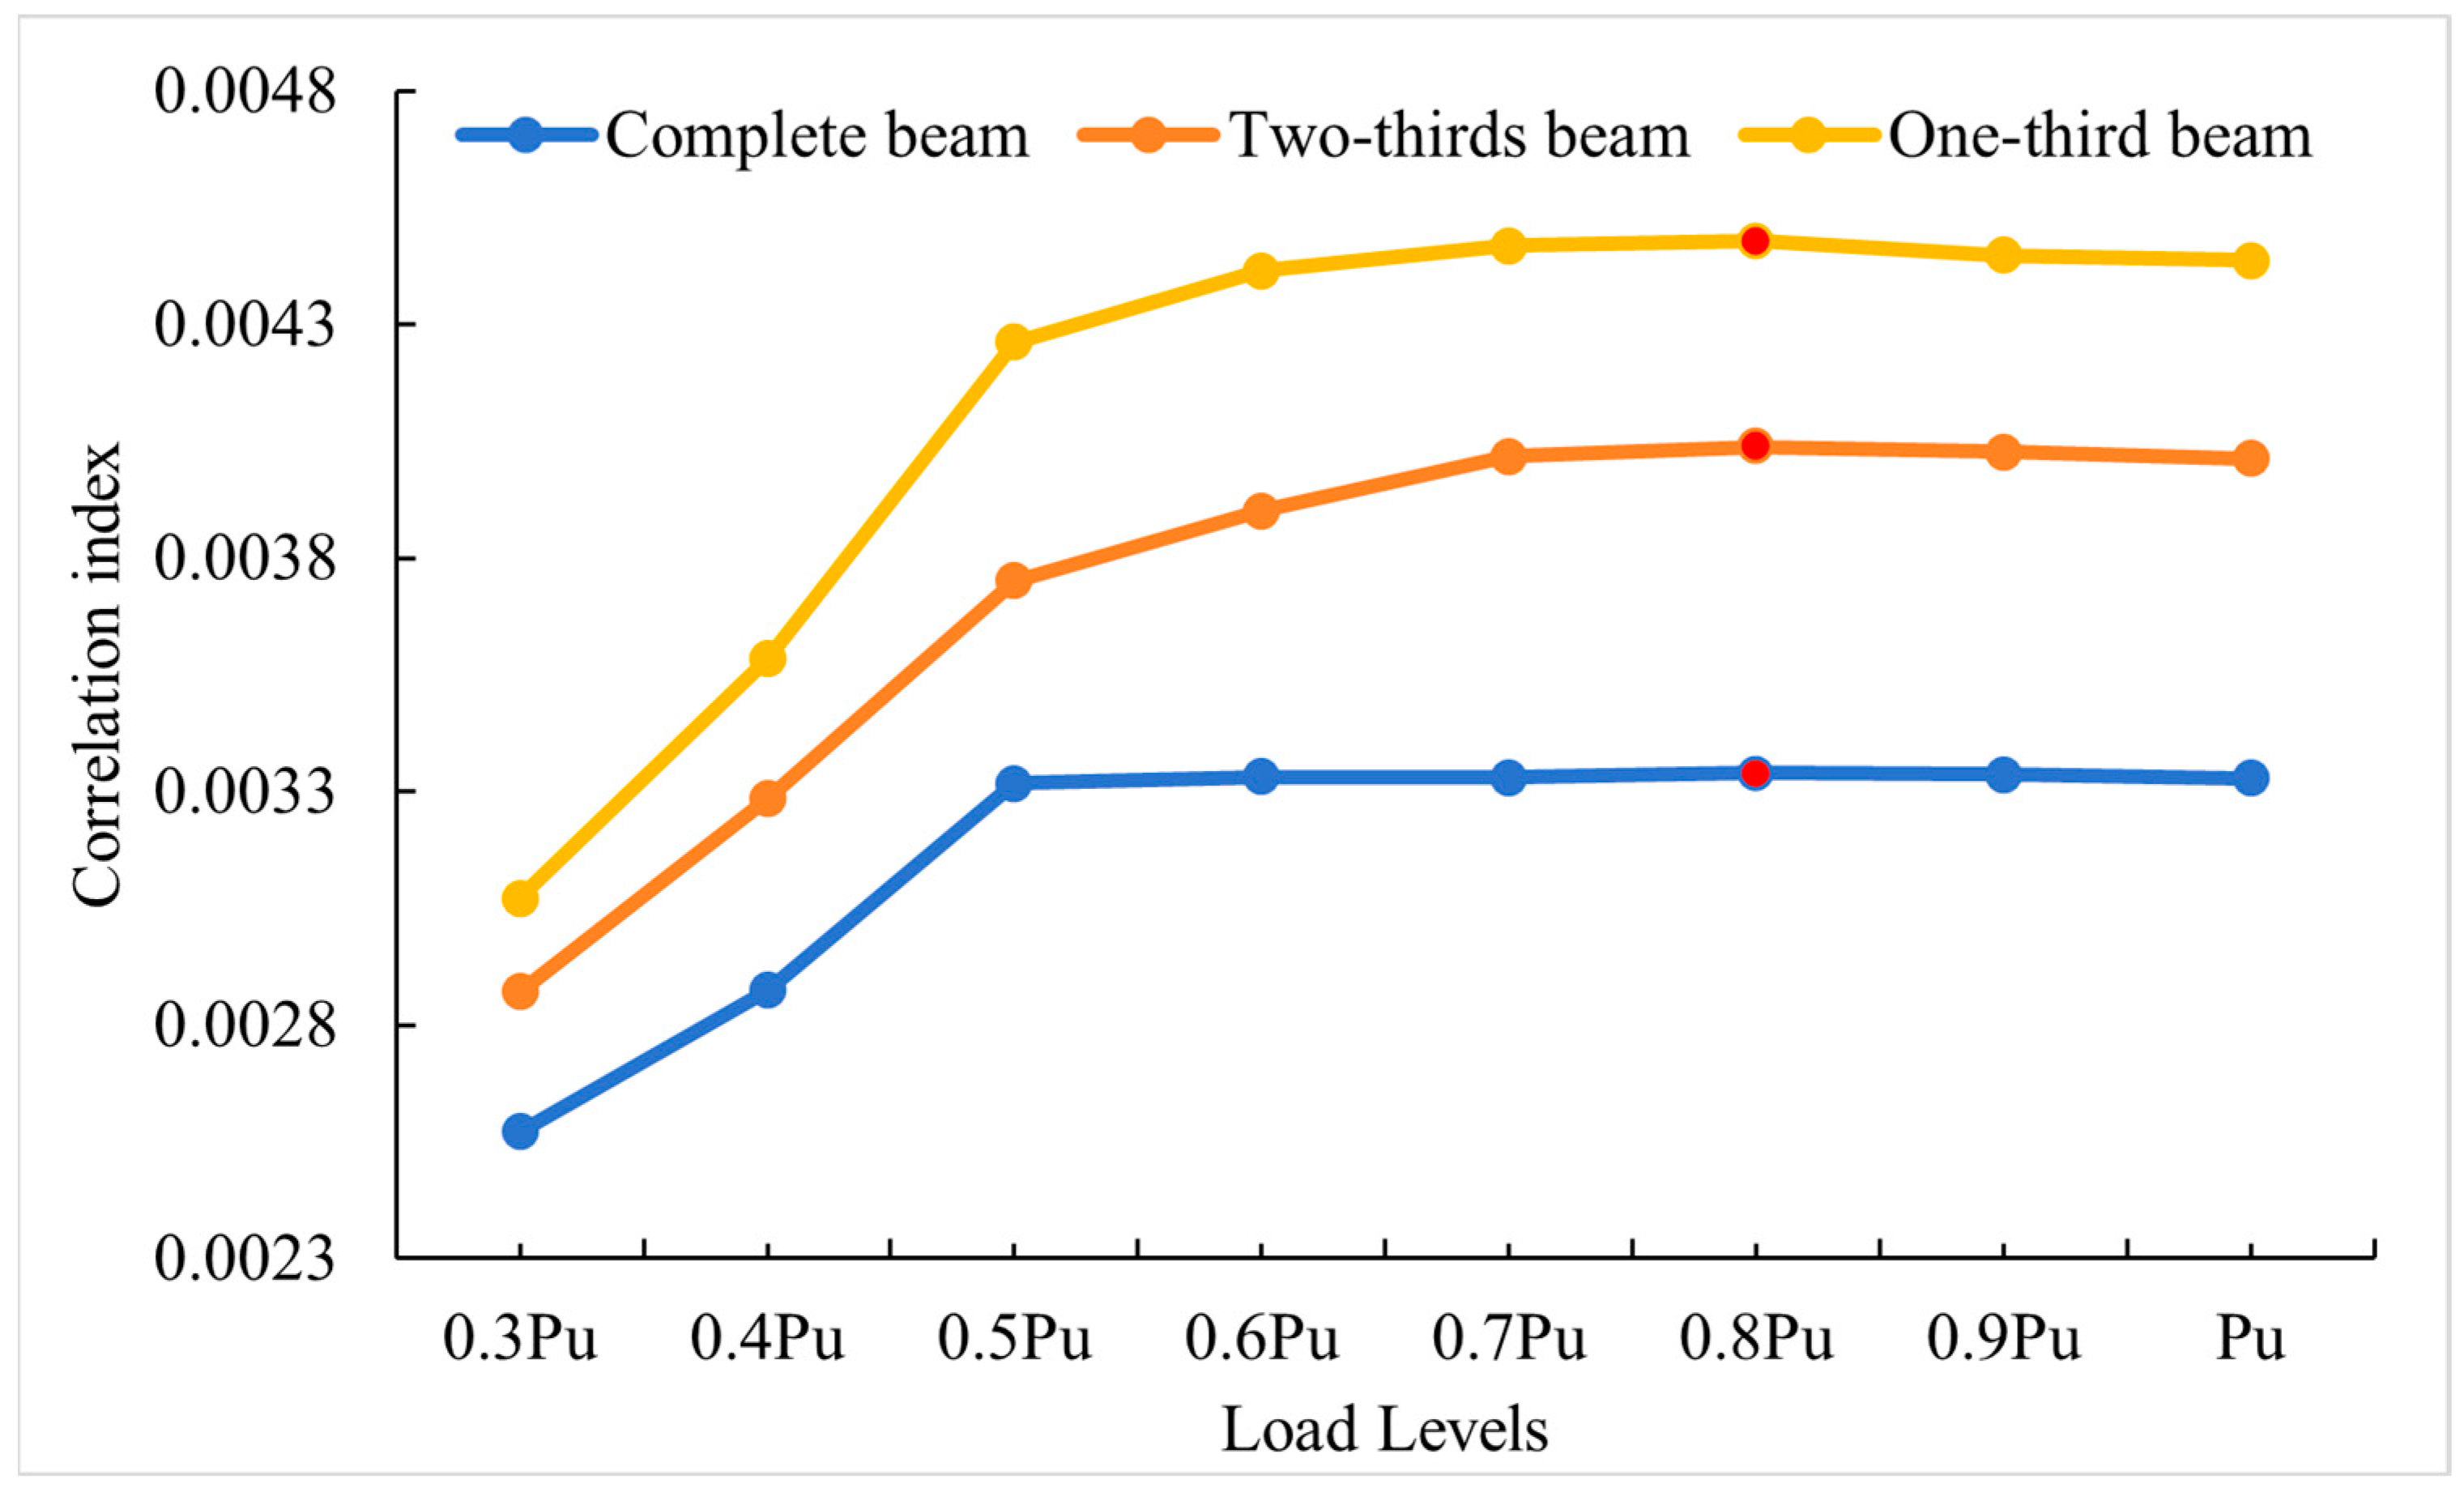
3.2.2. Analysis of the Impact of Incomplete Information on Load Identification Results

During the process of acquiring structural crack images, structural damage assessment is frequently incomplete due to factors such as occlusion or other observational constraints. To assess the impact of incomplete structural crack information on load identification results, the test beam from Figure 10 is taken as an example, showing a distribution diagram of cracks with varying levels of completeness in the test beam under 0.8   P u . The three levels of crack completeness are defined as follows: the left one-third of the beam, the left two-thirds of the beam, and the complete beam. Based on the correlation model, load identification is performed for all three cases.
The load identification results for the three different levels of completeness are shown in Figure 11. Through comparison, it can be observed that the correlation coefficient of complete crack image information is generally smaller than that of incomplete crack image information. This is because the better the completeness of the crack image, the more information the crack contains, and the accumulation of information errors leads to a larger average error. At the same time, since the correlation coefficient is negatively correlated with the average error, the trend of the above results can thus be obtained.
The results show that, based on crack image information at the three different levels of completeness, the final load estimation for all cases is 0.8   P u , which matches the actual load level. From this, it can be concluded that the proposed load identification method is highly robust to variations in the amount of crack information, and even one-third of the beam’s information is sufficient to meet the load identification requirements.

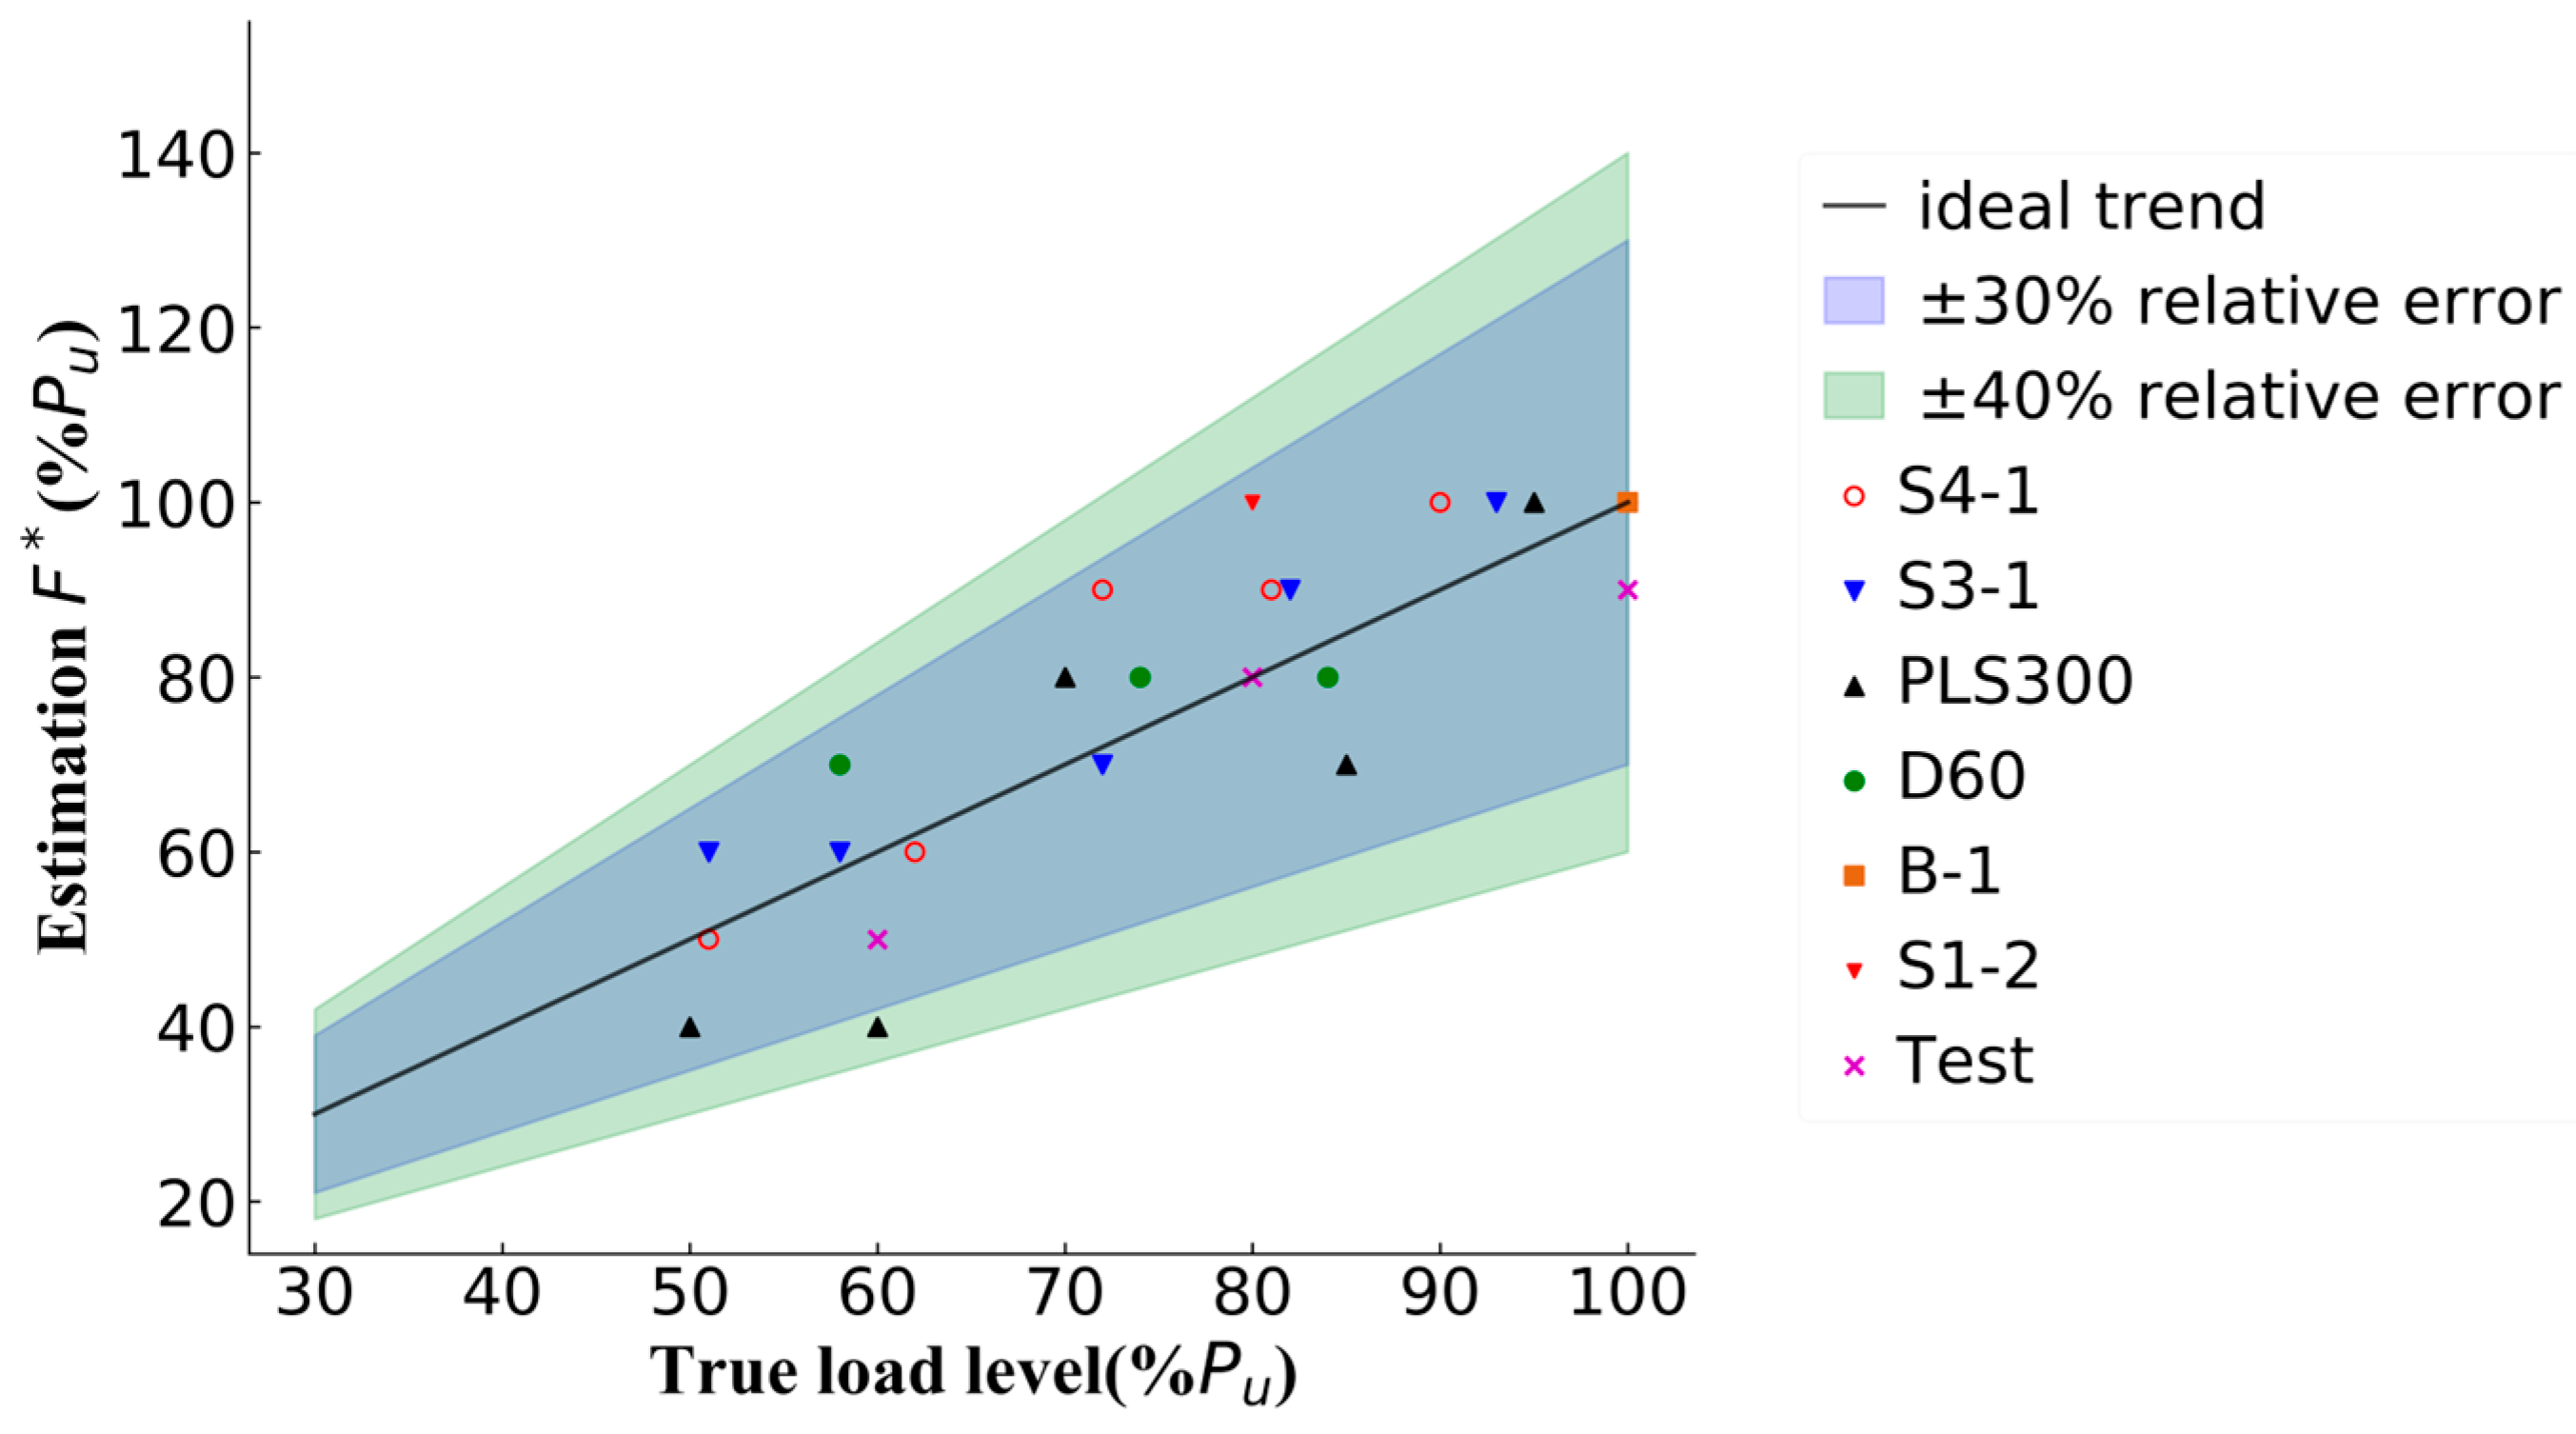
3.2.3. Load Identification Analysis of Crack Image Sample Set

In this section, a load identification analysis is conducted for the 25 cases in the sample set, and the calculation results are shown in Figure 12. It further presents the optimal load estimation results for seven different types of reinforced concrete beams under 25 different crack distributions. The estimation F for each beam is marked differently. Among the 25 final load estimates obtained with the proposed method, 24 results (96% of the total) have relative errors within 30%, and 14 of those have relative errors of less than 10%. Overall, the mean absolute percentage error (MAPE) for the 25 results compared to the true values is 10.98%. The calculation results indicate that the proposed method can achieve good predictive accuracy. Additionally, the method does not require specific experimental data for each structure. By fully utilizing numerical simulation techniques, this method can be applied to various reinforced concrete beams, demonstrating its excellent generalizability.
The load identification errors for the following cases are calculated as shown in Table 3.
Based on the error statistics from matching the crack locations and angles in the seven RC beam experiments with the magnitude and inclination of the first principal strain from the finite element analysis, the load magnitude was identified. The average error for the load estimation of the 25 different crack images was 10.98%. A comparison of the experimental results shows that the test outcomes can be accurately identified under both three-point bending and four-point bending loading modes. Additionally, as the load increases, the significant growth in crack information leads to more accurate identification results for larger loads compared to smaller loads.

3.3. Structural Damage Estimation

When concrete material exceeds the elastic stage and enters the plastic damage stage, the finite element method employs a damage factor d to describe the extent of damage. When the damage factor d = 0 , the material is in the elastic stage with no damage; when d = 1 , the material is completely destroyed. During the damage development stage, the damage factor d ranges between 0 and 1.
According to the energy principle, the formula for the damage factor is given as follows:
d = 1 σ E 0 ε
where σ is the stress; E 0 is the initial elastic modulus; and ε is the strain.
After performing load estimation on the structure, sufficient prior information is obtained. This provides a foundation for further analysis of the structural damage state. The damage factor is then used to assess the stiffness loss of the structure during the loading process.
Figure 13 presents a comparison of the crack distribution and damage factor in the experimental beam subjected to four-point bending. By comparing the crack distribution and damage factor distributions under three load cases in Figure 13, it is observed that the distribution of the damage factor shows a strong positive correlation with the crack distribution.
As the load increases, the damage factor and cracks develop simultaneously. At a load of 0.6   P u , the developments of cracks and damage factors in the pure bending section have essentially saturated. After that point, no significant increase is observed as the load continues to rise. However, in the bending–shear section, the damage factor continues to rise steadily until collapse occurs.

4. Conclusions

Structural damage assessment is a classic inverse problem, and load identification provides essential prior conditions for damage evaluation. Evaluating structural loads using image information is a feasible method. To accurately identify structural loads, this paper analyzes the load identification based on 25 different loading conditions of seven beams from the published literature. Based on the observations and discussions in the previous sections, the conclusions are drawn as follows:
  • Load evaluation and damage analysis based on surface crack images can achieve non-destructive, real-time, and efficient monitoring. By utilizing automated image processing techniques, manual intervention is reduced, improving detection accuracy and safety.
  • By comparing the location and angle information between the crack images and the finite element stress–strain field, a correlation model between the two is established. The load level corresponding to the maximum correlation coefficient is selected as the final identified load. The average error of load identification is only 10.98%, achieving the goal of rapid and quantitative load assessment.
  • The load obtained from the crack image provides sufficient prior conditions for assessing the structural damage state. Therefore, the structural damage state is evaluated using structural damage factors.
  • The load and damage identification method proposed in this paper exhibits strong generality and is not dependent on specific structural forms.
In future work, the impact of cracks caused by corrosion of the structure will be considered, and the crack width will also be considered to further optimize the identification method.

Author Contributions

Conceptualization, H.D. and C.Z.; methodology, C.Z.; software, Y.Z. and H.D.; validation, H.D., J.Y. and Y.Z.; investigation, H.D., J.Y. and Y.Z.; resources, C.Z.; data curation, H.D.; writing—original draft preparation, H.D.; writing—review and editing, H.D.; visualization, H.D. All authors have read and agreed to the published version of the manuscript.

Funding

This research work was supported by the National Natural Science Foundation of China (Grant No. 52268050).

Data Availability Statement

The original contributions presented in this study are included in the article. Further inquiries can be directed to the corresponding author.

Conflicts of Interest

The authors declare no conflicts of interest.

References

  1. He, K.; Gkioxari, G.; Dollar, P.; Girshick, R. Mask R-CNN. In Proceedings of the IEEE International Conference on Computer Vision, Venice, Italy, 22–29 October 2017; pp. 2961–2969. [Google Scholar]
  2. Chen, L.-C.; Papandreou, G.; Schroff, F.; Adam, H. Rethinking atrous convolution for semantic image segmentation. In Proceedings of the Computer Science—Computer Vision and Pattern Recognition, Honolulu, HI, USA, 21–26 July 2017. [Google Scholar] [CrossRef]
  3. Liu, D.; Cui, Y.; Tan, W.; Chen, Y. SG-Net: Spatial granularity network for one-stage video instance segmentation. In Proceedings of the IEEE/CVF Conference on Computer Vision and Pattern Recognition, Nashville, TN, USA, 20–25 June 2021; pp. 9816–9825. [Google Scholar]
  4. Ronneberger, O.; Fischer, P.; Brox, T. U-Net: Convolutional networks for biomedical image segmentation. In Proceedings of the Medical Image Computing and Computer-Assisted Intervention—MICCAI, Munich, Germany, 5–9 October 2015; pp. 234–241. [Google Scholar]
  5. Davoudi, R.; Miller, G.R.; Kutz, J.N. Structural load estimation using machine vision and surface crack patterns for shear-critical RC beams and slabs. J. Comput. Civ. Eng. 2018, 32, 04018024. [Google Scholar] [CrossRef]
  6. Zhang, W.-X.; Liu, X.-L.; Luo, B.; Li, M.-G. Quick assessment of loading capacity of bridge by cracking characteristics. J. Northeast. Univ. (Nat. Sci.) 2008, 29, 1346. [Google Scholar]
  7. Li, K.; Cao, G.; Yang, L. Experimental study on assessment of mechanical performance of prestressed concrete continuous box girder under different cracking conditions. J. Cent. South Univ. (Sci. Technol.) 2020, 51, 3475–3483. [Google Scholar]
  8. Xu, G.; Yue, Q.; Liu, X. Identification of historical maximum load on concrete beams based on crack and deformation response using knowledge-embedded machine learning algorithms. Eng. Struct. 2024, 314, 118376. [Google Scholar] [CrossRef]
  9. Davoudi, R. A Machine Learning and Computer Vision Framework for Damage Characterization and Structural Behavior Prediction. Ph.D. Thesis, University of Washington, Seattle, WA, USA, 2019. [Google Scholar]
  10. Davoudi, R.; Miller, G.R.; Calvi, P.; Kutz, J.N. Computer vision–based damage and stress state estimation for reinforced concrete and steel fiber–reinforced concrete panels. Struct. Health Monit. 2020, 19, 1645–1665. [Google Scholar] [CrossRef]
  11. Davoudi, R.; Miller, G.R.; Kutz, J.N. Data-driven vision-based inspection for reinforced concrete beams and slabs: Quantitative damage and load estimation. Autom. Constr. 2018, 96, 292–309. [Google Scholar] [CrossRef]
  12. Zhang, C.; Zhao, Y.J.; Wu, G.Y.; Wu, H.; Ding, H.; Yu, J.; Wan, R. A Correlation analysis-based structural load estimation method for RC beams using machine vision and numerical simulation. Buildings 2024, 15, 207. [Google Scholar] [CrossRef]
  13. Salehi, S.S.M.; Erdogmus, D.; Gholipour, A. Tversky loss function for image segmentation using 3D fully convolutional deep networks. In Proceedings of the Computer Science—Computer Vision and Pattern Recognition, Honolulu, HI, USA, 21–26 July 2017; pp. 379–387. [Google Scholar]
  14. Lin, T.-Y.; Goyal, P.; Girshick, R.; He, K.; Dollar, P. Focal loss for dense object detection. In Proceedings of the IEEE International Conference on Computer Vision, Venice, Italy, 22–29 October 2017; pp. 2980–2988. [Google Scholar]
  15. Zhang, T.Y.; Suen, C.Y. A fast parallel algorithm for thinning digital patterns. Commun. ACM 1984, 27, 236–239. [Google Scholar] [CrossRef]
  16. Lü, H.E.; Wang, P.S.P. A comment on “a fast parallel algorithm for thinning digital patterns”. Commun. ACM 1986, 29, 239–242. [Google Scholar] [CrossRef]
  17. Wu, R.-Y.; Tsai, W.-H. A new one-pass parallel thinning algorithm for binary images. Pattern Recognit. Lett. 1992, 13, 715–723. [Google Scholar] [CrossRef]
  18. Nguyen, N.H. U-net based skeletonization and bag of tricks. In Proceedings of the IEEE/CVF International Conference on Computer Vision, Montreal, QC, Canada, 10–17 October 2021; pp. 2105–2109. [Google Scholar]
  19. GB 55008-2021; General Code for Concrete Structures. Ministry of Housing and Urban Rural Development of the People’s Republic of China: Beijing, China, 2021.
  20. Gribniak, V.; Pérez Caldentey, A.; Kaklauskas, G.; Rimkus, A.; Sokolov, A. Effect of arrangement of tensile reinforcement on flexural stiffness and cracking. Eng. Struct. 2016, 124, 418–428. [Google Scholar] [CrossRef]
  21. Korol, E.; Tejchman, J.; Mróz, Z. Experimental and numerical assessment of size effect in geometrically similar slender concrete beams with basalt reinforcement. Eng. Struct. 2017, 141, 272–291. [Google Scholar] [CrossRef]
  22. Yan, W. Impact Factors Analysis on the Crack Width of Reinforced Concrete Beams. Master’s Thesis, Chongqing Jiaotong University, Chongqing, China, 2010. [Google Scholar]
  23. Yang, C. Research on Crack Width of Concrete Beam Reinforced with 600 MPa Steel Bars. Master’s Thesis, Hebei University of Technology, Tianjin, China, 2017. [Google Scholar]
  24. Quach, P.T. Understanding and Safely Predicting the Shear Response of Large-Scale Reinforced Concrete Structures. Master’s Thesis, University of Toronto, Toronto, ON, Canada, 2016. [Google Scholar]
Figure 1. Technical roadmaps of image-based load estimation.
Buildings 15 00922 g001
Figure 2. Flowchart of image segmentation.
Buildings 15 00922 g002
Figure 3. The finite element model of the RC beam.
Buildings 15 00922 g003
Figure 4. Strain and direction distribution information diagram obtained by finite element analysis.
Buildings 15 00922 g004
Figure 5. Coordinate mapping process.
Buildings 15 00922 g005
Figure 6. Test setup.
Buildings 15 00922 g006
Figure 7. Loading pattern for the test beam.
Buildings 15 00922 g007
Figure 8. Crack distribution diagrams of the test beam under three load levels.
Buildings 15 00922 g008
Figure 9. Comparison of load identification results with and without angle information for the teat beam.
Buildings 15 00922 g009aBuildings 15 00922 g009b
Figure 10. Distribution diagram of cracks with varying levels of completeness in the test beam under a load of 0.8   P u .
Buildings 15 00922 g010aBuildings 15 00922 g010b
Figure 11. Comparison of load identification results under different test beam completeness levels.
Buildings 15 00922 g011
Figure 12. Optimal load estimations of seven beams under different real load levels.
Buildings 15 00922 g012
Figure 13. Damage factor distributions of the test beam under different load levels.
Buildings 15 00922 g013
Table 1. Information of individual simply supported beam conditions.
Beam NumberRecorded Load l
(mm)
b
(mm)
h
(mm)
ρ
(%)
f c
(MPa)
E c
(GPa)
E s
(GPa)
f y
(MPa)
P u
(kN)
Test 0.6   P u 14001202001.2811.92820036078.37
0.8   P u
1.0   P u
S1-2 [20] 0.8   P u 32802843001.049.433.03210.5632.3224
B-1 [23] 1.0   P u 35002004000.743.827.84200712.58226
S3-1 [22] 0.50   P u 20001502501.0634.231.6420052582.94
0.57   P u
0.71   P u
0.80   P u
0.91   P u
S4-1 [22] 0.51   P u 20001502501.4134.231.64200525111.4
0.62   P u
0.72   P u
0.81   P u
0.9   P u
D60 [21] 0.5   P u 42002506640.745550501100169.6
0.6   P u
0.7   P u
0.85   P u
0.95   P u
PLS300 [24] 0.58   P u 18001753000.6544.836.3185457.795
0.74   P u
0.84   P u
0.95   P u
1.0   P u
Table 2. Cross-sectional reinforcement arrangements of bending beam specimens.
TestS1-2B1Beam S3-1Beam S4-1PLS300D60
Buildings 15 00922 i001Buildings 15 00922 i002Buildings 15 00922 i003Buildings 15 00922 i004Buildings 15 00922 i005Buildings 15 00922 i006Buildings 15 00922 i007
Table 3. The maximum–minimum errors of the load identifications.
Beam NumbersMax Error (%)Min Error (%)
Test16.670
S1-2 [19]2525
B-1 [22]00
S3-1 [21]17.652.78
S4-1 [21]251.96
D60 [20]20.690
PLS300 [23]33.335.26
Disclaimer/Publisher’s Note: The statements, opinions and data contained in all publications are solely those of the individual author(s) and contributor(s) and not of MDPI and/or the editor(s). MDPI and/or the editor(s) disclaim responsibility for any injury to people or property resulting from any ideas, methods, instructions or products referred to in the content.

