
Comparison of Influencing Factors on Safety Behavior and Perception Between Contractor Managers and Subcontractor Workers at Korean Construction Sites


Abstract
:1. Introduction
2. Accident Statistics and Literature Review
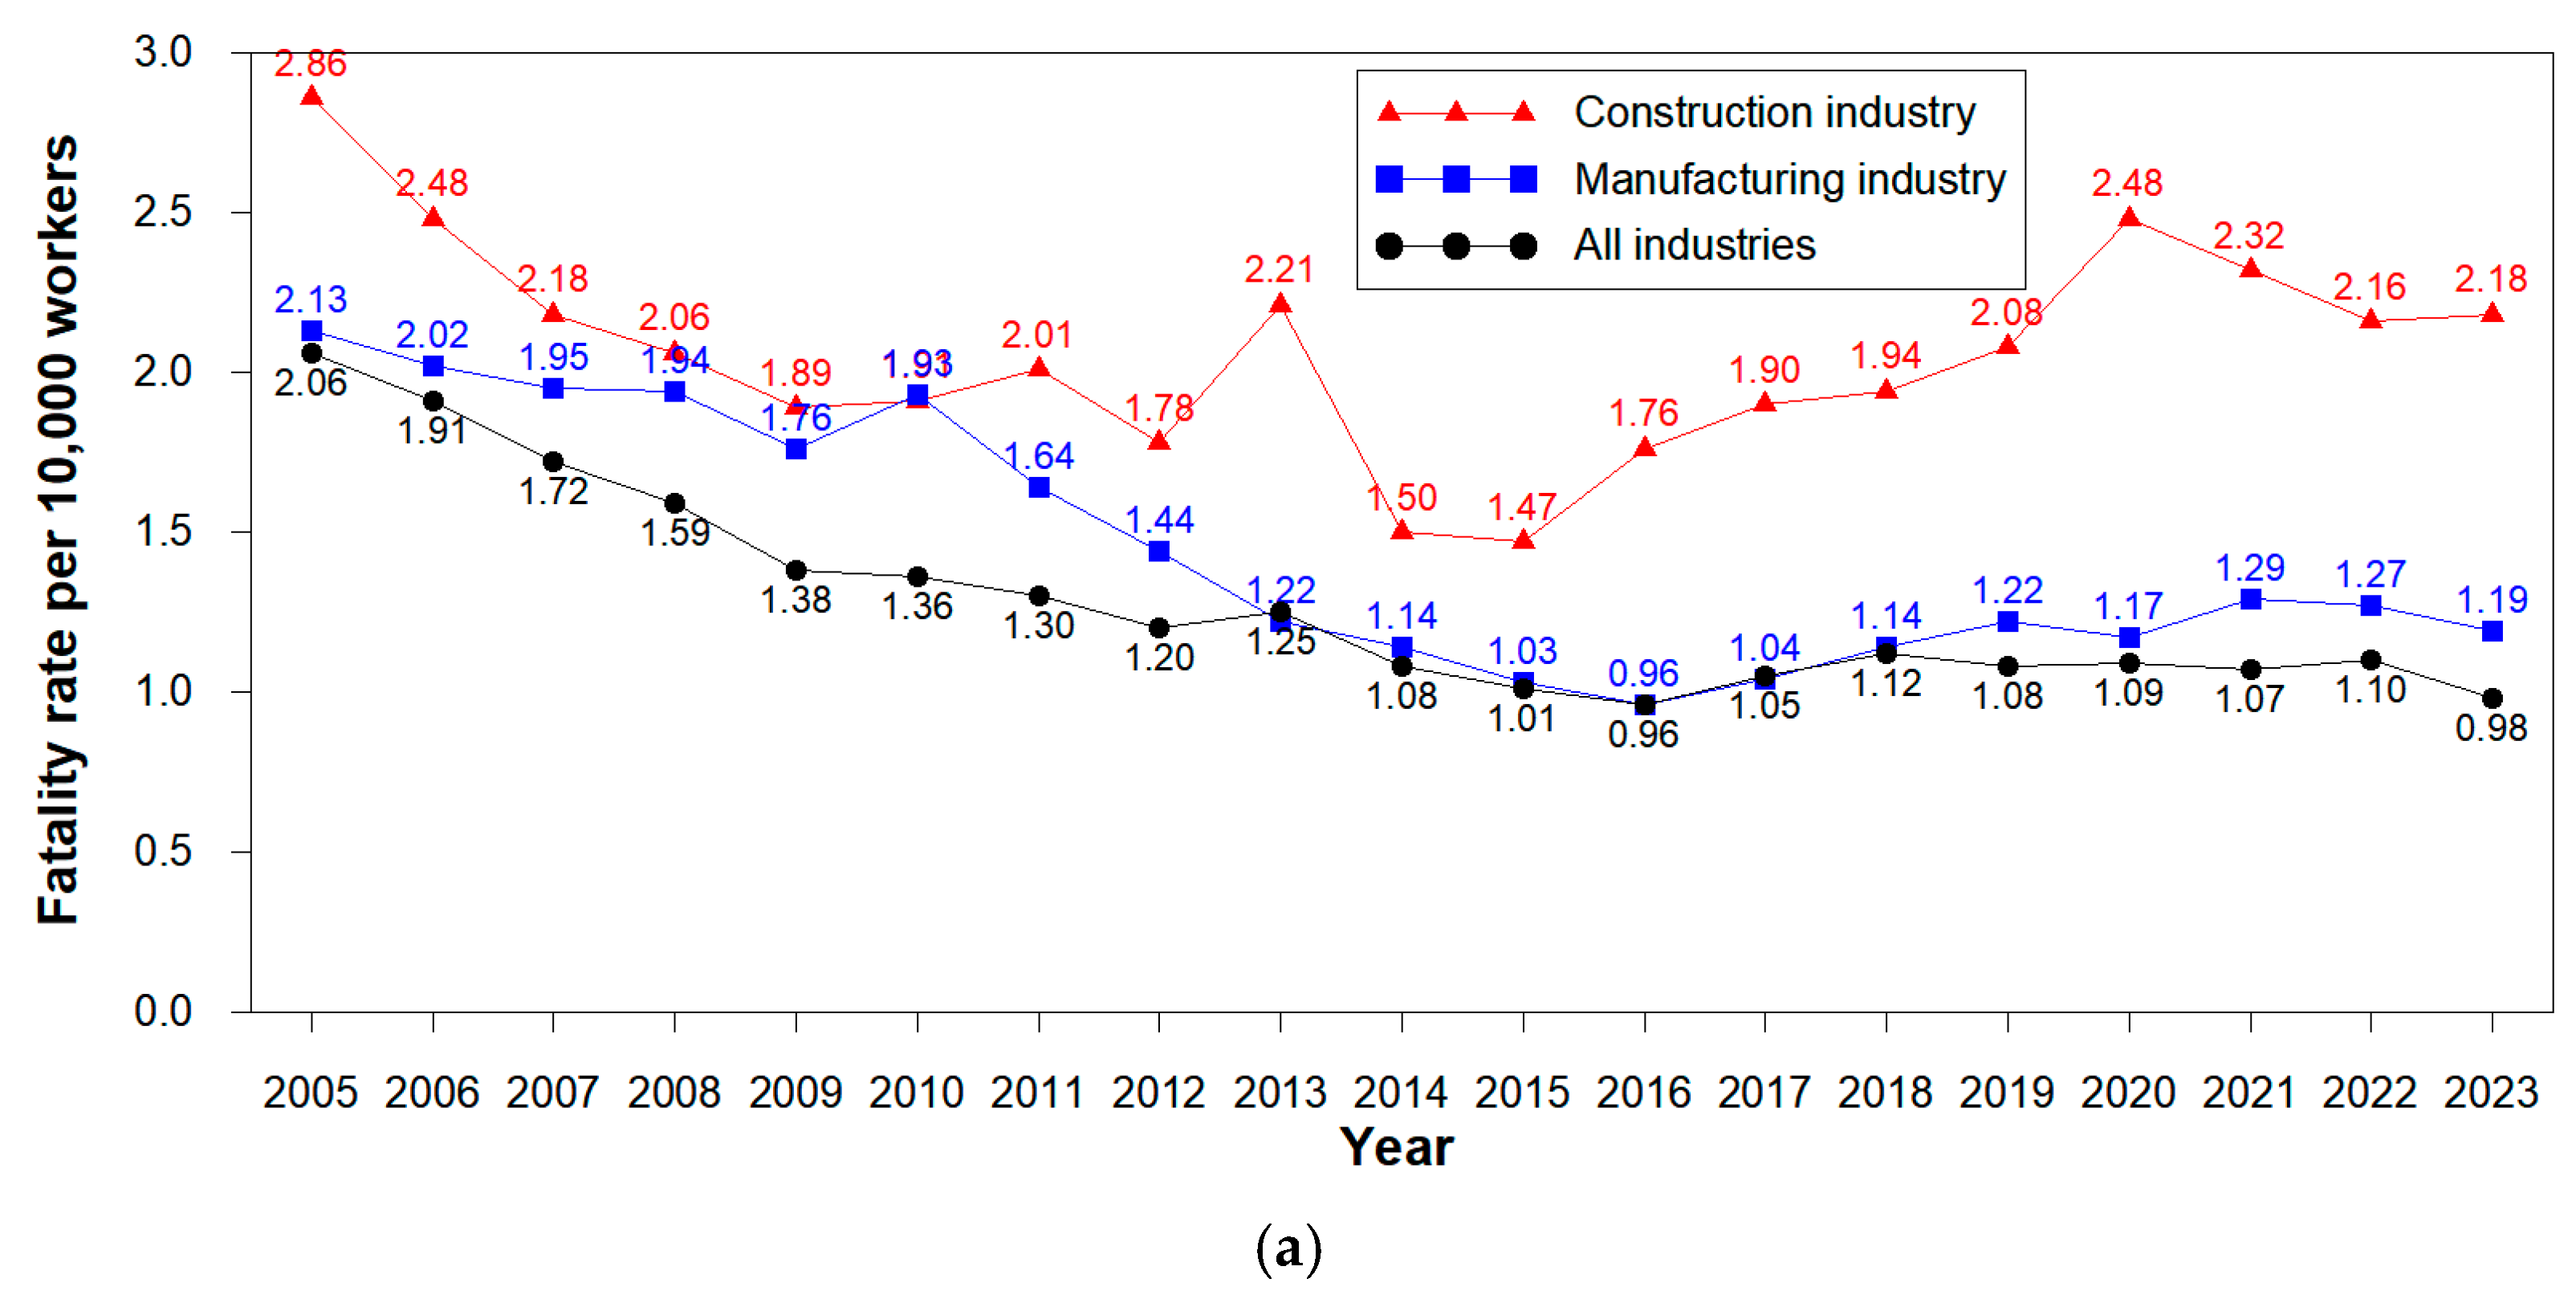
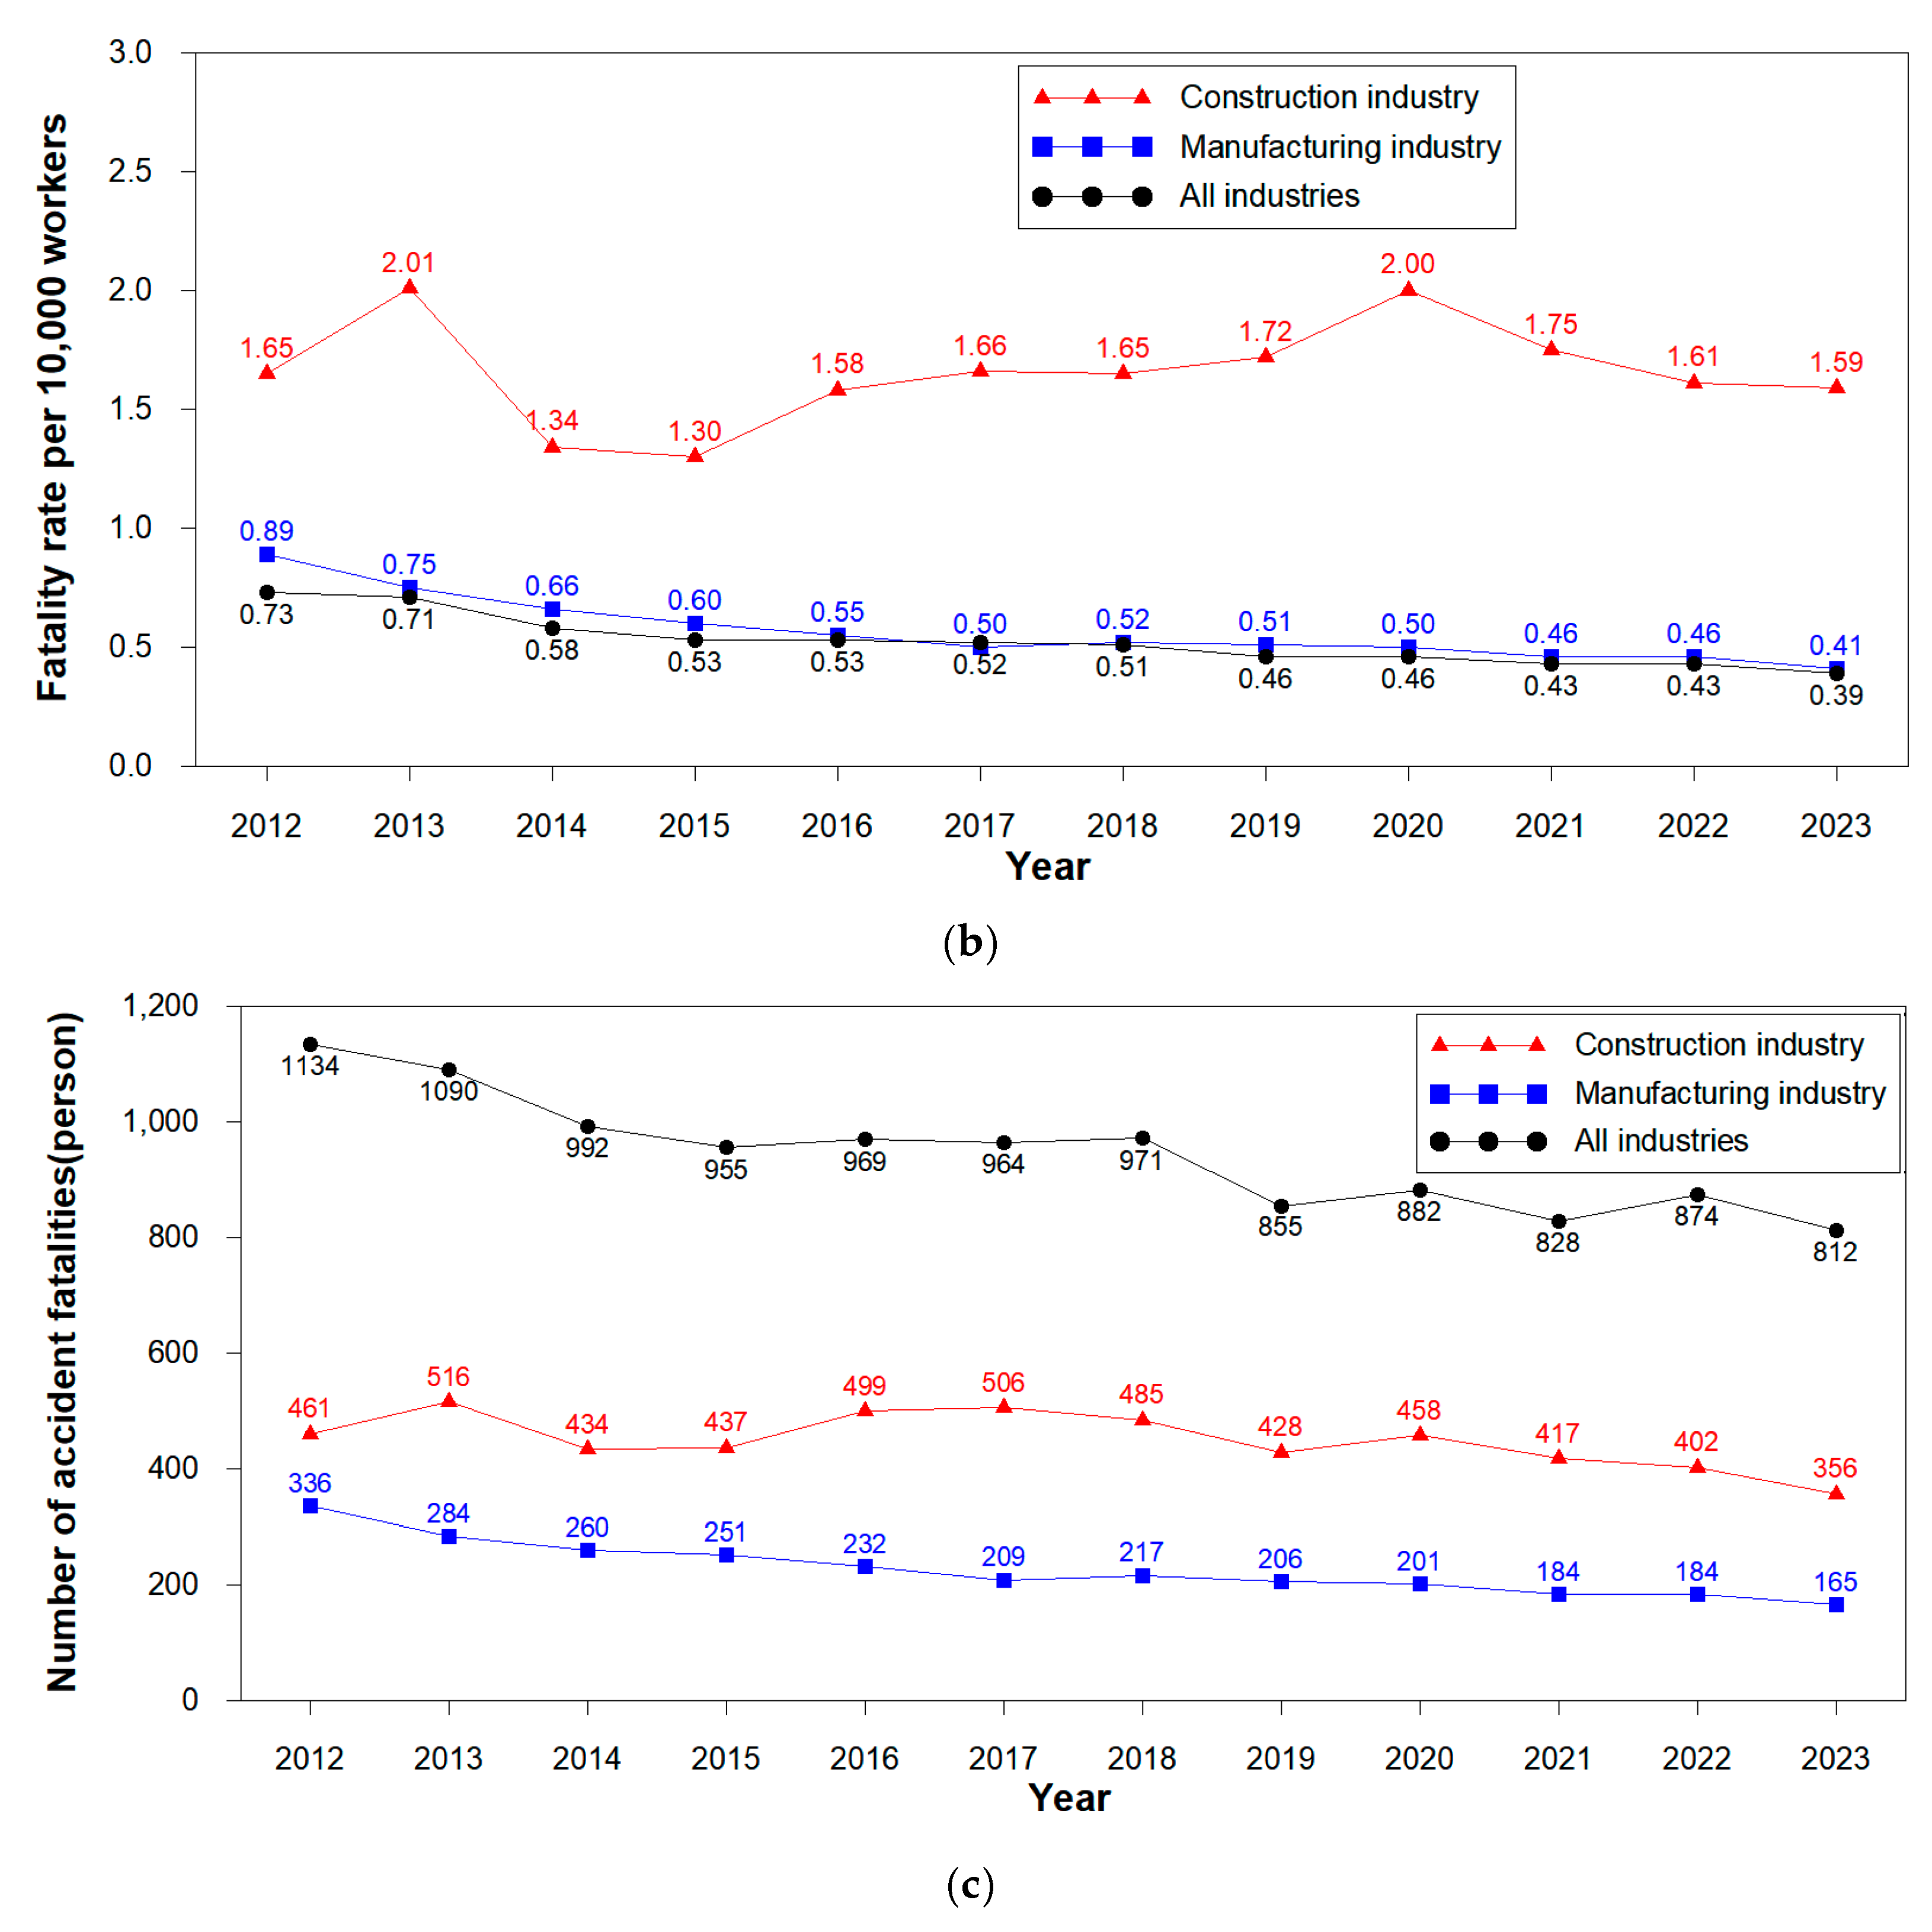
2.1. Accident Statistics in Korea
2.2. Literature Review
3. Research Methodology
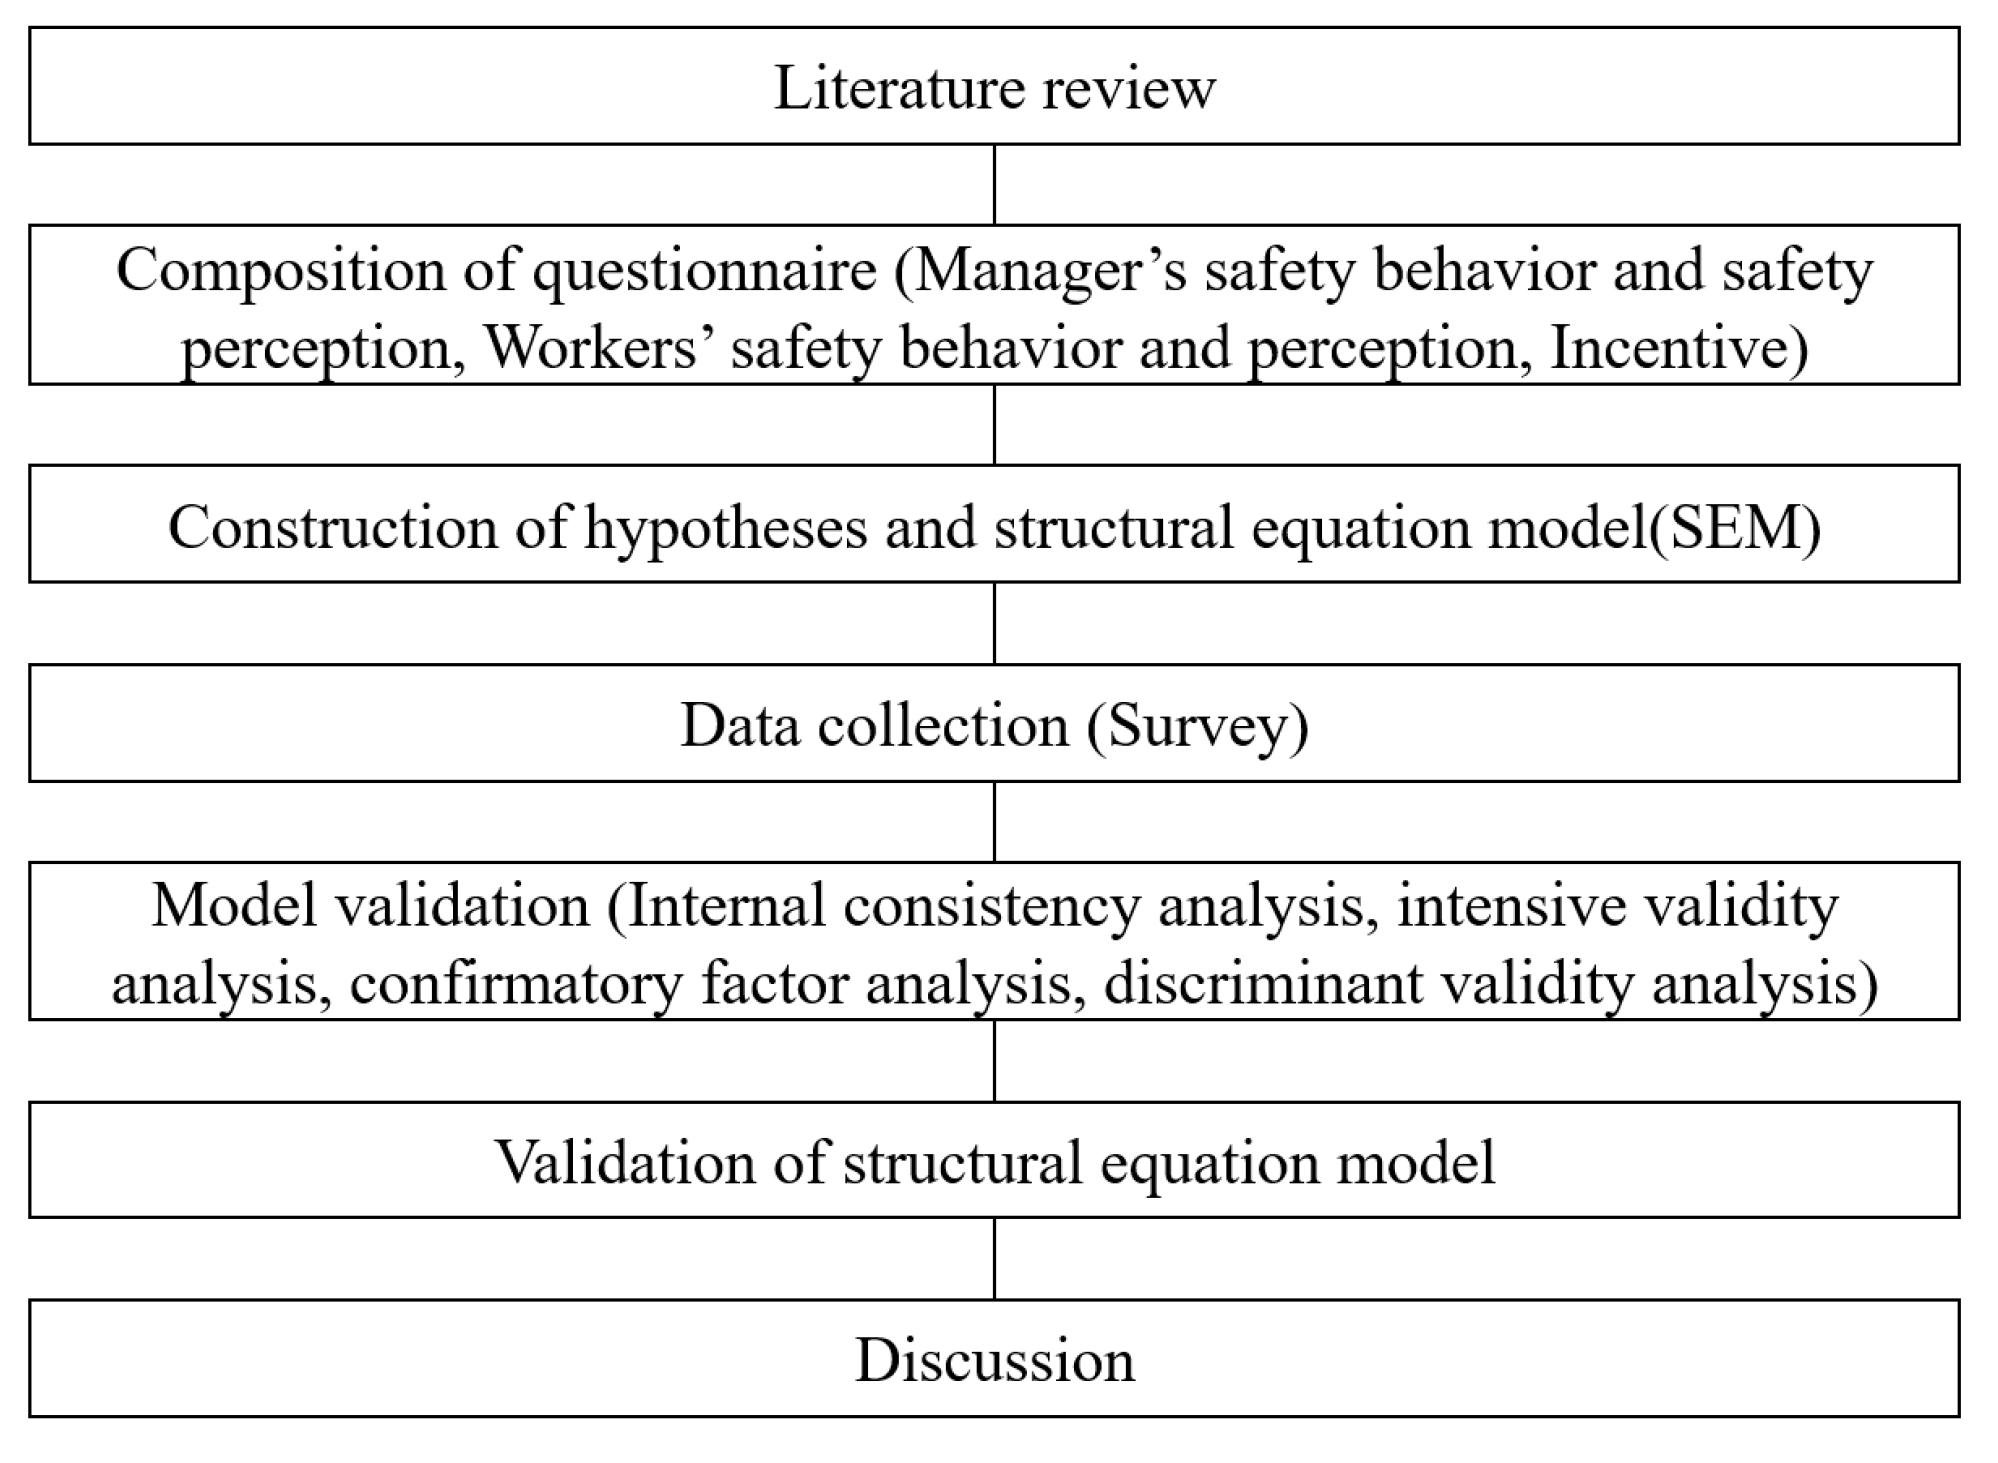
3.1. Research Procedure
3.2. Composition of the Questionnaire
3.3. Hypotheses
4. Data Collection
5. Results
5.1. Model Validation
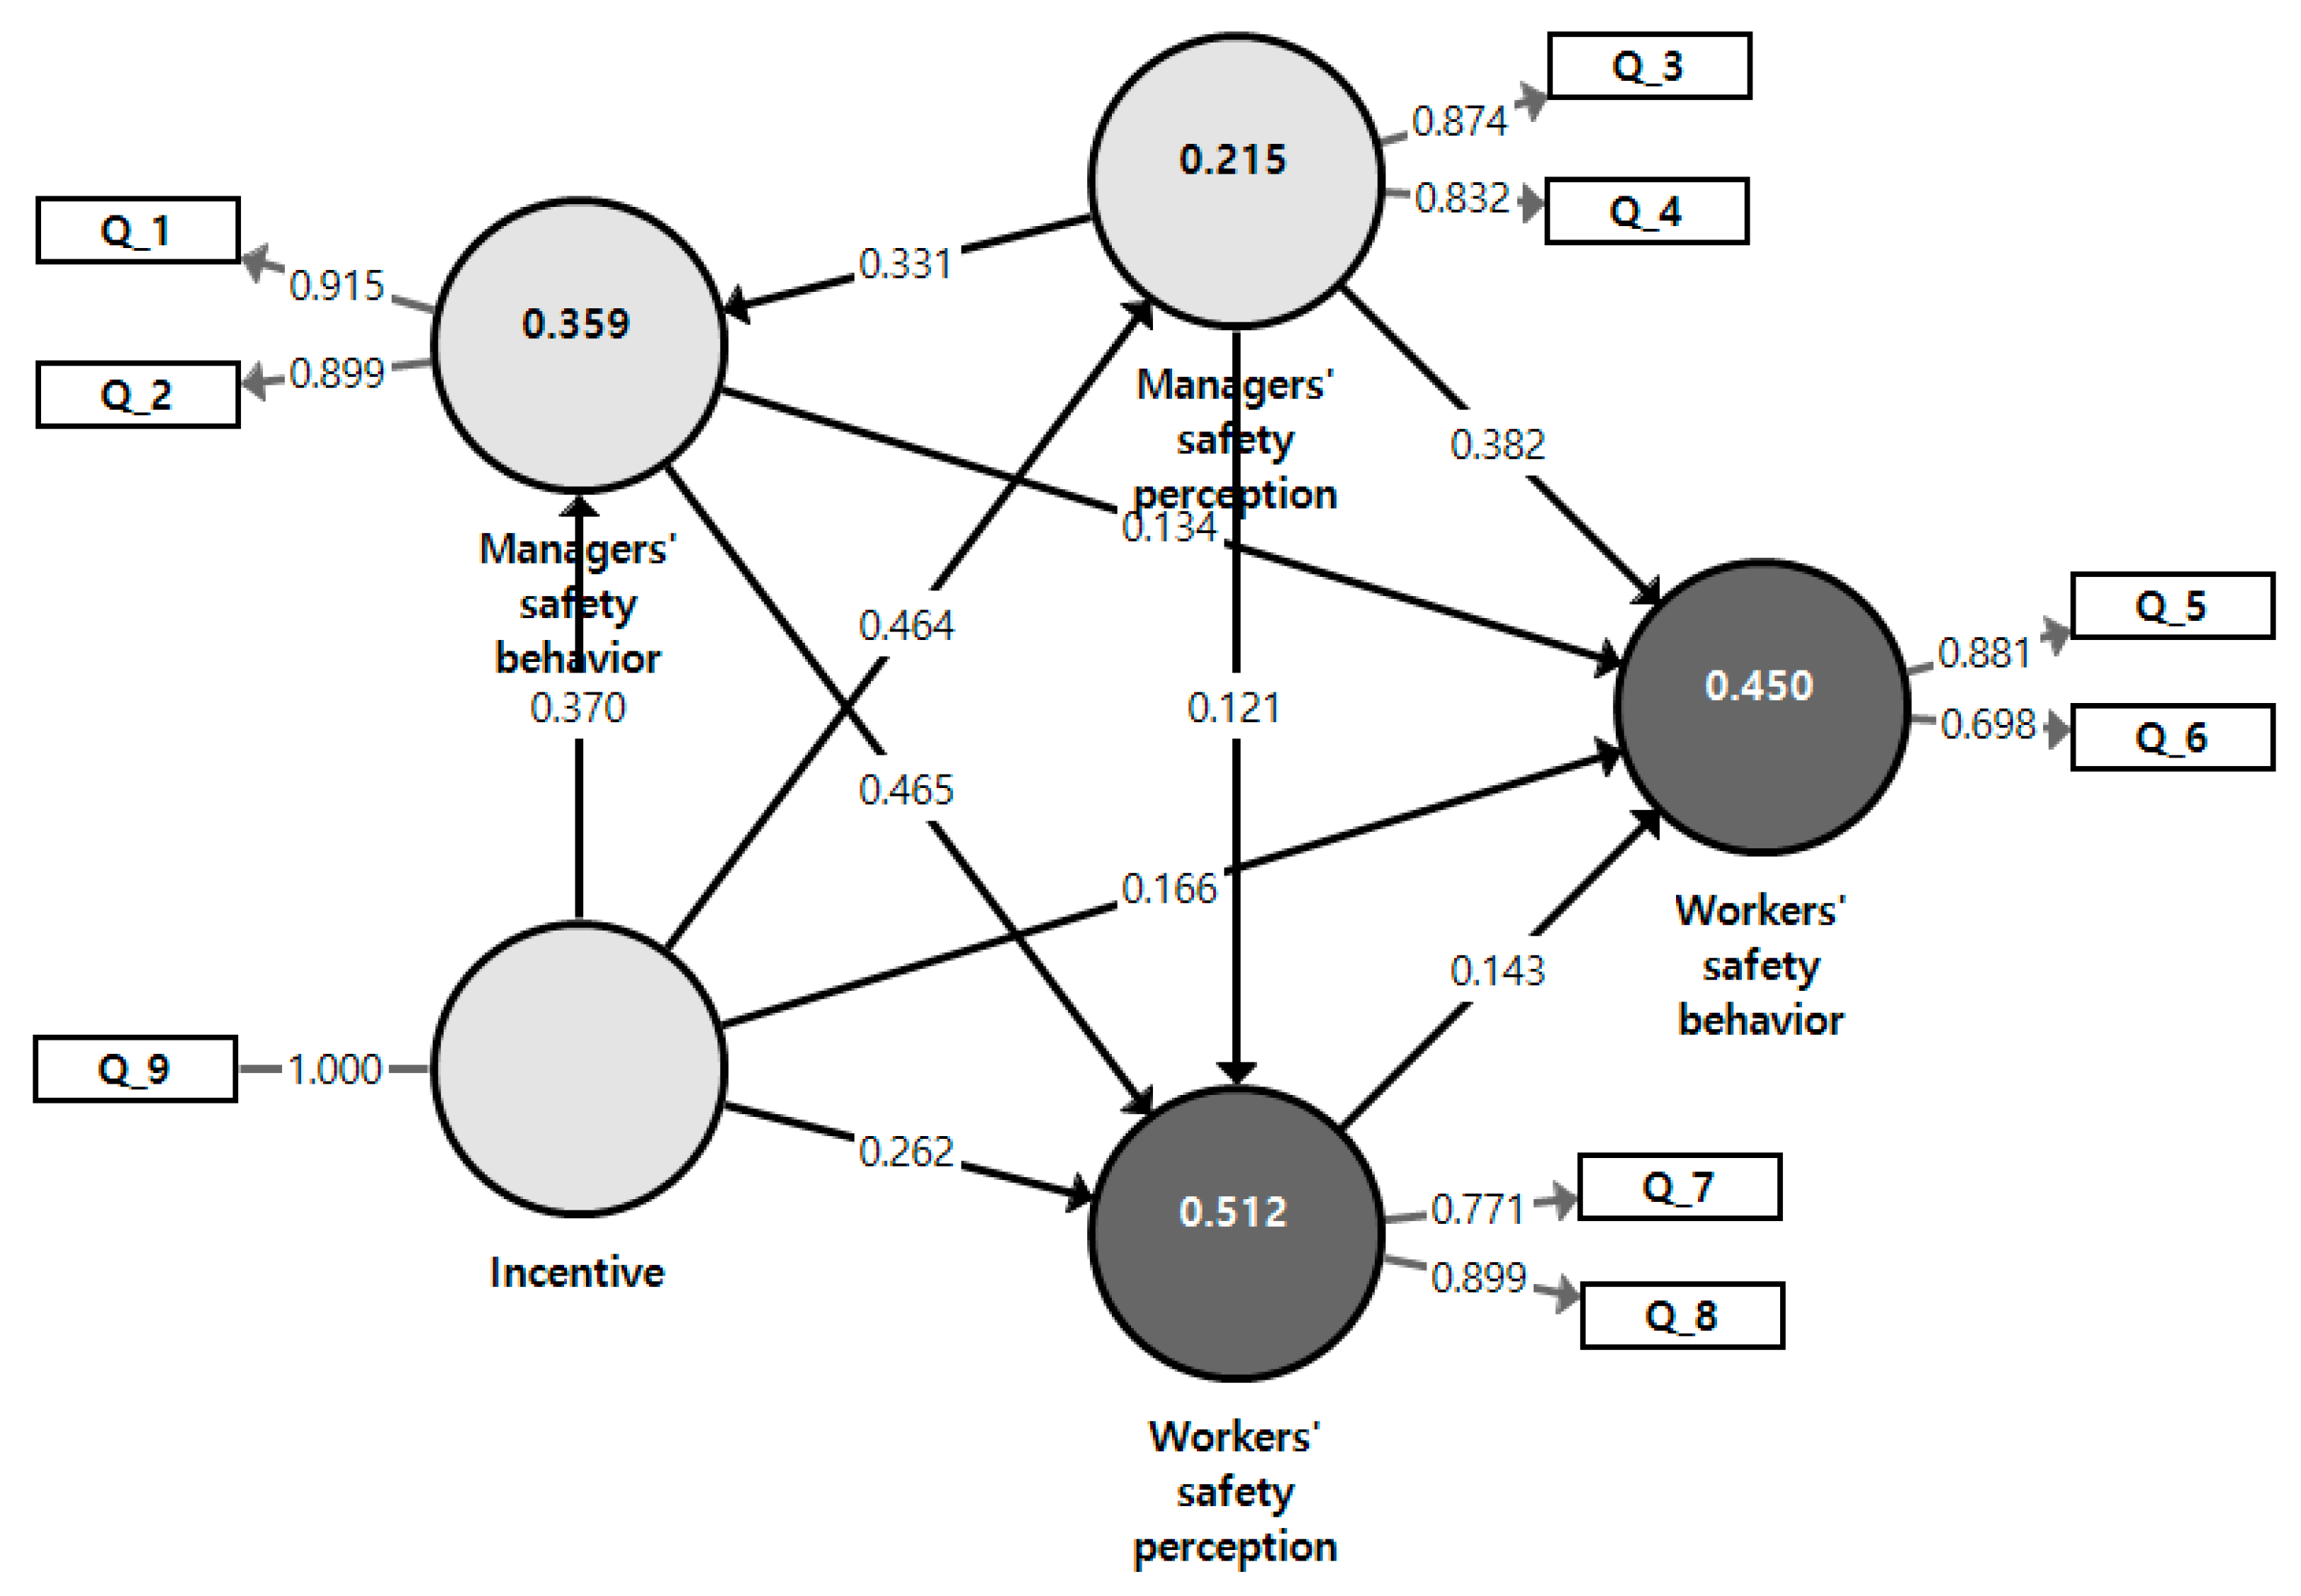
5.2. The Structural Equation Model
6. Discussion
6.1. Hypothesis Review
6.2. Implications of Structural Equation Model Analysis
7. Conclusions, Implications, and Limitations
Author Contributions
Funding
Data Availability Statement
Acknowledgments
Conflicts of Interest
References
- Idoro, G.I. Health and safety management efforts as correlates of performance in the Nigerian construction industry. J. Civ. Eng. Manag. 2008, 14, 277–285. [Google Scholar] [CrossRef]
- Williams, O.S.; Adul Hamid, R.; Misnan, M.S. Accident causal factors on the building construction sites: A review. Int. J. Built Environ. Sustain. 2018, 5, 78–92. [Google Scholar] [CrossRef]
- Lim, S.; Oh, A.; Won, J.; Chon, J. Improvement of inspection system for reduction of small-scale construction site accident in Korea. Ind. Health 2018, 56, 466–474. [Google Scholar] [CrossRef] [PubMed]
- Misnan, M.S.; Mohammed, A.H. Development of safety culture in the construction industry: A conceptual framework. In Proceedings of the 23rd Annual ARCOM Conference, Belfast, UK, 3–5 September 2007; pp. 13–22. [Google Scholar]
- Biggs, S.E.; Banks, T.D.; Davey, J.D.; Freeman, J.E. Safety leaders’ perceptions of safety culture in a large Australasian construction organization. Saf. Sci. 2013, 52, 3–12. [Google Scholar] [CrossRef]
- Hsieh, T.-Y. Impact of subcontracting on site productivity: Lessons learned in Taiwan. J. Constr. Eng. Manag. 1998, 124, 91–100. [Google Scholar] [CrossRef]
- Wong, F.; So, L. Restriction of the multi-layers subcontracting practice in Hong Kong-Is it an effective tool to improve safety performance of the construction industry. In Proceedings of the CIB Conference 2002, Hong Kong, China, 14 June 2002; Volume 9, pp. 229–235. [Google Scholar]
- Johnstone, R.; Mayhew, C.; Quinlan, M. Outsourcing risks? The regulation of occupational health and safety where subcontractors are employed. Comp. Lab. L. Pol’y J. 2000, 22, 351–393. [Google Scholar]
- Toole, T.M. Construction site safety roles. J. Constr. Eng. Manag. 2002, 128, 203–210. [Google Scholar] [CrossRef]
- Hinze, J.; Gambatese, J. Factors that influence safety performance of specialty contractors. J. Constr. Eng. Manag. 2003, 129, 159–164. [Google Scholar] [CrossRef]
- Fang, D.; Chen, Y.; Wong, L. Safety climate in construction industry: A case study in Hong Kong. J. Constr. Eng. Manag. 2006, 132, 573–584. [Google Scholar] [CrossRef]
- Chen, Q.; Jin, R. A comparison of subgroup construction workers’ perceptions of a safety program. Saf. Sci. 2015, 74, 15–26. [Google Scholar] [CrossRef]
- Arditi, D.; Mochtar, K. Trends in productivity improvement in the US construction industry. Construct. Manag. Econ. 2000, 18, 15–27. [Google Scholar] [CrossRef]
- Wu, C.; Wang, F.; Zou, P.X.W.; Fang, D. How safety leadership works among owners, contractors and subcontractors in construction projects. Int. J. Proj. Manag. 2016, 34, 789–805. [Google Scholar] [CrossRef]
- Li, Y.; Pei, J.; Wang, S.; Luo, Y. Analyzing the unsafe behaviors of frontline construction workers based on structural equation modeling. Buildings 2024, 14, 209. [Google Scholar] [CrossRef]
- Schwatka, N.V.; Goldenhar, L.M.; Johnson, S.K.; Beldon, M.A.; Tessler, J.; Dennerlein, J.T.; Trieu, H. A training intervention to improve frontline construction leaders’ safety leadership practices and overall jobsite safety climate. J. Saf. Res. 2019, 70, 253–262. [Google Scholar] [CrossRef]
- Chen, Y.; Hyatt, D.; Shahi, A.; Hanna, A.; Safa, M. How can conflicts with supervisors or coworkers affect construction workers’ safety performance on site? Two cross-sectional studies in North America. Buildings 2024, 14, 1245. [Google Scholar] [CrossRef]
- Liu, K.; Luo, X.; Feng, J.; Li, H.; Liu, B.; Jian, Y. Research on the impact of managers’ safety perception on construction workers’ safety behaviors. Buildings 2024, 14, 3467. [Google Scholar] [CrossRef]
- Mei, Y.; Huang, J.; Liu, J.; Jia, L. A study of factors influencing construction workers’ intention to share safety knowledge. Buildings 2024, 14, 440. [Google Scholar] [CrossRef]
- Ministry of Employment and Labor. Industrial Accident Status Analysis; Ministry of Employment and Labor: New Delhi, India, 2024. (In Korean)
- Li, X.; Liu, T.; Liu, Y. Cause analysis of unsafe behaviors in hazardous chemical accidents: Combined with HFACs and Bayesian network. Int. J. Environ. Res. Public Health 2020, 17, 11. [Google Scholar] [CrossRef]
- Zohar, D. Safety climate in industrial organizations: Theoretical and applied implications. J. Appl. Psychol. 1980, 65, 96–102. [Google Scholar] [CrossRef]
- Han, B.; Son, S.; Kim, S. Measuring safety climate in the construction industry: A systematic literature review. Sustainability 2021, 13, 10603. [Google Scholar] [CrossRef]
- Liu, X.; Xue, Z.; Ding, Z.; Chen, S. Current status and future directions of construction safety climate: Visual analysis based on WOS database. Sustainability 2023, 15, 3911. [Google Scholar] [CrossRef]
- Flin, R.; Mearns, K.; Oconnor, P.; Bryden, R. Measuring safety climate: Identifying the common features. Saf. Sci. 2000, 34, 177–192. [Google Scholar] [CrossRef]
- Chan, D.W.M.; Cristofaro, M.; Nassereddine, H.; Yiu, N.S.N.; Sarvari, H. Perceptions of safety climate in construction projects between workers and managers/supervisors in the developing country of Iran. Sustainability 2021, 13, 10398. [Google Scholar] [CrossRef]
- Griffin, M.A.; Neal, A. Perceptions of safety at work: A framework for linking safety climate to safety performance, knowledge, and motivation. J. Occup. Health Psychol. 2000, 5, 347–358. [Google Scholar] [CrossRef]
- Rasmussen, K.; Glasscock, D.J.; Hansen, O.N.; Carstensen, O.; Jepsen, J.F.; Nielsen, K.J. Worker participation in change processes in a Danish industrial setting. Am. J. Ind. Med. 2006, 49, 767–779. [Google Scholar] [CrossRef]
- Clarke, S. The relationship between safety climate and safety performance: A meta-analytic review. J. Occup. Health Psychol. 2006, 11, 315–327. [Google Scholar] [CrossRef]
- Christian, M.S.; Bradley, J.C.; Wallace, J.C.; Burke, M.J. Workplace safety: A meta-analysis of the roles of person and situation factors. J. Appl. Psychol. 2009, 94, 1103–1127. [Google Scholar] [CrossRef]
- Beus, J.M.; Payne, S.C.; Bergman, M.E.; Arthur, W. Safety climate and injuries: An examination of theoretical and empirical relationships. J. Appl. Psychol. 2010, 95, 713–727. [Google Scholar] [CrossRef]
- Clarke, S. An integrative model of safety climate: Linking psychological climate and work attitudes to individual safety outcomes using meta-analysis. J. Occup. Organ. Psychol. 2010, 83, 553–578. [Google Scholar] [CrossRef]
- Nahrgang, J.D.; Morgeson, F.P.; Hofmann, D.A. Safety at work: A meta-analytic investigation of the link between job demands, job resources, burnout, engagement, and safety outcomes. J. Appl. Psychol. 2011, 96, 71–94. [Google Scholar] [CrossRef]
- Jiang, L.; Lavaysse, L.M.; Probst, T.M. Safety climate and safety outcomes: A meta-analytic comparison of universal vs. industry-specific safety climate predictive validity. Work Stress 2019, 33, 41–57. [Google Scholar] [CrossRef]
- Seo, D.C.; Torabi, M.R.; Blair, E.H.; Ellis, N.T. A cross-validation of safety climate scale using confirmatory factor analytic approach. J. Saf. Res. 2004, 35, 427–445. [Google Scholar] [CrossRef] [PubMed]
- Kadir, A.; Lestari, F.; Sunindijo, R.Y.; Erwandi, D.; Kusminanti, Y.; Modjo, R.; Widanarko, B.; Ramadhan, N.A. Safety climate in the Indonesian construction industry: Strengths, weaknesses, and influential demographic characteristics. Buildings 2022, 12, 639. [Google Scholar] [CrossRef]
- Chen, W.T.; Merrett, H.C.; Huang, Y.-H.; Lu, S.T.; Sun, W.C.; Li, Y. Exploring the multilevel perception of safety climate on Taiwanese construction sites. Sustainability 2019, 11, 4596. [Google Scholar] [CrossRef]
- Chen, W.T.; Merrett, H.C.; Huang, Y.-H.; Bria, T.A.; Lin, Y.-H. Exploring the relationship between safety climate and worker safety behavior on building construction sites in Taiwan. Sustainability 2021, 13, 3326. [Google Scholar] [CrossRef]
- Newaz, M.T.; Davis, P.R.; Jefferies, M.; Pillay, M. Developing a Safety Climate Factor Model in Construction Research and Practice. Eng. Constr. Archit. Manag. 2018, 25, 738–757. [Google Scholar] [CrossRef]
- Makki, A.A.; Mosly, I. Predicting the safety climate in construction sites of Saudi Arabia: A bootstrapped multiple ordinal logistic regression modeling approach. Appl. Sci. 2021, 11, 1474. [Google Scholar] [CrossRef]
- Kim, S.; Song, S.; Lee, D.; Kim, D.; Lee, S.; Irizarry, J. A conceptual model of multi-spectra perceptions for enhancing the safety climate in construction workplaces. Buildings 2021, 11, 347. [Google Scholar] [CrossRef]
- Alamoudi, M. The integration of NOSACQ-50 with importance-performance analysis technique to evaluate and analyze safety climate dimensions in the construction sector in Saudi Arabia. Buildings 2022, 12, 1855. [Google Scholar] [CrossRef]
- Niu, M.; Leicht, R.M. Evaluating the safety climate in construction projects: A longitudinal mixed-methods study. Buildings 2024, 14, 4070. [Google Scholar] [CrossRef]
- Zhang, R.P.; Lingard, H.; Oswald, D. Impact of supervisory safety communication on safety climate and behavior in construction workgroups. J. Constr. Eng. Manag. 2020, 146, 04020089. [Google Scholar] [CrossRef]
- Brown, R.L.; Holmes, H. The use of a factor-analytic procedure for assessing the validity of an employee safety climate model. Accid. Anal. Prev. 1986, 18, 455–470. [Google Scholar] [CrossRef]
- DeJoy, D.M.; Wilson, M.G.; Vandenberg, R.J.; McGrath-Higgins, A.L.; Griffin-Blake, C.S. Assessing the impact of healthy work organization intervention. J. Occup. Organ. Psychol. 2010, 83, 139–165. [Google Scholar] [CrossRef]
- Suraji, A.; Duff, A.R.; Peckitt, S.J. Development of causal model of construction accident causation. J. Constr. Eng. Manag. 2001, 127, 337–344. [Google Scholar] [CrossRef]
- López Arquillos, A.; Rubio Romero, J.C.; Gibb, A. Analysis of construction accidents in Spain, 2003–2008. J. Saf. Res. 2012, 43, 381–388. [Google Scholar] [CrossRef]
- Sunindijo, R.Y.; Zou, P.X.W. How project manager’s skills may influence the development of safety climate in construction projects. Int. J. Proj. Organ. Manag. 2012, 4, 286–301. [Google Scholar] [CrossRef]
- Martin, H.; Lewis, T.M. Pinpointing safety leadership factors for safe construction sites in Trinidad and Tobago. J. Constr. Eng. Manag. 2014, 140, 04013046. [Google Scholar] [CrossRef]
- Hofmann, D.A.; Morgeson, F.P. Safety-related behavior as a social exchange: The role of perceived organizational support and leader–member exchange. J. Appl. Psychol. 1999, 84, 286–296. [Google Scholar] [CrossRef]
- Niskanen, T. Safety climate in the road administration. Saf. Sci. 1994, 17, 237–255. [Google Scholar] [CrossRef]
- Hayes, B.E.; Perander, J.; Smecko, T.; Trask, J. Measuring perceptions of workplace safety: Development and validation of the work safety scale. J. Saf. Res. 1998, 29, 145–161. [Google Scholar] [CrossRef]
- Mohamed, S. Safety climate in construction site environments. J. Constr. Eng. Manag. 2002, 128, 375–384. [Google Scholar] [CrossRef]
- Singh, A.; Misra, S.C. Safety performance & evaluation framework in Indian construction industry. Saf. Sci. 2021, 134, 105023. [Google Scholar] [CrossRef]
- Guastello, S.J. Do we really know how well our occupational accident prevention programs work? Saf. Sci. 1993, 16, 445–463. [Google Scholar] [CrossRef]
- Cao, Q.; Li, K.; Li, J. Impact of manager’s behavior on coalminer’s unsafe behavior. J. Manag. Sci. 2011, 24, 69–78. [Google Scholar]
- Guldenmund, F.W. The use of questionnaires in safety culture research–an evaluation. Saf. Sci. 2007, 45, 723–743. [Google Scholar] [CrossRef]
- Guldenmund, F.W. The nature of safety culture: A review of theory and research. Saf. Sci. 2000, 34, 215–257. [Google Scholar] [CrossRef]
- Marín, L.S.; Lipscomb, H.; Cifuentes, M.; Punnett, L. Perceptions of safety climate across construction personnel: Associations with injury rates. Saf. Sci. 2019, 118, 487–496. [Google Scholar] [CrossRef]
- Probst, T.M.; Goldenhar, L.M.; Byrd, J.L.; Betit, E. The safety climate assessment tool (S-CAT): A rubric-based approach to measuring construction Safety climate. J. Saf. Res. 2019, 69, 43–51. [Google Scholar] [CrossRef]
- Guldenmund, F.; Cleal, B.; Mearns, K. An exploratory study of migrant workers and safety in three European countries. Saf. Sci. 2013, 52, 92–99. [Google Scholar] [CrossRef]
- Yousefi, Y.; Jahangiri, M.; Choobineh, A.; Tabatabaei, H.; Keshavarzi, S.; Shams, A.; Mohammadi, Y. Validity assessment of the persian version of the nordic safety climate questionnaire (NOSACQ 50): A case study in a steel company. Saf. Health Work 2016, 7, 326–330. [Google Scholar] [CrossRef]
- Australian Transport Safety Bureau (ATSB). ATSB Aviation Safety Survey—Safety Climate Factors; Aviation Research Paper B2003/0122; ATSB: Canberra, Australia, 2004.
- Zhou, Q.; Fang, D.; Mohamed, S. Safety climate improvement: Case study in a Chinese construction company. J. Constr. Eng. Manag. 2010, 137, 86–95. [Google Scholar] [CrossRef]
- Hon, C.K.H.; Chan, A.P.C.; Yam, M.C.H. Determining safety climate factors in the repair, maintenance, minor alteration, and addition sector of Hong Kong. J. Constr. Eng. Manag. 2012, 139, 519–528. [Google Scholar] [CrossRef]
- Seo, H.C.; Lee, Y.S.; Kim, J.J.; Jee, N.Y. Analyzing safety behaviors of temporary construction workers using structural equation modeling. Saf. Sci. 2015, 77, 160–168. [Google Scholar] [CrossRef]
- Wu, C.; Song, X.; Wang, T.; Fang, D. Core dimensions of the construction safety climate for a standardized safety-climate measurement. J. Constr. Eng. Manag. 2015, 141, 04015018. [Google Scholar] [CrossRef]
- Zhou, Q.; Fang, D.; Wang, X. A method to identify strategies for the improvement of human safety behavior by considering safety climate and personal experience. Saf. Sci. 2008, 46, 1406–1419. [Google Scholar] [CrossRef]
- Glendon, A.; Litherland, D. Safety climate factors, group differences and safety behavior in road construction. Saf. Sci. 2001, 39, 157–188. [Google Scholar] [CrossRef]
- Hopkins, A. Making Safety Work: Getting Management Commitment to Occupational Health and Safety; Allen and Unwin: Sydney, Australia, 1995. [Google Scholar]
- Fornell, C.; Larcker, D.F. Structural equation models with unobservable variables and measurement error: Algebra and statistics. J. Mark. Res. 1981, 18, 382–388. [Google Scholar] [CrossRef]
- Nunnally, J.C. Teoría Psicométrica, Trillas; México DF: Mexico City, Mexico, 1987. [Google Scholar]
- Goodhue, D.L.; Thompson, R.L. Task-technology fit and individual performance. MIS Q. 1995, 19, 213–236. [Google Scholar] [CrossRef]
- Chin, W.W. Commentary: Issues and opinion on structural equation modeling. MIS Q. 1998, 22, 7–16. Available online: https://www.jstor.org/stable/249674 (accessed on 25 February 2025).
- Gefen, D.; Straub, D. A practical guide to factorial validity using PLS-graph: Tutorial and annotated example. Commun. Assoc. Inf. Syst. 2005, 16, 91–109. [Google Scholar] [CrossRef]
- Chin, W.W.; Gopal, A. Adoption intention in GSS: Relative importance of beliefs. ACM SIGMIS Database Database Adv. Inf. Syst. 1995, 26, 42–64. [Google Scholar] [CrossRef]
- Falk, M.; Miller, A.G. Infrared spectrum of carbon dioxide in aqueous solution. Vib. Spectrosc. 1992, 4, 105–108. [Google Scholar] [CrossRef]
- Wetzels, M.; Odekerken-Schröder, G.; van Oppen, C. Using PLS path modeling for assessing hierarchical construct models: Guidelines and empirical illustration. MIS Q. 2009, 33, 177–195. [Google Scholar] [CrossRef]
- Tenenhaus, M.; Vinzi, V.E.; Chatelin, Y.M.; Lauro, C. PLS path modeling. Comput. Stat. Data Anal. 2005, 48, 159–205. [Google Scholar] [CrossRef]
- Khun-anod, K.; Watanabe, T.; Tsuchiya, S. Roles and autonomous motivation of safety officers: The context of construction sites. Buildings 2024, 14, 460. [Google Scholar] [CrossRef]
- Ryan, R.M.; Deci, E.L. Intrinsic and extrinsic motivations: Classic definitions and new directions. Contemp. Educ. Psychol. 2000, 25, 54–67. [Google Scholar] [CrossRef]
- Deci, E.L.; Flaste, R. Why We Do What We Do: The Dynamics of Personal Autonomy; GP Putnam’s Sons: New York, NY, USA, 1995. [Google Scholar]
- Abas, N.H.; Nurahim, M.H.; Yasin, N.; Rahmat, M.H. Safety incentive program for construction project: Case studies of several construction projects in Klang Valley, Malaysia. Civ. Eng. Archit. 2020, 3, 359–365. [Google Scholar] [CrossRef]
- Meng, W.-L.; Shen, S.; Zhou, A. Investigation on fatal accidents in Chinese construction industry between 2004 and 2016. Nat. Hazard. 2018, 94, 655–670. [Google Scholar] [CrossRef]
- Choe, S.; Seo, W.; Kang, Y. Inter- and intra-organizational safety management practice differences in the construction industry. Saf. Sci. 2020, 128, 104778. [Google Scholar] [CrossRef]
- Kivimaki, M.; Kalimo, R.; Salminen, S. Perceived nuclear risk, organizational commitment, and appraisals of management: A study of nuclear power plant personnel. Risk Anal. 1995, 15, 391–396. [Google Scholar] [CrossRef]
- Aksorn, T.; Hadikusumo, B.H.W. Critical success factors influencing safety program performance in Thai construction projects. Saf. Sci. 2008, 46, 709–727. [Google Scholar] [CrossRef]
- Tam, C.M.; Zeng, S.X.; Deng, Z.M. Identifying elements of poor construction safety management in China. Saf. Sci. 2004, 42, 569–586. [Google Scholar] [CrossRef]
- Chan, A.P.C.; Wong, F.K.W.; Hon, C.K.H.; Lyu, S.; Javed, A.A. Investigating ethnic minorities’ perceptions of safety climate in the construction industry. J. Saf. Res. 2017, 63, 9–19. [Google Scholar] [CrossRef] [PubMed]
- Menzel, N.N.; Gutierrez, A.P. Latino worker perceptions of construction risks. Am. J. Ind. Med. 2010, 53, 179–187. [Google Scholar] [CrossRef] [PubMed]


| No. | Safety Climate Dimensions | Related Studies |
|---|---|---|
| 1 | Management safety priority, commitment, and competence (9 items) | [22,65,66,67,68] |
| 2 | Management safety empowerment (7 items) | [45] |
| 3 | Management safety justice (6 items) | [46,54,69] |
| 4 | Workers’ safety commitment (6 items) | [11,51,66,68,69] |
| 5 | Workers’ safety priority and risk non-acceptance (7 items) | [52] |
| 6 | Safety communication, learning, and trust in co-workers’ safety competence (8 items) | [51,54,68,70] |
| 7 | Trust in the efficacy of safety systems (7 items) | [22,56] |
| Category | Contents |
|---|---|
| Manager’s safety behavior (MSB) | Q1: The manager communicates with workers often about safety-related issues. Q2: The manager visits the site for safety inspection and directly participates in accident prevention activities. |
| Manager’s safety perception (MSP) | Q3: The manager does not carry out the work when safety is not secured. Q4: The manager thinks that safety and health is not their job. |
| Workers’ safety behavior (WSB) | Q5: Workers actively report risk factors that can lead to accidents. Q6: Workers are often found not following safety guidelines. |
| Workers’ safety perception (WSP) | Q7: Workers think that excessive emphasis on safety hinders the work in the field. Q8: Safety and health staff (managers) help prevent accidents. |
| Incentives | Q9: To give rewards for safety activities is helpful to motivate safety behavior since the awards make workers proud. |
| Classification | CMs (Contractor Managers) | SWs (Subcontractor Workers) | |||
|---|---|---|---|---|---|
| Number | (%) | Number | (%) | ||
| Age | <30 year | 65 | 5.3 | 137 | 11.5 |
| 30~39 year | 507 | 41.6 | 169 | 14.2 | |
| 40~49 year | 407 | 33.4 | 283 | 23.8 | |
| 50~59 year | 214 | 17.5 | 472 | 39.6 | |
| >60 year | 26 | 2.1 | 129 | 10.8 | |
| N/A | 0 | 0.0 | 1 | 0.1 | |
| Years of experience | <1 year | 16 | 1.3 | 170 | 14.3 |
| 1~3 year | 53 | 4.3 | 182 | 15.3 | |
| 3~5 year | 85 | 7.0 | 170 | 14.3 | |
| 5~10 year | 373 | 30.6 | 211 | 17.7 | |
| >10 year | 687 | 56.4 | 458 | 38.5 | |
| N/A | 5 | 0.4 | 0 | 0.0 | |
| Years of service | <1 year | 52 | 4.3 | 764 | 64.1 |
| 1~3 year | 108 | 8.9 | 271 | 22.8 | |
| 3~7 year | 209 | 17.1 | 84 | 7.1 | |
| 7~15 year | 506 | 41.5 | 43 | 3.6 | |
| >15 year | 254 | 20.8 | 25 | 2.1 | |
| N/A | 90 | 7.4 | 4 | 0.3 | |
| Classification | CMs (Contractor Managers) | SWs (Subcontractor Workers) | ||||
|---|---|---|---|---|---|---|
| Combined Reliability | AVE | Cronbach’s Alpha | Combined Reliability | AVE | Cronbach’s Alpha | |
| MSP | 0.843 | 0.728 | 0.628 | 0.838 | 0.721 | 0.616 |
| MSB | 0.903 | 0.823 | 0.785 | 0.849 | 0.737 | 0.644 |
| Incentive | 1 | 1 | 1 | 1 | 1 | 1 |
| WSP | 0.824 | 0.702 | 0.586 | 0.675 | 0.549 | 0.269 |
| WSB | 0.772 | 0.631 | 0.432 | 0.816 | 0.69 | 0.553 |
| Classification | CMs (Contractor Managers) | SWs (Subcontractor Workers) | |||
|---|---|---|---|---|---|
| Factor Loading Value | T-Value | Factor Loading Value | T-Value | ||
| MSP | Q3 | 0.874 | 81.583 | 0.872 | 87.969 |
| Q4 | 0.832 | 43.382 | 0.826 | 49.064 | |
| MSB | Q1 | 0.899 | 111.595 | 0.867 | 75.763 |
| Q2 | 0.915 | 157.035 | 0.850 | 58.473 | |
| Incentive | Q9 | 1.000 | 1.000 | ||
| WSP | Q7 | 0.771 | 37.179 | 0.404 | 7.209 |
| Q8 | 0.899 | 132.717 | 0.966 | 99.497 | |
| WSB | Q6 | 0.698 | 21.142 | 0.801 | 41.354 |
| Q5 | 0.881 | 77.079 | 0.859 | 76.036 | |
| Classification | MSP | MSB | Incentive | WSP | WSB | |
|---|---|---|---|---|---|---|
| MSP | Q3 | 0.874 | 0.491 | 0.412 | 0.448 | 0.504 |
| Q4 | 0.832 | 0.358 | 0.378 | 0.359 | 0.512 | |
| MSB | Q1 | 0.471 | 0.915 | 0.47 | 0.634 | 0.481 |
| Q2 | 0.439 | 0.899 | 0.48 | 0.565 | 0.438 | |
| Incentive | Q9 | 0.464 | 0.523 | 1 | 0.561 | 0.493 |
| WSP | Q7 | 0.315 | 0.403 | 0.38 | 0.771 | 0.371 |
| Q8 | 0.463 | 0.67 | 0.54 | 0.899 | 0.469 | |
| WSB | Q6 | 0.39 | 0.294 | 0.288 | 0.288 | 0.698 |
| Q5 | 0.541 | 0.486 | 0.472 | 0.49 | 0.881 | |
| Classification | MSP | MSB | Incentive | WSP | WSB | |
|---|---|---|---|---|---|---|
| MSP | Q3 | 0.871 | 0.416 | 0.38 | 0.51 | 0.557 |
| Q4 | 0.827 | 0.334 | 0.308 | 0.443 | 0.523 | |
| MSB | Q1 | 0.363 | 0.852 | 0.332 | 0.436 | 0.364 |
| Q2 | 0.399 | 0.865 | 0.303 | 0.437 | 0.408 | |
| Incentive | Q9 | 0.407 | 0.37 | 1 | 0.432 | 0.391 |
| WSP | Q7 | - | - | - | - | - |
| Q8 | 0.563 | 0.509 | 0.432 | 1 | 0.534 | |
| WSB | Q6 | 0.509 | 0.317 | 0.256 | 0.394 | 0.802 |
| Q5 | 0.547 | 0.424 | 0.385 | 0.489 | 0.858 | |
| Classification | MSP | MSB | Incentive | WSP | WSB |
|---|---|---|---|---|---|
| MSP | 0.853 | ||||
| MSB | 0.502 | 0.907 | |||
| Incentive | 0.464 | 0.523 | 1 | ||
| WSP | 0.476 | 0.662 | 0.561 | 0.838 | |
| WSB | 0.595 | 0.507 | 0.493 | 0.507 | 0.794 |
| Classification | MSP | MSB | Incentive | WSP | WSB |
|---|---|---|---|---|---|
| MSP | 0.850 | ||||
| MSB | 0.444 | 0.858 | |||
| Incentive | 0.407 | 0.37 | 1 | ||
| WSP | 0.563 | 0.509 | 0.432 | 1 | |
| WSB | 0.636 | 0.45 | 0.391 | 0.534 | 0.831 |
| Classification | Path | Path Coefficient | STDEV | T | p Values |
|---|---|---|---|---|---|
| H1-1 | MSP → WSB | 0.382 | 0.033 | 11.677 | 0.000 *** |
| H1-2 | MSP → MSB | 0.331 | 0.03 | 10.88 | 0.000 *** |
| H1-3 | MSP → WSP | 0.121 | 0.027 | 4.454 | 0.000 *** |
| H2-1 | MSB → WSB | 0.134 | 0.036 | 3.672 | 0.000 *** |
| H2-2 | MSB → WSP | 0.465 | 0.028 | 16.661 | 0.000 *** |
| H3 | WSP → WSB | 0.143 | 0.034 | 4.202 | 0.000 *** |
| H4-1 | Incentive → WSB | 0.166 | 0.032 | 5.254 | 0.000 *** |
| H4-2 | Incentive → WSP | 0.262 | 0.029 | 9.166 | 0.000 *** |
| H4-3 | Incentive → MSB | 0.370 | 0.031 | 11.935 | 0.000 *** |
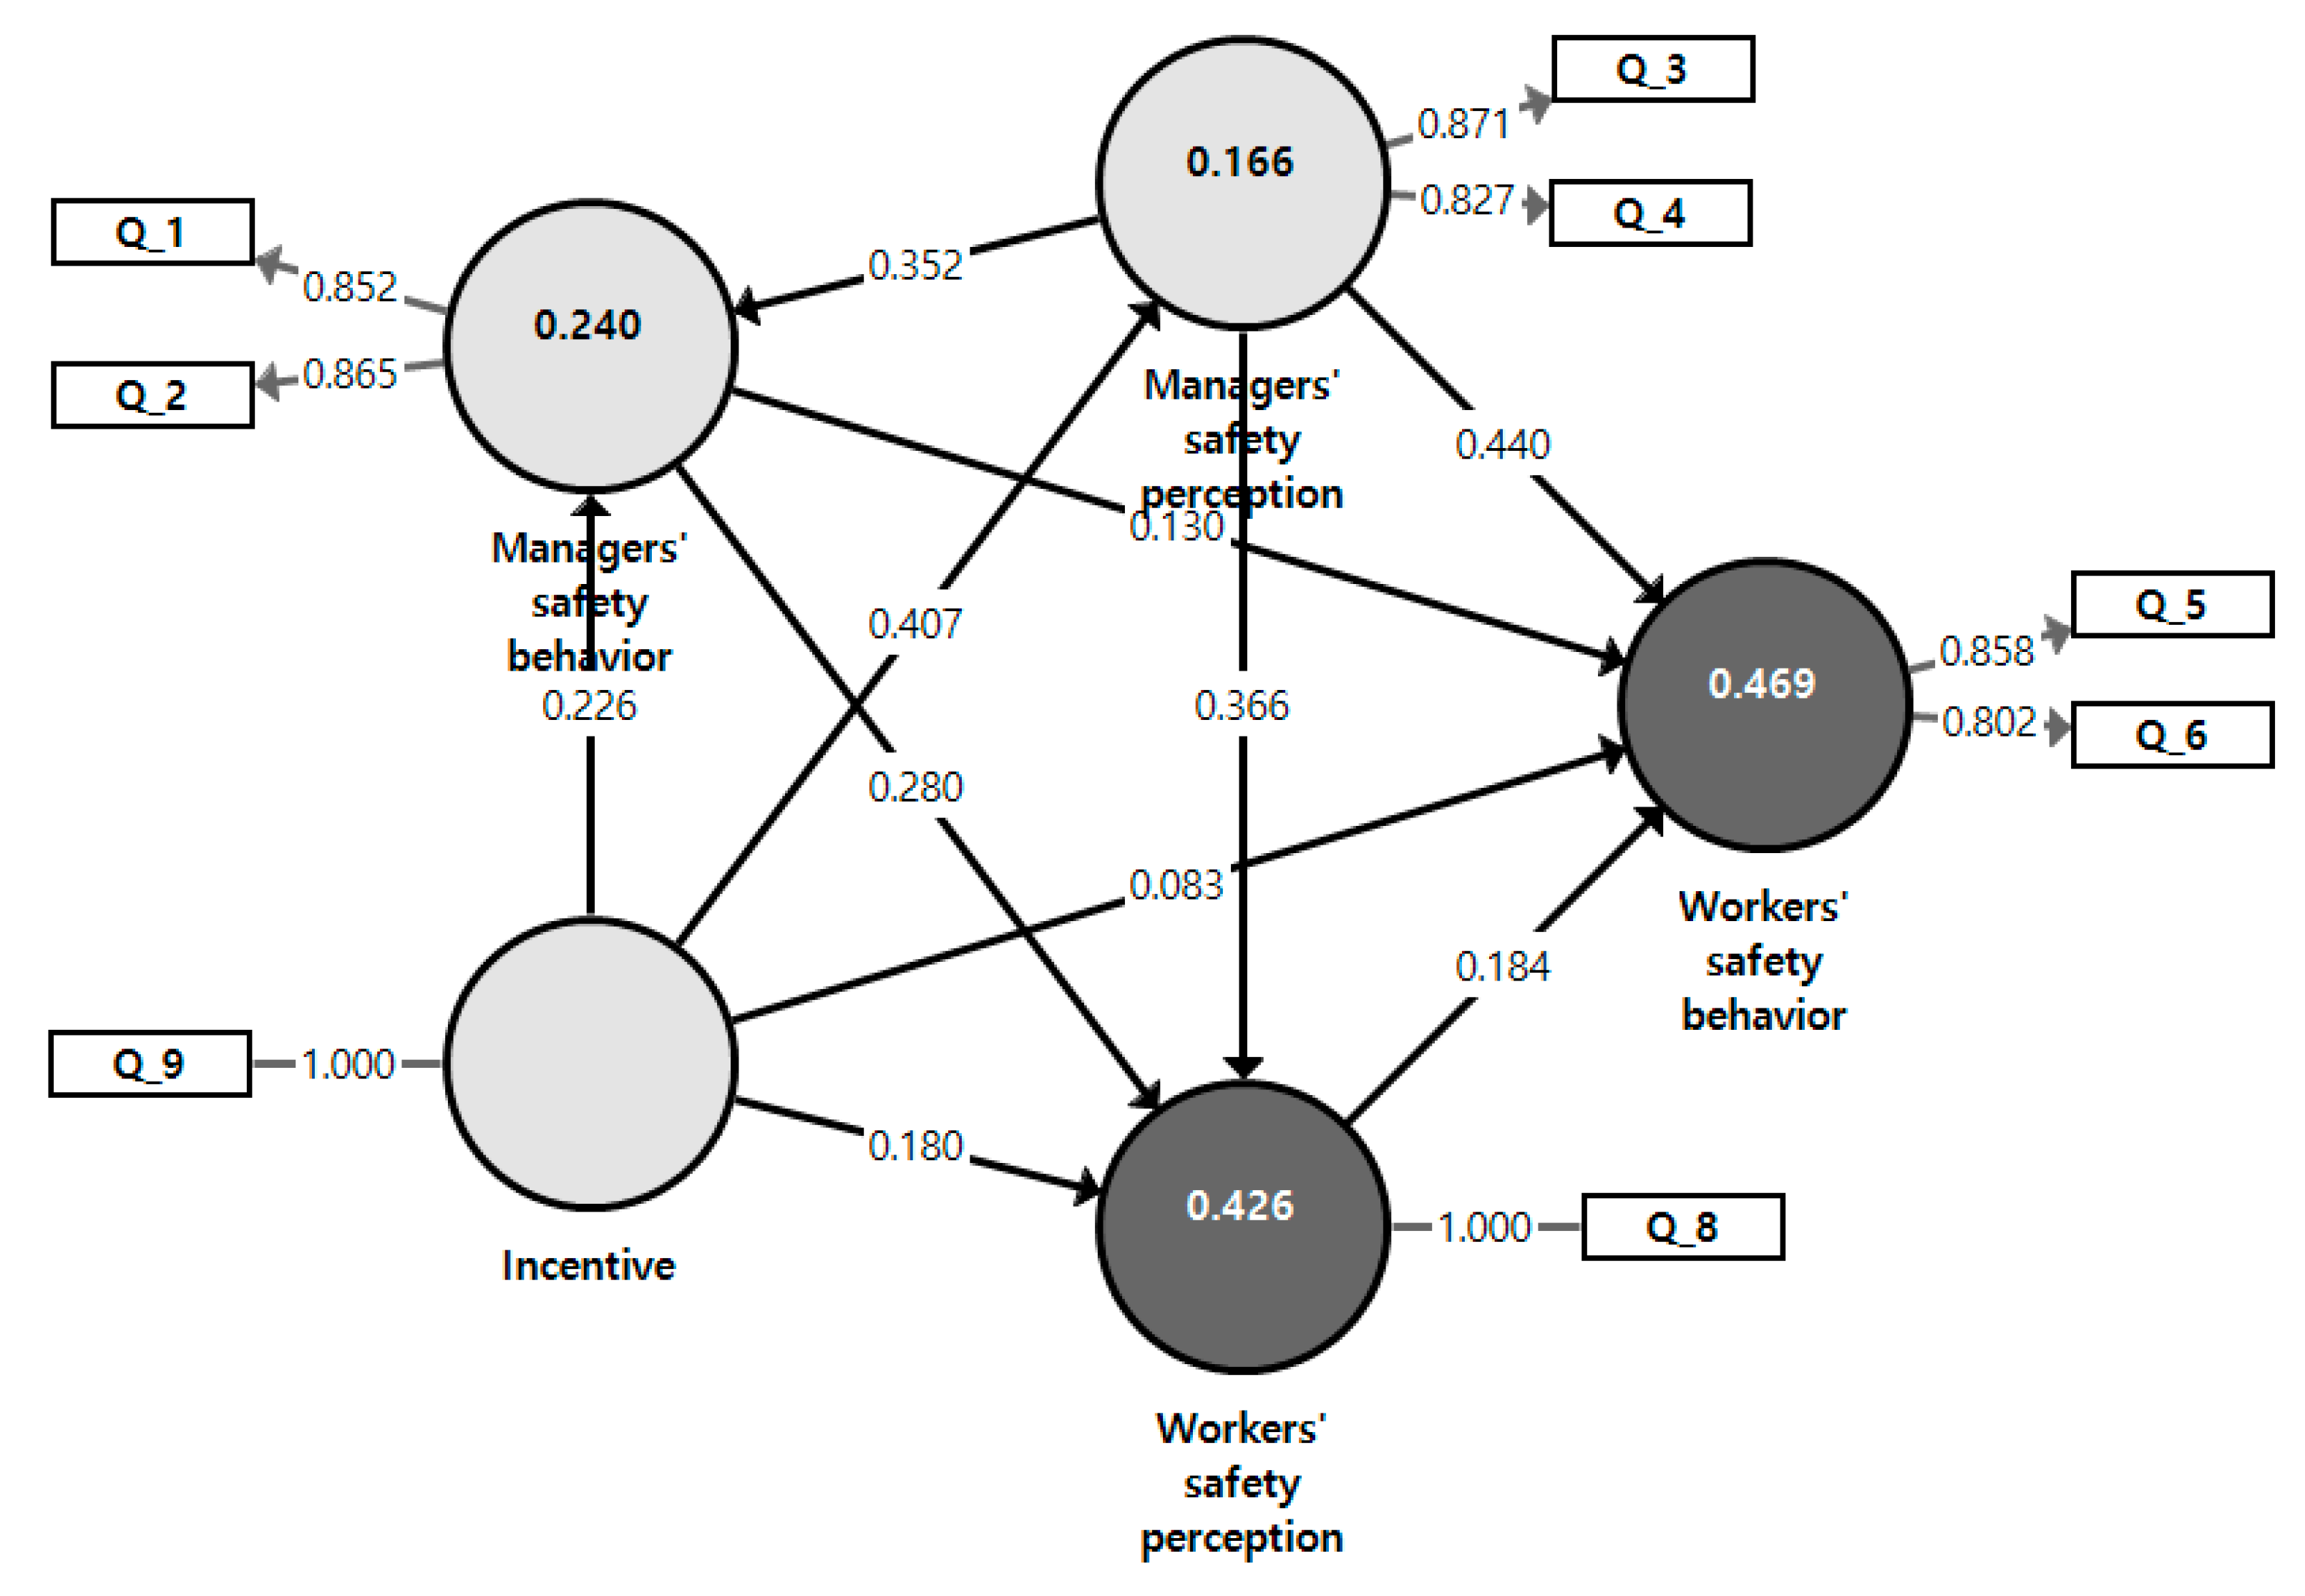
| Classification | Path | Path Coefficient | STDEV | T | p Values |
|---|---|---|---|---|---|
| H1-1 | MSP → WSB | 0.440 | 0.032 | 13.822 | 0.000 *** |
| H1-2 | MSP → MSB | 0.352 | 0.034 | 10.292 | 0 |
| H1-3 | MSP → WSP | 0.366 | 0.032 | 11.490 | 0 |
| H2-1 | MSB → WSB | 0.130 | 0.03 | 4.363 | 0 |
| H2-2 | MSB → WSP | 0.280 | 0.031 | 8.921 | 0 |
| H3 | WSP → WSB | 0.184 | 0.035 | 5.311 | 0 |
| H4-1 | Incentive → WSB | 0.083 | 0.028 | 2.967 | 0.003 |
| H4-2 | Incentive → WSP | 0.180 | 0.033 | 5.530 | 0 |
| H4-3 | Incentive → MSB | 0.226 | 0.032 | 6.965 | 0 |
| H4-4 | Incentive → MSP | 0.407 | 0.029 | 13.817 | 0 |
Disclaimer/Publisher’s Note: The statements, opinions and data contained in all publications are solely those of the individual author(s) and contributor(s) and not of MDPI and/or the editor(s). MDPI and/or the editor(s) disclaim responsibility for any injury to people or property resulting from any ideas, methods, instructions or products referred to in the content. |
© 2025 by the authors. Licensee MDPI, Basel, Switzerland. This article is an open access article distributed under the terms and conditions of the Creative Commons Attribution (CC BY) license (https://creativecommons.org/licenses/by/4.0/).
Share and Cite
Kim, M.-J.; Ahn, S.-P.; Shin, S.-H.; Kang, M.-G.; Won, J.-H. Comparison of Influencing Factors on Safety Behavior and Perception Between Contractor Managers and Subcontractor Workers at Korean Construction Sites. Buildings 2025, 15, 963. https://doi.org/10.3390/buildings15060963
Kim M-J, Ahn S-P, Shin S-H, Kang M-G, Won J-H. Comparison of Influencing Factors on Safety Behavior and Perception Between Contractor Managers and Subcontractor Workers at Korean Construction Sites. Buildings. 2025; 15(6):963. https://doi.org/10.3390/buildings15060963
Chicago/Turabian StyleKim, Min-Jun, Sang-Pyeong Ahn, Seung-Hyeon Shin, Min-Guk Kang, and Jeong-Hun Won. 2025. "Comparison of Influencing Factors on Safety Behavior and Perception Between Contractor Managers and Subcontractor Workers at Korean Construction Sites" Buildings 15, no. 6: 963. https://doi.org/10.3390/buildings15060963
APA StyleKim, M.-J., Ahn, S.-P., Shin, S.-H., Kang, M.-G., & Won, J.-H. (2025). Comparison of Influencing Factors on Safety Behavior and Perception Between Contractor Managers and Subcontractor Workers at Korean Construction Sites. Buildings, 15(6), 963. https://doi.org/10.3390/buildings15060963