Article

Study on the Bending-Shear Performance of Sandwich Insulation Composite Wall Panels with GFRP Connectors After Fatigue Damage

1
College of Hydraulic and Civil Engineering, Xinjiang Agricultural University, Urumqi 830052, China
2
College of Architectural Engineering, Jiaxing University, Jiaxing 314001, China
*
Author to whom correspondence should be addressed.
Buildings 2025, 15(7), 1004; https://doi.org/10.3390/buildings15071004
Submission received: 23 February 2025 / Revised: 18 March 2025 / Accepted: 19 March 2025 / Published: 21 March 2025
(This article belongs to the Section Building Structures)

Abstract

:
This study investigates the shear-bending performance of GFRP (Glass Fiber Reinforced Polymer) connectors in sandwich insulation composite wall panels following tension–compression fatigue damage. A total of 24 specimens, divided into 11 groups, were prepared for experimental analysis. Three distinct load amplitudes (5.4 kN, 4.0 kN, 2.7 kN) and three fatigue loading cycles (30,000, 50,000, 80,000) were established as loading conditions. The experimental protocol included out-of-plane tension–compression fatigue tests followed by post-fatigue shear-bending tests. The influence of varying load amplitudes and fatigue loading cycles on failure modes, load–displacement relationships, and bearing capacity alterations was systematically examined. A two-factor analysis of variance (ANOVA) was utilized to evaluate the statistical significance of these factors. The findings reveal that the predominant shear-bending failure modes post-fatigue damage are connector fracture and concrete crushing in the anchorage zone. Specifically, under a load amplitude of 2.7 kN and 30,000 cycles, the shear-bending capacity of the specimens exhibited a minimal reduction of 1.82% compared to the ultimate capacity of undamaged specimens. Conversely, at a load amplitude of 5.4 kN and 80,000 cycles, the shear-bending capacity experienced a substantial decline of 37.11%. Both load amplitude and fatigue loading cycles were found to significantly impact the shear-bending capacity, with fatigue loading cycles demonstrating a more pronounced effect. This research provides critical insights for the design and assessment of sandwich insulation composite wall panels, particularly in the context of long-term fatigue damage and its implications on structural performance, thereby contributing valuable theoretical and practical knowledge to the field.

1. Introduction

With the introduction of the “14th Five-Year Plan for Building Energy Efficiency and Green Building Development” [1], prefabricated “intelligent manufacturing” has become a new construction model in the building industry. In order to meet sustainable development goals and achieve the “dual carbon” targets, the government has strongly promoted the development of prefabricated buildings and raised higher requirements for building energy conservation and insulation. Exterior walls are an important part of the building thermal insulation system. They can be divided into three types. These types are based on where the insulation material is placed within the wall panel. The three types are external insulation, internal insulation, and sandwich insulation [2]. Sandwich insulation, which offers superior thermal insulation performance compared to internal insulation and higher fire resistance than external insulation has, therefore, garnered increasing attention from researchers. Prefabricated composite structures are a new type of composite structural system that integrates energy efficiency and seismic damping, offering excellent seismic performance [3,4]. The sandwich insulation composite exterior wall panel consists of a composite wall panel, insulation board, outer leaf panel, and connectors. The connectors are important load-bearing components of the prefabricated concrete sandwich insulation composite wall panel. They link the inner and outer concrete panels. They bear the self-weight of the outer leaf panel. They also bear the external loads applied to it [5]. Due to the unique structure and complex loading conditions of the sandwich insulation composite wall panel [6], the connectors must be arranged vertically within the concrete regions of the ribbed beams and ribbed columns, as shown in Figure 1.
In practical engineering applications, there are many types of connectors, but FRP (Fiber Reinforced Polymer) connectors have garnered significant attention from researchers due to their low thermal conductivity, excellent durability, high strength, and good fatigue performance [7]. FRP connectors are made from carbon fiber (CFRP), glass fiber (GFRP), and basalt fiber (BFRP), with GFRP being preferred for its lower cost. Additionally, owing to its excellent corrosion resistance, GFRP significantly reduces structural maintenance costs while enhancing durability and service life. For instance, in corrosive environments, GFRP connectors can last 2–3 times longer than traditional steel, thereby substantially reducing the overall lifecycle costs [8,9,10]. In recent years, numerous scholars both domestically and internationally have conducted studies on the mechanical properties of connectors. Considering the impact of connector type on the load-bearing performance of sandwich insulation wall panels, Dutta [11], Huang J. et al. [12], and Ki-Bong Choi et al. [13] have conducted bending and shear tests on sandwich insulation wall panels with various types of connectors, including groove, hexagonal, corrugated, plate-shaped, and FRP connectors. The results showed that the groove-shaped connectors exhibited the best shear performance. The diameter of the connectors affects their shear strength, and increasing the number of connectors significantly enhances the out-of-plane ultimate load-bearing capacity and stiffness of the wall. In addition, Peng et al. [14] and He Zhizhou et al. [15,16] have conducted shear tests on L-shaped, H-shaped, C-shaped, and I-shaped GFRP tie rods. The results indicated that the C-shaped tie rods exhibited greater stiffness and load-bearing capacity. Some scholars have conducted experimental studies on GFRP connectors. The results indicate that under cyclic loading, GFRP connectors exhibit better strength compared to conventional connectors. Furthermore, GFRP offers superior advantages in weight reduction, tensile performance, and durability compared to other materials [17,18,19]. Cox B [20] investigated the shear performance of GFRP connectors in insulated sandwich wall panels. The results demonstrated that GFRP connectors exhibit excellent performance under both static and cyclic loading conditions.
However, from the perspective of engineering safety, it is essential to comprehensively consider the impact of various factors on the structural load-bearing capacity. Based on this, some researchers have investigated the influence of factors such as fatigue damage on structural load-bearing capacity [21,22,23,24]. Some scholars studied the mechanical properties of steel structures after fatigue damage. They found that fatigue damage accumulates over different loading cycles. They also found that the magnitude of the fatigue load significantly affects structural deformation and failure modes [22,25]. It was also observed that the tensile strength of steel structures decreases significantly with an increase in the number of fatigue cycles [26,27,28,29,30]. Considering the significant impact of fatigue load and cycle numbers on structural failure modes and load-bearing capacity, Xu et al. [31] conducted fatigue tests on FRP concrete beams. The results showed that under fatigue loading, as the load amplitude increased, the slip displacement rapidly increased during the early stages of fatigue loading. With the increase in the number of fatigue cycles, the rate of slip displacement growth stabilized. However, when the specimen failed, the slip displacement increased sharply. After fatigue, the ultimate tensile strength of the GFRP reinforcement decreased by 4.5% to 32.3%. Deng [32] and Wang [33] also conducted fatigue tests on shear connectors in steel–concrete composite beams. Their results indicated that with the increase in the number of cycles, the load-bearing capacity of the connectors exhibited a nonlinear degradation trend, initially slow and then rapid. The specimens’ deformation recovery ability gradually decreased, and their stiffness deteriorated over time. It is evident that fatigue damage has a significant impact on structural mechanical performance. Therefore, studying the mechanical properties of structures after damage is essential to ensure their durability and safety.
In prefabricated composite structural systems, the repeated application of external wind loads over time can lead to fatigue damage within the structure, which in turn affects the overall safety and durability of the structure. Based on this, this study designed and fabricated 11 sets of specimens. These specimens were used for fatigue tests and static tests after fatigue damage. The study considered the effects of fatigue load amplitude and fatigue loading cycles. These effects on the failure modes, load–displacement behavior, and load-bearing capacity degradation of the specimens were analyzed. A two-factor analysis of variance was conducted to determine the primary influencing factors on the bending-shear load-bearing capacity of the GFRP connectors in the sandwich insulation composite wall panels. This study reveals the significant impact of the number of cyclic loading cycles on the bending-shear capacity of GFRP connectors. It quantifies the influence of loading parameters, providing a scientific basis for engineering design and optimization.

2. Experimental Investigation

The objective of this section is to provide detailed information about the specimens, including the quantity, identification numbers, and dimensions of the specimens.

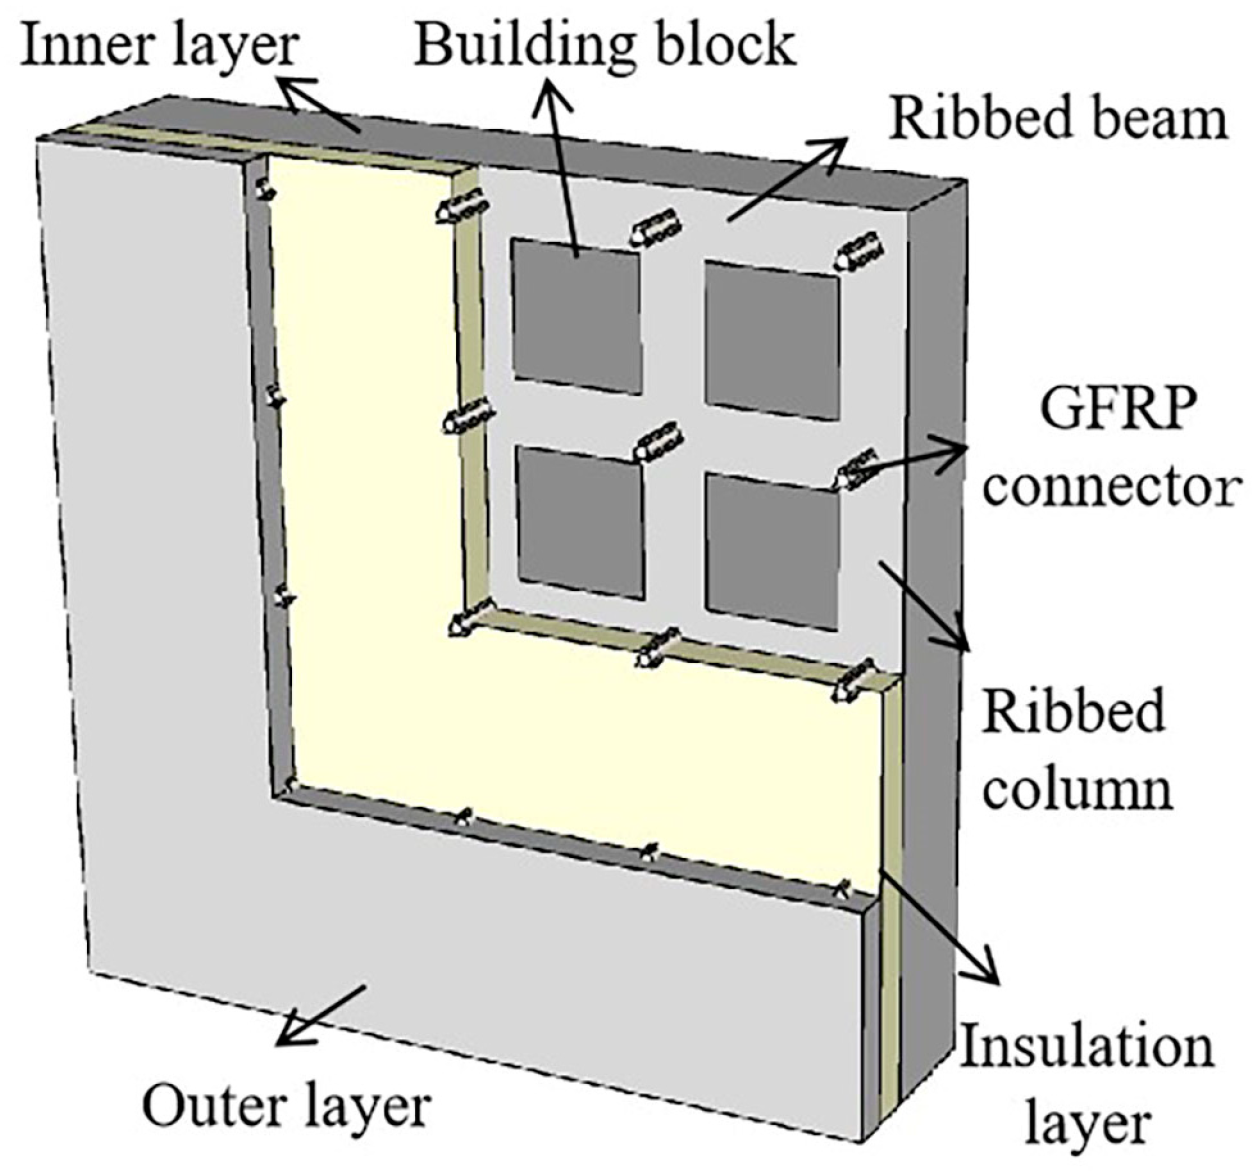
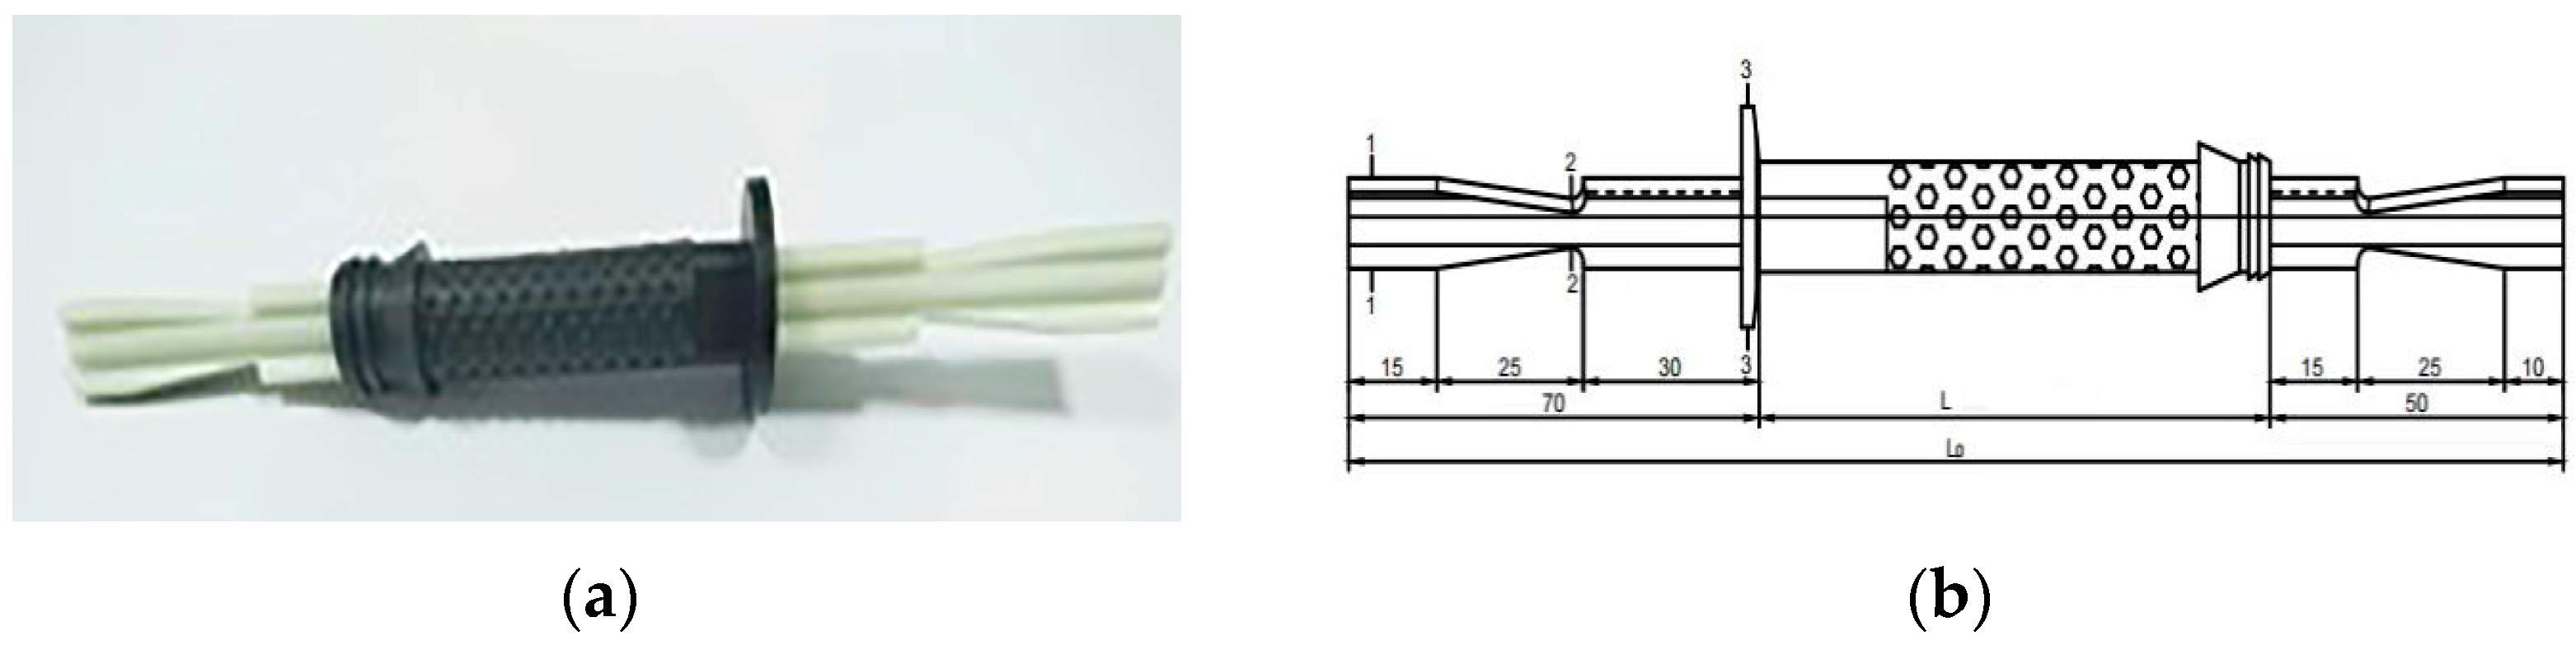
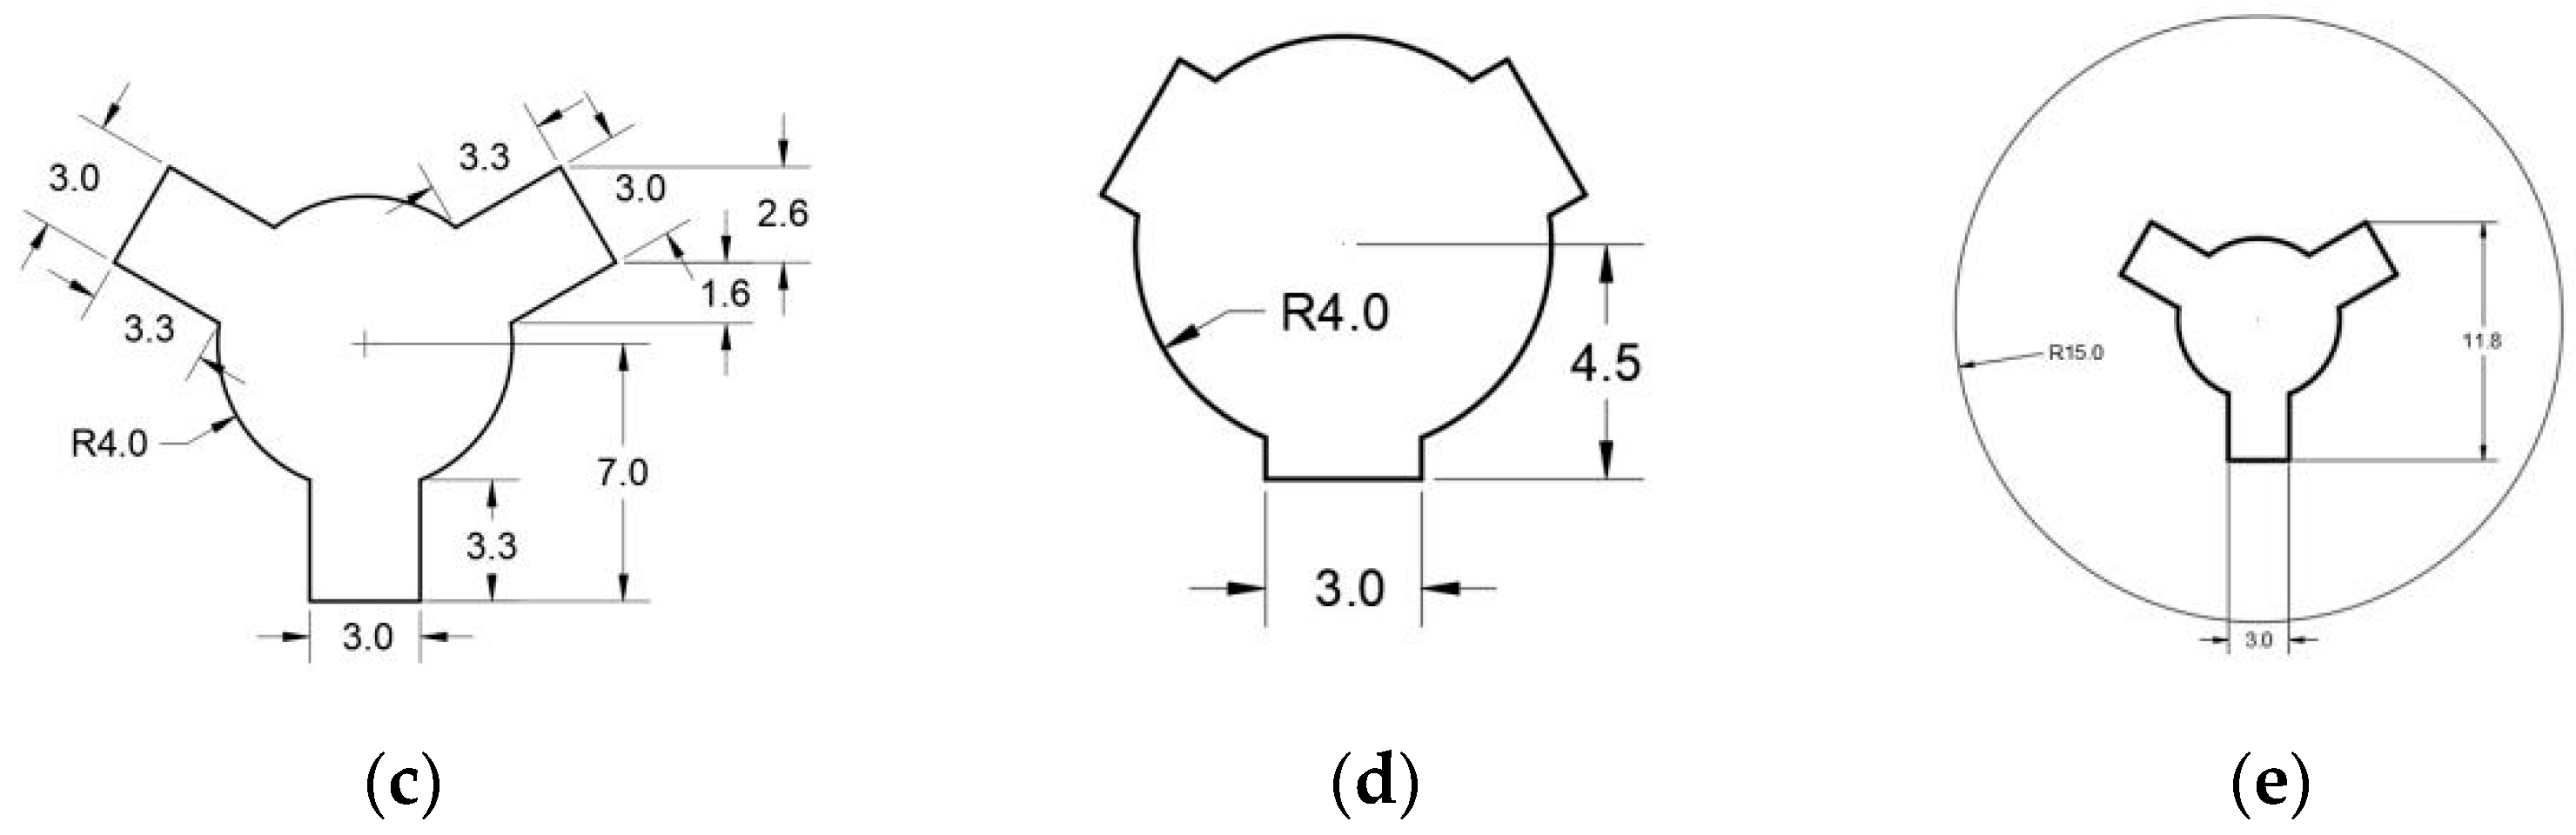
2.1. Specimen Design

The experiment included a total of 24 sandwich insulation composite wall panel GFRP connector specimens, divided into 11 sets. Among these, one set (LS-1, LS-2, LS-3) was used for uniaxial tensile tests, and another set (ZJ-1, ZJ-2, ZJ-3) was designated for bending-shear tests. The remaining nine sets, comprising 18 specimens, were subjected to fatigue damage under varying numbers of loading cycles without failure. These specimens were labeled as follows: PS1-A-1/2, PS1-B-1/2, PS1-C-1/2, PS2-A-1/2, PS2-B-1/2, PS2-C-1/2, PS3-A-1/2, PS3-B-1/2, and PS3-C-1/2. Here, PS1, PS2, and PS3 represent load amplitudes of 5.4 kN, 4.0 kN, and 2.7 kN, respectively, while A, B, and C denote 30,000, 50,000, and 80,000 loading cycles, respectively.
The dimensions of all specimens in the above groups are identical. The dimensions of the components are as follows: Outer leaf concrete panel: 500 mm × 500 mm × 60 mm; Insulation board: 500 mm × 500 mm × 70 mm; Inner leaf concrete panel: 500 mm × 500 mm × 200 mm; Block dimensions: 100 mm × 100 mm × 200 mm. Each specimen is equipped with a single tie rod inside. The specimen dimensions and reinforcement details are shown in Figure 2 and Figure 3.

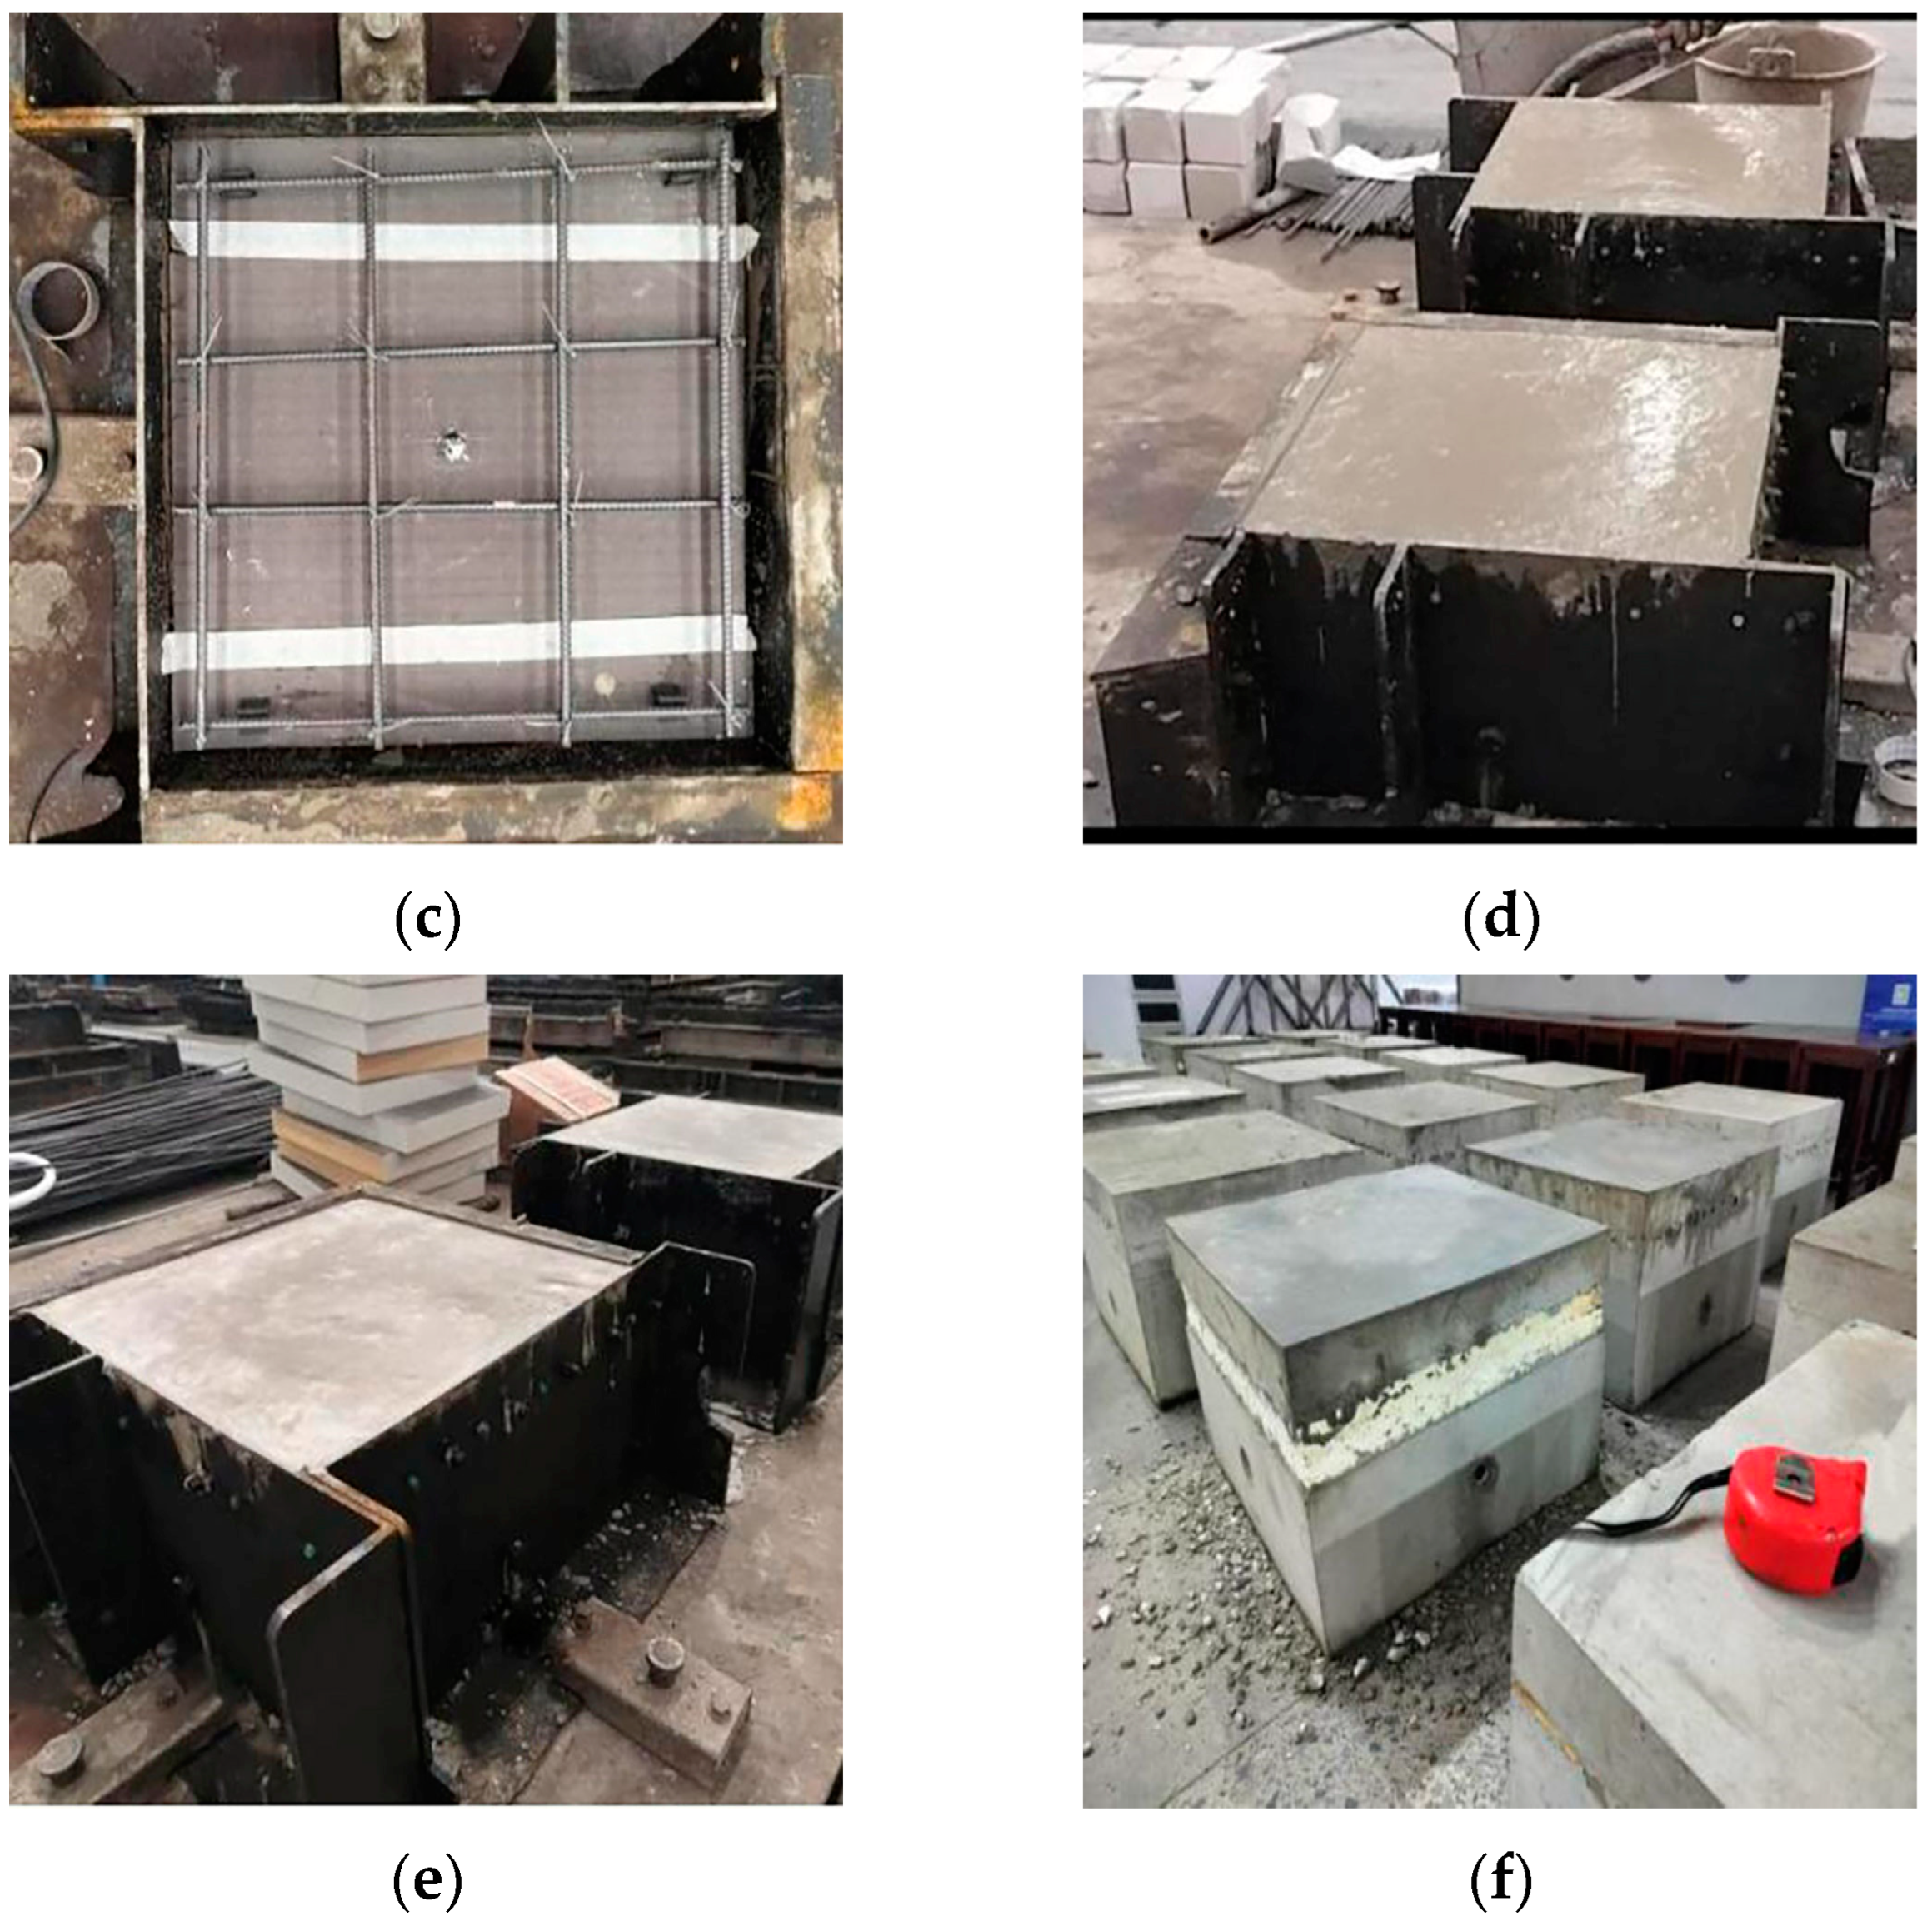
2.2. Specimen Fabrication

The sandwich insulation composite wall panel GFRP connector specimens used in this experiment were all from the same batch, processed and fabricated by Jin Xiao New Materials Technology Co., Ltd., Zhejiang, China. The inner and outer leaf panels of the specimens were made from C30 concrete. The steel mesh in the outer leaf panel and the steel reinforcement cage in the inner leaf panel both used HRB400-grade steel bars with a diameter of 8 mm, and the stirrups were made of HRB400-grade steel bars with a diameter of 6 mm. The connectors were GFRP rod-type commercial connectors produced by Nanjing Sibell Company (Nanjing, China), and the insulation board was made from polyurethane material. The detailed reinforcement of the specimens is shown in Figure 2, and the fabrication process is illustrated in Figure 4.
During the preparation of the specimens, a set of standard concrete cubes measuring 150 mm × 150 mm × 150 mm was fabricated from the same batch of concrete material, adhering to the standard. Both the test specimens and the concrete cubes were cured under the same conditions for 28 days to evaluate the mechanical properties of the concrete. A universal testing machine was utilized to assess the mechanical properties of the steel reinforcement and connector materials. The testing procedures for the steel reinforcement were conducted in accordance with the specifications. Tensile strength was determined following the guidelines, and the tensile modulus of the connectors was measured using the same standard. For the shear strength evaluation, the three-point bending method was employed: specimens were placed on unconstrained supports and subjected to three-point bending until failure at a constant loading rate. Throughout the loading process, the applied load was meticulously monitored and recorded to establish the relationship between shear strength, stress, and strain. The mechanical properties of the materials used in the specimens are listed in Table 1, Table 2 and Table 3.

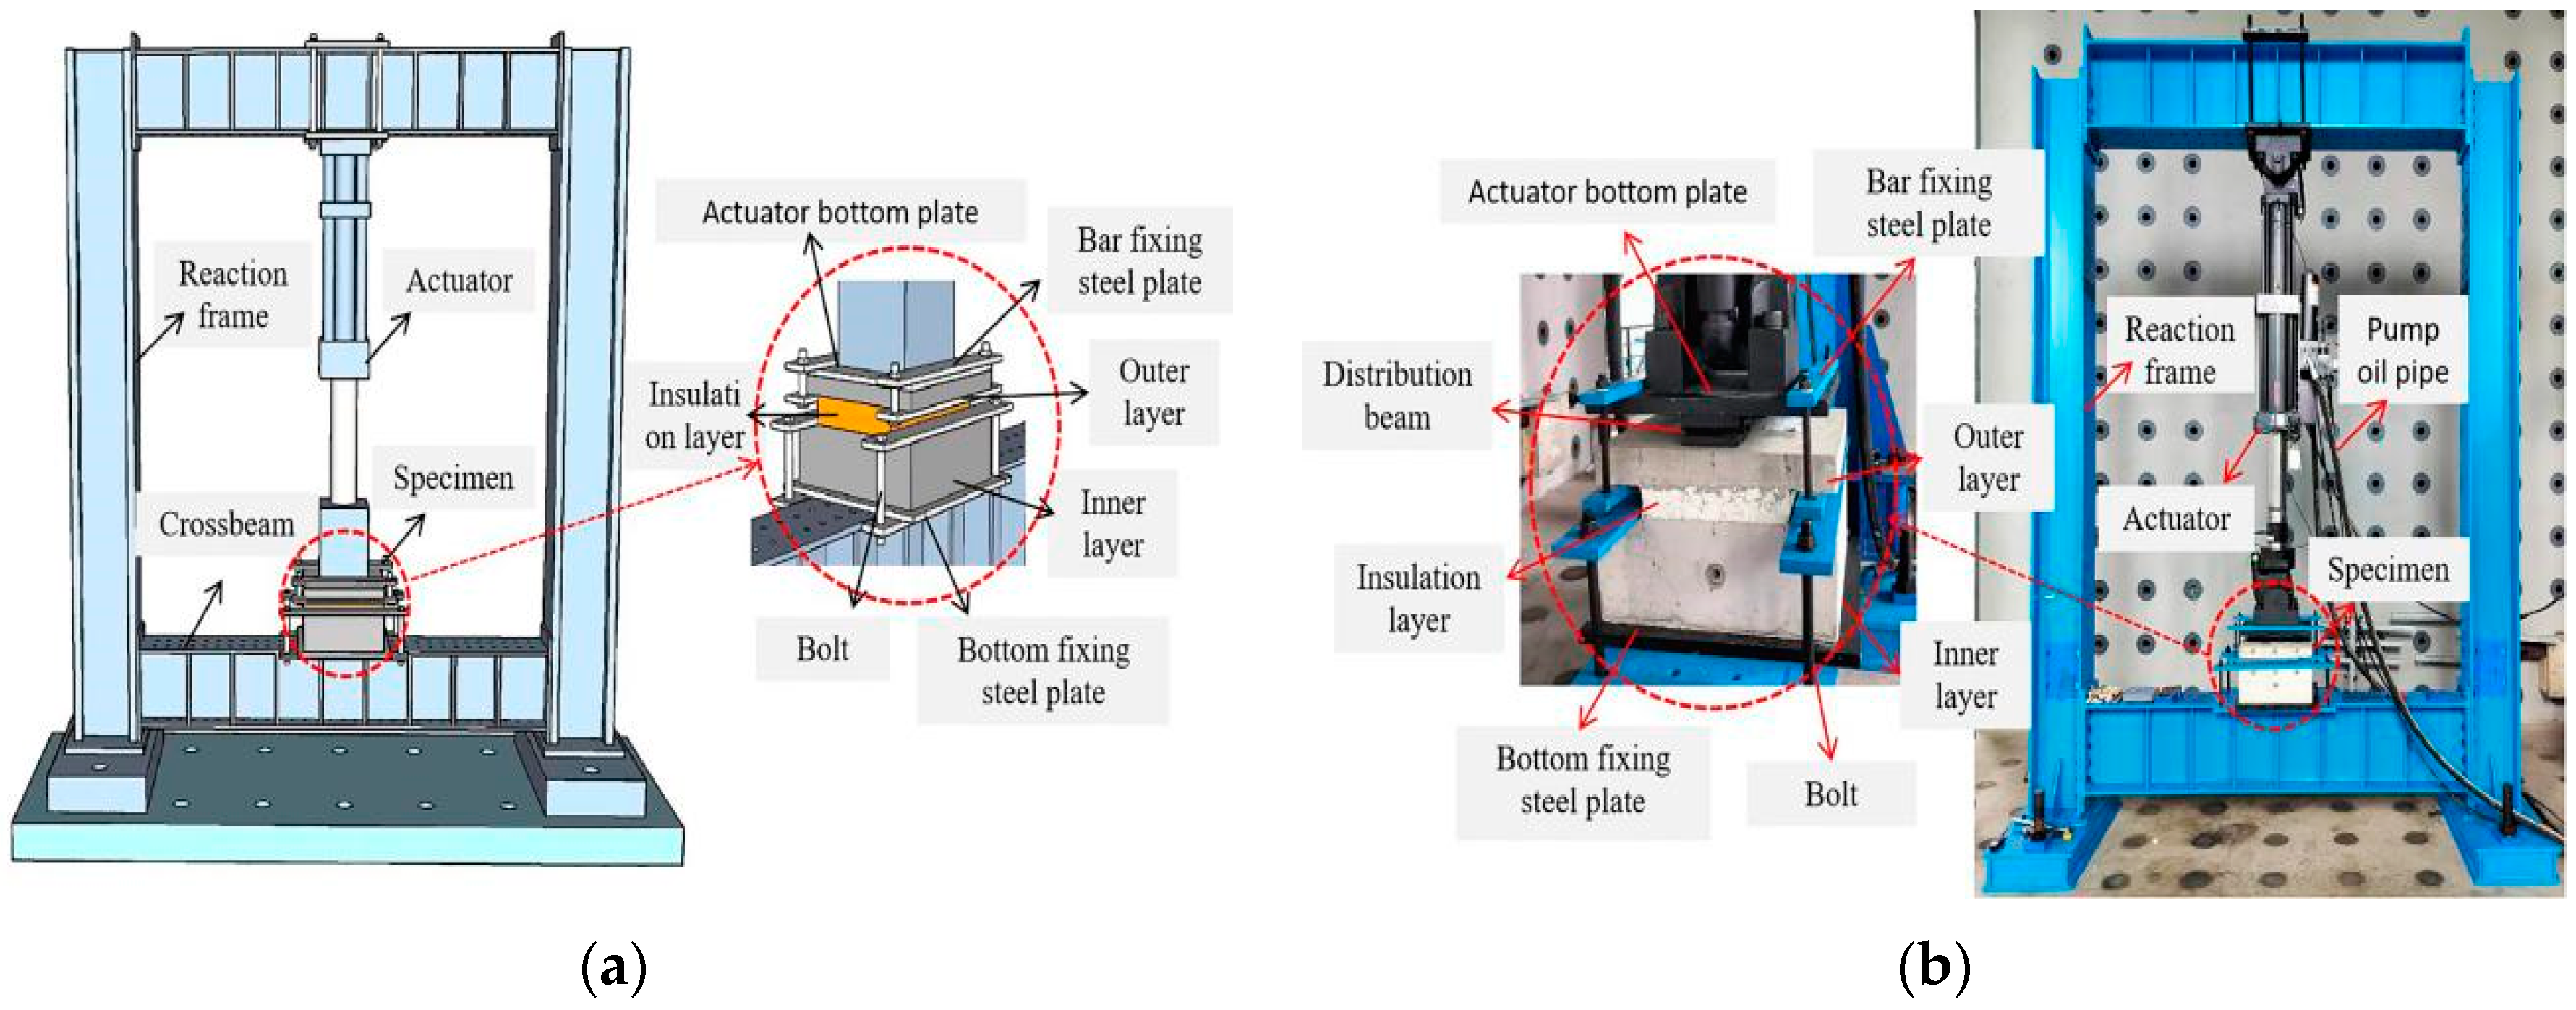
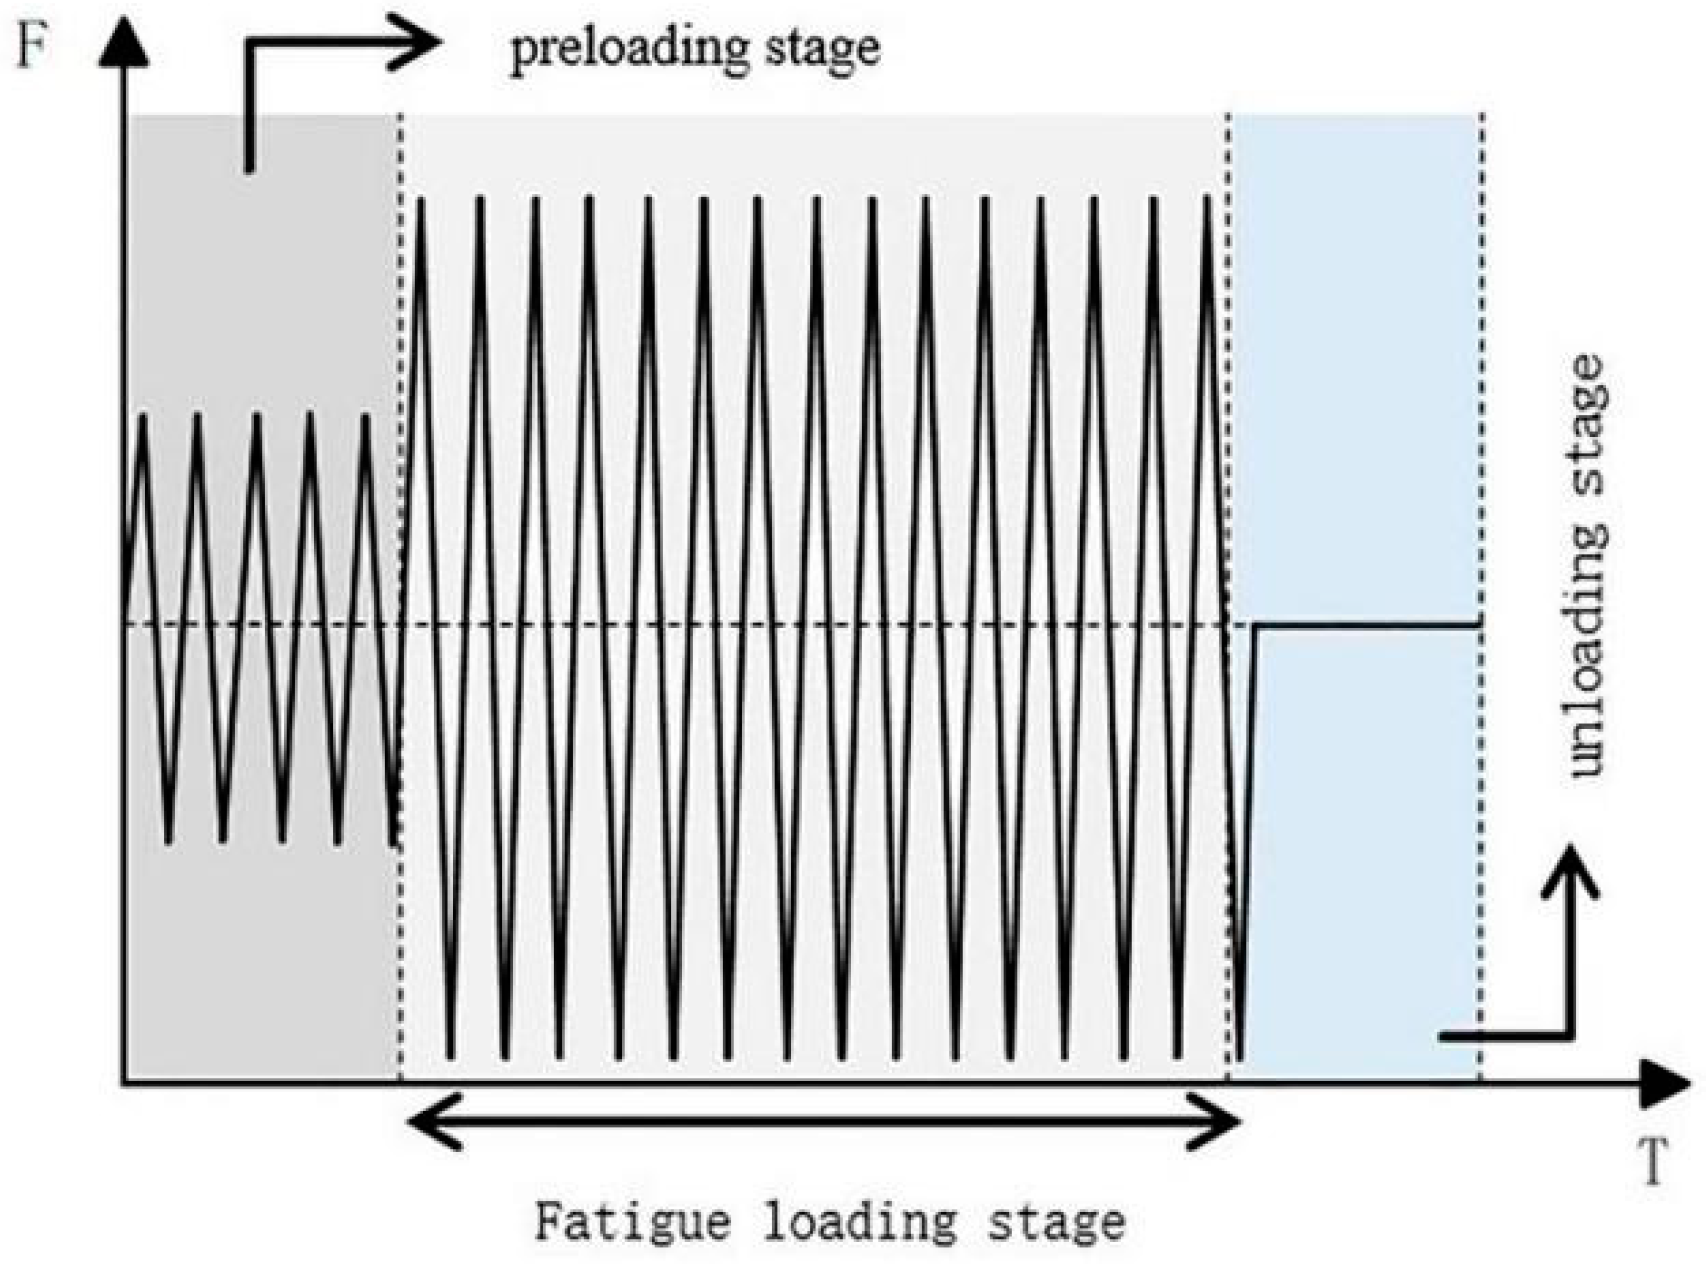
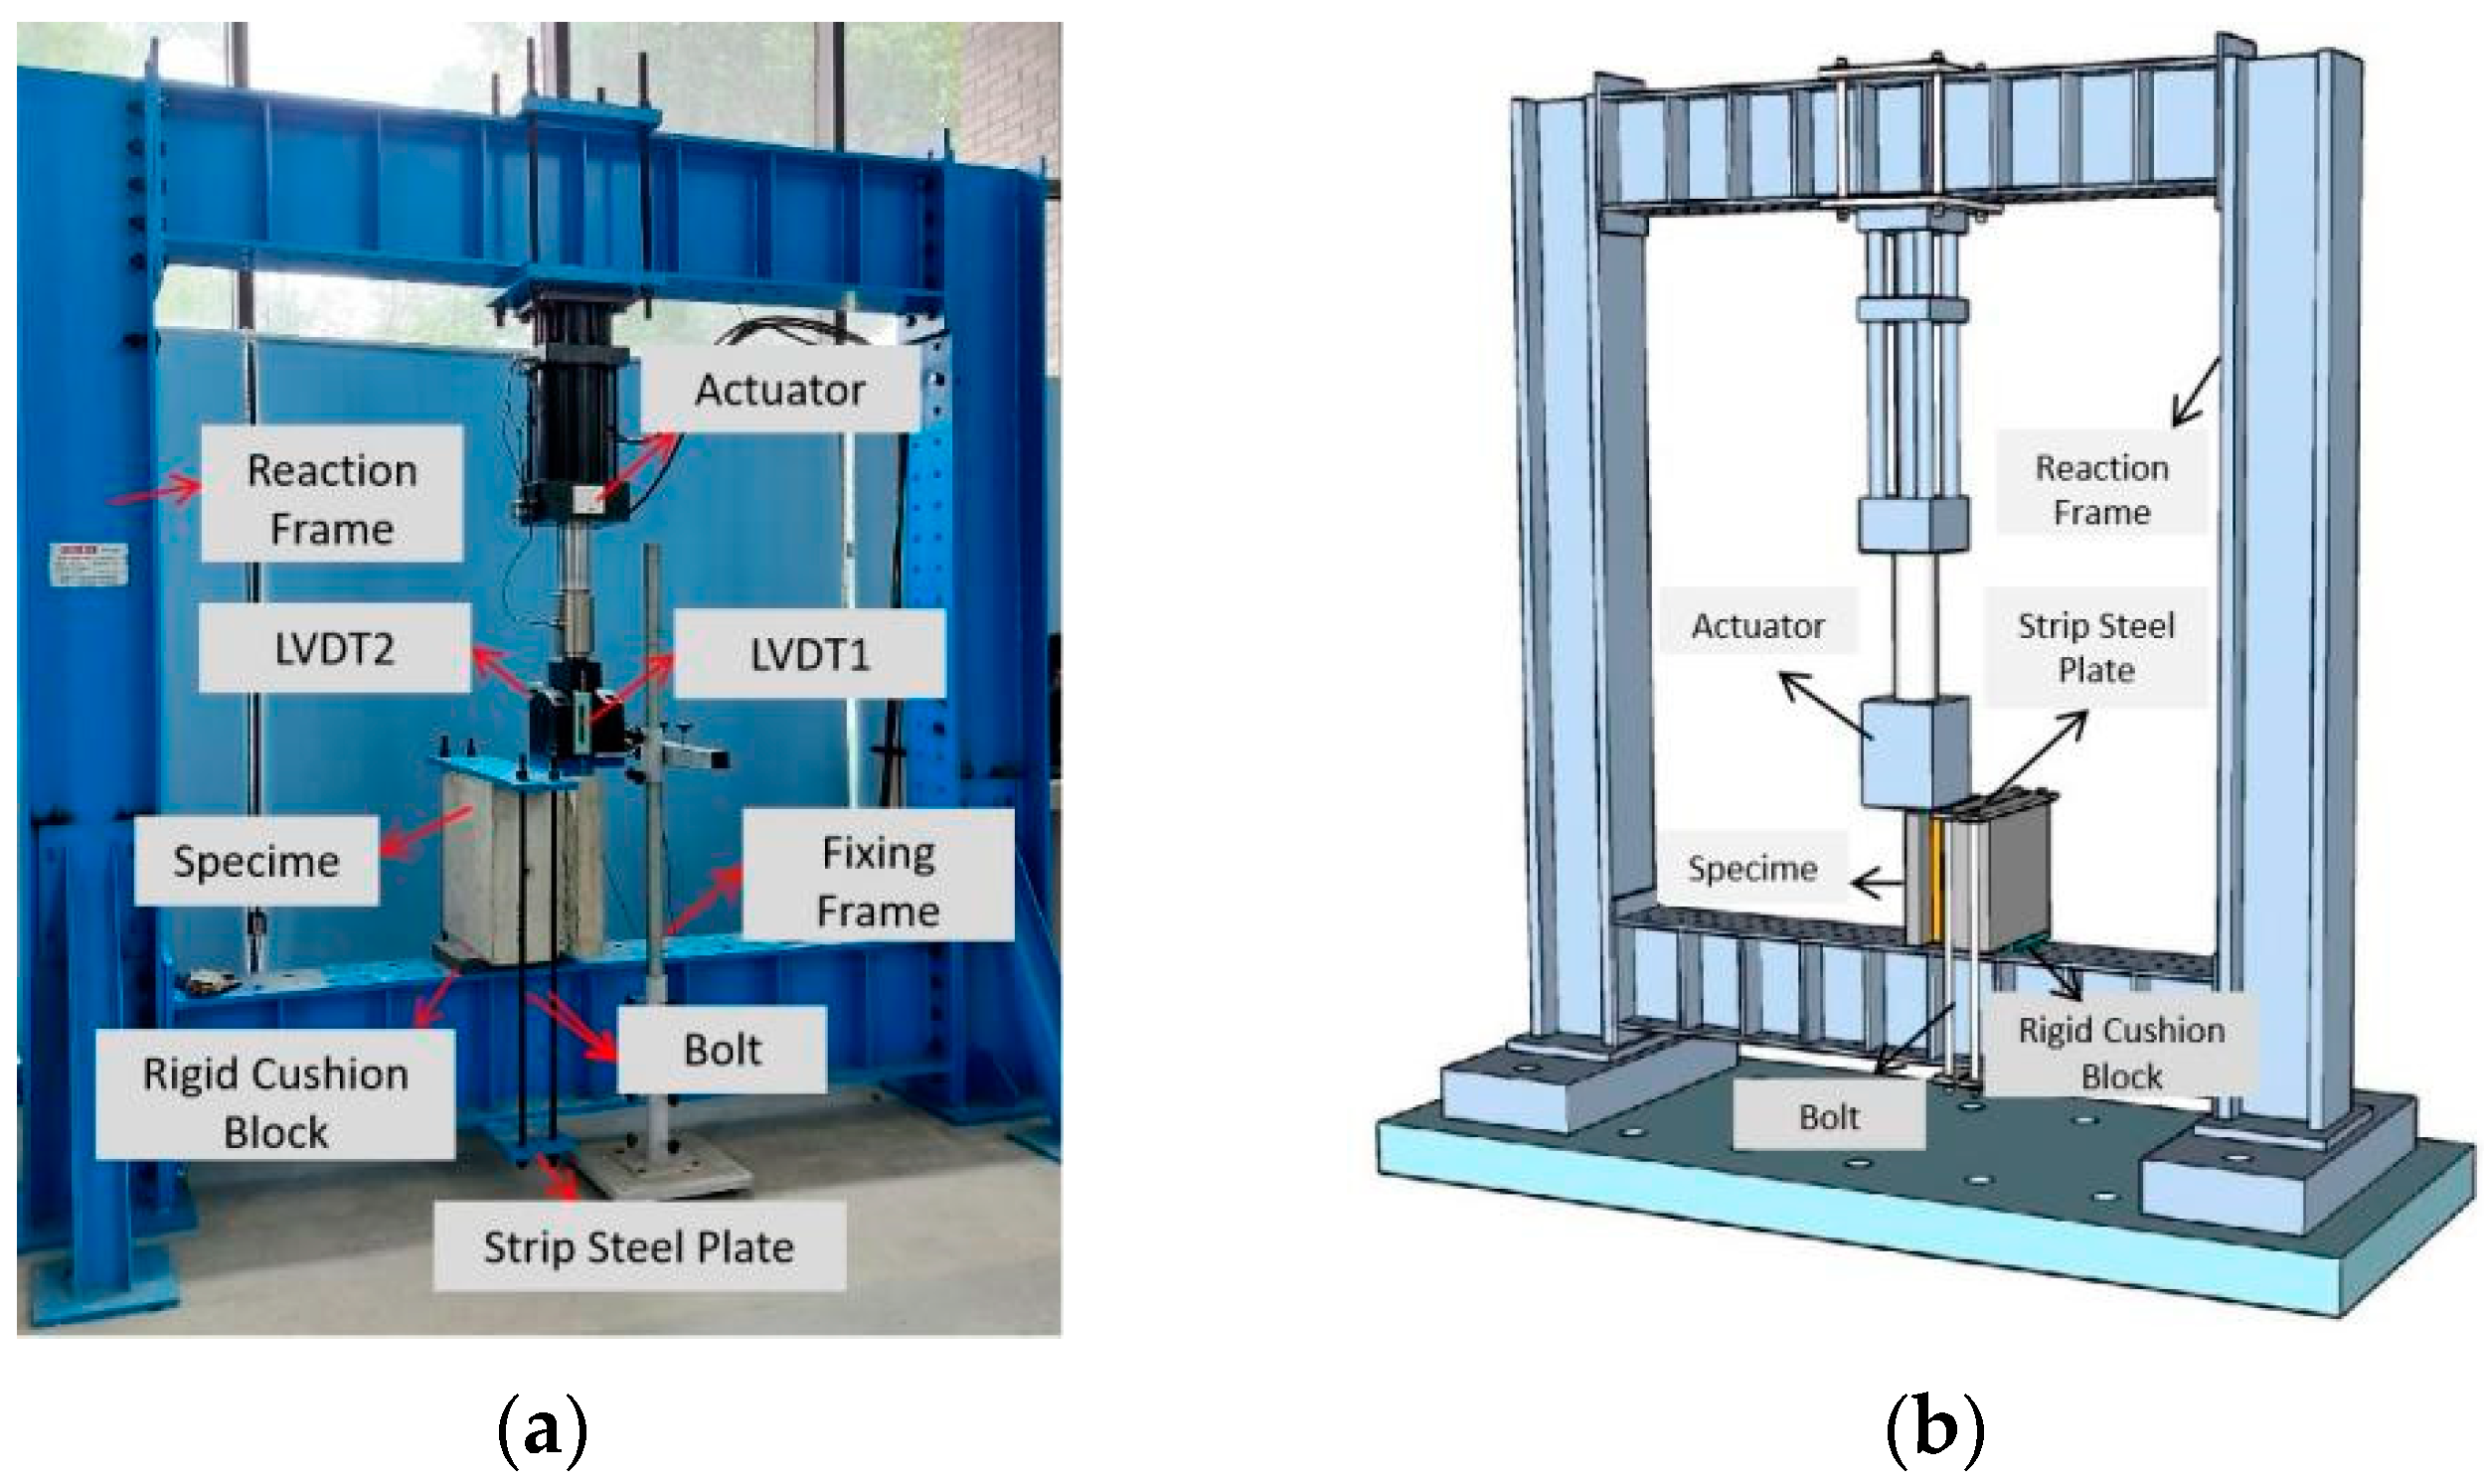
2.3. Experimental Loading Scheme

Both the uniaxial tensile and fatigue tests were conducted using an MTS (50 T) electro-hydraulic servo structural loading system (Eden Prairie, MN, USA) with a stroke of ±250 mm, as shown in Figure 5.
Before conducting the uniaxial tensile tests, specimens LS-1 to LS-3 were pre-loaded. Then, a stepwise loading method was used, with each step increasing by 1 kN at a rate of 0.1 kN/s, until the specimen failure was observed, at which point loading was stopped. The primary aim was to determine the specimen’s ultimate load-bearing capacity, Fy. The maximum fatigue loading value Pmax was set to 0.4 Fy, 0.6 Fy, and 0.8 Fy, and the minimum value Pmin was taken as 0.1 Pmax [34], from which the fatigue loading amplitude Pd was determined. Once the fatigue load amplitudes Pd1, Pd2, and Pd3 were defined, specimens PH-1 to PH-3 underwent sinusoidal wave loading at a frequency of 5 Hz until failure, measuring the fatigue life Nf of the specimens under different fatigue loads.
To assess the damage level of specimens under the same fatigue load amplitude but different loading cycles, specimens PS1-A-1/2 to PS3-A-1/2, PS1-B-1/2 to PS3-B-1/2, and PS1-C-1/2 to PS3-C-1/2 were subjected to 30,000, 50,000, and 80,000 cycles, respectively. Following these cycles, the nine sets of specimens were statically loaded until failure. The loading regime is shown in Figure 6, and the static loading test conditions after damage are provided in Table 4.
The unidirectional bending-shear tests and the bending-shear tests after fatigue damage were both conducted using a 20 T electro-hydraulic servo loading system, with force-displacement hybrid control. During the initial phase of loading, force control was used, with a loading rate of 1 kN per step at 0.1 kN/s. Once the displacement of the specimen reached approximately 3 mm, the loading mode was switched from force control to displacement control. Under displacement control, a stepwise loading method was again applied. Before the specimen reached its peak load, the loading rate was 0.5 mm per step at 1 mm/min. After the specimen reached its peak load, the loading rate was increased to 1 mm per step at 1 mm/min. After each loading step, the specimen was held for 5 min before proceeding to the next step, continuing until failure. In the analysis of the load–displacement curves of the specimens, the average values of the two displacement gauges at the top of the outer leaf panel were used. The experimental environment and loading method are shown in Figure 7.

3. Specimen Failure and Failure Characteristics Analysis

The objective of this section is to provide detailed information on the failure characteristics of GFRP connector specimens in sandwich insulation composite wall panels under different loading conditions.

3.1. Static Load Failure Characteristics

3.1.1. Uniaxial Tensile Failure

The failure modes of the uniaxial tensile specimens LS-1 to LS-3 are shown in Figure 8. For the sandwich insulation composite wall panel GFRP connector specimens, initial failure occurred with slight cracking between the insulation board and the concrete panel. As the load gradually increased, the insulation board and the concrete panel completely debonded. Observations of the final failure mode revealed that the failure was characterized by the GFRP connector being pulled out from the concrete panel.

3.1.2. Unidirectional Bending-Shear Failure

The failure modes of the unidirectional bending-shear specimens ZJ-1 to ZJ-3 are shown in Figure 9.
At the beginning of the loading, cracking occurred between the insulation board and the concrete panel. As the load continued to increase, the cracks between the insulation board and the concrete panel gradually expanded. When the specimen reached its peak load capacity, displacement control was applied. On one side parallel to the loading direction, the insulation board tore, forming a 45° diagonal crack. After the test, the insulation board in the center of the specimen was removed, and it was directly observed that the main failure mode of the specimen was the connector being sheared off directly at the anchorage.

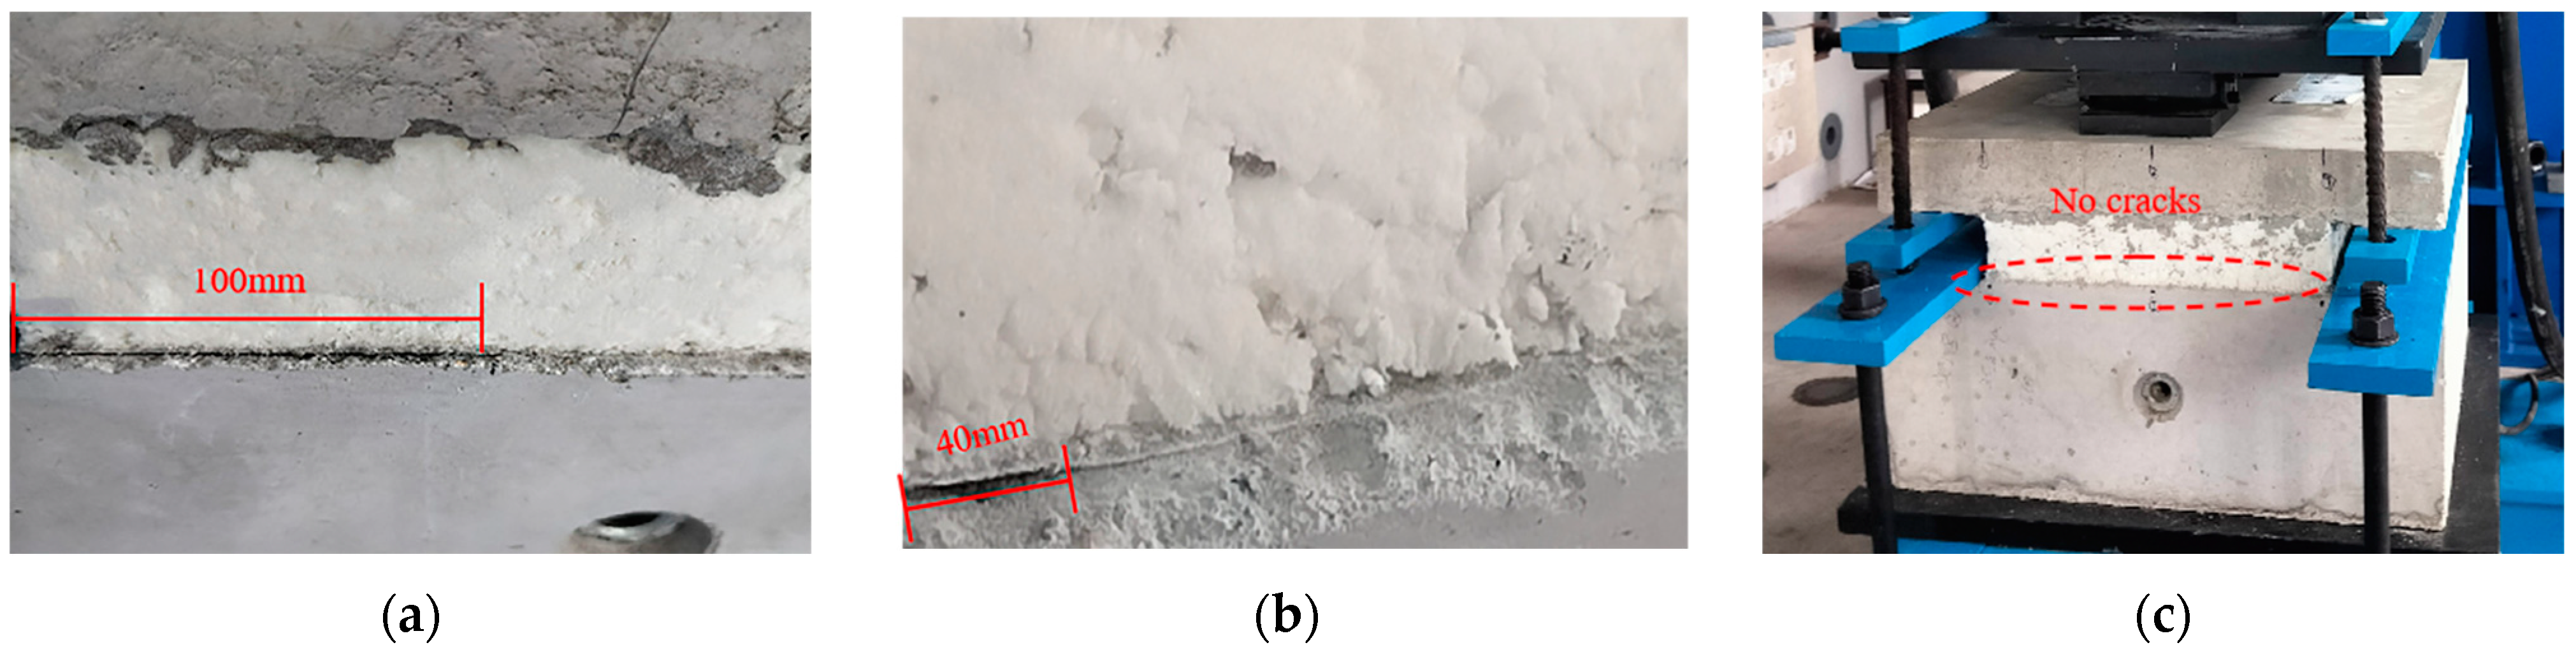
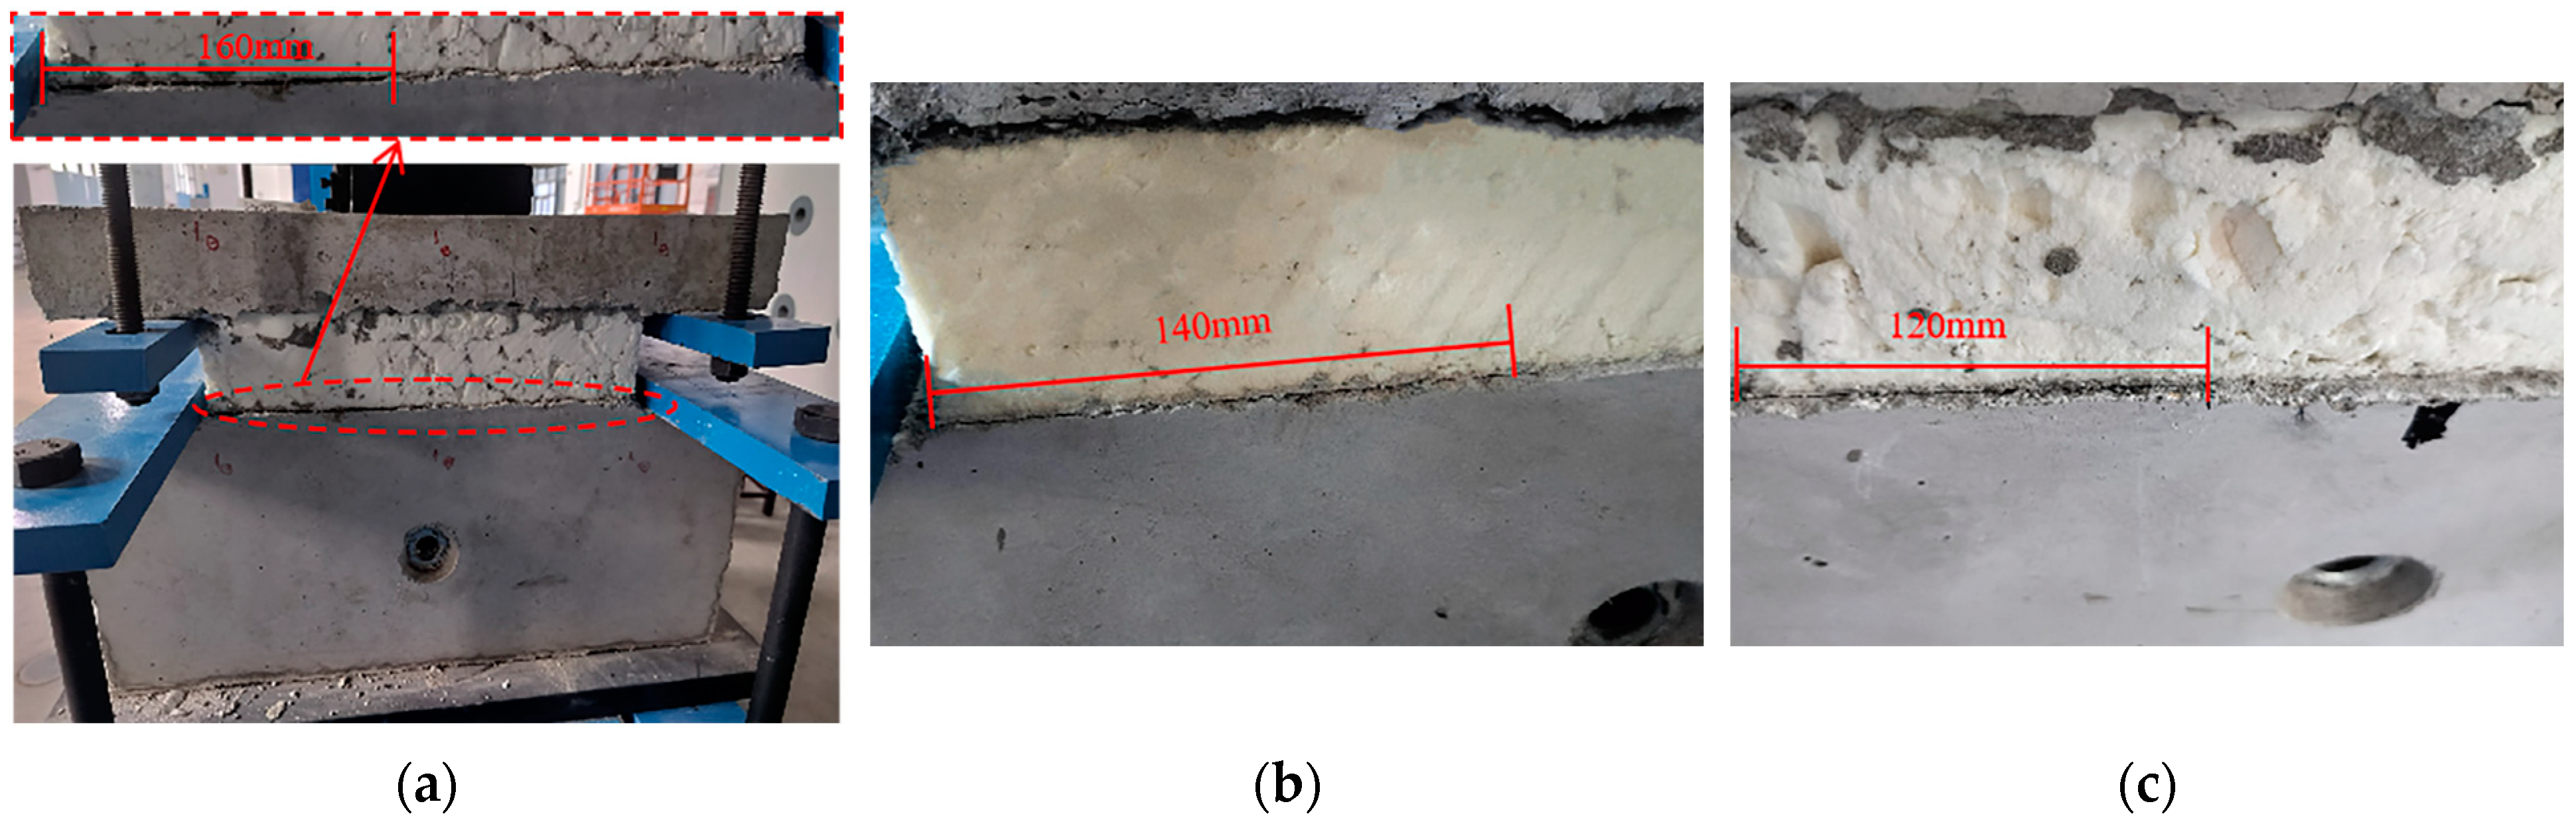
3.2. Fatigue Damage Characteristics

Figure 10, Figure 11 and Figure 12 show the fatigue damage characteristics of the sandwich insulation composite wall panel GFRP connectors after different load amplitudes and cyclic loading counts. In the following figures, all specimens have not failed after completing the prescribed number of cycles.
From Figure 10, it can be seen that after 30,000 cycles of loading, the specimen PS3-A with a load amplitude of 2.7 kN showed almost no obvious signs of damage. However, after 80,000 cycles, the specimen PS1-C with a load amplitude of 5.4 kN exhibited cracking between the insulation board and the concrete panel, with the crack fully penetrating. By comparing Figure 11b with Figure 12a, it can be observed that the length of the damage crack is nearly the same for both specimens, despite undergoing different numbers of cycles. From Figure 10, Figure 11 and Figure 12, it can be concluded that under the same load amplitude, the longer the number of cycles, the larger the crack length between the insulation board and the concrete panel. On the other hand, for the same number of cycles, the greater the load amplitude, the faster the crack propagation rate in the specimen.

3.3. Static Load Failure Characteristics After Fatigue Damage

Figure 13 illustrates the bending-shear failure mode of specimens following fatigue damage. Under conditions of low-load amplitude and limited cycle numbers, the specimens demonstrate failure characteristics comparable to those observed in undamaged specimens during shear failure. Specifically, both cases exhibit connector shear failure with characteristically smooth fracture surfaces, as clearly depicted in Figure 13b,c. At a load amplitude of 5.4 kN, Figure 13a,d,g present the bending-shear failure modes of specimens after completing the specified loading cycles. These specimens consistently show two distinct failure characteristics: connector pull-out from the concrete and crushing of the anchorage zone concrete. Figure 13f specifically illustrates the failure mode of specimen PS3-B, which exhibits connector fracture with an irregular surface morphology. Notably, three other specimens—PS2-B and PS2-C at 4.0 kN, and PS3-C at 2.7 kN—demonstrate similar failure patterns, primarily characterized by connector splitting. The observed variation in failure modes primarily results from differences in pre-existing fatigue damage levels before vertical bending-shear testing. Experimental evidence confirms that both fatigue test parameters—load amplitude and number of loading cycles—influence the post-damage static load failure mode. However, the load amplitude appears to exert a more substantial influence on the ultimate failure mode.

4. Experimental Results and Analysis

The objective of this section is to present the comprehensive test results of all specimens. This includes the analysis and calculation of the degree of damage to the specimens, as well as an analysis of the patterns in the changes in their load-bearing capacity.

4.1. Unidirectional Test Results

4.1.1. Unidirectional Tensile Ultimate Load Capacity

Figure 14 illustrates the uniaxial tensile ultimate bearing capacity characteristics of GFRP connectors in sandwich insulation composite wall panels. The load–displacement curve of the specimen exhibits three distinct phases. Phase I (0–1 mm displacement range): Before reaching 13 kN, the specimen demonstrates typical linear elastic behavior, where the load is proportional to displacement. During this phase, the displacement change remains relatively small, primarily corresponding to the cracking process of the insulation board and concrete panel. Phase II (1–15 mm displacement range): Within the load range of 13–15 kN, the specimen enters the plastic development stage. As the load increases, the displacement grows significantly, exhibiting pronounced nonlinear characteristics. At 15 kN, the specimen reaches its ultimate bearing capacity. Phase III (post-15 mm displacement range): This phase is characterized by softening behavior, showing a negative correlation between load and displacement. As the displacement continues to increase, the load gradually decreases and cannot regain the peak load, ultimately leading to complete failure of the specimen.

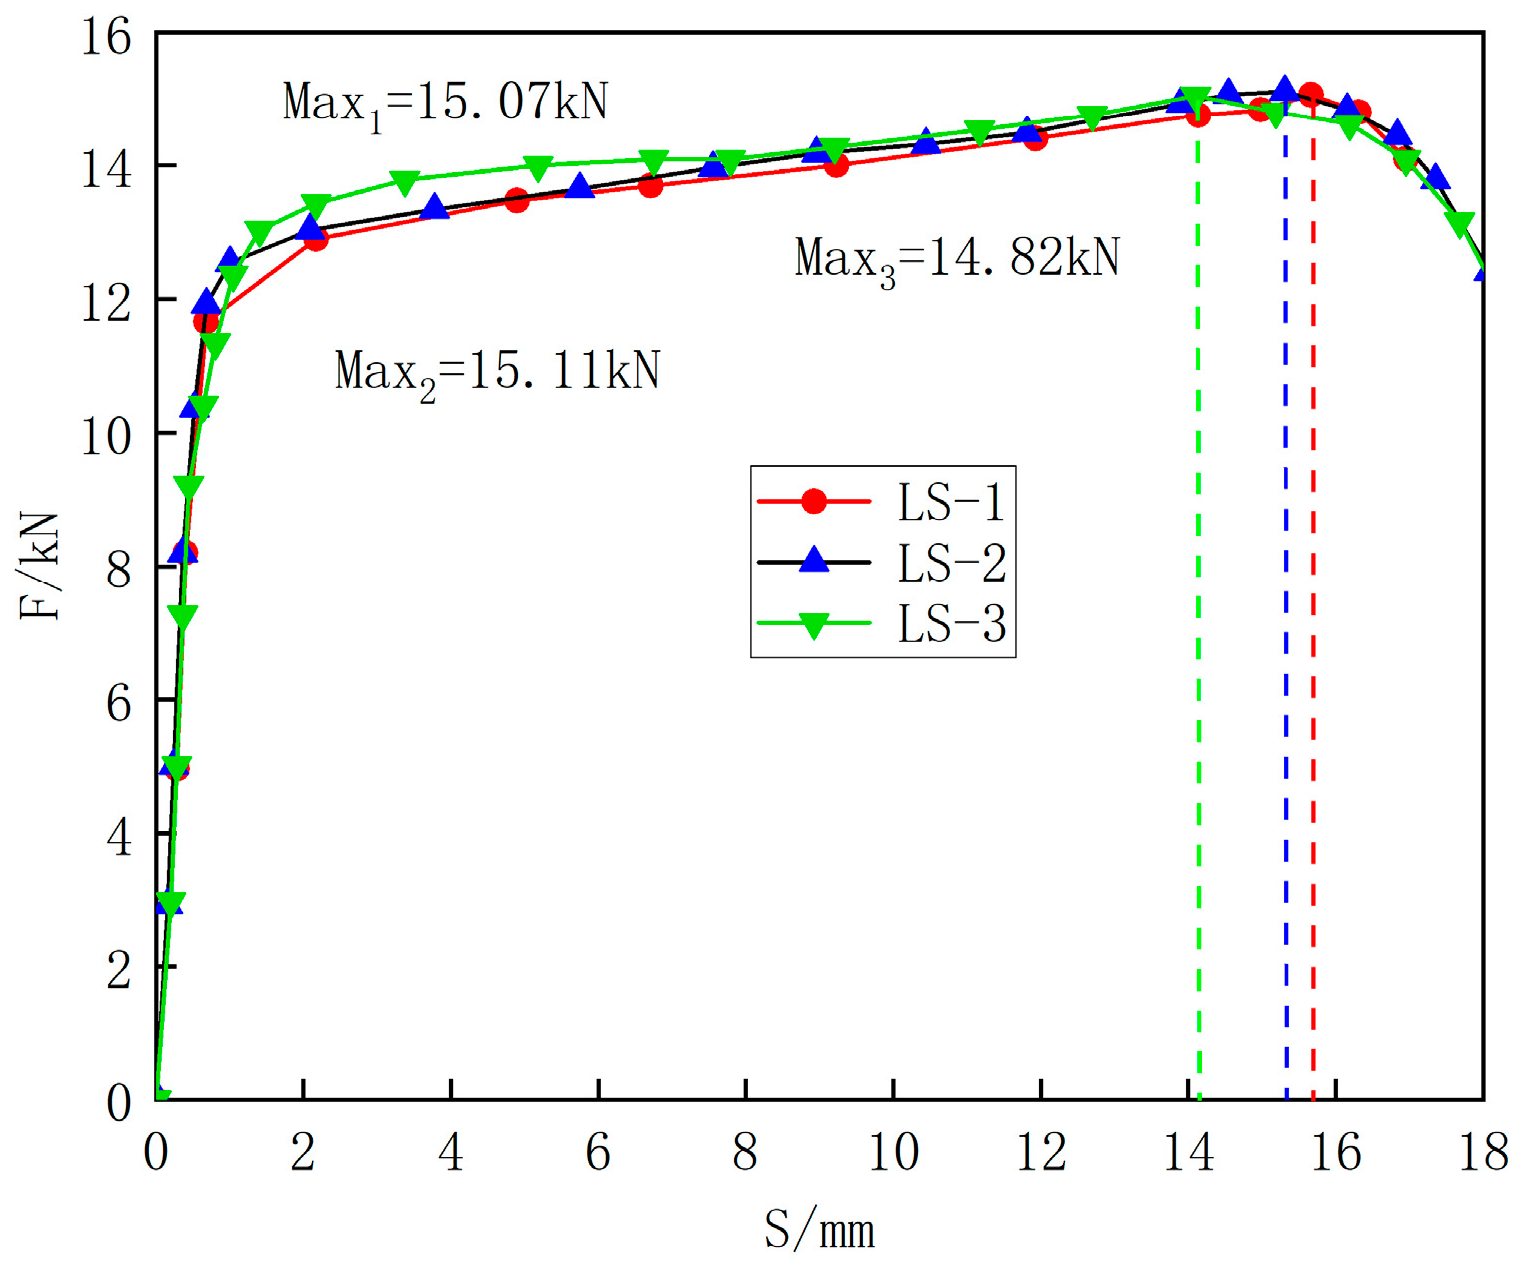
4.1.2. Unidirectional Bending-Shear Ultimate Load Capacity

The load capacity of the sandwich-insulated composite wallboard GFRP connector without fatigue damage is shown in Figure 15. Direct bending-shear tests were conducted on specimens ZJ-1 to ZJ-3, and the average ultimate load capacity of the specimens without fatigue damage was measured to be 9.35 kN. Before reaching the peak load, the load capacity and displacement are positively correlated. During this stage, the load is primarily carried by the bond between the insulation board and the concrete, as well as by the connector. After reaching the peak load, although the insulation board and concrete panels have not completely debonded, the external load is mainly carried by the connector.

4.2. Fatigue Damage Test Results

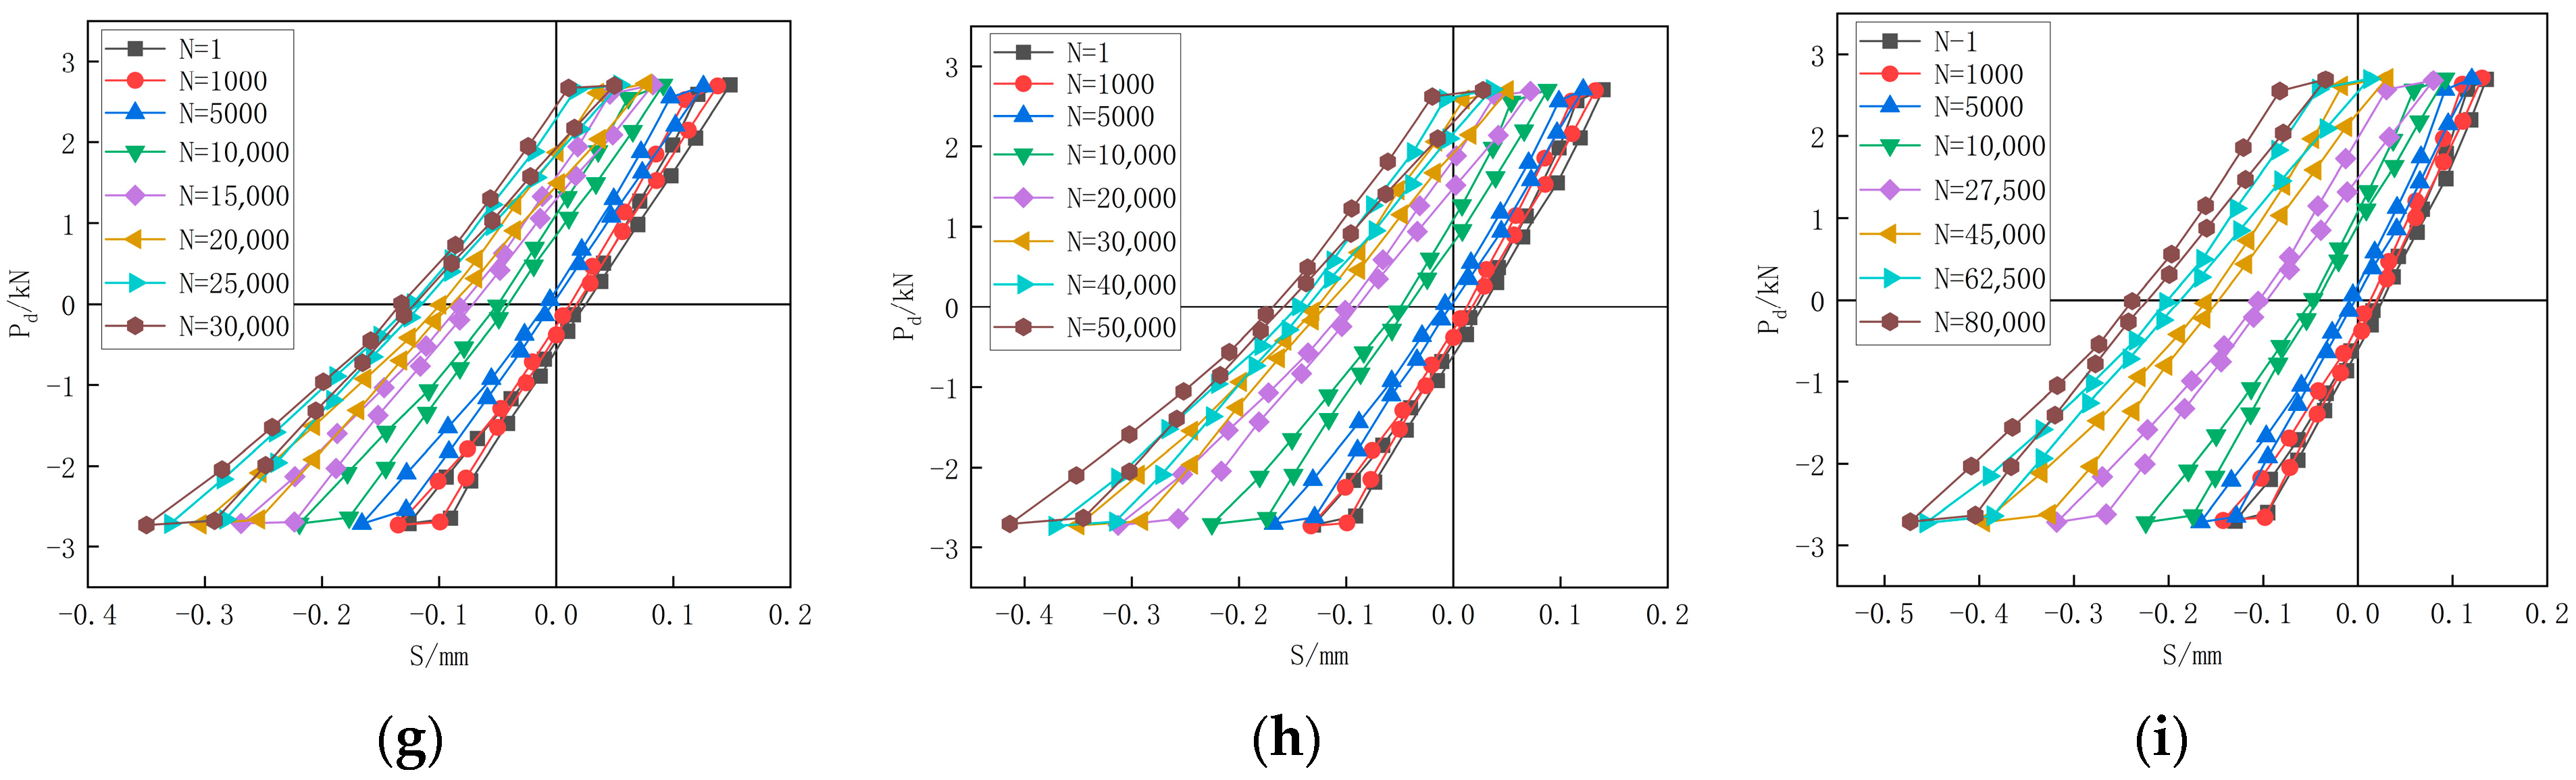
4.2.1. Damage Hysteresis Curve

From the hysteresis curve in Figure 16, it can be observed that during the initial stages of cyclic loading, the specimen’s tensile and compressive displacements exhibit symmetric distribution. As the number of cycles increases, the tensile displacement gradually increases, while the compressive displacement gradually decreases (in the MTS recording system, tensile displacement is represented as negative, and compressive displacement as positive). From Figure 16, it can be seen that the hysteresis curve of the specimen presents an inverted ‘S’ shape. During the early loading stages, the hysteresis curve is relatively steep. This is primarily due to the initial high stiffness of the sandwich insulation composite wallboard GFRP connector specimen. As the number of loading cycles increases, the hysteresis curve gradually becomes more flattened, indicating that the specimen’s stiffness is gradually decreasing.

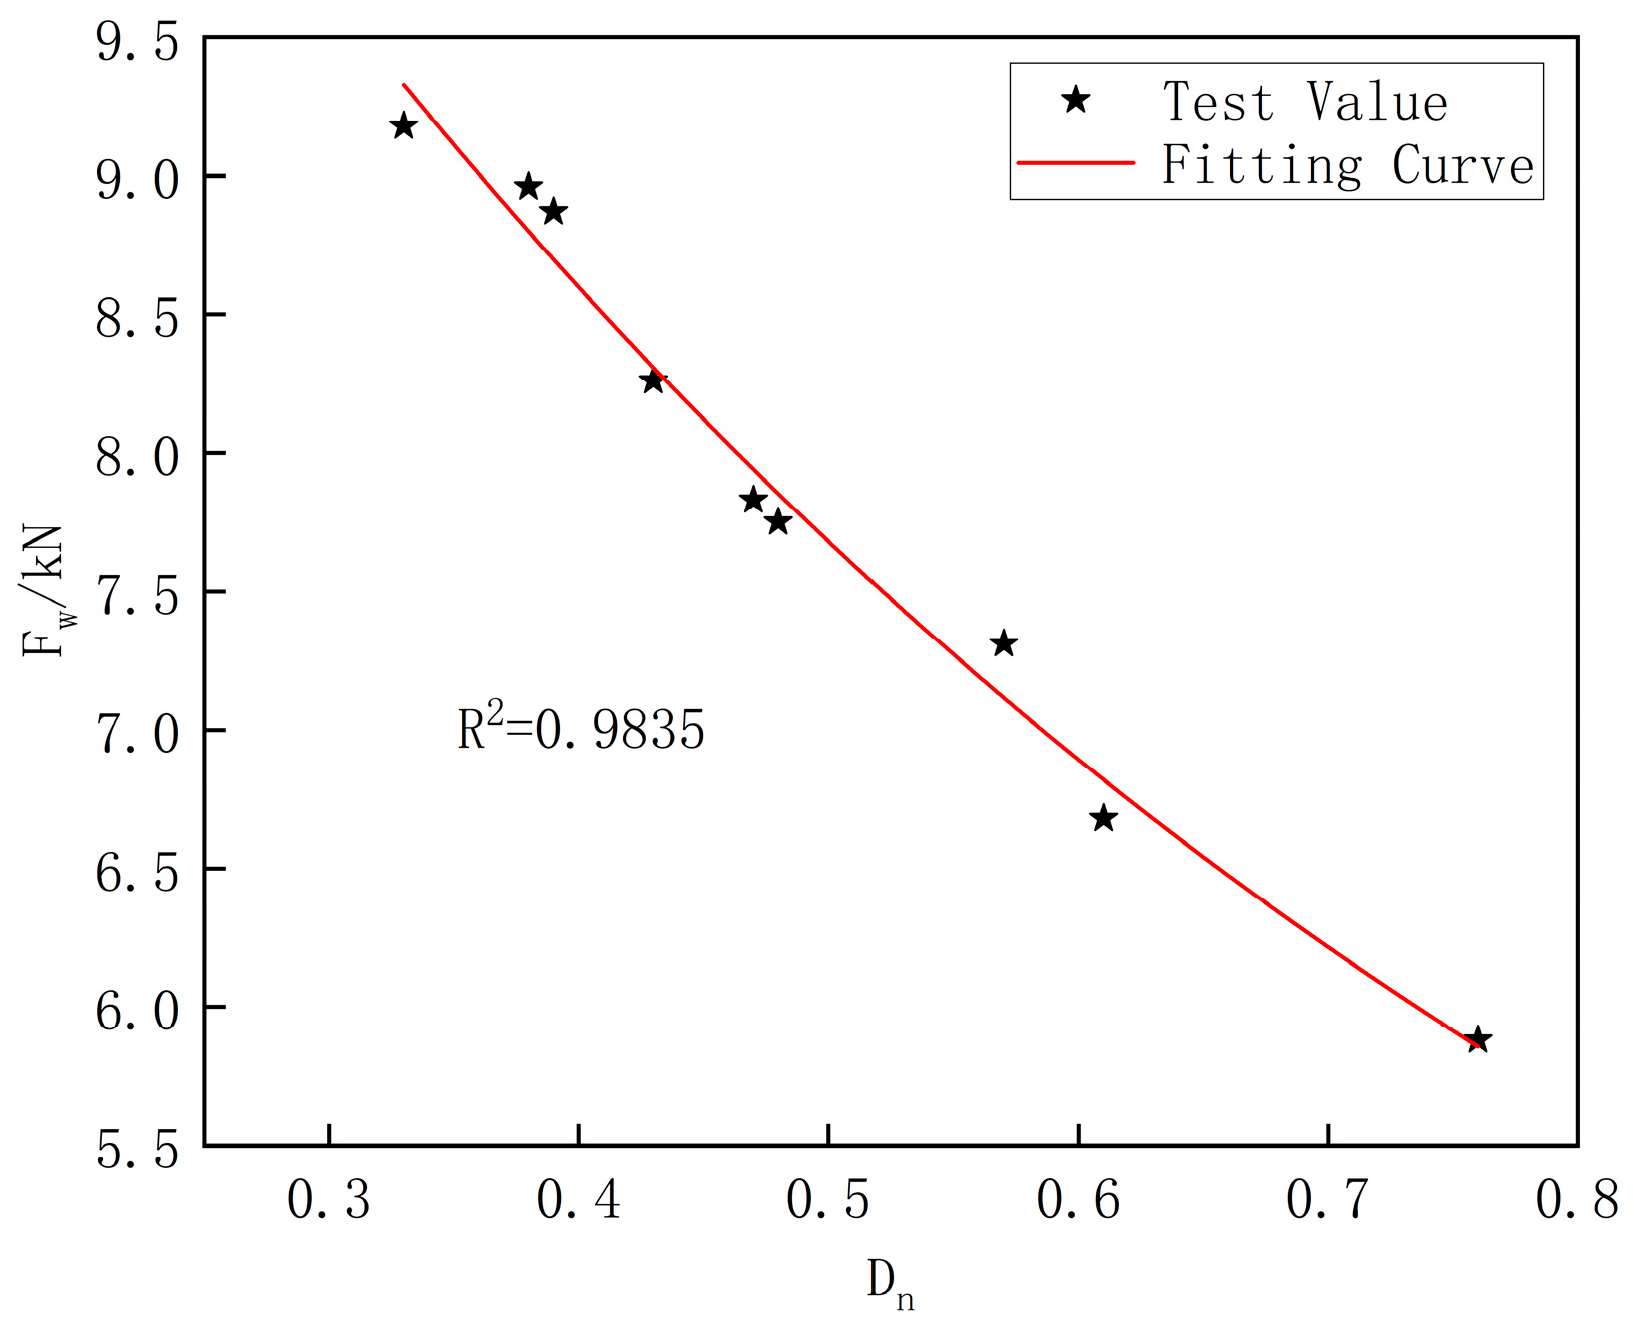
4.2.2. Fatigue Damage Degree Calculation

Based on experimental data from fatigue failure tests, a three-stage fatigue damage characterization model for the GFRP connectors of sandwich insulation composite wall panels was developed through fitting analysis, as shown in Equation (1) [35]. The model parameters for each stage are as follows: α = 4.16, α = 0.76, α = 2.12. The critical point parameters for the stages are N/Nf = 0.07, N/Nf = 0.94, while the damage accumulation parameters are D = 0.2912, D = 0.8726.
D N = α · N N f                                                                                     0 < N N f N N f D + α · N N f N N f                               N N f < N N f N N f D + α · N N f N N f                                       N N f < N N f 1

4.3. Bending-Shear Mechanical Performance Test Results After Fatigue Damage

4.3.1. Bending-Shear Load-Carrying Capacity After Fatigue Damage

Table 5 shows the bending-shear load-carrying capacity and displacement results of the specimens with fatigue damage but no failure. The ultimate load-carrying capacity of the sandwich-insulated composite wallboard GFRP connection component was 9.35 kN (the load-carrying capacity of the specimen without fatigue damage). After 30,000 cycles of fatigue loading, when the fatigue load amplitude decreased from 5.4 kN to 2.7 kN, the bending-shear load-carrying capacity of the specimen decreased to 88.3–98.2% of its ultimate load-carrying capacity. After 50,000 cycles of fatigue loading, when the fatigue load amplitude decreased from 5.4 kN to 2.7 kN, the specimen’s bending-shear load-carrying capacity decreased to 78.2–94.9% of its ultimate load-carrying capacity. After 80,000 cycles of fatigue loading, when the fatigue load amplitude decreased from 5.4 kN to 2.7 kN, the specimen’s bending-shear load-carrying capacity decreased to 62.9–82.9% of its ultimate load-carrying capacity. This shows that under the effect of fatigue loading, the bending-shear load-carrying capacity of the sandwich-insulated composite wallboard GFRP connection component decreases at different rates compared to the un-damaged specimen. The degradation rate of the bending-shear load-carrying capacity is slower when the number of fatigue cycles is lower, and faster when the number of cycles increases. Compared to the undamaged specimens, the bending-shear capacity of the fatigue-damaged specimens decreased by 1.8% to 37.1%, with a reduction factor ranging from 0.629 to 0.982.

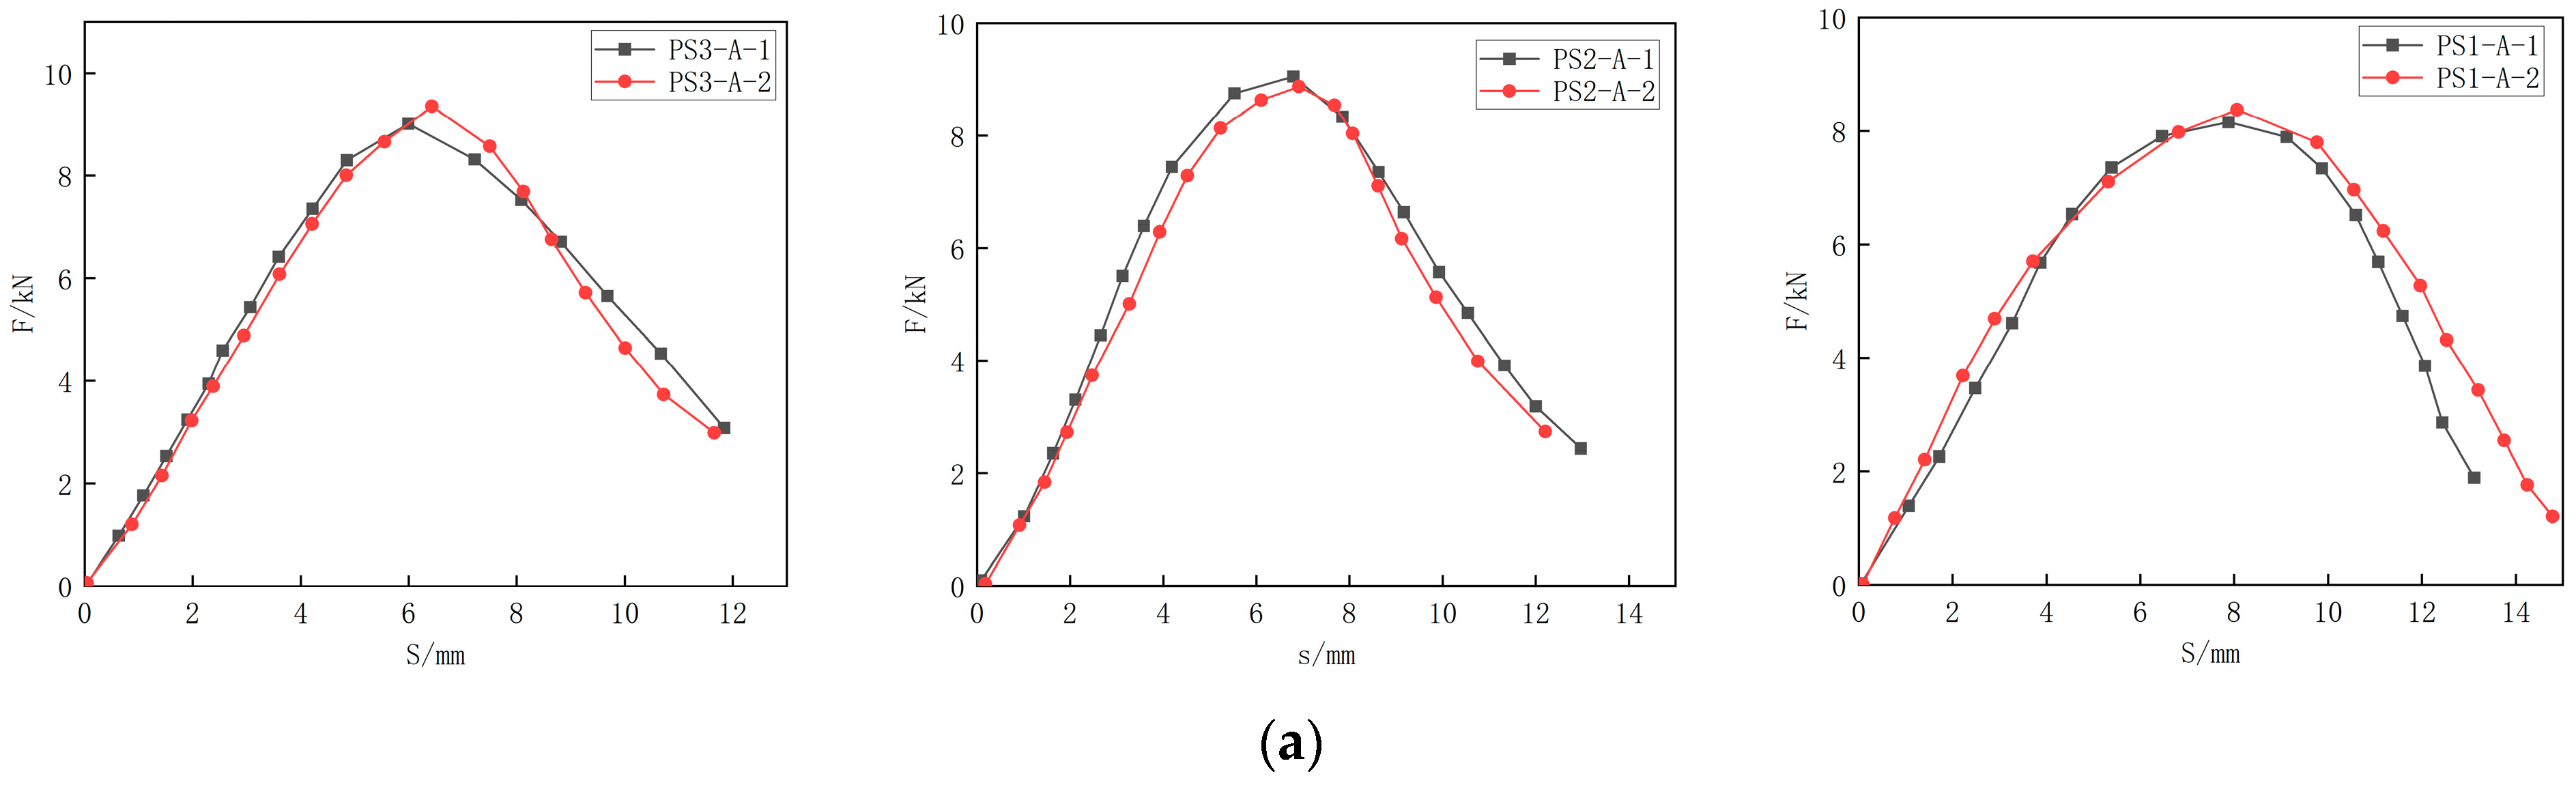
4.3.2. Load–Displacement Curve

Figure 17a–c shows the load–displacement curves of the specimens after 30,000, 50,000, and 80,000 cycles of fatigue loading, with load amplitudes of 2.7 kN, 4.0 kN, and 5.4 kN, respectively. From Figure 17, it can be observed that, for the same number of cycles, as the fatigue load amplitude increases, the shear load-bearing capacity of the specimens shows a degradation trend. Additionally, all specimens exhibit similar degradation characteristics. In the initial loading phase, the bending-shear capacity of the specimens shows a positive correlation with displacement. In the mid-loading phase, the load–displacement curve gradually becomes nonlinear, and during this stage, the load increases more slowly as displacement grows. In the final loading phase, the load–displacement curve becomes negatively correlated, and as displacement continues to increase, the load gradually decreases until the specimen fails.

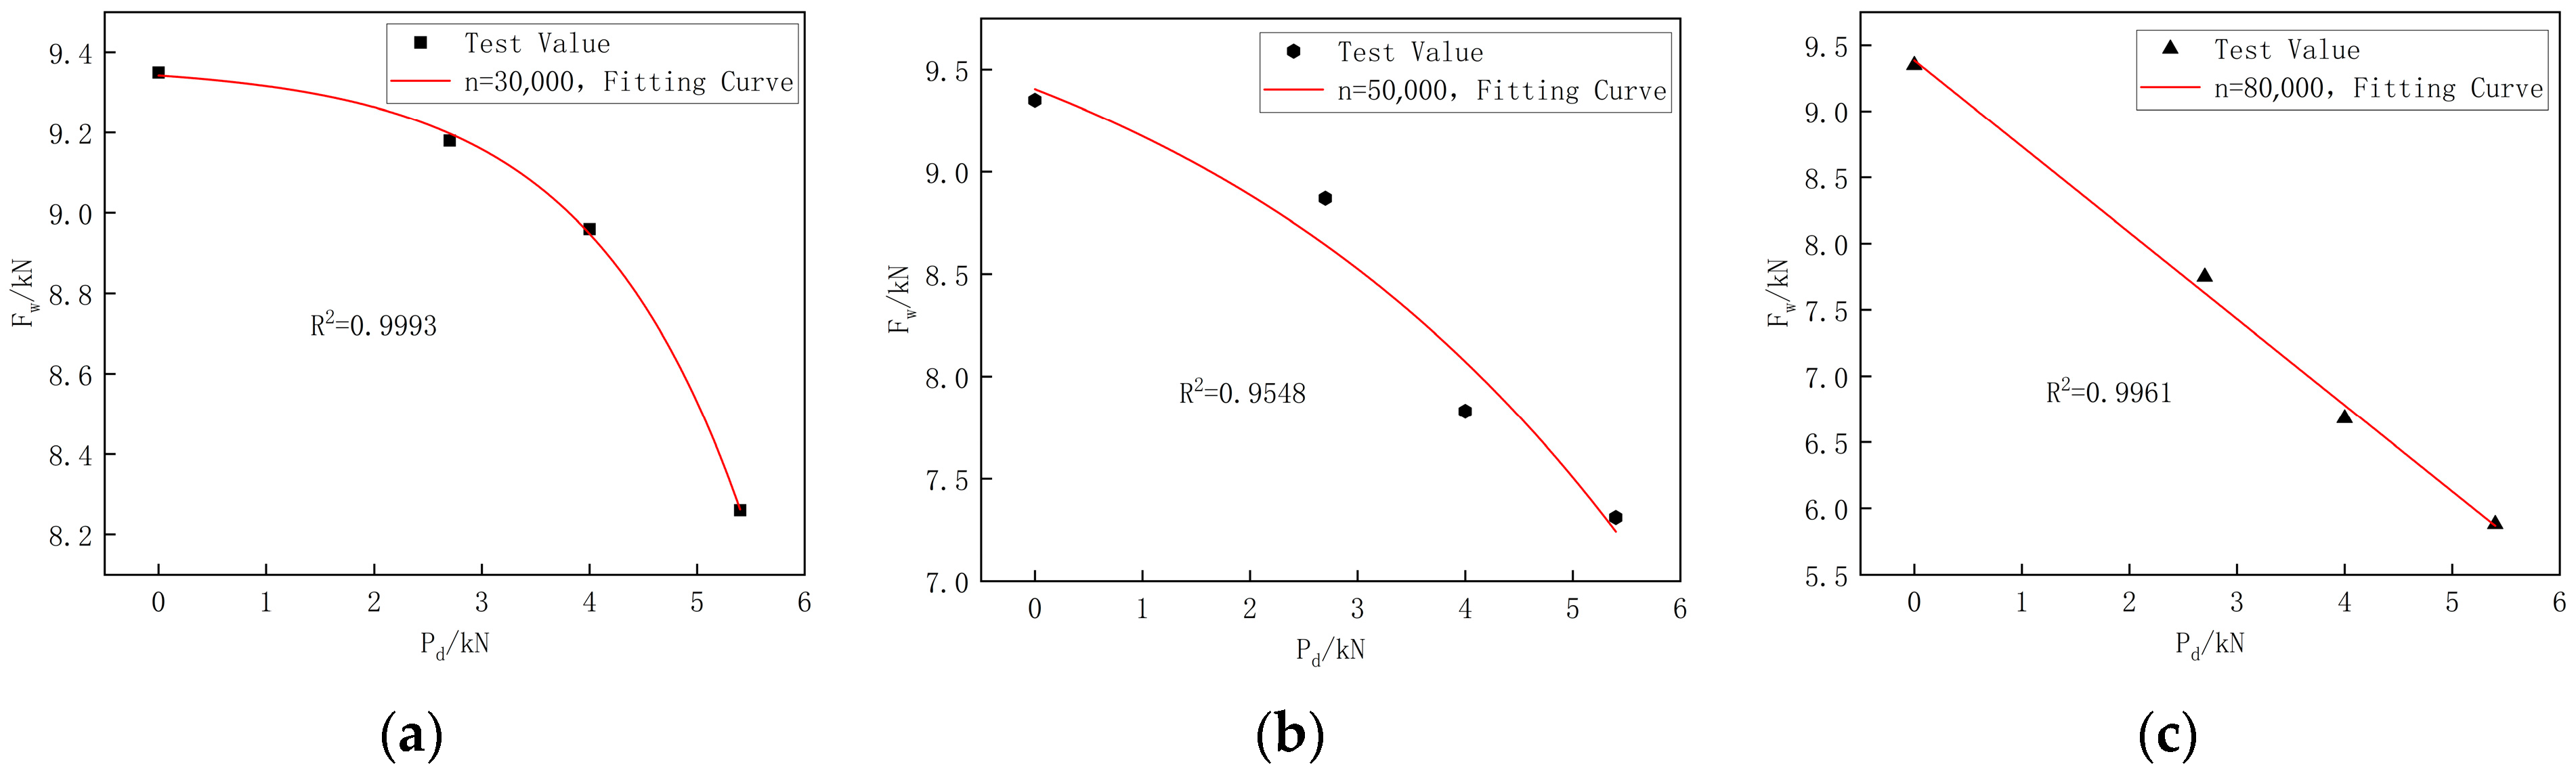
4.3.3. The Law of Bearing Capacity Variation

Analysis of the test results for specimens PS1-A-1 to PS3-C-2 indicates that the bending-shear bearing capacity of the specimens exhibits a nonlinear variation with respect to both the number of loading cycles and load amplitude. Figure 18 demonstrates how the flexural shear-bearing capacity changes with increasing loading cycles under three different load amplitudes. Based on the fitting curves in Figure 18, the flexural shear-bearing capacity of the GFRP connectors in the sandwich insulation composite wall panels follows a single exponential trend as the number of loading cycles increases. The fitting results for bending-shear capacity changes under different load amplitudes are as follows: at Pd = 2.7 kN, the capacity decreases by 1.82% after 0–30,000 cycles and by 5.13% between 30,000 and 50,000 cycles.
When the number of cyclic loadings reaches 50,000 to 80,000 cycles, the bending-shear capacity of the specimens decreases by 17.11%. For a load amplitude of Pd = 4.0 kN, after 0 to 30,000 cycles, the bending-shear capacity decreases by 4.17%. When the number of cycles is between 30,000 and 50,000, the bending-shear capacity decreases by 16.26%. When the number of cyclic loadings reaches 50,000 to 80,000 cycles, the bending-shear capacity decreases by 28.56%. For a load amplitude of Pd = 5.4 kN, after 0 to 30,000 cycles, the bending-shear capacity decreases by 11.66%. Between 30,000 and 50,000 cycles, the bending-shear capacity decreases by 21.82%. When the number of cycles reaches 50,000 to 80,000, the bending-shear capacity decreases by 37.11%. The experimental data were fitted and analyzed. The results show that the bending-shear capacity of the sandwich insulation composite wall panel GFRP tie bar decreases as the number of cyclic loadings increases. Under the same load amplitude, the decline is slow at first but becomes faster later.
Figure 19 shows the variation in bending-shear capacity with fatigue load amplitude for the sandwich insulation composite wall panel GFRP tie bar under the same number of cycles. As seen in Figure 19a, when the number of cycles n = 30,000, the bending-shear capacity decreases by 1.82% for a fatigue load amplitude range of 0 kN to 2.7 kN, 4.17% for a load amplitude range of 2.7 kN to 4.0 kN, and 11.66% for a fatigue load amplitude range of 4.0 kN to 5.4 kN. As shown in Figure 19b, when the number of cycles n = 50,000, the bending-shear capacity decreases by 5.13% for a load amplitude range of 0 kN to 2.7 kN, 16.26% for a load amplitude range of 2.7 kN to 4.0 kN, and 21.82% for a load amplitude range of 4.0 kN to 5.4 kN. When the number of cycles n = 80,000, the bending-shear capacity decreases by 17.11% for a load amplitude range of 0 kN to 2.7 kN, 28.56% for a load amplitude range of 2.7 kN to 4.0 kN, and 37.11% for a load amplitude range of 4.0 kN to 5.4 kN.
From the analysis of the fitted curves in Figure 19, it can be concluded that the bending-shear capacity of the GFRP tie bar follows a single-exponential decay pattern with respect to the fatigue load amplitude. Additionally, the bending-shear capacity exhibits a trend of slow initial decrease followed by a faster decline as the fatigue load amplitude increases.
Figure 20 shows the variation in bending-shear capacity with fatigue damage value Dn for the sandwich insulation composite wall panel GFRP tie bar. The fitted curve indicates that the bending-shear capacity follows a single-exponential decay pattern with respect to Dn.

5. Analysis of the Degree of Influence of Dual Factors on Bending-Shear Capacity

To investigate the influence of the number of cycles and fatigue load amplitude on the bending-shear capacity of the sandwich insulation composite wall panel GFRP tie bar, a two-factor analysis of variance was performed. The analysis examined the bending-shear capacity under three different load amplitudes and three different numbers of cycles, as shown in Table 6.
Firstly, set the bending-shear capacity of the sandwich insulation composite wall panel GFRP tie bar under different load amplitudes as ξ i j   ~   N μ i j , σ 2 , μ i j = μ + σ i + β j , i = 1, 2, 3; j = 1, 2, 3. Next, test whether the number of cycles has a significant effect on the bending-shear capacity of the specimen. Set the null hypothesis as H 01 = α 1 = α 2 = α 3 (Null hypothesis: α 1 , α 2 , α 3 all values are equal). Test whether the load amplitude has a significant effect on the bending-shear capacity of the specimen. Set the null hypothesis as H 02 = β 1 = β 2 = β 3 (Null hypothesis: β 1 , β 2 , β 3 all values are equal). The calculation results are shown in Table 7.
Where X i . ¯ represents the mean value of the horizontal Ai; X . j ¯ represents the mean value of the horizontal Bj; S S i . represents the sum of the squares of the horizontal components of Ai; S S . j represents the sum of the squares of the horizontal components of Bi; S S A represents the sum of the squares of factor A; S S B represents the sum of the squares of factor B; and S S e represents the sum of squares of the errors.
Perform analysis of variance on the results in Table 7, as shown in Table 8.
As shown in Table 8, FA = 38.129 > F0.95(2,4) = 6.94, the null hypothesis H 01 is rejected. Therefore, the number of cycles has a significant impact on the bending-shear capacity of the GFRP tie-bonded composite insulated sandwich wall panel. FB = 19.234 > F0.95(2,4) = 6.94, reject the null hypothesis H 02 . Therefore, the load amplitude also has a significant impact on the bending-shear capacity of the GFRP tie-bonded composite insulated sandwich wall panel. In addition, since FA = 38.129 > FB = 19.234, factor A has a greater impact on the bending-shear capacity of the specimen compared to factor B. Therefore, compared to load amplitude, the number of cycles during fatigue loading has a greater impact on the bending-shear capacity of the GFRP tie-bonded composite insulated sandwich wall panel.

6. Conclusions

This study aimed to investigate the bending-shear mechanical performance and the main influencing factors of the bending-shear capacity of the sandwich insulation composite wall panel GFRP tie bars after fatigue damage. Bending-shear tests were conducted on specimens both without fatigue damage and with varying degrees of fatigue damage. The effects of factors such as load amplitude and the number of cyclic loads on the failure modes, bending-shear capacity, and degradation patterns of the GFRP tie bars were studied. Additionally, a two-factor analysis of variance was used to identify the primary factors affecting the bending-shear capacity. The conclusions of this study are as follows:
(1)
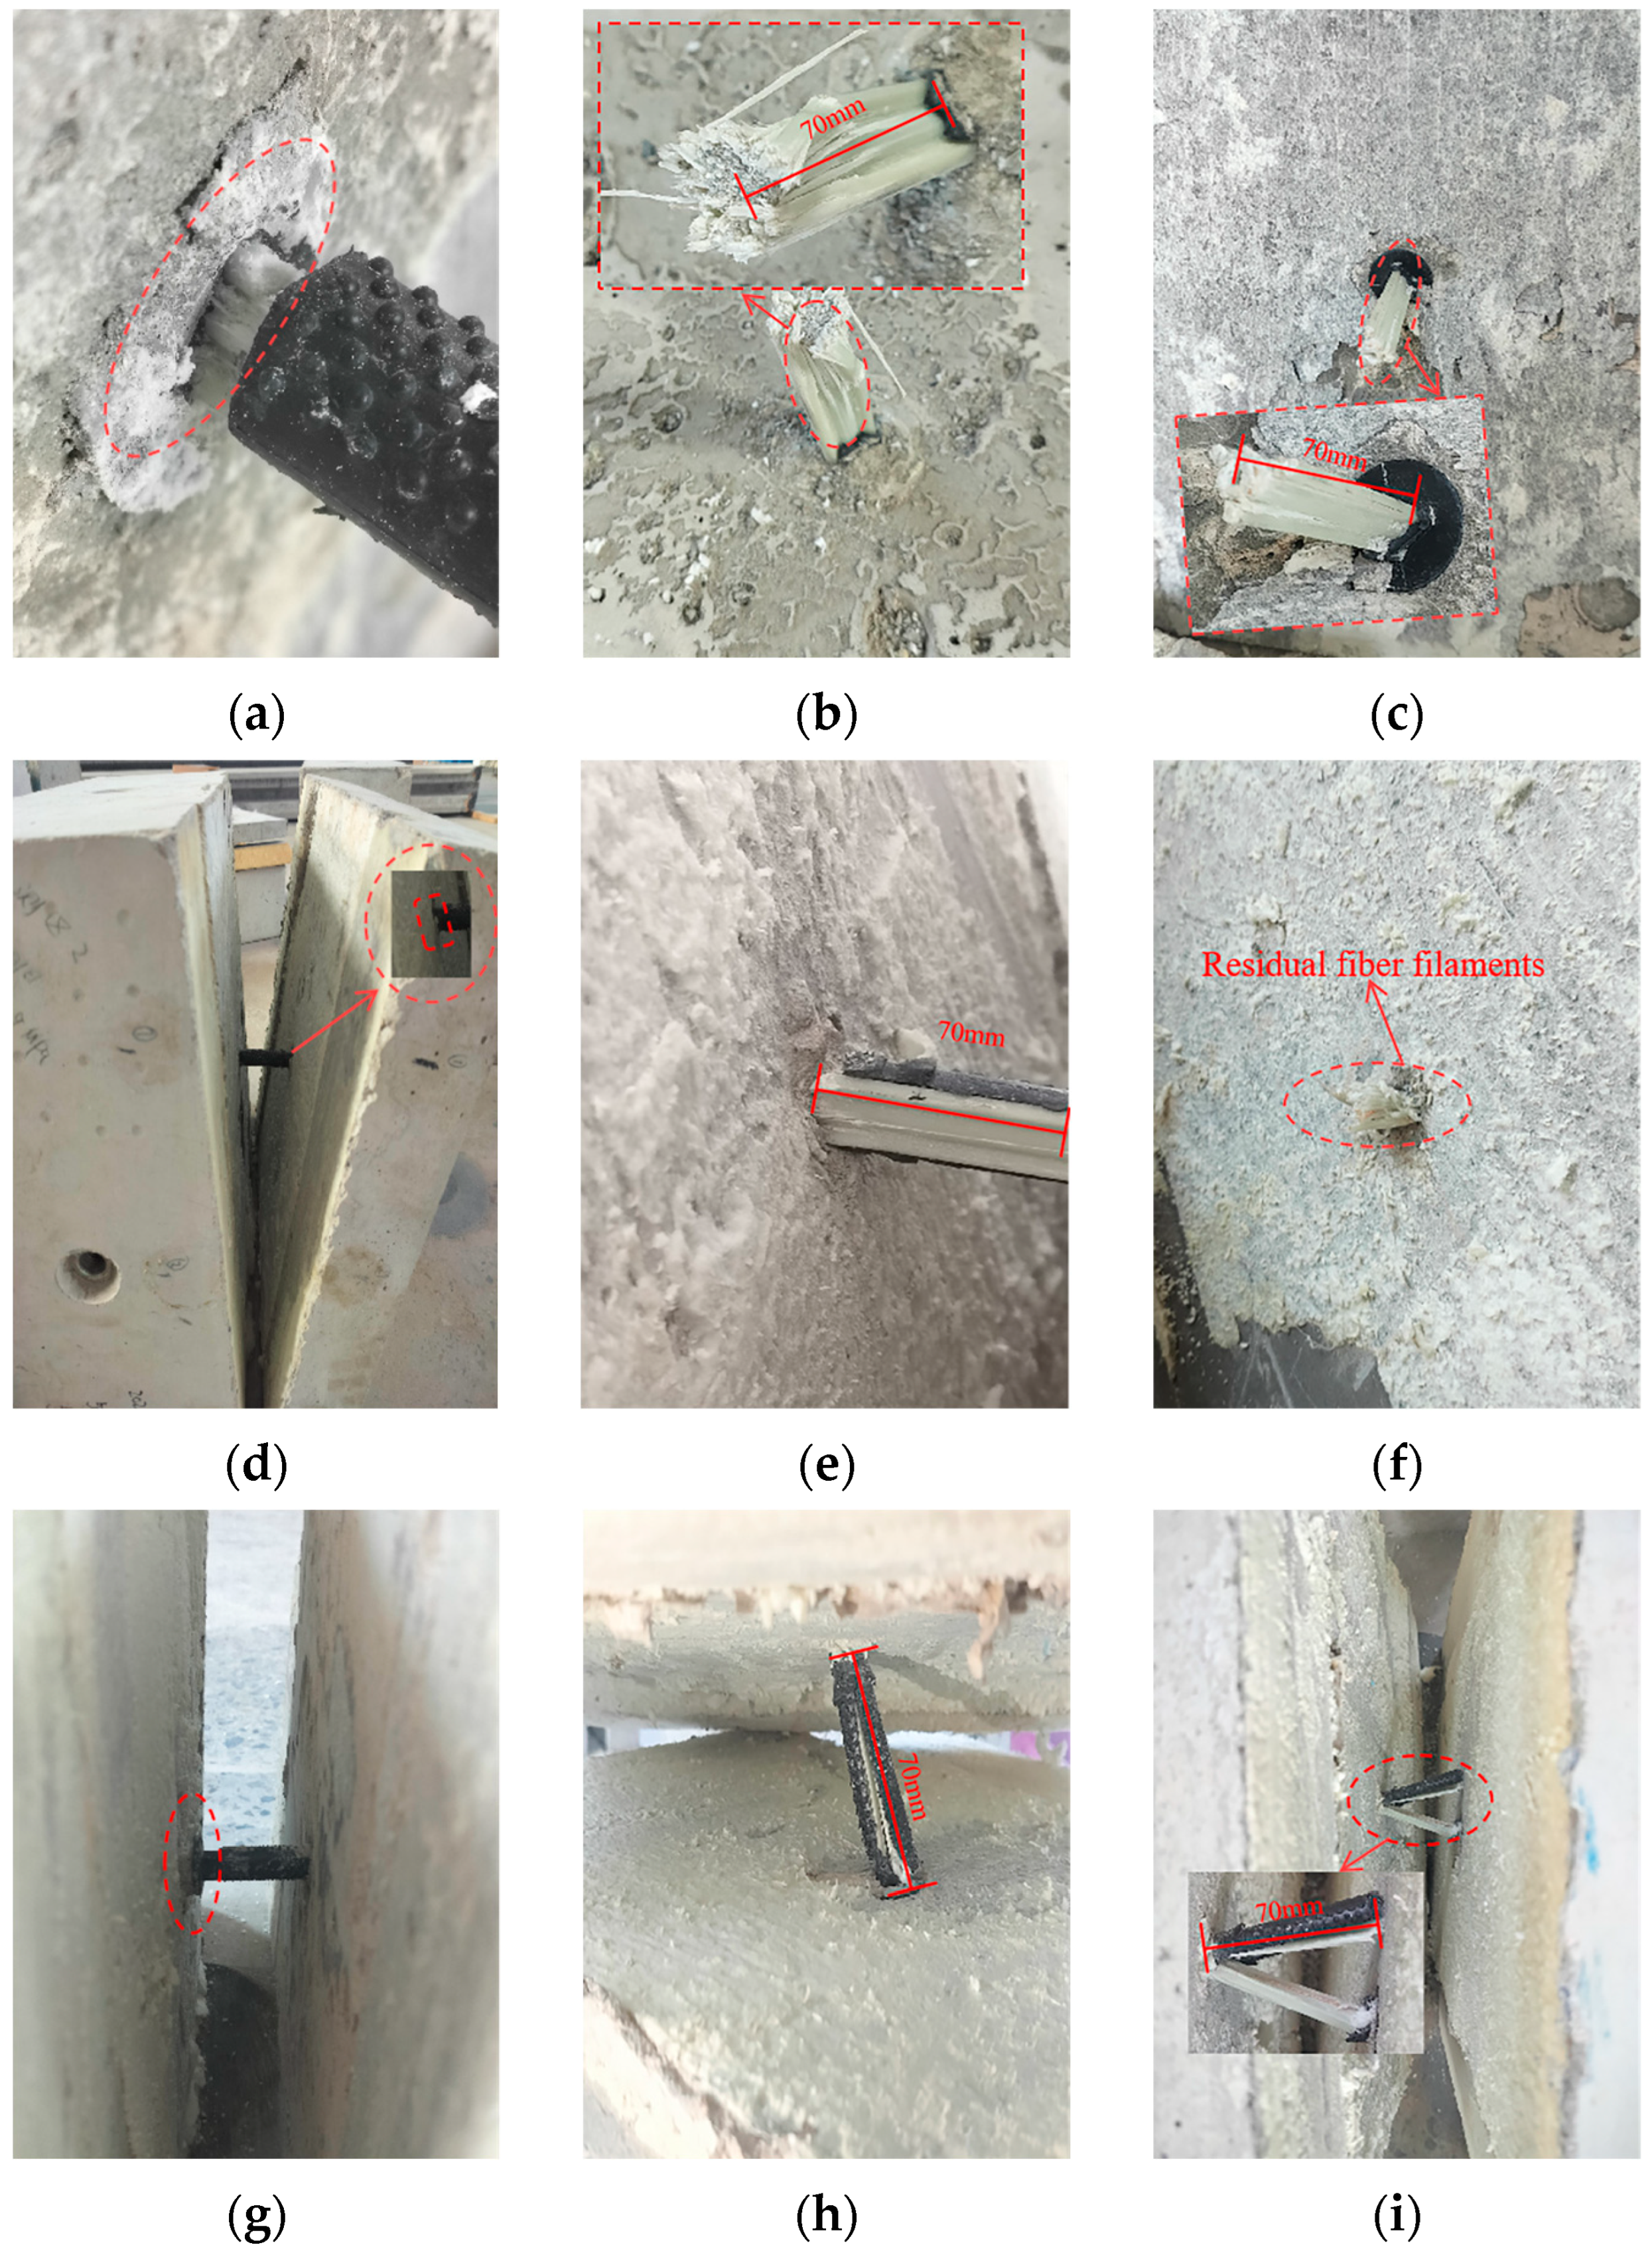
The GFRP tie bars of the sandwich insulation composite wall panel exhibit two distinct failure modes, namely, tie bar fracture and concrete crushing in the anchorage zone, as the load amplitude increases. Compared to the number of cyclic loads, the load amplitude has a greater influence on the failure modes of the GFRP tie bars.
(2)
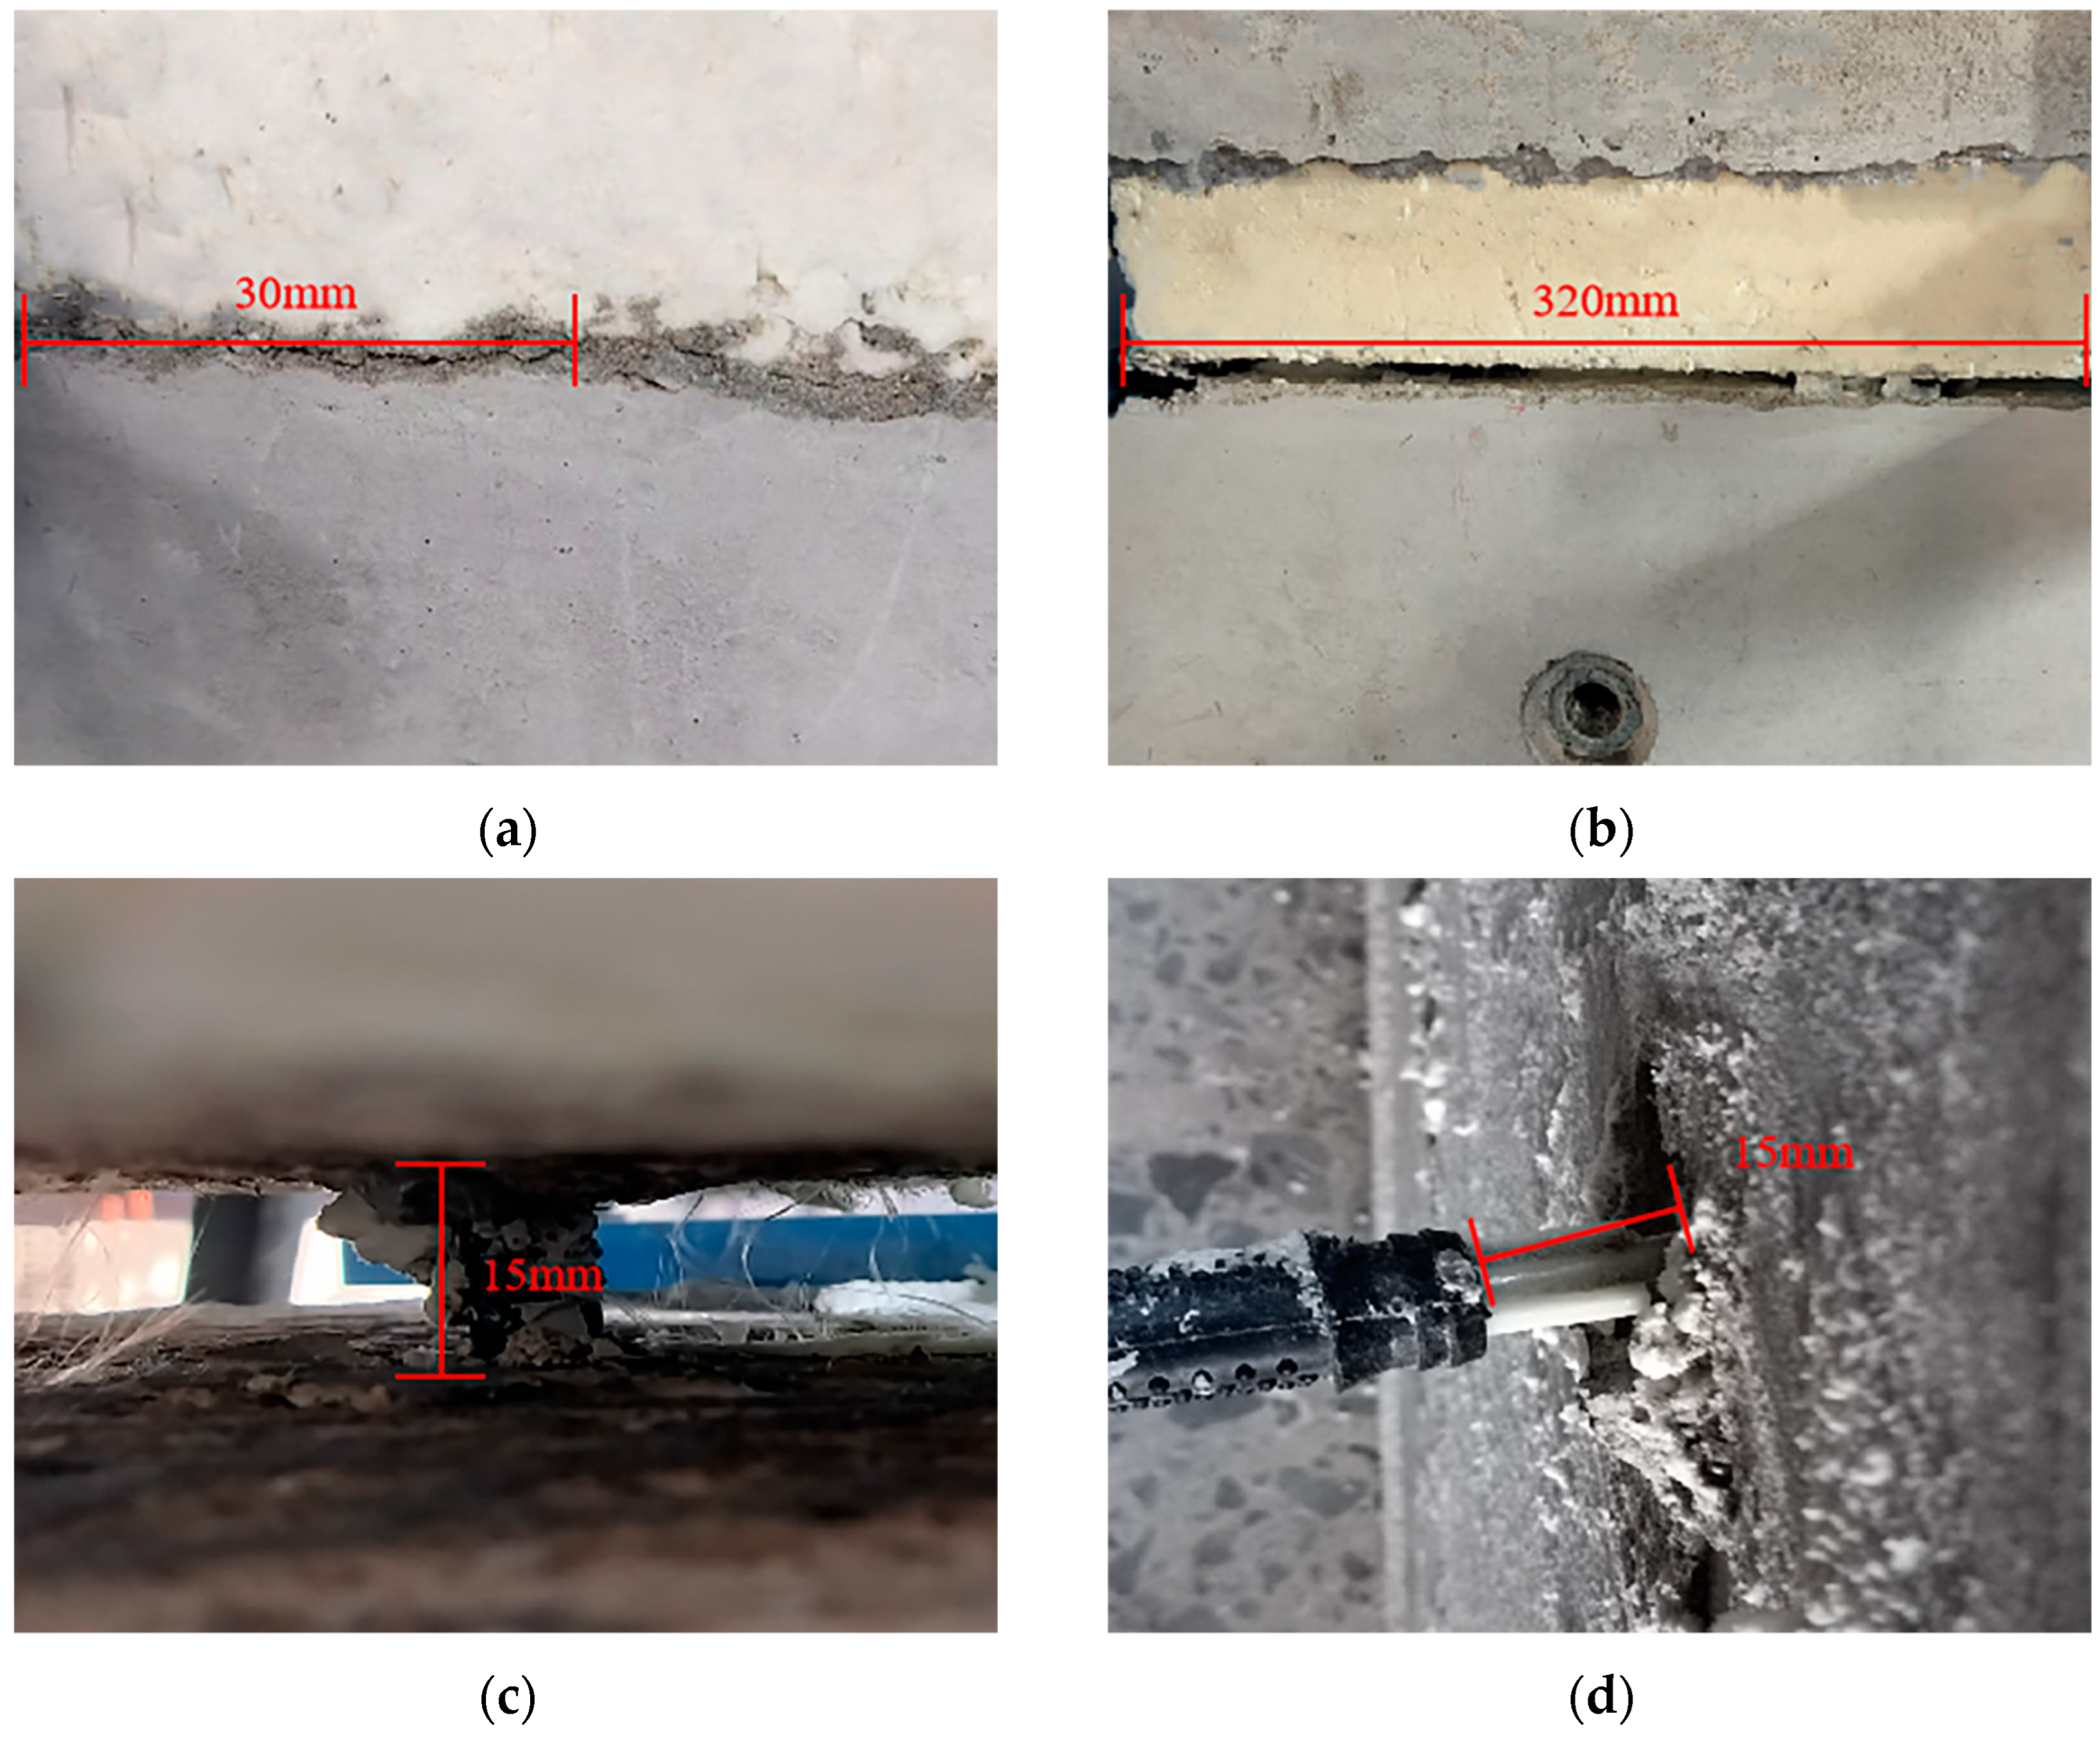
The GFRP tie bar specimens of the sandwich insulation composite wall panel were tested after 30,000, 50,000, and 80,000 cycles of loading. These specimens showed no significant failure characteristics, except for cracking between the insulation board and the concrete board. Additionally, the three-stage fatigue damage model was used to calculate the damage degree of the GFRP tie bars. Under load amplitudes of 2.7 kN, 4.0 kN, and 5.4 kN, the damage degree was found to range between 0.33 and 0.76 after 30,000 to 80,000 cycles of loading.
(3)
Under fatigue loading, the bending-shear capacity of the GFRP tie bars exhibits a “slow at first, then rapid” degradation pattern. In the static load failure tests after fatigue, the load amplitude was 2.7 kN, and the number of cycles was 30,000. Under these conditions, the degradation of bending-shear capacity was minimal. The capacity decreased by only 1.82% compared to the ultimate capacity of the undamaged specimen. However, when the load amplitude is 5.4 kN and the number of cycles reaches 80,000, the degradation of bending-shear capacity is most pronounced, reaching 37.11%.
(4)
Two-factor analysis of variance was performed. The results show that load amplitude has a significant impact on the bending-shear capacity of the sandwich insulation composite wall panel GFRP tie bars. Fatigue loading cycles also have a significant impact on the bending-shear capacity. Compared to load amplitude, the number of cyclic loads has a more significant effect on the bending-shear capacity of the specimens.

Author Contributions

Conceptualization, J.L. and G.C.; methodology, G.C.; software, Y.H.; formal analysis, Y.H.; investigation, Y.H.; resources, J.L. and G.C.; data curation, Y.H.; writing—original draft preparation, Y.H.; writing—review and editing, J.L., G.C. and C.M.; supervision, J.L. and G.C.; project administration, G.C. All authors have read and agreed to the published version of the manuscript.

Funding

This research was funded by Scientific Research Fund of Jiaxing Science and Technology Bureau (Grant No. 2023AZ31007), Natural Science Foundation of Xinjiang Uygur Autonomous (Grant No. 2022D01D033), Scientific Research Fund of Zhejiang Provincial Education Department (Y202352093), and Jiaxing University Launches Fund Project (Grant No. CD70522018).

Data Availability Statement

Data are contained within the article.

Conflicts of Interest

The authors declare no conflicts of interest.

References

  1. Ministry of Housing and Urban-Rural Development: Issued the “14th Five-Year Plan for Building Energy Conservation and Green Building Development”. Energy Conserv. Environ. Prot. 2022, 3, 6.
  2. Einea, A.; Salmon, D.C.; Fogarasi, G.J.; Culp, T.D.; Tadros, M.K. State-of-the-art of precast concrete sandwich panels. PCI J. 1991, 36, 78–98. [Google Scholar] [CrossRef]
  3. Abdul Ghafar, W.; Tao, Z.; Tao, Y.; He, Y.; Wu, L.; Zhang, Z. Experimental and numerical study of an innovative infill web-strips steel plate shear wall with rigid beam-to-column connections. Buildings 2022, 12, 1560. [Google Scholar] [CrossRef]
  4. Abdul Ghafar, W.; Zhong, T.; Abid, M.; Faizan, E.; Mohamed, A.; Yosri, A.M. Seismic performance investigation of an innovative steel shear wall with semi-rigid beam-to-column connections. Front. Mater. 2022, 9, 1075300. [Google Scholar] [CrossRef]
  5. Wu, X.G.; Tao, X.K.; Yu, S.Y.; Li, S.; Zang, R.; Liu, H.; Qian, Q.; Xin, S. Research Progress on the Application of High-Performance Composite Sandwich Exterior Wall Panels. J. Build. Struct. 2020, S01, 611–616. [Google Scholar]
  6. Guo, M.P.; Chen, G.X.; Zhang, Y.C.; Liu, J. Study on the Mechanical Properties of GFRP-Y Type Tie-Bonded Components for Sandwich Insulated Composite Wall Panels. Compos. Sci. Eng. 2024, 1–11. [Google Scholar]
  7. Chen, A.; Norris, T.G.; Hopkins, P.M.; Yossef, M. Experimental Investigation and Finite Element Analysis of Flexural Behavior ofInsulated Concrete Sandwich Panels with FRP Plate Shear Connectors. Eng. Struct. 2015, 98, 95–108. [Google Scholar] [CrossRef]
  8. Cadenazzi, T.; Dotelli, G.; Rossini, M.; Nolan, S.; Nanni, A. Cost and environmental analyses of reinforcement alternatives for a concrete bridge. Struct. Infrastruct. Eng. 2020, 16, 787–802. [Google Scholar]
  9. Manalo, A.; Maranan, G.; Benmokrane, B.; Cousin, P.; Alajarmeh, O.; Ferdous, W.; Liang, R.; Hota, G. Comparative durability of GFRP composite reinforcing bars in concrete and in simulated concrete environments. Cem. Concr. Compos. 2020, 109, 103564. [Google Scholar] [CrossRef]
  10. Maranan, G.; Manalo, A.; Benmokrane, B.; Karunasena, W.; Mendis, P.; Nguyen, T. Shear behaviour of geopolymer-concrete beams transversely reinforced with continuous rectangular GFRP composite spirals. Compos. Struct. 2018, 187, 454–465. [Google Scholar] [CrossRef]
  11. Dutta, D.; Jawdhari, A.; Fam, A. A New Studded Precast Concrete Sandwich Wall with Embedded Glass-Fiber Reinforced Polymer Channel Sections. PCI J. 2020, 65, 78–99. [Google Scholar] [CrossRef]
  12. Huang, J.; Dai, J. Direct shear tests of glass fiber reinforced polymer connectors for use in precast concrete sandwich panels. Compos. Struct. 2019, 207, 136–147. [Google Scholar]
  13. Choi, K.B.; Choi, W.C.; Feo, L.; Jang, S.J.; Yun, H.D. In-plane shear behavior of insulated precast concrete sandwich panels reinforced with corrugated GFRP shear connectors. Compos. Part B 2015, 79, 419–429. [Google Scholar]
  14. Pan, P.; He, Z.; Wang, H.; Kang, Y. Experimental investigation of C-shaped glass-fiber-reinforced polymer connectors for sandwich insulation wall panels. Eng. Struct. 2022, 250, 113462. [Google Scholar]
  15. He, Z.; Pan, P.; Ren, J.; Wang, H. Experimental and numerical investigation of novel I-shaped GFRP connectors for insulated precast concrete sandwich wall panels. J. Compos. Constr. 2020, 24, 04020040. [Google Scholar]
  16. He, Z.Z.; Peng, P.; Wang, H.S. Study on the Axial Performance of GFRP Connectors for Sandwich Insulated Walls. Eng. Mech. 2021, 38, 112–121. [Google Scholar]
  17. Choi, I.; Kim, J.H.; You, Y.C. Effect of cyclic loading on composite behavior of insulated concrete sandwich wall panels with GFRP shear connectors. Compos. Part B Eng. 2016, 96, 7–19. [Google Scholar]
  18. Mincigrucci, L.; Civera, M.; Lenticchia, E.; Ceravolo, R.; Rosano, M.; Russo, S. Comparative structural analysis of GFRP, reinforced concrete, and steel frames under seismic loads. Materials 2023, 16, 4908. [Google Scholar] [CrossRef]
  19. Chu, K.; Hossain, K.M.A.; Lachemi, M. Experimental and numerical study on joint-free bridges with steel or gfrp-reinforced ecc link slab subjected to static loading. Constr. Build. Mater. 2022, 327, 127035. [Google Scholar] [CrossRef]
  20. Cox, B.; Syndergaard, P.; Al-Rubaye, S.; Pozo-Lora, F.F.; Tawadrous, R.; Maguire, M. Lumped GFRP star connector system for partial composite action in insulated precast concrete sandwich panels. Compos. Struct. 2019, 229, 111465. [Google Scholar]
  21. Mocko, W. The influence of stress-controlled tensile fatigue loading on the stress-strain characteristics of AISI 1045 steel. Mater. Des. 2014, 58, 145–153. [Google Scholar]
  22. Zhang, C.; Wang, R.; Zhu, H. Experimental study on mechanical properties of Q690 high strength steel after fatigue damage. Jianzhu Jiegou Xuebao 2021, 42, 177–184. [Google Scholar]
  23. Mariappan, K.; Shankar, V.; Sandhya, R.; Bhaduri, A.K.; Laha, K. A comparative evaluation of the effect of low cycle fatigue and creep-fatigue interaction on surface morphology and tensile properties of 316 L (N) stainless steel. Met. Mater. Trans. A 2016, 47, 1575–1586. [Google Scholar]
  24. Mariappan, K.; Shankar, V.; Sandhya, R.; Mathew, M.D.; Bhaduri, A.K. Influence ofprior fatigue damage on tensile properties of 316 L (N) stainless steel and modified 9Cr1Mo steel. Met. Mater. Trans. A 2015, 46, 989–1003. [Google Scholar]
  25. Luo, N.; Zhou, T.; Zhang, C. Mechanical properties of Q345 structural steel after pre-fatigue loading. Structures 2023, 56, 104944. [Google Scholar]
  26. Mariappan, K.; Shankar, V.; Sandhya, R.; Bhaduri, A.K.; Laha, K. Comparative assessment of remnant tensile properties of modified 9Cr-1Mo steel under prior low cycle fatigue and creep-fatigue interaction loading. Int. J. Fatigue 2017, 103, 342–352. [Google Scholar]
  27. Wang, X.; Zhang, W.; Ni, J.; Zhang, T.; Gong, J.; Wahab, M.A. Quantitative description between pre-fatigue damage and residual tensile properties of P92 steel. Mater. Sci. Eng. A 2019, 744, 415–425. [Google Scholar]
  28. Hamdoon, M.; Das, S.; Zamani, N.; Grenier, D. Experimental study on the effect of strain cycles on mechanical properties of AISI 1022 steel. Strain 2011, 47, 386–392. [Google Scholar]
  29. Moćko, W.; Brodecki, A.; Kruszka, L. Mechanical response of dual phase steel at quasistatic and dynamic tensile loadings after initial fatigue loading. Mech. Mater. 2016, 92, 18–27. [Google Scholar]
  30. Moćko, W.; Kruszka, L. A viscoplastic response of a dual phase steel exposed to prior cyclic loadings. Mech. Mater. 2017, 113, 126–135. [Google Scholar]
  31. Xu, J.; Zhu, P.; Qu, W. Experimental study on the fatigue bond behavior of concrete beams reinforced with hybrid fiber-reinforced polymer and steel bars. Struct. Concr. 2023, 24, 6451–6466. [Google Scholar] [CrossRef]
  32. Deng, W.; Xiong, Y.; Liu, D.; Zhang, J. Static and fatigue behavior of shear connectors for a steel-concrete composite girder. J. Constr. Steel Res. 2019, 159, 134–146. [Google Scholar] [CrossRef]
  33. Wang, B.; Huang, Q.; Zhou, Y.; Li, W. Study on the Residual Mechanical Properties of PBL Shear-Resistant Connectors after Fatigue. J. Hunan Univ. Nat. Sci. Ed. 2017, 44, 128–135. [Google Scholar]
  34. Liang, G.; Yang, J.N.; Li, S.M.; Liu, H. Study on the Mechanical Properties of Q460 High-Strength Steel Staggered Hole Plates after Fatigue Damage. J. Vib. Shock 2023, 42, 307–315. [Google Scholar]
  35. Huang, Y.P.; Zheng, X.H.; Zhou, H.; Guo, X.; Han, Q. Fatigue Performance of CFRP-Concrete Interface. J. South China Univ. Technol. Nat. Sci. Ed. 2012, 40, 184–189. [Google Scholar]
Figure 1. Schematic diagram of sandwich insulation composite wall panel.
Buildings 15 01004 g001
Figure 2. Dimension and reinforcement diagram of specimen: (a) Dimensions of the inner leaf plate; (b) Outer leaf plate size drawing; (c) 1-1 Sectional view; (d) 2-2 Sectional view.
Buildings 15 01004 g002
Figure 3. Dimensions and physical details of GFRP connectors: (a) Physical drawing of connectors; (b) Connector dimension drawing; (c) 1-1 Figure; (d) 2-2 Figure; (e) 3-3 Figure.
Buildings 15 01004 g003aBuildings 15 01004 g003b
Figure 4. Schematic of specimen manufacturing process: (a) mold fixing; (b) casting of inner leaf panel; (c) layout of insulation board and connectors; (d) casting of outer leaf panel; (e) curing of specimens; (f) molding of specimens.
Buildings 15 01004 g004aBuildings 15 01004 g004b
Figure 5. Figure of test loading device: (a) load the schematic; (b) actual loading diagram.
Buildings 15 01004 g005
Figure 6. Fatigue loading curve diagram.
Buildings 15 01004 g006
Figure 7. Bending-shear test loading device diagram: (a) Schematic diagram; (b) Actual loading diagram.
Buildings 15 01004 g007
Figure 8. Failure modes of uniaxial tensile specimens LS-1 to LS-3: (a) Signs of debonding; (b) Debonding crack penetration; (c) Complete debonding; (d) Damage to the anchorage zone and connector pullout.
Buildings 15 01004 g008
Figure 9. Direct bending-shear failure characteristics diagram: (a) Cracking between the insulation board and concrete; (b) Insulation board splitting; (c) Connector fracture.
Buildings 15 01004 g009
Figure 10. Damage characteristics after 30,000 cycles: (a) PS1-A (Pd = 5.4 kN); (b) PS2-A (Pd = 4.0 kN); (c) PS3-A (Pd = 2.7 kN).
Buildings 15 01004 g010
Figure 11. Damage characteristics after 50,000 cycles: (a) PS1-B (Pd = 5.4 kN); (b) PS2-B (Pd = 4.0 kN); (c) PS3-B (Pd = 2.7 kN).
Buildings 15 01004 g011
Figure 12. Damage characteristics after 80,000 cycles: (a) PS1-C (Pd = 5.4 kN); (b) PS2-C (Pd = 4.0 kN); (c) PS3-C (Pd = 2.7 kN).
Buildings 15 01004 g012
Figure 13. Static load failure characteristics after fatigue damage: (a) Pd = 5.4 kN, N = 30,000; (b) Pd = 4.0 kN, N = 30,000; (c) Pd = 2.7 kN, N = 30,000, (d) Pd = 5.4 kN, N = 50,000; (e) Pd = 4.0 kN, N = 50,000; (f) Pd = 2.7 kN, N = 50,000; (g) Pd = 5.4 kN, N = 80,000; (h) Pd = 4.0 kN, N = 80,000; (i) Pd = 2.7 kN, N = 80,000.
Buildings 15 01004 g013
Figure 14. Load–displacement curve of LS-1~LS-3.
Buildings 15 01004 g014
Figure 15. Load–displacement curve of ZJ-1~ZJ-3.
Buildings 15 01004 g015
Figure 16. Fatigue damage hysteresis curve: (a) PS1-A; (b) PS1-B; (c) PS1-C; (d) PS2-A; (e) PS2-B; (f) PS2-C; (g) PS3-A; (h) PS3-B; (i) PS3-C.
Buildings 15 01004 g016aBuildings 15 01004 g016b
Figure 17. Load–displacement curve for bending and shear tests: (a) PS1~PS3-A-1/2 load–displacement curve; (b) PS1~PS3-B-1/2 load–displacement curve; (c) PS1~PS3-C-1/2 load–displacement curve.
Buildings 15 01004 g017aBuildings 15 01004 g017b
Figure 18. Variation in bending-shear capacity with the number of cycles under the same load amplitude: (a) Pd = 2.7 kN fitted curve; (b) Pd = 4.0 kN fitted curve; (c) Pd = 5.4 kN fitted curve.
Buildings 15 01004 g018
Figure 19. Variation in bending-shear capacity with load amplitude under the same number of cycles: (a) n = 30,000 fitted curve; (b) n = 50,000 fitted curve; (c) n = 80,000 fitted curve.
Buildings 15 01004 g019
Figure 20. Variation in bending-shear capacity with fatigue damage value Dn.
Buildings 15 01004 g020
Table 1. Mechanical properties of concrete.
Compressive Strength (MPa)Tensile Strength (MPa)Modulus of Elasticity (GPa)
33.62.728.9
Table 2. Mechanical properties of reinforcing steel.
D (mm)Tensile Strength (MPa)Yield Strength (MPa)Modulus of Elasticity (GPa)
6579395200
8586407200
Table 3. Mechanical properties of GFRP connectors.
Tensile Strength
(MPa)
Tensile Modulus of Elasticity (GPa)Compressive Strength (MPa)Compressive Modulus of Elasticity (GPa)Bending-Shear Strength (MPa)
80058.942985.8247.8
Table 4. Experimental conditions for mechanical performance of GFRP connection components in sandwich-insulated composite wall panels after fatigue damage.
NumberPmax/kNPmin/kNPd/kNN/Cyclen/CycleD
PS1-A-1/2121.25.4116,07130,0000.43
PS1-B-1/250,0000.57
PS1-C-1/280,0000.76
PS2-A-1/290.94.0162,97830,0000.38
PS2-B-1/250,0000.47
PS2-C-1/280,0000.61
PS3-A-1/260.62.7256,07330,0000.33
PS3-B-1/250,0000.39
PS3-C-1/280,0000.48
Note: Pmax: Maximum load; Pmin: Minimum load; Pd: Load amplitude, Pd = (Pmax − Pmin)/2; N: Fatigue life; n: Fatigue damage cycles.
Table 5. Post-damage flexural shear bearing capacity of the specimen.
NumberPd/kNN/CycleF/kNFa/kNS/mmSa/mm
ZJ-1008.929.355.446.06
ZJ-29.976.16
ZJ-39.166.59
PS1-A-15.430,0008.158.267.887.97
PS1-A-28.378.06
PS2-A-14.09.058.966.796.85
PS2-A-28.876.91
PS3-A-12.79.019.185.996.21
PS3-A-29.356.43
PS1-B-15.450,0006.987.318.868.96
PS1-B-27.649.06
PS2-B-14.07.617.838.228.25
PS2-B-28.058.28
PS3-B-12.78.938.877.287.13
PS3-B-28.816.98
PS1-C-15.480,0005.975.8810.2110.00
PS1-C-25.799.79
PS2-C-14.06.256.689.159.39
PS2-C-27.119.63
PS3-C-12.77.537.758.288.33
PS3-C-27.978.38
Note: F: Maximum load-carrying capacity of the specimen; Fa: Average maximum load-carrying capacity of the specimen; S: Relative displacement of the specimen; Sa: Average relative displacement of the specimen.
Table 6. Factors affecting bending-shear capacity.
Fw/kNFactor B (Pd)
B1 = 2.7 kNB2 = 4.0 kNB3 = 5.4 kN
Factor A
(cycle)
A1 = 30,0009.188.968.26
A2 = 50,0008.877.837.31
A3 = 80,0007.756.685.88
Table 7. Analysis of variance table for factors affecting bending-shear capacity.
B1B2B3 X i . ¯ S S i .
A19.188.968.268.800.4616
A28.877.837.318.001.2619
A37.756.685.886.771.7606
X . j ¯ 8.607.807.157.85 S S B = 3.165
S S . j 1.13182.60092.7806 S S A = 6.2742 S S e = 0.3291
Table 8. Analysis of significant factors affecting bending-shear capacity.
OriginSum of SquaresDegrees of FreedomSum of SquaresF-ValueQuantile
A6.2742r − 1 = 23.1371FA = 38.129F0.95(2,4) = 6.94
B3.1650s − 1 = 21.5825FB = 19.234F0.95(2,4) = 6.94
Error0.3291(r − 1)(s − 1) = 40.0823//
Sum9.7638rs − 1 = 8///
Where r represents the number of levels of factor A (r = 3); s represents the number of levels of factor B (r = 3).
Disclaimer/Publisher’s Note: The statements, opinions and data contained in all publications are solely those of the individual author(s) and contributor(s) and not of MDPI and/or the editor(s). MDPI and/or the editor(s) disclaim responsibility for any injury to people or property resulting from any ideas, methods, instructions or products referred to in the content.

