Article

The Effect of Wind Speed on Structural Along-Wind Response of a Lighting Pole According to TS498 and Eurocode 1

by
Erdem Türkeli
1,* and
Deniz Cokli
2
1
Construction Department, Vocational School of Technical Sciences, Ordu University, 52200 Ordu, Türkiye
2
Renewable Energy Department, Ordu University, 52200 Ordu, Türkiye
*
Author to whom correspondence should be addressed.
Buildings 2025, 15(7), 1085; https://doi.org/10.3390/buildings15071085
Submission received: 18 February 2025 / Revised: 23 March 2025 / Accepted: 25 March 2025 / Published: 27 March 2025
(This article belongs to the Section Building Structures)

Abstract

:
This study aimed to determine the wind loads of a steel lighting pole using TS498 and Eurocode 1 standards and to perform structural wind load analyses by applying these wind loads. In this regard, a 10 m high steel lighting pole, whose dynamic structural verification was carried out using the operational modal analysis method, was selected from the technical literature as an application example and was modeled with this verification using the SAP2000 structural analysis program. Comparative structural wind load analysis was carried out by applying the wind loads obtained using the cited standards for different wind speeds (5 mph, 40 mph, and 100 mph) to the modeled lighting pole. The most important novelty of this study from other studies and the innovation it adds to the technical literature is that the effect of wind speed on the dynamic properties of the structure such as frequency and so on wind forces are taken into account. While, in other studies, the dynamic properties of the structure are taken as constant at different wind speeds, in this study, the dynamic properties of the structure vary with the wind speed, which provides an approximately 11~12% reduction in the top displacements for both standards and leads to an economical design.

1. Introduction

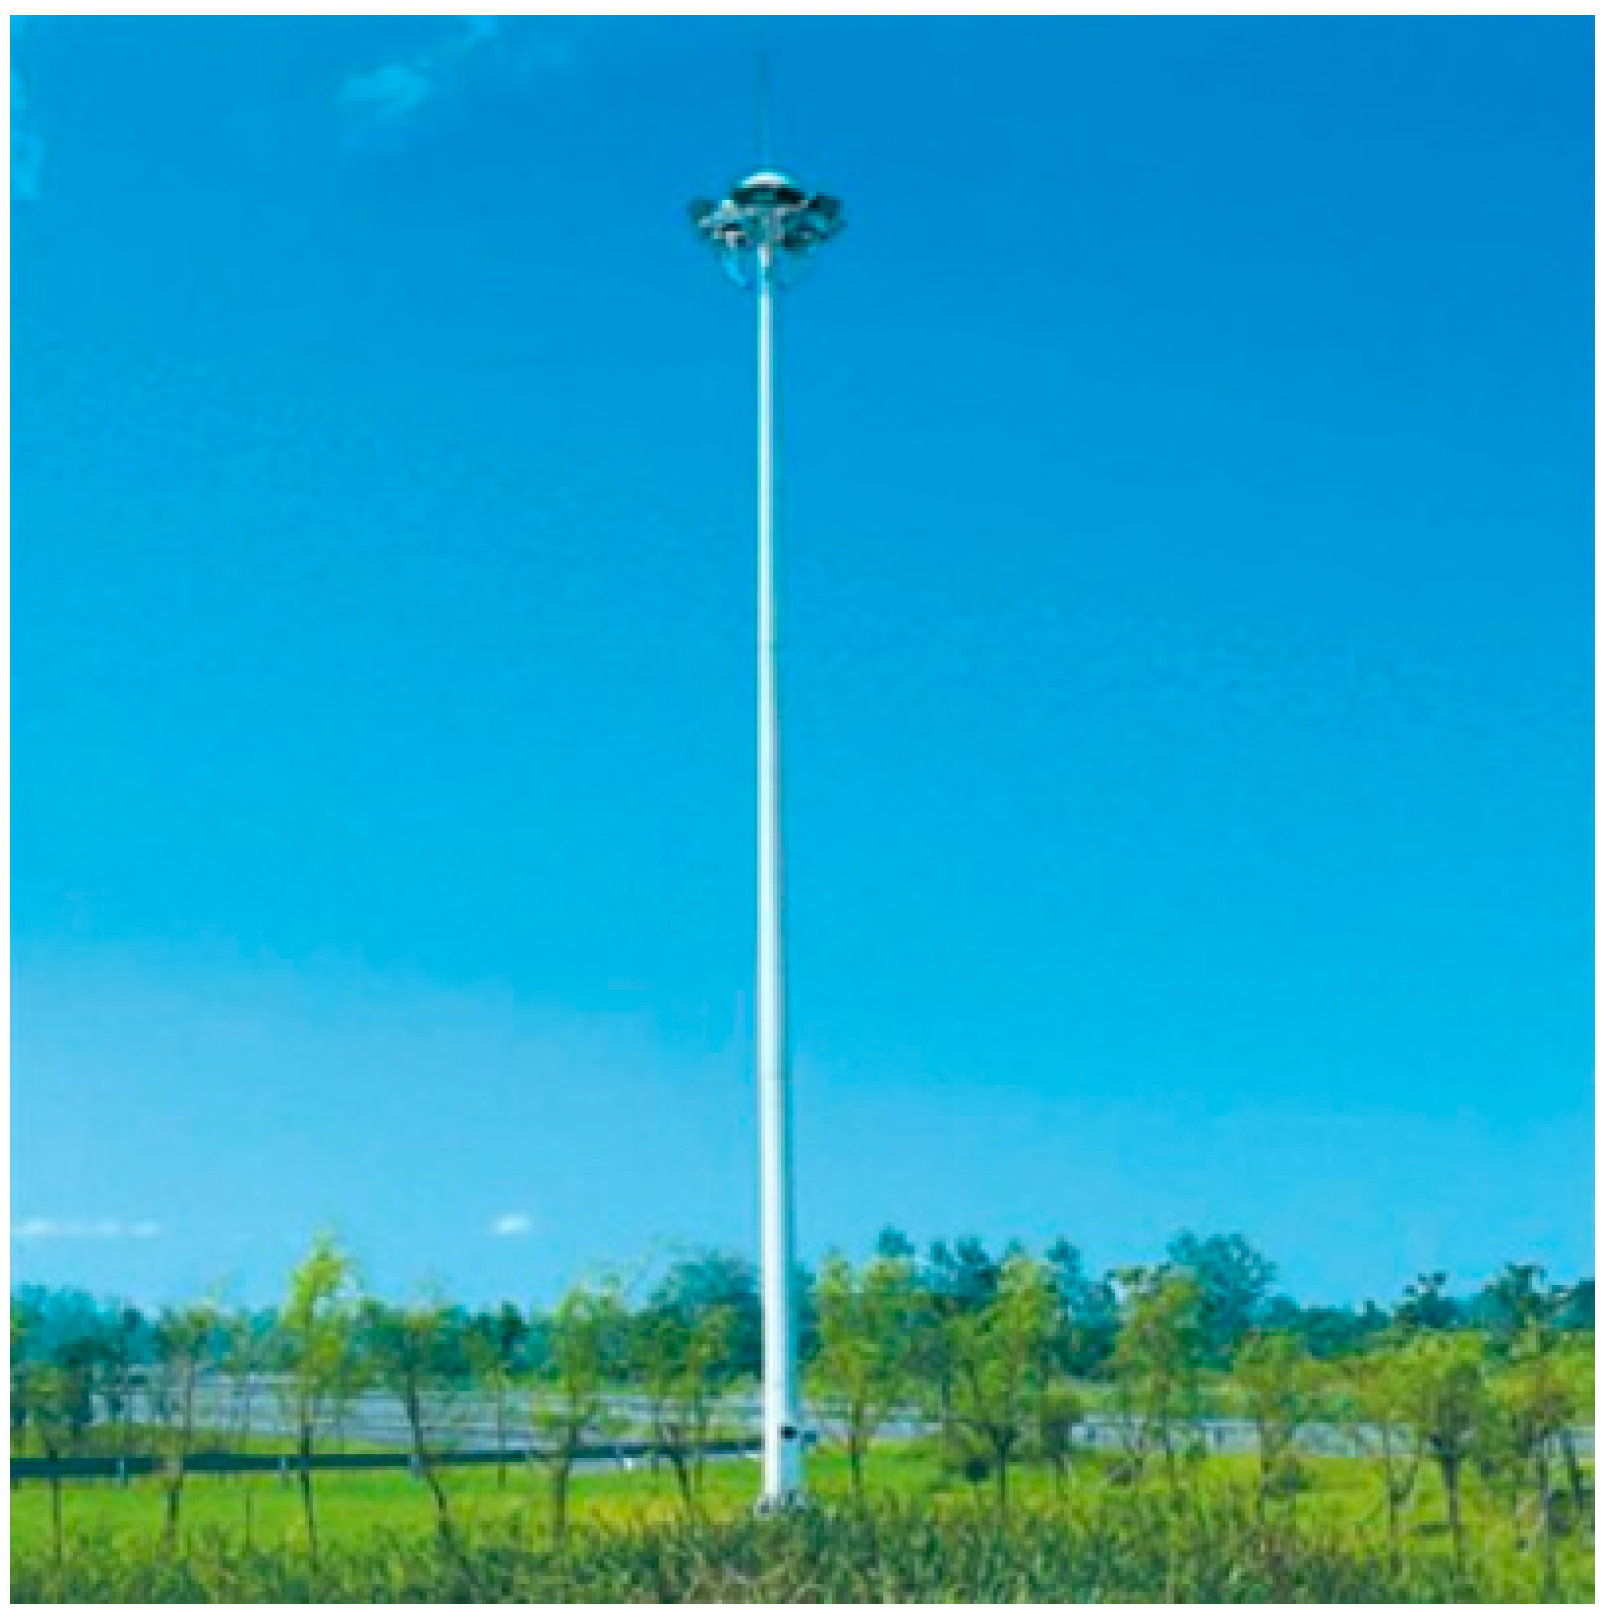
A lighting pole is a structure that holds one or more lighting bulbs, typically for outdoor lighting (Figure 1). Steel, aluminum, fiberglass, and wood are all examples of materials used to make lighting poles. They can also have a variety of shapes, including round, square, tapered, or ornamental. Lighting poles can be used to illuminate streets, parking lots, parks, stadiums, signs, and structures. Also, lighting poles have varying strengths and wind speed ratings [1].
Lighting poles are more vulnerable and susceptible to wind loads. Some damaged or collapsed lighting poles from wind storms are provided in Figure 2 [3,4].
Wind engineering studies, typically involving wind tunnel testing, are conducted for numerous significant structures. However, there is a vast class of structures that exhibit some dynamic sensitivity to wind but cannot justify the effort and expense of conducting those special particular wind engineering studies. Also, wind tunnels may not provide accurate results for circular structures like chimneys, towers, and masts due to scaling issues [5]. Therefore, it is very important to determine wind loads for lighting poles that can be classified as slender and wind sensitive structures.
In addition, modal analysis, which identifies eigenfrequencies and eigenmodes, is an extremely effective technique for determining structural features. Specifically, operational modal analysis (OMA) is a modal parameter identification technique based on vibration data acquired while the structure is in service conditions [6]. This strategy involves placing sensitive accelerometers on structures while taking into account their geometry and degrees of freedom. The collected vibration signals are then sent to a data acquisition device, and dynamic responses are available to use following signal processing in current software [7]. This method has gained much more popularity in recent years since no damage or destruction occurs on the structure. This study focuses on the wind response of a 10 m high steel lighting pole whose dynamic structural characteristics such as frequency and mode shapes were determined by Tuhta [8] with the help of OMA.
In the technical literature, some studies exist about the wind effects on lighting poles. Repetto and Solari [9] studied about the wind-induced effect for two slender and wind sensitive structures, i.e., anemometric pole and antenna tower. A fatigue analysis was provided based on a procedure proposed by the authors. Pagnini and Solari [10] performed full scale tests on light and slender steel poles and tubular towers in order to determine the effect of damping parameter on wind of these structures. Repetto and Solari [11] proposed a mathematical model for analyzing the stress cycles, damage accumulation, and fatigue life of thin vertical structures (e.g., towers, chimneys, poles, and masts) under along-wind vibrations. Caracoglia and Jones [12] investigated an experimental and numerical study about the oscillation reduction for highway lighting poles. Han et al. [13] studied the vortex-induced vibration of a tapering light pole, which was tested using a simplified aeroelastic model and a static sectional model in a wind tunnel. Mengistu et al. [14] monitored the wind and structural responses on a lighting pole to investigate downburst effects on structures. Piccardo and Solari [15] proposed a closed form method that can be utilized to determine the along-wind, crosswind, and torsional response of slender structures. Romanic et al. [16] experimentally studied the 1:50 scaled luminary pole to determine surface pressures and velocities in tornadic winds. Gonçalves et al. [17] performed a static analysis of a lamppost by utilizing Eurocode EN-40. Karaca et al. [18] determined the wind loads for a 20 m lighting tower by using Eurocode 1. In the study, the details of the calculations are provided. Erkmen [19] studied the wind vortex scattering of two oil distillation towers whose diameter and height are 3 and 68 m, respectively. Devi and Govindaraju [20] conducted a study to better understand the failures of slender flexible street pole systems when subjected to dynamic excitation from wind loads. Dilawer et al. [21] studied the design analysis of high mast lighting poles.
The detailed research of the technical literature revealed that there are no studies dealing with wind actions on lighting poles by using the procedures given in TS 498 and Eurocode 1. Therefore, it is inevitable to conduct such a comparative study for both standards. Also, the novelty of this study to the technical literature is that the change in the dynamic properties, i.e., first mode frequency of the lighting pole with the change in the wind speed, is taken into account. Generally, this cited first mode frequency change in lighting poles with the wind is ignored and the corresponding property is taken as constant throughout the calculation process. Gonçalves et al. [17] dealt with the static analysis of a lamppost by considering the first mode of the structure constant in the wind load calculations according to Eurocode EN-40. Other than this, Karaca et al. [18] studied the wind loading of a stadium lighting tower according to Eurocode 1 by considering the dynamic properties of the cited tower as constant throughout the calculations. However, throughout this study, the first mode frequency of the cited lighting pole is variable with the variable wind speed. For example, Dong et al. [22] identified that change in the wind speed affected overall dynamic parameters of the offshore wind turbine by utilizing OMA. By this way, in this study, the calculated wind loads according to Eurocode 1 changed with the variable wind speed, which include the first mode frequency of the structure in the wind load calculation procedure. The wind load calculation procedure of TS 498 does not include any dynamic properties of the structure. Also, the calculated wind loads by using both standards are applied to the same lighting pole that has constant and variable first mode frequency with the wind speed for better comparison. For both standards, an approximately 11~12% reduction in the top displacements are obtained by only considering the change in the first mode frequency with the wind speed, which has significant importance in the design. The design of lighting poles by not considering this change overestimates the structural response and the overall structural load carrying system details. Therefore, the novelty of this study to the technical literature is to identify the effect of considering the change in dynamic properties of lighting poles with different wind speeds.
The remainder of this study is classified in the following four sections: In Section 2, the general structural information and three dimensional (3D) structural model of the lighting pole with modal verification is provided. Also, the wind loading procedures of TS498 and Eurocode 1 are summarized. Section 3 is devoted to the calculation of wind loads and the results obtained from the application of these calculated wind loads to the modally verified lighting pole. A discussion follows Section 3 where the analyses results are interpreted and compared. In Section 4, the concluding remarks are provided.

2. Materials and Methods

The objective of this study is to determine the effect of change of first mode frequency on the wind response of a lighting pole according to TS498 and Eurocode 1 in a comparative manner, as there is no other study performing this in the technical literature. Therefore, a summary of the procedures of the cited standards is provided in the following sections. The scope of this study is limited to the certain wind speeds in Tuhta [8] from which the data of the cited lighting pole by OMA is obtained. Also, as stated in Tuhta [8], the linear assumption can be drawn in obtaining first mode frequency for unmeasured values of wind speed. Therefore, for 45 m/s, this linear approach is utilized in obtaining the first mode frequency of the pole.

2.1. General Properties of Lighting Pole

The lighting pole utilized in this study was chosen from the technical literature [8] to dynamically verify the finite element model (FEM) and conformity with the actual structure. By using OMA, the dynamic data of the steel lighting pole in a parking lot located in Samsun, Türkiye, depicted in Figure 3, was calculated for varying wind speeds [8].
The aforementioned lighting pole (Figure 3) is 10 m tall and composed of galvanized steel. The pole has a conical cross section that is exposed to wind influences from all directions. The top and bottom of the cited lighting pole have diameters of 10 cm and 30 cm, respectively. The thickness of the steel remains constant at 2.5 mm from bottom to top (Figure 4) [8].
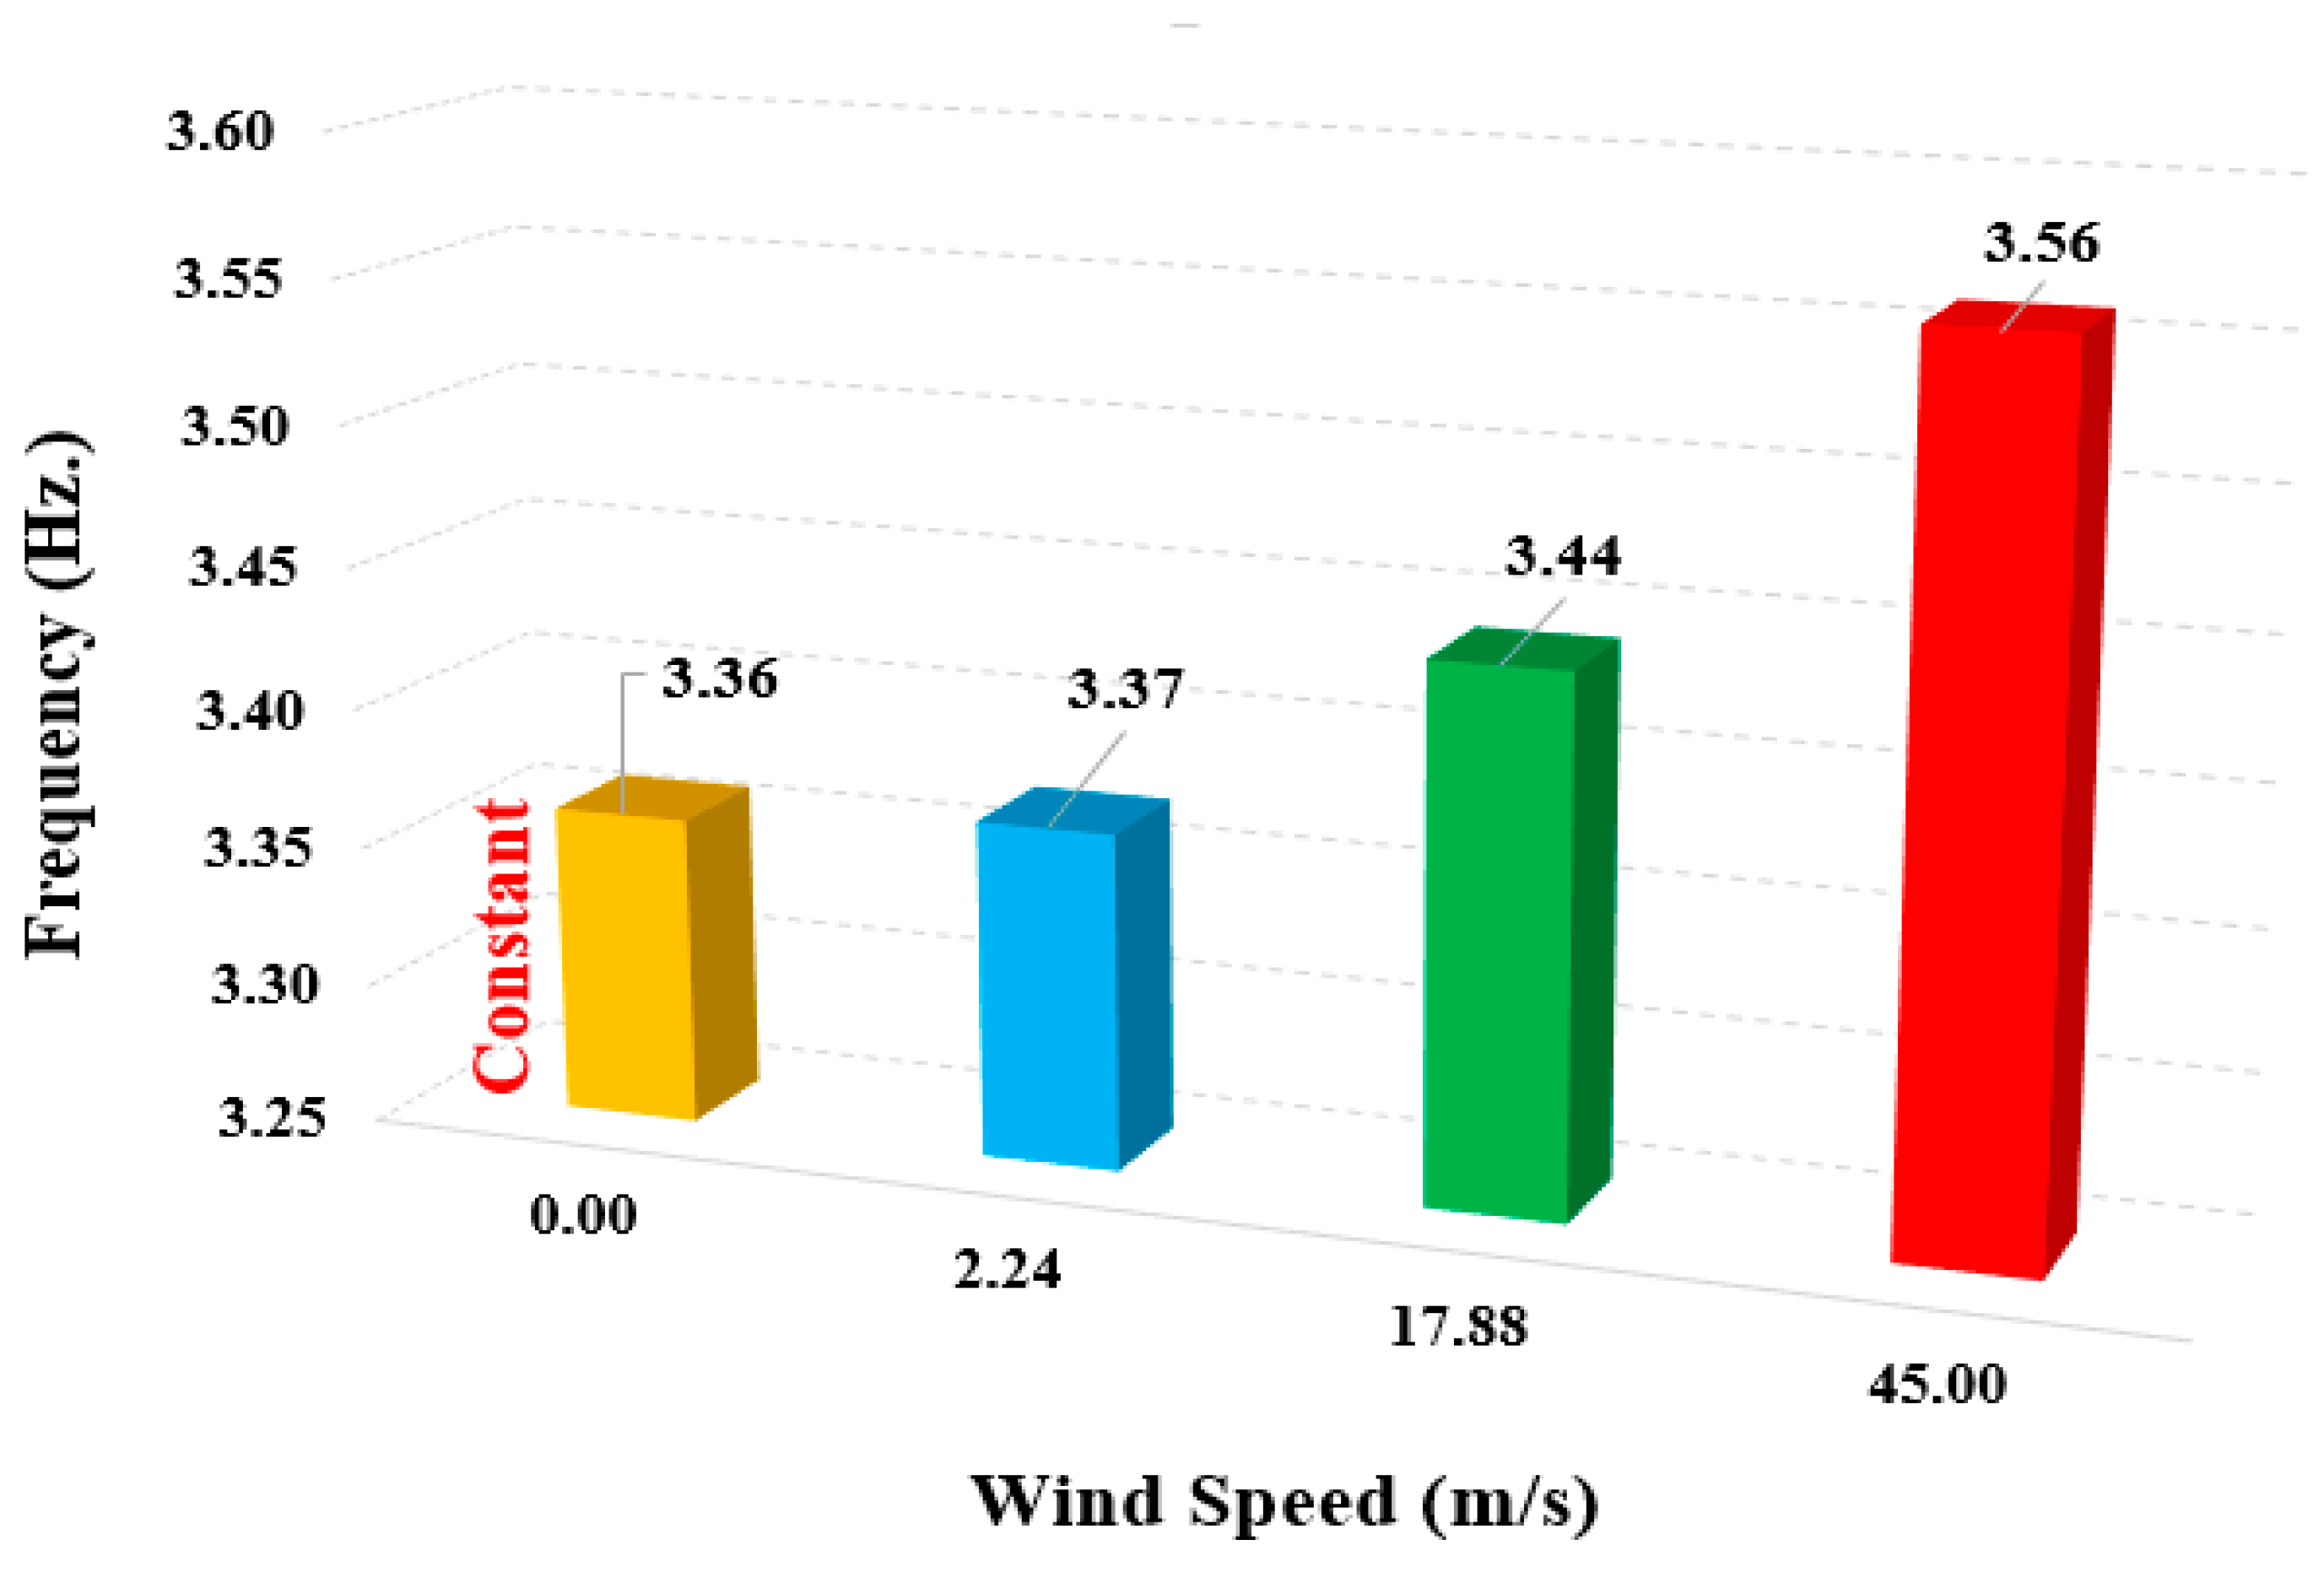
Tuhta [8] determined the dynamic data (frequencies, mode shapes, damping ratios) of the steel lighting pole for speeds of 5 mph (2.24 m/s) and 40 mph (17.88 m/s) in his OMA measurements. Also, it is stated that for other wind speeds, dynamic data can be calculated linearly. Accordingly, the first mode frequencies (Figure 5) of the considered steel lighting pole for 5 mph (2.24 m/s) and 40 mph (17.88 m/s) are 3.37 Hz and 3.44 Hz, respectively. The structure’s first mode frequency at the windless moment (at 0 m/s wind speed) is the most often used dynamic data in wind load calculations. Additionally, for the model to be verified, the mode shapes must be compatible with the verified structure. Because of this, the considered steel lighting pole’s first mode frequency in the windless moment (at 0 m/s wind speed) was determined to be 3.36 Hz using the linearity stated by Tuhta [8].
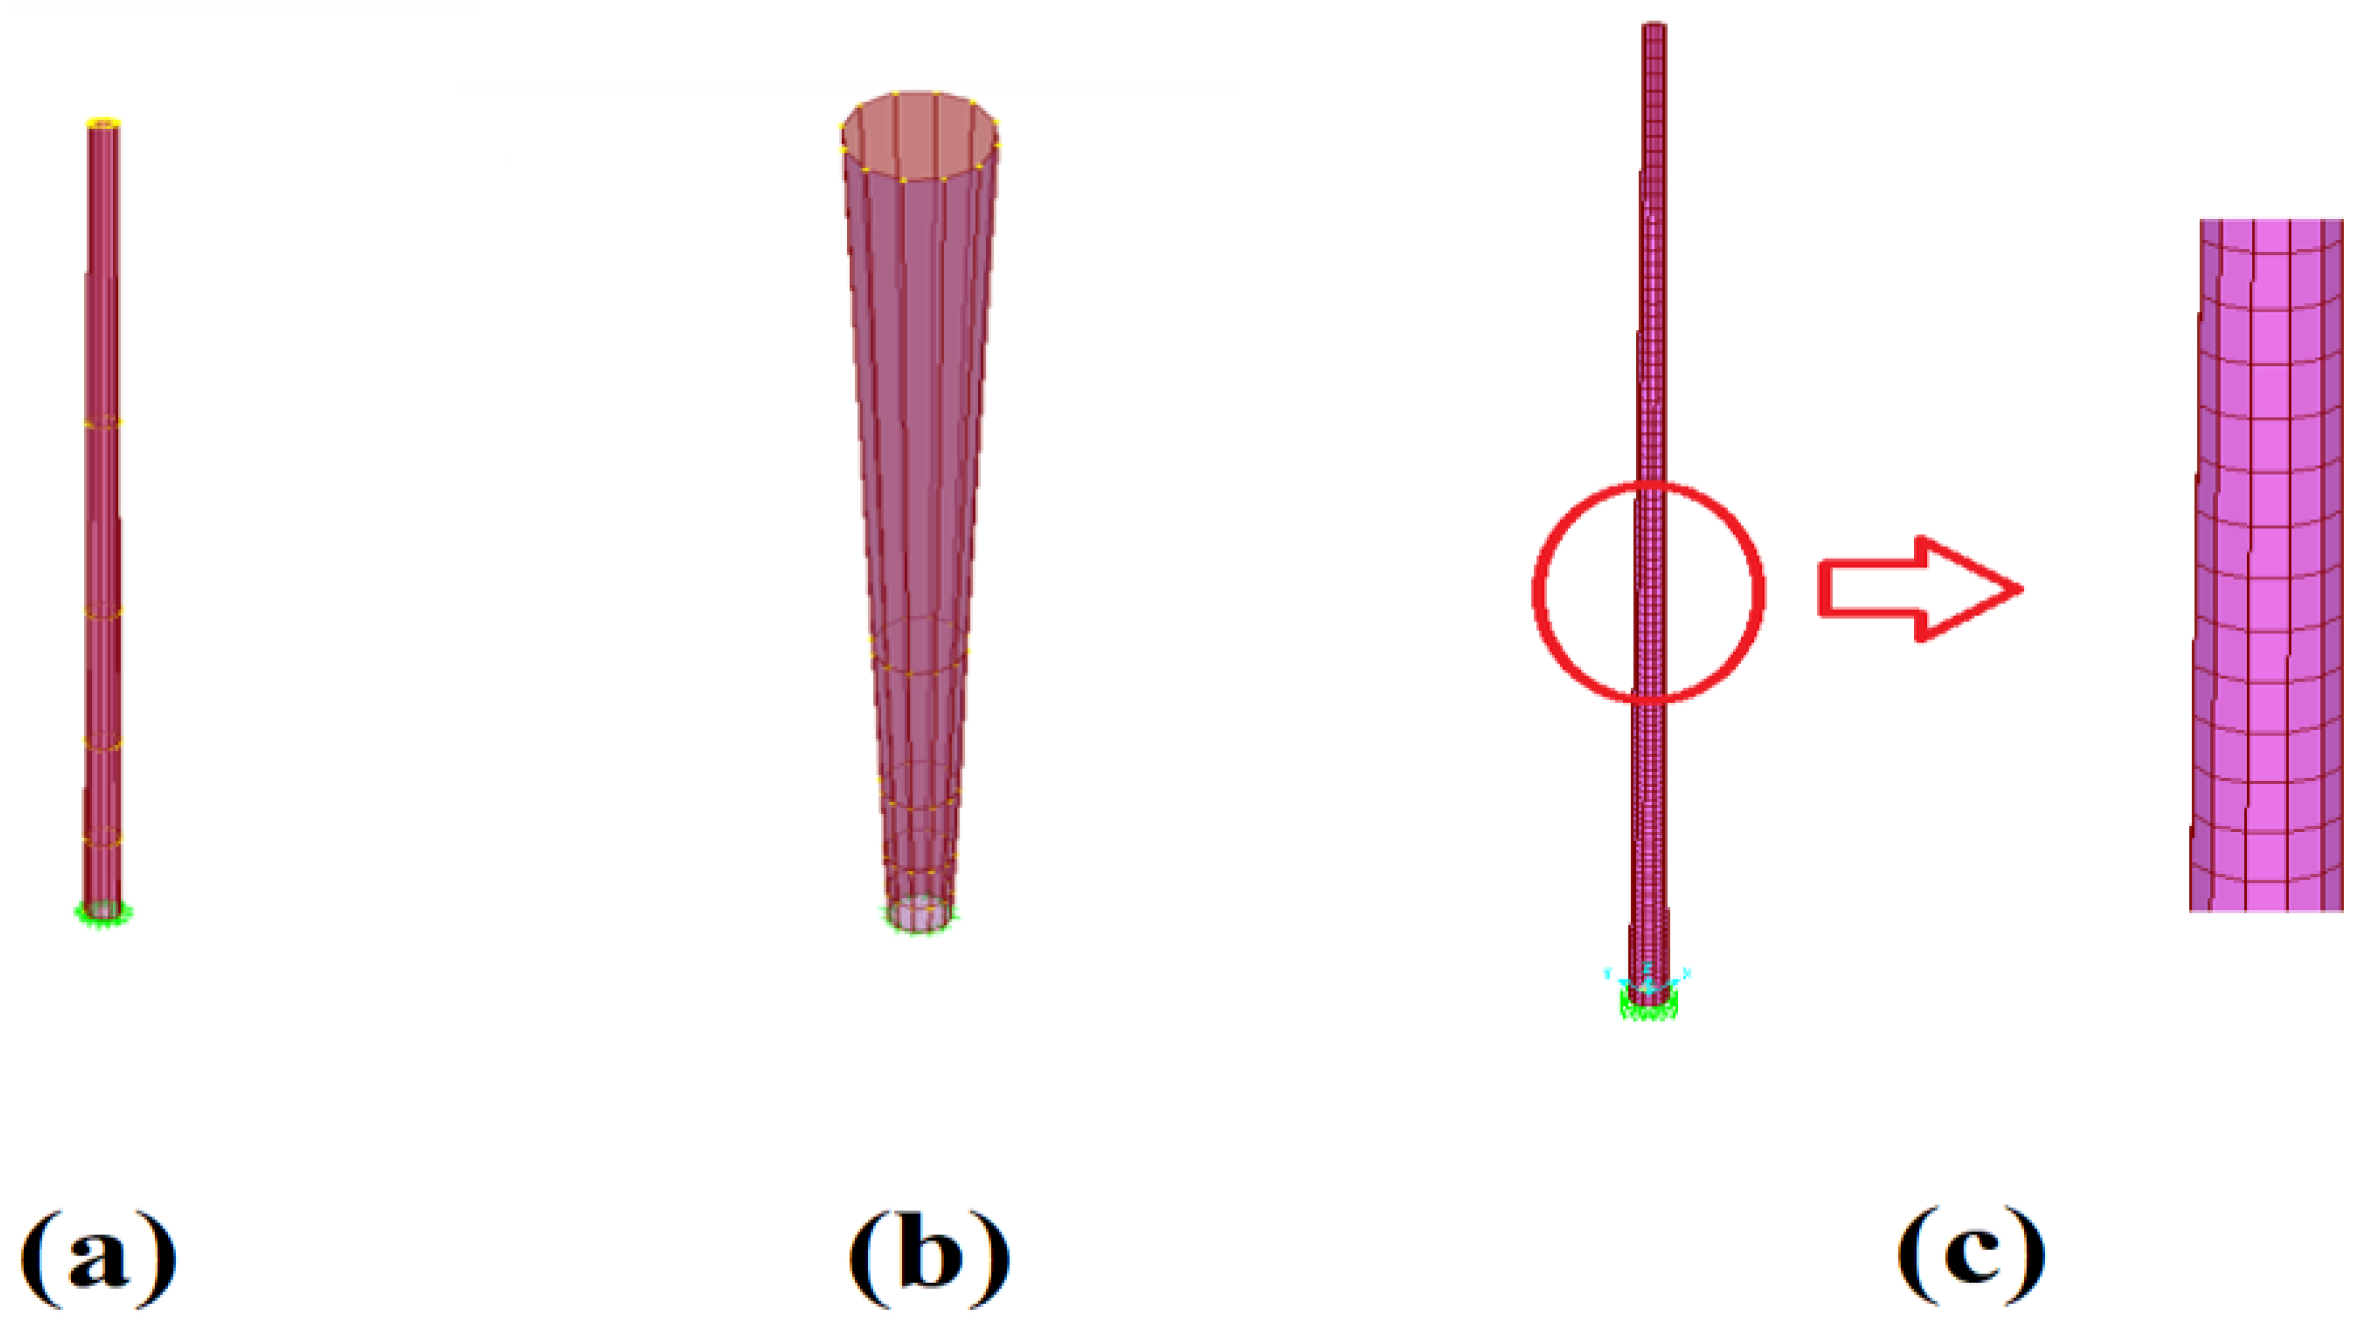
The FEM (Figure 6) of the steel lighting pole considered in this study is produced in SAP2000 V.14 [23]. In the FEM of the cited lighting pole, quadratic mesh elements with a size of 10 cm are utilized. Also, in the structural wind analysis, lighting instruments are added to the FEM of the cited lighting pole as a static load whose value is 0.5 kN, as stated by Tuhta [8].
Additionally, in order to confirm the FEM of the structure modeled in SAP2000 V.14 and apply it for structural wind load analysis, the mode shapes generated by Tuhta [8] were compared with the mode shapes obtained from this study (Figure 7).
The mode shapes obtained from the FEM in this study are compatible with the mode shapes obtained with the help of OMA by Tuhta [8]. This shows that the FEM produced in SAP2000 was validated and can be used in structural wind load analysis.

2.2. TS498

TS 498 [24] is a standard that specifies the loads to be calculated and utilized as a foundation for sizing the load-bearing structural elements in buildings, hospitals, industrial, and sports facilities. These include steel, wood, and RC constructions. In accordance with TS 498, wind load is computed by assuming that the wind direction is horizontal and that it has the greatest impact on the structure in all directions. The wind load is influenced by the structure’s geometry. Accordingly, Equation (1) is used to determine the wind loads on the structure.
W = C f · q · A
In Equation (1), Cf, q, and A denote the aerodynamic load coefficient, suction (speed pressure) (kN/m2), and affected surface area (m2), respectively. The geometry of the structure and wind direction affect the aerodynamic load coefficient (Cf) that is the result of wind tunnel tests. In this study, the value of the aerodynamic load coefficient is taken as 1.6, as specified in the cited standard. Also, the suction speed can be calculated by using Equation (2).
q = ρ v 2 2 g
In Equation (2), ρ is denoting the density of air which is 1.25 kg/m³. v is the wind speed and g is the gravitational acceleration.

2.3. Eurocode 1

Eurocode 1 [25] is a standard used in determining actions on structures including wind loads, which is used in European Union countries. The wind load procedure of Eurocode 1 covers structures up to 200 m in height [25]. According to Eurocode 1, wind load can be calculated by vector sum over individual structural elements using Equation (3) below.
F w = c s c d · c f · q p ( z e ) · A r e f
In Equation (3), cscd is the structural factor. Also, cf denotes the force coefficient for the structure or structural element. qp(ze) is defined as the peak velocity pressure at height ze. The structural factor cscd can be calculated by using Equation (4).
c s c d = 1 + 2 · k p · I v ( z e ) · B 2 + R 2 1 + 7 · I v ( z e )
kp, Iv, B2, and R2 denote the peak factor, turbulence intensity, background factor (it is safer to take this value as 1.0), and resonance response factor, respectively. T represents the average time (T is 600 s) for the average wind speed; the value of the peak factor can be calculated by using Equation (5).
k p = 2 ln v T + 0.6 2 ln ( v T )
The value found as a result of Equation (5) is compared with the kp = 3 value and the larger one is selected as the kp value. The up-crossing frequency ( v ) in Equation (5) can be obtained by utilizing Equation (6).
v = n 1 , x · R 2 B 2 + R ²
In Equation (6), n1,x denotes the first mode natural frequency of the lighting pole. Also, the turbulence intensity can be calculated by choosing either Equation (7) or Equation (8) that suits the condition provided.
I v z = σ v V m ( z ) = k I c o ( z ) · ln ( z / z 0 ) ,   z m i n z z m a x
I v z = k I c o ( z m i n ) · ln ( z m i n / z 0 ) , z z m i n
In Equations (7) and (8), V m z , c o , z 0 , k I , and σ v denote the mean wind speed, orography factor (can be obtained from the related standard), roughness length, turbulence factor value, and standard deviation of the wind turbulence. The values of z0, zmin, and zmax can be obtained from the related standard. The resonance response factor in Equation (4) can be calculated by using Equation (9).
R 2 = 2 · π · F · b · h δ s + δ a
In Equation (9), F is the wind energy spectrum. Also, øb and øh denote the size effect that are the breadth and height of the structure, respectively. δs is the structural damping expressed by the logarithmic decrement. Lastly, δa denotes the aerodynamic damping. The force coefficient for a finite circular cylinder in Equation (3) can be calculated by using Equation (10),
C f = C f , 0 · ψ λ
where Cf,0 and ψλ denote the force coefficient of cylinders without free-end flow and end-effect factor, respectively. The force coefficient of cylinders without free-end flow Cf,0 can be obtained from the graph provided in the standard according to different Reynolds numbers.
Lastly, the peak velocity pressure at height ze in Equation (3) can be obtained by utilizing Equation (11).
q p z = 1 + 7 · I v ( z ) · 1 2 · ρ · V m 2 ( z )
In this study, ρ denotes the density of air, which is 1.25 kg/m3. Also, Vm(z) is the mean wind velocity at a height z above the terrain, which is calculated by using logarithmic velocity profile. More details about the wind load calculation can be obtained from the cited standard.

2.4. Türkiye Wind Map

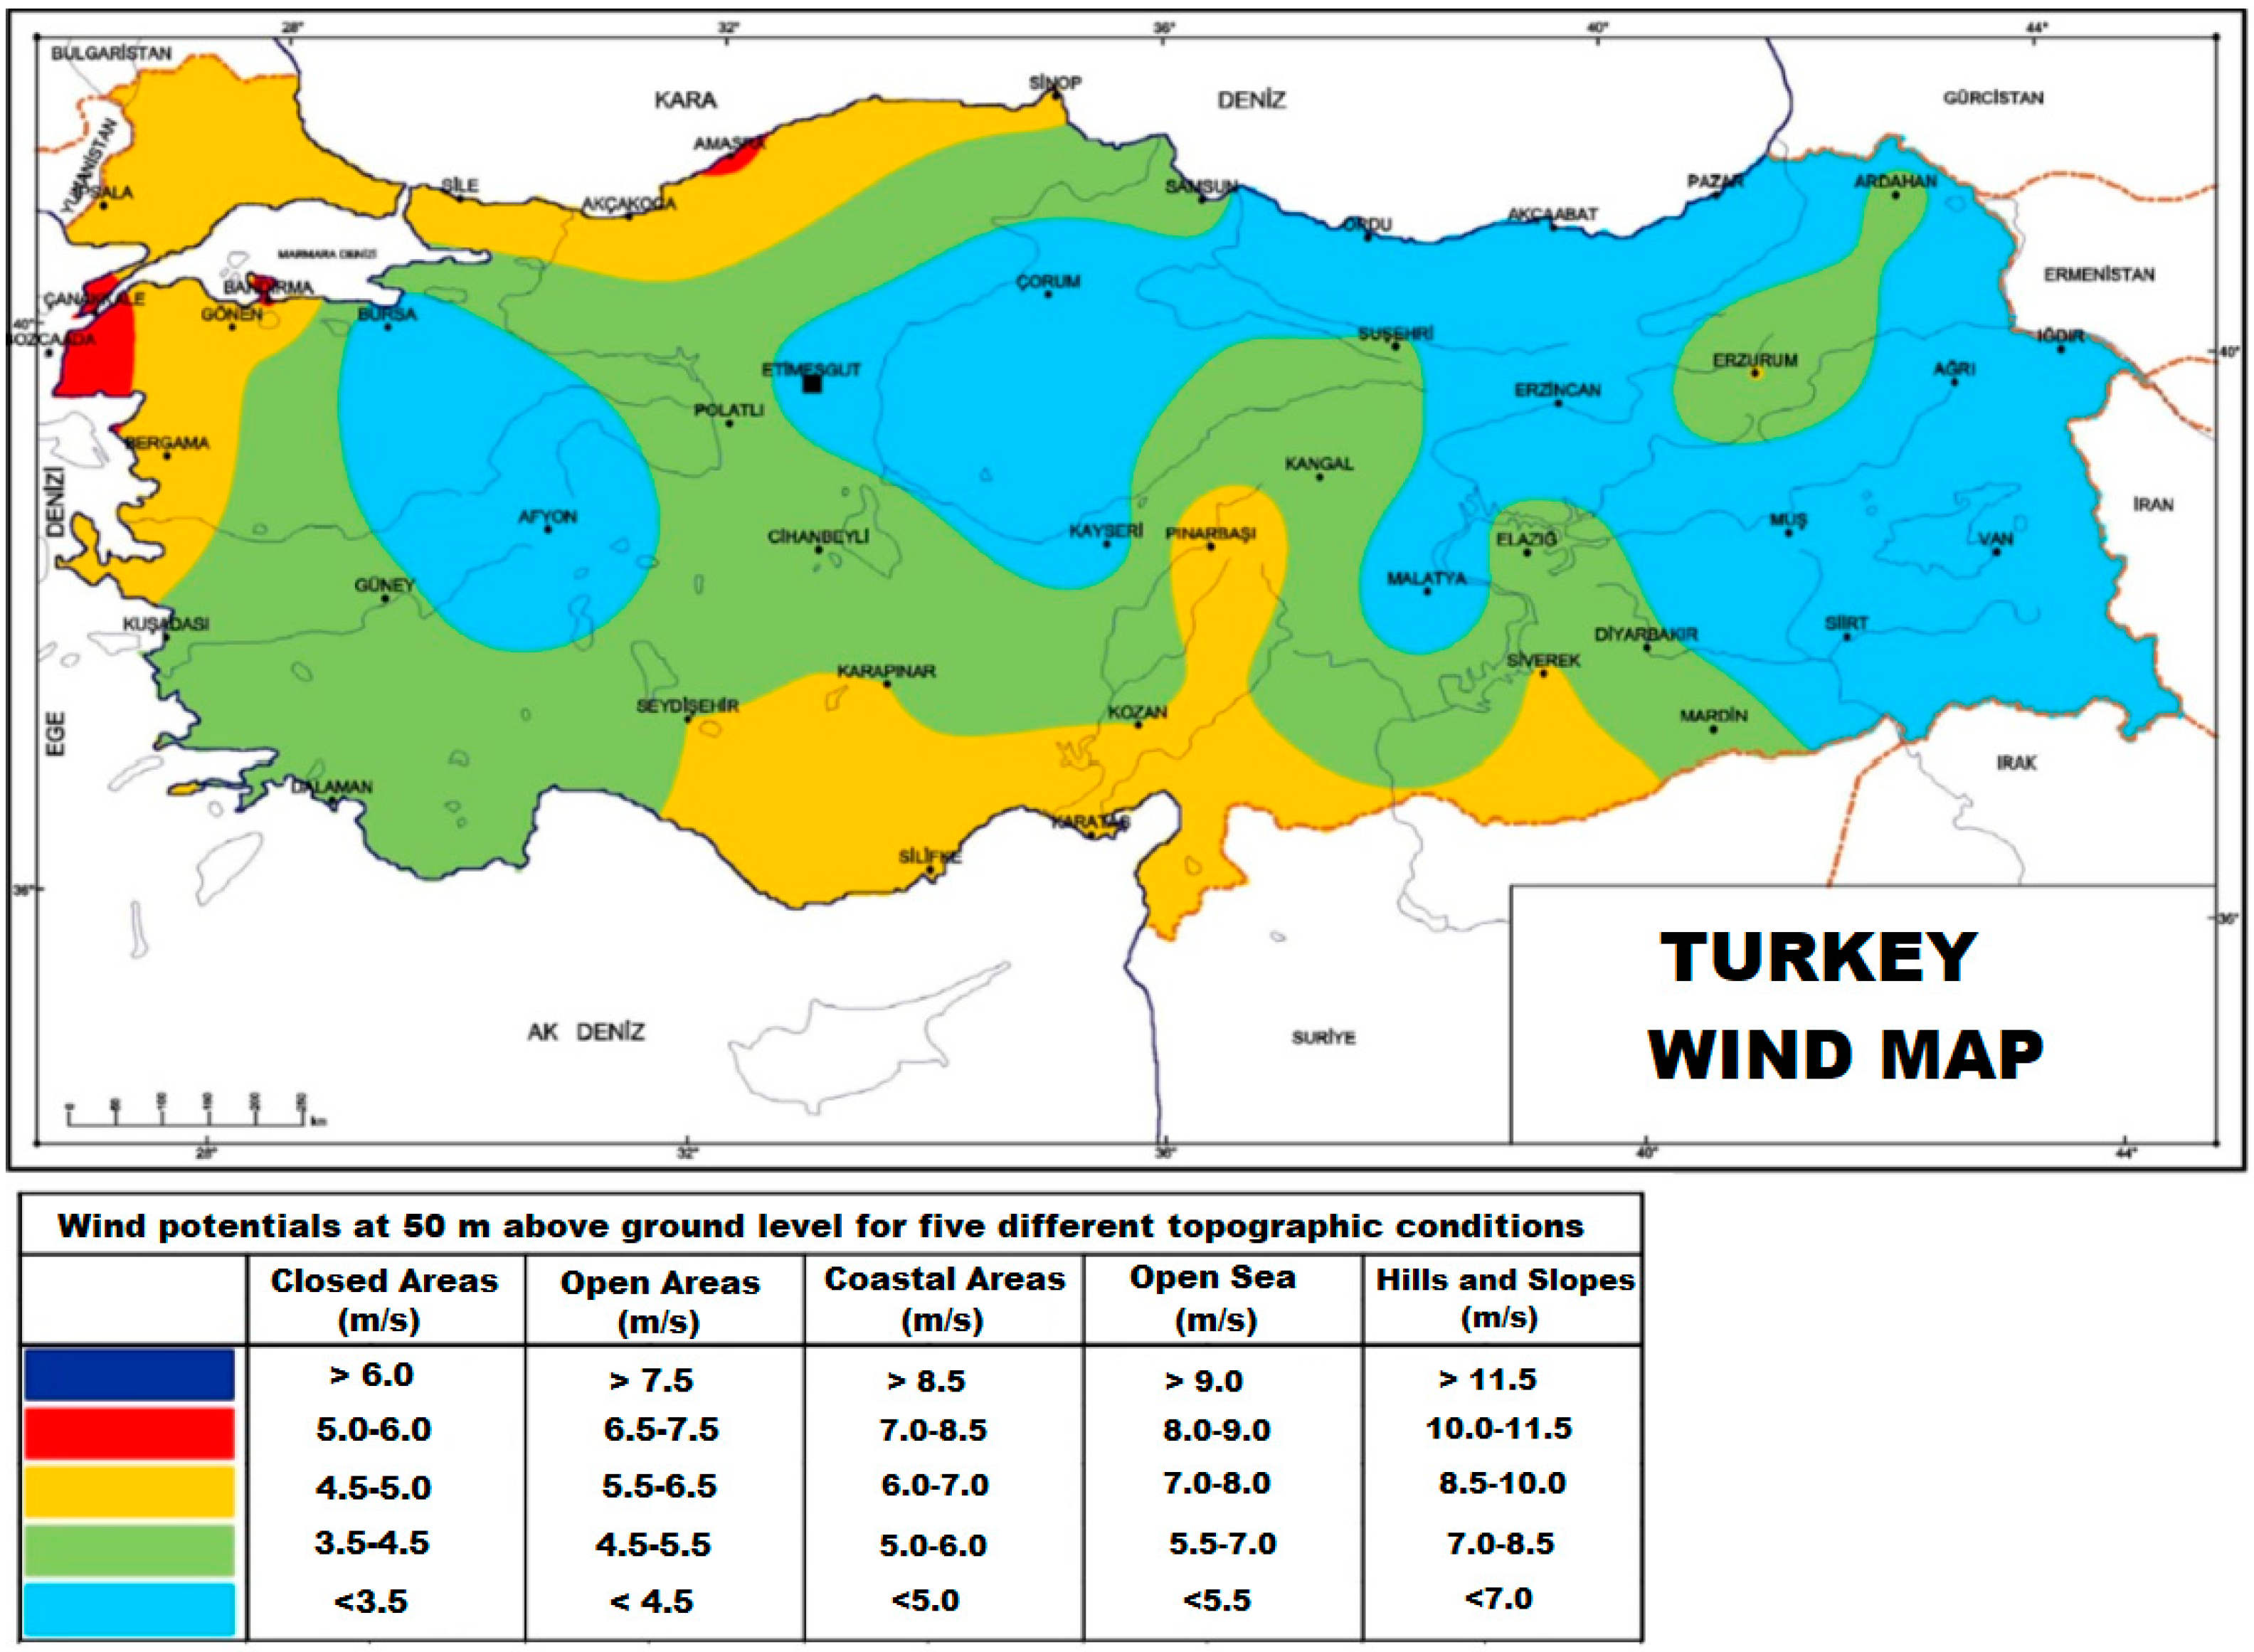
The General Directorate of Energy Affairs Studies (EİE) conducted studies that identified wind-rich areas such as Bandırma, Antakya, Kumköy, Mardin, Sinop, Gökçeada, Çorlu, and Çanakkale all located in Türkiye. Local wind potential determination studies were also conducted in Bandırma, Bozcaada, Çeşme, Gökçeada, Çanakkale, Karadeniz Ereğlisi, Florya, and Siverek (located in Türkiye). Potentials for wind energy are calculated using a variety of techniques. The Danish Meteorological Organization’s WASP (Wind Atlas Analysis and Application Program) program, which was used to create the European Wind Atlas, was utilized in this map to gather wind atlas data. The map made use of hourly wind data from 45 meteorological sites spread evenly [26]. In Figure 8, the Türkiye Wind Map is provided.
The average wind potential values at 50 m above ground level for five distinct topographic conditions—closed lands, open lands, coasts, open seas, and hills and slopes—are displayed in the Türkiye Wind Map in Figure 8. Storm wind speed was used especially for this study, and average values from the Turkish Wind Map were taken into account.

3. Results

This section of the study focuses on the structural analysis results that were achieved by applying the determined wind loads to the cited lighting pole in accordance with TS 498 and Eurocode 1 standards (for various wind speeds). The first mode frequency is typically the most significant dynamic parameter of the structure included in the wind load calculation techniques defined by the standards. Even when the wind speed varies, the first mode frequency is taken into account as a constant in the computations. Nevertheless, the fact that the structure’s first mode frequency fluctuates in response to wind speed was considered in this work, and a comparison with the scenario in which the structure’s first mode frequency is constant with wind speed was conducted.
Tuhta [8] determined the cited lighting pole’s dynamic data at two different speeds: 5 mph (2.24 m/s) and 40 mph (17.88 m/s). In this study, in order to calculate wind loads in accordance with TS 498 and Eurocode 1 standards, these speeds were taken into consideration. Moreover, the maximum wind speed recorded in Turkey was 48.9 m/s; for the sake of this study, calculations were performed using 45 m/s (100.66 mph) as the maximum wind speed [27].
In this study, only along-wind loads are taken into account as no across-wind forces or turbulence effects are taken into account. Also, the cited lighting pole is located on a region that is in “sea or coastal area exposed to the open sea”, as indicated in Eurocode 1. Therefore, the related parameters are selected by considering this layer boundary condition.

3.1. Wind Load Calculations According to TS498

The first mode frequency in the wind load calculation process is not included in any equation in the TS 498 standard. The wind loads determined in accordance with TS 498 are therefore unaffected by changes in first mode frequency. In this instance, the same wind loads were computed for the situations in which the first mode frequency was variable and not affected by wind speed. Wind speed is the only variable that affects the wind load as determined by TS 498. Table 1, Table 2 and Table 3 display the calculated wind loads for three different speeds: 5 mph (2.24 m/s), 40 mph (17.88 m/s), and 100.88 mph (45 m/s).

3.2. Wind Load Calculations According to Eurocode 1

As proposed by Tuhta [8], the first mode frequency varies with wind speed in the present study. In this instance, for comparison purposes, the wind loads are calculated independently using the first mode frequency as though the structure were in a windless area (referred to as the “constant” in this study) and assuming that the structure’s first mode frequency varies with wind speed (referred to as the “variable” in this study).

3.2.1. Constant First Mode Frequency with Wind Speed

In this part of the study, the first mode frequency is treated as a constant throughout the calculations as though the structure were in a windless area (referred to as the “constant” in this study) (Table 4, Table 5 and Table 6). In other words, the dynamic properties of the cited lighting pole, i.e., first mode frequency, are not influenced by the change in wind speed.

3.2.2. Variable First Mode Frequency with Wind Speed

The following tables (Table 7, Table 8 and Table 9) provide wind load calculations for situations in which the mentioned lighting pole’s first mode frequency varies due to varying wind speeds.

3.3. Comparison of Wind Loads

In this section of the study, the wind loads obtained in the preceding section are compared with each other according to different wind speeds and the details are provided in Table 10, Table 11 and Table 12.

3.4. Application of Wind Loads to Lighting Pole

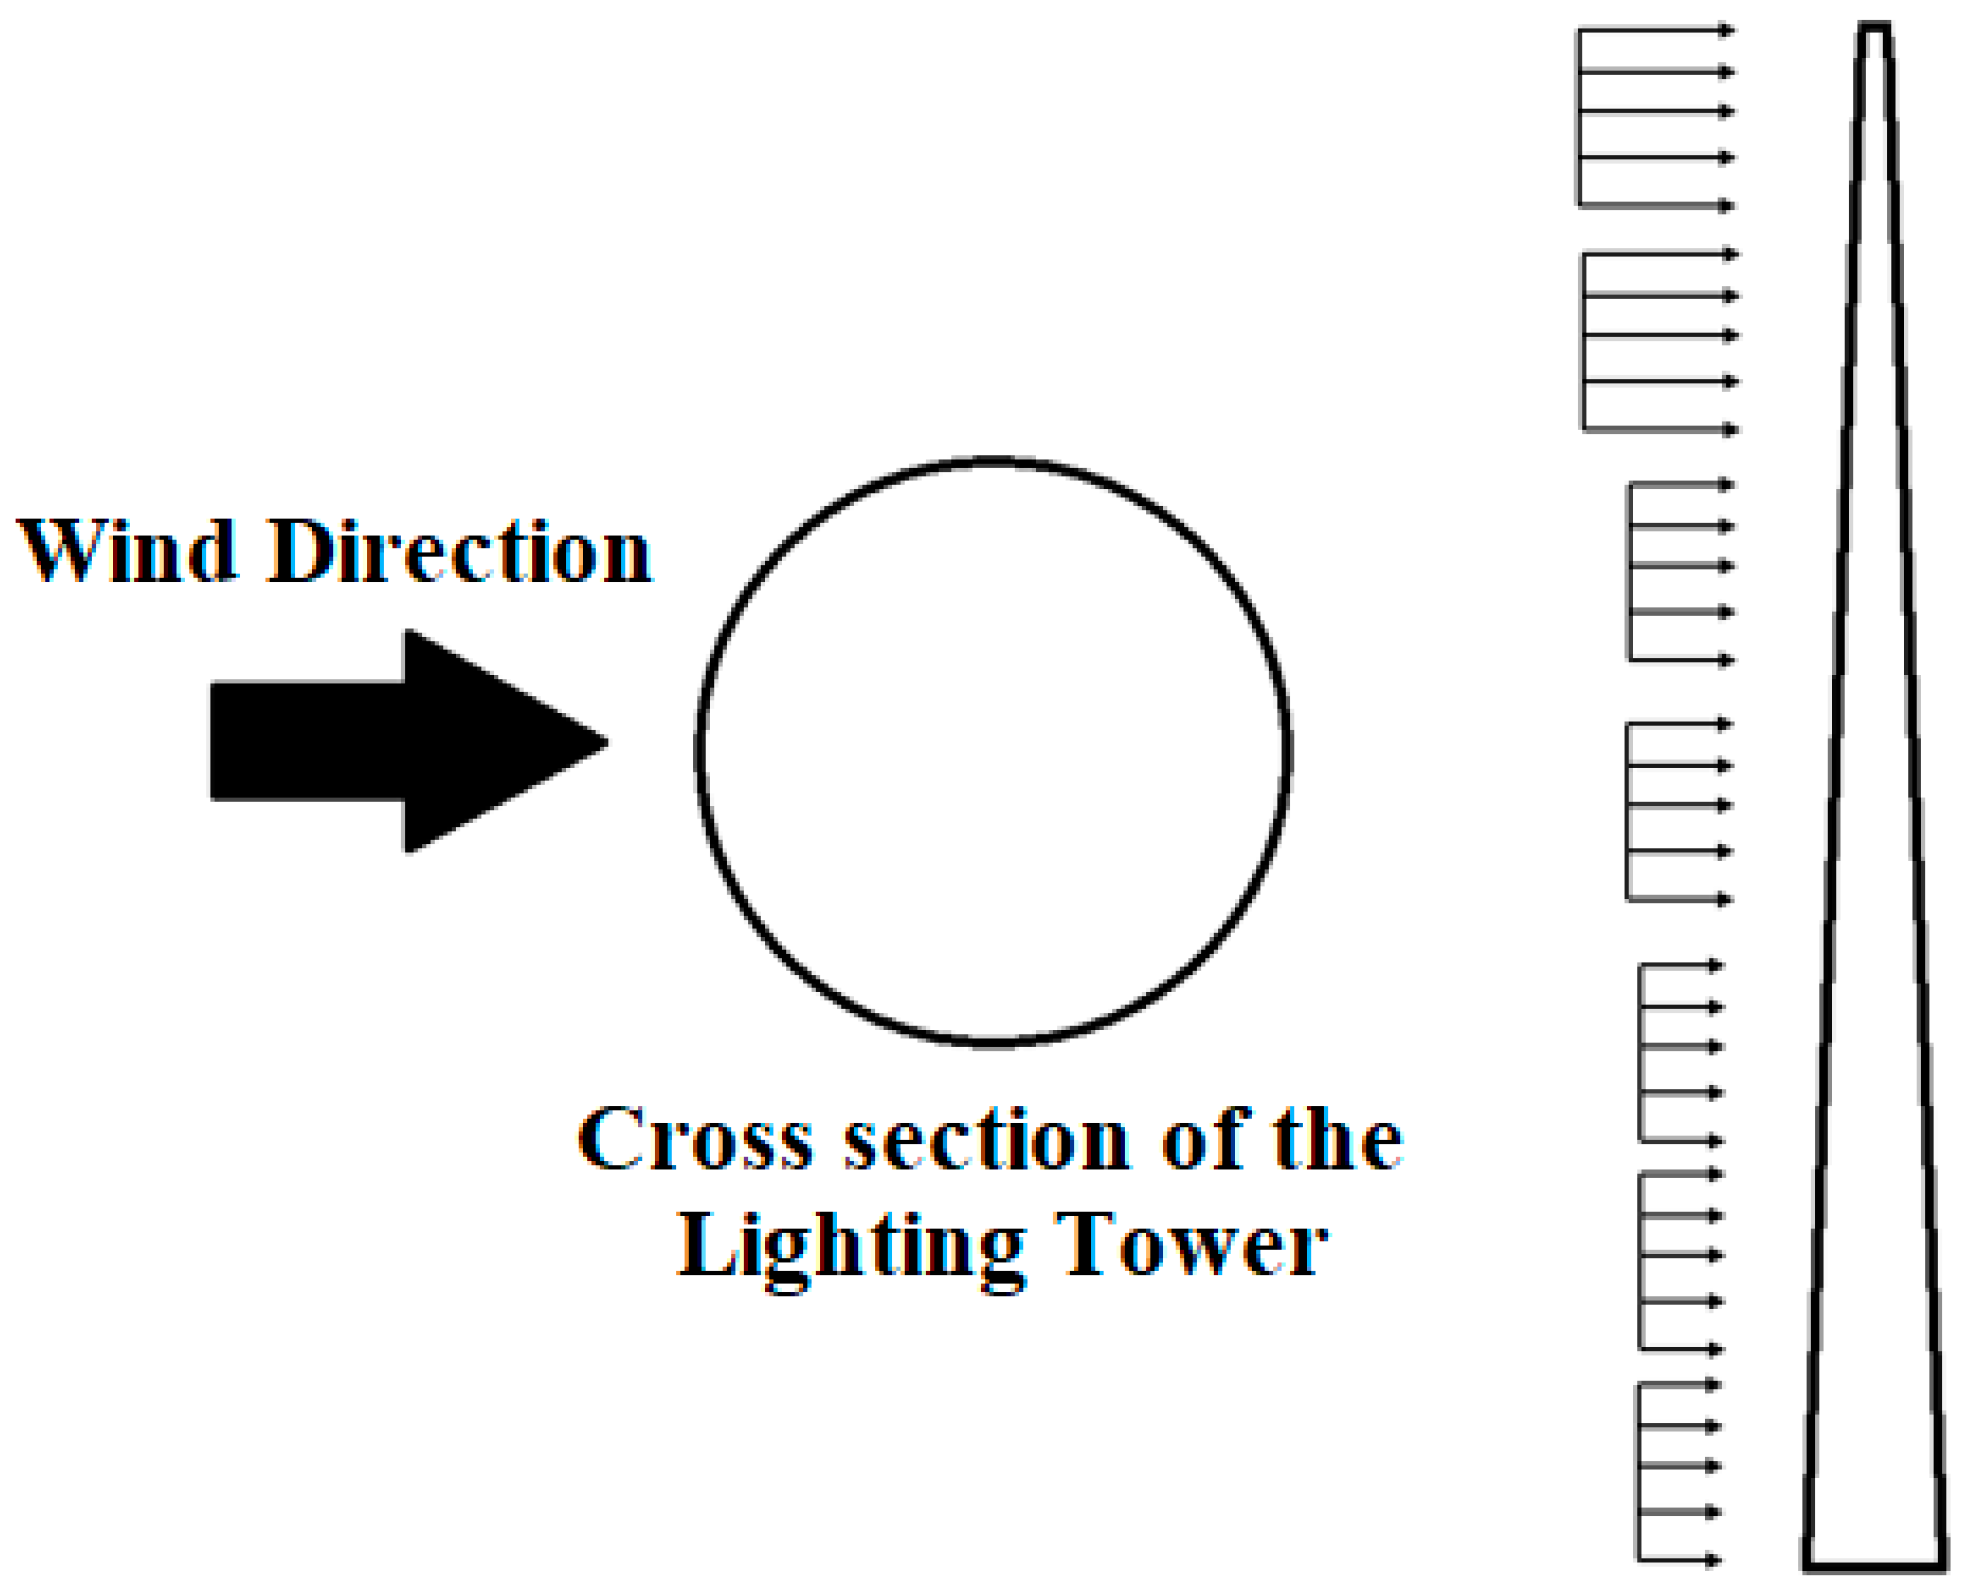
The cited lighting pole was subjected to wind loads determined by TS498 and Eurocode 1 standards obtained in the preceding section. This subjection of the obtained wind loads in the wind direction and as a static load are shown in Figure 9. In this study, the structure’s first mode frequency is treated as variable with wind speed, as proposed by Tuhta [8]. In this manner, wind loads are calculated independently for two cases. In the first case, the first mode frequency is considered constant as though the dynamic properties of the structure were obtained as in a windless location. For the second case, the structure’s first mode frequency is treated as variable with the varying wind speed. At the end, the differences in the two cases were compared with each other.

3.5. Structural Analysis Results

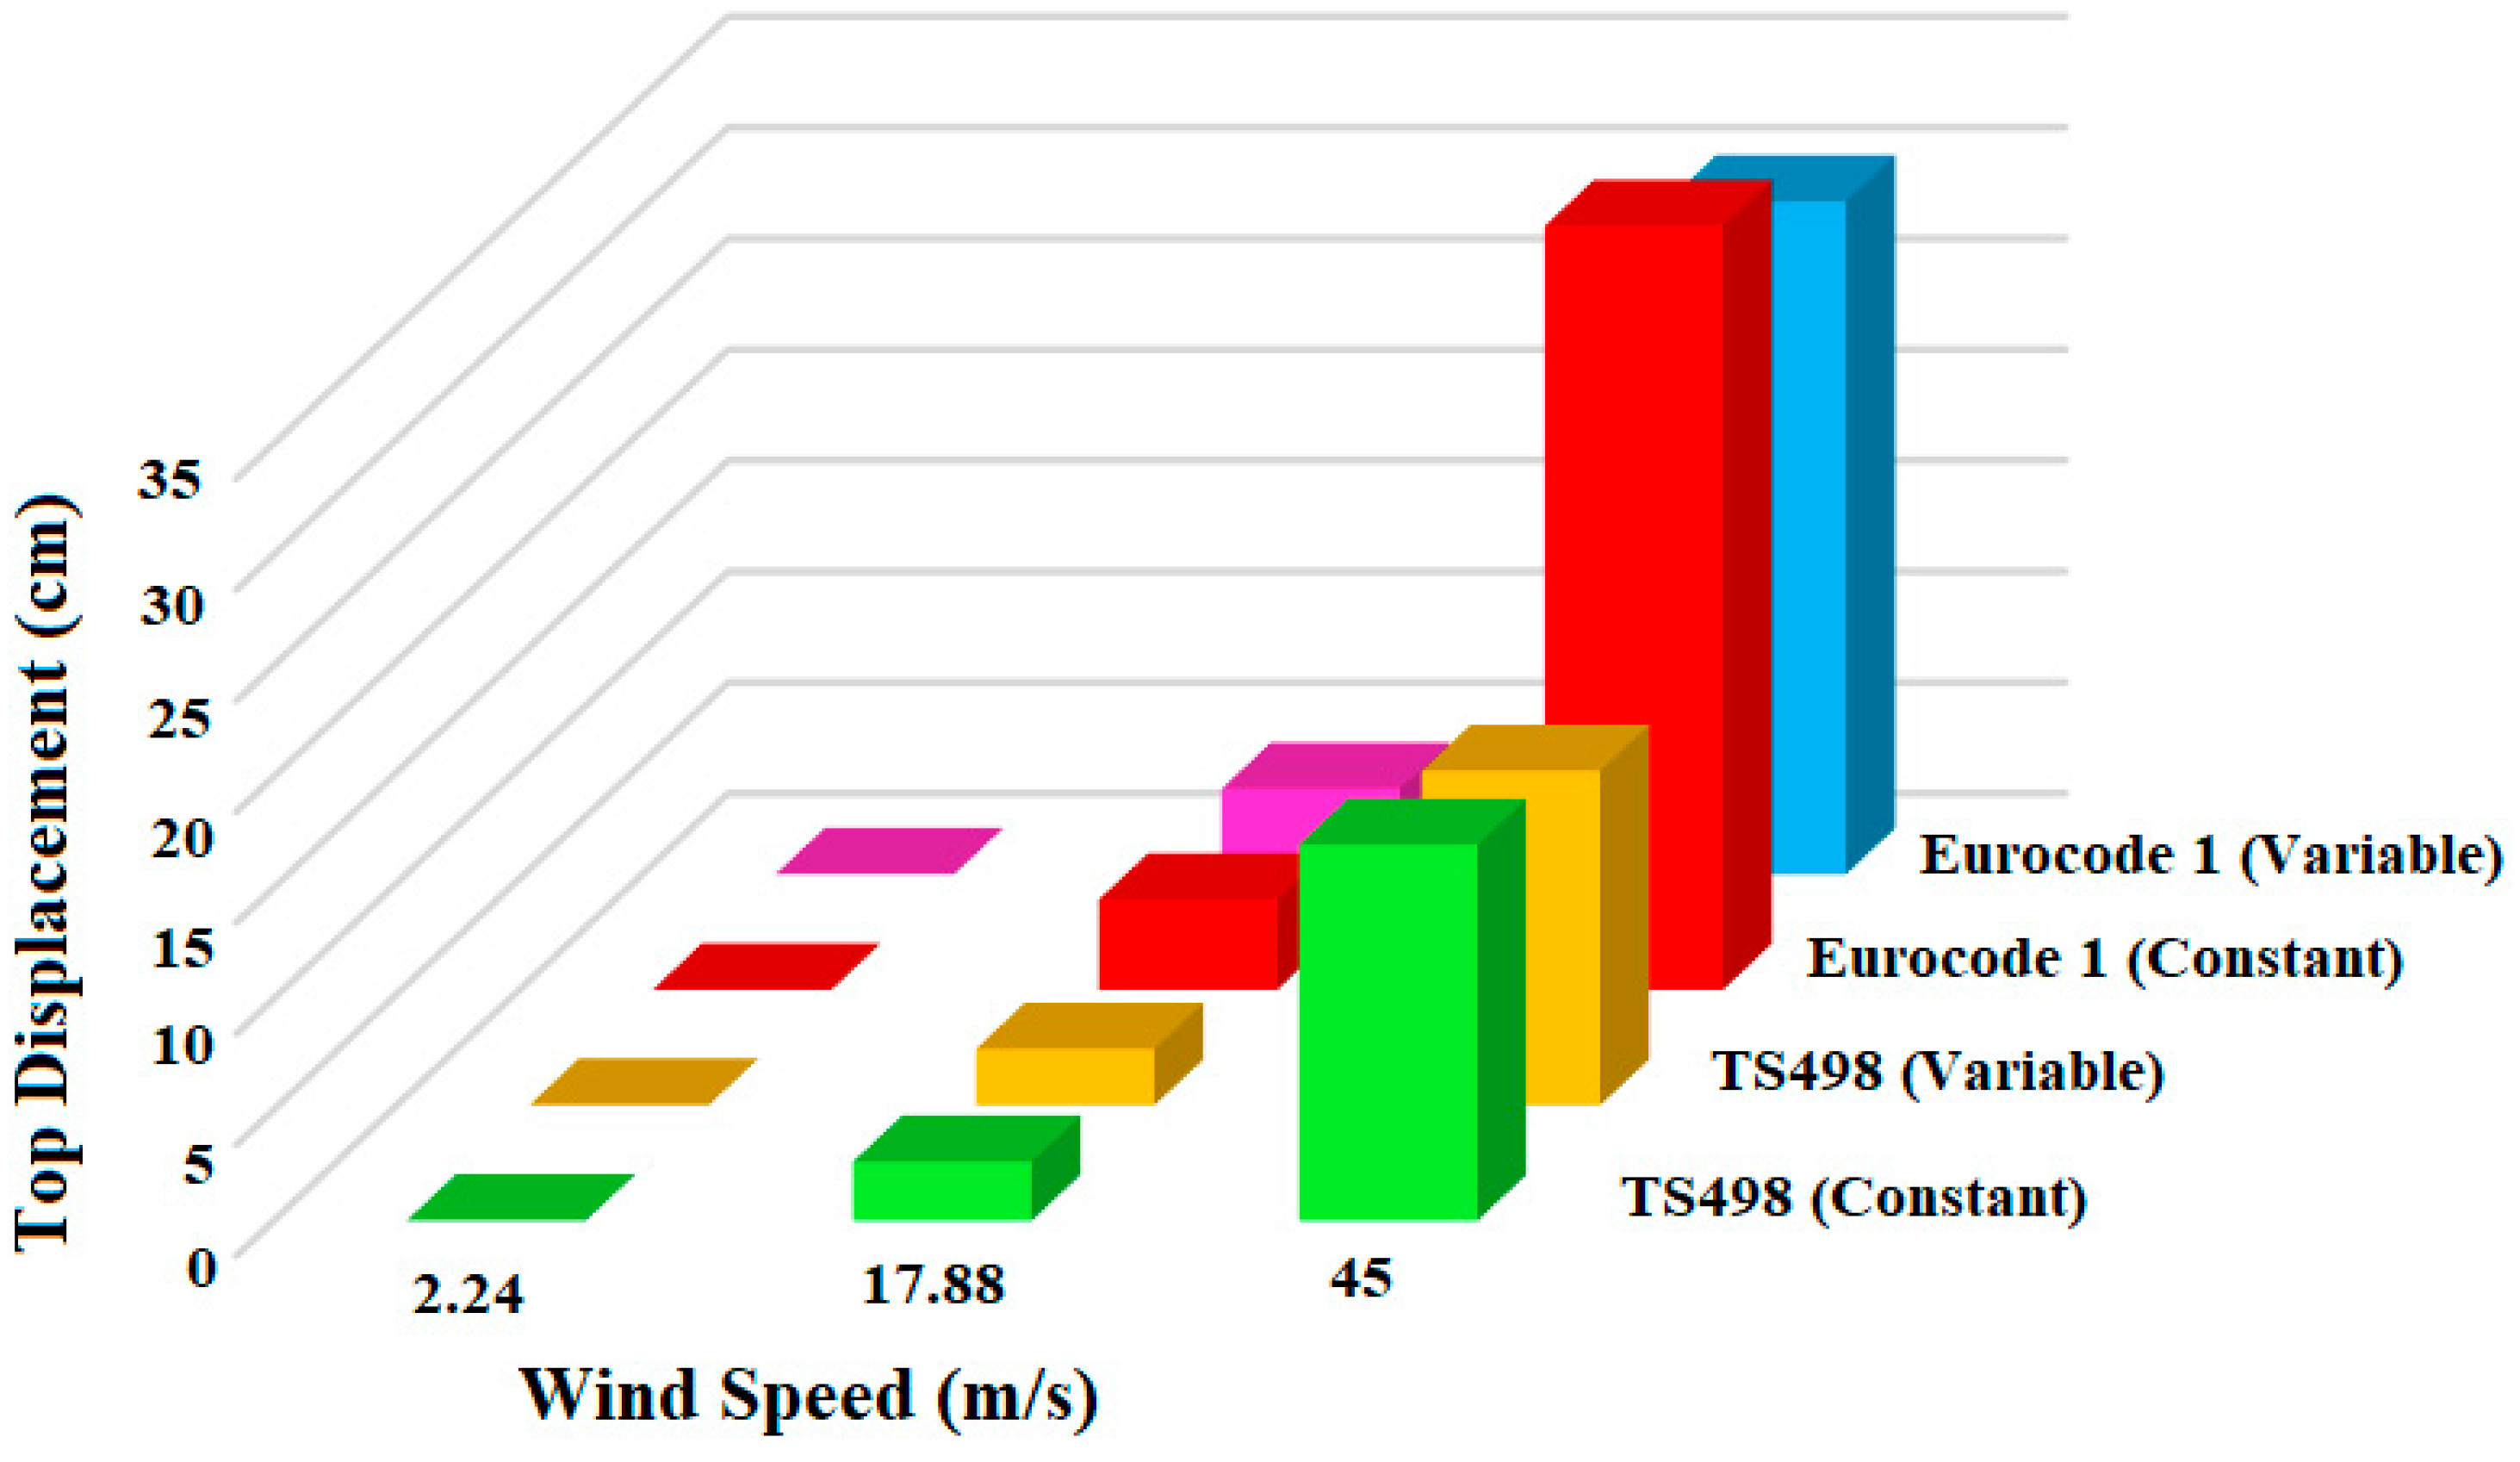
Table 13 displays the windward top displacements of the lighting pole as a result of the application of the wind loads determined in the preceding sections of the study.
For better visualization, the values provided in Table 13 are represented in Figure 10 for different wind speeds and different standards.
In Eurocode 3 [28], the maximum value of the windward peak displacement of steel chimneys should not be exceeded.
δ m a x = h 50
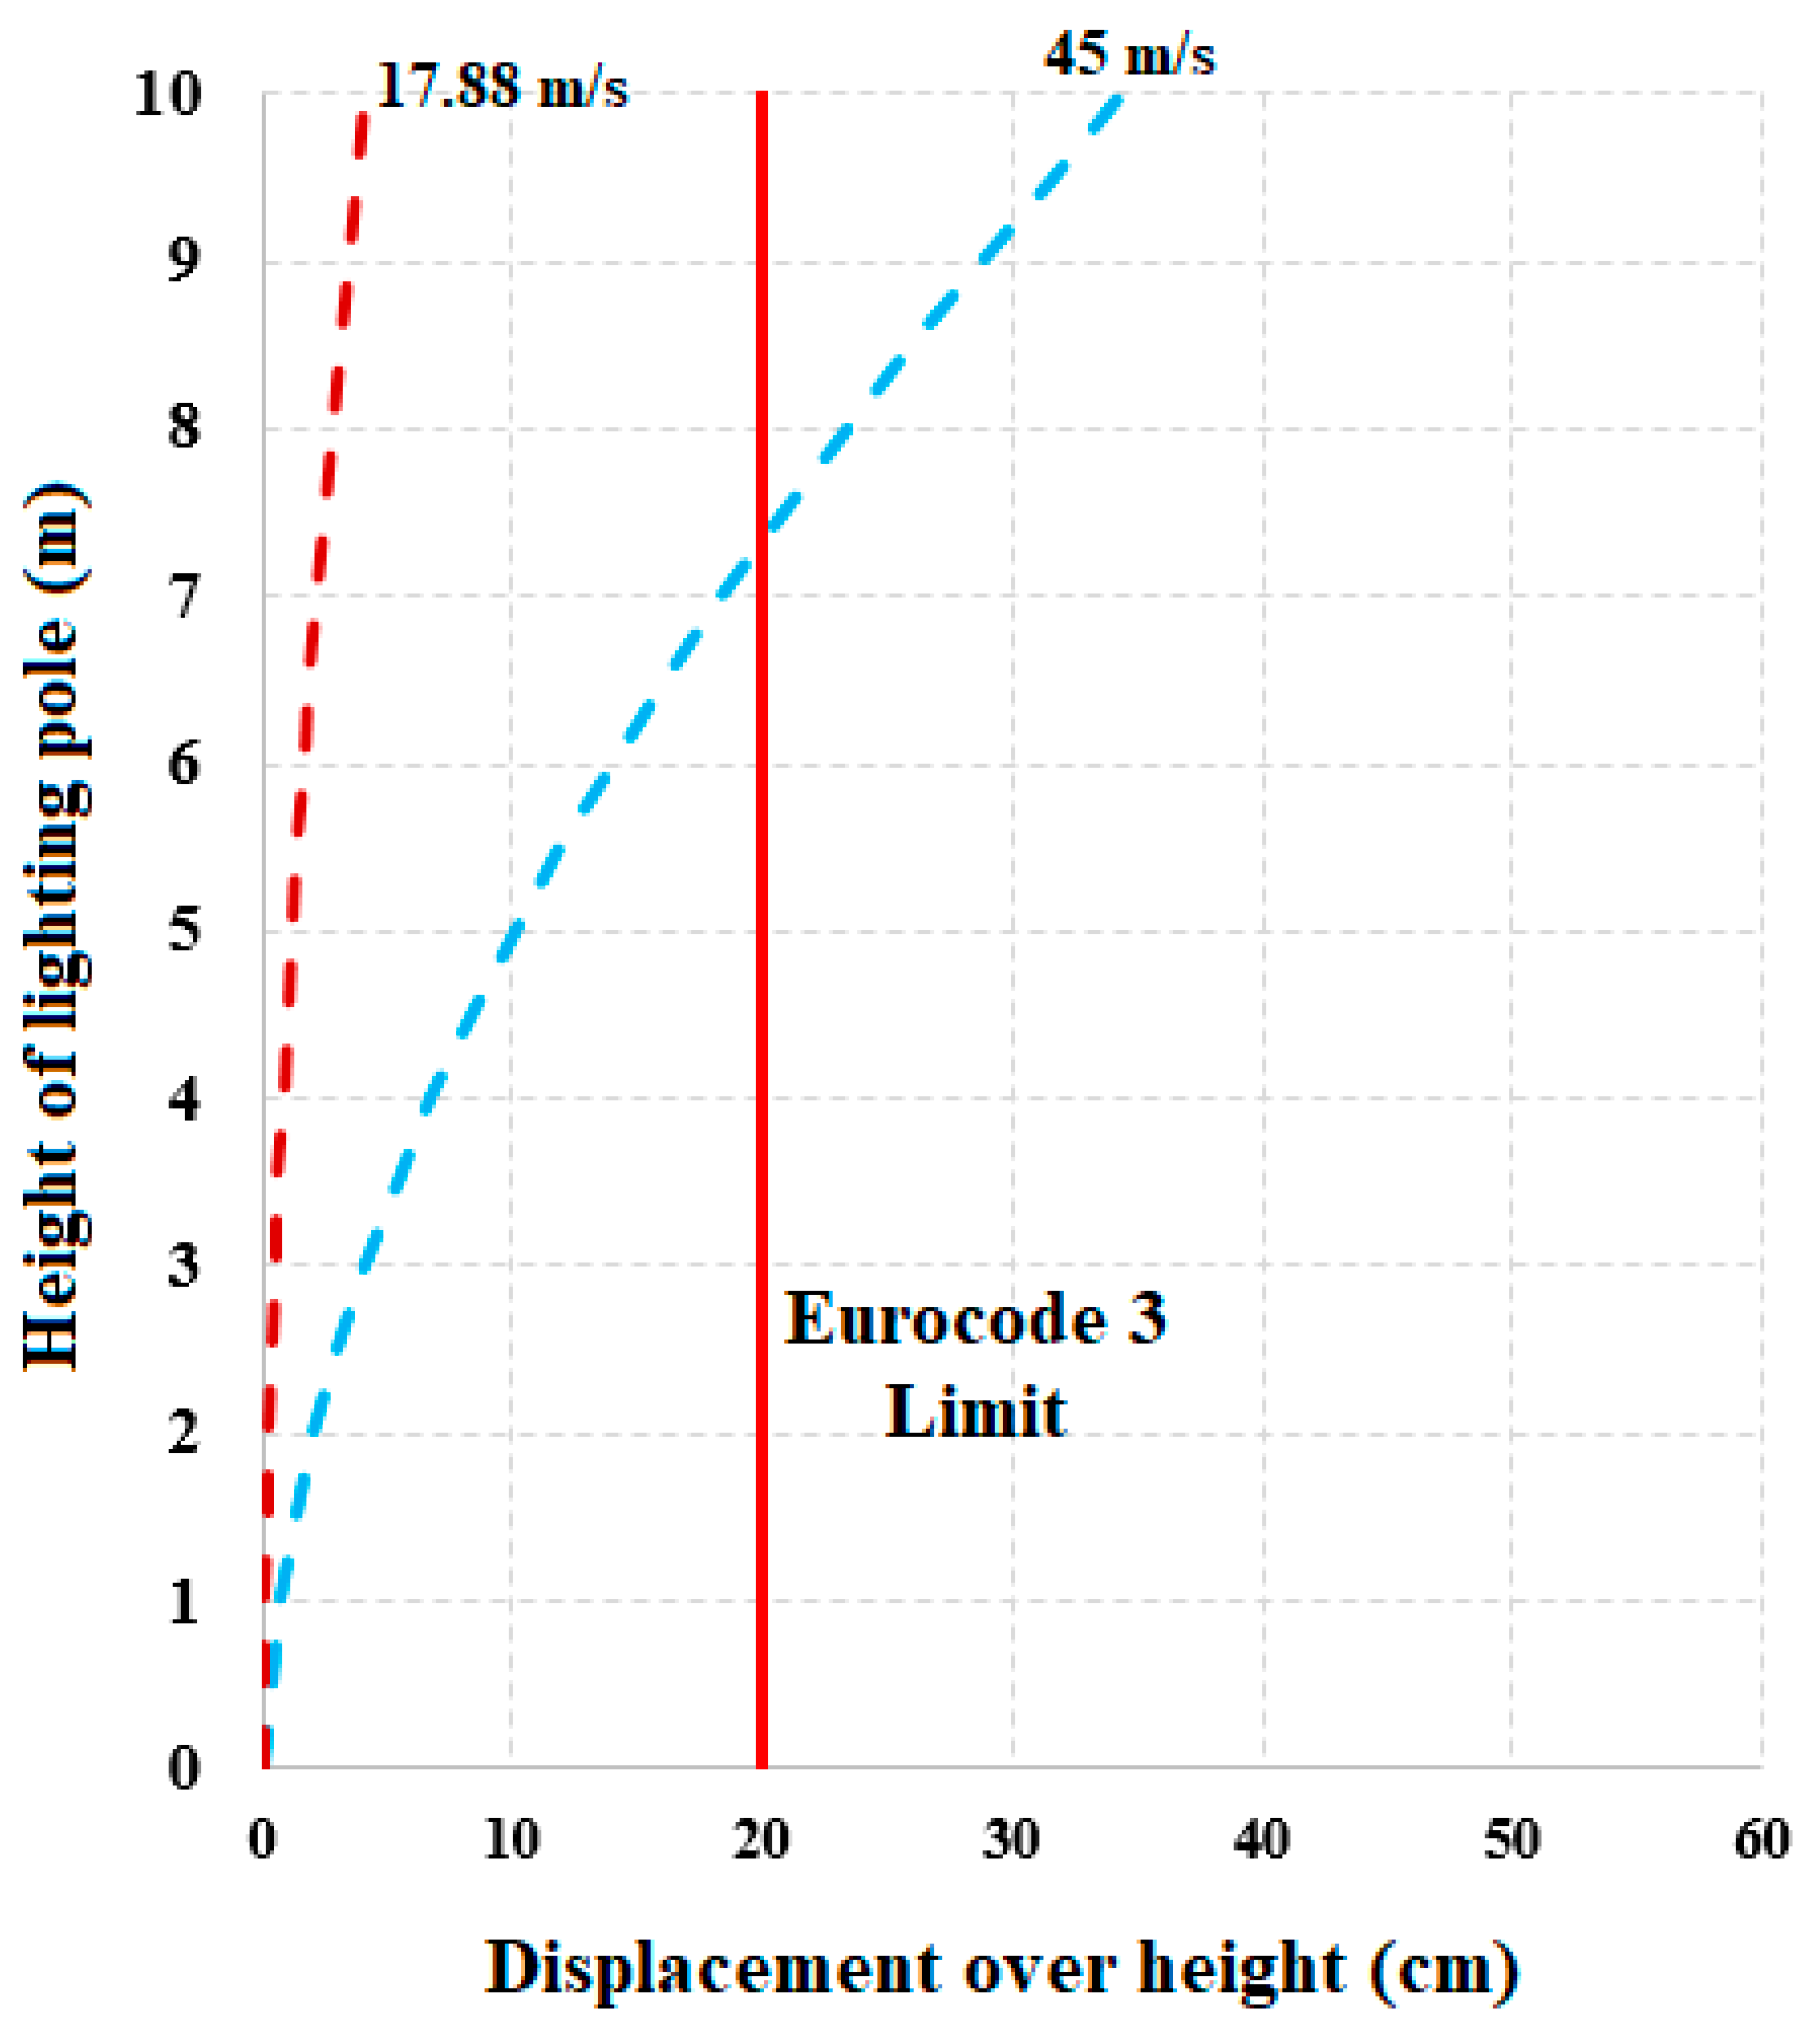
In Equation (12), h represents the chimney’s overall height. Here, instead of h, 10 m is the height of the cited lighting pole. When placed in Equation (12), a δmax value of 20 cm is obtained. Table 13 and Figure 10 make it evident that the top displacement values derived from TS498 fall below the upper limit value specified in Equation (12). However, for Eurocode 1, the top displacement values at 45 m/s speed are significantly beyond the limit value. Therefore, as an example, for Eurocode 1, the distribution of displacements over the height for wind speeds of 17.88 m/s and 45 m/s are provided in Figure 11 with Eurocode 3 limit.
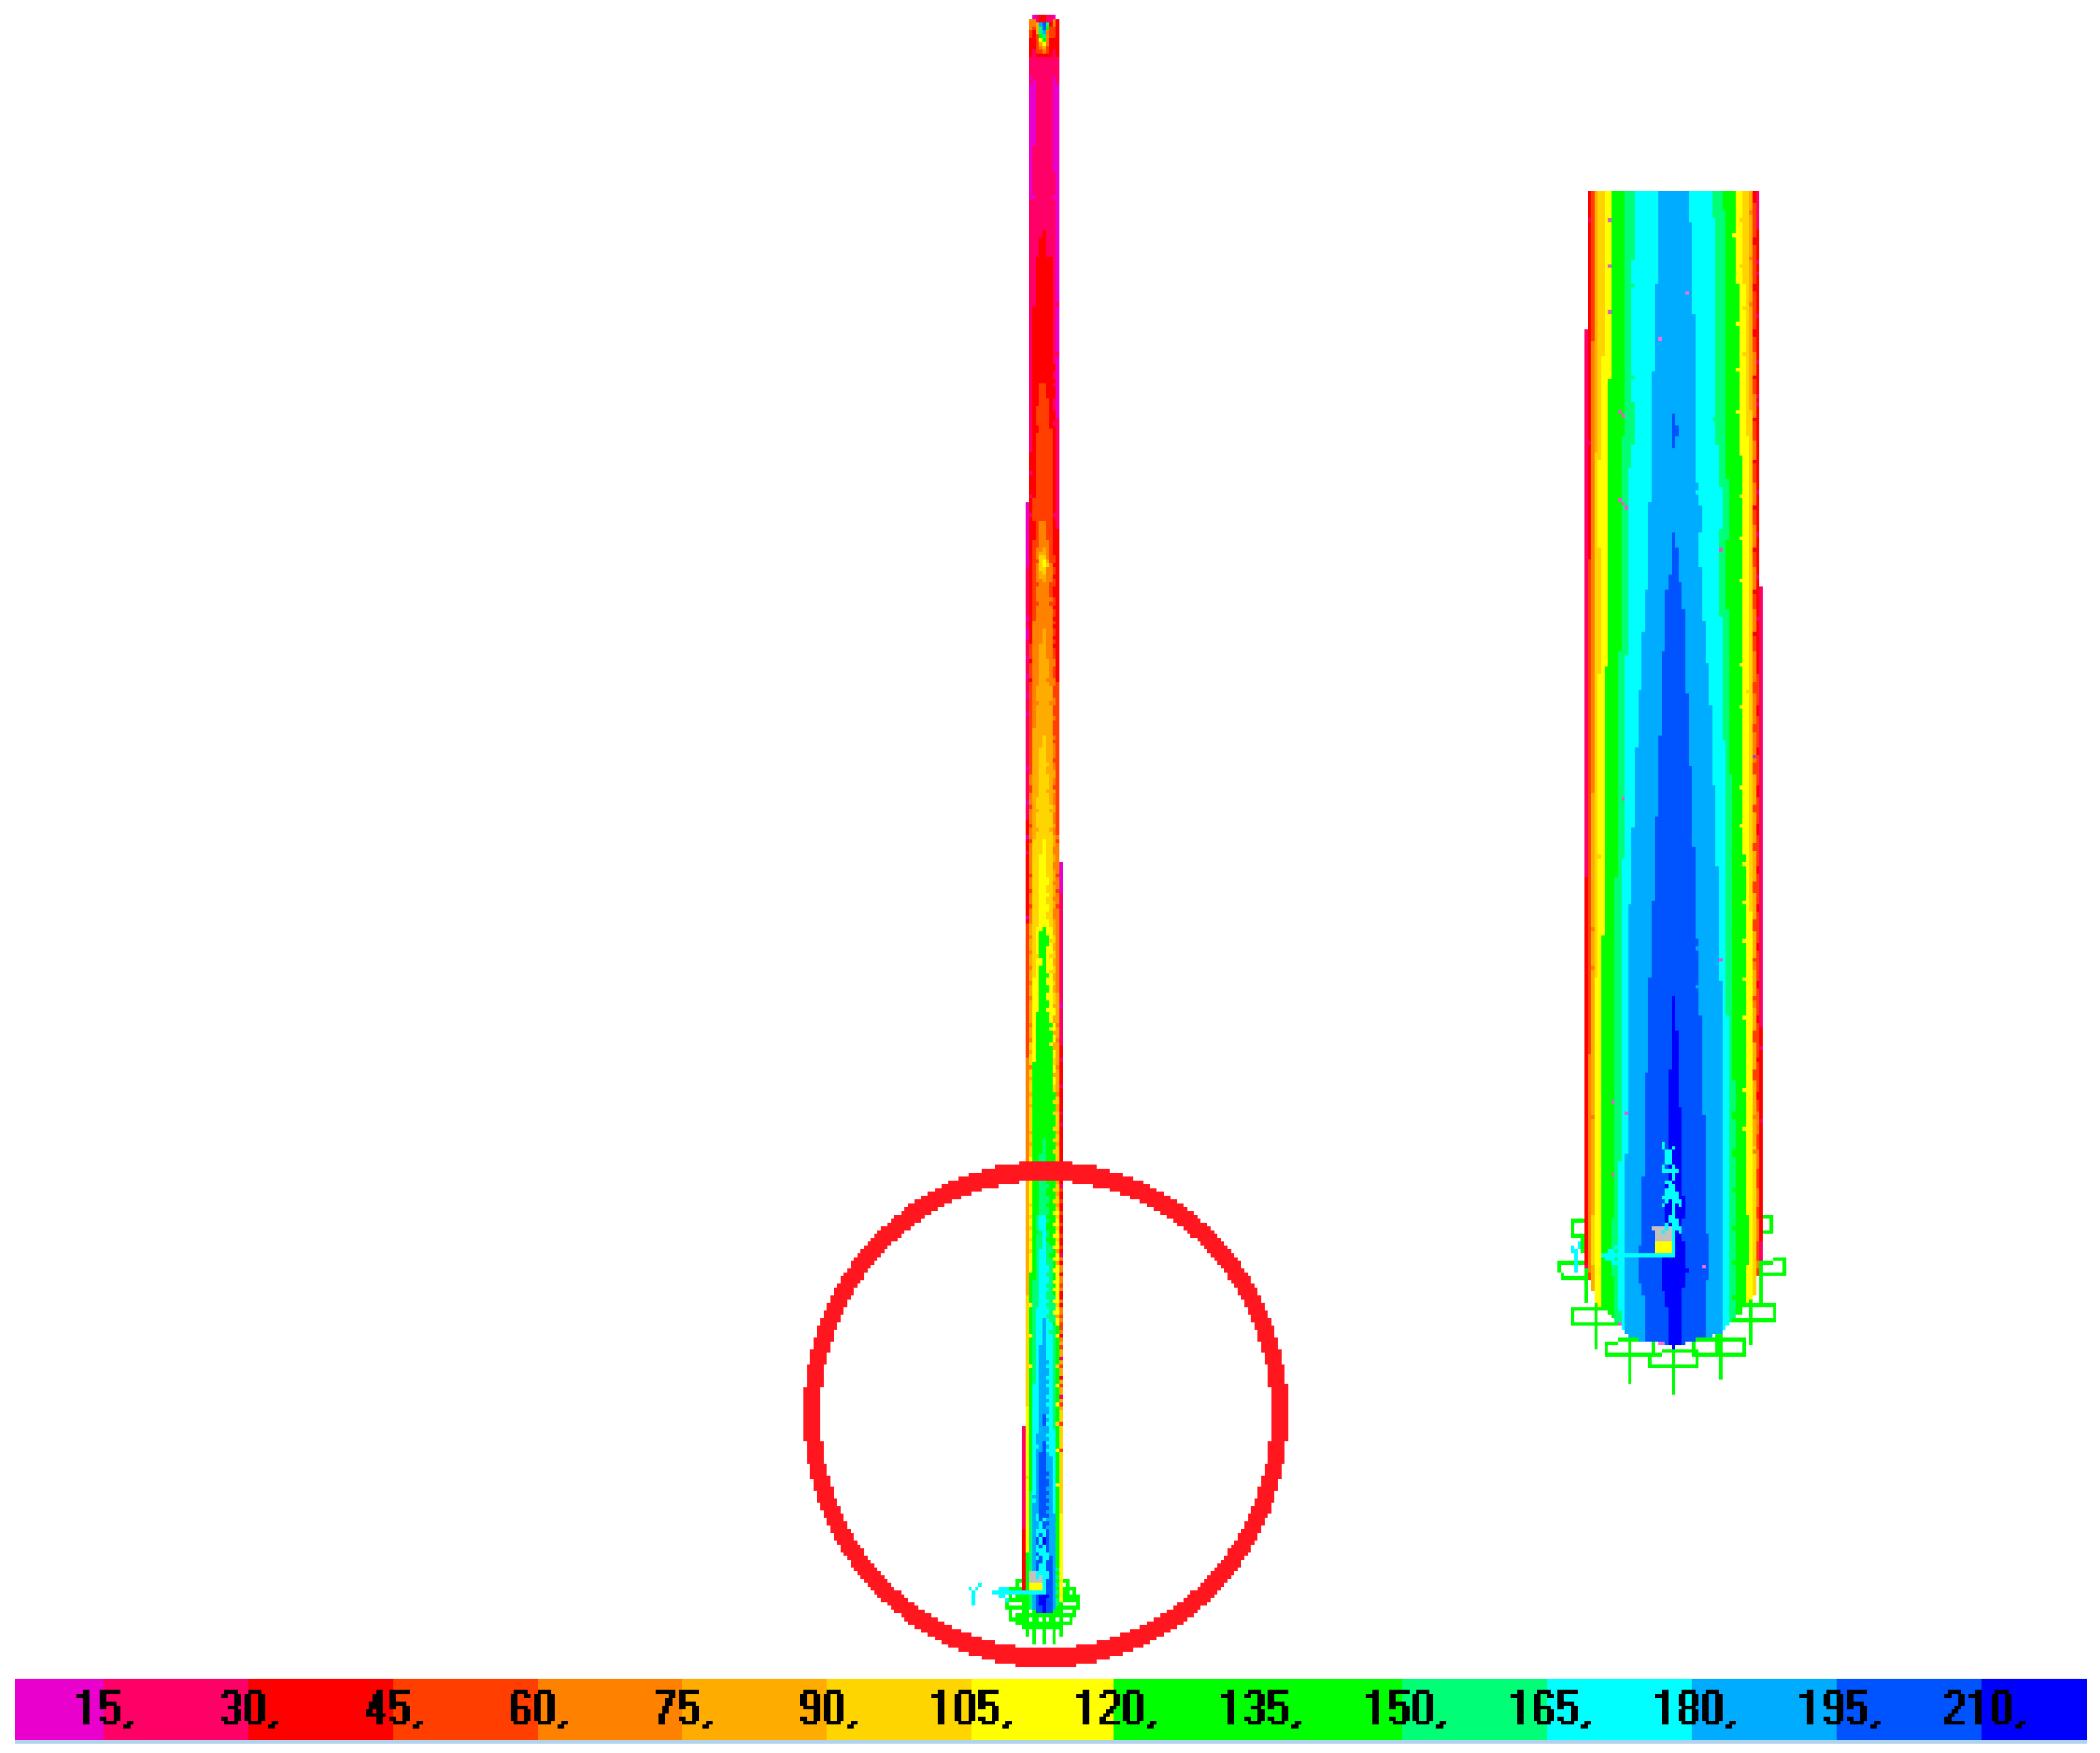
According to the Eurocode 1 standard, under 45 m/s wind speed, the cited lighting pole is unsafe, and there is a significant risk of damage or collapse. Additionally, the lighting pole’s von Mises stress distributions under the case where the highest top displacement occurred are provided in Figure 12.
As can be seen from Figure 12, the von Mises stresses occurring in the structure for the largest value of the top displacement are below the value of 220 MPa. This remains below the yield limit values of St37 (yield value limit is around 235 MPa) or St52 (yield value limit is around 355 MPa) steel. For the ultimate limit states check, in Eurocode 3 [28], resistance of structural elements or members related to the yield strength fy, where global or local buckling considered is provided by the partial factor γM1, is as follows:
γ M 1 = 1.10
From Figure 12, it can be deducted that the obtained von Mises stresses are well below the limit yield values of St37 or St52 steel from which the calculated partial factor is also well below the value 1.10 provided in Equation (13). However, it is clearly seen from Figure 12 that the region where the lighting pole is connected to the rigid base is the place where higher tensile stress accumulation occurs. Therefore, these tall and slender structures are prone and vulnerable to wind-related vital damage from this critical region. In the technical literature, there are some retrofitting and strengthening techniques for lighting poles. These include crack rewelding, welding triangular-shaped plates to the base and body, using bolted stiffeners, utilizing steel jackets, etc., where one is suitable for the condition of the lighting pole [29].

4. Conclusions

This study’s primary goal is to determine the wind loads on a steel lighting pole in accordance with TS498 and Eurocode 1 standards. Then, using the calculated wind loads on the structure, the findings of the structural analysis will be obtained and applied. According to the standards, wind loads are typically calculated using the structure’s first mode frequency. This frequency is supposed to remain constant for any wind speed, meaning that it will not alter even if the wind speed influencing the structure varies. Both the computation of wind loads and the application of these computed wind loads to the structure took into consideration of the fact that, as proposed by Tuhta [8], the first mode frequency varies with wind speed. In this instance, the results of the structural analysis indicated that at high wind speeds, changes of up to 12% took place.
One of the most challenging standards in terms of implementation ease is Eurocode 1. Eurocode 1 wind calculation procedure defines a large number of variables and factors. From this point of view, this study is believed to enlighten the way of practitioners.
The first mode frequency of the lighting pole cannot be included in any of the equations used in the TS498 standard wind load calculation technique. Because of this, the value of the wind loads computed remains unchanged regardless of whether the structure’s first mode frequency is regarded as constant or variable for fluctuating wind speeds.
Initial calculations were performed using the Eurocode 1 standard, assuming that the structure was in a windless (0 m/s) location, also for speeds of 2.24 m/s, 17.88 m/s, and 45.00 m/s. In this instance, for all of the previously listed wind speeds, the mode 1 frequency is considered as 3.36 Hz. Subsequently, the wind loads were computed for the scenario in which the structure’s first mode frequency varies with wind speed. In light of this, the wind loads computed at 2.24 m/s, 17.88 m/s, and 45.00 m/s are lower when the first mode frequency varies with wind speed than when it remains constant.
Considering the situation where the first mode frequency of the lighting pole varies for different wind speeds, the obtained top displacements are lower than when the first mode frequency is considered constant. So, for a speed of 45 m/s, this difference is 11.10% for TS 498 and 11.89% for Eurocode 1. This situation shows the importance of considering that the dynamic data of the structure changes with wind speed. Furthermore, for a speed of 45 m/s, the top displacement value obtained using the Eurocode 1 standard far exceeds the limit value of 20 cm presented in Eurocode 3. When evaluated from this aspect, the structure remains on the unsafe side in terms of the top displacement issue.
The highest value of the top displacement occurred in the Eurocode 1 standard and when the first mode frequency was considered constant. For this situation, the von Mises stresses in the structure occurred around 220 MPa. The calculated von Mises stresses are below the yield limit values of St37 (yield value limit is around 235 MPa) or St52 (yield value limit is around 355 MPa) steel.
From these obtained top displacement and stress values, it can be clearly seen that the design of steel lighting poles without determining dynamic parameters for different wind speeds overestimate the wind response of the structure. Although this can be counted as safe from a structural point of view, this leads to uneconomical designs for steel lighting poles. Therefore, in practice, the use of OMA should be to determine the dynamic structural analysis of the prototype structures before structural design is performed.
In summary, in this study, wind loads calculated according to TS 498 and Eurocode 1 standards were applied to a steel lighting pole, including cases where the first mode frequency was constant and the first mode frequency varied with the changes in wind speed. However, it is appropriate to point out that in order to generalize the results, structural analysis results should be obtained on a larger number of models, taking into account other wind speed values.

Author Contributions

Conceptualization, E.T. and D.C.; methodology, E.T.; software, E.T. and D.C.; validation, E.T. and D.C.; formal analysis, E.T. and D.C.; investigation, D.C.; resources, E.T. and D.C.; data curation, E.T. and D.C.; writing—original draft preparation, E.T. and D.C.; writing—review and editing, E.T. and D.C.; supervision, E.T.; project administration, E.T. and D.C. All authors have read and agreed to the published version of the manuscript.

Funding

This research received no external funding.

Data Availability Statement

The research data are available upon request.

Acknowledgments

This study belongs to Master of Science Thesis conducted in the Renewable Energy Department of Ordu University, Türkiye.

Conflicts of Interest

The authors declare no conflicts of interest.

References

  1. Light Poles and Pole Lights Buyers Guide. Available online: https://www.ledlightexpert.com/light-poles-and-pole-lights_ep1 (accessed on 21 January 2025).
  2. OMS Lighting and Pole Private Limited. Available online: https://www.omslighting.in/ (accessed on 21 January 2025).
  3. Breaking: College Football Stadium Ravaged by 100 mph Winds over the Weekend. Available online: https://www.totalprosports.com/ncaa/tulsa-chapman-football-stadium-100mph-winds/ (accessed on 21 January 2025).
  4. Zhang, M.; Li, T.; Wang, Y.; Chen, Y.; Zhao, G. Wind-Induced Vibration and Vibration Suppression of High-Mast Light Poles with Spiral Helical Strakes. Buildings 2023, 13, 907. [Google Scholar] [CrossRef]
  5. Holmes, J.D. Codification of Wind Loads on Wind-sensitive Structures. Int. J. Space Struct. 2009, 24, 87–95. [Google Scholar] [CrossRef]
  6. Stochino, F.; Attoli, A.; Serra, M.; Napoli, A.; Meloni, D.; Mistretta, F. Structural Identification from Operational Modal Analysis: The Case of Steel Structures. Buildings 2023, 13, 548. [Google Scholar] [CrossRef]
  7. Yilmaz, Z.; Okur, F.Y.; Günaydin, M.; Altunişik, A.C. Enhanced Modal Participation Ratio-Based Structural Damage Identification: A New Filtering Approach Using Modal Assurance Criteria. Buildings 2023, 13, 2467. [Google Scholar] [CrossRef]
  8. Tuhta, S. (Ed.) Determination of Wind Speed Effect on Dynamic Parameters of Full-Scale Lighting Pole by OMA. In Analytical and Operational Modal Analysis Applications in Composite Structures, 1st ed.; Nobel Academic Publishing: Ankara, Türkiye, 2022; pp. 49–67. [Google Scholar]
  9. Repetto, M.P.; Solari, G. Wind-induced fatigue collapse of real slender structures. Eng. Struct. 2010, 32, 3888–3898. [Google Scholar] [CrossRef]
  10. Pagnini, L.C.; Solari, G. Damping measurements of steel poles and tubular towers. Eng. Struct. 2001, 23, 1085–1095. [Google Scholar] [CrossRef]
  11. Repetto, M.P.; Solari, G. Dynamic alongwind fatigue of slender vertical structures. Eng. Struct. 2001, 23, 1622–1633. [Google Scholar] [CrossRef]
  12. Caracoglia, L.; Jones, N.P. Numerical and experimental study of vibration mitigation for highway light poles. Eng. Struct. 2007, 29, 821–831. [Google Scholar] [CrossRef]
  13. Han, Y.; Zhou, X.; Wang, L.; Cai, C.S.; Yan, H.; Hu, P. Experimental investigation of the vortex-induced vibration of tapered light poles. J. Wind Eng. Ind. Aerodyn. 2021, 211, 104555. [Google Scholar] [CrossRef]
  14. Mengistu, M.T.; Orlando, A.; Repetto, M.P. Wind and structural response monitoring of a lighting pole for the study of downburst effects on structures. J. Wind Eng. Ind. Aerodyn. 2023, 240, 105447. [Google Scholar] [CrossRef]
  15. Piccardo, G.; Solari, G. Closed form prediction of 3-D wind-excited response of slender structures. J. Wind Eng. Ind. Aerodyn. 1998, 74, 697–708. [Google Scholar] [CrossRef]
  16. Romanic, D.; Shoji, H.; Hangan, H. Experimental investigation of surface pressures, velocities, and dynamic structural analysis of tornadic winds on a luminary pole. J. Fluids Struct. 2023, 116, 103794. [Google Scholar] [CrossRef]
  17. Gonçalves, E.S.; Gonçalves, J.; Rosse, H.; Costa, J.; Jorge, L.; Gonçalves, J.A.; Coelho, J.P.; Ribeiro, J.E. Static analysis of a lamppost according to Eurocode EN-40. Procedia Struct. Integr. 2024, 54, 83–90. [Google Scholar] [CrossRef]
  18. Karaca, Z.; Öztürk, H.T.; Türkeli, E. Wind loads for stadium lighting towers according to Eurocode 1. Chall. J. Struct. Mech. 2016, 2, 226–233. [Google Scholar] [CrossRef]
  19. Erkmen, B. Vibration Behavior of Industrial Towers under Wind Vortexes. In Proceedings of the 6th Steel Structures Symposium, Eskişehir, Türkiye, 15–17 October 2015. (In Turkish). [Google Scholar]
  20. Devi, S.; Govindaraju, L. A study on wind induced vibration on lighting poles. Int. J. Res. Eng. Technol. 2014, 3, 172–178. [Google Scholar]
  21. Dilawer, S.I.; Junaidi, M.A.R.; Mehdi, D.S.N.; Ahmed, G.M.S. Design analysis and commissioning of high mast lighting poles. IOSR J. Mech. Civ. Eng. 2013, 8, 40–46. [Google Scholar]
  22. Dong, X.; Lian, J.; Wang, H.; Yu, T.; Zhao, Y. Structural vibration monitoring and operational modal analysis of offshore wind turbine structure. Ocean Eng. 2018, 150, 280–297. [Google Scholar] [CrossRef]
  23. Wilson, E.L. SAP 2000: Integrated Finite Element Analysis and Design of Structures; Computers & Structures: Berkeley, CA, USA, 2000. [Google Scholar]
  24. TS 498 (1997); Design Loads for Buildings. Turkish Standards Institute: Ankara, Türkiye, 1997. (In Turkish)
  25. EN 1991-1-4 (2005); Eurocode 1: Actions on Structures—General Actions—Part1-4: Wind Actions. Comite Europeen De Normalisation: Brussels, Belgium, 2005.
  26. General Directorate of Meteorology, Türkiye Wind Map. Available online: https://www.mgm.gov.tr/genel/ruzgar-atlasi.aspx (accessed on 11 April 2024).
  27. Lowest and Highest Values Recorded in Türkiye and the World. Available online: https://www.mgm.gov.tr/genel/sss.aspx?s=sicaklikenleri2 (accessed on 11 April 2024).
  28. EN 1993-3-2 (2006); Eurocode 3: Design of Steel Structures—Part 3-2: Towers, Masts and Chimneys-Chimneys. Comite Europeen De Normalisation: Brussels, Belgium, 2006.
  29. Choi, H.; Roda, A.; Najm, H. Fatigue Life Evaluation of High-Mast Lighting Tower (HMLT) and Aluminum Poles for Traffic Signals and Luminaires (Technical Report); Center for Advanced Infrastructure and Transportation: Piscataway, NJ, USA, 2016. [Google Scholar]
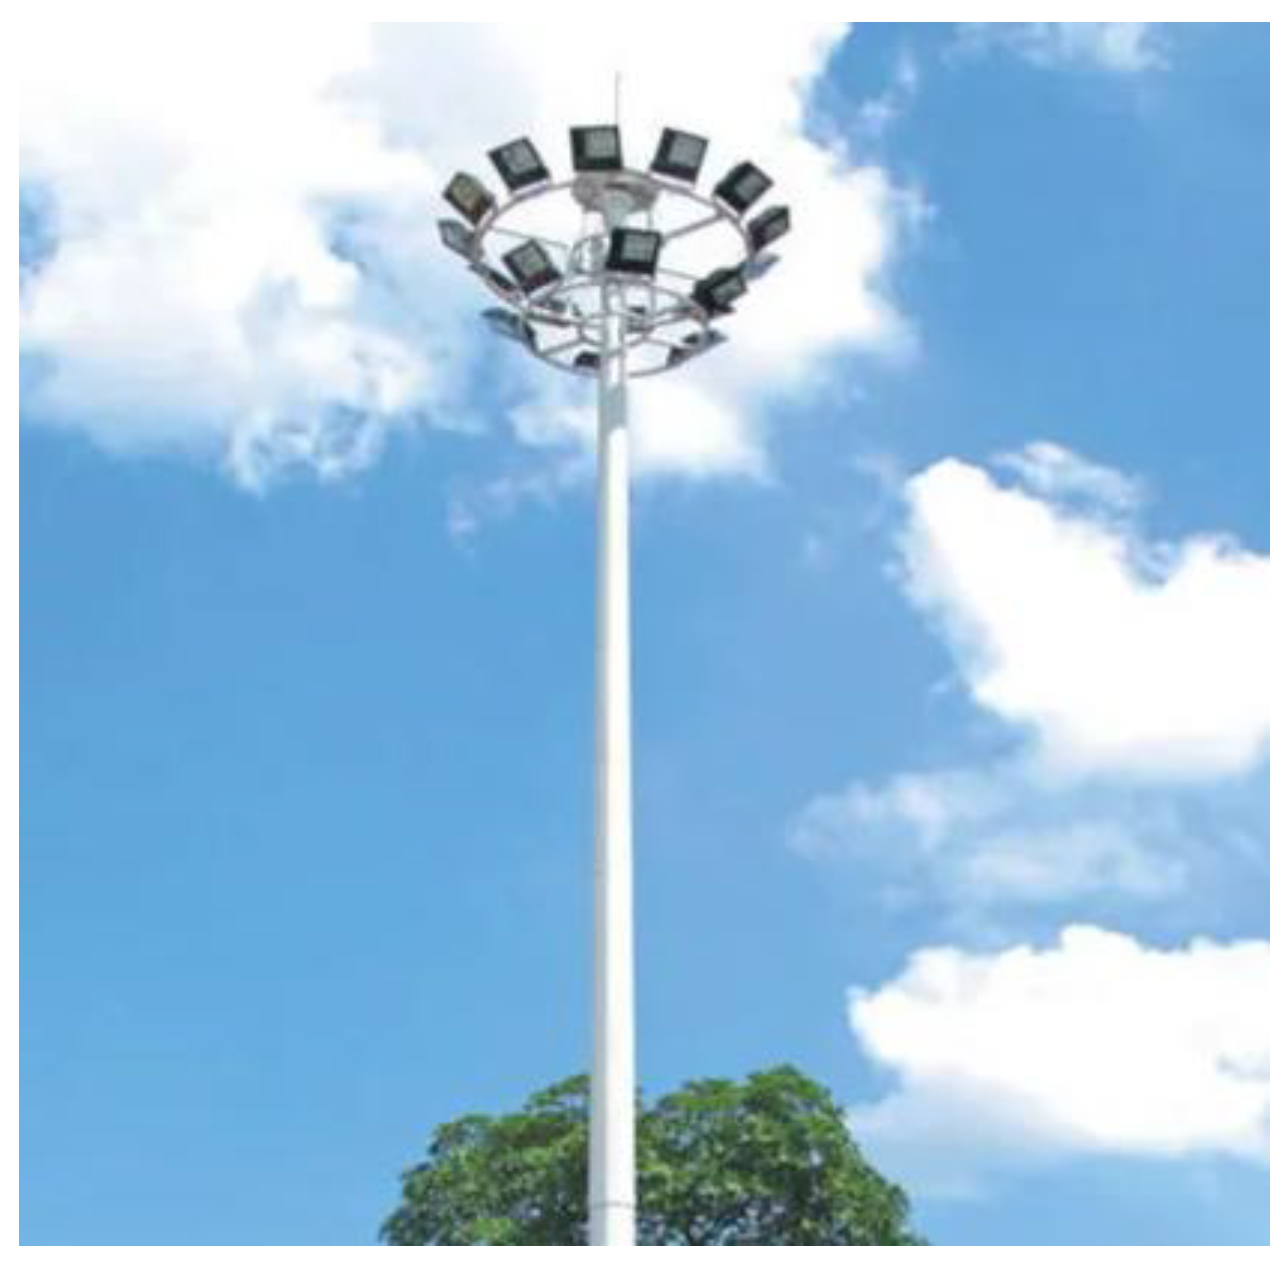
Figure 1. A steel lighting pole [2].
Buildings 15 01085 g001
Figure 2. Collapsed lighting poles (a,b) [3], (c) [4].
Buildings 15 01085 g002
Figure 3. A steel lighting pole in a parking lot located in Samsun (Türkiye) [8].
Buildings 15 01085 g003
Figure 4. Geometrical properties of lighting pole considered in this study [8].
Buildings 15 01085 g004
Figure 5. The first mode frequencies of the cited lighting pole under different wind speeds.
Buildings 15 01085 g005
Figure 6. The FEM of the lighting pole considered in this study (a) side view, (b) upper view, and (c) meshed FEM.
Buildings 15 01085 g006
Figure 7. Comparative FEM of considered lighting pole [8].
Buildings 15 01085 g007
Figure 8. Türkiye Wind Map [26].
Buildings 15 01085 g008
Figure 9. Application of wind loads to cited lighting pole.
Buildings 15 01085 g009
Figure 10. Top displacements of cited lighting pole.
Buildings 15 01085 g010
Figure 11. Displacement distribution over height for Eurocode 1 under different wind speeds.
Buildings 15 01085 g011
Figure 12. Von Mises stress distributions for maximum value of top displacement.
Buildings 15 01085 g012
Table 1. Wind loads acting on lighting pole for speed of 5 mph (2.24 m/s).
Section NoHeight from Ground (m)Outer Diameter (m)V0 (m/s)Vb,0 (m/s)qAW (kN)W (kN/m)
10–2.000.302.241.800.0020150.560.0018050.000903
22.00–4.000.262.241.990.0024680.480.0018950.000948
34.00–6.000.222.242.100.0027530.400.0017620.000881
46.00–8.000.182.242.180.0029660.320.0015190.000759
58.00–10.000.142.242.240.0031360.240.0012040.000602
Table 2. Wind loads acting on lighting pole for speed of 40 mph (17.88 m/s).
Section NoHeight from Ground (m)Outer Diameter (m)V0 (m/s)Vb,0 (m/s)qAW (kN)W (kN/m)
10–2.000.3017.8814.330.130.560.1150350.057517
22.00–4.000.2617.8815.860.160.480.1207440.060372
34.00–6.000.2217.8816.750.180.400.1122790.056140
46.00–8.000.1817.8817.390.190.320.0967510.048376
58.00–10.000.1417.8817.880.200.240.0767270.038363
Table 3. Wind loads acting on lighting pole for speed of 100.88 mph (45.00 m/s).
Section NoHeight from Ground (m)Outer
Diameter
(m)
V0 (m/s)Vb,0 (m/s)qAW (kN)W (kN/m)
10–2.000.3045.0036.070.810.560.7286500.364325
22.00–4.000.2645.0039.921.000.480.7648110.382405
34.00–6.000.2245.0042.171.110.400.7111950.355597
46.00–8.000.1845.0043.761.200.320.6128390.306420
58.00–10.000.1445.0045.001.270.240.4860000.243000
Table 4. Wind loads acting on lighting pole for speed of 5 mph (2.24 m/s).
Section NoHeight from Ground (m)Outer Diameter (m)Vb (m/s)Vm(z) (m/s)Iv(z)CFqp(z) (kg/m.s2) Cf,0ψλCfR2cscdArefFw (kN/m)
10–2.000.301.801.630.1747.590.013.650.400.920.370.031821.020.560.00039
22.00–4.000.261.992.230.1447.590.016.140.380.920.350.031821.020.480.00052
34.00–6.000.222.102.490.1347.590.017.440.350.920.320.031821.020.400.00049
46.00–8.000.182.182.680.1347.590.018.480.300.920.280.031821.020.320.00038
58.00–10.000.142.242.840.1247.590.019.360.220.920.200.031821.020.240.00023
Table 5. Wind loads acting on lighting pole for speed of 40 mph (17.88 m/s).
Section NoHeight from Ground (m)Outer
Diameter (m)
Vb (m/s)Vm(z) (m/s)Iv(z)CFqp(z) (kg/m.s2) Cf,0ψλCfR2cscdArefFw (kN/m)
10–2.000.3014.3312.990.175.960.03232.600.750.920.690.877471.250.560.05606
22.00–4.000.2615.8617.810.145.960.03390.980.750.920.690.877471.250.480.08076
34.00–6.000.2216.7519.870.135.960.03474.040.750.920.690.877471.250.400.08157
46.00–8.000.1817.3921.400.135.960.03540.370.740.920.690.877471.250.320.07436
58.00–10.000.1417.8822.630.125.960.03596.340.740.920.680.877471.250.240.06151
Table 6. Wind loads acting on lighting pole for speed of 100.88 mph (45.00 m/s).
Section NoHeight from Ground (m)Outer
Diameter (m)
Vb (m/s)Vm(z) (m/s)Iv(z)CFqp(z) (kg/m.s2)Cf,0ψλCfR2cscdArefFw (kN/m)
10–2.000.3036.0732.700.172.370.061.473.300.820.920.752.339051.510.560.46813
22.00–4.000.2639.9244.820.142.370.062.476.550.820.920.762.339051.510.480.67619
34.00–6.000.2242.1750.010.132.370.063.002.630.820.920.762.339051.510.400.68539
46.00–8.000.1843.7653.870.132.370.063.422.770.830.920.762.339051.510.320.62776
58.00–10.000.1445.0056.960.122.370.063.777.300.830.920.772.339051.510.240.52298
Table 7. Wind loads acting on lighting pole for speed of 5 mph (2.24 m/s).
Section NoHeight from Ground (m)Outer
Diameter (m)
Vb (m/s)Vm(z) (m/s)Iv(z)CFqp(z) (kg/m.s2) Cf,0ψλCfR2cscdArefFw (kN/m)
10–2.000.301.801.630.1747.730.013.650.400.920.370.031641.020.560.00039
22.00–4.000.261.992.230.1447.730.016.140.380.920.350.031641.020.480.00052
34.00–6.000.222.102.490.1347.730.017.440.350.920.320.031641.020.400.00049
46.00–8.000.182.182.680.1347.730.018.480.300.920.280.031641.020.320.00038
58.00–10.000.142.242.840.1247.730.019.360.220.920.200.031641.020.240.00023
Table 8. Wind loads acting on lighting pole for speed of 40 mph (17.88 m/s).
Section NoHeight from Ground (m)Outer
Diameter
(m)
Vb (m/s)Vm(z) (m/s)Iv(z)CFqp(z) (kg/m.s2)Cf,0ψλCfR2cscdArefFw (kN/m)
10–2.000.3014.3312.990.176.100.03232.600.750.920.690.851131.250.560.05587
22.00–4.000.2615.8617.810.146.100.03390.980.750.920.690.851131.250.480.08048
34.00–6.000.2216.7519.870.136.100.03474.040.750.920.690.851131.250.400.08129
46.00–8.000.1817.3921.400.136.100.03540.370.740.920.690.851131.250.320.07410
58.00–10.000.1417.8822.630.126.100.03596.340.740.920.680.851131.250.240.06130
Table 9. Wind loads acting on lighting pole for speed of 100.88 mph (45.00 m/s).
Section NoHeight from Ground (m)Outer
Diameter (m)
Vb (m/s)Vm(z) (m/s)Iv(z)CFqp(z) (kg/m.s2) Cf,0ψλCfR2cscdArefFw (kN/m)
10–2.000.3036.0732.700.172.510.061.473.300.820.920.752.223291.490.560.46378
22.00–4.000.2639.9244.820.142.510.062.476.550.820.920.762.223291.490.480.66990
34.00–6.000.2242.1750.010.132.510.063.002.630.820.920.762.223291.490.400.67902
46.00–8.000.1843.7653.870.132.510.063.422.770.830.920.762.223291.490.320.62193
58.00–10.000.1445.0056.960.122.510.063.777.300.830.920.772.223291.490.240.51812
Table 10. Comparison of wind loads acting on lighting pole for speed of 5 mph (2.24 m/s).
Section NoHeight from Ground (m)W
(kN/m)
TS 498
Fw
(kN/m)
(Constant)
Eurocode 1
Fw
(kN/m)
(Variable)
Eurocode 1
10–2.000.000903000.000385560.00038555
22.00–4.000.000948000.000524270.00052426
34.00–6.000.000881000.000485900.00048589
46.00–8.000.000759000.000382450.00038244
58.00–10.000.000602000.000227230.00022722
Table 11. Comparison of wind loads acting on lighting pole for speed of 40 mph (17.88 m/s).
Section NoHeight from Ground (m)W
(kN/m)
TS 498
Fw
(kN/m)
(Constant)
Eurocode 1
Fw
(kN/m)
(Variable)
Eurocode 1
10–2.000.057520.056060.05587
22.00–4.000.060370.080760.08048
34.00–6.000.056140.081570.08129
46.00–8.000.048380.074360.07410
58.00–10.000.038360.061510.06130
Table 12. Comparison of wind loads acting on lighting pole for speed of 100.88 mph (45.00 m/s).
Section NoHeight from Ground (m)W
(kN/m)
TS 498
Fw
(kN/m)
(Constant)
Eurocode 1
Fw
(kN/m)
(Variable)
Eurocode 1
10–2.000.364330.468130.46378
22.00–4.000.382410.676190.66990
34.00–6.000.355600.685390.67902
46.00–8.000.306420.627760.62193
58.00–10.000.243000.522980.51812
Table 13. Top displacements obtained from TS498 and Eurocode 1.
TS498Eurocode 1
Wind Speed (m/s)Displacement (cm)
(First Mode Frequency Constant)
Displacement (cm) (First Mode Frequency Variable) Difference (%)Displacement (cm)
(First Mode Frequency Constant)
Displacement (cm) (First Mode Frequency Variable) Difference (%)
2.240.04200.04170.710.01940.01930.52
17.882.672.54124.824.06793.85255.30
4516.9415.0611.1034.3930.311.89
Disclaimer/Publisher’s Note: The statements, opinions and data contained in all publications are solely those of the individual author(s) and contributor(s) and not of MDPI and/or the editor(s). MDPI and/or the editor(s) disclaim responsibility for any injury to people or property resulting from any ideas, methods, instructions or products referred to in the content.