Abstract
With global carbon emissions continuing to rise and urban energy demands growing steadily, understanding how urban block morphology impacts building photovoltaic (PV) efficiency and energy consumption has become crucial for sustainable urban development and climate change mitigation. Current research primarily focuses on individual building optimization, while block-scale coupling relationships between PV utilization and energy consumption remain underexplored. This study developed an integrated prediction and optimization tool using deep learning and physical simulation to assess how urban block design parameters (building morphology, orientation, and layout) affect PV efficiency and energy performance. Through a methodology combining block modeling, PV potential assessment, and energy consumption simulation, the research quantified relationships between design parameters, PV utilization, and energy consumption. Results demonstrate that appropriate building forms and layouts reduce shadow obstruction, enhance PV system capability, and simultaneously improve PV efficiency while reducing energy consumption. The tool provides improved prediction accuracy, enabling urban planners to scientifically design block layouts that maximize PV generation and minimize energy use. Extensive experimental validation demonstrates that the integrated model and analytical methods proposed in this study will help urban planners break through the limitations of individual building research, making PV-energy consumption optimization analysis at the block scale possible, and providing scientific basis for achieving low-carbon transformation and sustainable energy development in the building sector.
1. Introduction
With the increasingly severe problem of global climate change [1,2], the challenges of urban energy utilization and environmental protection are becoming more and more prominent [3]. The integration of energy efficiency in buildings and renewable energy becomes one of the key measures to combat climate change [4,5]. Especially in high-density urban blocks, how to achieve efficient photovoltaic energy utilization and optimize building energy consumption through rational building design is an important direction to promote urban sustainable development. In recent years, Building Integrated Photovoltaic (BIPV), as an innovative green building technology, has been widely concerned and gradually applied in block scale urban planning. In practical applications, the comprehensive influence of multiple factors of block design parameters (block form, building layout, environmental conditions, etc.) on photovoltaic utilization efficiency and energy consumption performance has not been fully quantified and analyzed [6,7,8]. The complex and intertwined multiple determinants make the collaborative optimization design of photovoltaic power generation potential and building energy consumption face great challenges.
How to use parametric modeling and intelligent algorithms to explore the block form, photovoltaic utilization and energy consumption reduction, effectively explore the coupling relationship between block design parameters and photovoltaic energy consumption collaborative optimization objectives, and provide a scientific digital optimization framework for block planning is an important challenge in current research [9,10,11]. In order to solve these problems, a technical framework integrating deep learning, physical simulation, and multi-objective optimization is proposed to explore the collaborative optimization design of block form, block scale PV, and building energy consumption. The framework combines big data analysis, machine learning, and physical modeling techniques, aiming to reveal the energy efficiency performance of different block form design schemes under hot summer and cold winter climates through refined simulation and analysis, so as to provide urban planners with data-driven decision support tools.
- Data acquisition and preprocessing: the basic data of the block were obtained through remote sensing images and Geographic Information System (GIS) and standardized to provide accurate input for the subsequent model establishment.
- Parametric modeling: Rhino and Grasshopper are used for multi-dimensional parametric modeling of block buildings to generate different block design samples;
- Photovoltaic and building energy consumption simulation: simulate the building energy consumption and photovoltaic power generation potential of each design in a specific climate through Tools such as EnergyPlus and Ladybug Tools;
- Machine learning model and sensitivity analysis: through the Light Gradient Boosting Machine (LightGBM) model, the nonlinear relationship between design parameters and performance is analyzed, and the sensitivity analysis of key parameters is performed.
- Multi-objective optimization: The non-dominated Sorting Genetic Algorithm II (NSGA-II) is used to optimize the multi-objective block design to maximize the photovoltaic power generation potential and minimize the building energy consumption.
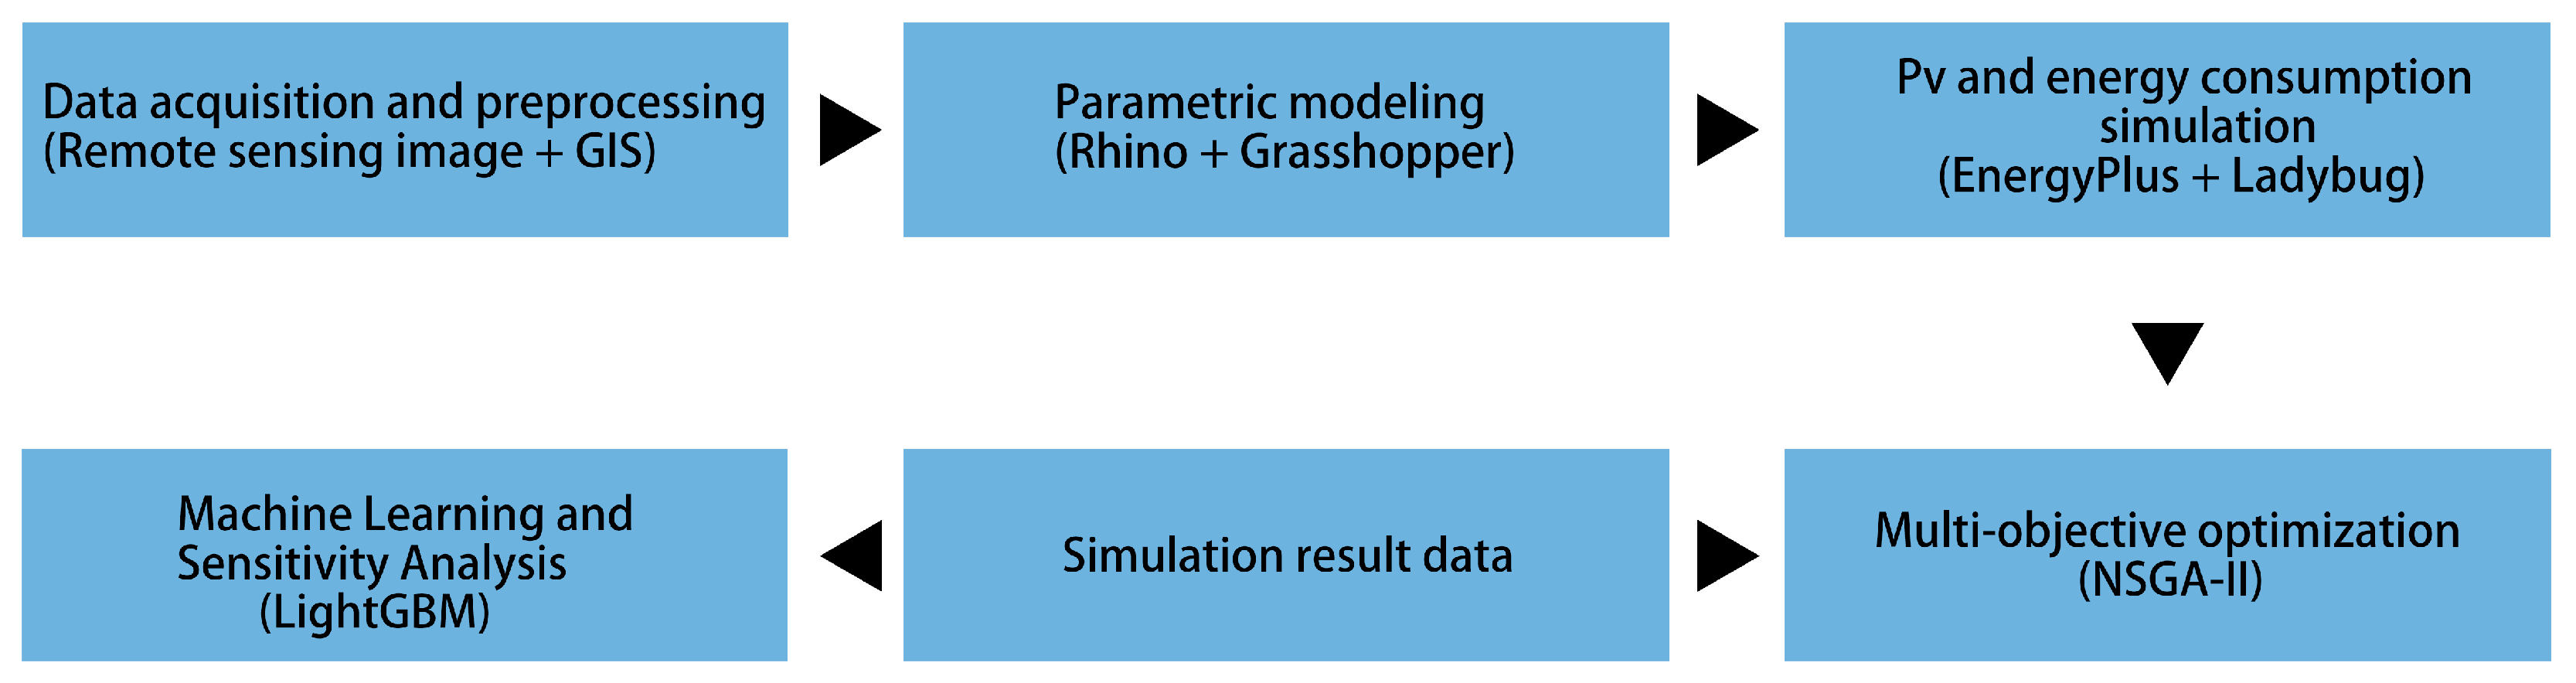
This method framework provides a new idea for block scale building design, breaks through the limitations of traditional building energy efficiency assessment, and provides a systematic way to optimize the design scheme under the dual goals of comprehensive consideration of photovoltaic power generation and building energy efficiency (Figure 1).
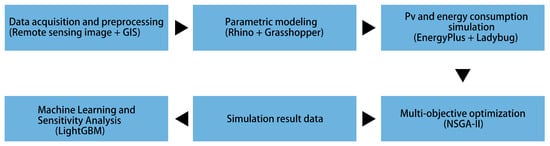
Figure 1.
Technical framework diagram. Arrow direction: indicates the direction of data flow, from data acquisition to final optimization design. Module content: Each module contains input, processing tools, and output results. Feedback mechanism: A feedback loop can be formed between the machine learning module and the optimization module to further optimize the design parameters.
In recent years, many studies have extensively explored the effect of occlusion on the efficiency of photovoltaic (PV) panels. For example, Pillai et al. systematically reviewed the performance of building integrated photovoltaic (BIPV) systems in different urban forms, emphasizing how the occlusion factor affects the energy output. Mendis et al. further analyzed the economic potential of integrated PV on commercial building facades. However, most studies still focus on a single building scale, lacking a broader perspective on how urban block form (including factors such as building layout, density, and spatial configuration) jointly affects PV efficiency and building energy consumption [12,13,14].
This study fills this critical research gap by shifting the focus from individual building optimization to an integrated block-scale approach. Unlike previous studies that treat PV deployment and building energy efficiency as isolated objectives, this study proposes a collaborative optimization framework to simultaneously improve PV utilization and minimize building energy consumption. By integrating parametric modeling, physical simulation, and machine learning techniques, this study provides a quantifiable and adaptable approach to urban block design optimization, a dimension that has not been fully explored in the existing literature.
In addition, traditional studies often use simplified energy consumption models and fail to fully consider the complex interaction between building form and PV performance. In this study, a data-driven high-precision prediction model is established by introducing multi-objective optimization techniques. This advance enables urban planners to make design decisions based on scientific evidence to reduce overall energy demand while maximizing renewable energy utilization [15,16].
As cities continue to push for low-carbon development, energy optimization at the block scale is becoming an important part of sustainable urban planning. By filling the research gap on the coupling relationship between urban form and PV energy efficiency, this study not only advances theoretical exploration, but also provides a practical design strategy for achieving high performance and energy-saving urban blocks [17,18].
2. Research Methods
2.1. Parametric Simulation Method
In the parametric simulation stage, the parametric design method based on Grasshopper platform is used to set the initial building simulation parameters by adjusting 13 key design parameters including building spacing [19,20], orientation, and height, so as to realize the precise control of urban block design [21,22] (Table 1).

Table 1.
Building simulation parameters.
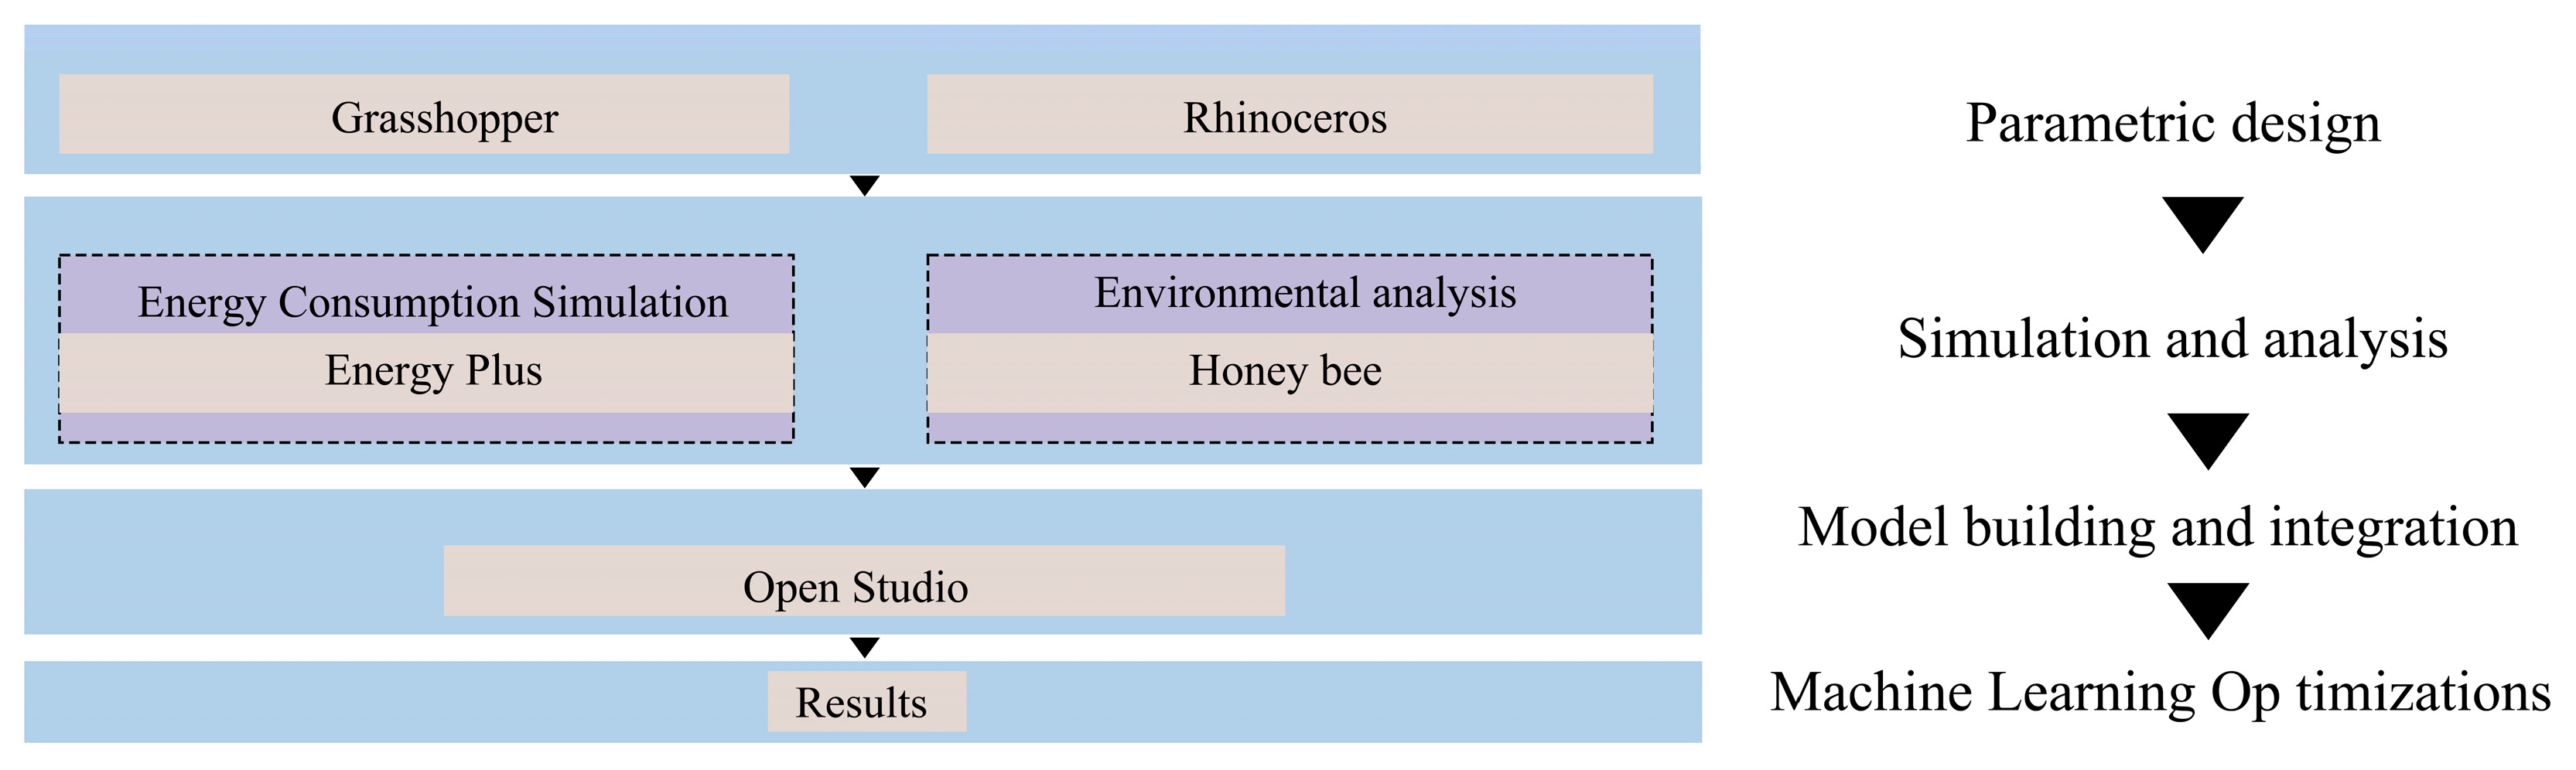
As a highly flexible and integrated graphical algorithm editor, Grasshopper has played an important role in architectural design and urban planning. Its intuitive graphical interface allows designers to construct complex geometric forms and design logics in a modular manner, avoiding the complexity of traditional programming. The advantage of this graphical workflow is that designers can quickly iterate over multiple design alternatives, exploring and optimizing multidimensional parameter settings while ensuring accuracy, resulting in a more efficient design process. In addition, the openness and extensibility of Grasshopper enables seamless integration with other advanced tools and plug-ins, providing more possibilities for design and analysis [23,24]. To comprehensively assess the impact of building design options on energy performance and renewable energy utilization, three industry-leading simulation tools are integrated based on the Grasshopper platform: Energy Plus, Honeybee, and Open Studio.
As a dynamic Energy consumption simulation tool, Energy Plus provides highly accurate building energy consumption analysis capabilities. With this tool, the study is able to meticulously capture the dynamic impact of different design parameters on building energy consumption, especially in the evaluation of Heating, Ventilation, and Air Conditioning (HVAC) system performance. Energy Plus can simulate in detail the effects of seasonal climate change, building usage behavior patterns and multiple energy efficiency strategies on energy consumption, providing a scientific basis for design optimization [25].
The Honeybee plug-in plays a key role in environmental performance analysis. The tool helps designers identify key environmental variables that may affect building performance by calculating the distribution of sunlight outside and inside the building, the efficiency of natural ventilation, as well as thermal comfort [26]. In insolation analysis, Honeybee can simulate the effects of different building orientations and spacing on lighting conditions, which can guide the layout optimization of rooftop PV systems. The tool also supports in-depth assessment of thermal comfort, providing data support for building skin design and shading system optimization.
Open Studio plugins further improve the efficiency and depth of the simulation process. Through its integrated interface, research enables the rapid construction of complex building models and simplifies the operation of multiple simulation processes. Open Studio not only speeds up parameter iteration but also supports connectivity to intelligent building management systems (BMS), enabling real-time optimization of energy use efficiency during the operational phase of the building [27]. The open framework of the tool opens up the possibility for the research to extend the functionality by customizing the script implementation in combination with machine learning algorithms to identify more optimal parameter combinations.
Figure 2 illustrates the logical structure of this comprehensive analysis framework. In the whole design and simulation process, the parameter space is automatically explored and optimized based on the advantages of machine learning technology. In this way, the study achieved a significant reduction in building energy consumption and significantly improved the energy efficiency of the PV system [28,29]. This multi-tool integrated framework provides scientific and operational guidance for building and block design and lays an important foundation for future smart city planning and sustainable development strategy.
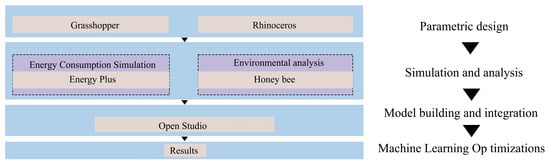
Figure 2.
Framework for parametric simulation.
2.2. Data Processing Methods
In the data processing stage, in order to optimize the simulation accuracy and efficiency, Latin Hypercube Sampling (LHS) is used for data sampling. The basic idea of LHS is to divide the value range of each variable into several intervals (usually called “layers”, denoted by ). A sample point is randomly selected in each interval to ensure that the value of the variable is evenly distributed in the whole range and to avoid the repetition of the sample points. The formula is as follows:
where the width of the value interval is , the range of each variable of is , and the range of each variable is equally divided into n.
Secondly, Pearson product-moment correlation coefficient analysis was used [30,31,32], the linear influence of block design parameters on the PV potential and energy consumption objective function is quantified, and the significant relationship between variables is revealed, which provides a scientific basis for optimizing block layout [33,34].The Pearson correlation coefficient (n) is calculated based on the ratio of the covariance of two variables to their standard deviation, as follows:
Among them, the calculation of r is based on the average value of samples Xi and Yi, and the range is [−1, 1], which accurately depicts the strength of linear relationship. r = 0 means that the variables are linearly independent. r ∈ (−1, 0) indicates a negative linear correlation between variables, and the negative correlation becomes stronger when r ∈ (−1, 0) approaches. If r ∈ (−1, 0) indicates a positive correlation between the variables, the correlation is significant if it approaches 1. In the process of research, by analyzing the variables such as the proportion of low level and the plot area width, it is found that the proportion of low level is significantly positively correlated with the PV potential (r = 0.8), and the width of plot D is weakly negatively correlated with the heating energy consumption (r = −0.3). These results provide an important basis for optimal design.
However, limited by the linear assumption, Pearson analysis cannot effectively capture the complex nonlinear relationships and the interactions between variables, so it is difficult to fully reflect the potential patterns in high-dimensional data scenarios. In order to overcome the above shortcomings, the Light Gradient Boosting Machine (LightGBM) (Light Gradient Boosting Machine is a gradient boosting framework developed by Microsoft and contributors from the open-source community. Designed for efficient large-scale data processing, it supports parallel computation and is widely used in machine learning applications. Microsoft is headquartered in Redmond, WA, USA) model is introduced in the regression analysis stage [35,36,37]. As a machine learning algorithm based on Gradient Boosting Decision Tree (GBDT), LightGBM can efficiently deal with nonlinear relationships and multi-dimensional variable interactions. In particular, it has excellent performance compared with traditional algorithms (such as XGBoost and CatBoost) in training speed, accuracy and big data scenarios. The LightGBM model is used to model the key variables selected by Pearson (such as the proportion of low-rise and the plot width) to further explore the nonlinear relationship between the PV potential and the energy consumption objective function. The initial model during LightGBM training can be expressed as follows.
where is the loss function; usually the mean squared error (MSE) or cross-entropy loss is used.
MTH iteration:
where is the learning rate and is the MTH weak learner (decision tree). The new learner is generated by fitting the residuals of the current model:
The Design of Experiments (DOE) (Latin square sampling) is used to obtain 500 groups of design parameters and target values. The LightGBM model is used to screen out the key design parameters (such as the proportion of low-rise and the width of the plot), and the nonlinear effects of these parameters on the photovoltaic power generation and building energy consumption of the block are deeply analyzed.
3. Study the Construction of Training Data Set for Block Shape Optimization
3.1. Overview of the Study Area
The study area is selected in Wuhan, Hubei Province, with a special focus on the city’s aging neighborhoods, aiming to explore their spatial characteristics and their potential and challenges in modern urban renewal. As an important city in central China, Wuhan has gone through many planning and reconstruction, but there are still many old blocks. The spatial form of these blocks not only reflects the accumulation of history and culture but also exposes many problems in urban development, such as aging infrastructure and unreasonable functional layout. In the context of urban renewal, the renovation potential of old blocks is huge, which has far-reaching significance for sustainable urban development. By improving energy efficiency, introducing renewable energy systems, optimizing spatial layout, and improving environmental quality, the transformation of old blocks can not only improve the livability and functionality of blocks but also reduce traditional energy consumption and alleviate environmental pressure, thus promoting the green transformation of cities. On the whole, the renovation of old blocks provides important opportunities for urban sustainable development and is a key link to achieve multiple sustainable goals of society, economy, and environment.
Wuhan, a rapidly urbanizing city in China, is characterized by its hot summer and cold winter climate, leading to significant seasonal variations in energy demand. The city’s high-density urban fabric results in complex shading effects, directly impacting PV efficiency and building energy performance. As a key hub for China’s low-carbon urban development, Wuhan provides a representative case for studying PV-integrated urban morphology optimization in dense, mixed-use environments. The insights gained from this study can be applied to other cities with similar climatic and spatial conditions, contributing to broader sustainable urban design strategies.
This study assumes that in high-density urban environments, shading primarily originates from adjacent buildings rather than distant terrain or potential future developments. To control variables, environmental factors such as vegetation and meteorological conditions are not directly analyzed for their impact on photovoltaic (PV) efficiency. Instead, the focus is on optimizing building morphology (height, spacing, and layout) to minimize shading effects, enhance PV performance, and reduce overall energy consumption. The simulation explicitly incorporates shading from surrounding buildings and inter-building shading within the block to ensure realistic modeling outcomes. Given Wuhan’s current urban development trends, newly constructed residential blocks typically feature limited vegetation-induced shading, as most greenery consists of low shrubs and grass that do not obstruct solar access. Shading trees are generally located within centralized green spaces or parks to meet the daylighting needs of ground-floor residents and vulnerable groups, rather than being interspersed among residential buildings. Therefore, vegetation shading is not considered a significant factor in the simulation.
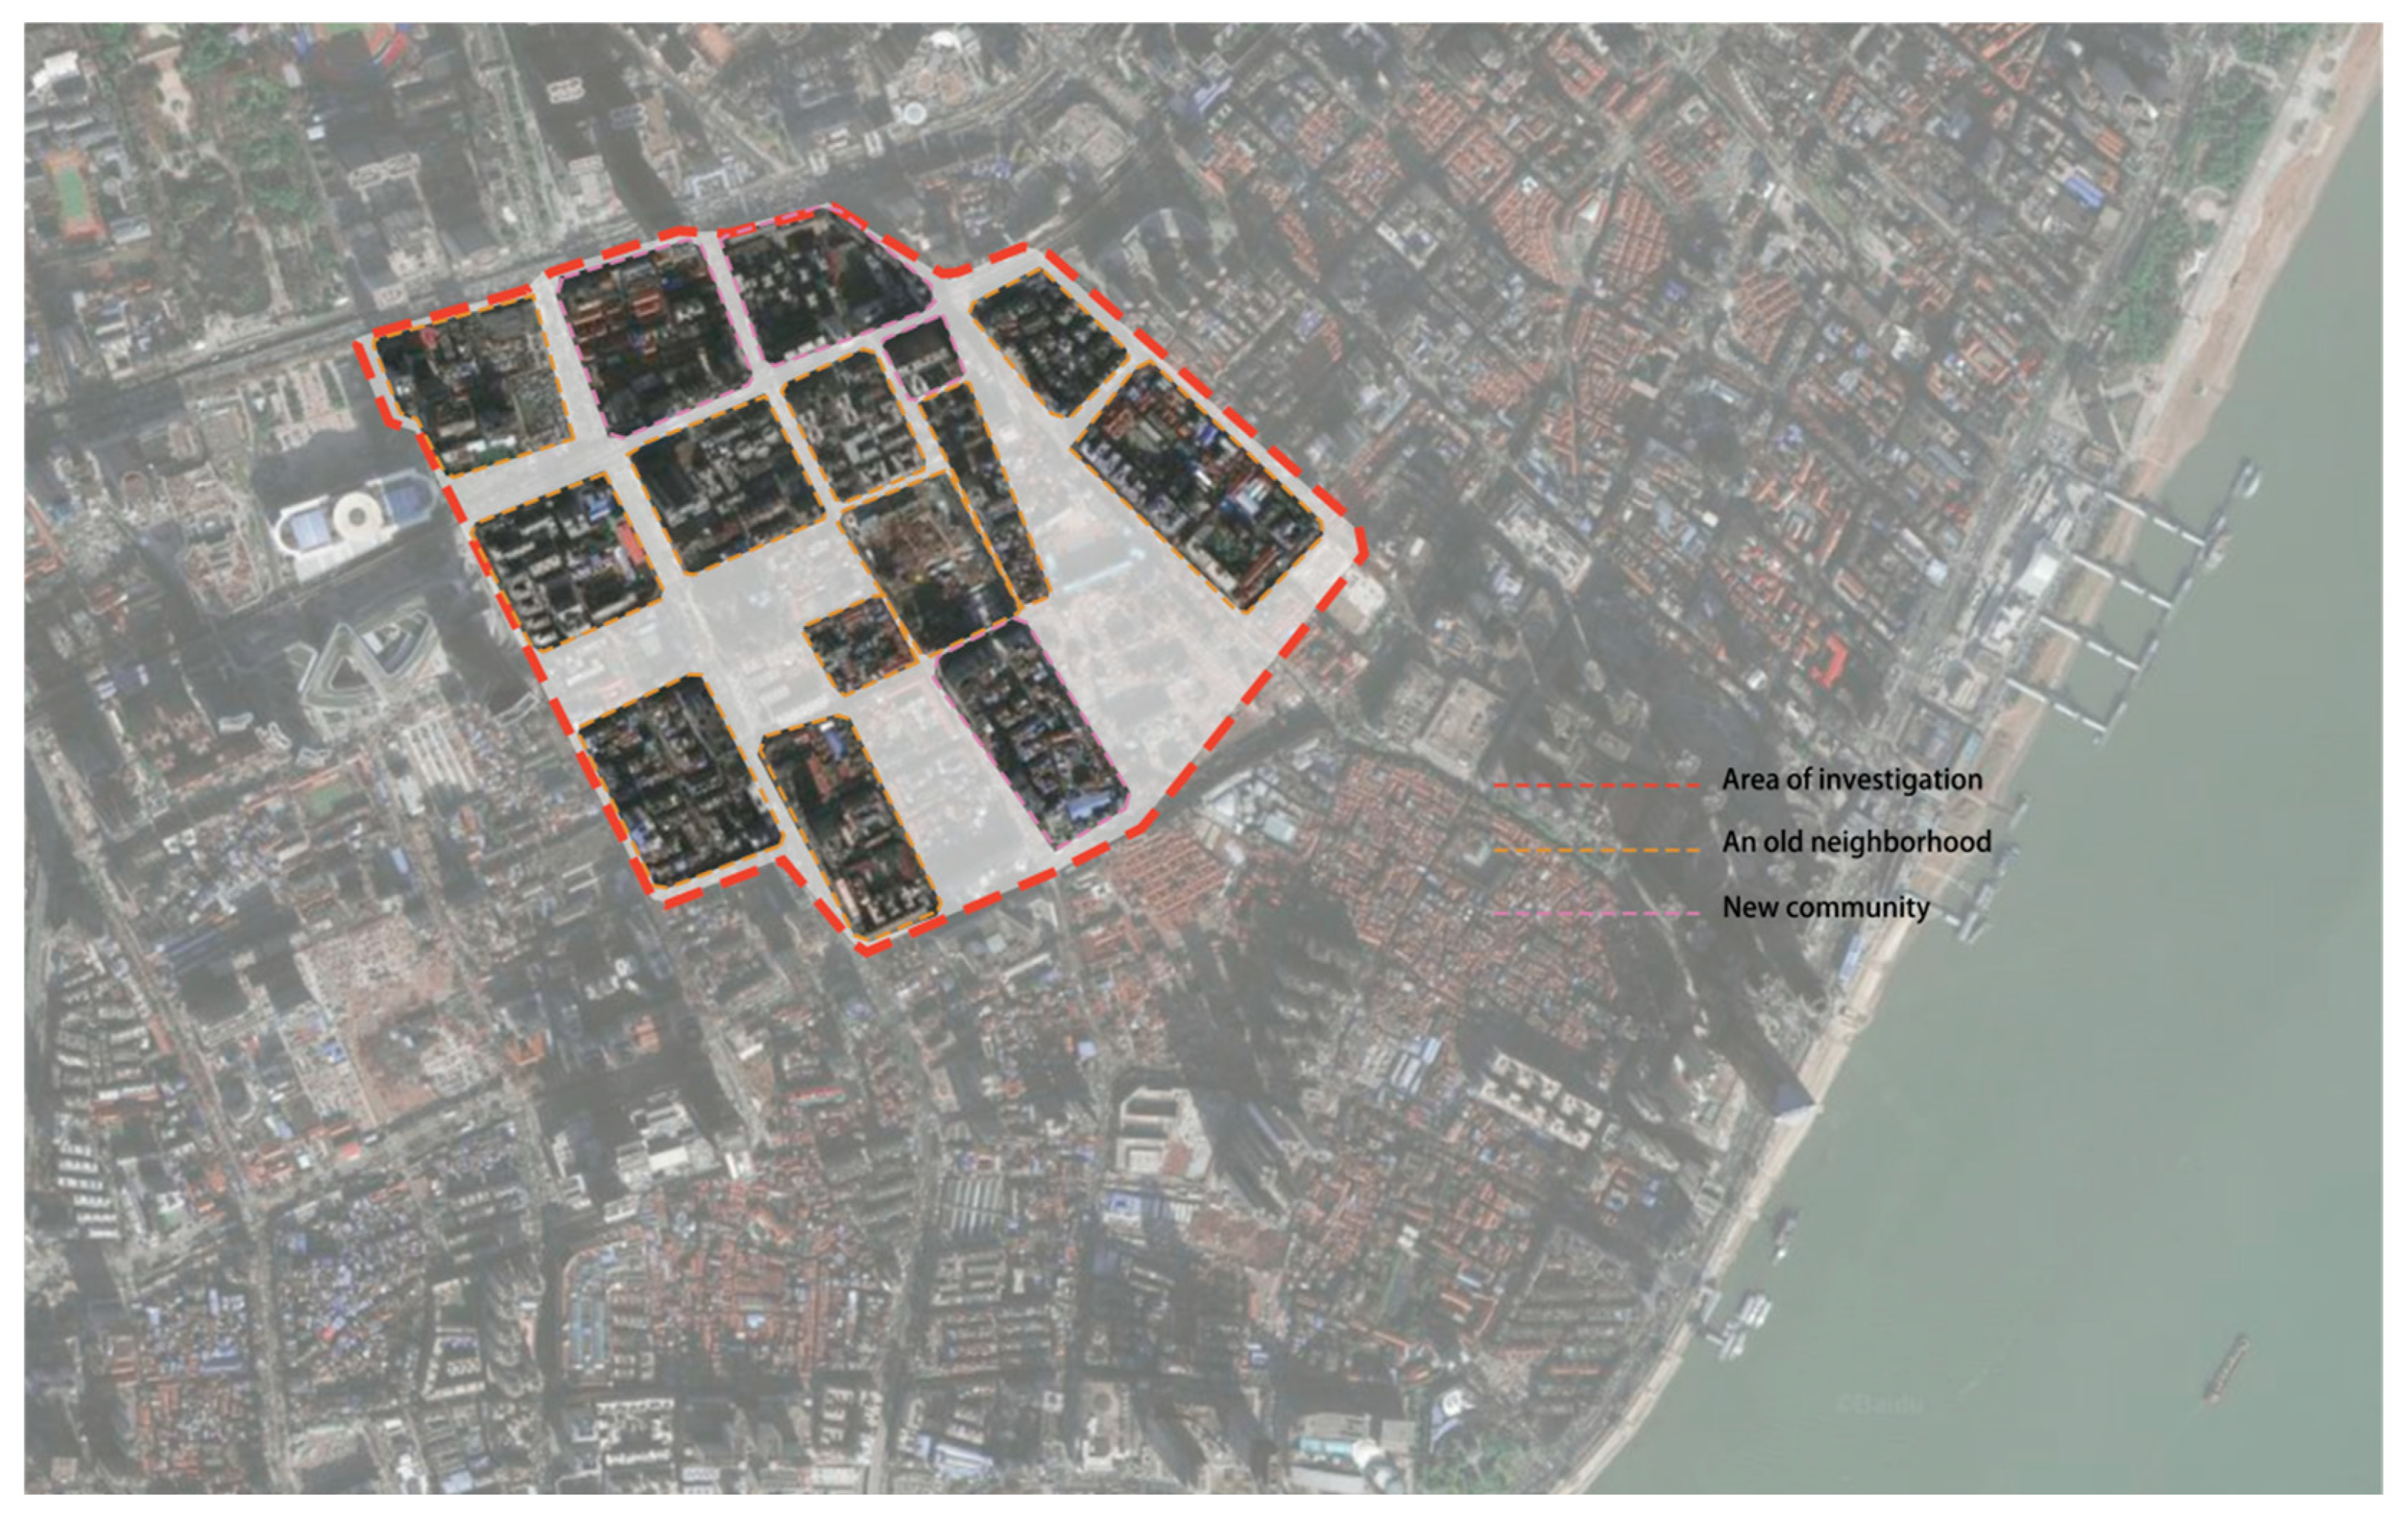
In order to deeply understand the spatial structure of Wuhan city blocks, a comprehensive investigation of 15 representative city blocks was conducted through field investigation and satellite image analysis (Figure 3 is based on freely available Sentinel-2 imagery, which provides high-resolution multispectral images suitable for urban morphology analysis. This data set, part of the Copernicus Earth Observation Program managed by the European Space Agency (ESA), was used to extract urban block structures in Wuhan. The image was then modified by the authors to include additional information and to suit the specific requirements of our research.) These blocks cover both old and new, and the former occupies a relatively large number, showing obvious characteristics of traditional urban planning. These old blocks generally have the advantages of regular layout, clear functions, and smooth traffic, but they also face problems such as high building density, insufficient public space and aging infrastructure.
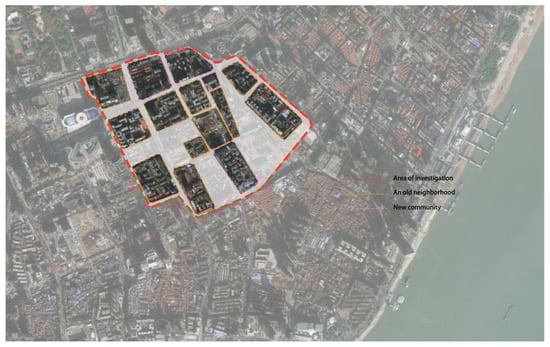
Figure 3.
Area of study (Image provided by the European Space Agency (ESA), Copernicus Program, redrawn by the authors).
It is found that the old urban blocks in Wuhan have a high regularity in the overall layout. The interior of the block is mostly rectangular or square grid, and the overall terrain is flat, which helps to form a clear traffic flow and functional differentiation. The division of commercial and residential functions is relatively clear, with the commercial district usually distributed along the main road, while the residential district is mainly distributed in the inner side of the block. In addition, most of the plot ratios in these blocks are concentrated between 3.87 and 4.39, indicating that the building density in these areas is moderate, while also ensuring a certain amount of open space and public facilities. The building density is between 22.5% and 34.4%, which is relatively high, but still maintains a relatively loose space utilization compared with the newly built blocks.
3.2. Setting of Related Basic Parameters and Objective Function
According to the actual situation of the study area, the ideal block size is set as 200 m × 200 m, the total area is 40,000 m2, the plot ratio is 4, the building density is 27%, the height of low-rise buildings is limited to 12 m, and the peripheral high-rise buildings (length × width × height: 60 m × 50 m × 30 m) are planned, a total of 16 buildings. The underlying simulation parameters for block setting are detailed in Table 2 below.
Table 2.
Block parameter setting table.
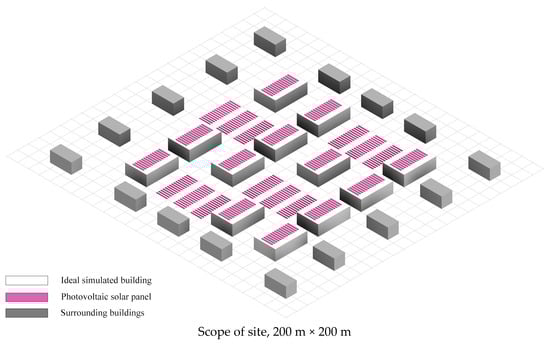
Figure 4.
Idealized city block model.
Furthermore, the design characteristics of city blocks are summarized, and 12 design parameters (Table 3) are set and normalized, which are variable control parameters of block design, so that the ideal block shape can be shaped by adjusting the parameters in subsequent research.
Table 3.
Block design control parameter setting table.
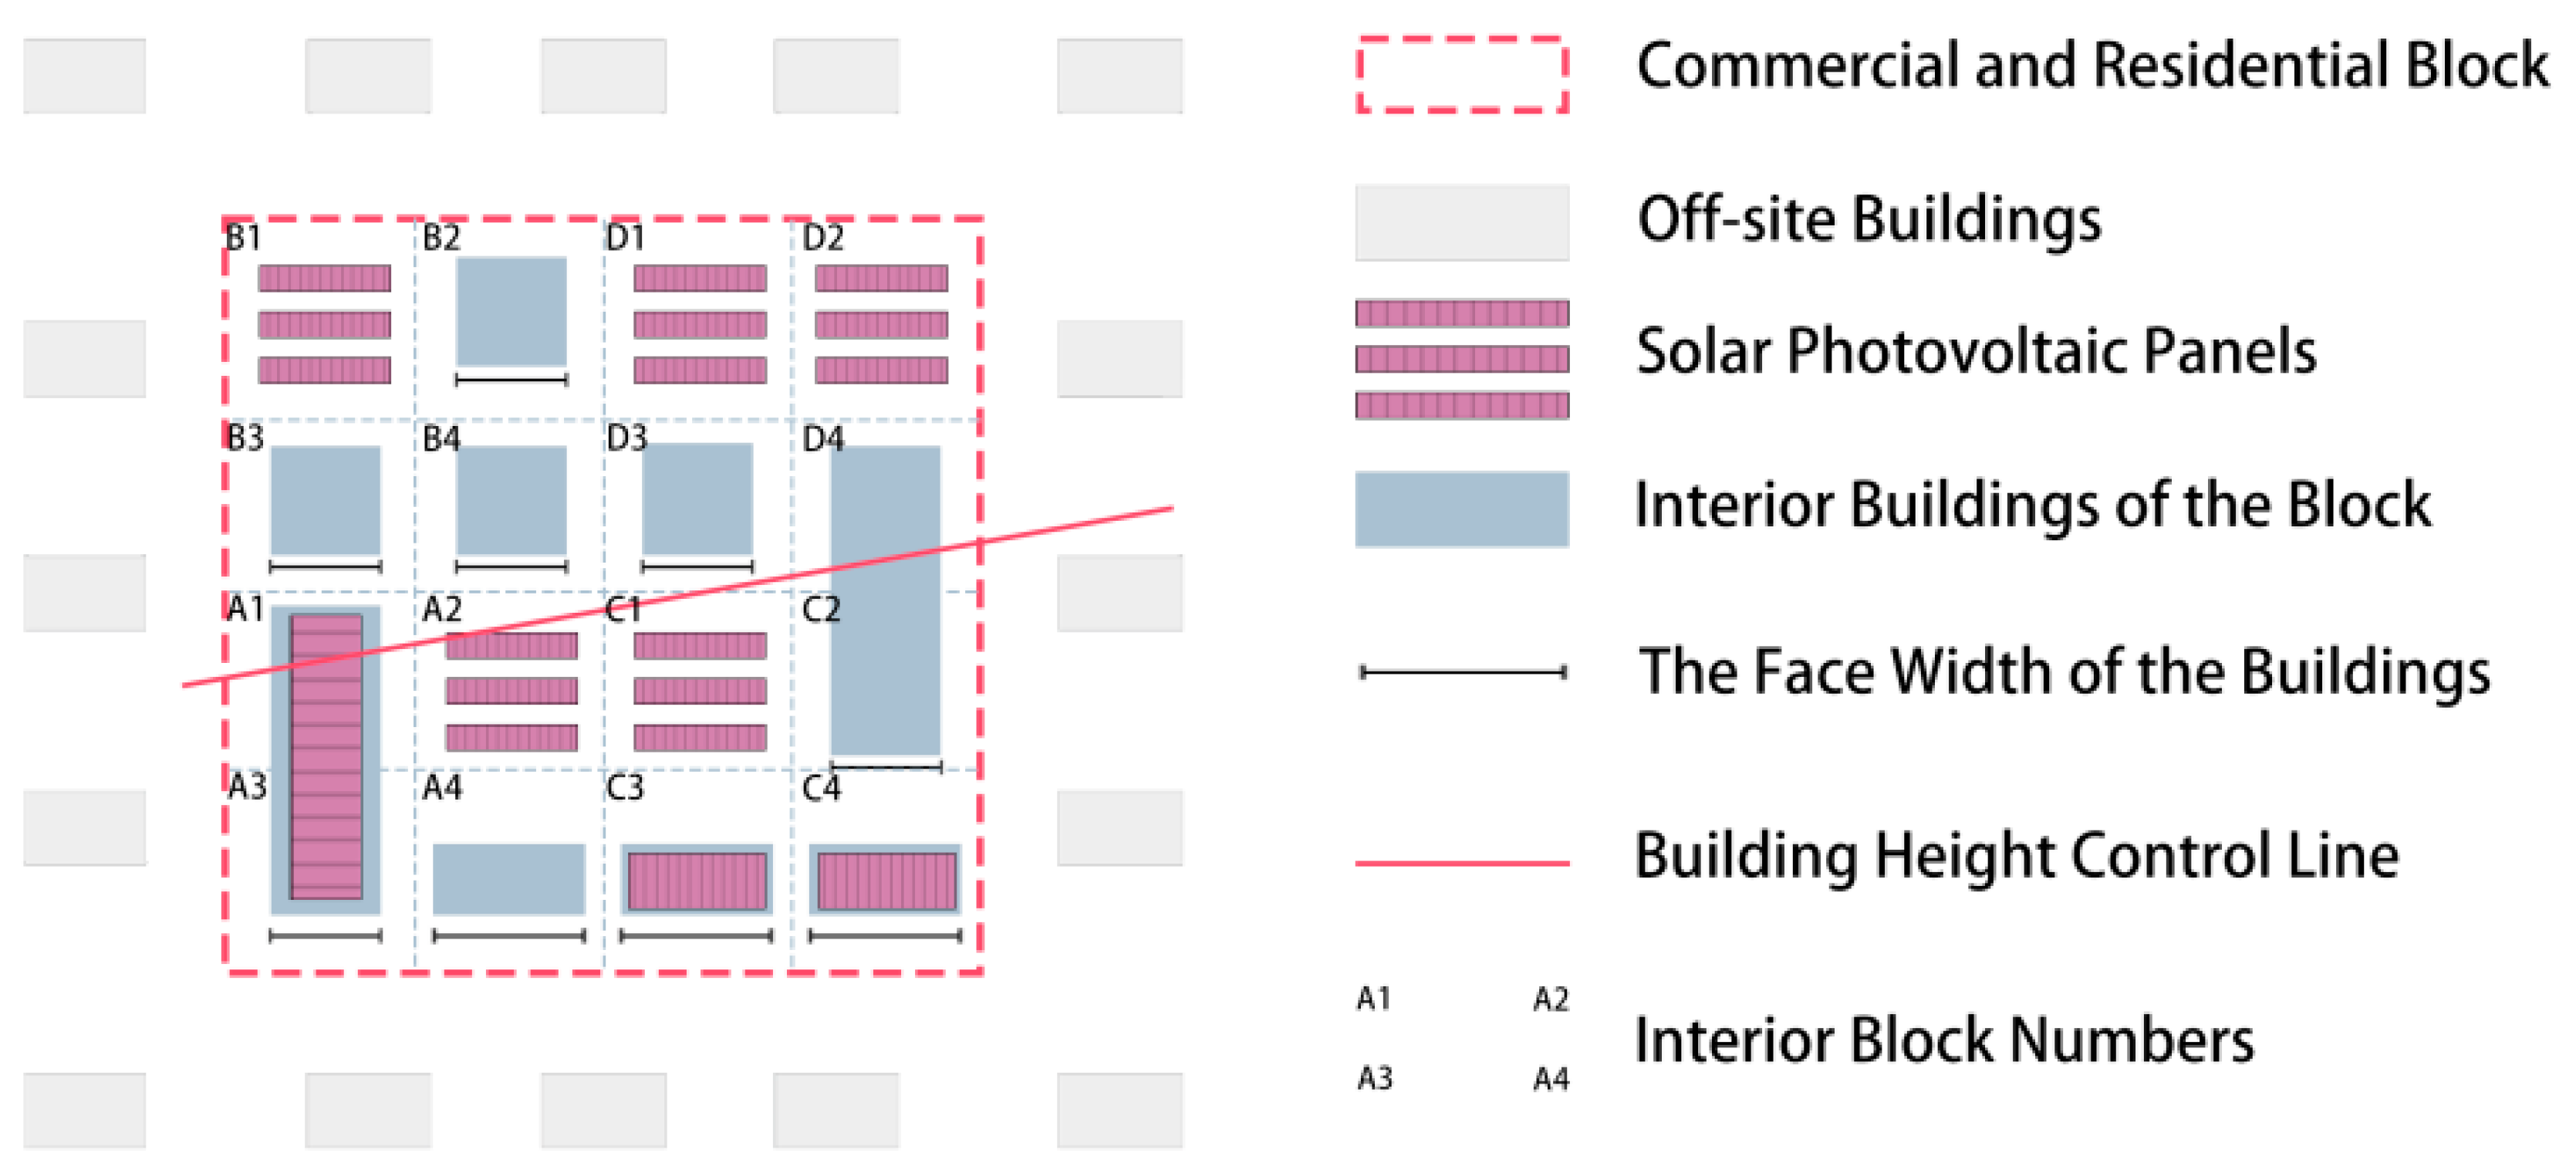
The study area is equally divided into four areas A, B, C, and D, and each area is subdivided into four plots. According to the design parameters, the plots are classified as buildings or open Spaces, and the buildings are divided into high-rise and low-rise, so as to realize fine design and control (Figure 5). Use Grasshopper (Grasshopper is a plugin for Rhinoceros software, developed by Robert McNeel & Associates. The company is headquartered in Seattle, WA, USA. Grasshopper is widely used in architectural design, industrial design, and interaction design, providing a visual programming environment for parametric modeling.) and Honeybee (Honeybee is a plugin developed by Ladybug Tools that operates within the Grasshopper environment. It is primarily used for environmental design analysis, supporting daylight simulations with Radiance and energy modeling with EnergyPlus. Ladybug Tools is based in New York City, NY, USA, and specializes in developing performance analysis tools for buildings and urban environments.) plug-in to analyze block energy consumption according to American Society of Heating, Refrigerating and Air-Conditioning Engineers (ASHRAE) standard and study the influence of design parameters (Table 4 and Table 5).
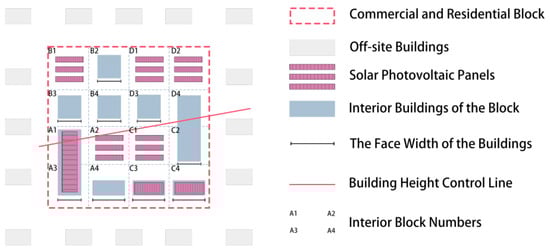
Figure 5.
Display of simulation parameter setting.
Table 4.
Block ideal model simulation setting.
Table 5.
Simulation objective function setting table.
3.3. Setting of Sampling Method
Firstly, according to the principle of LHS, the value ranges of key variables (such as the proportion of low level, the width of plot, etc.) were stratified, and the number of samples (n = 500) was defined. Secondly, 500 sets of parameter combinations satisfying the analysis of photovoltaic potential and building energy consumption were generated to ensure the uniformity and diversity of data distribution. Finally, based on the sampling results, a parametric model was constructed by combining machine learning algorithms (such as LightGBM) (Table 6).
Table 6.
LHS parameter setting table.
3.4. Setting of Data Processing Method
The combination of design parameters and the objective function value are obtained by sampling, and the Pearson analysis is used to preliminarily explore their relationship. In view of the nonlinear characteristics, the LightGBM regression algorithm is introduced. LightGBM is based on histogram algorithm and leaf splitting optimization, which accelerates processing and improves prediction accuracy, especially for large-scale high-dimensional data processing. Its multi-threading and distributed computing characteristics significantly enhance the training efficiency, and the regularization function effectively prevents overfitting. In order to verify the rationality of LightGBM, compared with AdaBoost regression algorithm, it shows the optimization advantages of LightGBM in splitting point search and tree growth strategy, which is more suitable for complex data sets and ensures the efficiency and accuracy of analysis (Table 7).
Table 7.
LRegression hyperparameter setting table for LightGBM and AdaBoost models.
4. Based on Simulation Results and Result Analysis
4.1. Overview of Simulation Results
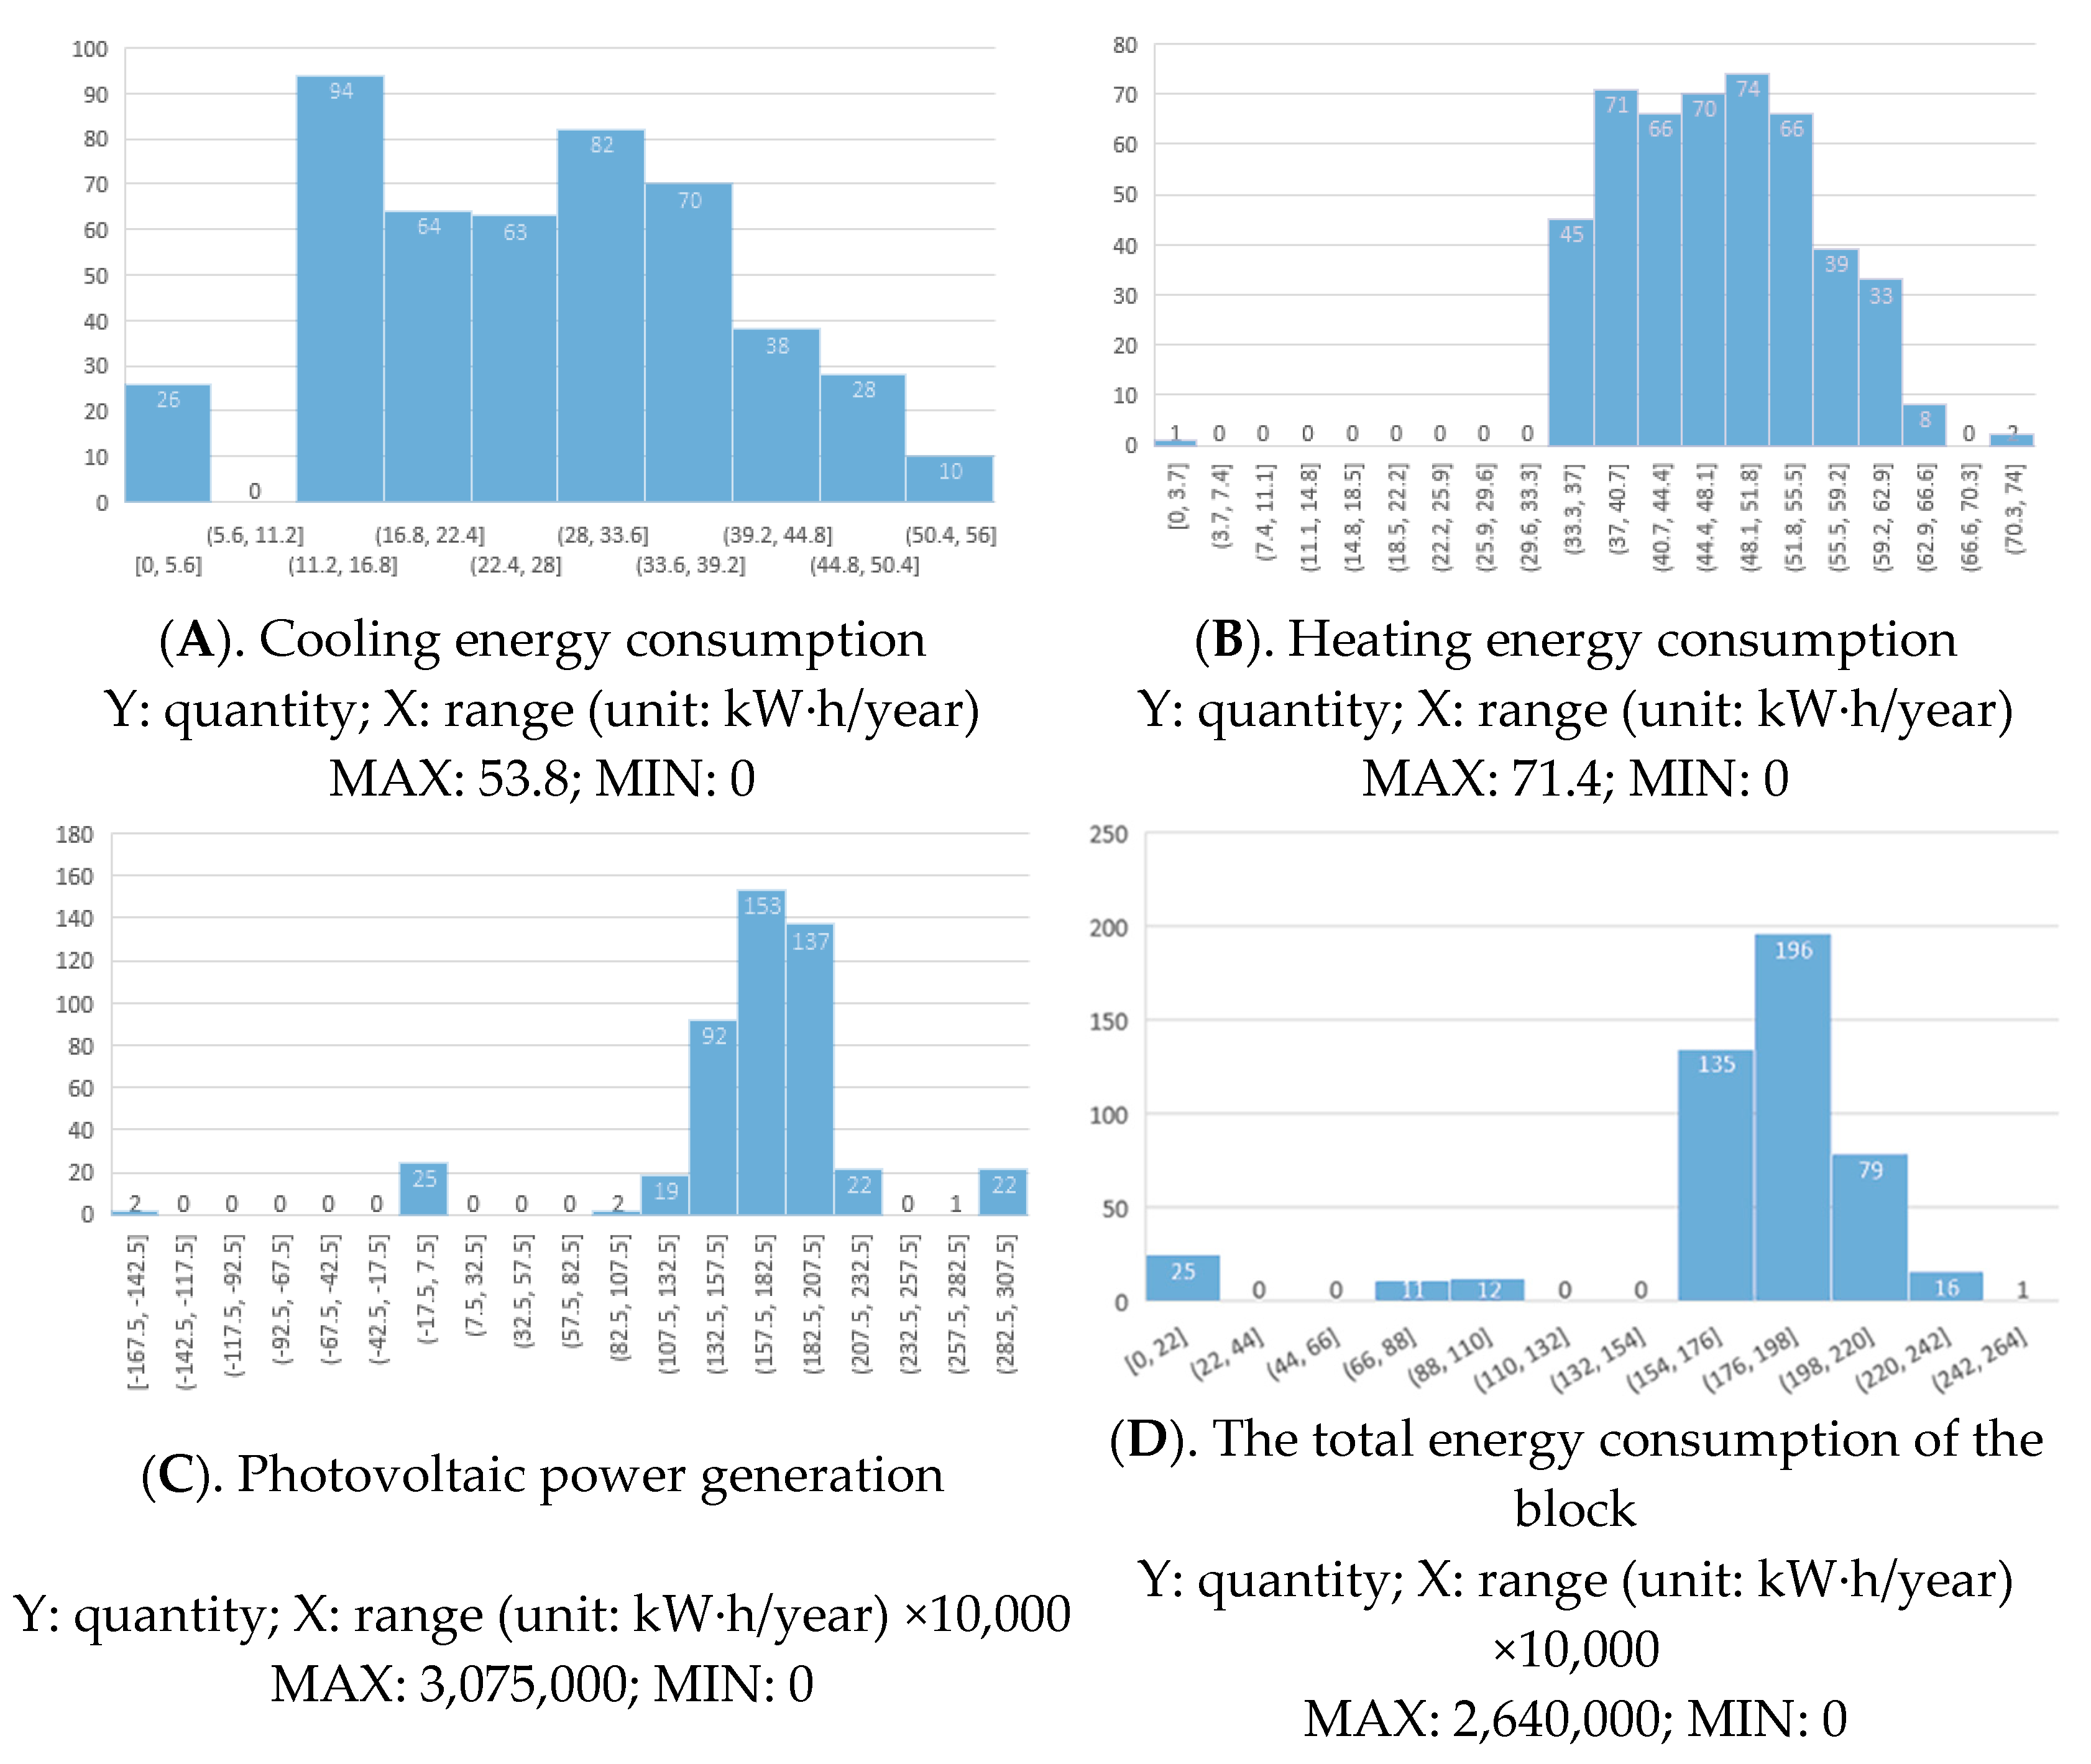
A total of 500 sampling times were carried out, and 475 objective function results were obtained after 92 h, as shown in Figure 6. The study drew a histogram of these 475 groups of design parameters and objective function values for comparative analysis, as shown in Figure 6 below.

Figure 6.
Overview of the heating energy consumption results. To ensure the accuracy and clarity of the reported data, potential misunderstandings and unrealistic values have been addressed. Specifically, the erroneous minimum value in the photovoltaic power generation data (originally reported as −167.5) has been removed. This correction aligns the data with realistic physical constraints and enhances the reliability of the findings.
The distribution of cooling energy consumption shows a clear right-skewed trend. The cooling energy consumption of most samples is concentrated in the range of 10 to 30, and only a few samples consume more than 40. This result indicates that the cooling energy consumption of buildings in the block is generally at a low level under the current design parameters, but the presence of high value samples also suggests potential optimization needs, especially in reducing the cooling demand of high energy consumption buildings.
The distribution of heating energy consumption appears to be more uniform, with most samples concentrated in the range of 40 to 60, and the energy consumption level is relatively stable. However, there are still a small number of samples whose heating energy consumption is significantly higher than the average, showing some volatility. These high value samples show that there is still room for improvement in the further optimization of heating demand in block planning and building design.
The distribution of PV power generation shows the characteristics of an approximately normal distribution, which is mainly concentrated in the interval of 1 million to 2 million. This result indicates that the performance of the PV system is stable, and the overall generation efficiency performs well within the current design parameters. But at the same time, it also means that by adjusting the design parameters, it is still possible to further optimize the efficiency of the photovoltaic power generation system, thereby increasing the proportion of renewable energy in the building energy consumption.
The distribution of the total energy consumption of the block is relatively concentrated. The total energy consumption of the vast majority of samples is distributed in the range of 1.6 million to 2.1 million, and only a few samples exceed 2.3 million or less than 1.6 million. The distribution characteristics show that the overall energy consumption of the block has less volatility under the change in design parameters, but the optimization of high energy consumption samples still needs to be paid attention to further improve the energy efficiency level of the block as a whole.
Taken together, it is found that the change in design parameters significantly affects the energy consumption distribution and photovoltaic generation efficiency of block buildings. Specifically, the values of the objective function show different distribution characteristics with the change in design parameters, especially in the distribution of cooling energy consumption and photovoltaic power generation. In view of these findings, the subsequent research needs to combine parameter sensitivity analysis to deeply explore the influence law of key design parameters on energy consumption and power generation, so as to develop a more scientific optimization strategy.
When the same design parameters are changed, the E value, the energy efficiency index, changes in a large range, which indicates that the block building design is more sensitive to parameter adjustment. In the subsequent optimization process, designers should focus on the fluctuation of E value and take it as one of the core indicators to improve energy efficiency and optimize design.
4.2. Correlation Analysis Between Design Parameters and Objective Function
Pearson correlation analysis was used to evaluate the relationship between the values of 475 sets of design parameters and their corresponding objective function values. The Pearson correlation coefficient results for each objective function are visualized in the heat map in Table 8.
Table 8.
A. Solar power _ Normalized; B. Heating energy consumption; C. Cooling energy consumption; D. Total energy consumption. Objective function related heat.  A. Axis left and right displacement B. Axis rotation C. Axis forward and backward displacement D. Proportion of lower strata E. 04 face width F. 04 Open space G. 00 face width H. 03 Open Space I. 02 face width J. 02 Open Space K. 01 face width L. 01 Open Space M. Solar power _ Normalized N. Heating energy consumption O. Cooling energy consumption P. Total energy consumption.
A. Axis left and right displacement B. Axis rotation C. Axis forward and backward displacement D. Proportion of lower strata E. 04 face width F. 04 Open space G. 00 face width H. 03 Open Space I. 02 face width J. 02 Open Space K. 01 face width L. 01 Open Space M. Solar power _ Normalized N. Heating energy consumption O. Cooling energy consumption P. Total energy consumption.
The study shows that there is a significant correlation between some of the design parameters and the objective function. Specifically, the proportion of low-rise buildings has the most significant impact on the performance of heating, cooling and photovoltaic systems, and the correlation coefficients are −0.970, −0.904, and −0.861, respectively, showing a strong negative correlation. This result indicates that increasing the proportion of low-rise buildings in the building design can significantly reduce the energy consumption requirements of the system while optimizing the PV power generation performance.
The correlation coefficient between the area width of plot B and the total energy consumption of block is −0.944, indicating that the area width of plot B has a significant negative correlation with the total energy consumption. The correlation coefficient of the area width of plot A is −0.912, which is also negative, but the influence degree is relatively low. These analysis results show that in urban planning and architectural design, appropriately increasing the plot width can effectively reduce the total energy consumption of the block, thereby improving energy efficiency (Table 9).
Table 9.
Results of significance analysis of the relationship between design parameters and objective function.
It is also found that the correlation between other design parameters (open space, surface width) and the objective function is generally weak, and the relationship is nonlinear, which indicates that there may be more complex interaction mechanisms.
4.3. Designing a Machine Learning Regression Model with Parameters Related to the Target Function
The regression analysis results show that LightGBM is significantly better than AdaBoost in all aspects (Table 10). Specifically, the LightGBM model shows excellent performance in the prediction of heating, cooling, photovoltaic power generation, and total energy consumption. The R-squared values of the training set and the prediction set are close to or more than 0.9, which fully verifies the high accuracy and generalization ability of the model and provides strong support for the prediction and optimization of block building energy consumption.
Table 10.
Objective function evaluation table.
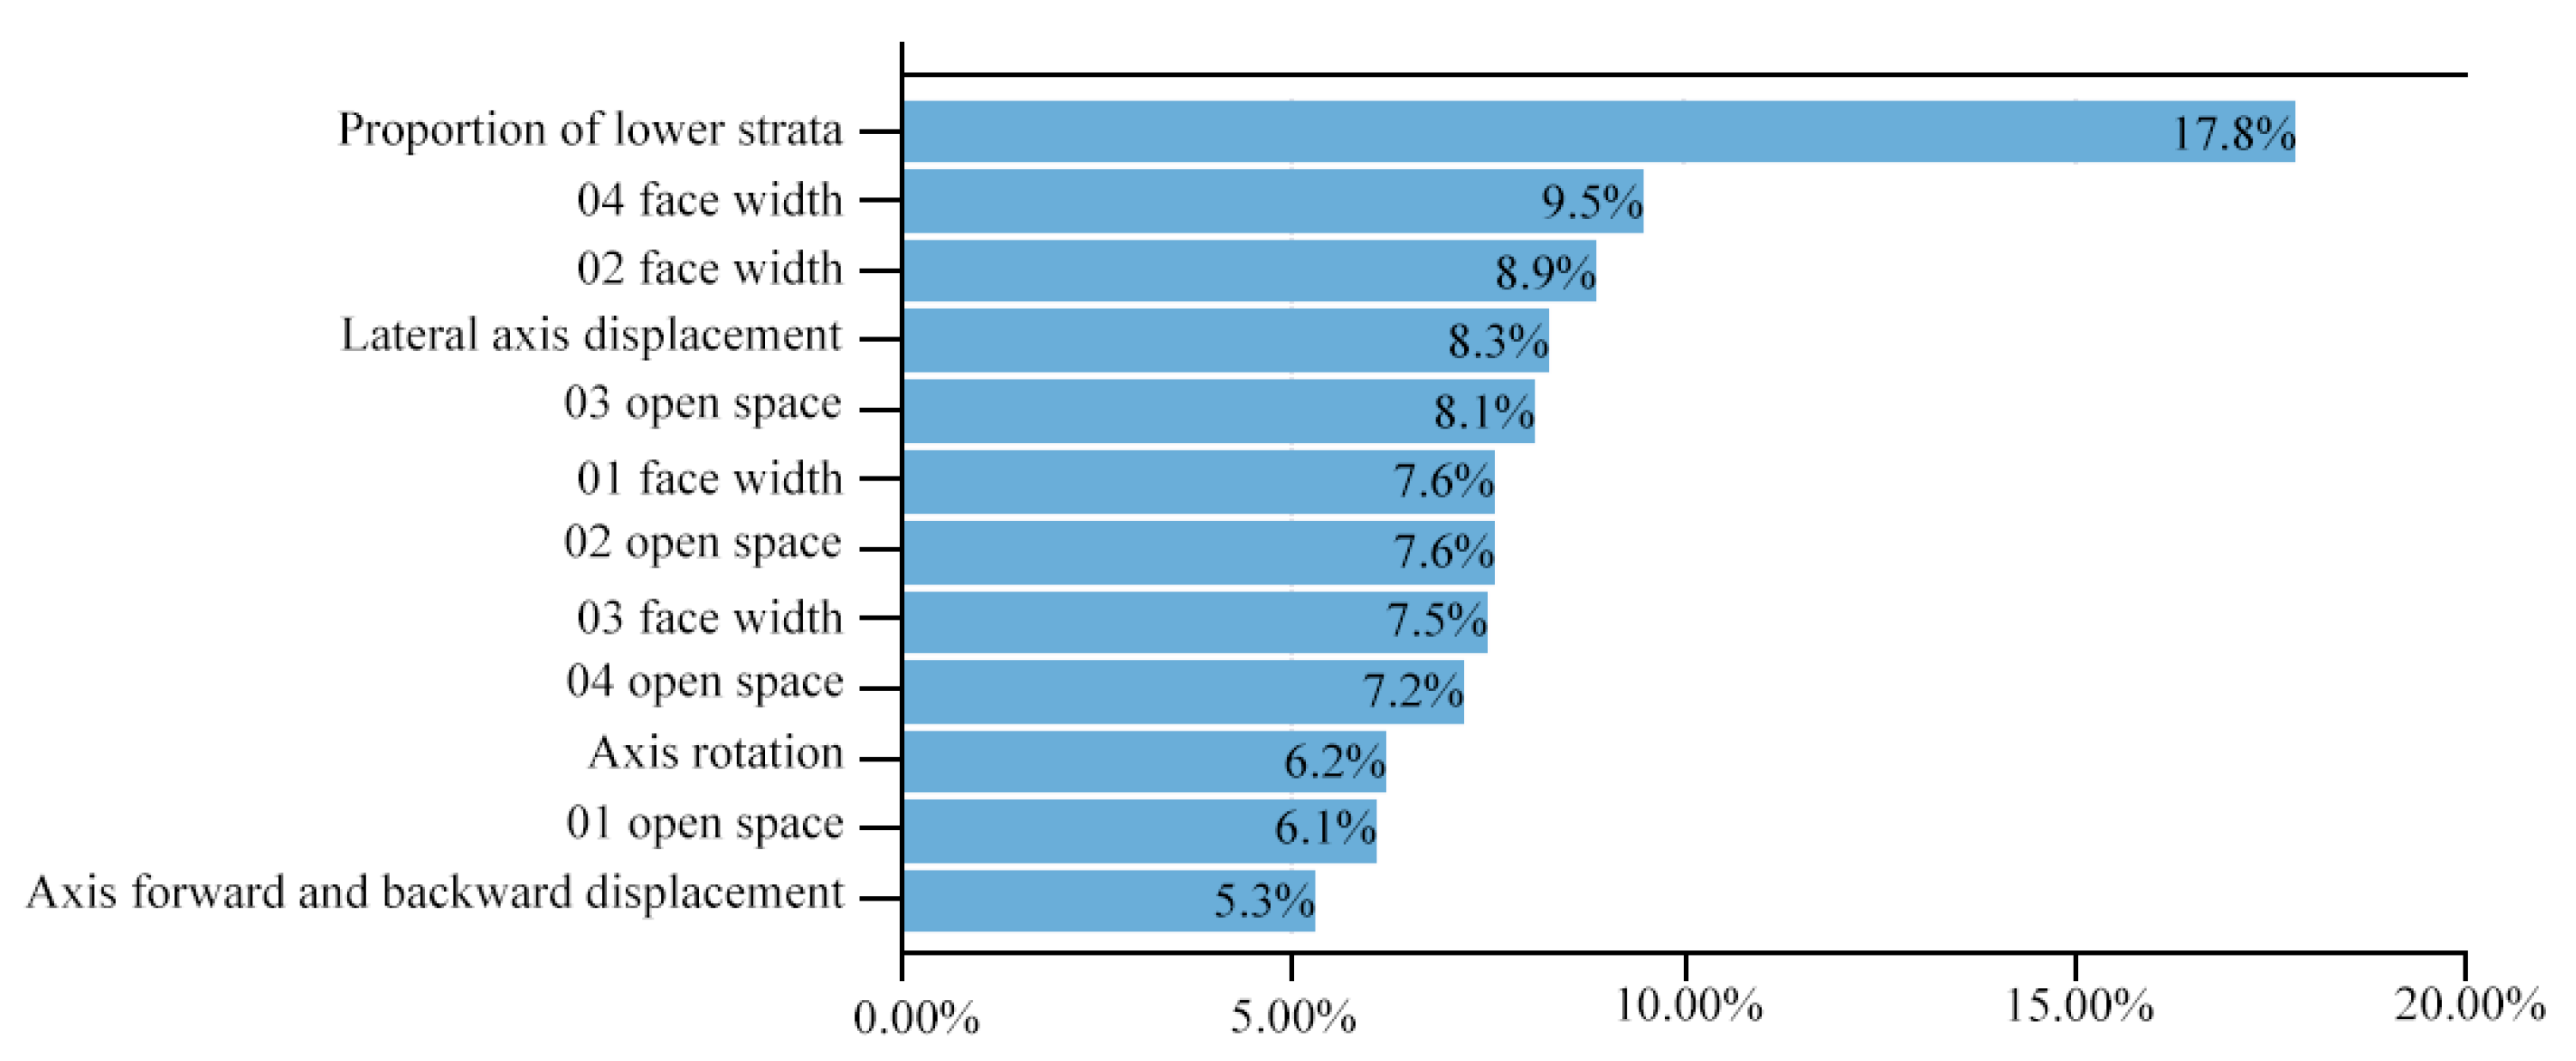
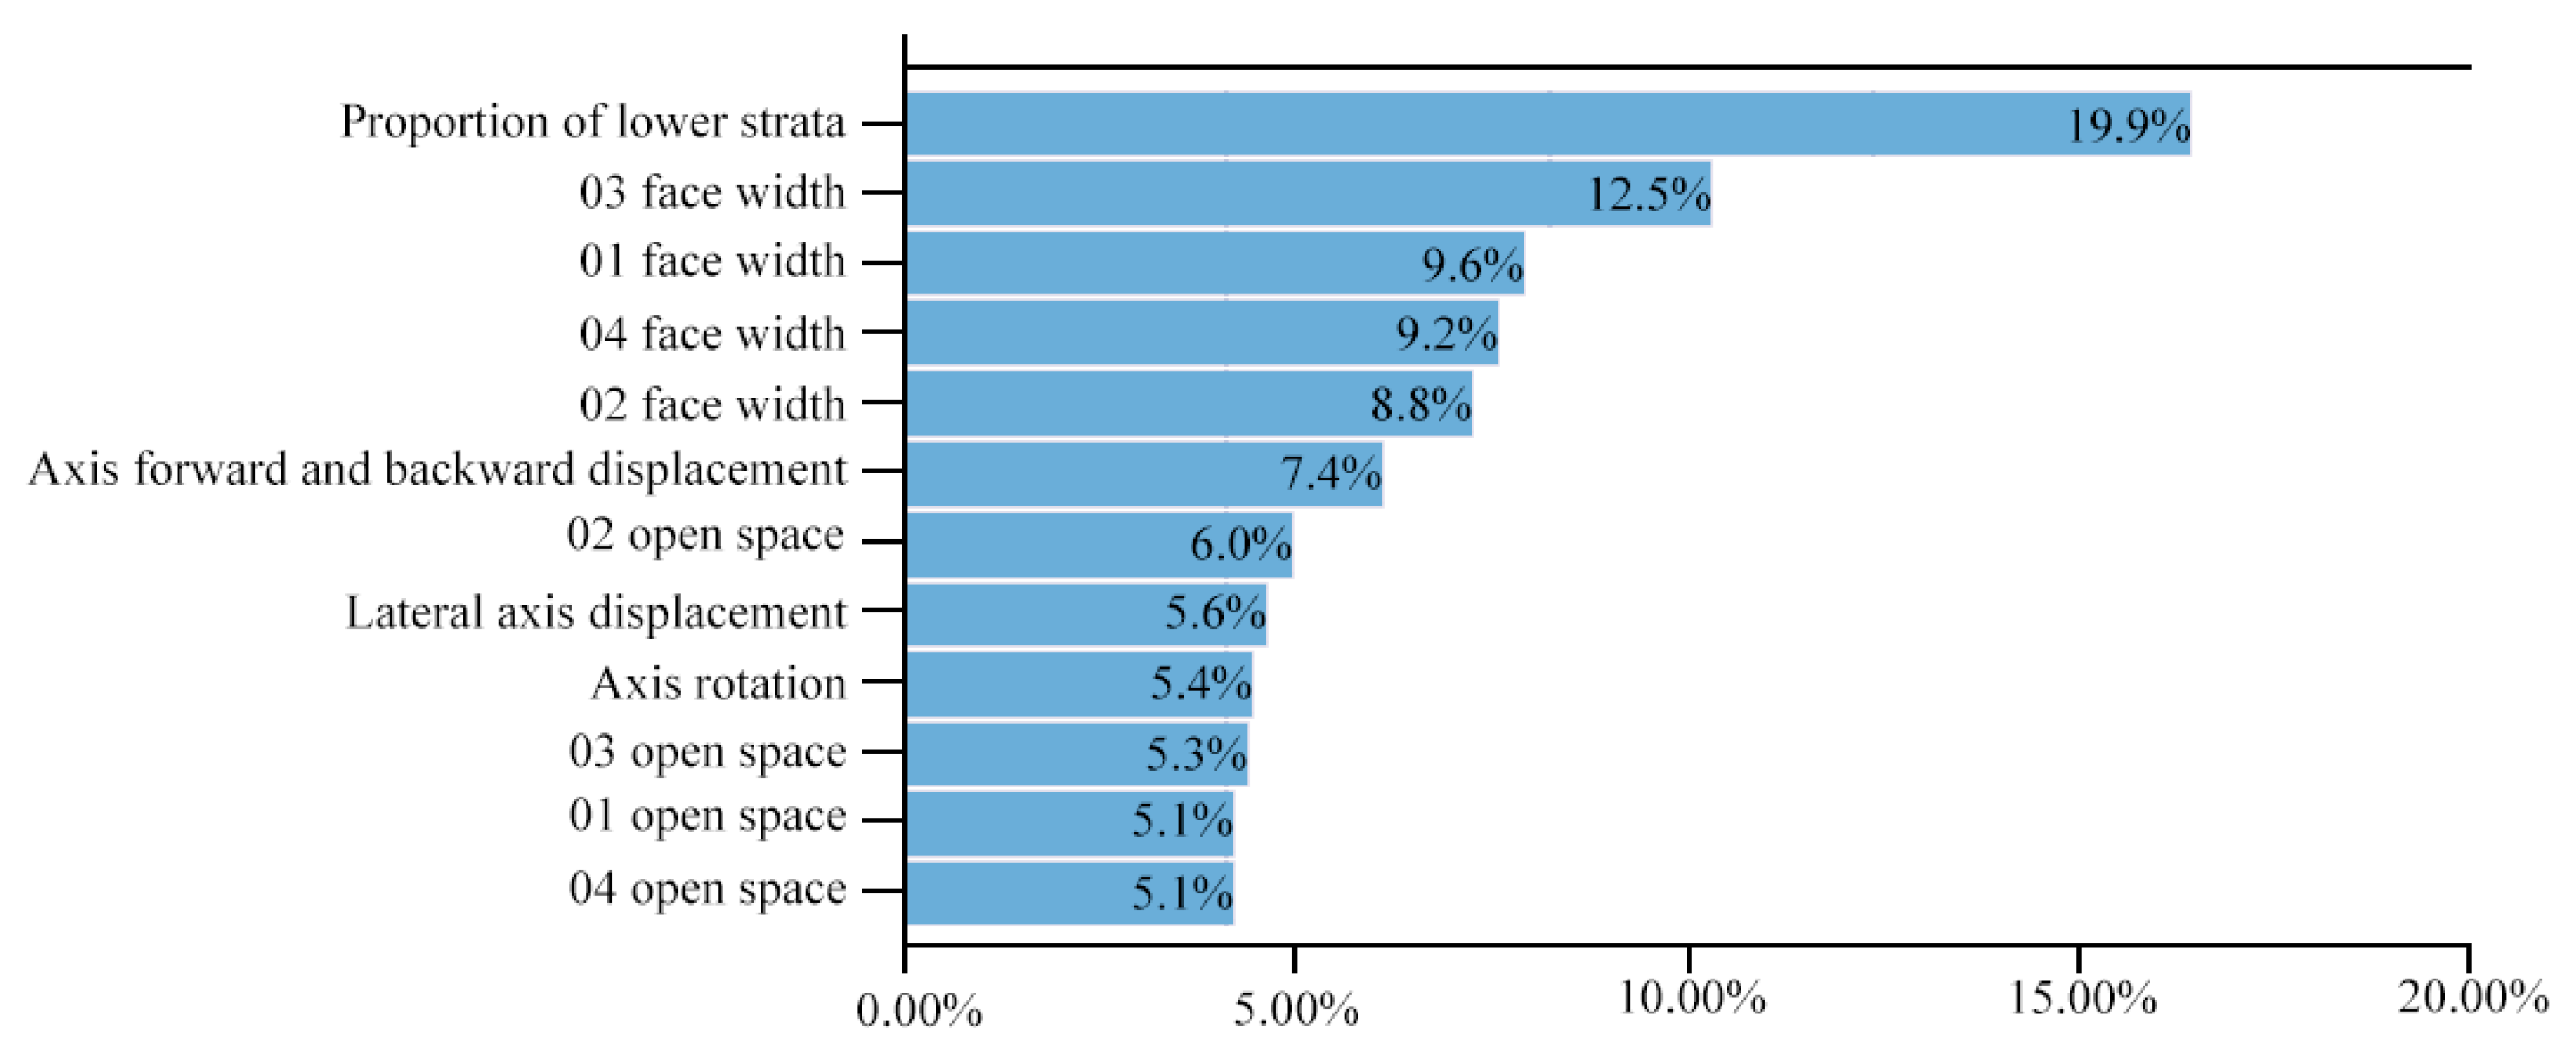
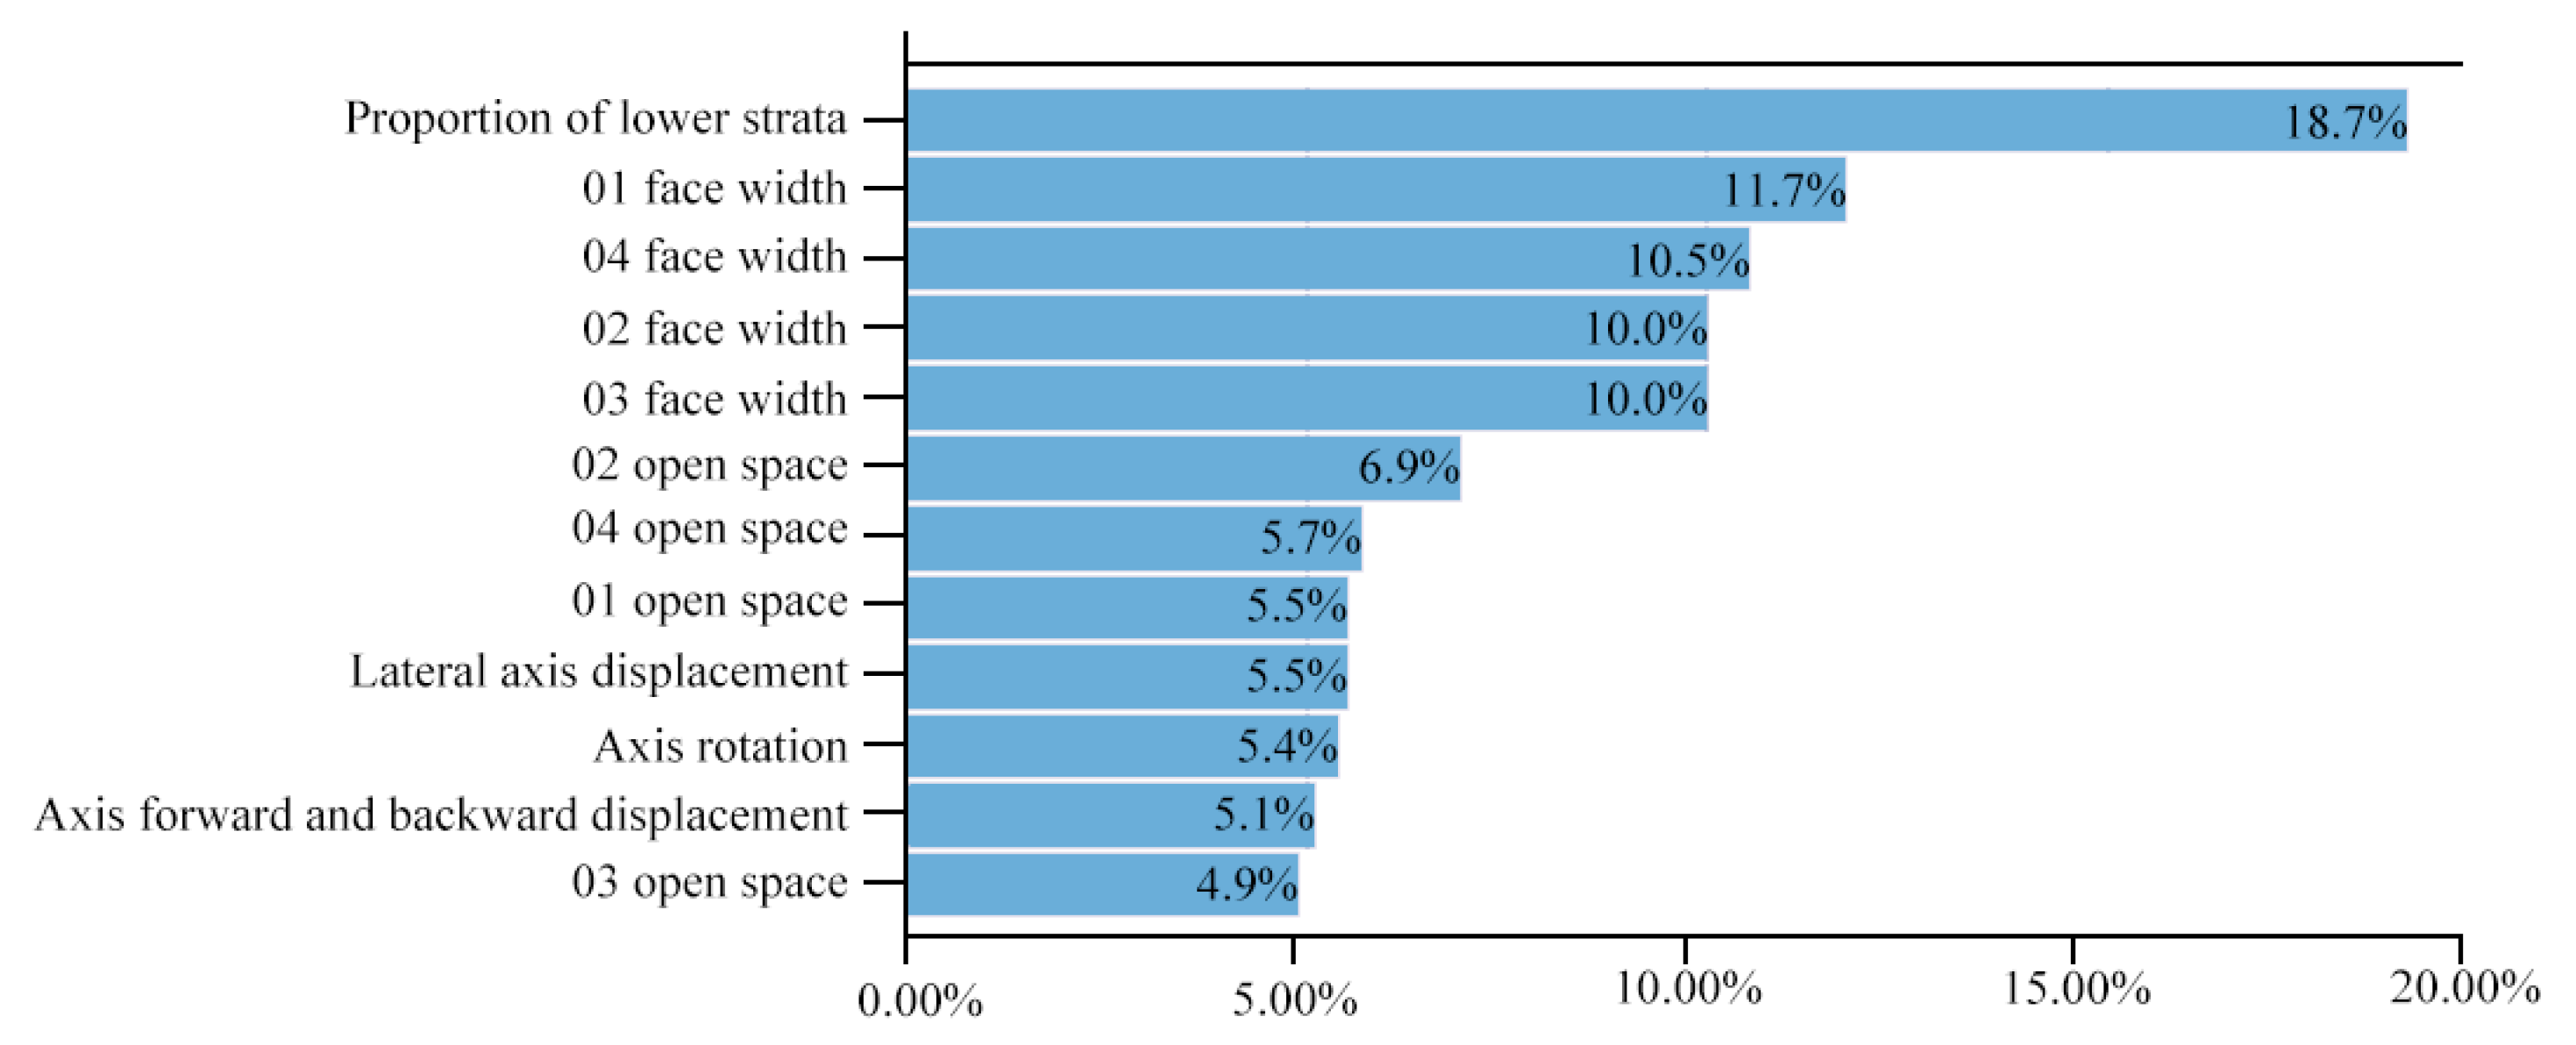
Based on the feature importance of the objective function of LightGBM regression analysis, the feature influence is ranked and quantified for heating energy consumption (Figure 7), cooling energy consumption (Figure 8), photovoltaic power generation (Figure 9), and total electricity consumption (Figure 10).
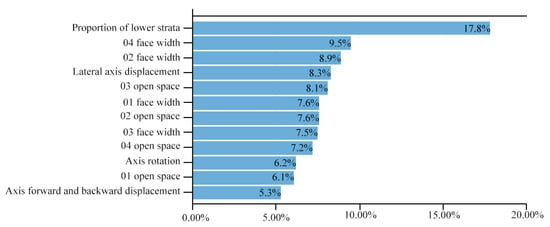
Figure 7.
Feature importance of heating energy consumption.

Figure 8.
Feature importance of cooling energy consumption.

Figure 9.
Feature importance of PV power generation.
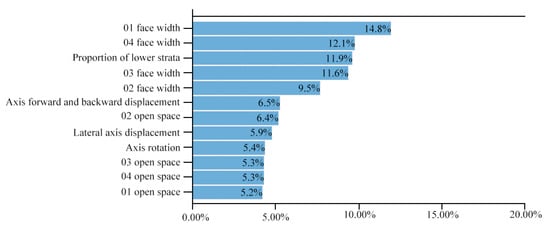
Figure 10.
Feature importance of total power consumption.
- In the heating energy consumption (Figure 7), the most critical feature of the heating energy consumption is the proportion of low-rise buildings (17.8%), indicating that the proportion of low-rise buildings in the block has a significant effect on the heating energy consumption, which may be related to the heat loss characteristics of low-rise buildings. Secondly, the area width of plot D (9.5%) also has a great impact on heating energy consumption, which may be related to the plot form and its building arrangement density;
- In the cooling energy consumption (Figure 8), the main influence feature of cooling energy consumption is the proportion of low floors (19.9%), reflecting the close relationship between the number of building floors and the cooling demand in summer. At the same time, the importance of the surface width of plot C (12.5%) is also high, indicating that the width parameter in plot design has a key impact on the cooling energy consumption of the block;
- Photovoltaic power generation (Figure 9), in the photovoltaic power generation model, the proportion of low-rise (18.7%) is the most important feature, probably because low-rise buildings increase the laying area of photovoltaic panels. Secondly, the importance of the width of plot A (11.7%), plot A (14.8%), and plot D (12.1%) is high, indicating that the width and orientation of different plots play a key role in the optimization of photovoltaic power generation efficiency;
- In the total electricity consumption model of total electricity consumption (Figure 10), the area width of plot A (14.8%) is the most important feature, followed by the area width of plot D (12.1%) and the proportion of low layers (11.7%). This indicates that the parametric design of different plots and the proportion of building floors have an important influence when optimizing the total energy consumption.
Under different objective functions, the proportion of low-rise buildings and the plot width are significant influencing features, especially in the heating energy consumption, cooling energy consumption and photovoltaic power generation models. This indicates that the number of building floors and plot shape parameters have global significance for the energy performance optimization of the block, and reasonable control of the proportion of building floors and plot width can significantly improve the energy efficiency and renewable energy utilization rate of the block.
4.4. Morphological Analysis of Typical Cases
In order to further analyze the relationship between the design parameters and the objective function, the best 10 optimal solutions for each of the 475 cases are extracted to form the optimal solution set. At the same time, the research also extracts the worst 10 solutions with respect to the objective function to form the worst solution set. By refining the optimal and worst solution sets, the study reveals the deep rules between design parameters and energy consumption.
Figure 11 shows the optimal and worst block morphologies for heating energy consumption. The optimal form (A) is a compact building layout, small distance, forming a micro-climate zone, effectively reducing heat loss; the high-rise building in the center acts as a wind barrier to reduce the impact of cold wind. The worst form (B) is when the building is distributed in strips, with large spacing, high wind speed, large external wall area, and serious heat loss. It is suggested that northern cities adopt intensive layout and reasonable collocation of high and low buildings to improve heating efficiency.
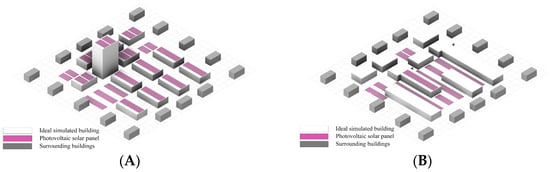
Figure 11.
(A). Optimal block form for heating energy consumption; (B). Block forms with the worst heating energy consumption. Heating energy consumption block morphology.
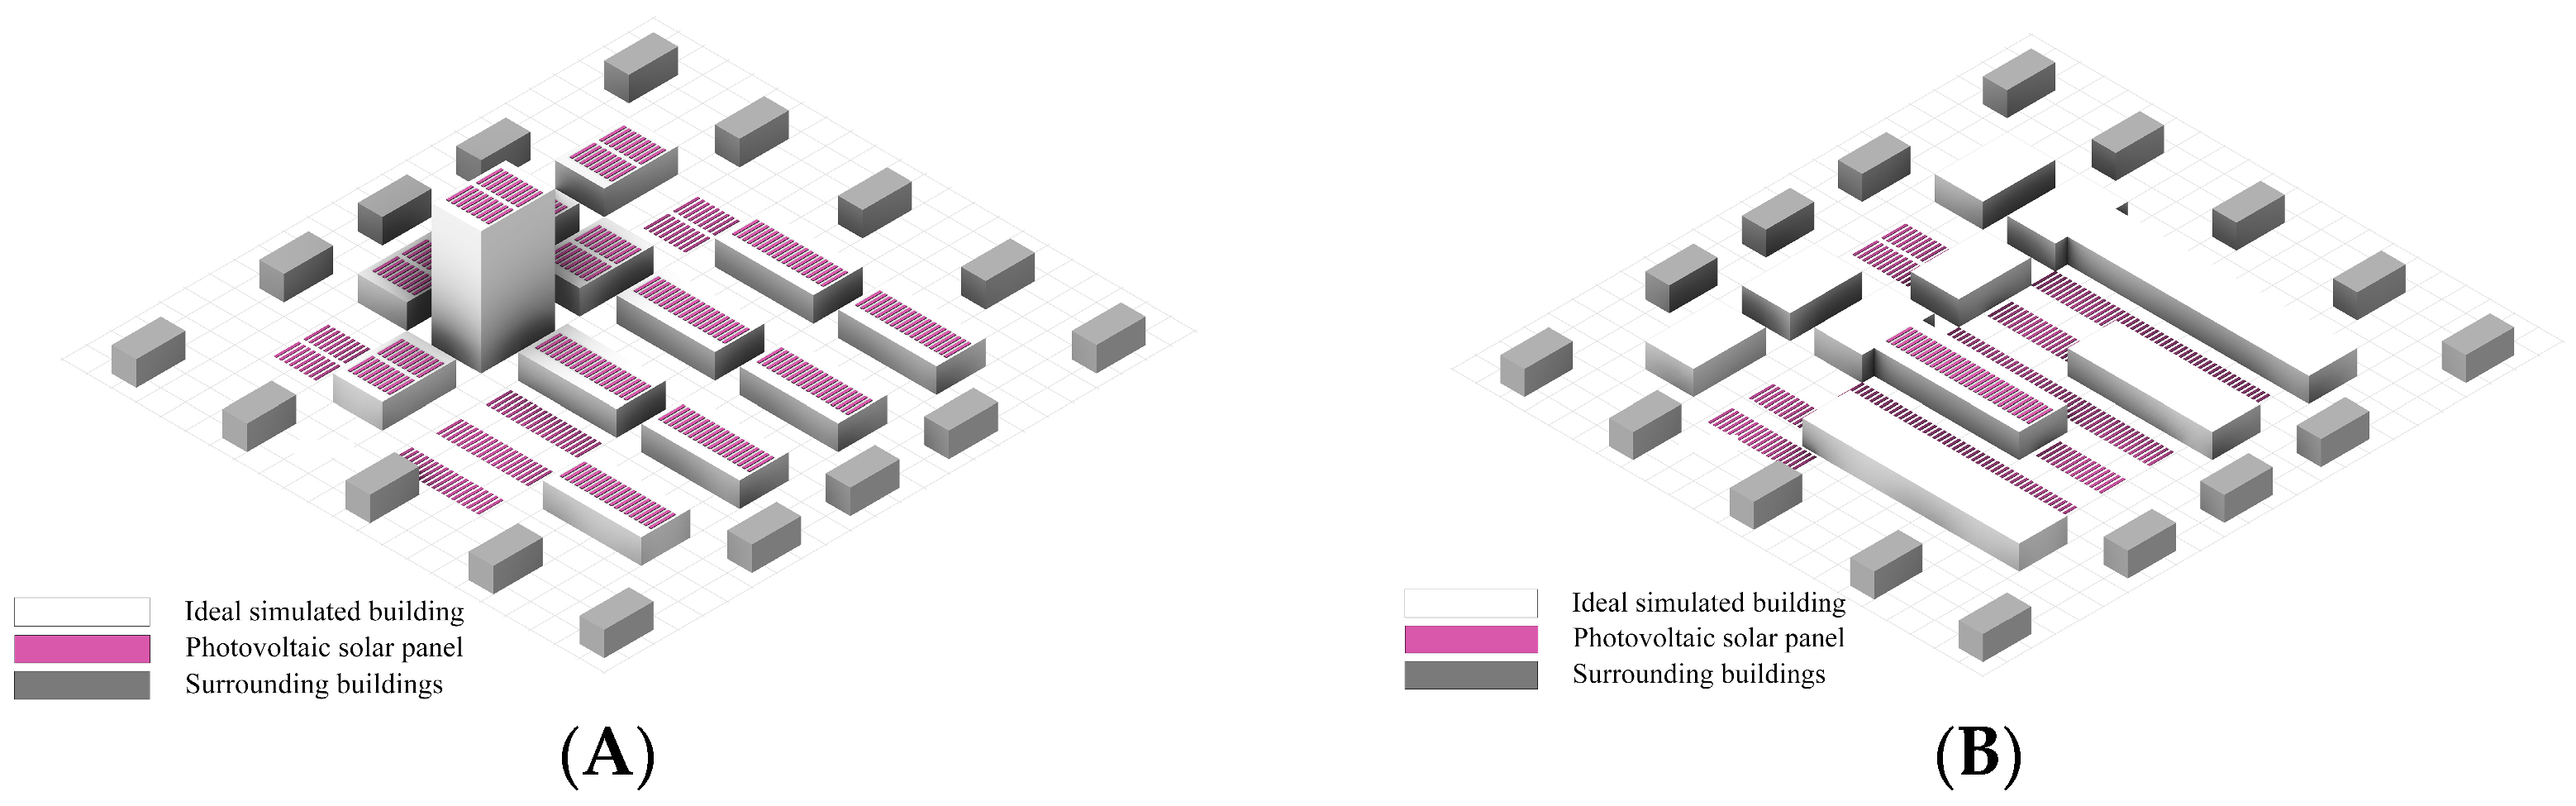
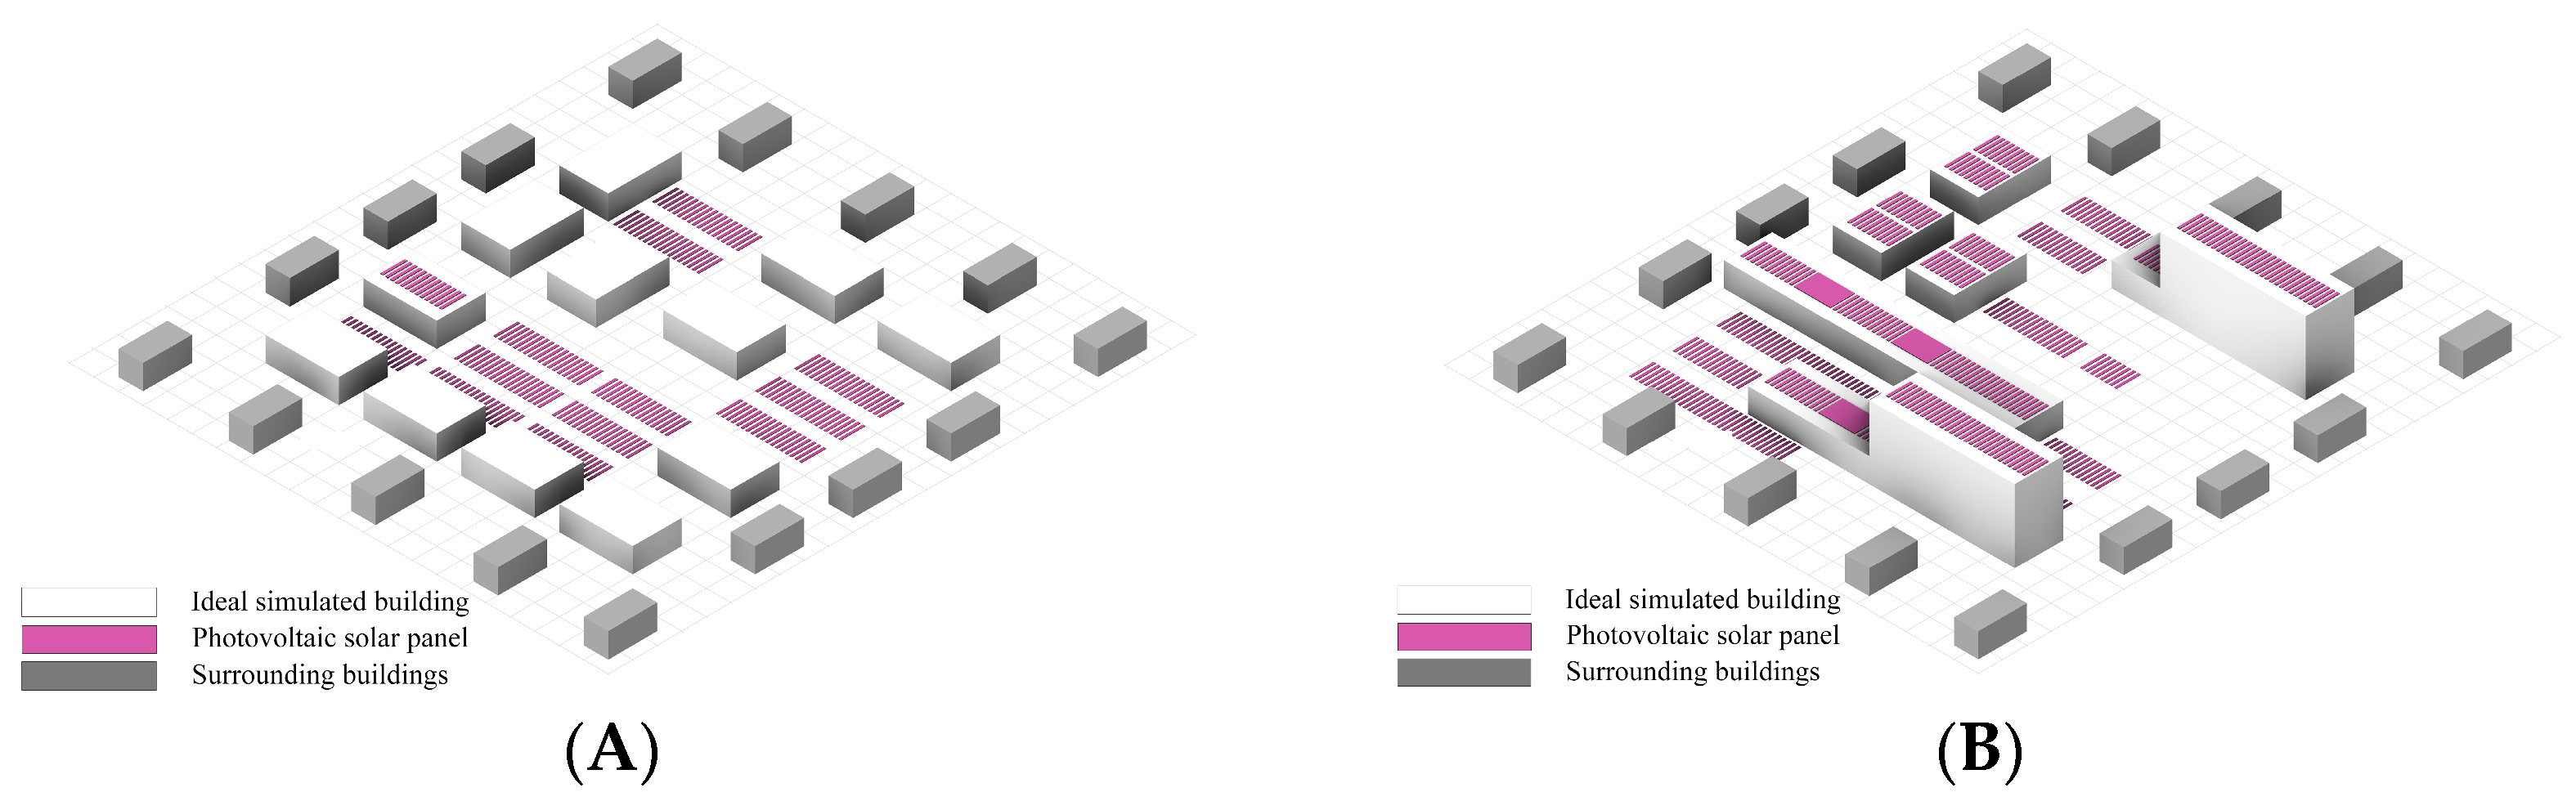
Figure 12 shows that the optimal form of cooling energy consumption (A) achieves shading and natural ventilation through reasonable building density and photovoltaic panel arrangement and significantly reduces cooling load. In the worst form (B), the buildings are scattered, the shading is insufficient, the ventilation flow line is not smooth, and the heat island effect is obvious. It is suggested to optimize the ventilation corridor, building orientation and spacing to improve the ventilation and cooling effect.
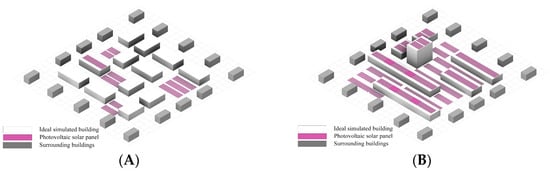
Figure 12.
(A). Optimal block form for cooling energy consumption; (B). The block form with the worst cooling energy consumption. Shape diagram of refrigeration energy consumption block.
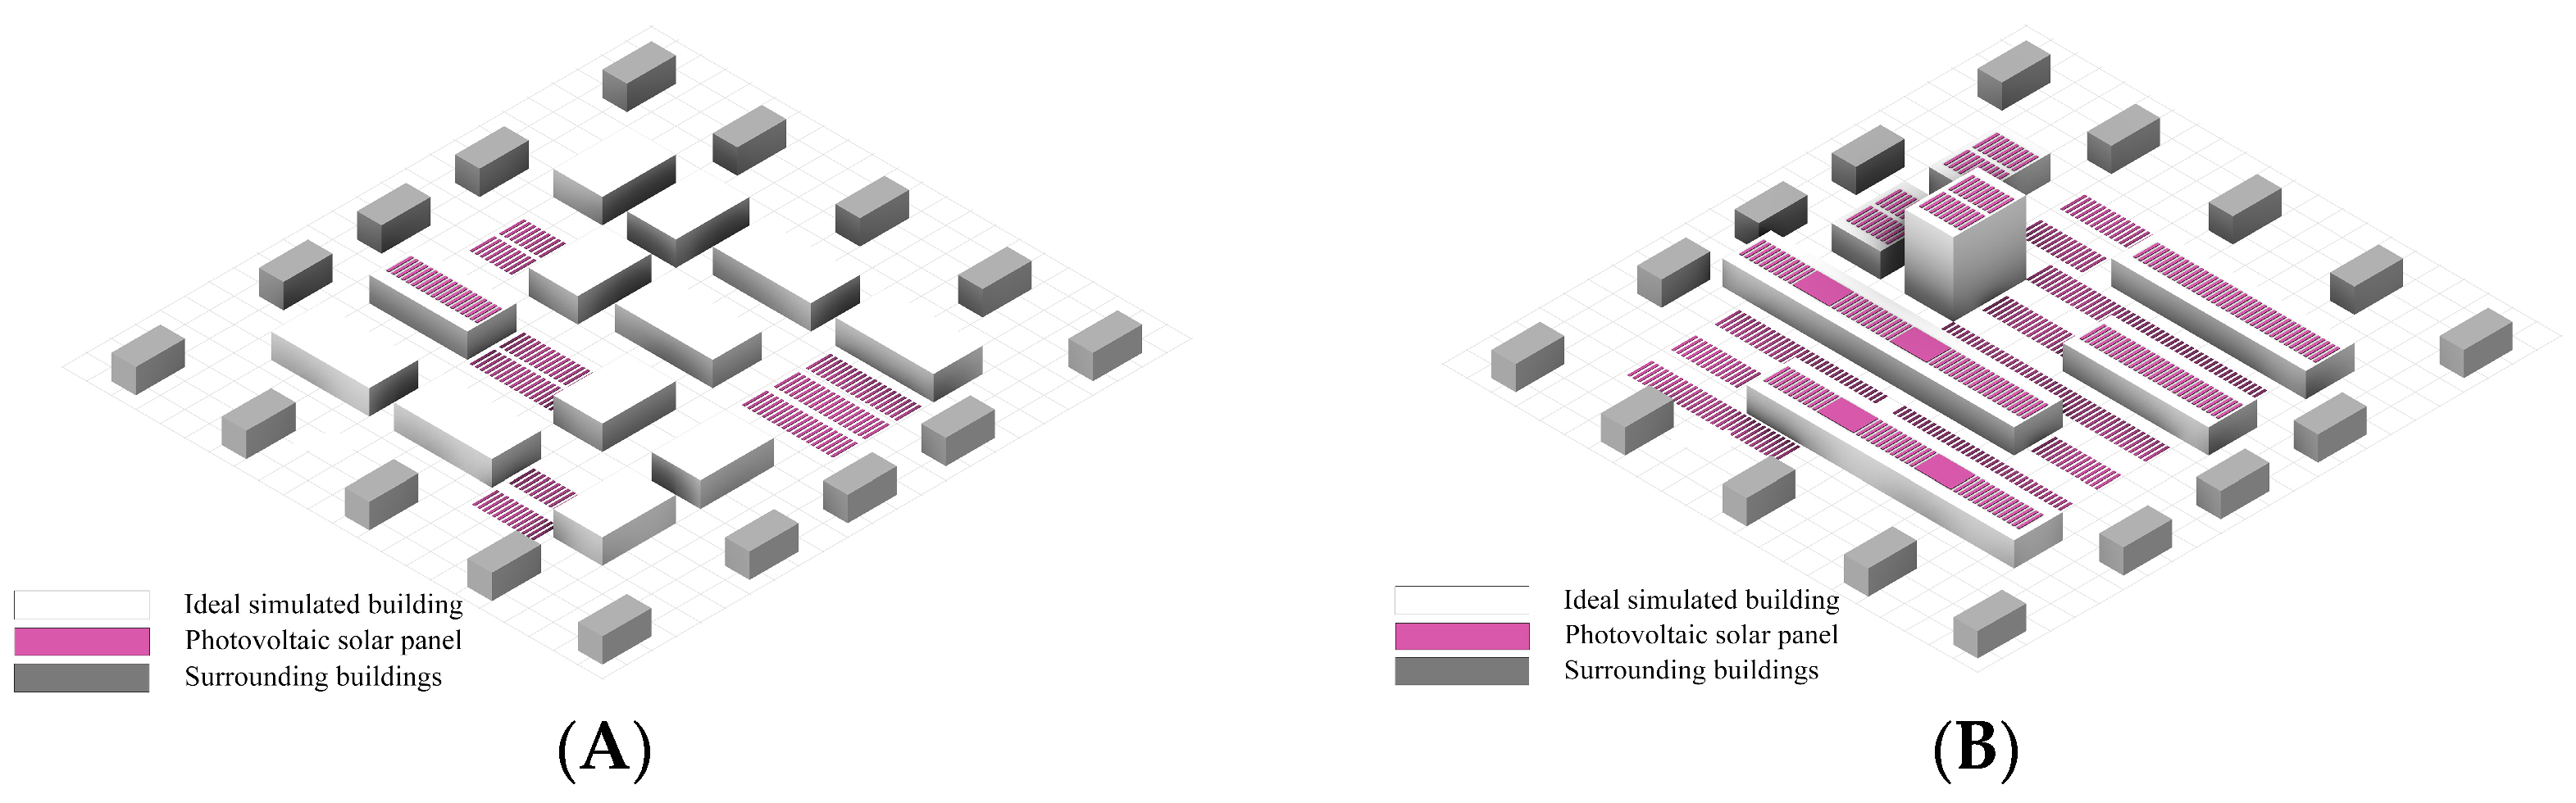
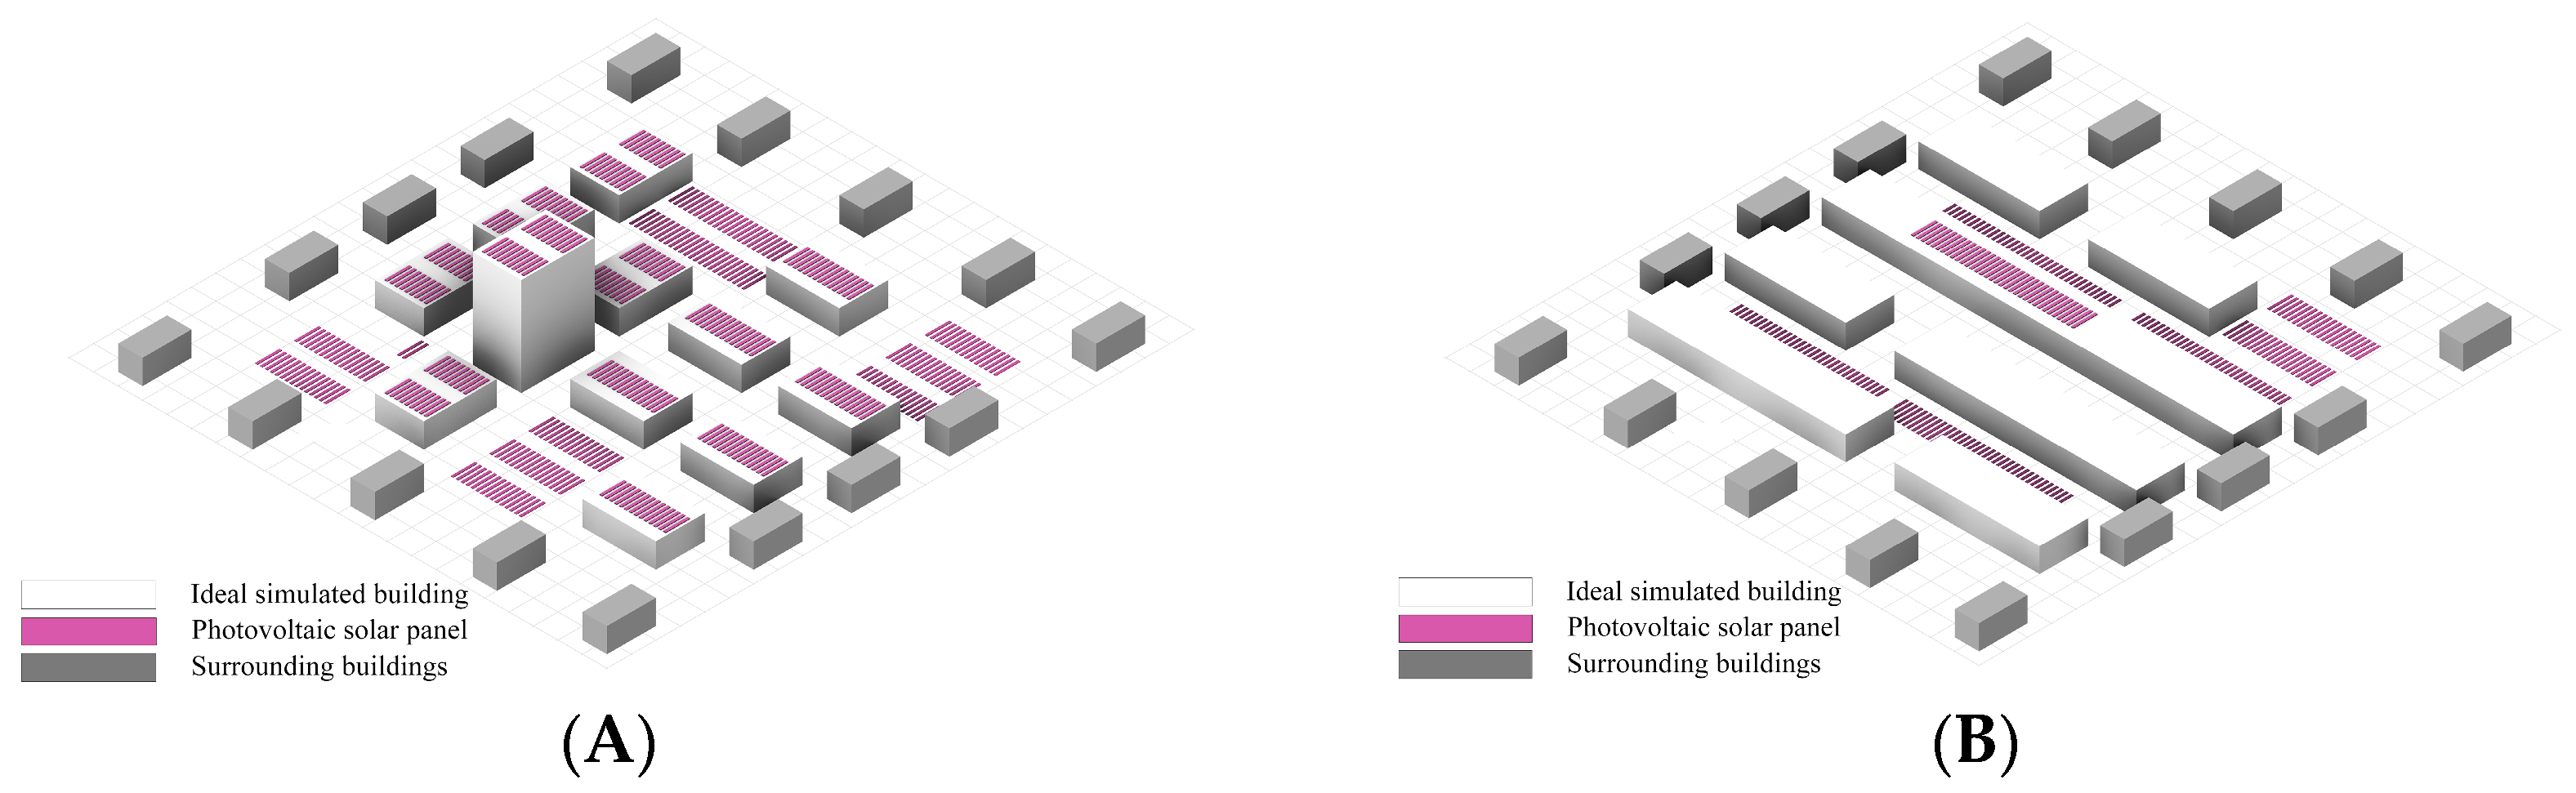
Figure 13 shows that the optimal form (A) building height is consistent, the layout is regular, the occlusion is reduced, and the photovoltaic efficiency is improved. In the worst form (B), the buildings are enclosed and distributed in strips, with serious occlusion and low power generation. It is recommended to reduce the height difference, optimize the central axis arrangement, and expand the photovoltaic panel area in the southwest and southeast regions to improve power generation efficiency.
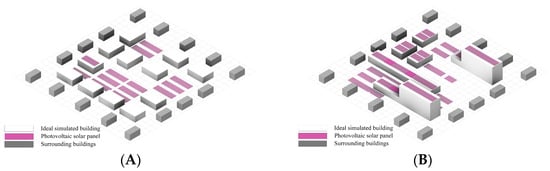
Figure 13.
(A). The optimal block form of photovoltaic power generation; (B). The block form with the worst photovoltaic power generation. Morphological diagram of photovoltaic power generation block.
Figure 14 compares the optimal and worst morphologies of the total energy consumption. The optimal form (A) had a compact building layout, centralized core building, optimized photovoltaic panel utilization and natural ventilation, and reduced heat transfer loss. The worst form (B) has scattered buildings, low utilization of photovoltaic panels, poor ventilation, and significantly higher energy consumption. It is suggested that compact layout, centralized design of functions, and collaborative optimization of ventilation and photovoltaic panels should be strengthened.

Figure 14.
(A). The optimal block form for total energy consumption; (B). Block form with the worst total energy consumption. Total energy consumption block morphology diagram.
4.5. Conclusions
Through a systematic analysis of the design parameters of 15 representative urban blocks in Wuhan, including old blocks and new blocks, the coupling relationship between building energy consumption and photovoltaic power generation efficiency was studied and evaluated. The results show that the adjustment of design parameters has a significant impact on block energy consumption and photovoltaic power generation, especially in the proportion of low-rise buildings and plot width. Specifically, the increase in the proportion of low-rise buildings can effectively reduce the energy consumption of building heating and cooling and improve the power generation efficiency of photovoltaic systems. The proportion of low-rise buildings can be expressed by controlling the building height and number of floors. Low-rise buildings usually have a low height and a small number of floors. Reasonable adjustment of these parameters can help optimize the energy efficiency performance of blocks. The proper design of the plot width helps to optimize the natural ventilation and sunlight conditions, further reducing the building energy consumption and increasing the photovoltaic power generation potential. The plot width can be expressed by adjusting the Building Spacing and Street Width. A larger building spacing and a wider street usually means a larger plot width, which can effectively improve the microclimate conditions of the block. These findings provide scientific basis and practical guidance for the design of urban blocks and provide an important reference for the optimization of block form in future sustainable urban development.
- The proportion of low-rise buildings has a strong negative correlation with the energy efficiency performance of heating, cooling and photovoltaic systems (correlation coefficients are −0.970, −0.904, and −0.861, respectively). This shows that increasing the proportion of low-rise buildings can effectively reduce the energy consumption demand while improving the photovoltaic power generation efficiency. Rationally allocating the proportion of low-rise buildings in building design plays an important role in saving energy and improving the utilization of renewable energy.
- The plot width also has a significant impact on the total energy consumption. It is found that the area width of plot B is negatively correlated with the total energy consumption (correlation coefficient is −0.944), while the area width of plot A is negatively correlated (correlation coefficient is −0.912), but its influence is relatively small. This means that in urban planning, appropriately increasing the width of the land parcel can help reduce energy consumption and optimize the energy efficiency of the block.
- The performance of PV systems is significantly affected by the building design, especially the building layout and orientation. By properly laying out buildings to maximize sunlight exposure and reduce shadow occlusion, the power generation efficiency of photovoltaic systems can be significantly improved, thereby providing more renewable energy to the block.
4.6. Validation of Simulation Results
To ensure the robustness and credibility of the simulation results, this study references existing research and finds strong alignment between its conclusions and previous studies, further confirming the effectiveness of the proposed strategies.
The findings on the impact of low-rise building proportion on energy efficiency and photovoltaic (PV) utilization are consistent with those of Zafari Jurshari et al. (2024), who demonstrated that increasing the proportion of low-rise buildings in humid temperate climates optimizes solar exposure, reduces winter heating demand, and enhances PV efficiency [38]. Similarly, the conclusion that wider plot designs contribute to lower overall energy consumption aligns with the findings of Mendis et al. (2020), who observed that increasing building spacing improves natural ventilation, thereby reducing cooling loads in commercial buildings [12].
Additionally, the study’s insights into optimizing building layout and orientation for improved PV performance are supported by Pillai et al. (2022), who systematically reviewed the impact of urban morphology on Building Integrated Photovoltaic (BIPV) systems and emphasized the role of shading in energy output [2]. Furthermore, the integration of machine learning with physical simulations in this study introduces a novel data-driven approach to urban energy optimization, which aligns with the work of Gao et al. (2024), who employed regression models to enhance the accuracy of energy consumption predictions [33].
These validations confirm the reliability of the simulation results, ensuring that the findings provide a scientifically sound foundation for sustainable urban block design and energy optimization.
5. Guide Strategies and Programs
Based on the in-depth analysis of the impact of design parameters on heating, cooling energy consumption and photovoltaic power generation of 15 city blocks in Wuhan, combined with the application of parametric design, Latin hypercube sampling, Pearson correlation analysis, and machine learning regression models, the following design strategies with theoretical basis and practical guidance are obtained.
5.1. Appropriately Increase the Proportion of Low-Rise Buildings to Optimize Energy Efficiency and Photovoltaic Power Generation Performance
The study shows that an increase in the proportion of low-rise buildings has a significant impact on the heating and cooling energy consumption and the PV system performance. Specifically, low-rise buildings have smaller heat loss rate and better ventilation performance. Increasing the proportion of low-rise buildings can effectively reduce the energy consumption of building heating and cooling and improve the efficiency of photovoltaic power generation. This result is supported by related studies, especially under extreme climate conditions, low-rise buildings are better able to adapt to ambient temperature changes, thereby reducing the demand for air conditioning and heating [1]. While reducing building energy consumption, low-rise buildings are also able to provide more space and sunlight for PV systems, thereby improving the power generation efficiency of the system. Appropriately increasing the proportion of low-rise buildings in block design, especially in cold or hot areas, can help to save energy and reduce emissions, and improve the self-sufficiency of building energy systems.
5.2. Optimize the Plot Width and Improve Natural Ventilation and Sunshine Conditions
It is found that the plot width has an important impact on the energy efficiency of the block, and appropriately expanding the plot width can improve the natural ventilation and sunlight effect of the building, thereby reducing the energy consumption of air conditioning and heating. This conclusion is consistent with urban density theory and urban microclimate theory. When the urban density is high, the space between buildings is small, and the ventilation and sunlight conditions are poor, which leads to the aggravation of the heat island effect and increase the energy consumption of buildings. Appropriately increasing the plot width can not only optimize natural ventilation and daylighting by increasing building gaps, but also reduce shadow occlusion between building groups, thereby reducing the efficiency loss of photovoltaic systems [39,40]. It is also found that reasonable plot width design can help reduce total energy consumption, especially in high-density urban environments, and effective utilization of building clearance through layout optimization can help improve environmental comfort and improve overall building energy efficiency.
5.3. Optimization of Building Layout and Orientation to Improve Photovoltaic Power Generation Efficiency
The optimization of building layout and orientation is the key to improve the efficiency of photovoltaic power generation [41,42]. The results show that the orientation and arrangement of buildings directly affect their energy efficiency performance, especially the output of photovoltaic power generation systems. The south orientation of the building maximizes the reception of sunlight, reduces the winter heating load, and increases the power generation of the photovoltaic system. Based on this theory, many architectural design researchers have proposed the necessity of building orientation optimization. For example, Anand S. Joshi et al. pointed out in their research that by optimizing the orientation of building groups, the efficiency of photovoltaic systems can be greatly improved, and the consumption of other energy sources can be reduced [43]. In addition, a reasonable building arrangement is able to reduce shadow occlusion and maximize the sunlight receiving area of the PV panel. Through simulations and practical applications, building orientation optimization and layout adjustment have been proven to be effective means to improve the efficiency of PV systems and reduce building energy consumption [44]. The orientation optimization and spatial layout adjustment of buildings in the design phase should focus on how to reduce the shadow occlusion between buildings and ensure the rationality of the building orientation to maximize the energy capture ability of the photovoltaic system.
6. Limitations of the Study
Although this study provides valuable insights into optimizing urban block energy efficiency and photovoltaic (PV) utilization, it has several limitations. The simulation-based approach does not fully account for real-world variations such as material aging, equipment degradation, user behavior, and long-term climate fluctuations. Future research should incorporate real-world energy monitoring data to validate and refine the proposed models.
Additionally, this study focuses on a single climate type—Wuhan’s “hot summer, cold winter” climate. Future studies should explore different climatic regions to ensure the adaptability of the findings across diverse environmental conditions. Furthermore, the research primarily examines residential blocks, while commercial and mixed-use developments may exhibit different energy consumption patterns and optimization needs, requiring further investigation.
To enhance the optimization framework, future research can integrate advanced multi-objective optimization methods, such as Genetic Algorithms (GA) and Particle Swarm Optimization (PSO), to explore optimal trade-offs between energy efficiency, PV utilization, and urban morphology. By combining real-world validation, broader climatic analysis, and improved optimization techniques, future studies can further refine and generalize sustainable urban design strategies.
7. Conclusions
This study integrated parametric design tools (Grasshopper), Latin Hypercube Sampling (LHS), Pearson correlation analysis, and machine learning regression models to investigate the impact of design parameters on heating and cooling energy consumption as well as photovoltaic (PV) power generation in 15 urban blocks in Wuhan. By systematically analyzing key design factors such as block building layout, orientation, low-rise building proportion, and plot width, this research quantifies the complex interactions between urban morphology and energy performance, offering a scientific basis for optimizing urban block energy efficiency and promoting sustainable development.
- Influence of low-rise building proportion on energy efficiency and PV utilizationThe proportion of low-rise buildings exhibits a strong negative correlation with heating energy consumption (r = −0.970) and cooling energy consumption (r = −0.904), while significantly enhancing PV generation efficiency (r = −0.861). Increasing the proportion of low-rise buildings reduces heat loss, improves natural ventilation, and enhances solar exposure, leading to lower energy demand and higher renewable energy utilization.
- Effect of plot width on total energy consumptionThe study reveals that plot width plays a critical role in optimizing energy efficiency. A wider plot design is associated with lower overall energy consumption, as evidenced by the strong negative correlation between plot B width and total energy consumption (r = −0.944), and plot A width shows a similar trend (r = −0.912). Expanding plot width enhances natural ventilation and sunlight penetration, thereby reducing both heating and cooling loads.
- Building layout and orientation optimization for PV performanceProperly optimizing building orientation and layout minimizes shading effects and maximizes PV generation efficiency. The study highlights that south-facing orientations and uniform building heights significantly enhance solar energy capture, supporting more effective PV utilization.
- Innovative data-driven approach for urban-scale energy optimizationBy integrating deep learning techniques with physical simulations, this study introduces a novel framework that surpasses conventional single-building optimizations. The LightGBM model effectively captures nonlinear relationships between urban design parameters and energy performance, improving the predictive accuracy of energy consumption and PV potential at the block scale.
Author Contributions
Conceptualization, R.W. and Y.H.; methodology, R.W. and Y.H.; software, G.Z.; formal analysis, G.Z.; investigation, R.W.; data collection, Y.Y. and Q.D.; software programming, Y.Y. and Q.D.; writing—original draft preparation, R.W., Y.H. and G.Z.; writing—review and editing, R.W. and Y.H. All authors have read and agreed to the published version of the manuscript.
Funding
This research was supported by the Xiangyang Hubei University of Technology Industrial Research Institute, under the project titled “Intelligent Design and Renovation of Industrial Buildings” (Project No.: XYYJ2023A07, Category A). In addition, our research was also supported by the 2024 College Student Innovation and Entrepreneurship Training Program, under the project titled “Research on the Application of Building Information Modeling Technology in Hubei Province”, funded by Hubei University of Technology (Project No.: S202410500062).
Data Availability Statement
The data presented in this study are available within this article.
Conflicts of Interest
The authors declare no conflicts of interest.
Nomenclature
| Nomenlature | Description |
| RMSE (Root Mean Squared Error) | A statistical measure of prediction accuracy, calculated as the square root of the mean squared differences. |
| MSE (Mean Squared Error) | The mean of the squared differences between actual and predicted values. |
| MAE (Mean Absolute Error) | The average of absolute differences between actual and predicted values. |
| MAPE (Mean Absolute Percentage Error) | A metric expressing prediction errors as a percentage of actual values. |
| NSGA-II (Non-dominated Sorting Genetic Algorithm II) | A multi-objective optimization algorithm used for trade-off analysis. |
| LHS (Latin Hypercube Sampling) | A statistical sampling technique for efficient simulation experiments. |
| HVAC (Heating, Ventilation, and Air Conditioning) | Systems for regulating indoor climate conditions in buildings. |
| WWR (Window-to-Wall Ratio) | The percentage of a building’s exterior covered by windows, impacting energy efficiency. |
| GIS (Geographic Information System) | A framework for capturing and analyzing spatial and geographic data. |
| ESA (European Space Agency) | The agency operating Sentinel-2, which provides Earth observation data. |
| GBDT (Gradient Boosting Decision Tree) | A machine learning method that enhances prediction accuracy through iterative learning. |
| LightGBM (Light Gradient Boosting Machine) | An optimized gradient boosting algorithm used for large-scale data analysis. |
| DOE (Design of Experiments) | A structured statistical approach to optimize experimental design. |
| ASHRAE (American Society of Heating, Refrigerating and Air-Conditioning Engineers) | An organization setting global standards for building energy efficiency. |
| PV (Photovoltaic) | Solar technology that converts sunlight into electricity. |
| BIPV (Building-Integrated Photovoltaics) | PV systems integrated into building components such as facades and roofs. |
Due to the complexity of the program and the limitations in image clarity, we are unable to display the full parametric battery pack diagram directly in the manuscript. For readers who wish to access the full version of the diagram or request additional information, please refer to the contact information of the corresponding author in the manuscript to get in touch with us directly.
References
- Hong, T.; Malik, J.; Krelling, A.; O’Brien, W.; Sun, K.; Lamberts, R.; Wei, M. Ten Questions Concerning Thermal Resilience of Buildings and Occupants for Climate Adaptation. Build. Environ. 2023, 244, 110806. [Google Scholar] [CrossRef]
- Zafari Jurshari, M.; Yousefi Tazakor, M.; Yeganeh, M. Optimizing the Dimensional Ratio and Orientation of Residential Buildings in the Humid Temperate Climate to Reduce Energy Consumption (Case: Rasht Iran). Case Stud. Therm. Eng. 2024, 59, 104484. [Google Scholar] [CrossRef]
- Karkon, E.; Liravi, M.; Georges, L.; Li, J.; Novakovic, V. Design of a Hybrid Solar and Biomass-Based Energy System Integrated with near-Zero Energy Building: Techno-Environment Investigation and Multicriteria Optimization. Process Saf. Environ. Prot. 2025, 193, 26–42. [Google Scholar] [CrossRef]
- Alimohamadi, R.; Jahangir, M.H. Multi-Objective Optimization of Energy Consumption Pattern in Order to Provide Thermal Comfort and Reduce Costs in a Residential Building. Energy Convers. Manag. 2024, 305, 118214. [Google Scholar] [CrossRef]
- Lu, M.; Sun, Y.; Ma, Z. Multi-Objective Design Optimization of Multiple Energy Systems in Net/Nearly Zero Energy Buildings under Uncertainty Correlations. Appl. Energy 2024, 370, 123620. [Google Scholar] [CrossRef]
- Assareh, E.; Dia Eldin Nadhim Alahmedi, M.; Agarwal, N.; Lee, M. Zero Energy Building Optimization for a Residential Complex with a New Optimized Cogeneration System for Electricity, Cooling, Heating and Freshwater Production. Appl. Therm. Eng. 2024, 244, 122527. [Google Scholar] [CrossRef]
- Huo, H.; Deng, X.; Wei, Y.; Liu, Z.; Liu, M.; Tang, L. Optimization of Energy-Saving Renovation Technology for Existing Buildings in a Hot Summer and Cold Winter Area. J. Build. Eng. 2024, 86, 108597. [Google Scholar] [CrossRef]
- Pillai, D.S.; Shabunko, V.; Krishna, A. A Comprehensive Review on Building Integrated Photovoltaic Systems: Emphasis to Technological Advancements, Outdoor Testing, and Predictive Maintenance. Renew. Sustain. Energy Rev. 2022, 156, 111946. [Google Scholar] [CrossRef]
- Naji Alhasnawi, B.; Jasim, B.H.; Naji Alhasnawi, A.; Hussain, F.F.K.; Homod, R.Z.; Hasan, H.A.; Ibrahim Khalaf, O.; Abbassi, R.; Bazooyar, B.; Zanker, M.; et al. A Novel Efficient Energy Optimization in Smart Urban Buildings Based on Optimal Demand Side Management. Energy Strategy Rev. 2024, 54, 101461. [Google Scholar] [CrossRef]
- Guo, F.; woo Ham, S.; Kim, D.; Moon, H.J. Deep Reinforcement Learning Control for Co-Optimizing Energy Consumption, Thermal Comfort, and Indoor Air Quality in an Office Building. Appl. Energy 2025, 377, 124467. [Google Scholar] [CrossRef]
- Liu, W.; Wang, J.; Wang, Y. Building Solar Integrated Energy Systems Considering Power and Heat Coordination: Optimization and Evaluation. Sol. Energy 2024, 279, 112821. [Google Scholar] [CrossRef]
- Mendis, T.; Huang, Z.; Xu, S.; Zhang, W. Economic Potential Analysis of Photovoltaic Integrated Shading Strategies on Commercial Building Facades in Urban Blocks: A Case Study of Colombo, Sri Lanka. Energy 2020, 194, 116908. [Google Scholar] [CrossRef]
- Wang, J.; Liu, W.; Sha, C.; Zhang, W.; Liu, Z.; Wang, Z.; Wang, R.; Du, X. Evaluation of the Impact of Urban Morphology on Commercial Building Carbon Emissions at the Block Scale—A Study of Commercial Buildings in Beijing. J. Clean. Prod. 2023, 408, 137191. [Google Scholar] [CrossRef]
- Lawal, K.; Rafsanjani, H.N. Trends, Benefits, Risks, and Challenges of IoT Implementation in Residential and Commercial Buildings. Energy Built Environ. 2022, 3, 251–266. [Google Scholar] [CrossRef]
- Zhang, W.; Shi, Y.; Yang, H.; Zou, Y.; Cao, X.; Cui, H. Design Optimization of Passive PCM-Enhanced Hospital Buildings for Efficient Energy-Saving. J. Energy Storage 2024, 91, 112037. [Google Scholar] [CrossRef]
- Hua, Z.; Zhang, L.; Zhang, S.; Yang, S.; Liu, C. Multi-Objective Coordinated Optimization of Low-Carbon Building Energy Systems Based on High Renewable Energy Penetration. J. Build. Eng. 2024, 96, 110577. [Google Scholar] [CrossRef]
- Chen, W.; He, Y.; Li, N.; Wang, Z.; Peng, J.; Xiang, X. A Smart Platform (BEVPro) for Modeling, Evaluating, and Optimizing Community Microgrid Integrated with Buildings, Distributed Renewable Energy, Electricity Storage, and Electric Vehicles. J. Build. Eng. 2024, 87, 109077. [Google Scholar] [CrossRef]
- Jing, T.; Zhao, Y. Optimizing Energy Consumption in Smart Buildings: A Model for Efficient Energy Management and Renewable Integration. Energy Build. 2024, 323, 114754. [Google Scholar] [CrossRef]
- Wu, C.; Pan, H.; Luo, Z.; Liu, C.; Huang, H. Multi-Objective Optimization of Residential Building Energy Consumption, Daylighting, and Thermal Comfort Based on BO-XGBoost-NSGA-II. Build. Environ. 2024, 254, 111386. [Google Scholar] [CrossRef]
- Chen, W.-H.; You, F. Sustainable Energy Management and Control for Decarbonization of Complex Multi-Zone Buildings with Renewable Solar and Geothermal Energies Using Machine Learning, Robust Optimization, and Predictive Control. Appl. Energy 2024, 372, 123802. [Google Scholar] [CrossRef]
- Chen, L.; Zhang, L.; Wu, Y.; Xu, G.; Li, B. Isogeometric Size Optimization Design Based on Parameterized Volume Parametric Models. Comput.-Aided Des. 2024, 169, 103672. [Google Scholar] [CrossRef]
- Deng, W.; Ke, W.; Deng, Z.; Wang, X. Virtual Design of Woven Fabrics Based on Parametric Modeling and Physically Based Rendering. Comput.-Aided Des. 2024, 173, 103717. [Google Scholar] [CrossRef]
- Chen, J.; Shao, Z.; Zhu, H.; Chen, Y.; Li, Y.; Zeng, Z.; Yang, Y.; Wu, J.; Hu, B. Sustainable Interior Design: A New Approach to Intelligent Design and Automated Manufacturing Based on Grasshopper. Comput. Ind. Eng. 2023, 183, 109509. [Google Scholar] [CrossRef]
- de Sousa Freitas, J.; Cronemberger, J.; Soares, R.M.; Amorim, C.N.D. Modeling and Assessing BIPV Envelopes Using Parametric Rhinoceros Plugins Grasshopper and Ladybug. Renew. Energy 2020, 160, 1468–1479. [Google Scholar] [CrossRef]
- Di Bari, R.; Turrin, F.; Leis, H.; Isaia, F.; Belleri, A. Effectiveness and Sustainability of Solutions Sets Aimed at plus Energy Buildings. A Multi-Case and Multi-Domain Investigation. J. Build. Eng. 2024, 94, 109914. [Google Scholar] [CrossRef]
- Manni, M.; Bonamente, E.; Lobaccaro, G.; Goia, F.; Nicolini, A.; Bozonnet, E.; Rossi, F. Development and Validation of a Monte Carlo-Based Numerical Model for Solar Analyses in Urban Canyon Configurations. Build. Environ. 2020, 170, 106638. [Google Scholar] [CrossRef]
- Li, L.; Mirzabeigi, S.; Soltanian-Zadeh, S.; Dong, B.; Krietemeyer, B.; Gao, P.; Wilson, N.; Zhang, J. A High-Performance Multi-Scale Modular-Based Green Design Studio Platform for Building and Urban Environmental Quality and Energy Simulations. Sustain. Cities Soc. 2025, 119, 106078. [Google Scholar] [CrossRef]
- Zhaoyi, X.; ChuanJun, L. Optimization Design of Low-Carbon Building Thermal Energy Based on Optical Sensing and Virtual Reality Image Scene Reconstruction. Therm. Sci. Eng. Prog. 2024, 54, 102832. [Google Scholar] [CrossRef]
- Shadram, F.; Mukkavaara, J. Investigating the Potential for Realizing Life Cycle Net-Zero Energy Buildings in Europe Using Multi-Objective Optimization. Energy Rep. 2024, 12, 5648–5670. [Google Scholar] [CrossRef]
- Image Encoding Selection Based on Pearson Correlation Coefficient for Time Series Anomaly Detection—ScienceDirect. Available online: https://www.sciencedirect.com/science/article/pii/S1110016823008657?via%3Dihub (accessed on 1 March 2025).
- Teng, T.-P.; Chen, W.-J. Using Pearson Correlation Coefficient as a Performance Indicator in the Compensation Algorithm of Asynchronous Temperature-Humidity Sensor Pair. Case Stud. Therm. Eng. 2024, 53, 103924. [Google Scholar] [CrossRef]
- Puth, M.-T.; Neuhäuser, M.; Ruxton, G.D. Effective Use of Pearson’s Product–Moment Correlation Coefficient. Anim. Behav. 2014, 93, 183–189. [Google Scholar] [CrossRef]
- Gao, T.; Han, X.; Wang, J.; Geng, Y.; Zhang, H.; Song, T. Enhancing Building Energy Efficiency: An Integrated Approach to Predicting Heating and Cooling Loads Using Machine Learning and Optimization Algorithms. J. Build. Eng. 2024, 98, 110759. [Google Scholar] [CrossRef]
- Zhang, Y.; Teoh, B.K.; Zhang, L. Multi-Objective Optimization for Energy-Efficient Building Design Considering Urban Heat Island Effects. Appl. Energy 2024, 376, 124117. [Google Scholar] [CrossRef]
- Chen, H.; Cheng, Y.; Du, T.; Wu, X.; Cao, Y.; Liu, Y. Enhancing the Performance of Recycled Aggregate Green Concrete via a Bayesian Optimization Light Gradient Boosting Machine and the Nondominated Sorting Genetic Algorithm-III. Constr. Build. Mater. 2025, 458, 139527. [Google Scholar] [CrossRef]
- Emmela, S.; Rama Lahari, V.; Anusha, B.; Bhavana, D.; Yasyukevich, Y.V.; Demyanov, V.V.; Venkata Ratnam, D. Global Ionospheric Total Electron Content Short-Term Forecast Based on Light Gradient Boosting Machine, Extreme Gradient Boosting, and Gradient Boost Regression. Adv. Space Res. 2024, 74, 3642–3653. [Google Scholar] [CrossRef]
- Thongthammachart, T.; Araki, S.; Shimadera, H.; Matsuo, T.; Kondo, A. Incorporating Light GradIent Boosting Machine to Land Use Regression Model for Estimating NO2 and PM2.5 Levels in Kansai Region, Japan. Environ. Model. Softw. 2022, 155, 105447. [Google Scholar] [CrossRef]
- Zou, Y.; Zhan, Q.; Xiang, K. A Comprehensive Method for Optimizing the Design of a Regular Architectural Space to Improve Building Performance. Energy Rep. 2021, 7, 981–996. [Google Scholar] [CrossRef]
- Xie, X.; Luo, Z.; Grimmond, S.; Sun, T. Impact of Building Density on Natural Ventilation Potential and Cooling Energy Saving across Chinese Climate Zones. Build. Environ. 2023, 244, 110621. [Google Scholar] [CrossRef]
- Santamouris, M. Cooling the Cities—A Review of Reflective and Green Roof Mitigation Technologies to Fight Heat Island and Improve Comfort in Urban Environments. Sol. Energy 2014, 103, 682–703. [Google Scholar] [CrossRef]
- Ahmadian, E.; Sodagar, B.; Bingham, C.; Elnokaly, A.; Mills, G. Effect of Urban Built Form and Density on Building Energy Performance in Temperate Climates. Energy Build. 2021, 236, 110762. [Google Scholar] [CrossRef]
- Liu, K.; Xu, X.; Huang, W.; Zhang, R.; Kong, L.; Wang, X. A Multi-Objective Optimization Framework for Designing Urban Block Forms Considering Daylight, Energy Consumption, and Photovoltaic Energy Potential. Build. Environ. 2023, 242, 110585. [Google Scholar] [CrossRef]
- Joshi, A.S.; Dincer, I.; Reddy, B.V. Performance Analysis of Photovoltaic Systems: A Review. Renew. Sustain. Energy Rev. 2009, 13, 1884–1897. [Google Scholar] [CrossRef]
- Liu, R.; Liu, Z.; Xiong, W.; Zhang, L.; Zhao, C.; Yin, Y. Performance Simulation and Optimization of Building Façade Photovoltaic Systems under Different Urban Building Layouts. Energy 2024, 288, 129708. [Google Scholar] [CrossRef]


Disclaimer/Publisher’s Note: The statements, opinions and data contained in all publications are solely those of the individual author(s) and contributor(s) and not of MDPI and/or the editor(s). MDPI and/or the editor(s) disclaim responsibility for any injury to people or property resulting from any ideas, methods, instructions or products referred to in the content. |
© 2025 by the authors. Licensee MDPI, Basel, Switzerland. This article is an open access article distributed under the terms and conditions of the Creative Commons Attribution (CC BY) license (https://creativecommons.org/licenses/by/4.0/).