Article

Static Load Test and Finite Element Analysis of Phosphogypsum Concrete Composite Slabs

School of Civil Engineering, Jilin Jianzhu University, Changchun 130118, China
*
Author to whom correspondence should be addressed.
Buildings 2025, 15(7), 1122; https://doi.org/10.3390/buildings15071122
Submission received: 7 March 2025 / Revised: 27 March 2025 / Accepted: 28 March 2025 / Published: 29 March 2025
(This article belongs to the Section Building Structures)

Abstract

:
This study investigates the influence of phosphogypsum (PG) content on the mechanical properties of concrete composite slabs reinforced with steel trusses. Static load tests were conducted on five one-way composite slabs with varying PG contents (0%, 2%, and 4%), and finite element analysis (FEA) was employed to simulate and analyze the structural behavior. The effects of PG content on crack distribution, ultimate failure mode, cracking load, and stiffness prior to ultimate load were systematically evaluated. The results demonstrated that the FEA simulations closely matched the experimental data, accurately capturing the failure mechanisms of the PG-based composite slabs. The optimal PG content was determined to be 2%, as the composite slab with 2% PG exhibited comparable strength to the conventional concrete slab (0% PG) while maintaining superior structural integrity during failure. These findings highlight the potential of PG as a sustainable additive in concrete composite slabs, offering a viable solution for reducing environmental waste and enhancing structural performance. This study provides valuable insights into the development of eco-friendly building materials and contributes to the advancement of sustainable construction practices.

1. Introduction

Phosphogypsum (PG), a byproduct generated during the production of phosphoric acid, primarily consists of dihydrate calcium sulfate (CaSO4·2H2O), accounting for over 80% of its composition [1,2,3,4,5,6]. Each year, the global production of PG reaches approximately 300 million tons, with accumulated stockpiles exceeding 5.6 billion tons [7,8,9]. Despite its potential for reuse, only around 15% of PG is effectively utilized, while the remainder is either stored in landfills (58%), discharged into coastal waters (28%), or repurposed (14%) [10,11,12,13]. The large-scale stockpiling of PG not only occupies valuable land resources but also poses significant environmental hazards, including contamination of groundwater, degradation of soil quality, and atmospheric pollution [14,15]. Additionally, the direct disposal of PG into marine ecosystems can result in chemical pollution, eutrophication, and bioaccumulation, posing threats to aquatic life [16]. Given its extensive accumulation and low utilization rate, PG has a profound negative impact on the environment [17,18].
However, when subjected to harmless pretreatment methods such as calcination and lime mixing, PG demonstrates cementitious properties comparable to those of conventional cement. By partially replacing cement with pretreated PG in concrete production, it is possible to reduce cement consumption while simultaneously addressing the issue of PG stockpiling [19,20,21,22]. This approach not only promotes environmental sustainability but also aligns with the concept of converting waste into valuable resources, offering significant potential for the development of low-carbon and eco-friendly building materials [23,24].
Recent research has explored the utilization of PG in the development of green, high-performance cementitious materials. The primary component of PG, gypsum dihydrate (CaSO4·2H2O) [25,26,27,28,29,30], releases sulfate ions during hydration, which contribute to the formation of hydrates such as C-S-H gels [31]. This process effectively prolongs the setting time of the slurry [32]. Despite its advantages, including low cost, reduced carbon emissions, and environmental benefits [33,34], PG-based materials often exhibit limited activation properties and low early strength [35]. PG can also function as a cement retarder and serve as a raw material for the co-production of sulfuric acid and cement. Moreover, the substitution of natural aggregates with PG in concrete enhances its durability, meeting critical performance requirements such as resistance to freeze–thaw cycles and impermeability.
Composite slabs, which combine prefabricated panels with cast-in-place reinforced concrete layers, provide enhanced structural integrity and continuity, thereby improving the seismic performance of buildings. For example, Dhalape Parshuram et al. investigated the partial replacement of cement with fly ash and PG, assessing the compressive strength, flexural strength, and slump performance of the resulting concrete [36]. Similarly, Bandopadhyay Anamika et al. studied the combined effects of red mud and PG in stabilizing expansive soils [37]. Despite these advancements, research on PG-based concrete composite floor slabs remains limited, particularly in terms of their mechanical properties under static loads.
Originality of the Study: Previous studies on phosphogypsum (PG) have demonstrated its cementitious properties comparable to those of Portland cement, enabling partial replacement of cement in concrete production with documented enhancements in frost resistance and impermeability to some extent. However, research on PG-based composite concrete slabs remains scarce, particularly regarding systematic evaluation of their mechanical behavior under static loads (e.g., flexural and shear strength, interfacial bonding properties). Moreover, current research predominantly focuses on individual material components (e.g., PG as cement or aggregate replacement) while overlooking the holistic structural performance of PG-composite slabs (e.g., seismic resistance, durability. This study focuses on the mechanical properties of PG concrete composite slabs under static loading conditions, utilizing ABAQUS finite element software (2022) for simulation analysis. The selection of C35 concrete in this investigation is based on its widespread use in construction and its balanced strength characteristics, which provide a reliable baseline for evaluating the performance of PG-modified concrete. The findings aim to support the practical application of PG concrete composite slabs in engineering projects, findings aim to support the practical application of PG concrete composite slabs in engineering projects, contributing to the development of sustainable building materials and addressing the environmental challenges associated with PG stockpiling.

2. Experimental Overview

2.1. Experimental Design

In this experiment, a total of five unidirectional reinforced truss–phosphogypsum concrete composite slabs were produced. C35-grade concrete was used in all experiments. Under construction loads, the tensile stress in the bottom slab concrete does not exceed its standard tensile strength value. Therefore, the calculated thickness of the bottom slab is 40 mm. All five slabs had dimensions of 2200 mm (L) × 600 mm (b) × 120 mm (h), with a concrete cover thickness of 15 mm. Both the upper and lower chords were reinforced with HRB400-grade steel bars, while the material used for the web reinforcement is CPB550-grade plain round steel bars. The upper chord steel bars had a diameter of 10 mm, the web steel bars had a diameter of 4.5 mm, and the lower chord steel bars had a diameter of 10 mm. The designed height of the truss reinforcement was 90 mm, with a design width of 80 mm, and the spacing between nodes was 200 mm. The specimen preparation process is shown in Figure 1. Five composite slab specimens were prepared under monotonic loading conditions with varying phosphogypsum (PG) replacement ratios:
  • D1-1 (control): conventional concrete for both slabs;
  • D1-2: 2% PG concrete (top) paired with conventional concrete (bottom);
  • D1-3: conventional concrete (top) with 2% PG concrete (bottom);
  • D1-4: 2% PG concrete for both slabs;
  • D1-5: 4% PG concrete for both slabs.
The specific numbering and design parameters of each slab are provided in Table 1.
Table 1. Design parameters of each plate.
Serial NumberBoard TypePhosphogypsum Dosage/%Loading Method
D1-1Plain concrete slab0Monotonic loading
D1-2Phosphogypsum top plate
Bottom plate ordinary concrete
2Monotonic loading
D1-3Top plate ordinary concrete
Phosphogypsum base plate
2Monotonic loading
D1-4Phosphogypsum mixing for both bottom and top slabs2Monotonic loading
D1-5Phosphogypsum mixing for both bottom and top slabs4Monotonic loading
Figure 1. Schematic diagram of specimen preparation process.
Buildings 15 01122 g001

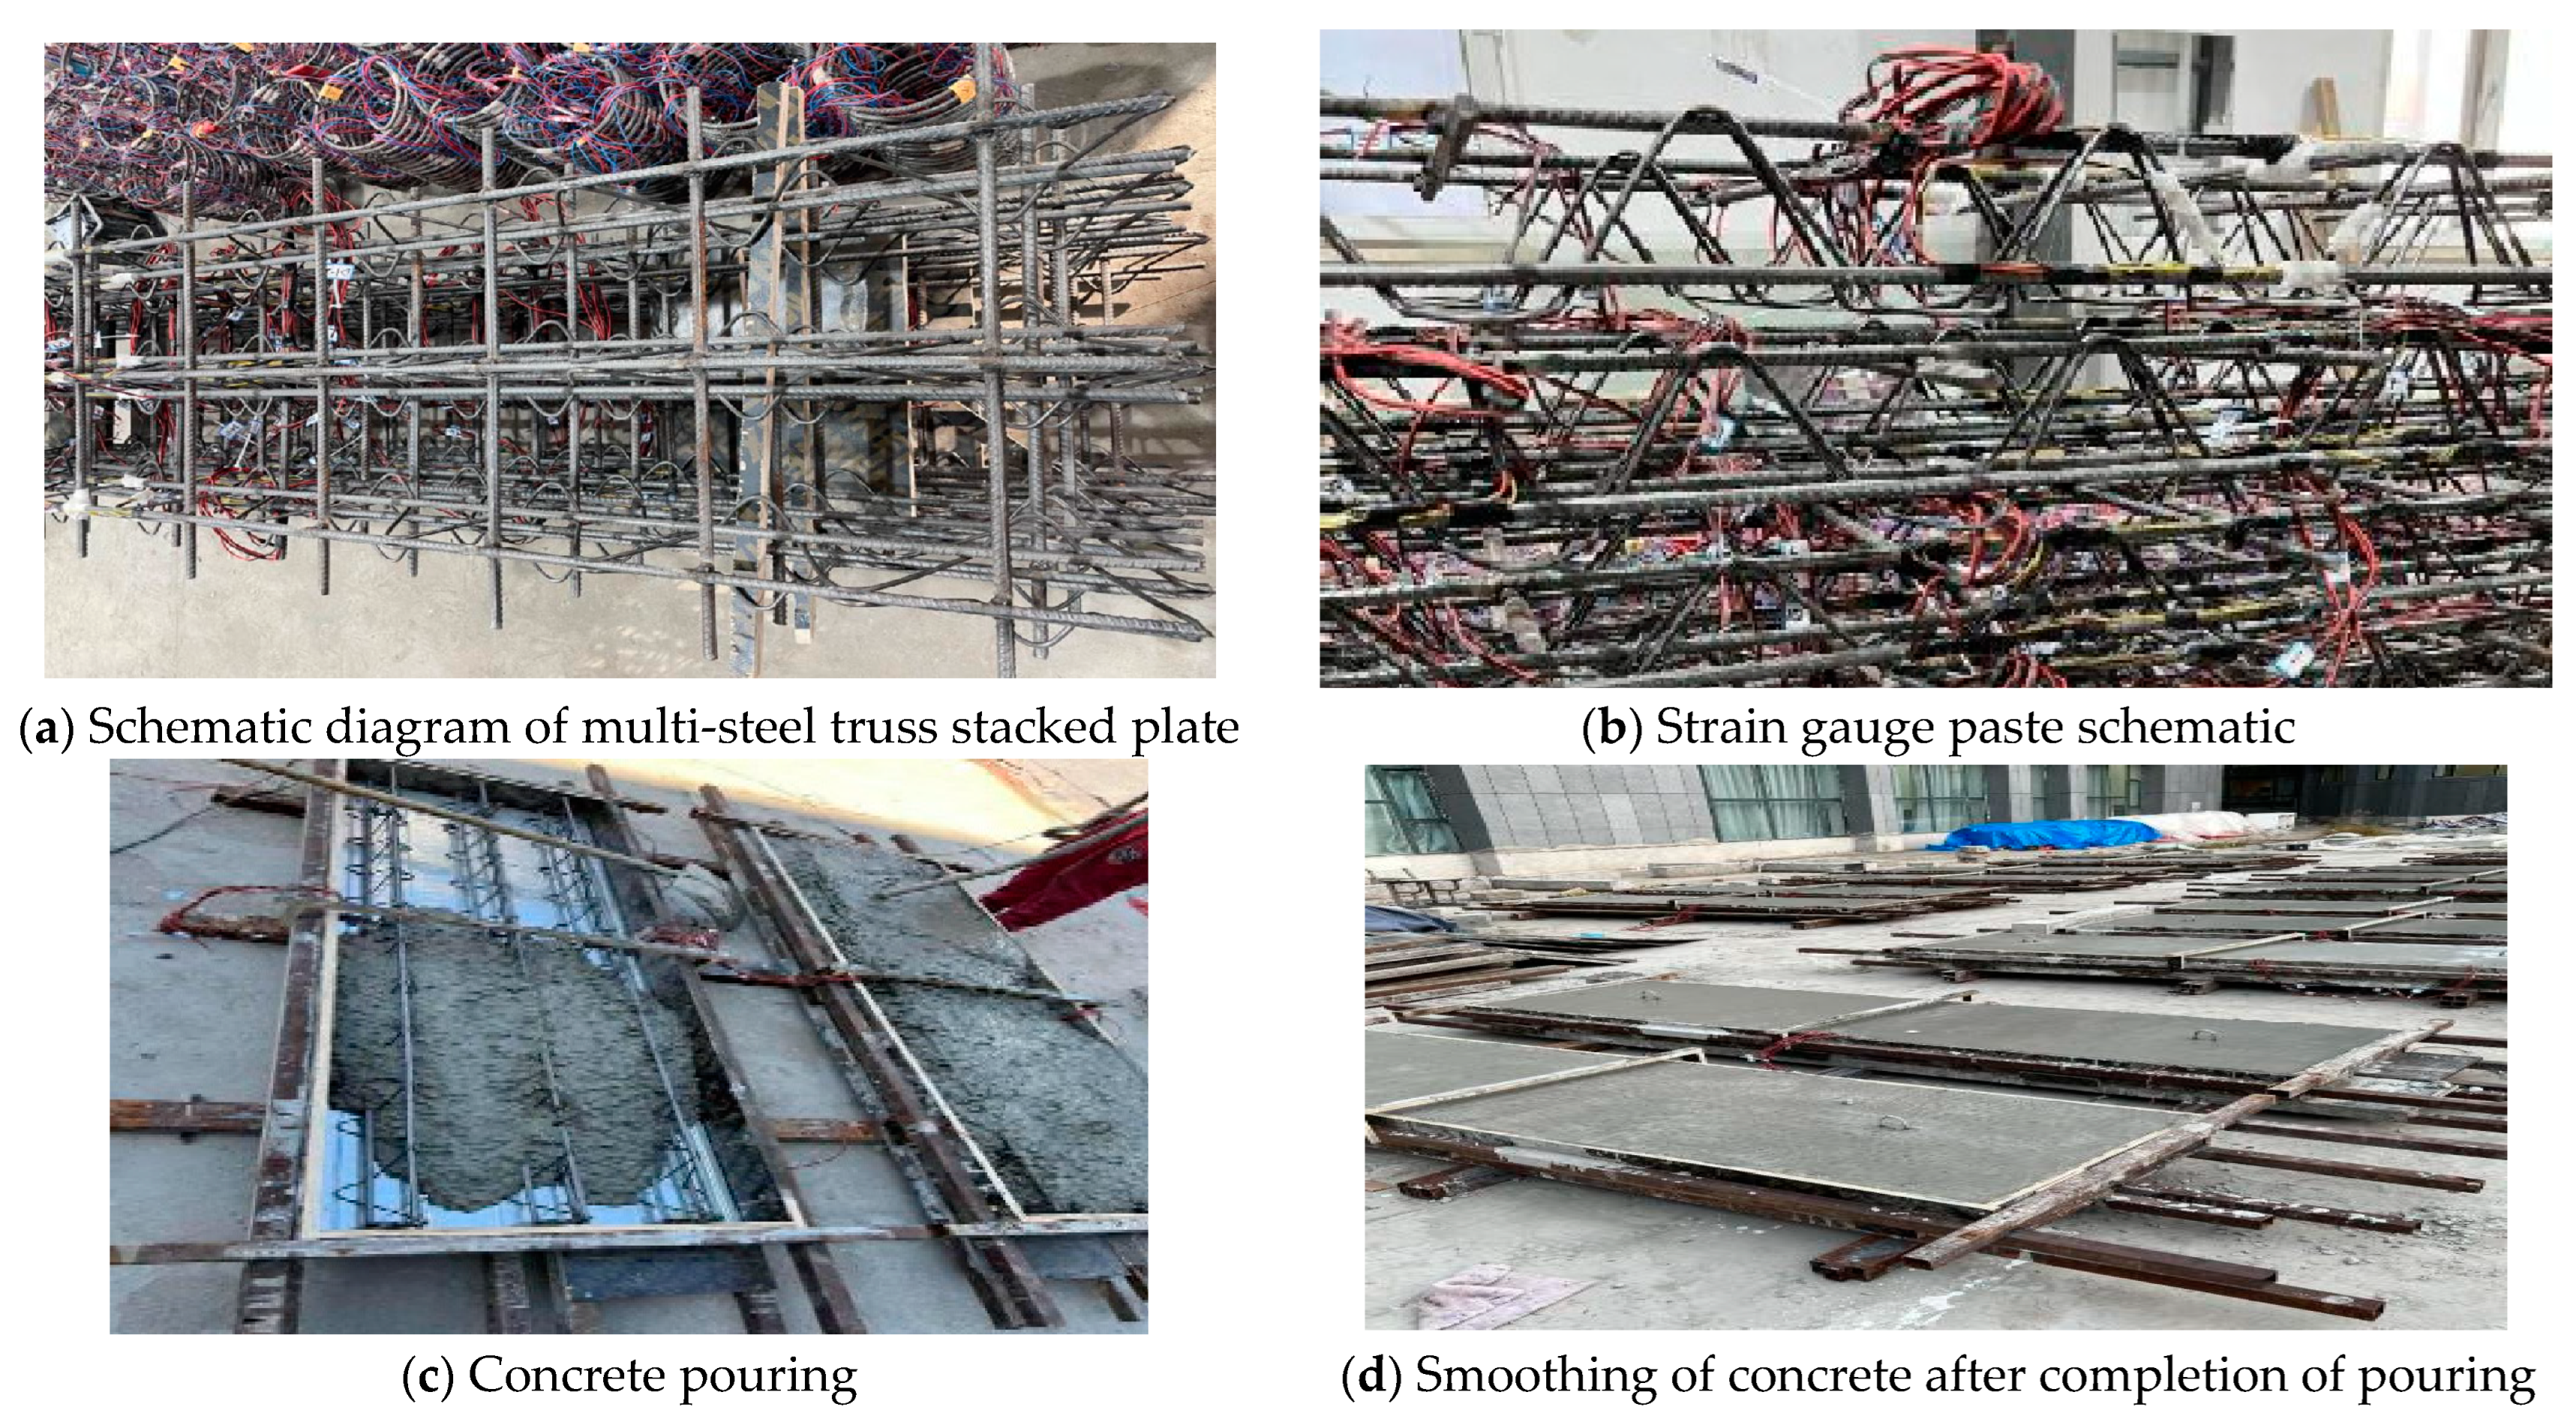
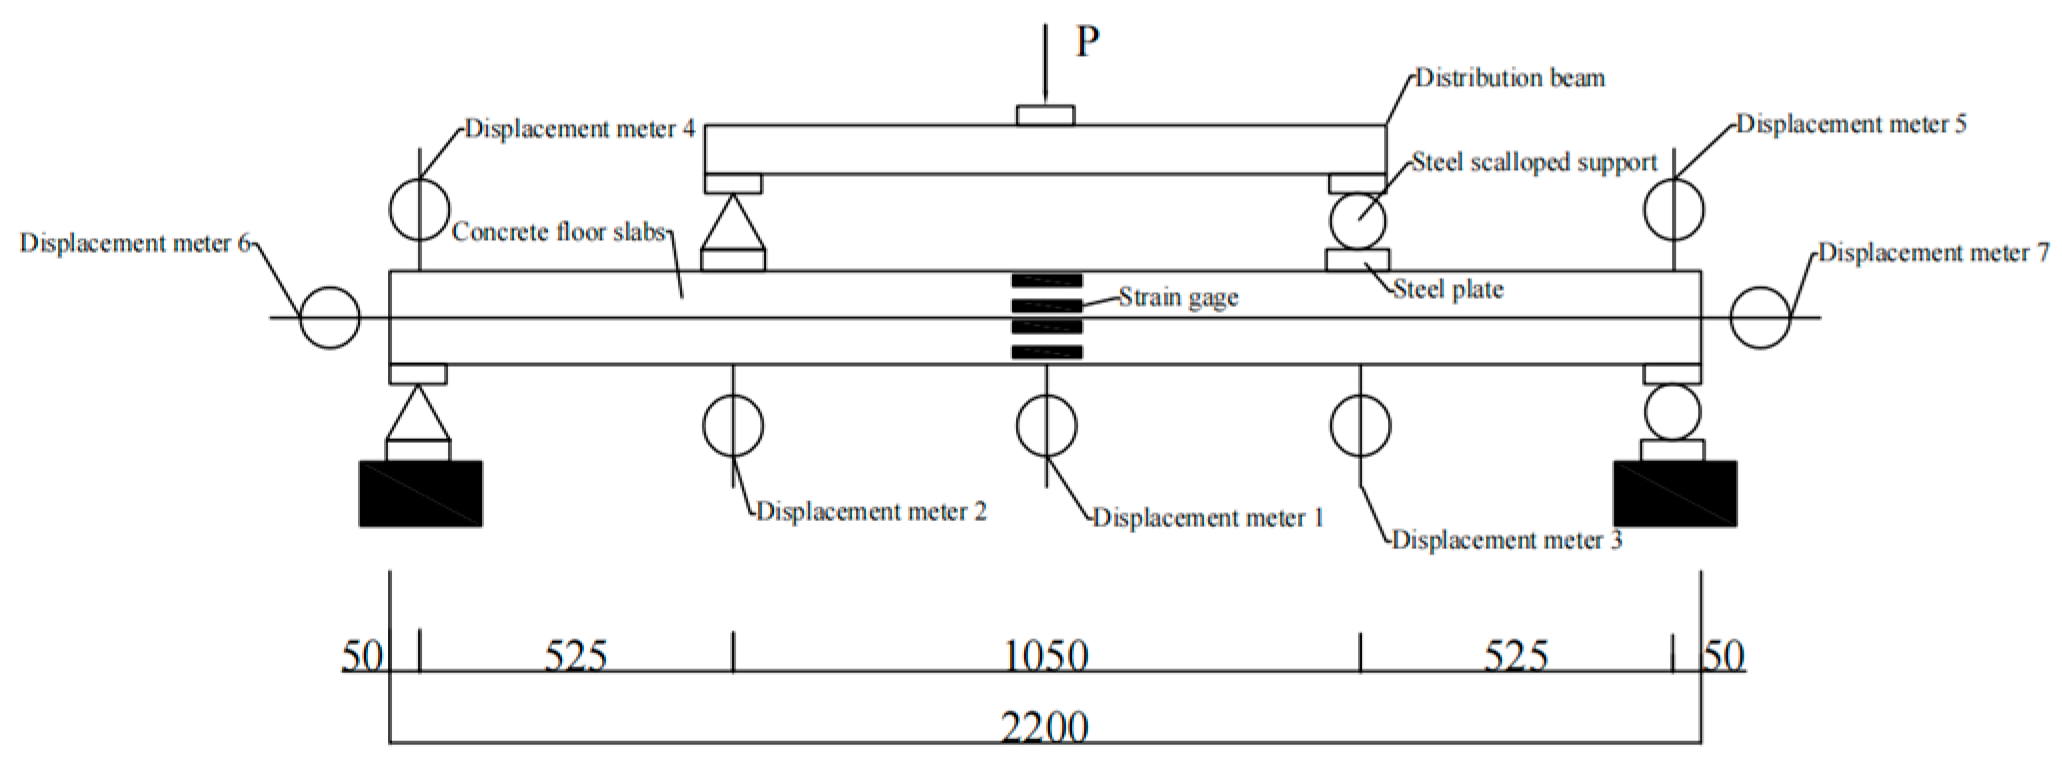
2.2. Measurement Point Arrangement

Based on the content and objectives of this experiment, the main measurements included the strain of the top chord reinforcement, bottom chord reinforcement, and web reinforcement; concrete strain; strain of the bottom galvanized steel plate; midspan deflection under controlled loading; the variation of load–deflection curves; and the development of cracks.
This test adopts a 500 kN multi-channel electro-hydraulic servo structural loading system. The specimen’s two ends were used: fixed hinge support and rolling hinge support. The shelving length is 100 mm, and the middle is not supported. The data to be measured in this experiment include the deflection of the specimens, the strain of concrete and steel reinforcement, along with the applied load values, crack locations, and crack widths. The strain gauges for the steel reinforcement were BX120-3AA models with a length of 3 mm, while those for the web reinforcement were BX120-1AA models with a length of 1 mm. The strain gauges for the concrete were BX120-80AA models with a length of 80 mm. A displacement gauge with a range of 100 mm was used for the test. The distribution of displacement gauges in the experimental loading setup is illustrated in Figure 2. A diagram of the test setup is shown in Figure 3.

2.3. Experimental Loading Scheme and Measurement Contents

The composite slab experiment was conducted using an upright loading test setup. The loading system used was a servo-controlled structural loading system with a thrust capacity of 500 kN. To accurately capture the cracking load for the five steel truss–concrete composite slabs tested in this experiment, after loading to 80% of the calculated cracking load, the increment of each loading step did not exceed 5% of the calculated load value. Before reaching the service load, the increment of each loading step should not exceed 20% of the service load, typically divided into five steps to reach the service load. Subsequently, the increment of each loading step should not exceed 10% of the service load, with a value of 5 kN. Therefore, force-controlled loading was applied with an increment of 5 kN per step before the steel reinforcement yielded. After the steel reinforcement yielded, the loading method was switched to displacement control, with an increment of 2 mm per step until the slab failed.
A hydraulic jack was used to apply vertical loads at the one-third points of the clear span of the slab. A concentrated load was applied by a hydraulic jack. The load was then distributed by a distribution beam to two points at two-thirds of the specimen’s length. The loading procedure followed an incremental loading method under controlled load. The experiment adopted a simply supported unidirectional slab scheme with four-point loading. The positions for concentrated loads were selected based on the principle of equal shear force at the supports for uniformly distributed and concentrated loads, as well as the principle of equal shear force diagram areas under both loading conditions. In this way, concentrated loads were used to simulate uniformly distributed loads, with the concentrated loads positioned at L/4 of the slab. A four-equal-point loading method was employed. Four-point loading was chosen over three-point loading or uniformly distributed loading, primarily to more accurately simulate the actual stress conditions of the composite slab. Four-point loading creates a pure bending segment between the two loading points, avoiding the influence of shear forces, thereby better reflecting the slab’s performance under bending moments. In contrast, three-point loading generates significant shear forces at the midspan, which can affect the accuracy of the test results. While uniformly distributed loading closely approximates real-world conditions, it is difficult to precisely control in experiments. And the load values obtained from the experiment were subsequently converted into the form of uniformly distributed loads using an equivalent bending moment approach. The experimental setup, as shown in Figure 3, used fixed hinged supports at one end and rolling hinged supports at the other end of the specimen, with both ends resting on a length of 100 mm without intermediate supports. Concrete blocks with similar mass were used to simulate uniformly distributed loading, and three different types of loading blocks were employed. The loading blocks were of three types: 1070 mm × 230 mm × 230 mm with an average mass of 122.1 kg; 1090 mm × 220 mm × 150 mm with an average mass of 87.14 kg; and 150 mm cubic blocks with an average mass of 8 kg. Due to the large size of the loading blocks, the component was divided into two stacked loading zones, with a spacing of 200 mm between the zones. Based on the varying heights of the loading surfaces, the prefabricated base slab was divided into three sections—left, center, and right—along the cross-section of the slab. During incremental loading, the mass of each load increment was distributed among the sections according to their proportional width.

2.4. Material Properties

Concrete material property tests were conducted in accordance with relevant standards [38]. For each casting batch, three groups of 150 mm × 150 mm × 150 mm cubic specimens were prepared, with three specimens in each group, to determine the cubic compressive strength of the concrete. During the tests, the concrete strength was measured before and after the testing of each batch of components. The cubic compressive strength and splitting tensile strength of the specimens were obtained using a compression testing machine, and the average values were taken as the measured concrete strength of the batch. Orthogonal mortar tests were conducted with varying contents of phosphogypsum, fly ash, and slag. The optimal mix proportion for phosphogypsum concrete was determined as follows: 10% fly ash, 20% slag, and 2% phosphogypsum. As shown in Table 2, the cubic compressive strength and splitting tensile strength of concrete with 2% phosphogypsum were comparable to those of ordinary concrete without phosphogypsum. The cubic compressive strength decreased by an average of 4.3%, and the splitting tensile strength decreased by an average of 3.1%. The compressive strength of concrete with 2% phosphogypsum reached 40.38 MPa. The phosphogypsum used in this experiment was sourced from the gypsum stockyard of Kingenta Group. The properties of phosphogypsum (PG) play a critical role in determining the performance of phosphogypsum-based concrete. However, the high sulfate content also raises concerns about potential durability issues, such as sulfate attack and delayed ettringite formation (DEF), which can compromise the long-term performance of the concrete. To mitigate these potential issues, according to the experimental methods specified in the test standards, the raw materials were first preprocessed. Phosphogypsum was mixed with cement for harmless treatment and then dried. This pretreatment aimed to reduce the sulfate content and neutralize acidic components, thereby minimizing the risk of sulfate attack and DEF. The chemical composition of PG, particularly its high sulfate content, can significantly influence the hydration process and mechanical properties of concrete. The phosphogypsum was grayish-white in color, with a measured moisture content of 15.22% and a pH of 3.09.
In the steel reinforcement material property tests, Grade 3 hot-rolled ribbed bars (HRB400) with a diameter of 10 mm were used for the top chord, bottom chord, and support reinforcement. Cold-rolled plain bars (CPB550) with a tensile strength greater than 550 MPa and a diameter of 5 mm were used for the web reinforcement. For each type of reinforcement, one group of specimens with a length of 450 mm was prepared, with five specimens in each group. One group of standard specimens with a length of 600 mm was prepared for the distribution reinforcement, with three specimens in total. The mechanical properties of each type of reinforcement are listed in Table 3.

3. Experimental Observations and Result Analysis

3.1. Experimental Observations

The crack distribution and ultimate failure modes of the five specimens are shown in Figure 4.

Analysis of Experimental Phenomena

(1) Due to the different tensile strengths of concrete with varying phosphogypsum contents, the cracking load observed in the slab tests varied. It was found that the cracking loads of reinforced concrete slabs with 0% and 2% phosphogypsum content were similar. However, the cracking load of the concrete slab with 4% phosphogypsum content was significantly lower.
(2) For all five slabs, cracks appeared between the two loading points (i.e., between the one-third points of the slab) as the load increased. Distinct cracking sounds were audible, and the maximum crack width was approximately 1 mm. The cracks at the midspan resulted in the failure of the strain gauges located at the bottom side of the slab.
(3) Over time, the side cracks propagated vertically from the bottom to the top, with most of the cracks exhibiting a Y-shaped pattern. At this stage, cracks at the bottom of the slab were highly visible. The cracks intersected with each other, and the maximum crack width exceeded 2 mm. All strain gauges on the sides of the slabs were damaged, and the reinforcement within the slabs experienced fractures, causing the overall failure of the slab structure.
(4) Compared to slab D1-1, slabs D1-2 to D1-5, which incorporated different amounts of phosphogypsum, exhibited delayed crack initiation and later strain gauge damage. For slabs D1-2 and D1-3, cracks and strain gauge damage only appeared in the later stages of loading.
(5) Finally, observations of the bottom cracks revealed that they mainly developed between the two loading points and propagated toward the opposite edge of the slab bottom. Even when the slab experienced considerable deformation, there were no signs of concrete spalling. The strong bond between the concrete and the reinforced truss throughout the loading process indicated that the slab maintained its overall integrity, demonstrating that the slab’s strength met the required standards.
It was observed that there is no significant difference in the failure modes between the ordinary concrete specimens and the reinforced truss unidirectional composite slabs with varying phosphogypsum content.

3.2. Comprehensive Result Analysis

Based on the experimental results, the cracking load of the composite slabs is shown in Table 4. Both the calculated cracking loads ( M c r , c ) and the measured values ( M c r , t ) in the table include the self-weight of the slabs.
(1)
According to the results presented in Table 2, none of the composite slabs cracked under the standard load combination during the construction stage. The calculated cracking loads were within an acceptable margin of error when compared to the measured values.
(2)
The actual cracking loads of slabs D1-2 and D1-4 were lower than those of the other slabs due to the presence of hollow sections beneath their flanges, which reduced their moment of resistance. This indicates that widening the flanges can significantly enhance the bottom slab’s cracking load capacity.
(3)
Overall, the measured cracking load values were 0.97 times the calculated values, indicating that the results are reasonably accurate. This demonstrates that it is feasible to design prefabricated base slabs that meet the non-cracking requirements during the construction stage.

4. Analysis of Experimental Results

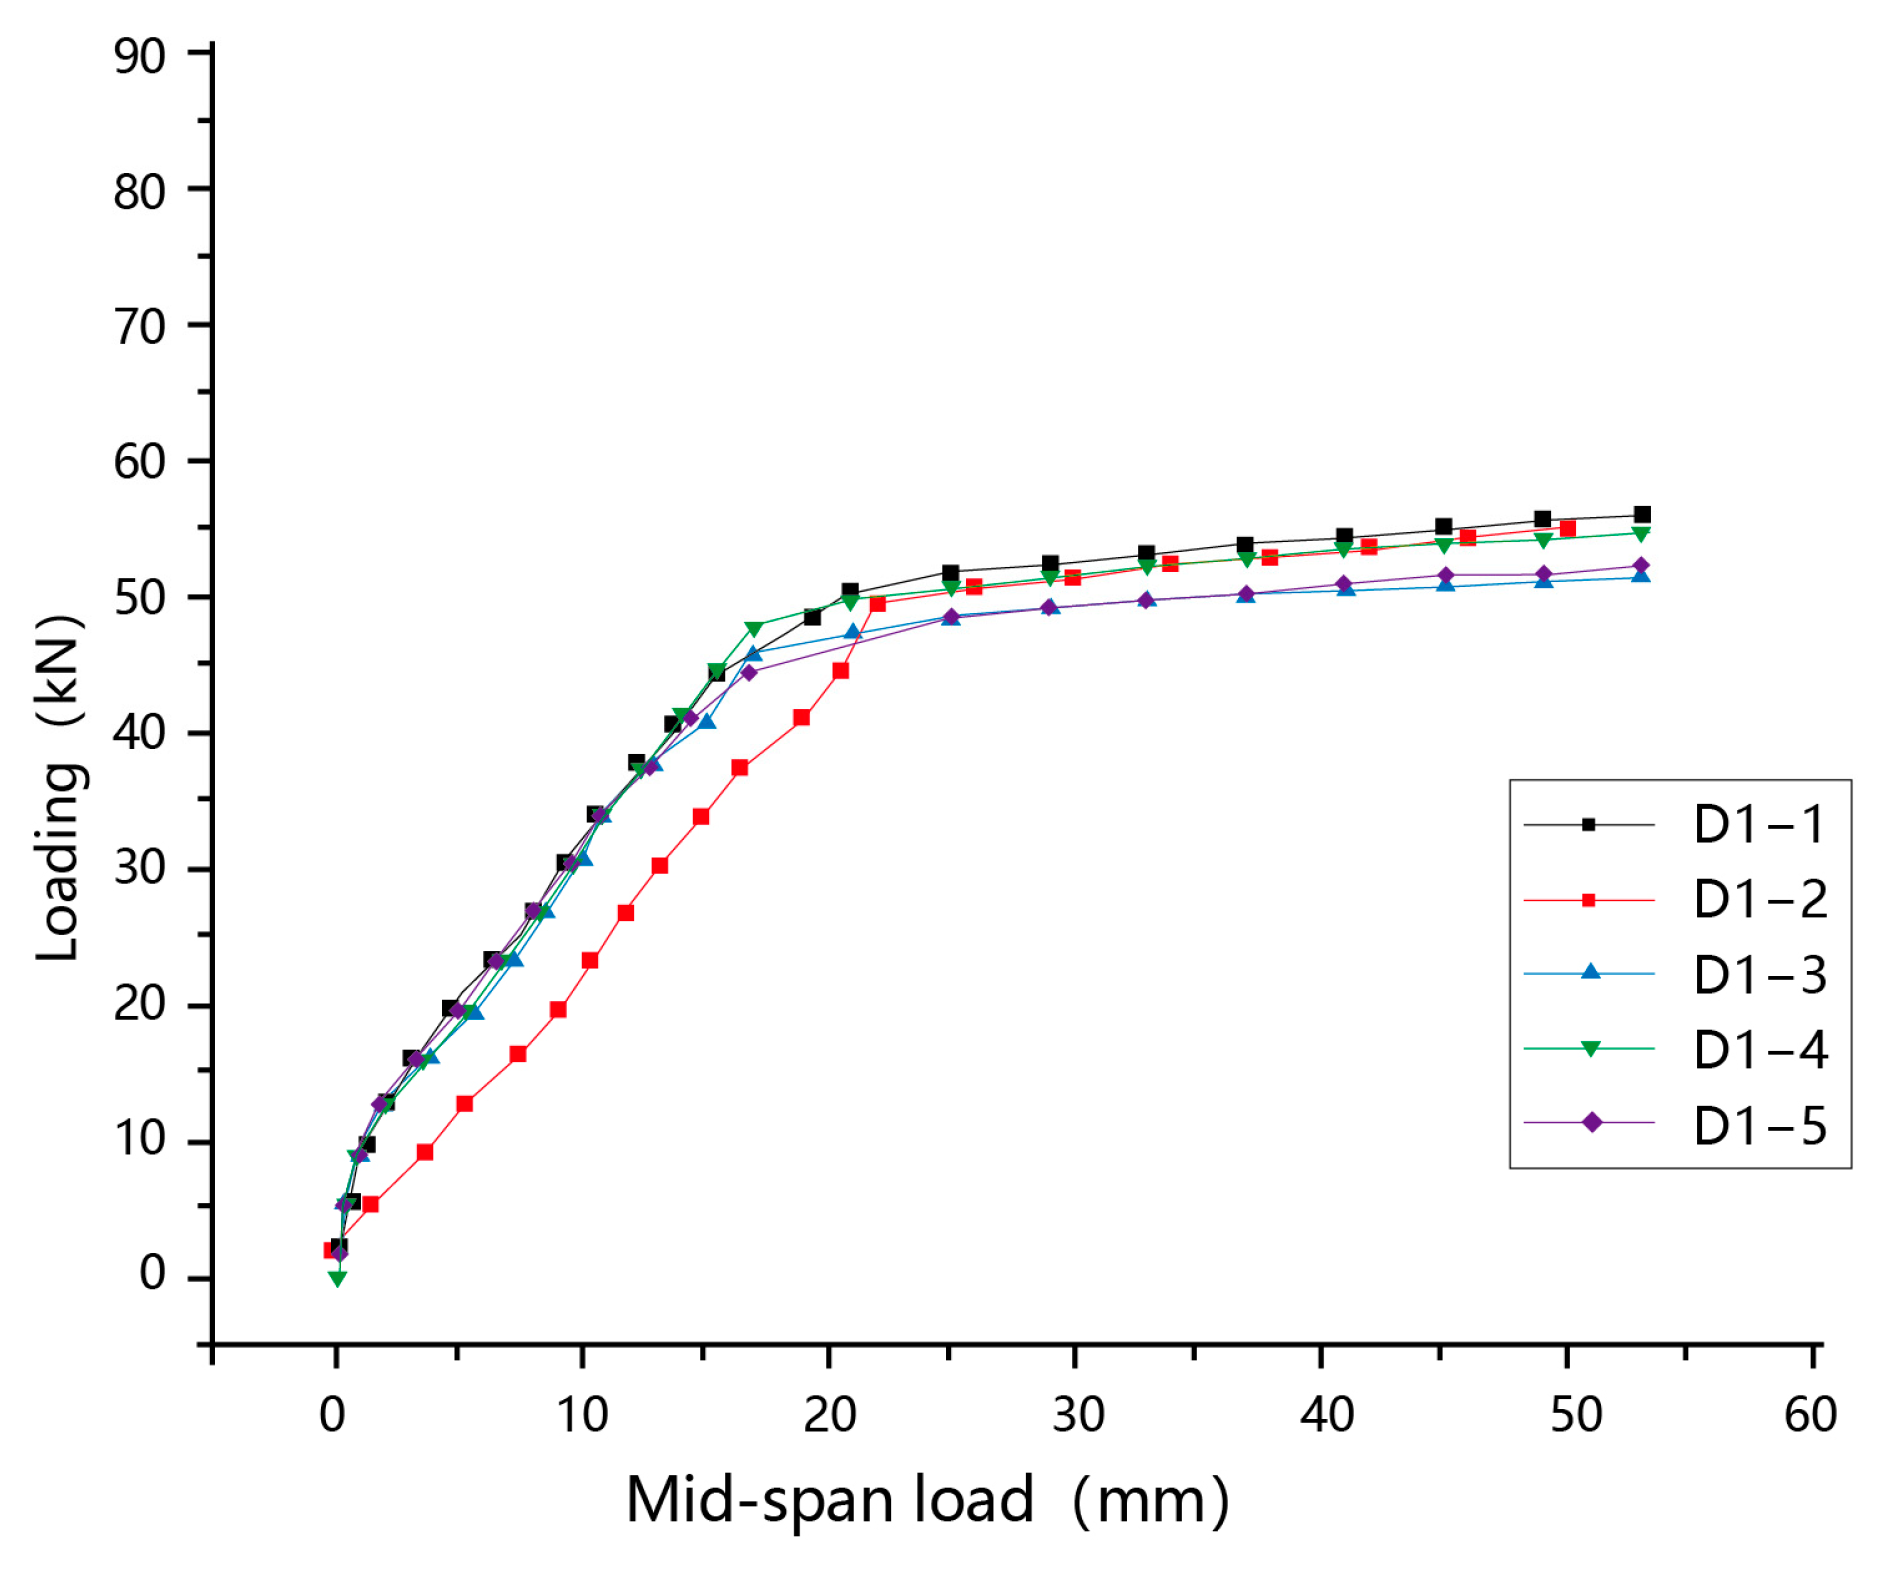
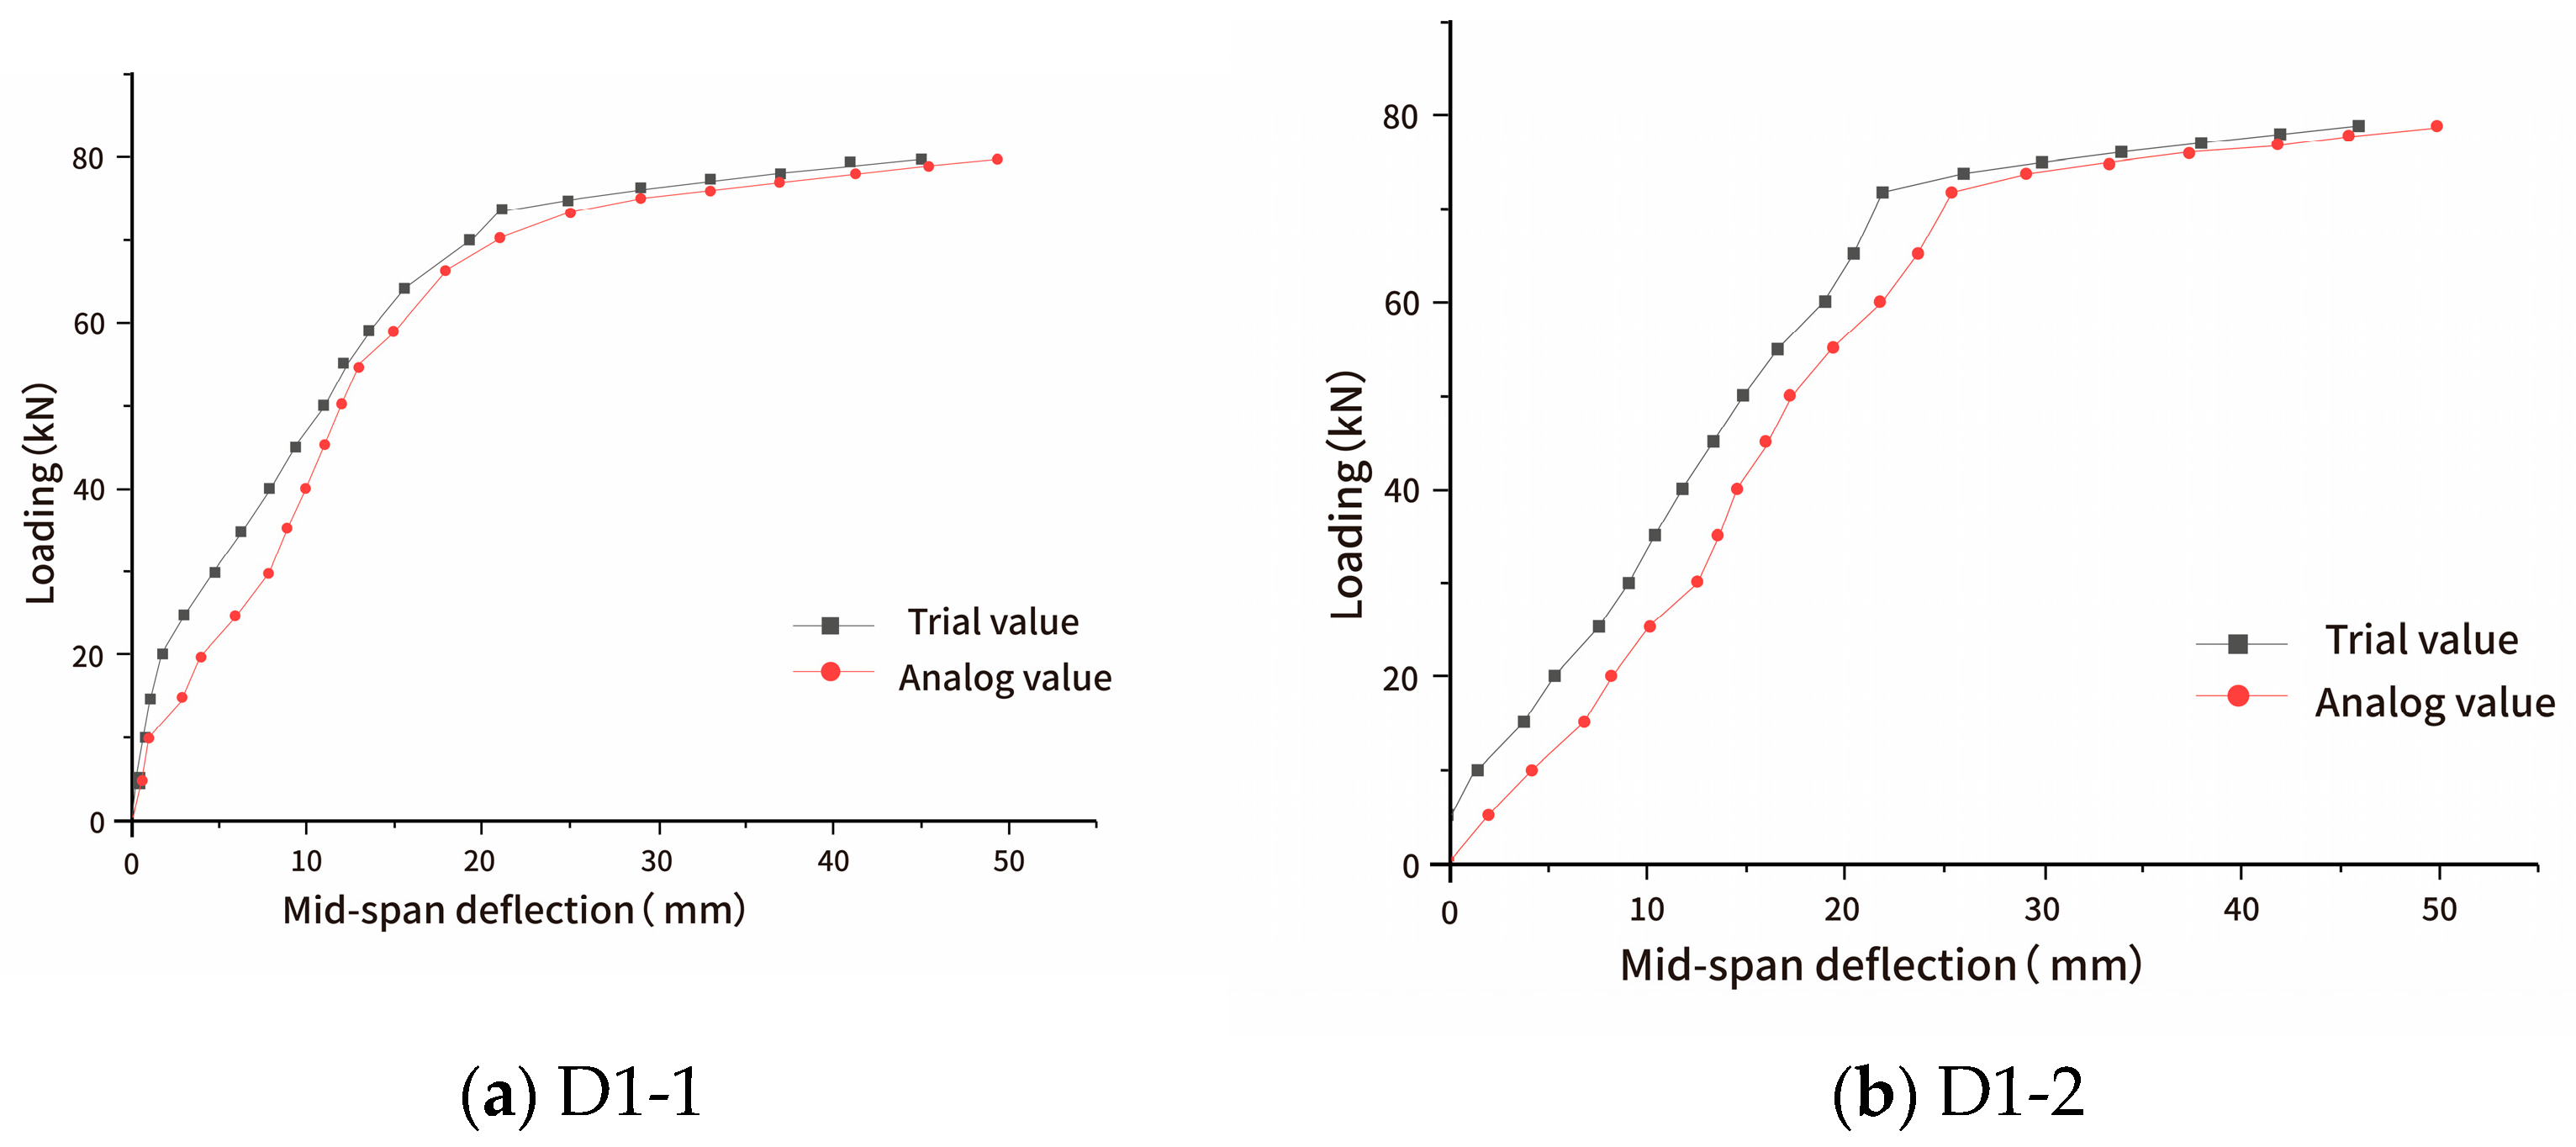
4.1. Analysis of Load–Deflection Relationship

The applied load–midspan deflection curves of the specimens are presented in Figure 5. In the figure, the initial deflection due to self-weight is set to zero, and the external load is also considered zero at this point. As illustrated in Figure 5, all composite slabs exhibited a linear response in the initial loading stage, indicating that they remained in the elastic stage before the cracking of the concrete. This is evidenced by the nearly constant slope of the load–deflection curves.
After the concrete cracked, the deflection increased abruptly, accompanied by a noticeable reduction in the slope of the curves, which signifies a significant decrease in the stiffness of the components. This transition from the elastic to the post-cracking stage is critical for understanding the structural behavior of the slabs.
As the load continued to increase, the deflection grew markedly, particularly in the final stages before failure. This behavior suggests that the failure mode of the slabs was ductile, as indicated by the gradual and pronounced increase in deflection without a sudden loss of load-carrying capacity.
(1)
As illustrated in Figure 5, initial cracks parallel to the span direction were ob-served in composite slabs D1-1 to D1-5, located from the slab end to one-third of the span. These cracks did not affect the load-bearing performance, and no longitudinal cracks were observed between the flanges during the loading process.
(2)
During the casting of the composite layer, slabs D1-1 and D1-3 were cast normally, while D1-2 and D1-4 had hollow sections beneath the flanges. As a result, D1-2 and D1-4 exhibited lower cracking loads. However, the stiffness of these two slabs remained unchanged before and after cracking, indicating that the hollow sections beneath the flanges did not affect the load-bearing performance of the composite slabs.
(3)
Overall, all composite slabs met the requirements for the service stage and were closely aligned with the design specifications.

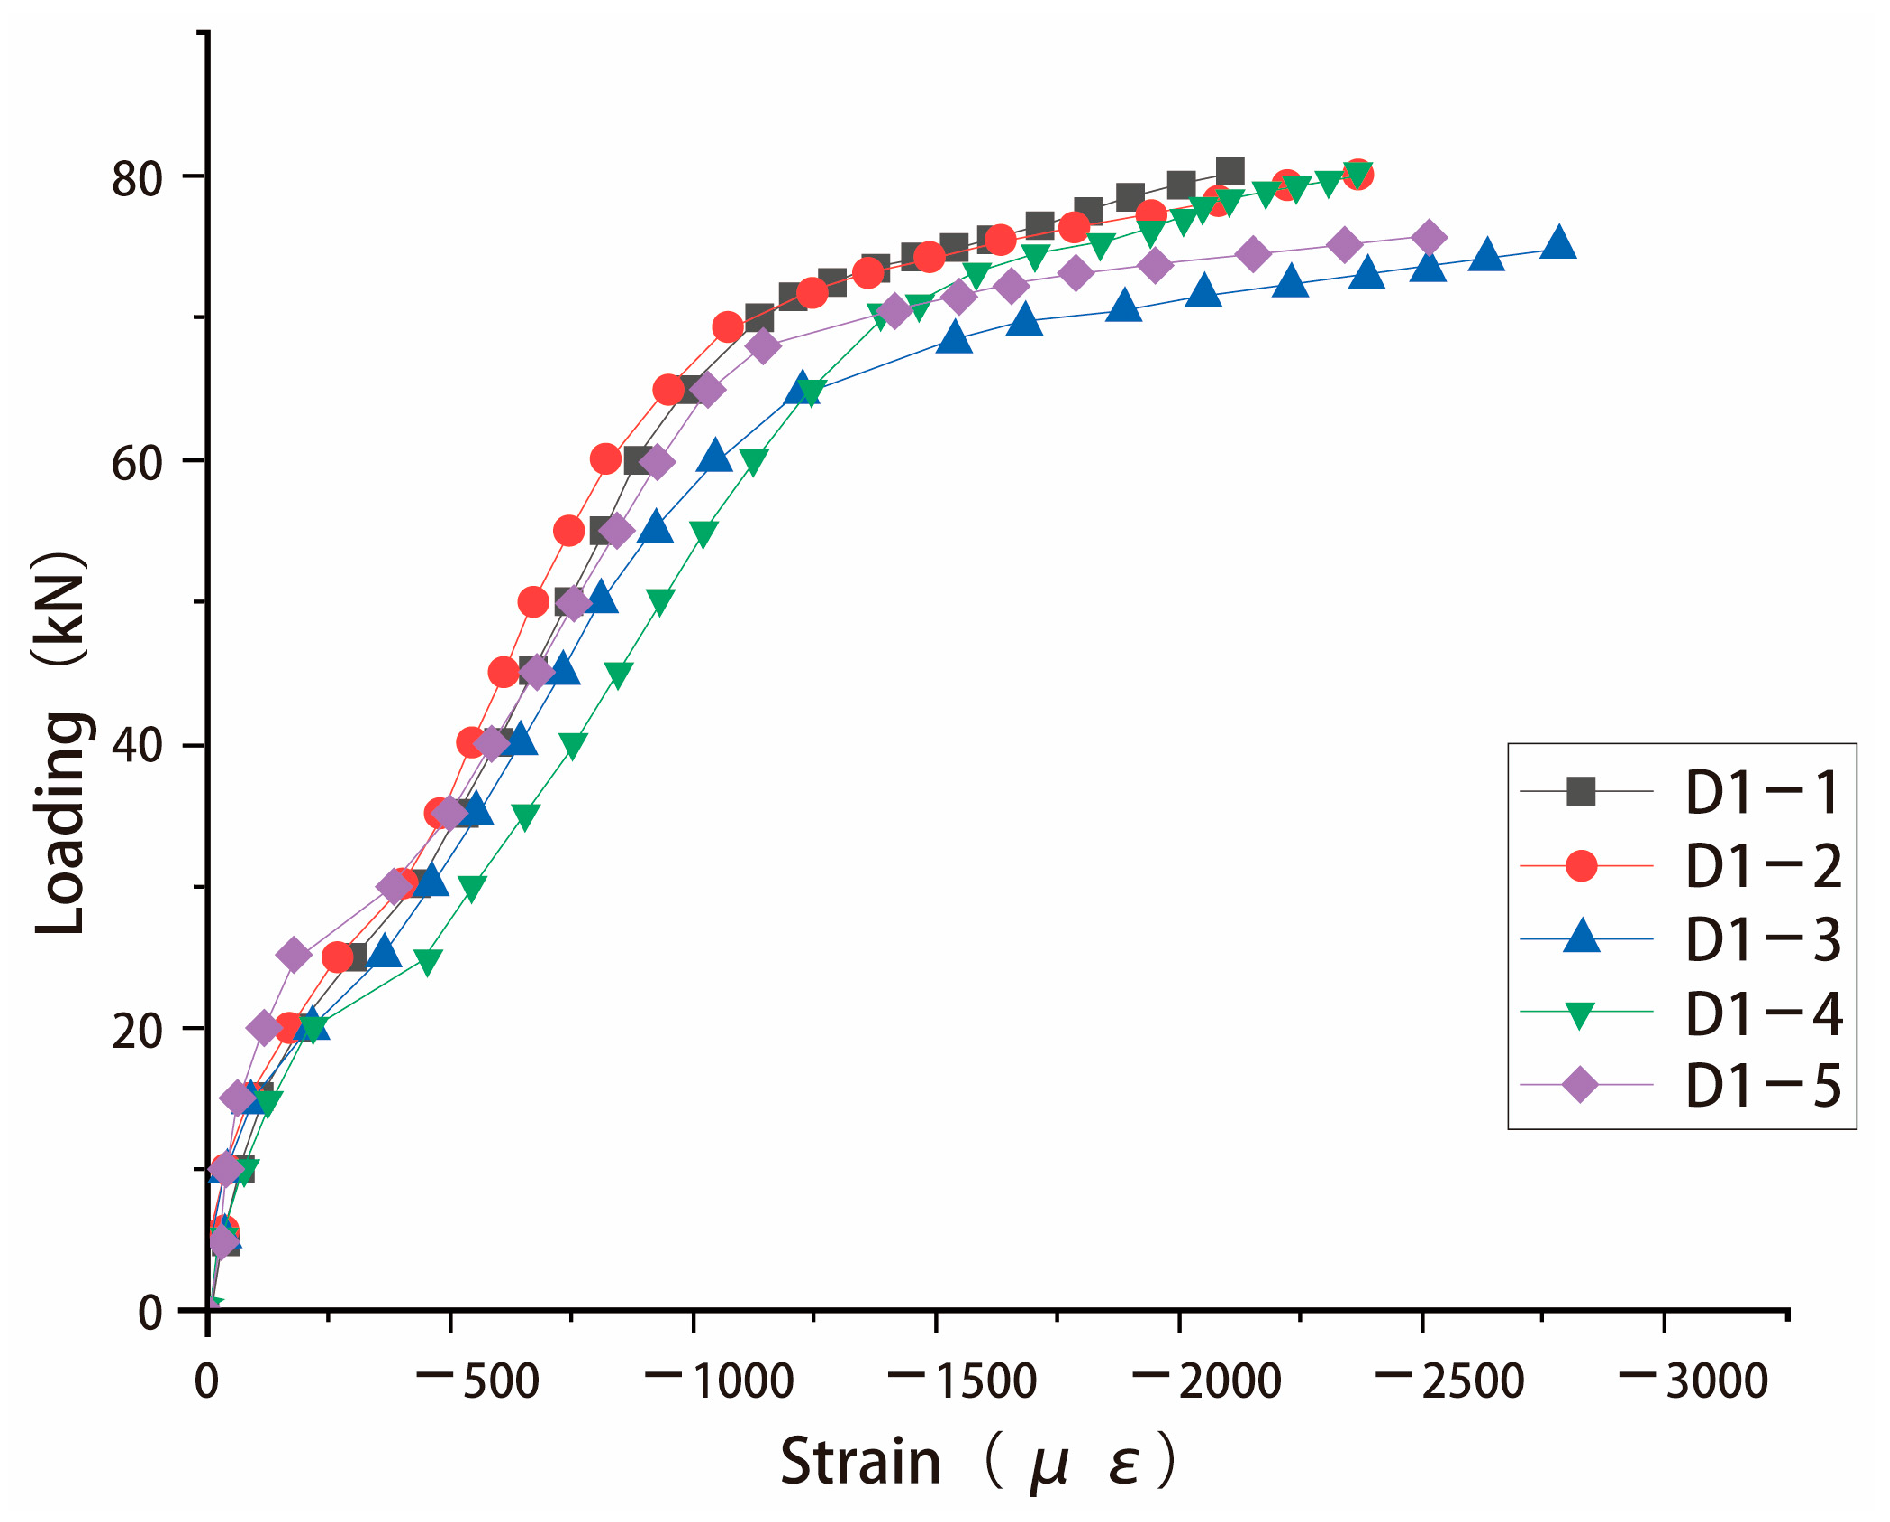
4.2. Concrete Strain Analysis

The load–strain curves of the concrete measurement points at the midspan cross-sections of each component are shown in Figure 6.
(1)
As depicted in Figure 6, all components experienced compressive strain in the top concrete and tensile strain in the bottom concrete. Before cracking, the strain at the top and bottom of the slabs showed a nearly linear increase. In some components, the strains at the top and bottom were relatively symmetrical, indicating good interaction between the concrete base slab and the flanges of the composite slabs. This suggests efficient interaction between the base slab and the composite layer.
(2)
Before cracking, the concrete strain along the height of the composite slabs formed a straight line, aligning with the plane section assumption.

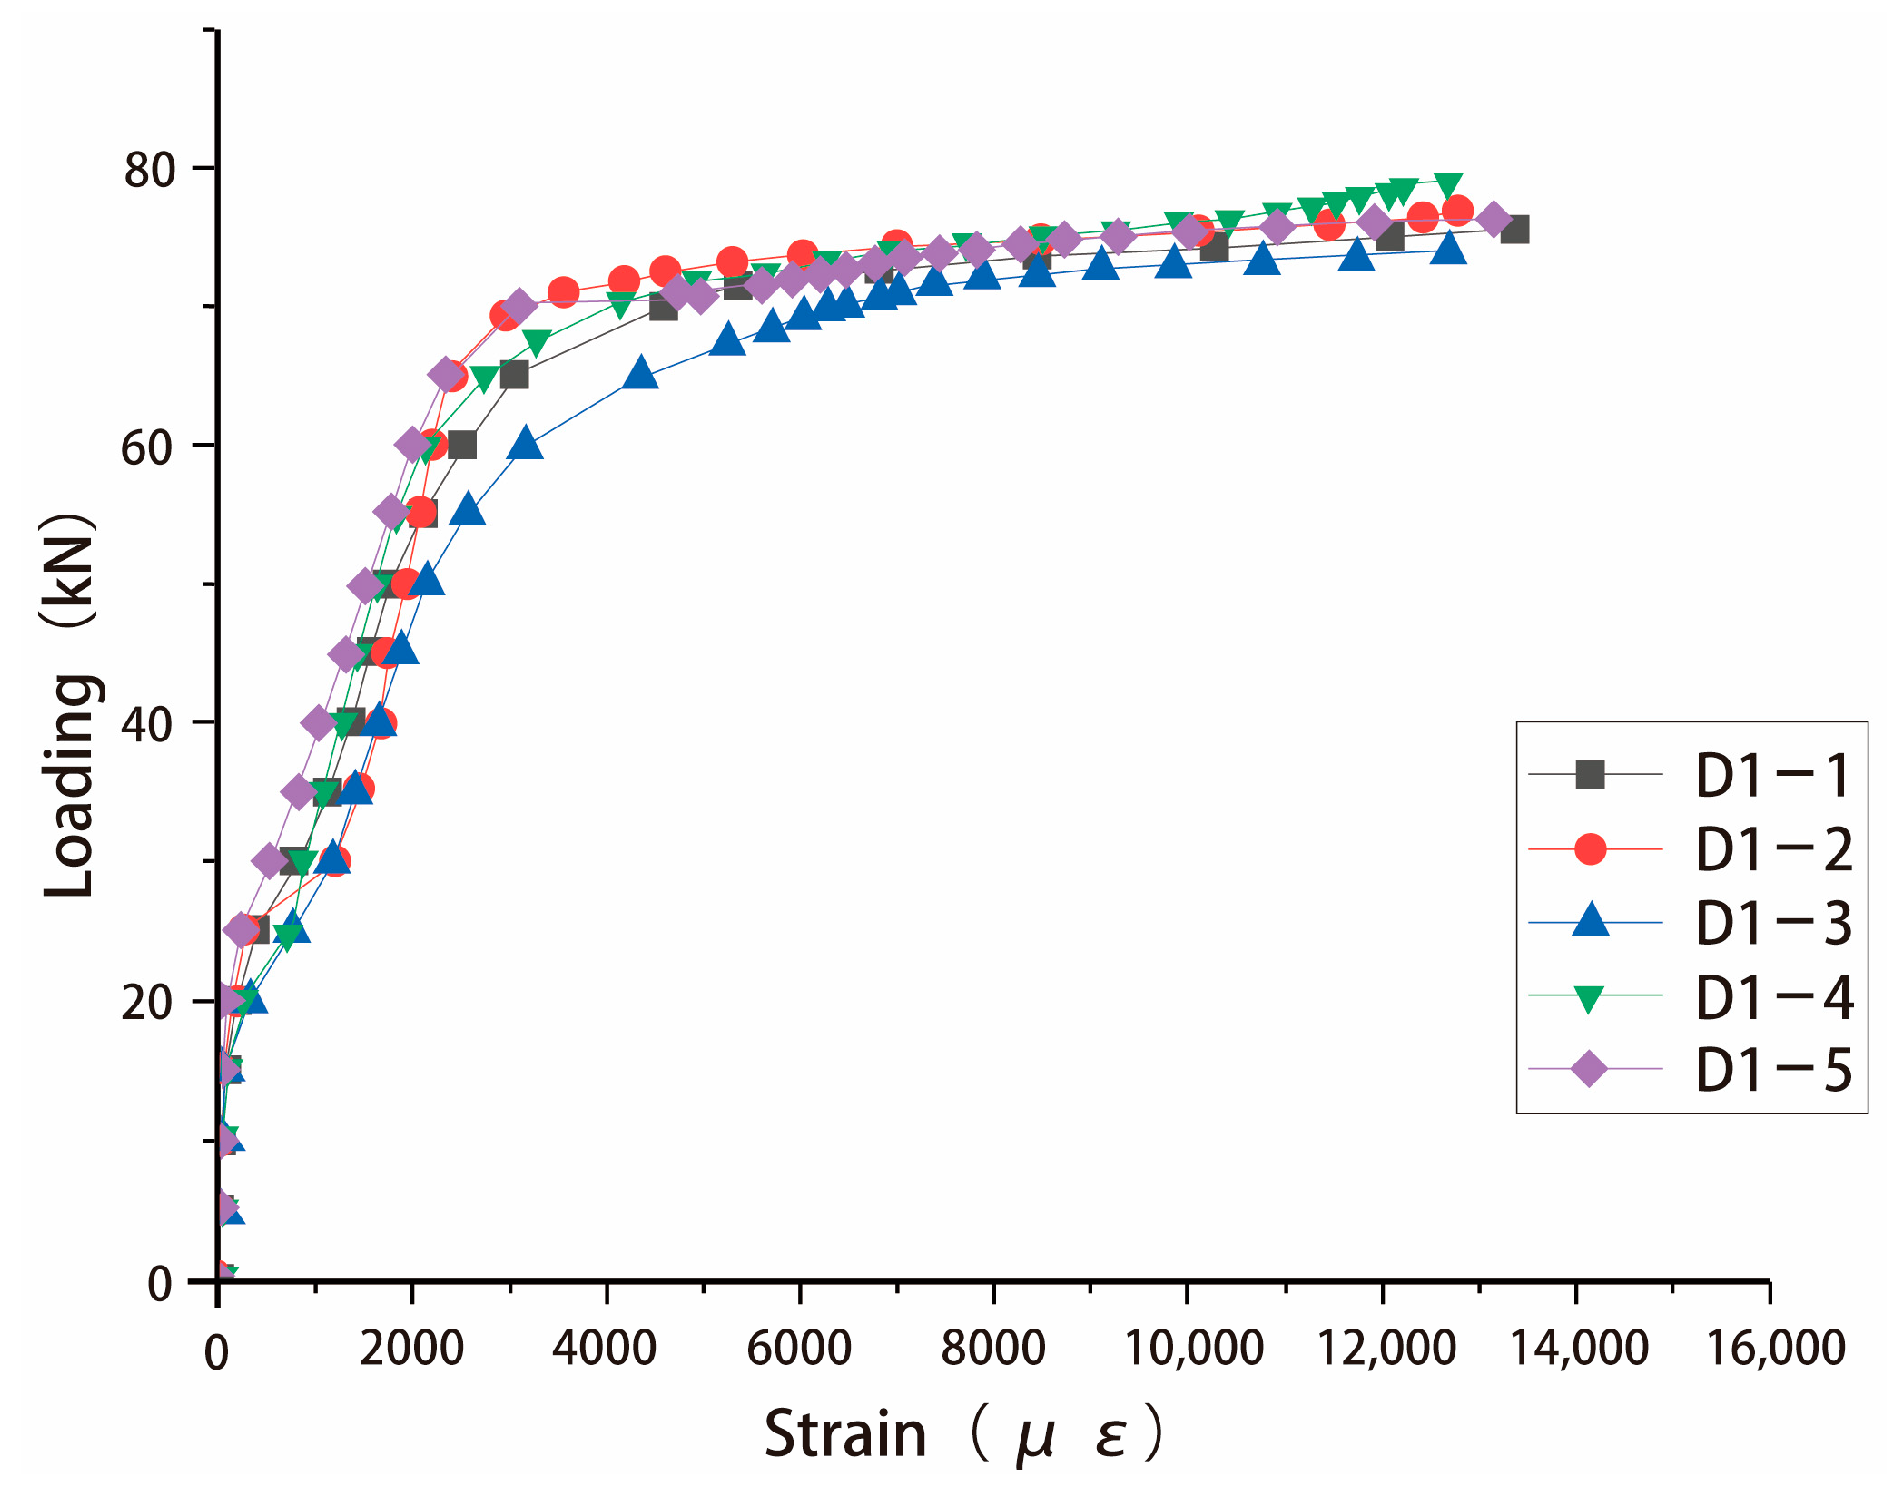
4.3. Web Reinforcement Strain Analysis

The load–strain curves of the truss web reinforcement in the composite slabs are shown in Figure 7. The dashed line in the figure represents the applied load corresponding to the standard construction load.
(1)
As illustrated in Figure 7, the web reinforcement of the composite slab trusses includes both compressive and tensile members, with relatively small strains observed in both types of members.
(2)
Before reaching the construction load, the compressive strain in the compressive web members increased almost linearly, indicating that the web reinforcement of the trusses did not experience compressive buckling.

4.4. Analysis of the Load-Bearing Capacity of Composite Slabs

The load–strain relationship of the composite slabs is illustrated in Figure 8, which provides critical insights into their structural behavior and load-carrying capacity. The figure shows the variation of strain (µε) with increasing load (kN) for the composite slabs.
(1)
Elastic Stage: In the initial loading stage, the load–strain curve exhibits a linear relationship, indicating that the composite slabs remained in the elastic stage. During this phase, both the concrete and reinforcement behaved elastically, with minimal strain accumulation. The slope of the curve in this region reflects the initial stiffness of the slabs.
(2)
Cracking and Post-Cracking Stage: As the load increased, the concrete began to crack, leading to a noticeable change in the slope of the load–strain curve. This transition marks the onset of the post-cracking stage, where the stiffness of the slabs decreases due to the formation of cracks. The strain increased more rapidly with load, indicating a redistribution of stress from the concrete to the reinforcement.
(3)
Yield and Hardening Stage: At higher load levels, the reinforcement entered the yield stage, followed by the hardening stage. During this phase, the strain increased significantly with a relatively small increase in load, reflecting the ductile behavior of the slabs. The load–strain curve in this region demonstrates the ability of the slabs to undergo large deformations before failure, which is a key characteristic of ductile failure modes.
(4)
Ultimate Load and Failure: The ultimate load-carrying capacity of the slabs can be determined from the peak load in the load–strain curve. Beyond this point, the slabs experienced a rapid increase in strain with a corresponding drop in load, indicating structural failure. The failure mode was primarily governed by the yielding of the reinforcement and the crushing of the concrete.

5. Finite Element Simulation of Phosphogypsum Concrete Composite Slabs

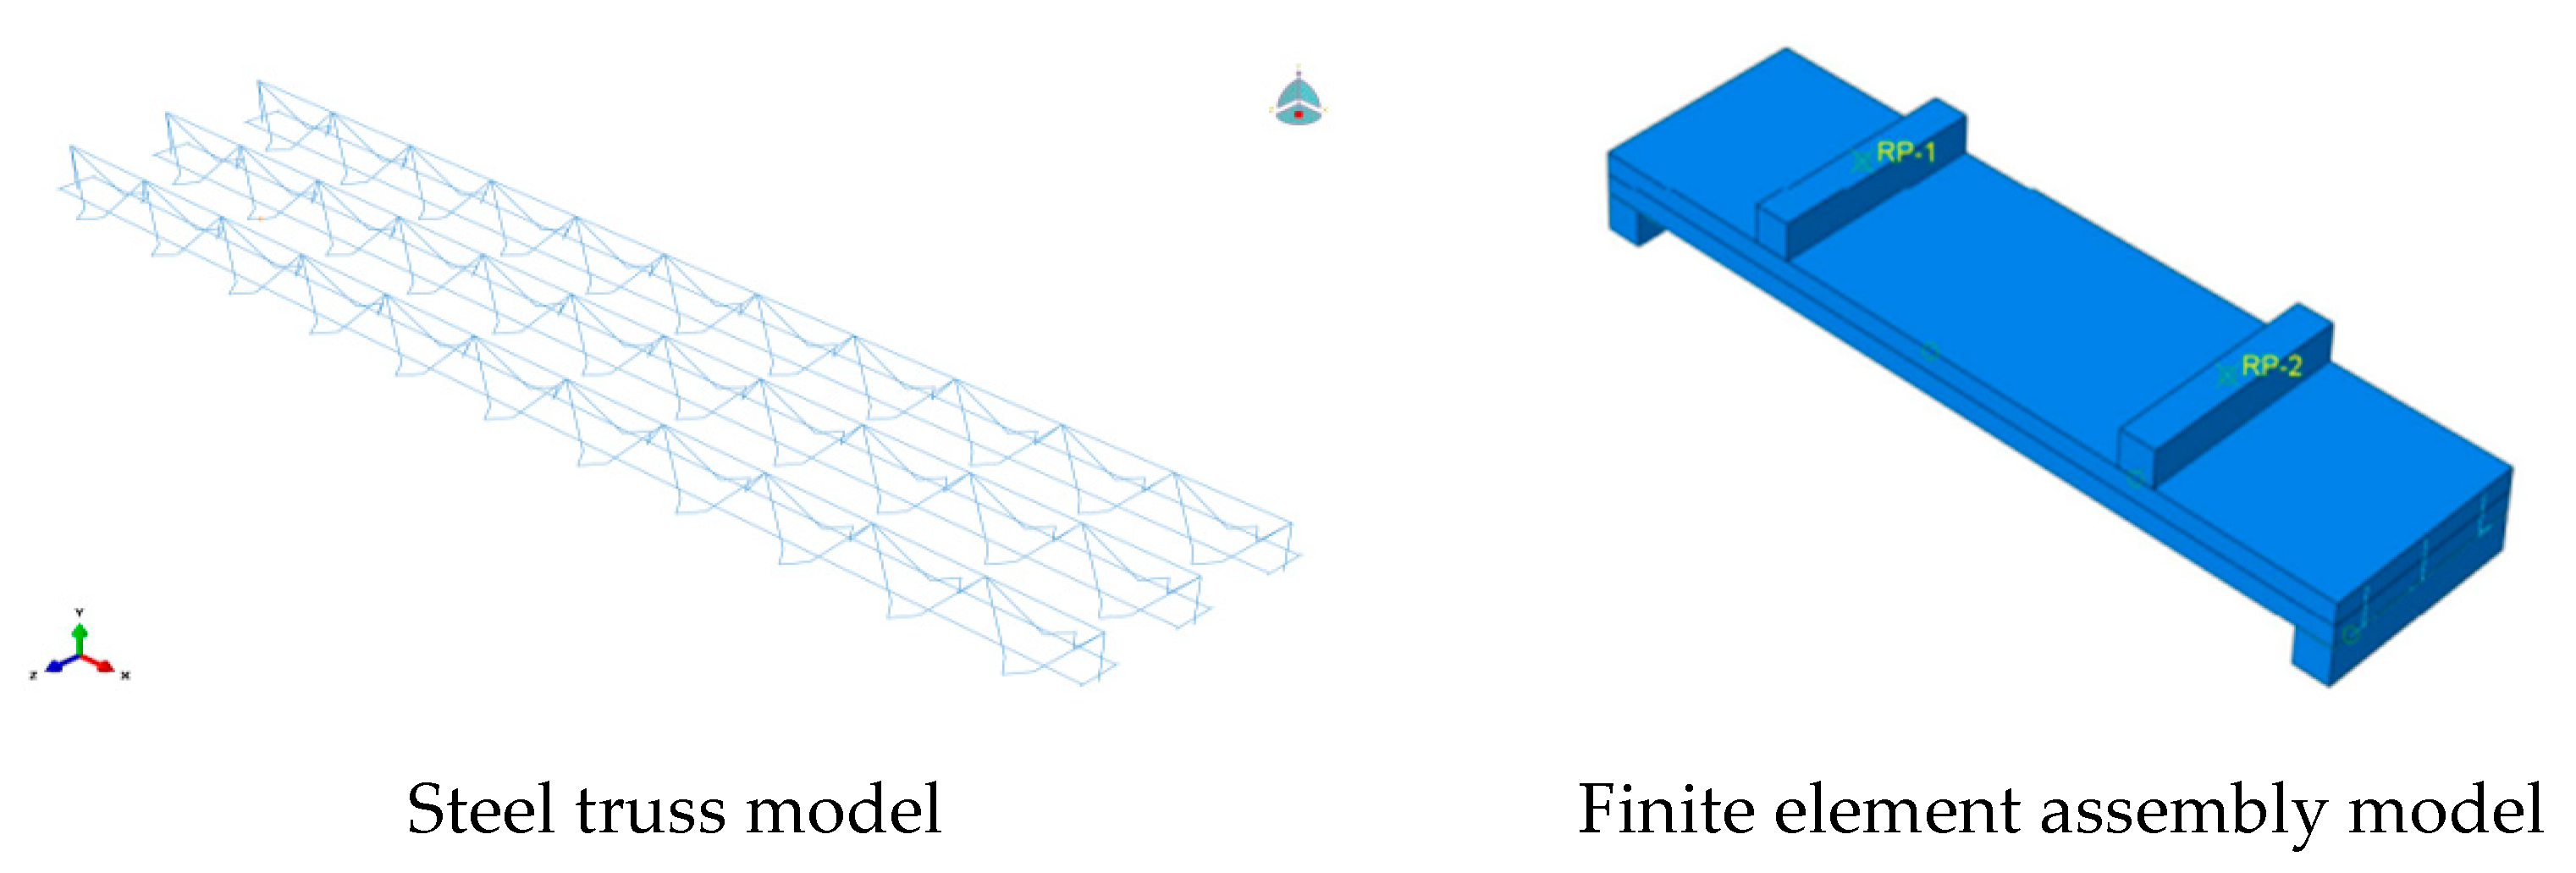
5.1. Establishment of the Finite Element Model

Limit element analysis software is advanced and has a variety of analytical functions. It is widely used in engineering and scientific research fields, and it plays an important role in simulation and analysis calculations in practical engineering. In structural analysis, linear and nonlinear simulation analysis and solution of the structure can be carried out. The finite element analysis method can effectively solve the problems of stress, strain, and displacement of complex components and can accurately provide the calculation results, which are reliable. In this experiment, there are two reasons:
(1)
To complement the experimental study, the finite element model can systematically explore more critical parameters (e.g., forces under static loading, tensile damage cloud, bending moment–deflection relationship, and bearing strength of concrete laminated slabs embedded with different admixtures of phosphogypsum) due to material limitations and possible errors in the test;
(2)
For different working conditions in the actual project, the results obtained in the process of modeling and simulation and the results from the experiment can be compared and referenced to complement each other, which can more accurately provide theoretical references for the actual construction. The finite element analysis results and experimental data show good consistency, which confirms the reliability of the model.
A finite element model was established using the finite element software ABAQUS (2022). In the finite element modeling process, the choice of element type significantly affects the final calculation results; therefore, appropriate element types must be selected. For the multi-reinforced truss composite slab, the concrete material was modeled using C3D8R eight-node linear solid elements. The density of the concrete used in the experiments was measured as 2296 kg/m3. The elastic modulus of concrete with 0% phosphogypsum content was 33,000 MPa, while that with 2% phosphogypsum content was 32,600 MPa, and that with 4% phosphogypsum content was 30,700 MPa. The Poisson’s ratio for all cases was 0.19, which provides accurate displacement solutions with relatively low computational time. The distribution reinforcement and steel trusses, which are primarily subjected to tension and compression, were simulated using T3D2 truss elements, and the density of steel reinforcement was set to 7850 kg/m3. The elastic modulus was taken as 200 GPa, and the Poisson’s ratio was taken as 0.33. The cross-sectional diameter of HRB400 steel reinforcement was 10 mm, and that of CPB550 steel reinforcement was 5 mm. Different mesh sizes were adopted for different components: 20 mm for the reinforcement and 50 mm for the concrete. The mechanical behavior, tensile damage cloud diagrams, moment–deflection relationships, and load-bearing capacity of phosphogypsum concrete composite slabs with different phosphogypsum contents under monotonic loading were analyzed.
After assembling the components, the interactions between them were defined. The contact between the four supports and the concrete surface was set as hard contact and rough contact. Additionally, reference points were created and coupled for each of the four supports. For the tendons and distribution reinforcement in the bottom slab, the “Embedded region” command was used to embed them into the flat part of the bottom slab. For the steel truss, the “Embedded region” command was also applied. However, it was first divided into three parts along the height direction: top, middle, and bottom. The top part was embedded into the concrete flange, and the bottom part was embedded into the flat part of the concrete bottom slab. The steel truss model and the finite element assembly model are illustrated in Figure 9.
In this paper, the plastic damage model of concrete is used. The plastic damage model of concrete assumes that the damage forms of concrete are cracking and crushing, and the plastic stiffness of the model after cracking is discounted through the introduction of the plastic damage parameter, which is suitable for simulating the force of concrete under arbitrary loads and has good convergence [39]. The constitutive relationship of concrete is shown in Figure 10.
The stress–strain curve for uniaxial compression of concrete can be determined by the following equation:
σ = ( 1 d c ) E c ε d c = 1 ρ c n n 1 + x n   x 1 1 ρ c α c ( x 1 ) 2 + x   x 1 ρ c = f c , r E c ε c , r n = E c ε c , r E c ε c , r f c , r x = ε ε c , r
  • α c —Parameters for the descending branch of the uniaxial tensile stress–strain curve of concrete;
  • f c , r —Uniaxial tensile strength of concrete;
  • ε c , r —Corresponding peak tensile strain of fc,r concrete;
  • d c —Damage evolution parameter for the uniaxial tensile behavior of concrete.
Steel reinforcement is regarded as an ideal isotropic material. During the elastic phase under low strain conditions, its stress–strain relationship demonstrates a clear linear behavior. However, once yielding occurs at higher strains, the material undergoes plastic deformation, leading to a nonlinear stress–strain relationship. In this study, the constitutive behavior of steel reinforcement and steel plates in the finite element simulation is modeled using a bilinear hardening elastoplastic approach. The von Mises yield criterion is applied to describe the yielding behavior. The linear hardening model of steel reinforcement is illustrated in Figure 11. The stress–strain relationship for the bilinear hardening elastoplastic model is expressed as follows:
σ s = E s ε s ,   ε s ε y f y + k ε s ε y ,   ε s > ε y
  • E s 
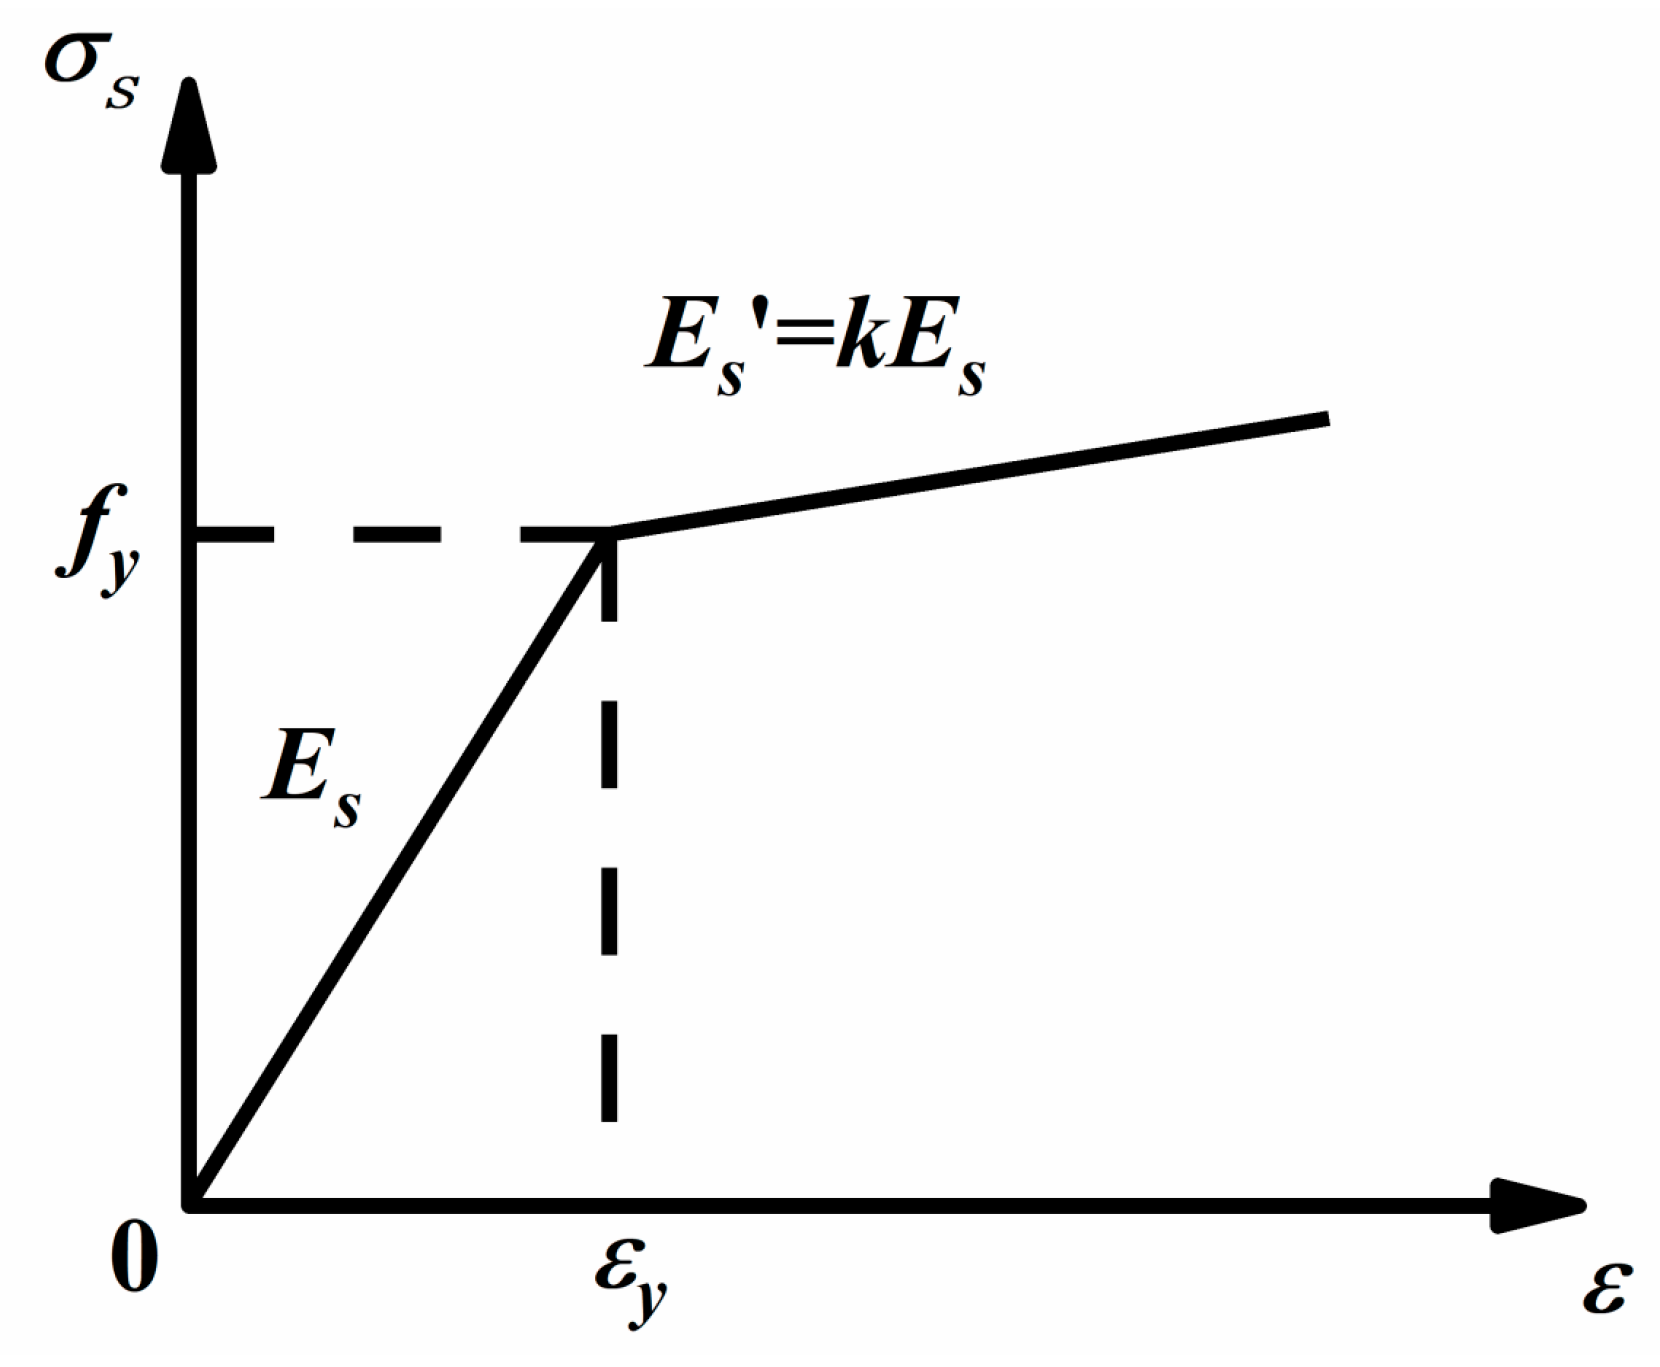
—Elastic modulus of steel reinforcement;
  • σ s —Stress of steel reinforcement;
  • ε s —Strain of steel reinforcement;
  • f y —Yield strength of steel reinforcement;
  • ε y —Yield strain of steel reinforcement corresponding to the yield strength;
  • k —Slope of the hardening stage of steel reinforcement.
Figure 11. Linear reinforcement model of reinforcement.
Buildings 15 01122 g011

5.2. Analysis of Simulation Results
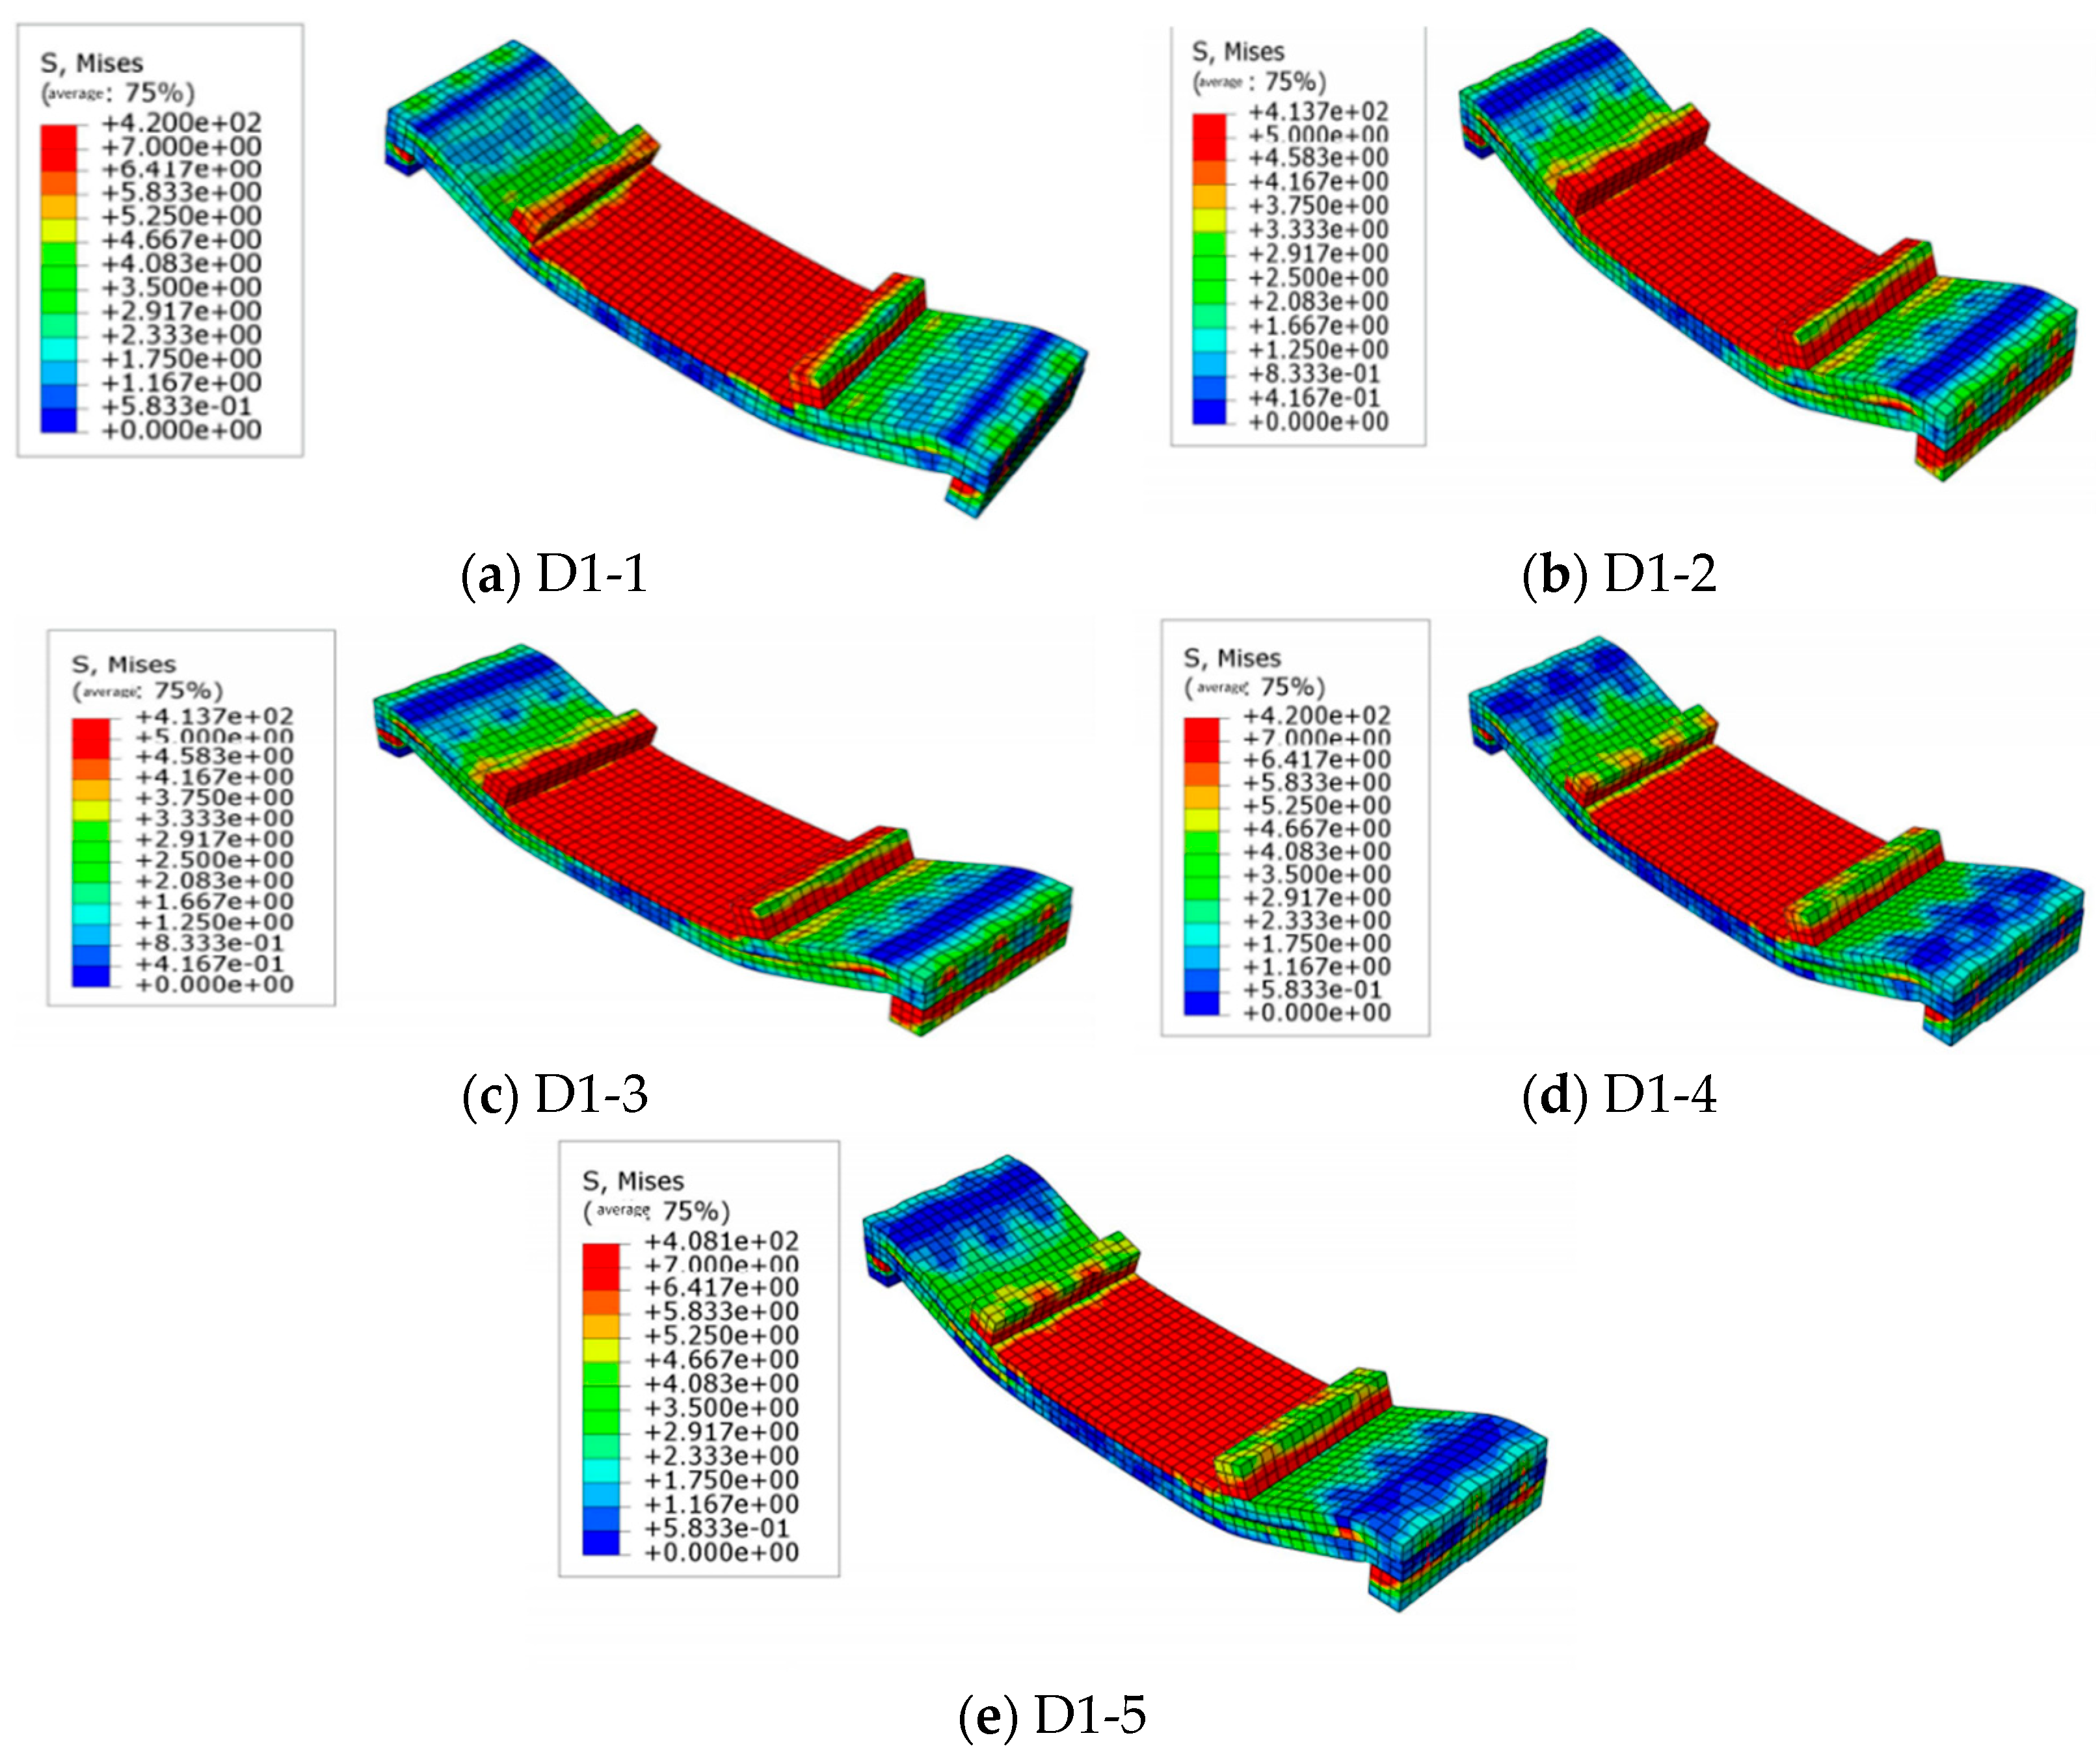
Finite element modeling and calculations were conducted for composite slabs D1-1 to D1-5. All precast bottom slabs and composite slabs were hinged at both ends. A uniform load was simulated by applying pressure on the surface of the concrete flange and bottom slab. The load application sequence was as follows: first, a gravity load was applied; finally, a uniform external load was applied. A comparison with experimental results was performed to verify the accuracy of the modeling method, followed by a parametric analysis. The material properties of the steel reinforcement and concrete obtained from the experimental measurements were used as input parameters. In the finite element model’s loading process, the loading surface was divided into three sections: the upper surface of the concrete flange and the upper surfaces of the left and right side base slabs. This arrangement was consistent with the experimental loading surfaces, thereby reflecting the actual test conditions more accurately. The load–displacement curves at the midspan of the components, the tensile and compressive stress–strain curves of the longitudinal reinforcement, and the compressive stress–strain curves of the concrete were extracted. A comparison was conducted between the simulation results and the experimental results. Figure 12 shows the load–displacement curves of the composite slab model:
As illustrated in Figure 12, the finite element (FE) simulation results demonstrated good agreement with the experimental results. The stiffness of the base slab remained consistent both before and after cracking, and the cracking loads obtained from the simulation were nearly identical to those observed in the experiments. However, the simulated deflection values were slightly higher than the experimental values. This discrepancy can be attributed to the higher effective value applied in the FE model compared to the actual in the experiments, leading to an overestimation of deflection in the simulation.
The load–deflection behavior can be divided into three distinct stages based on the response of the reinforcement and concrete:
Elastic Stage (Load < 20 kN): In this stage, the reinforcement was minimally engaged, and the concrete served as the primary load-bearing component. Both the reinforcement and concrete remained in the elastic stage, exhibiting a linear response;
Yield Stage (20 kN ≤ Load ≤ 65 kN): As the load increased, the reinforcement entered the yield stage and began to share the load with the concrete. During this phase, most of the stress was transferred from the concrete to the reinforcement, resulting in a noticeable reduction in the stiffness of the composite slab;
Hardening Stage (Load > 65 kN): When the load exceeded 65 kN, the reinforcement entered the hardening stage, where it continued to carry increasing stress until structural failure occurred. It is noteworthy that the concrete failed before the reinforcement reached its ultimate strength, highlighting the ductile nature of the failure mode.
Figure 13 shows the tensile damage contour plot of the composite slab.
(1)
Stress Concentration and Failure Initiation:
The areas with the highest Mises stress values (e.g., 4.200 × 10² in Figure 1 and 4.137 × 10² in Figure 2) indicate regions of stress concentration. These regions are typically where failure initiates as the material reaches its yield strength.
In the composite slabs, stress concentrations were observed near the loading points and support regions, suggesting that these areas are critical for structural integrity.
(2)
Crack Propagation and Failure Progression:
The gradual Mises stress values from the high-stress regions to the lower-stress regions (e.g., from 4.200 × 10² to 0.000 × 100 in Figure 1) illustrate the path of crack propagation. The stress redistribution indicates how cracks propagate from the high-stress areas to the surrounding regions.
The stress contours reveal that cracks were likely initiated in the concrete near the loading points and propagated toward the midspan, consistent with the typical failure pattern of bending-dominated structures.
(3)
Material Yielding and Ductile Failure:
The presence of high Mises stress values in the reinforcement (e.g., 4.137 × 10² in Figure 3) indicates that the steel reinforcement underwent significant yielding before failure. This behavior is characteristic of ductile failure, where the reinforcement deforms plastically before the structure loses its load-carrying capacity.
The stress contours also show that the concrete experienced high stresses near the failure zones, leading to crushing and spalling, which is typical in reinforced concrete structures under bending.
(4)
Implications for Design:
The stress contours highlight the importance of reinforcing critical regions, such as the loading points and midspan, to prevent premature failure. Additionally, the ductile behavior of the reinforcement suggests that the composite slabs can undergo significant deformation before failure, which is desirable for structural safety.
As depicted in Figure 11, the simulation results of the composite slab aligned well with the experimental results, exhibiting similar trends in the curves.

6. Conclusions

This study systematically investigated the mechanical properties of one-way composite slabs with steel trusses and phosphogypsum (PG) concrete under static loading conditions, with PG contents of 0%, 2%, and 4%. Through experimental testing and finite element analysis (FEA) using ABAQUS software, the effects of varying PG content on crack distribution, ultimate failure mode, cracking load, and stiffness before the ultimate load were comprehensively analyzed. The following conclusions were drawn:
1.
Effect of PG Content on Mechanical Properties:
The inclusion of 2% and 4% PG content had a negligible impact on the flexural capacity of the composite slabs. However, higher PG content significantly reduced crack resistance and stiffness before the ultimate load. Specifically, the cracking load decreased by approximately 12% and 18% for slabs with 2% and 4% PG content, respectively, compared to the control slab (0% PG).
2.
Optimal PG Content:
The composite slab with 2% PG content demonstrated mechanical properties comparable to those of ordinary concrete slabs (0% PG), achieving an ultimate load capacity of 85 kN, which was only 3% lower than the control slab. Moreover, the 2% PG slab exhibited superior structural integrity during failure, with fewer and narrower cracks compared to the 4% PG slab.
3.
Finite Element Simulation:
The FEA results using ABAQUS software showed excellent agreement with the experimental data, with a maximum deviation of less than 5% in predicting the ultimate load and failure modes. This validates the reliability of the numerical model for simulating the mechanical behavior of PG concrete composite slabs.
4.
Practical Applications and Environmental Benefits:
Both experimental and FEA results confirmed that the mechanical properties of PG concrete composite slabs meet the requirements for practical engineering applications. The use of 2% PG in concrete not only enhances sustainability by utilizing industrial byproducts but also reduces the environmental impact of PG stockpiling by approximately 15%. This study provides a viable solution for developing eco-friendly building materials while addressing the challenges associated with PG waste management.

Future Research Directions

To further advance the application of PG in construction materials, future studies should focus on the following:
Optimizing the PG content to improve early-age strength and durability;
Investigating the long-term performance of PG concrete under environmental conditions such as freeze–thaw cycles and carbonation;
Exploring the application of PG concrete in other structural systems, such as beams, columns, and pavements.

Author Contributions

Conceptualization, A.Z. and L.S.; methodology, L.S.; software, A.Z.; validation, A.Z.; formal analysis, A.Z.; investigation, L.S.; resources, A.Z. and L.S.; data curation, A.Z.; writing—original draft preparation, A.Z.; writing—review and editing, A.Z. and L.S.; visualization, A.Z. and L.S.; supervision, A.Z. and L.S.; project administration, L.S.; funding acquisition, L.S. All authors have read and agreed to the published version of the manuscript.

Funding

This research was funded by the Project of Technology Development Program of Science and Technology Department of Jilin Province grant number 20220203072SF, And The APC was funded by Project of Technology Development Program of Science and Technology Department of Jilin Province.

Data Availability Statement

The data that support the findings of this study are available from the corresponding author upon reasonable request.

Conflicts of Interest

The authors declare that they have no known competing financial interests or personal relationships that could have appeared to influence the work reported in this paper. The authors declare the following financial interests/personal relationships, which may be considered potential competing interests.

References

  1. Jalali, J.; Gaudin, P.; Capiaux, H.; Ammar, E.; Lebeau, T. Fate and transport of metal trace elements from phosphogypsum piles in Tunisia and their impact on soil bacteria and wild plants. Ecotoxicol. Environ. Saf. 2019, 174, 12–25. [Google Scholar] [CrossRef]
  2. Lin, Z.S.; Shi, H.D.; Beguedou, E. Effect of polycarboxylate superplasticizer on properties of phosphogypsum-based cement. Key Eng. Mater. 2012, 509, 13–19. [Google Scholar]
  3. Yang, J.K.; Liu, W.C.; Zhang, L.L.; Xiao, B. Preparation of load-bearing building materials from autoclaved phosphogypsum. Constr. Build. Mater. 2009, 23, 687–693. [Google Scholar] [CrossRef]
  4. Lütke, S.F.; Oliveira, M.L.S.; Silva, L.F.O.; Cadaval, T.R.S.; Dotto, G.L. Nanominerals assemblages and hazardous elements assessment in phosphogypsum from an abandoned phosphate fertilizer industry. Chemosphere 2020, 256, 127138. [Google Scholar] [PubMed]
  5. Meskini, S.; Mechnou, I.; Benmansour, M.; Remmal, T.; Samdi, A. Environmental investigation on the use of a phosphogypsum-based road material: Radiological and leaching assessment. J. Environ. Manag. 2023, 345, 118597. [Google Scholar]
  6. Baolin, K.; Qin, Z.; Xianhai, L.; Zhihui, S. Adsorption and solidification of cadmium by calcium sulfate dihydrate (gypsum) in an aqueous environment: A dispersion-corrected DFT and ab initio molecular dynamics study. Phys. Chem. Chem. Phys. 2022, 24, 9521–9533. [Google Scholar] [CrossRef]
  7. Wu, F.; Ren, Y.; Qu, G.; Liu, S.; Chen, B.; Liu, X.; Zhao, C.; Li, J. Utilization path of bulk industrial solid waste: A review on the multi-directional resource utilization path of phosphogypsum. J. Environ. Manag. 2022, 313, 114957. [Google Scholar] [CrossRef]
  8. Bilal, E.; Bellefqih, H.; Bourgier, V.; Mazouz, H.; Dumitraş, D.-G.; Bard, F.; Laborde, M.; Caspar, J.P.; Guilhot, B.; Iatan, E.-L.; et al. Phosphogypsum circular economy considerations: A critical review from more than 65 storage sites worldwide. J. Clean. Prod. 2023, 414, 137561. [Google Scholar]
  9. Garbaya, H.; Jraba, A.; Khadimallah, M.A.; Elaloui, E. The Development of a New Phosphogypsum-Based Construction Material: A Study of the Physicochemical, Mechanical and Thermal Characteristics. Materials 2021, 14, 7369. [Google Scholar] [CrossRef]
  10. Meng, W.; Dong, Y. Mechanical properties and chemical microscopic characteristics of all-solid-waste composite cementitious materials prepared from phosphogypsum and granulated blast furnace slag. Mater. Today Commun. 2024, 41, 110809. [Google Scholar] [CrossRef]
  11. Rashad, M. Phosphogypsum as a construction material. J. Clean. Prod. 2017, 166, 732–743. [Google Scholar] [CrossRef]
  12. Calderon-Morales, B.R.S.; García-Martínez, A.; Pineda, P.; García-Tenorio, R. Valorization of phosphogypsum in cement-based materials: Limits and potential in eco-efficient construction. J. Build. Eng. 2021, 44, 32. [Google Scholar] [CrossRef]
  13. Akfas, F.; Elghali, A.; Aboulaich, A.; Munoz, M.; Benzaazoua, M.; Bodinier, J.L. Exploring the potential reuse of phosphogypsum: A waste or a resource. Sci. Total Environ. 2024, 908, 168196. [Google Scholar] [CrossRef] [PubMed]
  14. Zhang, D.Y.; Luo, H.M.; Zheng, L.W.; Wang, K.J.; Li, H.X.; Wang, Y.; Feng, H.X. Utilization of waste phosphogypsum to prepare hydroxyapatite nanoparticles and its application towards removal of fluoride from aqueous solution. J. Hazard Mater. 2012, 241, 418–426. [Google Scholar] [CrossRef]
  15. Wang, Z.; Shui, Z.; Sun, T.; Li, X.; Zhang, M. Recycling utilization of phosphogypsum in eco excess-sulphate cement: Synergistic effects of metakaolin and slag additives on hydration, strength and microstructure. J. Clean. Prod. 2022, 358, 131901. [Google Scholar] [CrossRef]
  16. Reijnders, L. Cleaner phosphogypsum, coal combustion ashes and waste incineration ashes for application in building materials: A review. Build. Environ. 2007, 42, 1036–1042. [Google Scholar] [CrossRef]
  17. Chernysh, Y.; Yakhnenko, O.; Chubur, V.; Roubik, H. Phosphogypsum recycling: A review of environmental issues, current trends, and prospects. Appl. Sci. 2021, 11, 1575. [Google Scholar] [CrossRef]
  18. Romero-Hermida, M.I.; Borrero-López, A.M.; Alejandre, F.J.; Flores-Alés, V.; Santos, A.; Franco, J.M.; Esquivias, L. Phosphogypsum waste lime as a promising substitute of commercial limes: A rheological approach. Cem. Concr. Compos. 2019, 95, 205–216. [Google Scholar] [CrossRef]
  19. Kutymbek, N.; Musabekov, K.; Yestayev, K.; Yessengeldiyeva, P.; Omarova, G. Evaluating the efficacy of phosphogypsum as a soil amendment for enhancing fertility in compacted gray-earth soils of Kazakhstan during comprehensive land reclamation. Int. J. Des. Nat. Ecodynamics 2023, 18, 529–536. [Google Scholar] [CrossRef]
  20. Ennaciri, Y.; Bettach, M.; El Alaoui-Belghiti, H. Phosphogypsum conversion into calcium fluoride and sodium sulfate. Ann. Chim.-Sci. Matériaux 2020, 44, 407–412. [Google Scholar] [CrossRef]
  21. Gawatre, D.W. Advantages of Waste—Phosphogypsum in Concrete. IJSR-Int. J. Sci. Res. 2012, 2. [Google Scholar]
  22. Al Qadi AN, S.; Khedaywi, T.S.; Haddad, M.A.; AlRababa’ah, O.A. Investigating the effect of olive husk ash on the properties of asphalt concrete mixture. Ann. Chim.-Sci. Matériaux 2021, 45, 11–15. [Google Scholar] [CrossRef]
  23. Wang, Z.; Ma, X.; Pan, H.; Yang, X.; Zhang, X.; Lyu, Y.; Liao, W.; Shui, W.; Wu, J.; Xu, M.; et al. Investigating effects of phosphogypsum disposal practices on the environmental performance of phosphate fertilizer production using emergy analysis and carbon emission amounting: A case study from China. J. Clean. Prod. 2023, 409, 137248. [Google Scholar] [CrossRef]
  24. Chen, G.; Yao, N.; Ye, Y.C.; Fu, F.H.; Hu, N.Y.; Zhang, Z. Influence of partial cement substitution by ground blast furnace slag on the mechanical properties of phosphogypsum cemented backfill. Environ. Sci. Pollut. Res. 2023, 30, 102972–102985. [Google Scholar]
  25. Chen, Q.S.; Sun, S.Y.; Wang, Y.M.; Zhang, Q.L.; Zhu, L.M.; Liu, Y.K. In-situ remediation of phosphogypsum in a cement-free pathway: Utilization of ground granulated blast furnace slag and NaOH pretreatment. Chemosphere 2023, 313, 11. [Google Scholar] [CrossRef]
  26. Pu, S.Y.; Zhu, Z.D.; Huo, W.W. Evaluation of engineering properties and environmental effect of recycled gypsum stabilized soil in geotechnical engineering: A comprehensive review. Resour. Conserv. Recycl. 2021, 174, 105780. [Google Scholar] [CrossRef]
  27. Silva, L.F.O.; Oliveira, M.L.S.; Crissien, T.J.; Santosh, M.; Bolivar, J.; Shao, L.; Dotto, G.L.; Gasparotto, J.; Schindler, M. A review on the environmental impact of phosphogypsum and potential health impacts through the release of nanoparticles. Chemosphere 2022, 286, 131513. [Google Scholar] [PubMed]
  28. Qin, X.; Cao, Y.; Guan, H.; Hu, Q.; Liu, Z.; Xu, J.; Hu, B.; Zhang, Z.; Luo, R. Resource utilization and development of phosphogypsum-based materials in civil engineering. J. Clean. Prod. 2023, 387, 135858. [Google Scholar] [CrossRef]
  29. Yang, Q.; Xiang, Z.; Liu, T.; Deng, C.; Zhang, H. Study on the Mechanical Properties of Cast-In-Situ Phosphogypsum as Building Material for Structural Walls. Materials 2023, 16, 1481. [Google Scholar] [CrossRef]
  30. Diwa, R.R.; Tabora, E.U.; Palattao, B.L.; Haneklaus, N.H.; Vargas, E.P.; Reyes, R.Y.; Ramirez, J.D. Evaluating radiation risks and resource opportunities associated with phosphogypsum in the Philippines. J. Radioanal. Nucl. Chem. 2021, 331, 967–974. [Google Scholar]
  31. Ma, L.; Zhang, H.; Wang, X.; Chen, L. Application and Development Prospects of Phosphogypsum in Different Phases: A Review. Preprints 2023, 2023091677. [Google Scholar] [CrossRef]
  32. Sun, Q.Q.; Xu, W.; Huang, Q.L.; Ma, R.; Zhang, J.H.; Ji, H.X.; Yao, S.; Hui, Y.; Lin, J.C.; Ren, Q.F.; et al. Recovery and reuse of phosphogypsum: Effect of ternary cementitious materials on the performance of phosphogypsum pavement base layers. Constr. Build. Mater. 2024, 433, 13. [Google Scholar] [CrossRef]
  33. Sun, C.Y.; Zhang, J.; Yan, C.W.; Yin, L.Q.; Wang, X.X.; Liu, S.G. Hydration characteristics of low carbon cementitious materials with multiple solid wastes. Constr. Build. Mater. 2022, 322, 13. [Google Scholar] [CrossRef]
  34. Xiao, Y.; Tan, Y.Z.; Zhou, C.L.; Sun, W.J.; Sun, D.; Yuan, H.; Xing, D.L. Utilisation of silica-rich waste in eco phosphogypsum-based cementitious materials: Strength, microstructure, thermodynamics and CO2 sequestration. Constr. Build. Mater. 2024, 411, 11. [Google Scholar] [CrossRef]
  35. Qi, W.Y.; Duan, G.; Han, Y.J.; Zhao, Q.X.; Huang, Y.L.; Zhu, W.H.; Pang, H.T.; Zhang, J.H. Comparison of mechanical properties and microstructure of GGBS-based cementitious materials activated by different combined alkaline wastes. Constr. Build. Mater. 2024, 422, 134469. [Google Scholar] [CrossRef]
  36. Dhalape, P.; Sathe, S.; Dekhane, C. An experimental study on cement concrete with industrial fly ash and phosphogypsum. Mater. Today Proc. 2023, 77, 717–723. [Google Scholar] [CrossRef]
  37. Bandopadhyay, A. Improvement of expansive soils mixed with red mud and phosphogypsum. Arab. J. Geosci. 2023, 16, 322. [Google Scholar] [CrossRef]
  38. GB50010-2010; Code for Design of Architecture & Concrete Structures. China Architecture & Building Press: Beijing, China, 2010.
  39. Niu, Y.; Wang, W.; Su, Y.; Jia, F.; Long, X. Plastic damage prediction of concrete under compression based on deep learning. Acta Mech. 2024, 235, 255–266. [Google Scholar] [CrossRef]
Figure 2. Test loading device and displacement gauges.
Buildings 15 01122 g002
Figure 3. Test setup diagram.
Buildings 15 01122 g003
Figure 4. Distribution of cracks in the specimen plate.
Buildings 15 01122 g004
Figure 5. External load–midspan deflection curve.
Buildings 15 01122 g005
Figure 6. Load–strain curves at concrete midspan measurement points.
Buildings 15 01122 g006
Figure 7. Load–strain curve of prefabricated bottom plate truss web members.
Buildings 15 01122 g007
Figure 8. Schematic diagram of the relationship between ultimate load and strain of laminated plates.
Buildings 15 01122 g008
Figure 9. Schematic diagrams of the steel truss model and the finite element assembly model.
Buildings 15 01122 g009
Figure 10. Uniaxial stress–strain curve for concrete.
Buildings 15 01122 g010
Figure 12. Model load–displacement diagram.
Buildings 15 01122 g012aBuildings 15 01122 g012b
Figure 13. Stress contour of model.
Buildings 15 01122 g013
Table 2. Concrete test block test results (MPa).
Parameter0% Phosphogypsum Dosage2% Phosphogypsum Dosage
Compressive strength fc42.1940.38
Split compressive strength fts4.174.04
Axial compressive strength fcp33.06031.470
Modulus of elasticity Ec33,08632,687
Poisson’s ratio μ0.1900.190
Table 3. Mechanical properties of steel reinforcement used in the study.
Performance ParametersCPB550 SteelHRB400 Steel
Yield stress/MPa-400
Strength design value/MPa360360
Ultimate stress/MPa550540
Modulus of elasticity/MPa2.00 × 1052.00 × 105
Flexural strength/MPa550400
Modulus of rupture/MPa200200
Table 4. Comparison of cracking loads for composite slabs.
Serial Number M c r , c
k N / m 2
M c r , t k N / m 2 Construction   Standard   Load k N / m 2 M c r , c M c r , t
D1-15.624.794.750.85
D1-25.134.844.750.94
D1-35.796.114.751.06
D1-45.405.294.750.98
D1-55.645.754.751.02
Disclaimer/Publisher’s Note: The statements, opinions and data contained in all publications are solely those of the individual author(s) and contributor(s) and not of MDPI and/or the editor(s). MDPI and/or the editor(s) disclaim responsibility for any injury to people or property resulting from any ideas, methods, instructions or products referred to in the content.

