Article

Environmental Impacts of Light Sources in Buildings: Analysis of Environmental Product Declarations (EPDs) in European Union

by
Endrit Hoxha
1,*,
Seyed Morteza Hosseini
2,*,
Bernardette Soust-Verdaguer
3 and
Jan de Boer
4
1
Department of the Built Environment, Aalborg University Copenhagen, A.C. Meyers Vænge 15, 2450 Copenhagen SV, Denmark
2
Department of Architecture, Design & Media Technology, Aalborg University Copenhagen, A.C. Meyers Vænge 15, 2450 Copenhagen SV, Denmark
3
Instituto Universitario de Arquitectura y Ciencias de La Construcción, University of Seville, 41004 Sevilla, Spain
4
Fraunhofer Institute of Building Physics, 70569 Stuttgart, Germany
*
Authors to whom correspondence should be addressed.
Buildings 2025, 15(8), 1279; https://doi.org/10.3390/buildings15081279
Submission received: 7 March 2025 / Revised: 9 April 2025 / Accepted: 11 April 2025 / Published: 14 April 2025
(This article belongs to the Special Issue Lighting in Buildings—2nd Edition)

Abstract

:
Benchmark studies of the environmental impacts of buildings often overlook the contribution of lighting systems. This omission presents a significant knowledge gap, especially given the growing focus on energy-efficient technologies and sustainable building designs. To address this gap, the life cycle assessment method was used to calculate the environmental impacts of lighting systems, focusing on the Global Warming Potential (GWP) indicator. An in-depth review of databases and programs across the 27 European Union member states was also conducted. The study analyzed both the absolute and relative contributions of lighting systems to the overall environmental impacts of buildings, with a specific focus on the situation in Denmark. A total of 101 Environmental Product Declarations (EPDs) covering 753 LED lighting products were identified. Material-related impacts accounted for 1–12% of the total GWP, while energy used during operations contributed 6–24%. These results emphasize the importance of both embodied and operational impacts. Improving the luminous efficacy of lighting systems emerges as a more effective and feasible strategy to reduce a building’s GWP than lowering overall energy use or grid carbon intensity. In countries with high-carbon electricity, reducing the operational impacts is critical. Elsewhere, selecting lighting systems with low embodied impacts is also essential.

1. Introduction

The European Union aims to reduce greenhouse gas (GHG) emissions drastically to 1990 levels [1], for which the building sector is responsible for over one-third [2]. The rapid increase in global floor area and rising affluence have significantly increased the demand for thermal and visual comfort by buildings’ occupants. This demand has substantially increased energy consumption and related greenhouse gas emissions [3]. Therefore, building energy consumption encompasses various factors such as lighting, heating, domestic hot water, air conditioning, and cooling [4]. Electric lighting constitutes a significant proportion of this consumption, accounting for approximately 11% and 4% of total electricity use in the commercial and residential sectors, respectively [5].
A review of the relevant literature on the energy consumption of electric lighting reveals that most recent studies have focused on integrated lighting systems [6,7]. These systems combine daylighting strategies with conventional and smart lighting technologies [8] to optimize energy efficiency. For example, a study by Iatauro and Zinzi [9] revealed that using dynamic climate-based simulations instead of the EN15193-1 [10] standard can reduce annual lighting energy consumption by 62–78%. A similar study by [11] investigated the integration of LED dimming control with interactive kinetic louvers, utilizing occupant detection and estimation to enhance visual comfort, daylight performance, and electric energy consumption simultaneously. The results indicate that this parametric approach reduces the energy consumption of electric lighting by approximately 99% compared to the lighting occupancy profile of the ASHRAE 90.1 standard (ASHRAE, Peachtree Corners, GA, USA). A related study [12] demonstrated that implementing daylight-concentrating indoor louvers, integrated with LED-linked dimming control, resulted in an 86% reduction in the energy consumption of electric lighting, particularly during the transitional season. In the study [13], it was found that vertical tubular daylighting devices (TDDs), combined with LED and a dimming control system, could reduce the energy consumption of electric lighting by up to 21% in deep-plan office buildings located in hot desert climates. According to Albu et al. [14], reimplementing daylight system control in the case studied reduced the operational energy use by 25% to 75%. However, due to the high impact over the lighting’s lifetime, the GWP reduction was limited to approximately 10%.
However, few studies have assessed the environmental impacts of lighting systems on electric energy use in buildings. Two groups of studies can be identified, which are classified into smart and conventional lighting systems. The first research category investigates various types of lighting and employs both occupancy detection and sensor-based optimization to reduce electric energy consumption significantly. Notably, there is substantial potential for energy savings in electric lighting, with approximately 30% achievable by replacing Compact Fluorescent Lamps (CFLs) with smart light-emitting diodes (LEDs). Additionally, the integration of smart lighting systems with LEDs has been found to reduce energy consumption by up to 40% in residential buildings in Sweden [8].
The second category mostly focuses on conventional lighting systems by replacing different types of lights with high-performance LEDs. Studies conducted in various countries, including China, Malaysia, Turkey, Bangladesh, and Brazil, on educational, residential, and industrial building types confirmed the effectiveness of replacing traditional lighting with LED. These studies demonstrate significant reductions in lighting energy consumption and carbon emissions. A study conducted in China investigated the impact of replacing incandescent light bulbs with compact fluorescent lights (CFLs) on household lighting electricity usage. The research considered various factors, including different room types, daily lighting usage patterns, the number of light bulbs per household and room, and seasonal variations. The findings revealed that this intervention reduced lighting energy consumption by 23% to 27% [15]. A comparative study between CFL and LED luminaires found that LED luminaires reduced greenhouse gas emissions and cumulative energy demand by 41–50%, mainly due to their high energy efficiency [16]. Another study examined the energy benefits of LED adoption in Malaysia by reviewing the relevant research papers and conducting a life-cycle assessment. The findings indicated that replacing 62% of incandescent lamps with LEDs in residential buildings could result in an 80% reduction in carbon emissions and 85% in electricity bills [17]. A similar intervention in an industrial building in Bangladesh demonstrated a decrease in lighting energy usage within a range of 7% to 15%, which resulted in a 51% reduction in carbon emissions [18]. Enhancing conventional lighting systems in historical and educational buildings in Turkey by replacing incandescent halogen lamps and fluorescent tube lights with LEDs resulted in significant energy savings. Specifically, this intervention led to a 78% reduction in electric energy consumption in historical buildings [19] and a 68% reduction in educational buildings [20]. Moreover, a study conducted in Brazil investigated the reduction in electric energy consumption in an educational building by retrofitting fluorescent tube lights with LEDs. Life-cycle assessment (LCA) and field-study measurements indicated a 34% reduction in lighting energy consumption and a 33% decrease in carbon emissions [21]. A similar intervention in Serbia showed that replacing lighting systems could achieve savings of 53% to 62%, with an average payback period of about four years for the analyzed schools [22]. Due to the superior luminous efficacy of LED luminaires compared to conventional lighting technologies, they are considered an environmentally sustainable lighting solution [23]. However, a limited number of studies have been focused on analyzing the environmental impacts of lighting systems. Using the Product Environmental Footprint (PEF) methodology, Wu and Su assessed the environmental impacts of an LED low-bay industrial luminaire [24]. Welz et al. compared the environmental impacts of four different lighting technologies: the tungsten lamp, the halogen lamp, the conventional fluorescent lamp, and the compact fluorescent lamp. They confirmed that the fluorescent lamps had lower environmental impacts compared to the other technologies [25].
In summary, research studies that focus exclusively on lighting types and systems primarily address energy efficiency and the resultant reduction in carbon emissions within the scope of electric lighting use. These studies often overlook the contribution of lighting to the overall energy use intensity and the environmental impact of the entire building. They do not consider the comprehensive impact of different lighting types on the building’s performance. In addition, these studies neglect the analysis of Environmental Product Declarations (EPDs). Therefore, new research is needed to investigate these effects on the building scale and compare their environmental impacts with the impacts of building fabric, heating, and ventilation systems.
To address this knowledge gap, this study will extensively review the actual state of the published EPDs of lighting systems and analyze their impacts when installed in each of the 27 European Union member states. Furthermore, the study focuses on assessing the impacts of the materials composing the lighting (embodied impacts) and those related to energy consumption during the operational stage (operational impacts). Then, the environmental impacts of lighting are tested for probable correlation with the luminous efficacy of each solution. Finally, the absolute and relative contribution of lighting to the overall impact of buildings is calculated.

2. Materials and Methods

The contribution of the lighting to the overall impacts of buildings was calculated following a three-step methodology. First, the information related to the environmental impacts of various lighting systems was obtained through an extensive search in the EPDs database and programs published in a European context. After being complied, the data were normalized and analyzed. Then, through a building case study, the impacts of all lighting systems and their absolute and relative contributions were assessed.

2.1. Data Collection

The data collection process started by identifying databases and programs with information related to the environmental impacts of lighting in the European context. A total of eighteen national databases [26,27,28,29,30,31,32,33,34,35,36,37,38,39,40,41,42,43] and seven programs [44,45,46,47,48,49,50] were identified. Since this study was an extension of previously published research, the method of identifying lightings’ environmental product declarations (EPDs) was similar to that in [51]. The inclusion criteria for the data to be collected were that the information must have been published in open-access EPDs, and only for systems providing lighting functions. Datasets related to lighting used for other purposes, such as evacuation systems, decoration, lighting roads, etc., were not included for further analysis. After a detailed, in-depth search within the databases and programs, 101 open-access EPDs were identified, representing 753 various LED lighting systems, mainly published in French, Danish, Belgian, German, and Dutch databases. For all EPDs, extraction information was collected manually by checking all PDF files. This information included the GHG emissions calculated through the global warming potential (GWP) indicator for all life-cycle stages according to EN-15804 [52]: production (A1–A3), transport (A4), assembly (A5), use (B1), maintenance (B2), repair (B3), replacement (B4), refurbishment (B5), deconstruction (C1), transport (C2), waste processing (C3), disposal (C4), and load beyond the system boundary (D). The impacts of these product life-cycle stages are necessary to recognize the embodied impact related to the materials used to produce the lighting systems. In addition, information related to power, luminosity, reference service life, and declared units was collected mainly to calculate the environmental impacts of the operational stage (B6) of lighting systems.

2.2. Data Normalization, Classification, and Analysis

To enable the comparison of the lighting systems in terms of the environmental impacts and to facilitate their use in assessing building impacts, their normalization is necessary under the same unit. For these reasons, in this study, we have followed the recommendations of the PEP Ecopassport (Paris, France) [30], which recommends providing the impacts of lighting under a functional unit of 1000 lumens over 35,000 h of use. This functional unit is not intended to describe the real luminosity or the working hours of the lighting, which is set in line with unit normalization so as to enable comparison between the various solutions. It should be stressed that most of the EPDs already provide the impacts under that functional unit, while we need to normalize the impacts for the rest. The normalization of data could be classified as normalizing those data concerning the embodied impacts that represent those from the processes the materials underwent from the production of the lighting system to their elimination at the end of life, and the impacts of the operational phase representing normalization from the use of the lights. First, the reference service life provided for each type of lighting was converted into hours of use. This information was then used to divide the embodied impacts of lighting, which were multiplied by 35,000, representing the hours of use. The information related to the power of each lighting system was multiplied by 35,000 to obtain the energy required in kWh to operate the light under the declared functional unit. The conversion of energy consumption by lighting in impacts was made possible by multiplying the carbon content of the electricity grid provided in kg CO2 e/kWh [53]. Detailed information related to all the GWP scores of each lighting system under the normalized functional unit is provided in Supplementary Materials. In addition, the Supplementary Materials provides information on all the other extracted information related to lighting. The environmental impacts of lighting systems and their luminous efficacy were also analyzed. To that end, four categories were created based on the literature. All lighting with a luminous efficacy of up to 50 lm/W was grouped like the low-performance ones grouped in the first category. In the second section, lighting with a luminous efficacy of 50 and 100 lm/W was categorized as a medium performance. The third high-performance lamp had a luminous efficacy between 100 and 150 lm/W, and the last with a larger luminous efficacy was considered as high performance.

2.3. Life-Cycle Assessment

The four-step scientific validation method of life-cycle assessment (LCA) was applied to assess a building’s environmental impacts by following the EN15978 [54] norm. In the first step in calculating the applied attributional LCA, goal and scope were defined as the functional unit the system boundary of the study and the environmental indicator to be calculated. The functional unit representing a quantified description of the primary function of the building was defined as a one-square meter gross floor area (GFA) per year for a reference service life of 50 years [55]. The system boundary of the study, which in the LCA indicates the related materials, processes, and energy included in the assessment of impacts, was limited to the building’s life-cycle stages of production (A1–A3), replacement (B4), operational energy use for heating, cooling ventilation and energy used for artificial lighting (B6), waste processing (C3), and disposal (C4). Foundations, external walls, windows, roof, intermediate slabs, internal walls, doors, and the lighting system are other ways of building product and material decomposition [56] considered within the system boundary of the study. Given the exploratory objectives of this study and the urgent nature of the climate change problem, then, the assessments were focused only on the environmental indicator of global warming potential (GWP). However, it deserves to be stressed that the process for the assessment of another environmental indicator is similar, and all links to the data sources are fully provided. The second step in the LCA dealing with life-cycle inventories involves collecting foreground and background data. The foreground data generating the information related to the materials and products employed in the buildings were extracted from the BIM model. The reference service lives used to calculate the impacts for the replacement (B4) of materials or products during the building’s operational stage were obtained from the generic Danish data [57]. Full details related to the BIM model, the extraction of data, and the hypothesis for the calculation of the environmental impacts of building fabrics are provided in [58]. For the background data containing information related to the impacts, in our case, the kg CO2 e per unit material changed between the generic OKOBAUDAT library and the Danish EPD library. The life-cycle inventory for lighting systems has been treated slightly differently compared to that for building fabric. Since the building project assessed in this study has not undergone any energy used for artificial lighting simulations due to the lack of regulation by norms, as in the case of Denmark, then certain assumptions and hypotheses needed to be made. The quantities of lighting systems have been calculated in relation to the minimum amount of luminosity for a specific area, which, in the case of residential buildings, was equal to 500 lux [59]. The energy requirement during the building’s operational stage and the user profile given in [60] were taken into account. We considered two scenarios for the carbon content of electricity for energy used for artificial lighting. The first scenario assumed a constant carbon content of the electricity grid over time, equal to that of 2020. The second scenario considered a progressive scenario, which assumed a decarbonization pathway for the electricity grid over time. In the third step of the LCA, the impact assessment, the IPCC impact assessment method, was used to calculate the GWP indicator [61]. In the last interpretation step of the LCA, the analyses were focused on the contribution of the lighting systems to the overall impacts of buildings and variations of the share as a function of their luminous efficacy.

3. Case Study

A residential building with a gross floor area of 2572 m2 situated in Denmark was considered for the investigation of the environmental impacts of lighting systems. Figure 1 shows the information regarding the building related to the share of areas used for specific purposes, occupancy profiles, and the minimum required luminosity recommended in the norm [59]. The building previously analyzed in [58] had a wooden structure and was chosen as a very appropriate project for the aim of this explanatory study. The reason behind this is that this building had a low GWP score, making it a future representative project able to reach the limit values set by the Danish government to limit greenhouse gas emissions from the construction industry (1). The building had a modular construction with prefabricated insulated elements requiring only connection at the site. The envelope was supported by concrete foundations insulated with polystyrene. The building elements had very low thermal transmission coefficients (U-values) ranging from 0.06 W/(m2 K) to 0.17 (W/m2 K). The demand of 21.3 kWh/m2/year of heating for the building was assured through a district connection. The electricity was partially supported by 77 m2 photovoltaic panels and partly by 28.1 kWh/m2/year from the grid. A detailed description of the case study, the materials and components employed, and all other details are described in [58].

4. Results

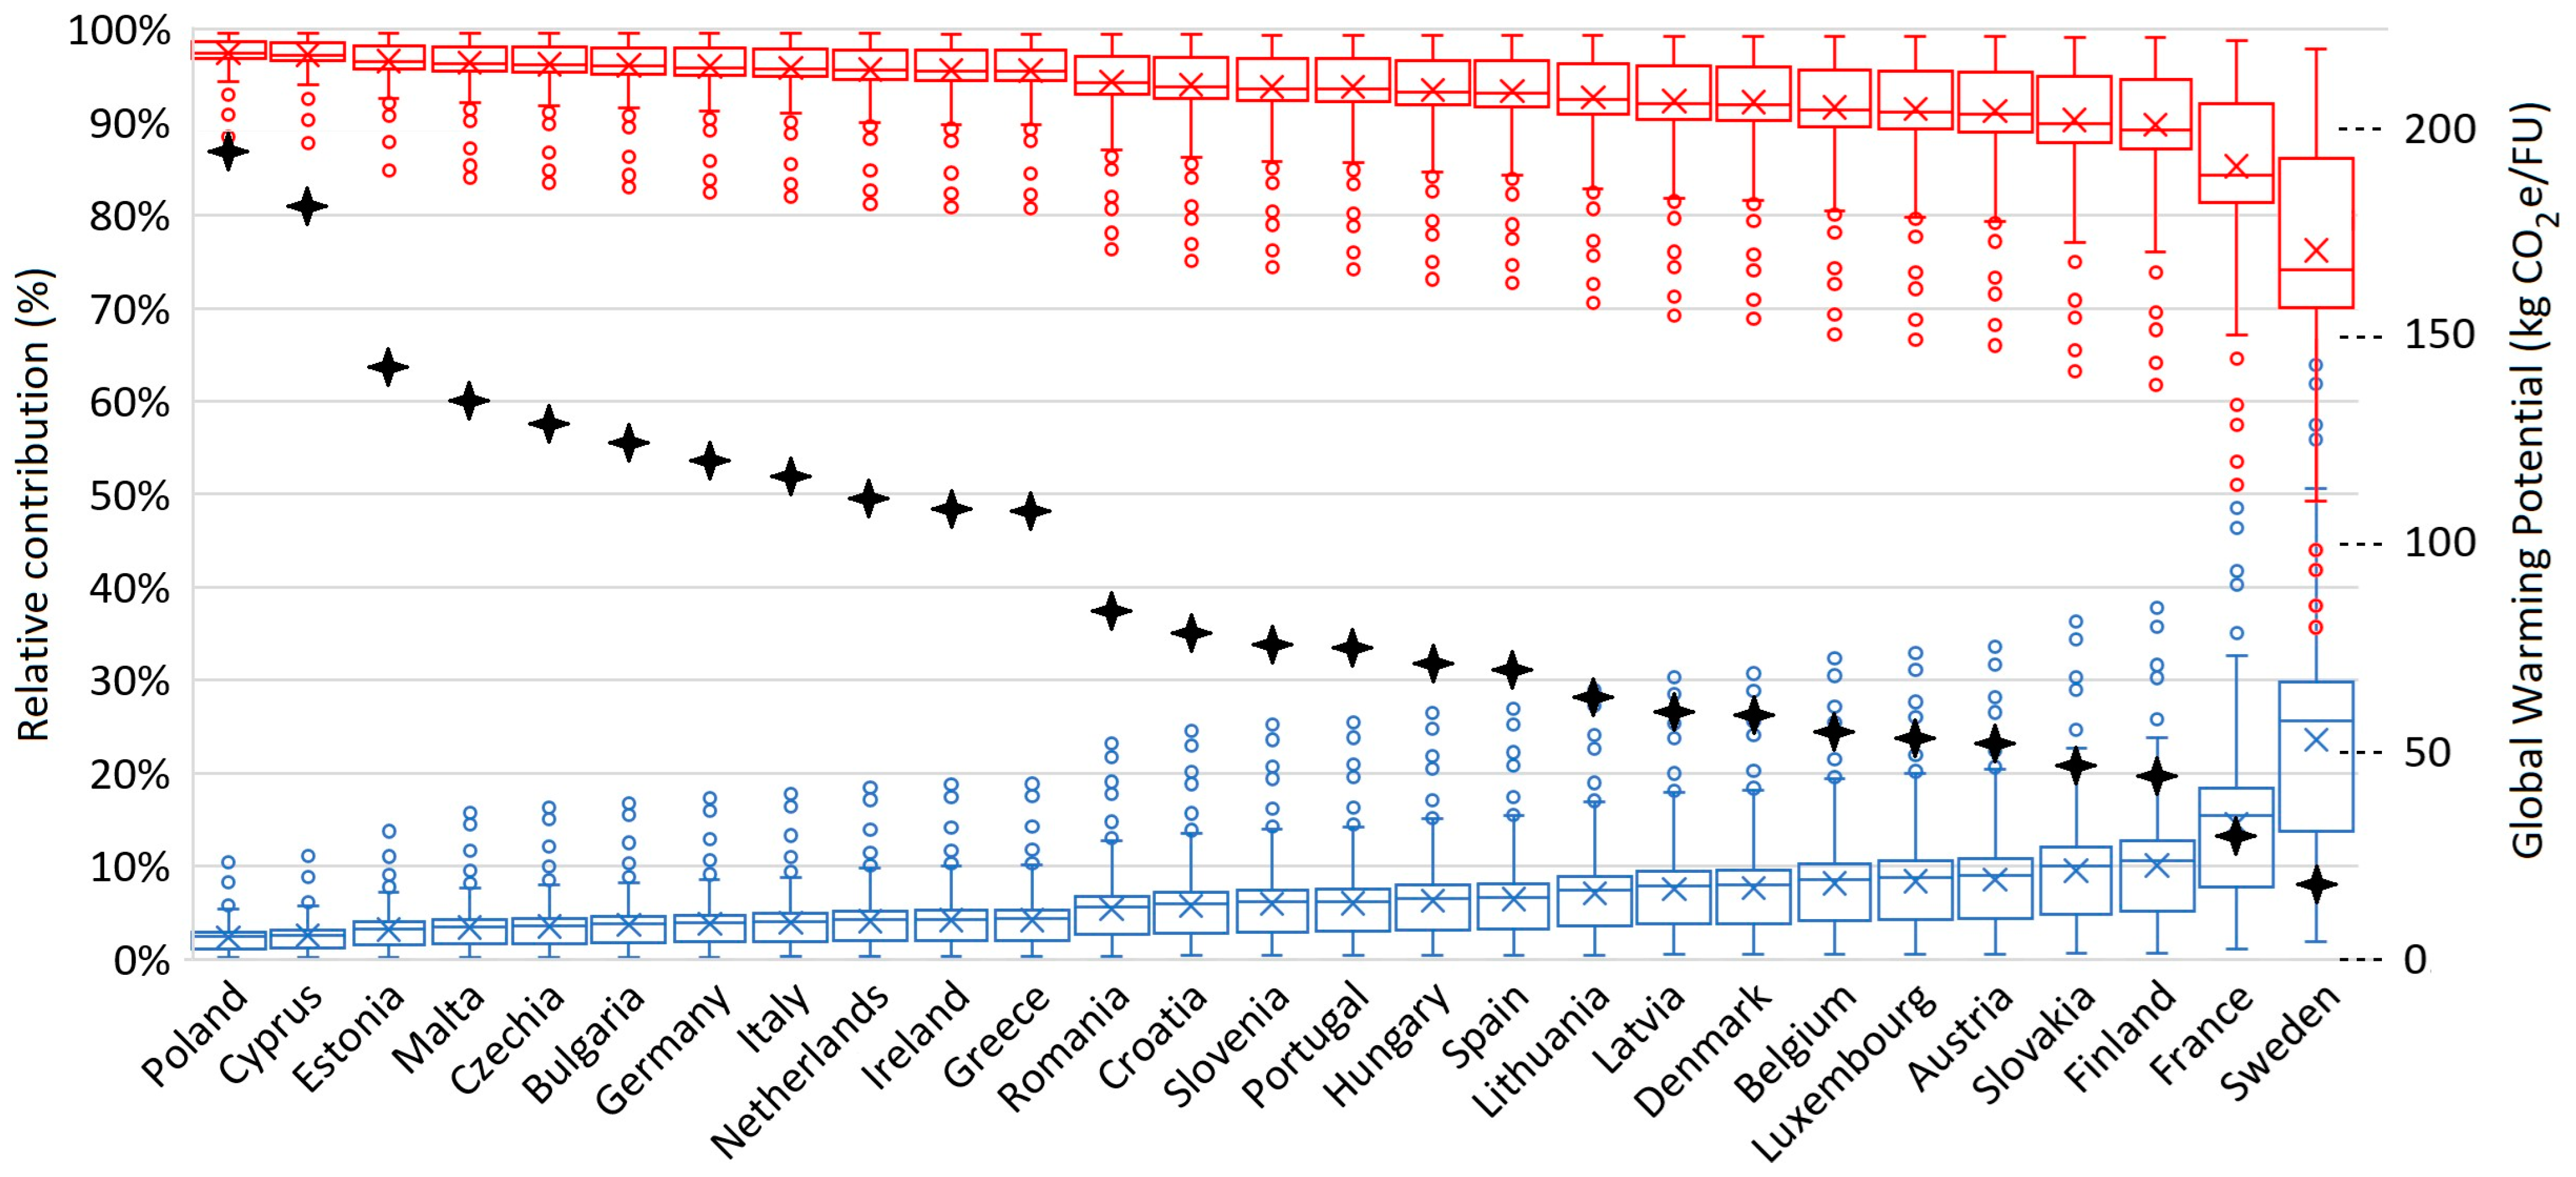
Figure 2 summarizes the absolute values of the GWP indicator of all lighting systems per functional unit (FU) by providing 1000 lumens for 35,000 h, as considered to be operating in the EU-27 member states. Furthermore, the results show the relative share of the embodied and operational impacts of energy used for artificial lighting, listed in decreasing order of electricity grid decarbonization. From the situation in Poland, as the case with the most carbonized electricity grid, on average, the impact of lighting systems was equal to 194 kg CO2 e/FU, while in Sweden, the average impact was equal to 18.2 kg CO2 e/FU, being the country with the least carbonized electricity. This difference in results between the impacts of lighting systems as operating in different countries shows the possibility of reducing the impacts by a factor of ten in the case of a reduction in the carbon content of the electricity grid. Regarding relative contributions, the embodied impacts in the Polish case were on average equal to 2%, with a variation between 0% and 10% depending on the function of the lighting type and its luminous efficacy. For Sweden, on average, the embodied impacts were equal to 24%, with a variation between 2% and 64%. Consequently, in the case of other EU-27 countries, the relative contribution of the embodied impacts varied between 1% and 64%.
The analysis of the results indicated the presence of a few outliers in terms of impacts. Their embodied impacts are more dominant than those of operation. The reasons for this were either that they had very high luminous efficacy, reducing their need for operating energy, or that the materials used in their production were heavy in terms of GHG emissions. It should be stressed that Poland, Cyprus, Estonia, Malta, Czechia, Bulgaria, Germany, Italy, the Netherlands, Ireland, and Greece show results above the average European level. In these countries, the energy used for artificial lighting accounts for over 95% of the impacts, making it the dominant factor. Therefore, efforts to reduce impacts should focus on minimizing energy used for artificial lighting needs or using low-carbon energy sources like photovoltaic panels. For other countries, the share of their lighting systems’ embodied impacts could be considered relatively significant. Consequently, to reduce the impacts of lighting systems in these cases, building designers should not only minimize electrical energy needs and use low-carbon energy sources, but also carefully select systems with low embodied impacts.
Based on these results, we can conclude that the decarbonization of the electricity grid can drastically reduce the environmental impacts of energy used for artificial lighting and should be prioritized in several European countries. The implementation of low-carbon energy sources like photovoltaic panels is of primary importance. In this vein, with an improved carbon content of the electricity grid, the relative contribution of the embodied impacts related to lighting systems becomes more significant, making it the next target for improving the GWP score. However, the minimization of lighting system impacts is a function of both their luminous efficacy and the carbon content of the electricity grid.
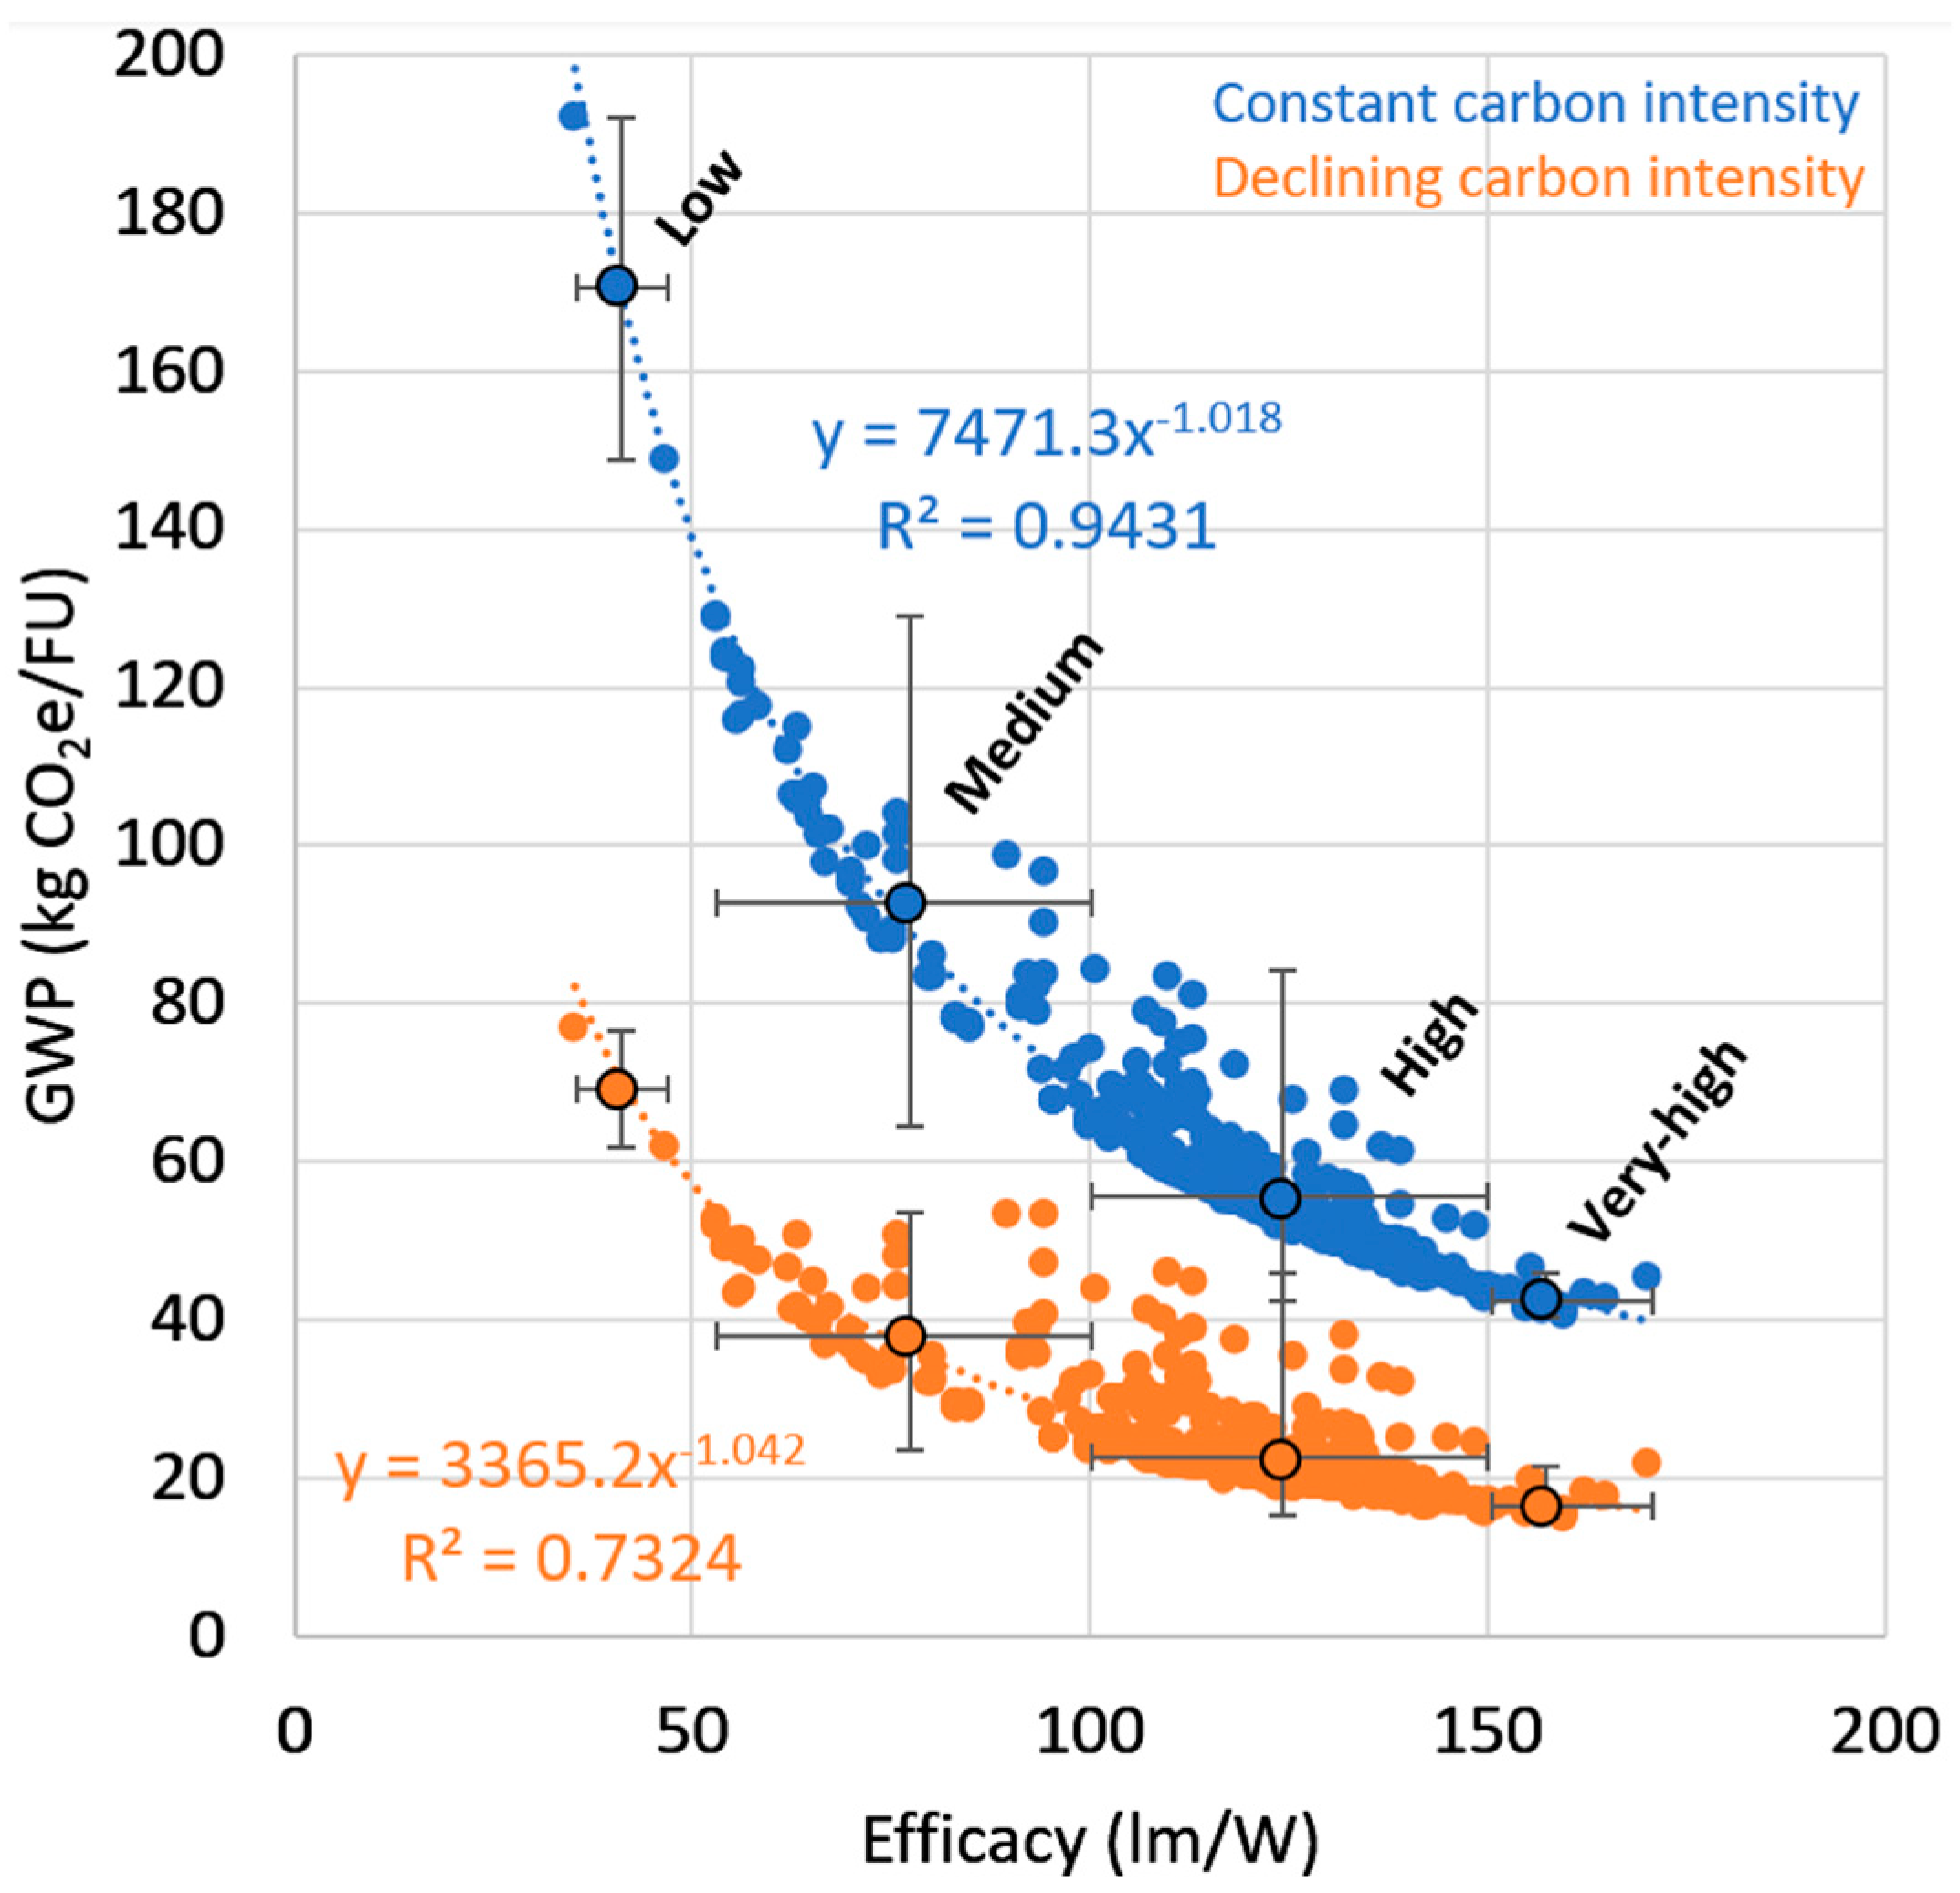
Since the subject of operational energy consumption from energy used for artificial lighting has been extensively analyzed in previously published studies, in this research, we investigated the minimization of lighting system impacts in relation to their luminous efficacy and the carbon content of the electricity grid. Given the limitations of data related to the progression of the carbon content of the electricity grid for several EU-27 countries and the case-study building analyzed here, the next analyses are focused and are representative of the Danish context. To improve the understanding of the influence of these factors and their relationship to the GWP indicator, Figure 3 shows the correlation between the lighting system impacts and luminous efficacy under two scenarios. One scenario assumes a constant carbon content of the electricity grid over time, while the second considers its progressive decarbonization. The results showed a strong correlation between the GWP score and the lighting luminous efficacy in both scenarios. This correlation follows an exponential decrease equation, with Pearson correlation coefficients of R = 0.97 and R = 0.86 for the constant and progressive improvement of electricity grid carbon content, respectively.
In the first scenario, which assumed a constant carbon content of the electricity grid over time, the GWP score from lighting systems with different luminous efficacy levels fell from 192 kg CO2 e/FU to 40 kg CO2 e/FU. A relative reduction of −480% was calculated due to the minimization of impacts resulting from an increase in lighting luminous efficacy from 35 to 171 lm/W (+488%). Furthermore, under the progressive scenario, which considered the decarbonization of the electricity grid over time, the impacts related to lighting luminous efficacy fell from 77 kg CO2 e/FU to 14.8 kg CO2 e/FU. In this case, a relative minimization of −520% was calculated for the same improvement to lighting luminous efficacy.
Based on these results, it can be concluded that lighting luminous efficacy could be improved by 488%, potentially reducing the GWP score by 480–520%. Analyzing the reduction in the GWP score due to a decrease in the carbon content of the electricity grid, it can be observed that, for the lowest luminous efficacy, the impact was reduced from 192 kg CO2 e/FU to 77 kg CO2 e/FU (−250%). Meanwhile, for the highest lighting luminous efficacy, the reduction was from 40 kg CO2 e/FU to 14.8 kg CO2 e/FU (−270%). Consequently, improving the grid’s carbon content could reduce the GWP score by 250–270%. These findings suggest that enhancing lighting luminous efficacy is more effective than decarbonizing the electricity grid to minimize the GWP score of lighting systems.
A deeper analysis for a further classification of lighting luminous efficacy improvements is presented in Figure 3, which highlights four groups: low-, medium-, high-, and very-high-performance LEDs. In the first scenario, where the carbon content of the electricity grid remained constant over time, the impacts of low-performance LEDs ranged between 149 and 192 kg CO2 e/FU, indicating a variation of 43 kg CO2 e/FU. For medium-performance LEDs, the impact varied between 65 and 128 kg CO2 e/FU, with a difference of 63 kg CO2 e/FU between the worst and best cases. High-performance LEDs had an impact ranging between 43 and 84 kg CO2 e/FU, with a variation of 41 kg CO2 e/FU. High-performance LEDs showed an impact variation between 39 and 46 kg CO2 e/FU, indicating a range of 7 kg CO2 e/FU. Under the progressive scenario, where the electricity grid’s carbon content fell over time, the impacts of low-performance LEDs ranged between 61 and 76 kg CO2 e/FU, with a difference of 15 kg CO2 e/FU between the worst and best cases. For medium-performance LEDs, the impact varied between 24 to 54 kg CO2 e/FU, with a range of 30 kg CO2 e/FU. High-performance LEDs showed an impact variation between 15 and 46 kg CO2 e/FU, with a difference of 31 kg CO2 e/FU. Lastly, for high-performance LEDs, the impact varied between 15 and 21 kg CO2 e/FU, with a range of 6 kg CO2 e/FU. The results indicated that high-performance LEDs were the lighting system solution with the lowest environmental impacts. However, if a specific type of lighting system with a different luminous efficacy must be used, the results demonstrated significant impact reductions when selecting the optimal solution within a given type of lighting system and luminous efficacy range.
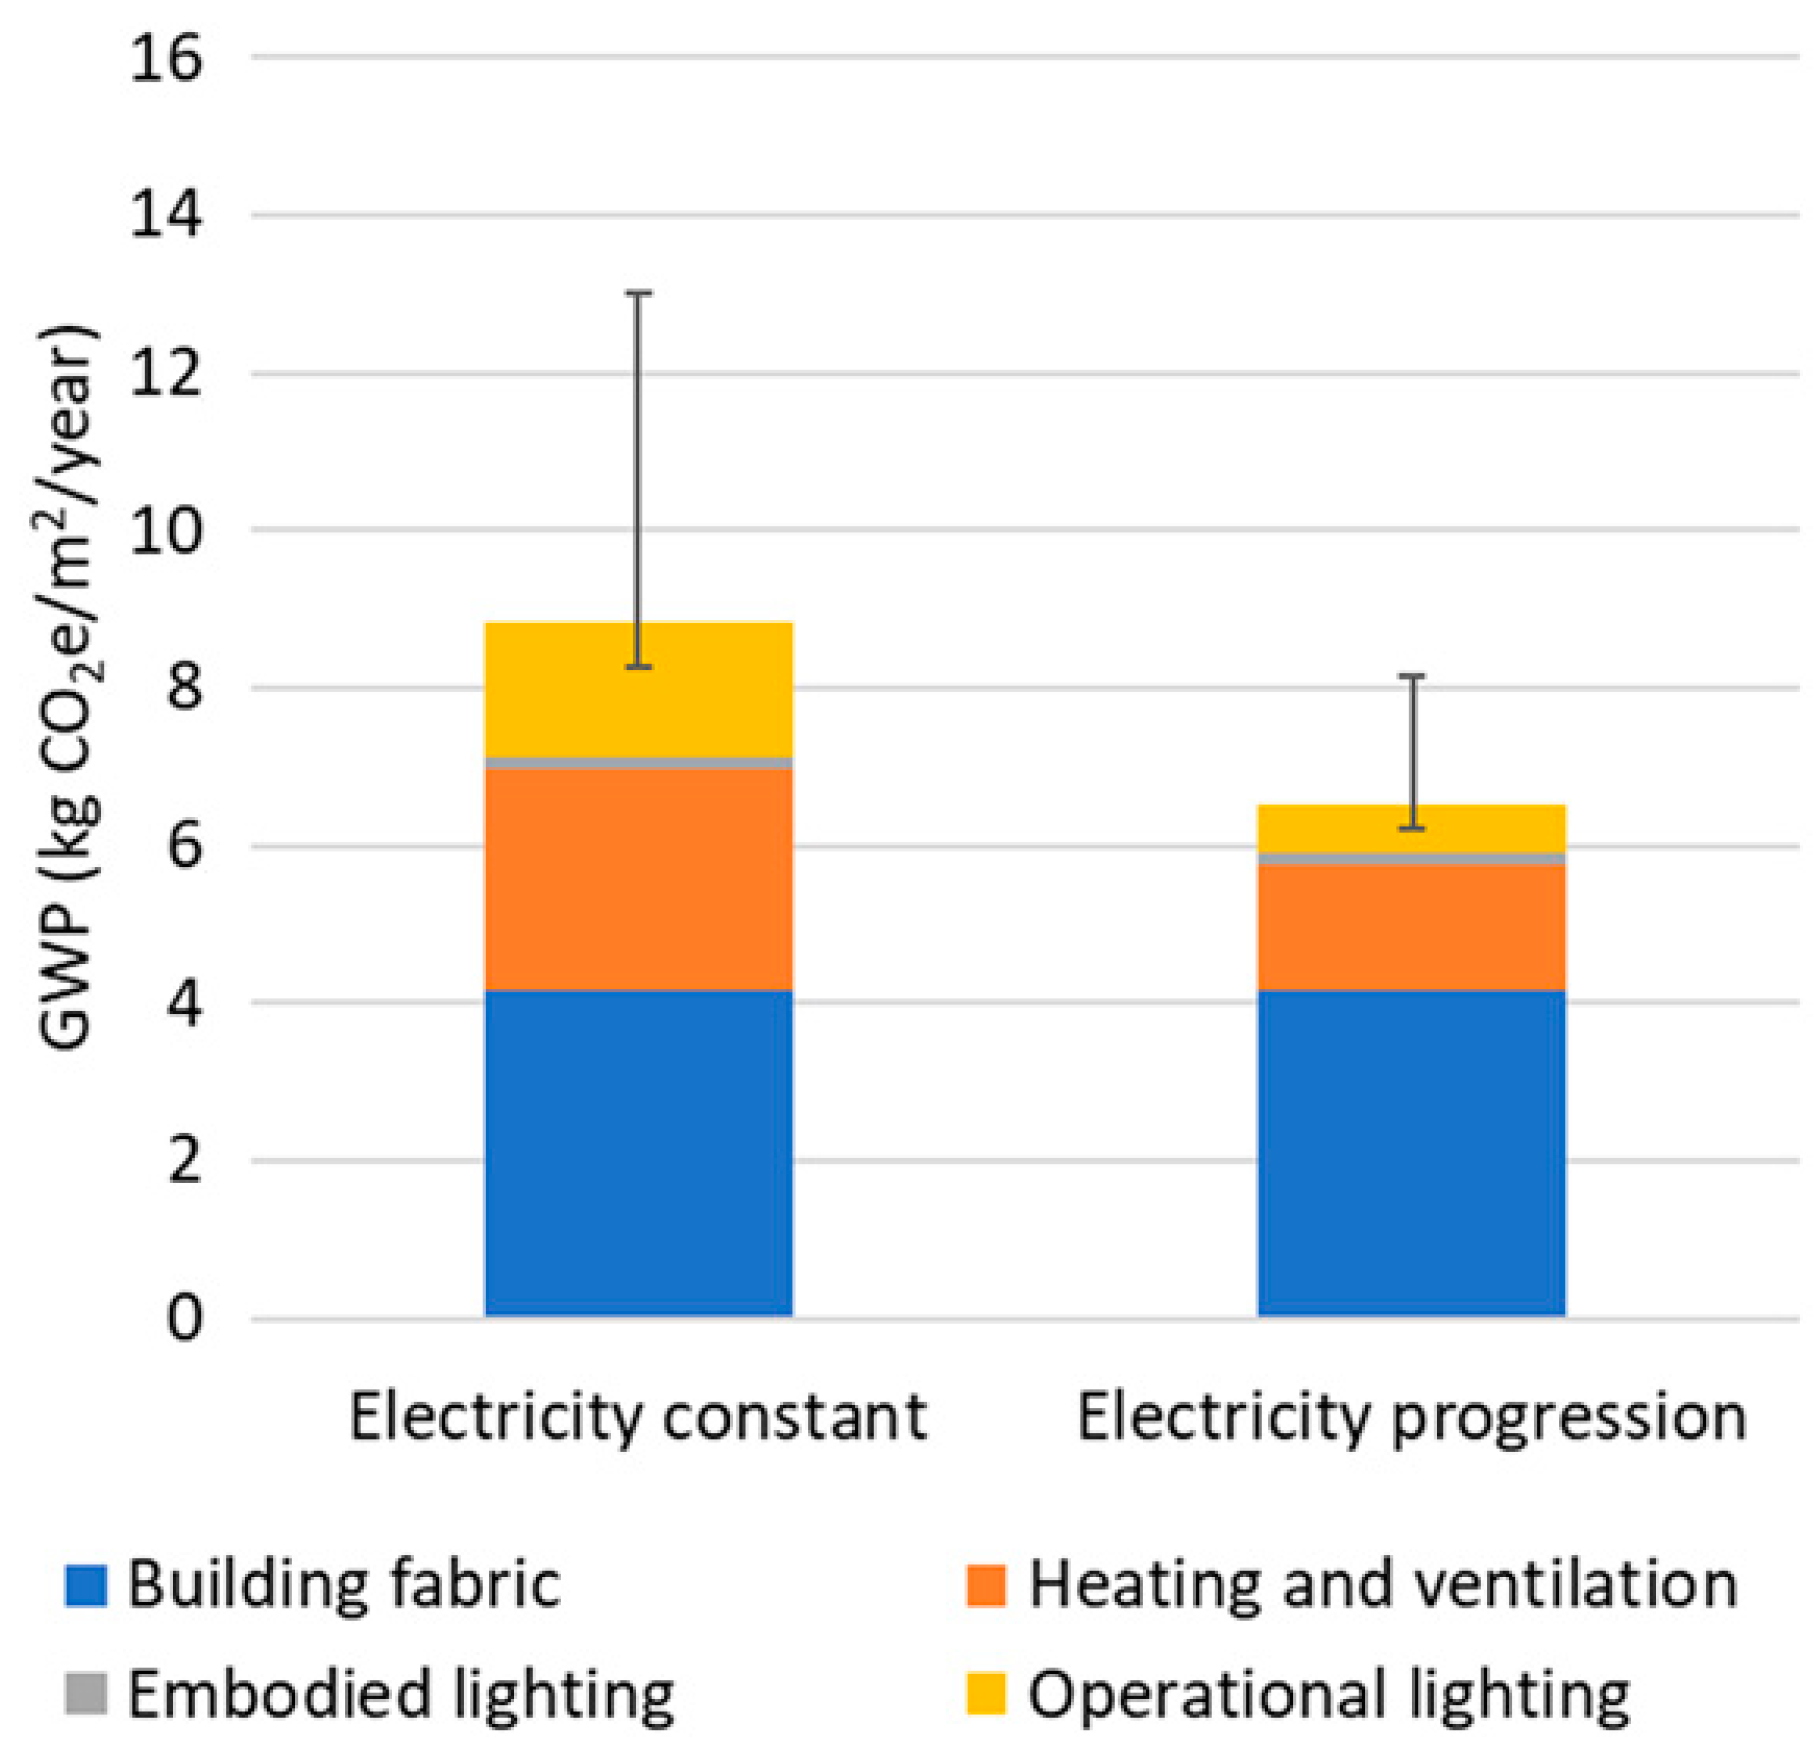
To improve understanding of the impacts of lighting systems on the scale of the building, Figure 4 presents the GWP score of a case study in the scenarios of considering a constant and progressive carbon content of the electricity grid, respectively. Under the first scenario, the average impact of the building was calculated to be 8.8 kg CO2 e/m2/year, with a variation between 8.2 and 13 kg CO2 e/m2/year. The embodied impacts of building fabric and lighting system were respectively equal to 4.18 kg CO2 e/m2/year and 0.15 kg CO2 e/m2/year, contributing 47% and 2% to the overall building impacts. At the same time, the operational impacts for thermal purposes and energy used for artificial lighting were equal to 2.8 kg CO2 e/m2/year and 1.7 kg CO2 e/m2/year, contributing 32% and 19%. In this scenario, the results indicated the larger contribution of the impacts from lighting energy consumption, which deserves prior attention by the designer to reduce the impacts.
Under the progressive decarbonization of the electricity grid scenario, the average impacts of the building were calculated as equal to 6.51 kg CO2 e/m2/year. In this case, based on the type of lighting system employed, the impact of the building varied between 6.23 and 8.16 kg CO2 e/m2/year. Regarding the relative contribution to the overall impacts of building the building fabric, the lighting system, heating and ventilation, and the energy used for artificial lighting were respectively equal to 64%, 2%, 24%, and 9%. Even in this scenario, the average relative contribution of lighting energy consumption was predominant compared to the embodied impacts.
However, concerning the absolute values of the average embodied impacts of the lighting system and operational energy consumption in both scenarios, there is an obvious necessity to reduce them further, given the limit values equal to 0.3 kg CO2 e/m2/year that buildings must reach under Paris agreement which Denmark is committed to achieve [62] (furthermore, the variation in the building impacts of the various lighting systems further stresses the need to reduce their impacts). For this reason, Figure 5 gives detailed results of each lighting system’s absolute and relative contribution to timber buildings under the progressive decarbonization of the electricity grid. Comparing the impacts of the building case study with the limit value of 7.1 kg CO2 e/m2/year [63], in 2025, the new projects must comply with the Danish regulations, of which 3% of scenarios cannot reach. This is mostly for those cases where low-, medium-, and some high-performance systems are considered as lighting system options. Based on these results, we can conclude that the lighting system is a significant target deserving attention to minimize of building impacts to reach the limit targets and comply with Danish regulations related to environmental impacts. In addition, designers should avoid using lamps with the lower 113 lm/W luminous efficacy as lighting system options, since they significantly increase the impact of buildings. The implementation of such options for lighting systems will, in consequence, require the drastic minimization of energy requirements and the implementation of low-carbon sources of electricity. On the other hand, high- and very-high-performance LEDs are the lighting system solutions that, within the framework of the case study building, could help in reaching the limit values. An in-depth analysis of these solutions highlighted the lighting system responsible for 7% and 29% of the overall impacts of buildings. The contribution of embodied impacts was found to be within the range of 1% to 12.5%, while at the operational stage, it fell between 6% and 24%. Based on these results, we can definitively conclude that the impact of lighting systems is significant compared to the impacts of other building components. To minimize lighting system impacts, designers should focus on selecting systems with low embodied impacts and reducing the impact of their operations.

5. Discussion

The study focuses on an extended review of the open-access EPDs of systems providing lighting functions. Several reasons justified limiting the inclusion criteria to the EPDs, the exclusion energy audits, and the measured data available in the scientific or gray literature. The reason for focusing on EPDs was because they are standardized, have the same scope, and include all the information related to the life cycle stages. Being third-party verified, they reduce the risk of error. As the energy audits and measured data are not standardized, mostly being created for a specific purpose, they do not cover all the life-cycle stages and consequently could lack information. The problems of data standardization and methodological inconsistencies in the robustness of LCA results are highlighted in previous studies. Shanker et al. stressed the critical role of industry collaboration, data standardization, and methodological consistency in enabling accurate life-cycle assessments for lighting products [64]. The influence of the methodological aspects on the calculation of the environmental impacts of lighting is also highlighted in [65].
Several assumptions were made in assessing the environmental impacts of lighting systems and their contribution to the global warming potential (GWP) indicator of a case study building. Three occupancy profiles were considered: living spaces, circulation, and service areas. Additionally, a perfect correlation between occupancy profiles and lighting needs was assumed. Although the study was based on these assumptions, it is important to stress that no more robust hypotheses could be found after an in-depth review of the literature and discussions with experts. Developing a more representative hypothesis for Denmark is especially challenging, given that the energy used for artificial lighting simulations are not typically performed for new buildings, as the standards do not regulate them. None of the new buildings in Denmark have lighting systems installed by default; instead, the user installs a lighting system based on their specific needs. For this reason, the impacts of lighting systems do not include wires and cables, as these are typically implemented for other purposes. While the hypotheses made in this study could influence the results, they are fully supported by the LCA standard (Ecochain, Amsterdam, the Netherlands) [54,66]. This standard recognizes that the impact assessment process is iterative, requiring many hypotheses and assumptions, which are refined with each successive assessment. This study found that the global warming potential score for lighting systems and the energy required for their operation varied between 0.01 and 0.9 kg CO2 e/m2/year and 0.41 and 1.98 kg CO2 e/m2/yr, respectively. The Swiss database KBOB [67] provides a ratio of 0.26 kg CO2 e/m2/year for the GWP score of the lighting system used in residential buildings. This value aligns with the average GWP score of 0.15 kg CO2 e/m2/year obtained in our case study, which was an unexpected result that nonetheless confirmed the validity of this study despite the assumptions and hypotheses considered.
Regarding the GWP score for the energy used for artificial lighting, the range obtained in this study overlapped with findings from previous studies [68]. All these studies were based on assumptions and were valid in different contexts. However, since the intervals between the GWP scores intersect, the results were reliable and strengthened their validity. Another assumption in this study was that the same lighting system was implemented across the entire case study building. This is a hypothetical analysis, as the lighting systems in residential buildings can vary from one apartment to another. However, given the study’s goal, this assumption will not affect the conclusions, as any likely combination of different lighting system solutions in the building would result in a GWP score within the calculated range. Despite the numerous assumptions and hypotheses, this explanatory study presents, for the first time, the impacts of the lighting system on the overall GWP score of a building.
Additionally, this paper provides an overview of the current state of the literature regarding environmental product declarations containing information about the environmental impact of various lighting system solutions. Further research is needed to improve and strengthen the hypotheses and assumptions for reducing the environmental impacts of lighting systems. More energy used for artificial lighting simulations for other country contexts are necessary since artificial lighting is strongly dependent on building locations within Europe and beyond. Considering the large influence of the assumption and hypothesis on the LCA results, the study could be enriched in the future with uncertainty and sensitivity analyses. In using these analyses, it is advisable to calculate the uncertainties of the GWP score from the uncertainties related to the assumption of lighting uniformity, use duration, occupancy, carbon content of electricity grid, or variations in EPDs. While a sensitivity analysis will identify which assumption or uncertainties have the largest influence on the GWP score’s uncertainties, there is a need for priorities to be set to strengthen the LCA results.

6. Conclusions

In this study, we analyzed the environmental impacts of lighting system through the global warming potential indicator. An extensive overview of databases and programs for the European context revealed the publication of 101 open-access EPDs, containing information on 753 LED lighting systems, with luminous efficacies ranging from 30 to 171 lm/W. The assessment of the impacts under the functional unit of the lighting system to provide 1000 lumens over 35,000 h of operation in each of the EU-27 countries highlighted Poland, Cyprus, Estonia, Malta, Czechia, Bulgaria, Germany, Italy, the Netherlands, Ireland, and Greece as being above the average European level. For these countries, the primary focus in reducing lighting system impacts should be on the operating phase, which is responsible for more than 95% of the impact. This can be achieved by reducing the energy required or providing electricity from sources with very low carbon content. For the other EU-27 countries, a particular focus should be placed on the choice of materials, as the impacts related to the materials they comprise contributed up to 60%.
The results indicated a strong correlation between the lighting system impacts and their luminous efficacy, following a decreasing exponential curve. Based on these results, we found that selecting lighting systems with higher luminous efficacy is more effective in reducing impacts than finding solutions for minimizing the energy used for artificial lighting through passive strategies or improving the carbon content of the electricity grid. In a case study building that was valid for the Danish context, we found that lighting impacts were a significant factor in achieving climate targets for buildings, as their contribution can vary between 10% and 30% of the overall impacts of buildings. It was found that LEDs and high-performance LEDs are the only solutions that could be implemented in projects to reach Danish targets. However, even these technologies have high impacts that significantly influence the overall impacts of buildings. To achieve future climate targets, there is an urgent need to further reduce lighting system impacts—not only in the operational phase, which contributes 6% to 24%, but also from the embodied impacts, which account for 1% to 12.5%.
The exploratory analysis presented in this paper indicates the need for a further detailed analysis of the calculation of electrical lighting system requirements. The study should be extended to other countries with different locations or building typologies. Moreover, the results—limited by the hypotheses considered in the assessment—should be strengthened in future analyses by refining user profiles and incorporating dynamic analyses of energy consumption for artificial lighting.

Supplementary Materials

The following supporting information can be download at https://www.mdpi.com/article/10.3390/buildings15081279/s1.

Author Contributions

Conceptualization, E.H.; methodology, E.H. and S.M.H.; software, E.H. and S.M.H.; validation, E.H., B.S.-V., J.d.B. and S.M.H.; formal analysis, E.H.; investigation, E.H; data curation, E.H.; writing—original draft preparation, E.H.; writing—review and editing, E.H., B.S.-V., J.d.B. and S.M.H.; visualization, E.H.; supervision, E.H. All authors have read and agreed to the published version of the manuscript.

Funding

This research received funding from EUDP Denmark with Projekt nr.: 134232-510320.

Data Availability Statement

Data are contained within the article.

Acknowledgments

We would like to acknowledge that this study is a part of our contribution to the project titled: “EUDP 2023-I Deltagelse i IEA SHC Task 70/EBC Annex 90 “Low carbon, high comfort integrated lighting”.

Conflicts of Interest

The authors declare no conflict of Interest.

References

  1. Inter International Energy Agency. Buildings. 2025. Available online: https://www.iea.org/topics/energyefficiency/buildings (accessed on 24 February 2025).
  2. European Commission. Roadmap for Moving to a Competitive Low Carbon Economy in 2050; European Commission: Brussels, Belgium, 2011; Available online: https://ec.europa.eu/clima/document/download/roadmap_2050_en.pdf (accessed on 24 February 2025).
  3. Yang, L.; Yan, H.; Lam, J.C. Thermal comfort and building energy consumption implications—A review. Appl. Energy 2014, 115, 164–173. [Google Scholar] [CrossRef]
  4. Nishimwe, A.M.R.; Reiter, S. Estimation, analysis and mapping of electricity consumption of a regional building stock in a temperate climate in Europe. Energy Build. 2021, 253, 111535. [Google Scholar] [CrossRef]
  5. Mahmoudzadeh, P.; Hu, W.; Davis, W.; Durmus, D. Spatial efficiency: An outset of lighting application efficacy for indoor lighting. Build. Environ. 2024, 255, 111409. [Google Scholar] [CrossRef]
  6. Gentile, N.; Lee, E.S.; Osterhaus, W.; Altomonte, S.; Naves David Amorim, C.; Ciampi, G.; Garcia-Hansen, V.; Maskarenj, M.; Scorpio, M.; Sibilio, S. Evaluation of integrated daylighting and electric lighting design projects: Lessons learned from international case studies. Energy Build. 2022, 268, 112191. [Google Scholar] [CrossRef]
  7. Zocchi, G.; Hosseini, M.; Triantafyllidis, G. Exploring the Synergy of Advanced Lighting Controls, Building Information Modelling and Internet of Things for Sustainable and Energy-Efficient Buildings: A Systematic Literature Review. Sustainability 2024, 16, 937. [Google Scholar] [CrossRef]
  8. Hafezparast Moadab, N.; Olsson, T.; Fischl, G.; Aries, M. Smart versus conventional lighting in apartments—Electric lighting energy consumption simulation for three different households. Energy Build. 2021, 244, 111009. [Google Scholar] [CrossRef]
  9. Iatauro, D.; Zinzi, M. Daylight Assessment and Implications on the Overall Energy Need in an Office Building: A Case Study. In Multiphysics and Multiscale Building Physics; Berardi, U., Ed.; Springer Nature: Singapore, 2025; pp. 312–317. [Google Scholar] [CrossRef]
  10. EN 15193-1:2017; Energy Performance of Buildings—Energy Requirements for Lighting. CEN, European Committee for Standardization: Brussels, Belgium, 2017.
  11. Hosseini, S.M.; Heiranipour, M.; Wang, J.; Hinkle, L.E.; Triantafyllidis, G.; Attia, S. Enhancing Visual Comfort and Energy Efficiency in Office Lighting Using Parametric-Generative Design Approach for Interactive Kinetic Louvers. J. Daylighting 2024, 11, 69–96. [Google Scholar] [CrossRef]
  12. Lee, J.H.; Kang, J.-S. Study on Lighting Energy Savings by Applying a Daylight-Concentrating Indoor Louver System with LED Dimming Control. Energies 2024, 17, 3425. [Google Scholar] [CrossRef]
  13. Mesloub, A.; Alnaim, M.M.; Albaqawy, G.; Alsolami, B.M.; Mayhoub, M.S.; Tsangrassoulis, A.; Doulos, L.T. The visual comfort, economic feasibility, and overall energy consumption of tubular daylighting device system configurations in deep plan office buildings in Saudi Arabia. J. Build. Eng. 2023, 68, 106100. [Google Scholar] [CrossRef]
  14. Albu, H.; Beu, D.; Rus, T.; Moldovan, R.; Domniţa, F.; Vilčeková, S. Life cycle assessment of LED luminaire and impact on lighting installation—A case study. Alex. Eng. J. 2023, 80, 282–293. [Google Scholar] [CrossRef]
  15. Clarke-Sather, A.; Li, Y.; Qu, J. Lighting energy use in Anding District, Gansu Province, China. Energy Sustain. Dev. 2016, 32, 40–49. [Google Scholar] [CrossRef]
  16. Principi, P.; Fioretti, R. A comparative life cycle assessment of luminaires for general lighting for the office–compact fluorescent (CFL) vs Light Emitting Diode (LED)—A case study. J. Clean. Prod. 2014, 83, 96–107. [Google Scholar] [CrossRef]
  17. Khorasanizadeh, H.; Parkkinen, J.; Parthiban, R.; David Moore, J. Energy and economic benefits of LED adoption in Malaysia. Renew. Sustain. Energy Rev. 2015, 49, 629–637. [Google Scholar] [CrossRef]
  18. Hasan, M.M.; Moznuzzaman, M.; Shaha, A.; Khan, I. Enhancing energy efficiency in Bangladesh’s readymade garment sector: The untapped potential of LED lighting retrofits. Int. J. Energy Sect. Manag. 2024; ahead-of-print. [Google Scholar] [CrossRef]
  19. Kocaman, B. Energy Efficiency in Lighting for Historical Buildings: Case Study of the El Aman Caravanserai in Province of Bitlis, Turkey. Light Eng. 2020, 28, 68–76. [Google Scholar] [CrossRef]
  20. Seyıtoglu, S.S.; Tozlu, Ö.F.; Avcıoğlu, E. Indoor Lighting Conversion Approach for Sustainable Energy Efficiency Applications in Campus Buildings: Hitit University Engineering Faculty Study. Gazi Univ. J. Sci. 2023, 36, 1326–1337. [Google Scholar] [CrossRef]
  21. Oliveira, L.B.; Salles, R.A.; Fragoso, A.P.; Fortes, M.Z.; Tavares, G.M. Lighting retrofit using LED technology—Efficiency analysis and environmental impacts. In Proceedings of the 2018 Simposio Brasileiro de Sistemas Eletricos (SBSE), Niteroi, Brazil, 12–16 May 2018; pp. 1–5. [Google Scholar] [CrossRef]
  22. Josijevic, M.; Gordić, D.; Milovanovic, D.; Jurišević, N.; Rakic, N. A method to Estimate Savings of LED Lighting Instalation in Public Buildings the Case Study of Secondary Schools in Serbia. Therm. Sci. 2017, 21, 2931–2943. [Google Scholar] [CrossRef]
  23. Tähkämö, L.; Bazzana, M.; Ravel, P.; Grannec, F.; Martinsons, C.; Zissis, G. Life cycle assessment of light-emitting diode downlight luminaire—A case study. Int. J. Life Cycle Assess. 2013, 18, 1009–1018. [Google Scholar] [CrossRef]
  24. Wu, Y.; Su, D. LCA of an industrial luminaire using product environmental footprint method. J. Clean. Prod. 2021, 305, 127159. [Google Scholar] [CrossRef]
  25. Welz, T.; Hischier, R.; Hilty, L.M. Environmental impacts of lighting technologies—Life cycle assessment and sensitivity analysis. Environ. Impact Assess. Rev. 2011, 31, 334–343. [Google Scholar] [CrossRef]
  26. DAPHABITAT. 2024. Available online: https://daphabitat.pt/dap/dap-registadas (accessed on 30 January 2024).
  27. ZAG. 2024. Available online: https://www.zag.si/en/certificates-and-approvals/issued-environmental-product-declarations/ (accessed on 30 January 2024).
  28. OPENDAP. 2024. Available online: https://node.opendap.es/processList.xhtml?stock=default (accessed on 30 January 2024).
  29. itb. 2024. Available online: https://www.itb.pl/epd (accessed on 30 January 2024).
  30. PEP-Ecopassport. 2024. Available online: https://register.pep-ecopassport.org/pep/consult (accessed on 30 January 2024).
  31. INIES. 2024. Available online: https://www.inies.fr/ (accessed on 30 January 2024).
  32. Boverket. 2024. Available online: https://www.boverket.se/en/start/building-in-sweden/developer/rfq-documentation/climate-declaration/climate-database/Search/?version=4&climatedatabasequery (accessed on 30 January 2024).
  33. EPD-Norway. 2024. Available online: https://www.epd-norge.no/ (accessed on 30 January 2024).
  34. EPD Italy. 2024. Available online: https://www.epditaly.it/en/epd-search/ (accessed on 30 January 2024).
  35. MRPI. 2024. Available online: https://www.mrpi.nl/epd-overzicht/ (accessed on 30 January 2024).
  36. EPD Denmark. 2024. Available online: https://www.epddanmark.dk/uk/epd-database/ (accessed on 30 January 2024).
  37. CO2data. 2024. Available online: https://co2data.fi/rakentaminen/#en (accessed on 30 January 2024).
  38. RAKENNUSTIETO. 2024. Available online: https://cer.rts.fi/en/rts-epd/searchfor-rts-epds/ (accessed on 30 January 2024).
  39. BAU-EPD. 2024. Available online: https://www.bau-epd.at/en/epd/list (accessed on 30 January 2024).
  40. BAUBook. 2024. Available online: https://www.baubook.at/zentrale/ (accessed on 30 January 2024).
  41. Health Food Chain Safety Environment. 2024. Available online: https://www.health.belgium.be/en/database-environmental-product-declarations-epd#:~:text=Introduction%20to%20the%20B-EPD%20programme%20It%20gives%20a,for%20the%20environment%20and%20often%20allow%20cost%20savings (accessed on 30 January 2024).
  42. Cenia. 2024. Available online: https://www.cenia.cz/spolecenska-odpovednost/epd/databaze-epd/ (accessed on 30 January 2024).
  43. DGBC. 2024. Available online: https://www.insideinside.nl/en/ (accessed on 30 January 2024).
  44. OEKOBAUDAT. 2024. Available online: https://www.oekobaudat.de/no_cache/en/database/search.htm (accessed on 30 January 2024).
  45. IBU-EPD. 2024. Available online: https://ibu-epd.com/en/ibu-data-start/ (accessed on 30 January 2024).
  46. Eco-platform. 2024. Available online: https://www.eco-platform.org/epd-data.htm (accessed on 30 January 2024).
  47. EPD HUB. 2024. Available online: https://www.epdhub.com/ (accessed on 30 January 2024).
  48. IGBC. 2024. Available online: https://www.igbc.ie/epd-search/ (accessed on 30 January 2024).
  49. Digital Environmental HUB. 2024. Available online: https://lcadatabase.com/ (accessed on 30 January 2024).
  50. The International EPD. 2024. Available online: https://www.environdec.com/home (accessed on 30 January 2024).
  51. Hoxha, E.; Birgisdottir, H.; Röck, M. Climate IMPACT of EU building materials: Data compilation and statistical analysis of global warming potential in environmental product declarations. Sustain. Prod. Consum. 2025, 54, 64–74. [Google Scholar] [CrossRef]
  52. EN-15804:2012+A2; Sustainability of Construction Works—Environmental Product Declaration—Core Rules for the Product Category of Construction Product. CEN, European Committee for Standardization: Brussels, Belgium, 2019.
  53. Our World in Data. Carbon Intensity of Electricity Generation. 2023. Available online: https://ourworldindata.org/grapher/carbon-intensity-electricity?region=Europe (accessed on 30 January 2025).
  54. EN-15978; Sustainability Assessment of Construction Works—Assessment of Environmental Performance of Buildings—Calculation Method. CEN, European Committee for Standardization: Brussels, Belgium, 2011.
  55. Birgisdottir, H.; Mortensen, L.H.; Hansen, K.; Aggerholm, S. Kortlægning af Bæredygtigt Byggeri [Mapping Sustainable Construction]; The Danish Building Research Institute, Aalborg University: Copenhagen, Denmark, 2013. [Google Scholar]
  56. Soust-Verdaguer, B.; Obrecht, T.P.; Alaux, N.; Hoxha, E.; Saade, M.R.M.; Röck, M.; Garcia-Martinez, A.; Llatas, C.; de Cózar, J.G.; Passer, A. Using systematic building decomposition for implementing LCA: The results of a comparative analysis as part of IEA EBC Annex 72. J. Clean. Prod. 2023, 384, 135422. [Google Scholar] [CrossRef]
  57. Aagaard, N.J.; Brandt, E.; Aggerholm, S.; Haugbølle, K. Levetider af Bygningsdele ved Vurdering af Bæredygtighed og Totaløkonomi; SBI forlag: Copenhagen, Denmark, 2013. [Google Scholar]
  58. Nawrocka, N.; Machova, M.; Jensen, R.L.; Kanafani, K.; Birgisdottir, H.; Hoxha, E. Influence of BIM’s level of detail on the environmental impact of buildings: Danish context. Build. Environ. 2023, 245, 110875. [Google Scholar] [CrossRef]
  59. EN 12464-1; Lighting and Lighting—Lighting of Workplaces—Part 1: Indoor Workplaces. European Standard: Brussels, Belgium, 2021.
  60. American Society of Heating, Refrigerating, and Air-Conditioning Engineers. ANSI/ASHRAE/IES Standard 90.1-2016: Energy Standard for Buildings Except Low-Rise Residential Buildings (SI Edition); ASHRAE: Peachtree Corners, GA, USA, 2016. [Google Scholar]
  61. Ciais, P.; Sabine, C.; Bala, G.; Bopp, L.; Brovkin, V.; House, J.I. Carbon and other biogeochemical cycles. In Climate Change 2013: The Physical Science Basis. Contribution of Working Group I to the Fifth Assessment Report of the Intergovernmental Panel on Climate Change Change; Cambridge University Press: Cambridge, UK, 2014; pp. 465–570. [Google Scholar]
  62. Reduction Roadmap. Beyond the Roadmap: A Transition Plan for the Danish Building Industry Version 2. 2024. Available online: www.reductionroadmap.dk (accessed on 30 January 2025).
  63. Nordic Sustainable Construction. Supplementary Agreement on Stricter CO2 Limits for New Buildings in Denmark. 2024. Available online: https://www.nordicsustainableconstruction.com/news/2024/june/tillaegsaftale-paa-engelsk (accessed on 30 January 2025).
  64. Shanker, L.; Mazzei, I.; Bowes, T. Streamlining life cycle assessment for complex Mechanical Electrical and Plumbing products–Lessons from lighting. Build. Serv. Eng. Res. Technol. 2025, 01436244241305759. [Google Scholar] [CrossRef]
  65. Mazzei, I.; Saint, R.; Kay, A.; Pomponi, F. Embodied carbon quantification of luminaires using life cycle assessment and CIBSE TM65 methodologies: A comparison case study. J. Ind. Ecol. 2024, 28, 59–73. [Google Scholar] [CrossRef]
  66. EeBGuide. EeBGuide Guidance Document Part B: Building. In Operational Guidance for Life Cycle Assessment Studies of the Energy-Efficient Building Initiative; Fraunhofer Institut für Bauphysik: Stuttgart, Germany, 2011. [Google Scholar]
  67. KBOB Database. Eco-bau and IPB 2009/1:2014. Eco-Data in Construction. 2014. Available online: https://www.kbob.admin.ch/kbob/fr/home.html (accessed on 30 January 2025).
  68. Jusselme, T.; Brambilla, A.; Hoxha, E.; Jiang, Y.; Vuarnoz, D. Building 2050-Scientific Concept and Transition to the Experimental Phase; Swiss Federal Technology Institute of Lausanne: Lausanne, Switzerland, 2016. [Google Scholar]
Figure 1. Percentages, occupancy profiles, and the required quantity of lighting for each of the building’s specific areas.
Buildings 15 01279 g001
Figure 2. Average GWP score of lighting systems for EU-27 countries, and the variation of relative contributions of embodied and operational impacts. The declared functional unit (FU) is assumed to be a light providing 1000 lumens over 35,000 h. Black stars present the absolute values of GWP (kg CO2 e/FU), red boxplots present relative operational impacts (%) and blue boxplots the relative embodied impacts (%).
Buildings 15 01279 g002
Figure 3. Relation between luminous efficacy and the environmental impacts of lighting in Denmark. Lined black circles represent the average values for each group, and the interval bars indicate the variations between the minimal and maximal values.
Buildings 15 01279 g003
Figure 4. The GWP score of buildings in the scenarios for a constant and progressive carbon content of electricity, respectively, for Denmark.
Buildings 15 01279 g004
Figure 5. The GWP score of buildings in the scenarios for a progressive carbon content of electricity, for 753 lighting systems respectively, for Denmark.
Buildings 15 01279 g005
Disclaimer/Publisher’s Note: The statements, opinions and data contained in all publications are solely those of the individual author(s) and contributor(s) and not of MDPI and/or the editor(s). MDPI and/or the editor(s) disclaim responsibility for any injury to people or property resulting from any ideas, methods, instructions or products referred to in the content.