Abstract
Durable reinforced concrete is a fundamental requirement in a marine environment, but at the same time it must be sustainable, meaning its production emits the least amount of greenhouse gases. Hence, the importance of achieving optimal proportioning methods. This paper presents and discusses the electrochemical differences in the passivity state of reinforced concrete specimens designed using two proportioning methods: M1 prioritizes the ultimate strength of the element, and M2 focuses on sustainability through optimized aggregate arrangement and reduced cement content. Small beams (150 mm × 150 mm × 300 mm) with varying cover thickness (15 mm, 20 mm, and 30 mm), with two water/cement ratios (0.45 and 0.65), all utilizing Portland composite cement (PCC 30R), were exposed in a tropical marine environment 50 m from the seashore in the north of the Yucatan Peninsula for 700 days (passive state). Corrosion rate, corrosion potential, resistivity, and internal conditions (relative humidity and temperature) were periodically measured. A key finding revealed that M2, despite its sustainable advantage, tends to depassivation before M1, at least during the two years of exposure and while in the passive state.
1. Introduction
Concrete is one of the most widely used building materials in the world due to its high strength, durability, and versatility [1]. However, this durability is conditioned by different factors, including mix composition, environmental conditions, and processes that occur during its service life [2,3]. Concrete structures must be designed, built, and supervised based on codes, manuals, and standards to ensure their durability and safety, fulfilling their intended service life and performance requirements. However, increasing structural load demands on reinforced concrete structures, along with the aggressive actions of nature, increasingly require the development of new technologies for the design of concrete elements [4,5,6,7], considering not only mechanical strength but also performance against aggressive agents. Corrosion of reinforcing steel is one of the main causes of deterioration in reinforced concrete structures, compromising their performance and reducing their service life [3,8]. Furthermore, structures must become more resistant and durable and contribute to reducing pollutants in construction material production (5% of global CO2 emissions) [9,10,11,12].
The literature provides approaches to improve the durability of concrete, including the optimization of the particle size distribution of aggregates, the use of corrosion inhibitor additives, or the use of nanomaterials to enhance properties [13,14,15]. Concrete consists primarily of three components: cement, aggregates, and water, where fine (sand) and coarse (gravel) aggregates constitute between 60% and 75% of the volume of a concrete mix [16], so their selection is crucial in designing durable and high-performance concrete. Studies have demonstrated that the microstructure of concrete and the arrangement of aggregates can influence its porosity, permeability, and, consequently, its resistance to corrosion (see Table 1). Due to their size, distribution, and physical properties, aggregates play an important role in the strength, durability, and economy of concrete elements [17]. Aggregates come from different sources: natural, such as rivers or lagoons, or manufactured as crushed stone, and can be identified or related according to their resistance properties [18,19]. However, even among aggregates from the same source, there are differences that generate very different concretes [20,21,22]. This study compares two mix design methods in terms of concrete cover thickness, water/cement (w/c) ratio, and internal conditions of temperature and relative humidity that could affect the passivity state of reinforced concrete specimens exposed to a natural marine environment in the Yucatán Peninsula: Method 1 (M1), based on the maximum strength of the elements, and Method 2 (M2), considering the arrangement of aggregates in concrete elements. This study analyzes the electrochemical performance of reinforcing steel in specimens designed with two different methods over a 700-day exposure period in a tropical marine environment. Corrosion rate, corrosion potential, and electrical resistivity are evaluated to determine which approach provides greater corrosion protection under aggressive conditions during the passivation period. This study aims to contribute to the development of more sustainable and efficient design strategies to improve the durability of reinforced concrete in marine environments.

Table 1.
Influence of aggregates in concrete.
2. Materials and Methods
2.1. Sample Design
A total of 12 reinforced concrete beams were designed using two different mix design methods, 6 for each method:
- Method 1 (M1), based on the maximum strength of the elements [28].
This method, known and used in many parts of the world, establishes a systematic procedure for determining the optimal proportions of cement, water, and fine and coarse aggregates, ensuring strength, durability, and workability. The required characteristics are determined based on the concrete’s intended use and placement and subsequent conditions. It begins with the selection of the slump and maximum aggregate size, followed by determining the air content and water/cement ratio. The cement content is then calculated, and the aggregate volume is determined using tables. Finally, the mixture is adjusted and verified through experimental testing to ensure it meets project specifications.
- Method 2 (M2) considering the arrangement of aggregates in concrete elements [29].
This method is based primarily on the aggregate shape rather than its particle size distribution. Its central focus is on determining the percentage of voids in the aggregate mix. The optimal composition is identified when the mixture has the lowest percentage of voids and the smallest specific surface area, which allows for a reduction in the amount of cement required. This results in a more economical, durable, and workable concrete. To design the mixture, the minimum percentage of voids and specific surface area are first determined by testing different weight ratios of sand and gravel: 35:65, 40:60, 45:55, 50:50, and 55:45. Once all the combinations have been evaluated, the one with the lowest percentage of voids is selected, as it represents the optimal composition for the concrete. The required quantities of water and cement are then determined experimentally, based on the strength and slump specified in the project.
The mix proportion for one cubic meter of fresh concrete used in each design can be seen in Table 2. Among the coincidences, both methods consider the internal characteristics of the aggregates (sand and gravel), such as moisture content and absorption. However, M2 considers as part of the design process an estimation of the volume of aggregates to obtain an adequate ratio among them that provides the least percentage of voids. If the quantities of the materials used are analyzed, it is possible to observe that, in M2, the cement content is lower than in M1, and the aggregate content (sand and gravel) is higher. Specifically, to have the lowest void content among coarse particles, the amount of sand used is 7% higher in M2 for both w/c ratios.
Table 2.
Material proportioning according to design 1.
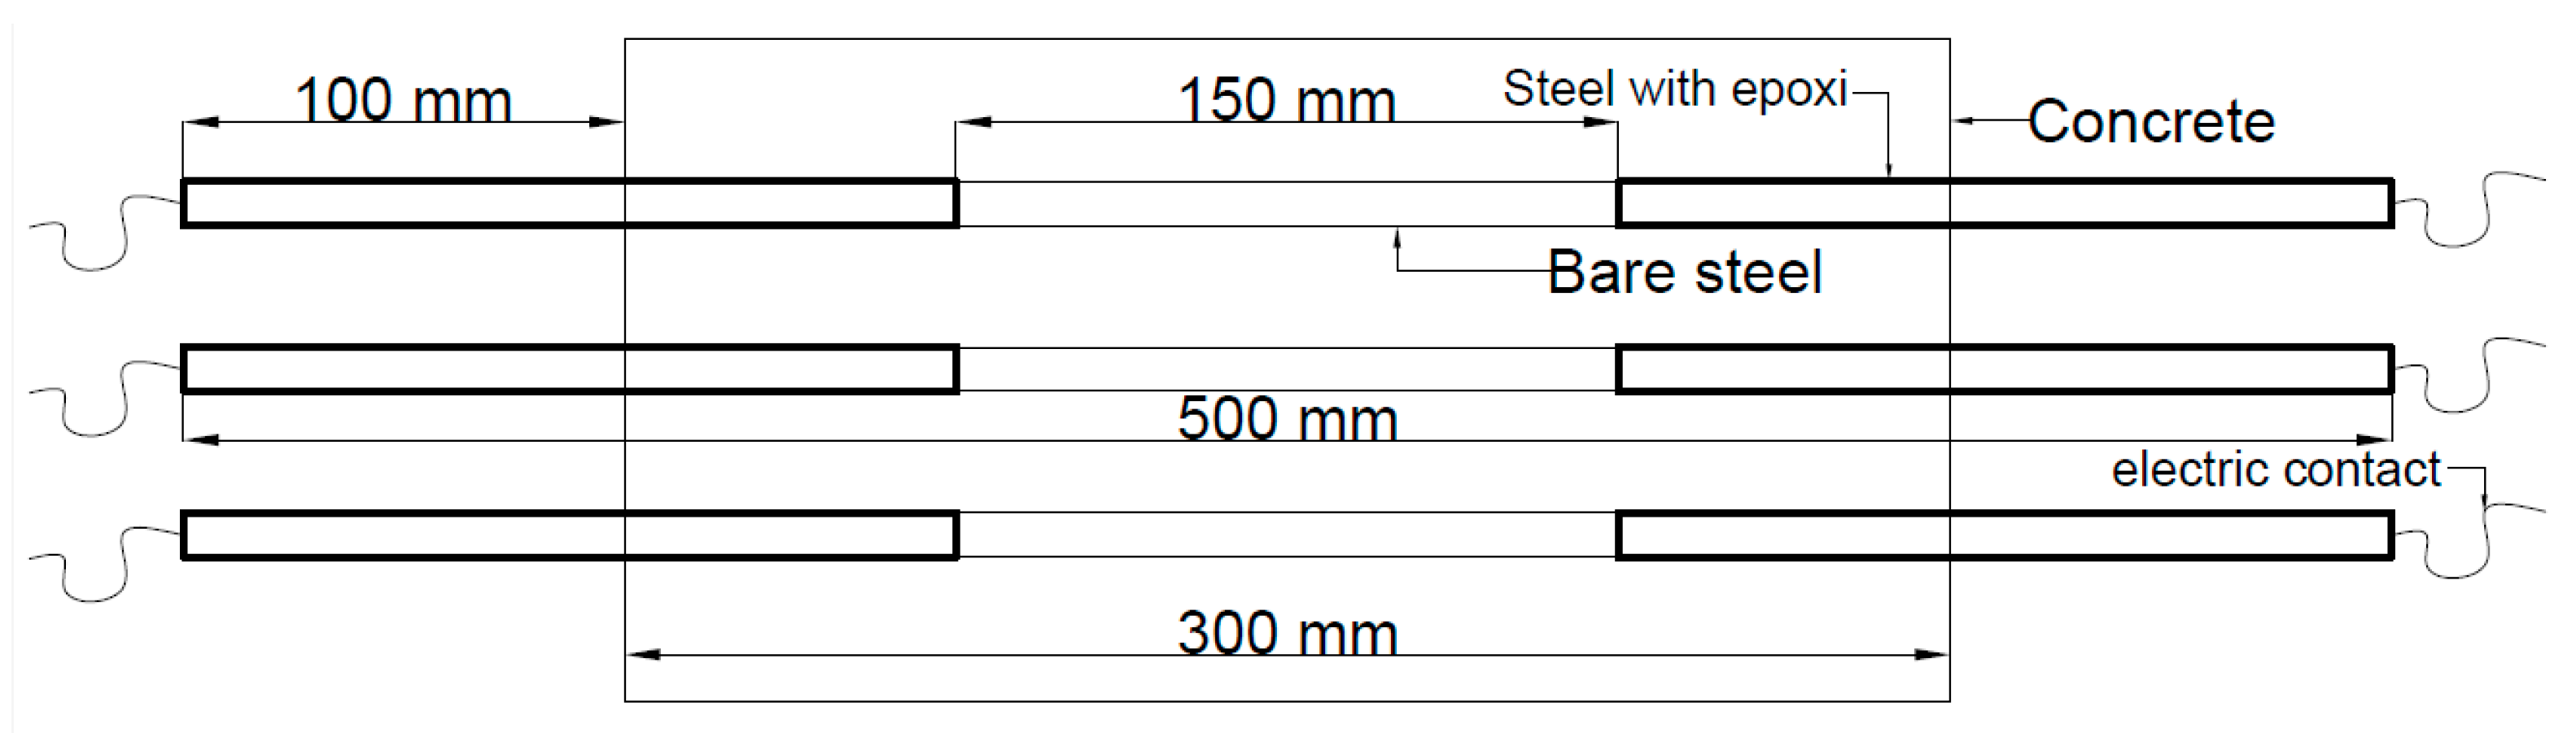
PCC-30R cement and crushed limestone aggregates from the region were used. From the six specimens of each method, three were designed with a 0.45 (low) water/cement (w/c) ratio and three with a 0.65 (high) w/c ratio, considered to produce good- and poor-quality concrete, respectively. The geometry of the specimens consisted of a cross-section of 150 mm by 150 mm and a length of 300 mm. As reinforcement, six carbon steel bars of 9.525 mm (3/8”) in diameter and 500 mm in length were used. Before placing the reinforcements in the molds, the study area was delimited with epoxy paint and insulating tape, leaving the central section (150 mm) of the reinforcement uncoated, to avoid corrosion in other sections of the steel. The ends of the reinforcements were completely insulated with the application of epoxy and then placed in a plastic tube. For electrical contact between the reinforcing steel and the measuring equipment, the ends of each reinforcement were drilled, and a copper wire was placed (Figure 1).
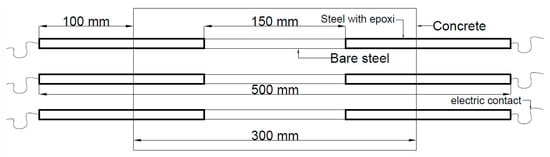
Figure 1.
Scheme of the tested beams.
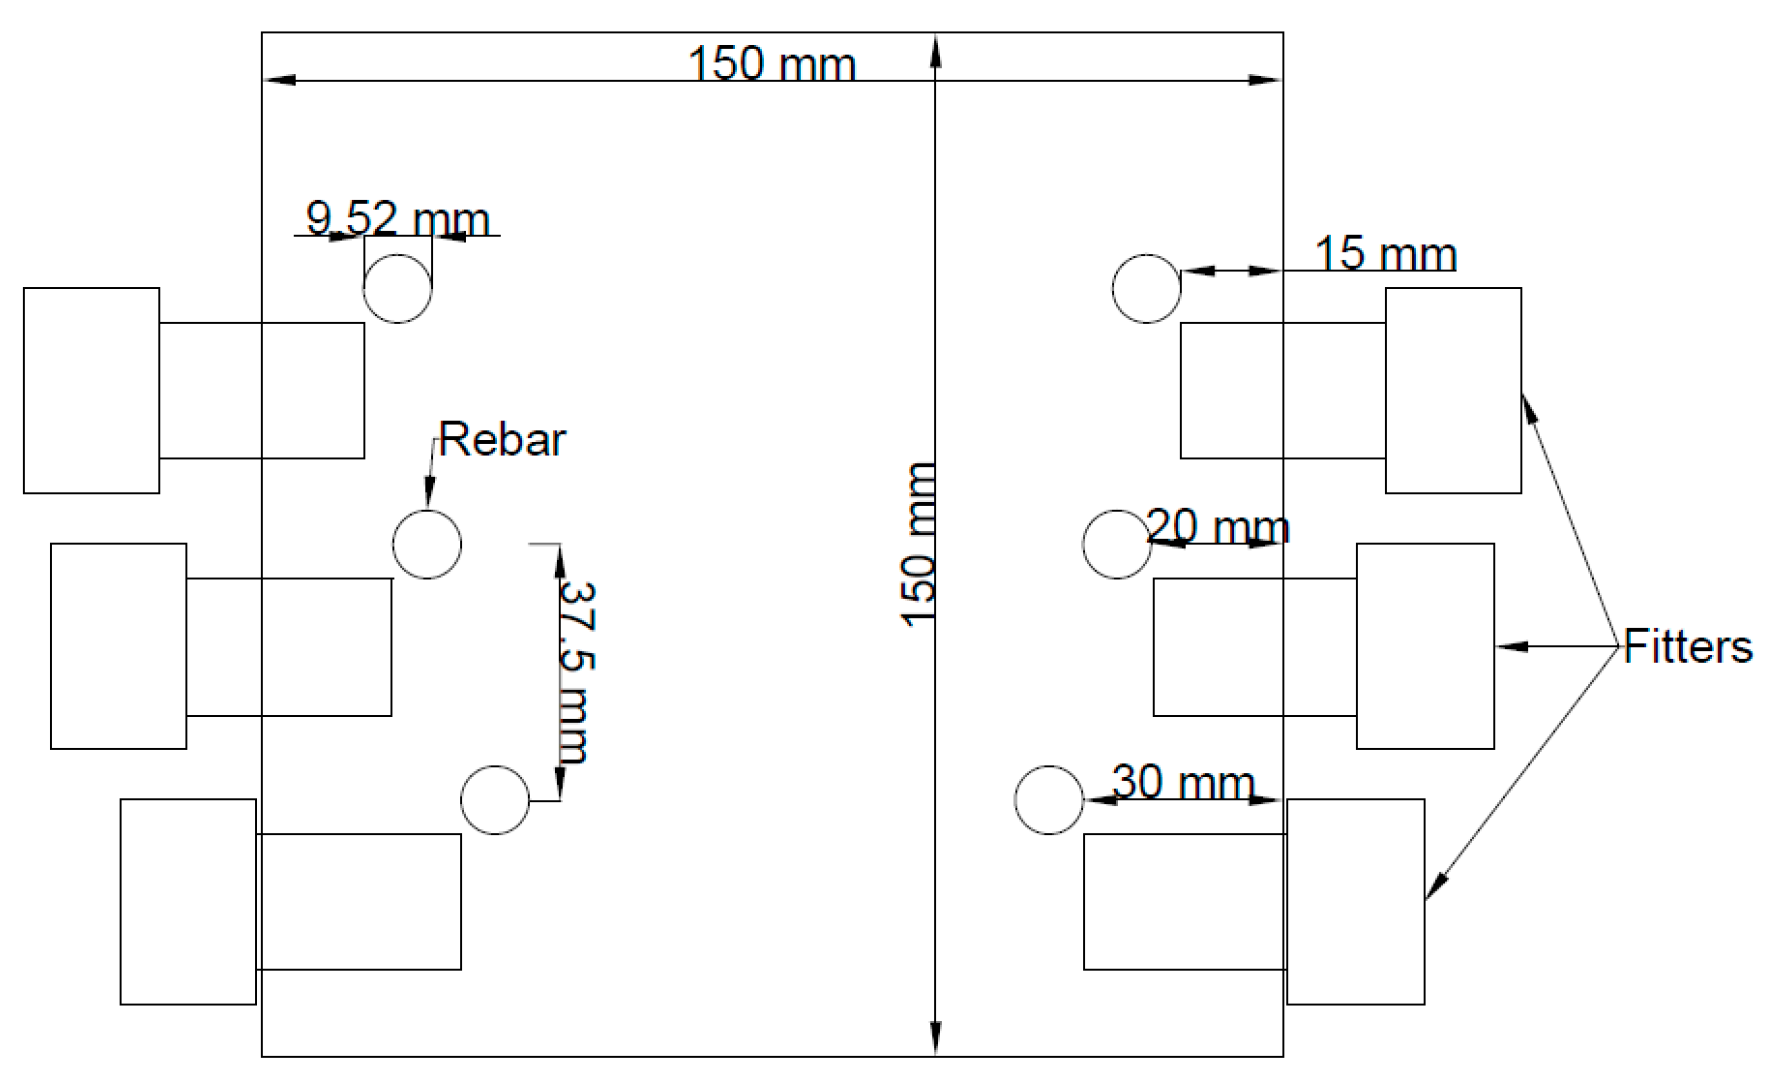
The steel was placed in the specimens, ensuring three different cover thicknesses: 15 mm, 20 mm, and 30 mm. Six access chambers (fitters) were installed to measure the internal conditions of relative humidity and temperature of the concrete at the depth of the reinforcements (Figure 2).
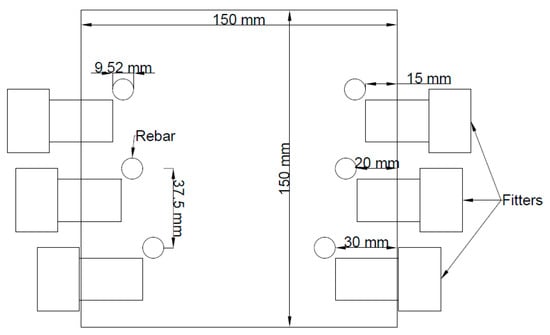
Figure 2.
Reinforcements and positioning of the fitters.
The curing process was carried out for a period of 28 days in a humidity-controlled chamber at 100% RH.
2.2. Environmental Exposure
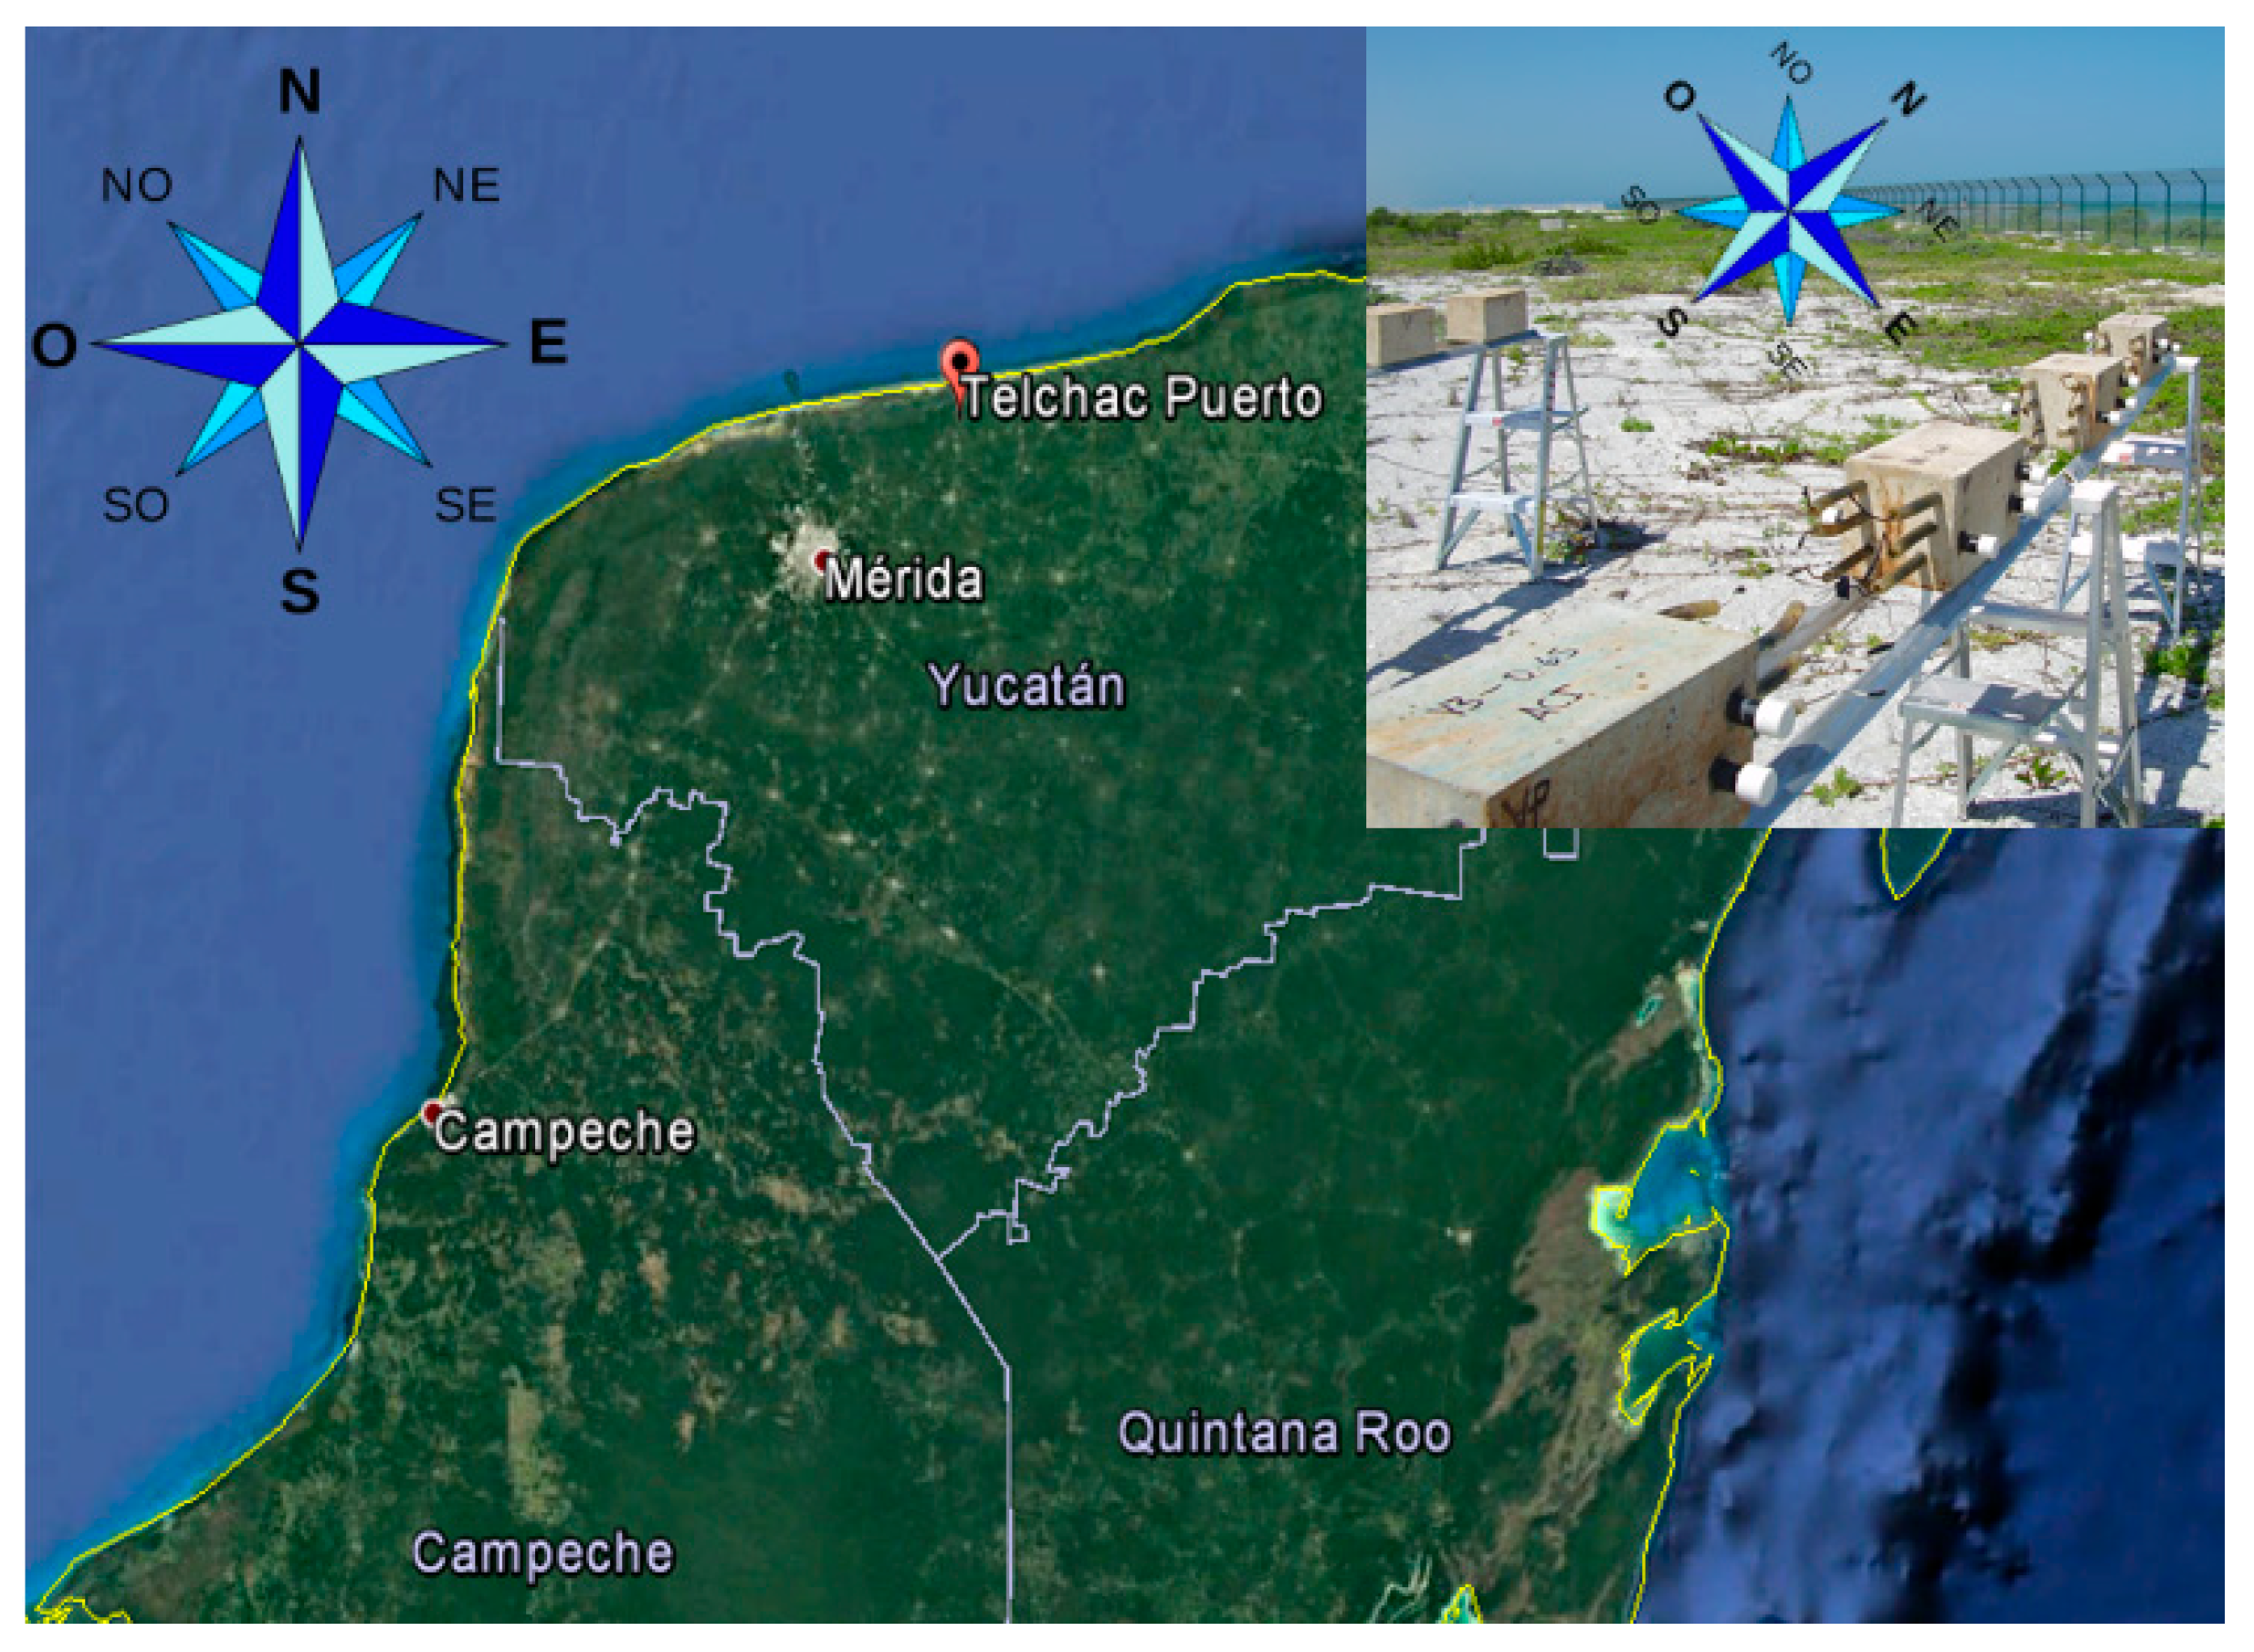
The specimens (beams) were exposed at the marine station of the Center for Research and Advanced Studies, Mérida Unit, (Cinvestav-Mérida) located in the municipality of Telchac Puerto, in the north of Yucatán, México, located 50 m from the seashore and 0.95 m above ground level. The reinforcement placed at 30 mm was positioned at the bottom of the beam. The beams were oriented in such a way that the study face was exposed to the influence of the prevailing winds, PWs, from the northeast (Figure 3).
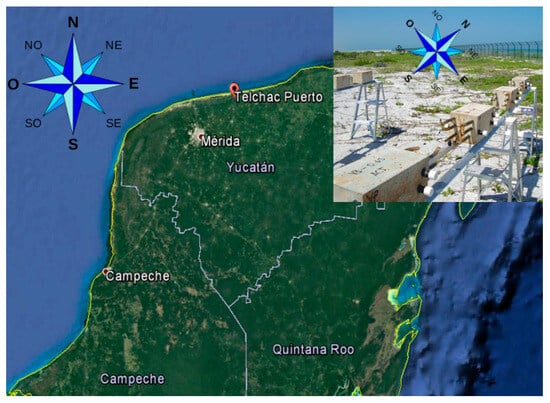
Figure 3.
Exposure of specimens.
2.3. Measurement of Electrochemical and Electrical Parameters
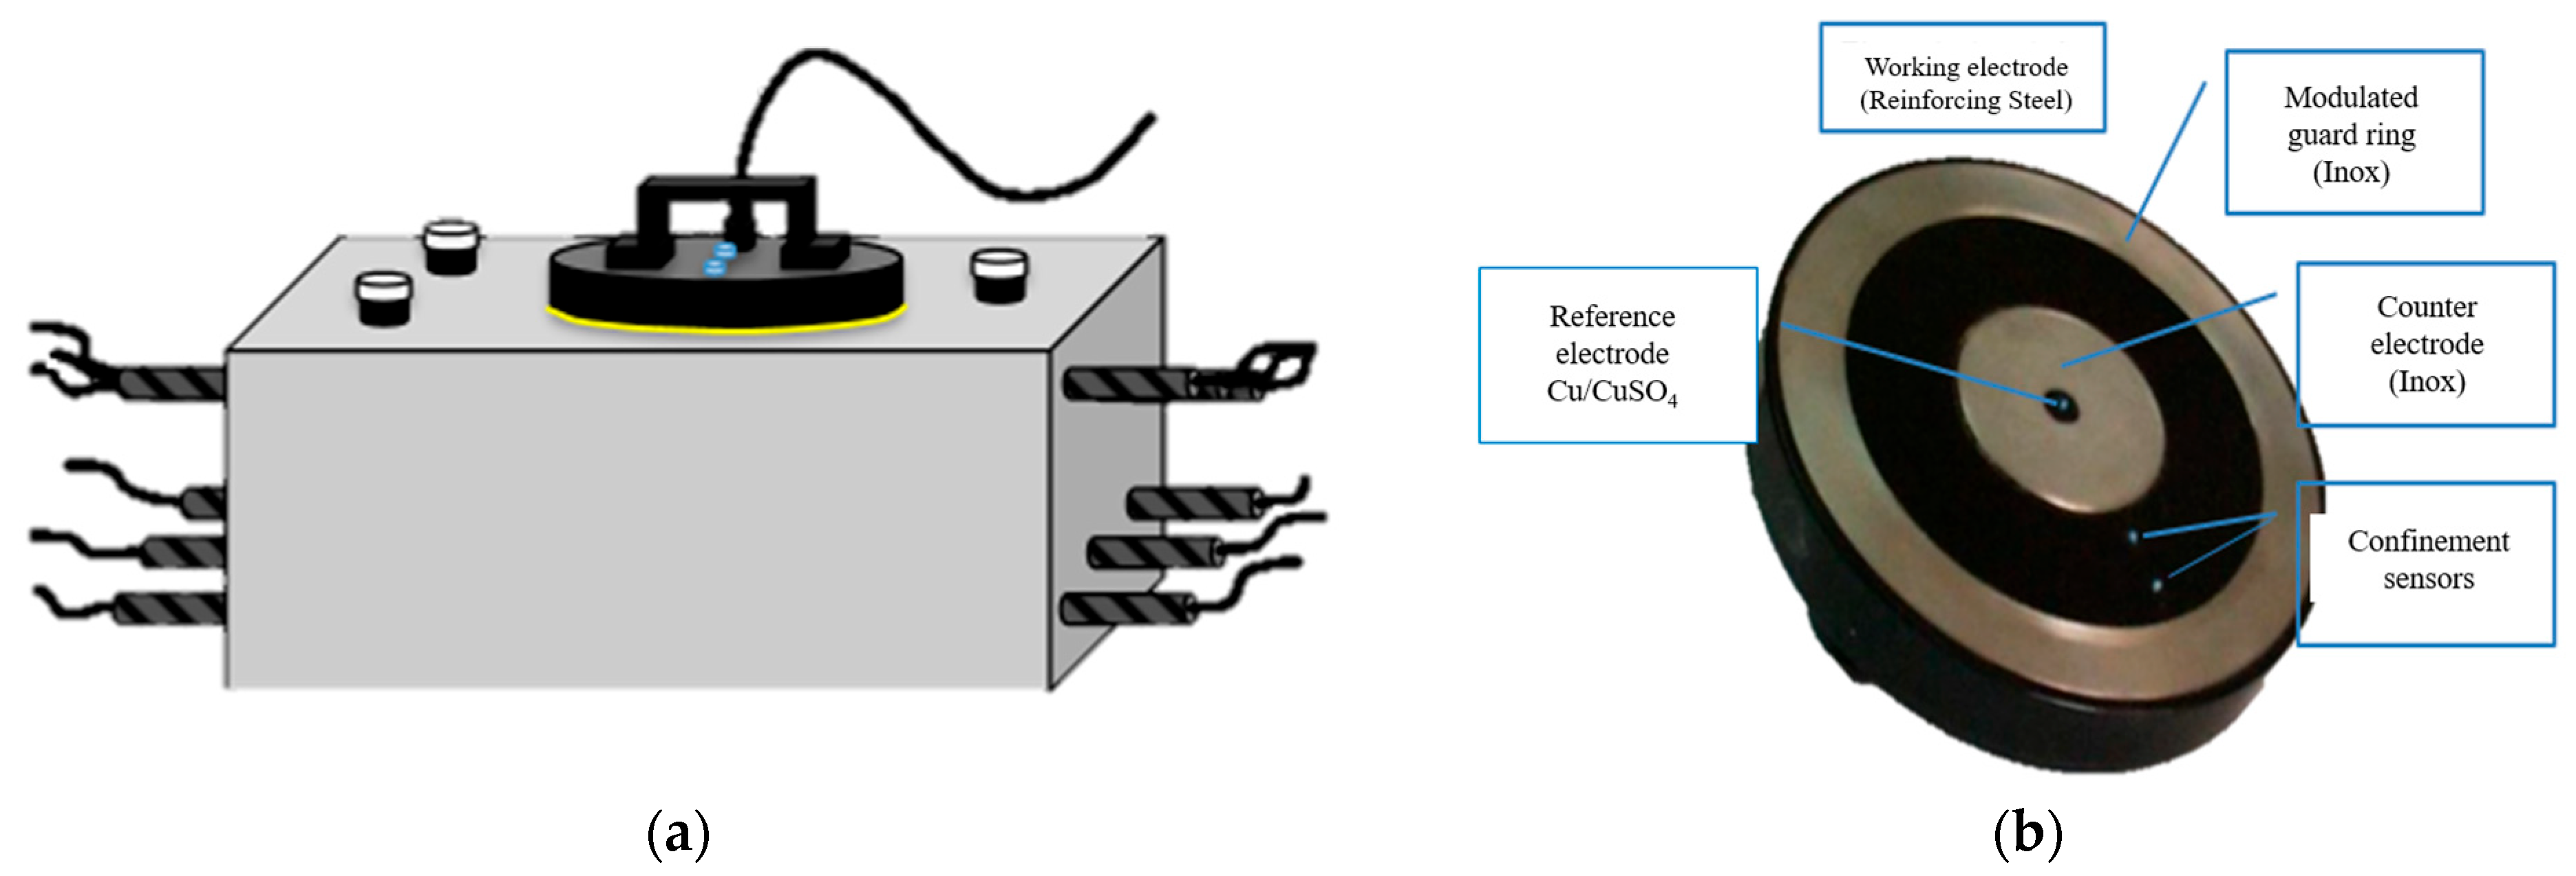
Electrochemical (corrosion rate, icorr, corrosion potential, Ecorr, and electrical resistivity) and electrical (ρ) measurements were carried out over a period of approximately 700 days at intervals of approximately 90 days using a portable corrosion meter (Figure 4) through a confinement system that was placed over the center of the beams, where the steel was uncoated. This provided Ecorr in mV and the electrical resistance of the concrete (Rs), from which the ρ in kΩ-cm was obtained through Equation (1).
where D is the diameter of the corrosion meter’s counter electrode. The icorr is obtained in μA/cm2 [30], using the linear polarization resistance technique, Rp, through Equations (2) and (3).

Figure 4.
(a) Measurement scheme and (b) equipment for electrochemical monitoring.
The literature establishes two criteria for constant B: 26 mV in the presence of corrosion and 52 mV in the absence of corrosion. The corrosion meter uses the value of 26 mV, which has been shown to be an acceptable value for evaluations under site conditions [31,32,33].
2.4. Internal Measurements of Relative Humidity (RH) and Temperature (T)
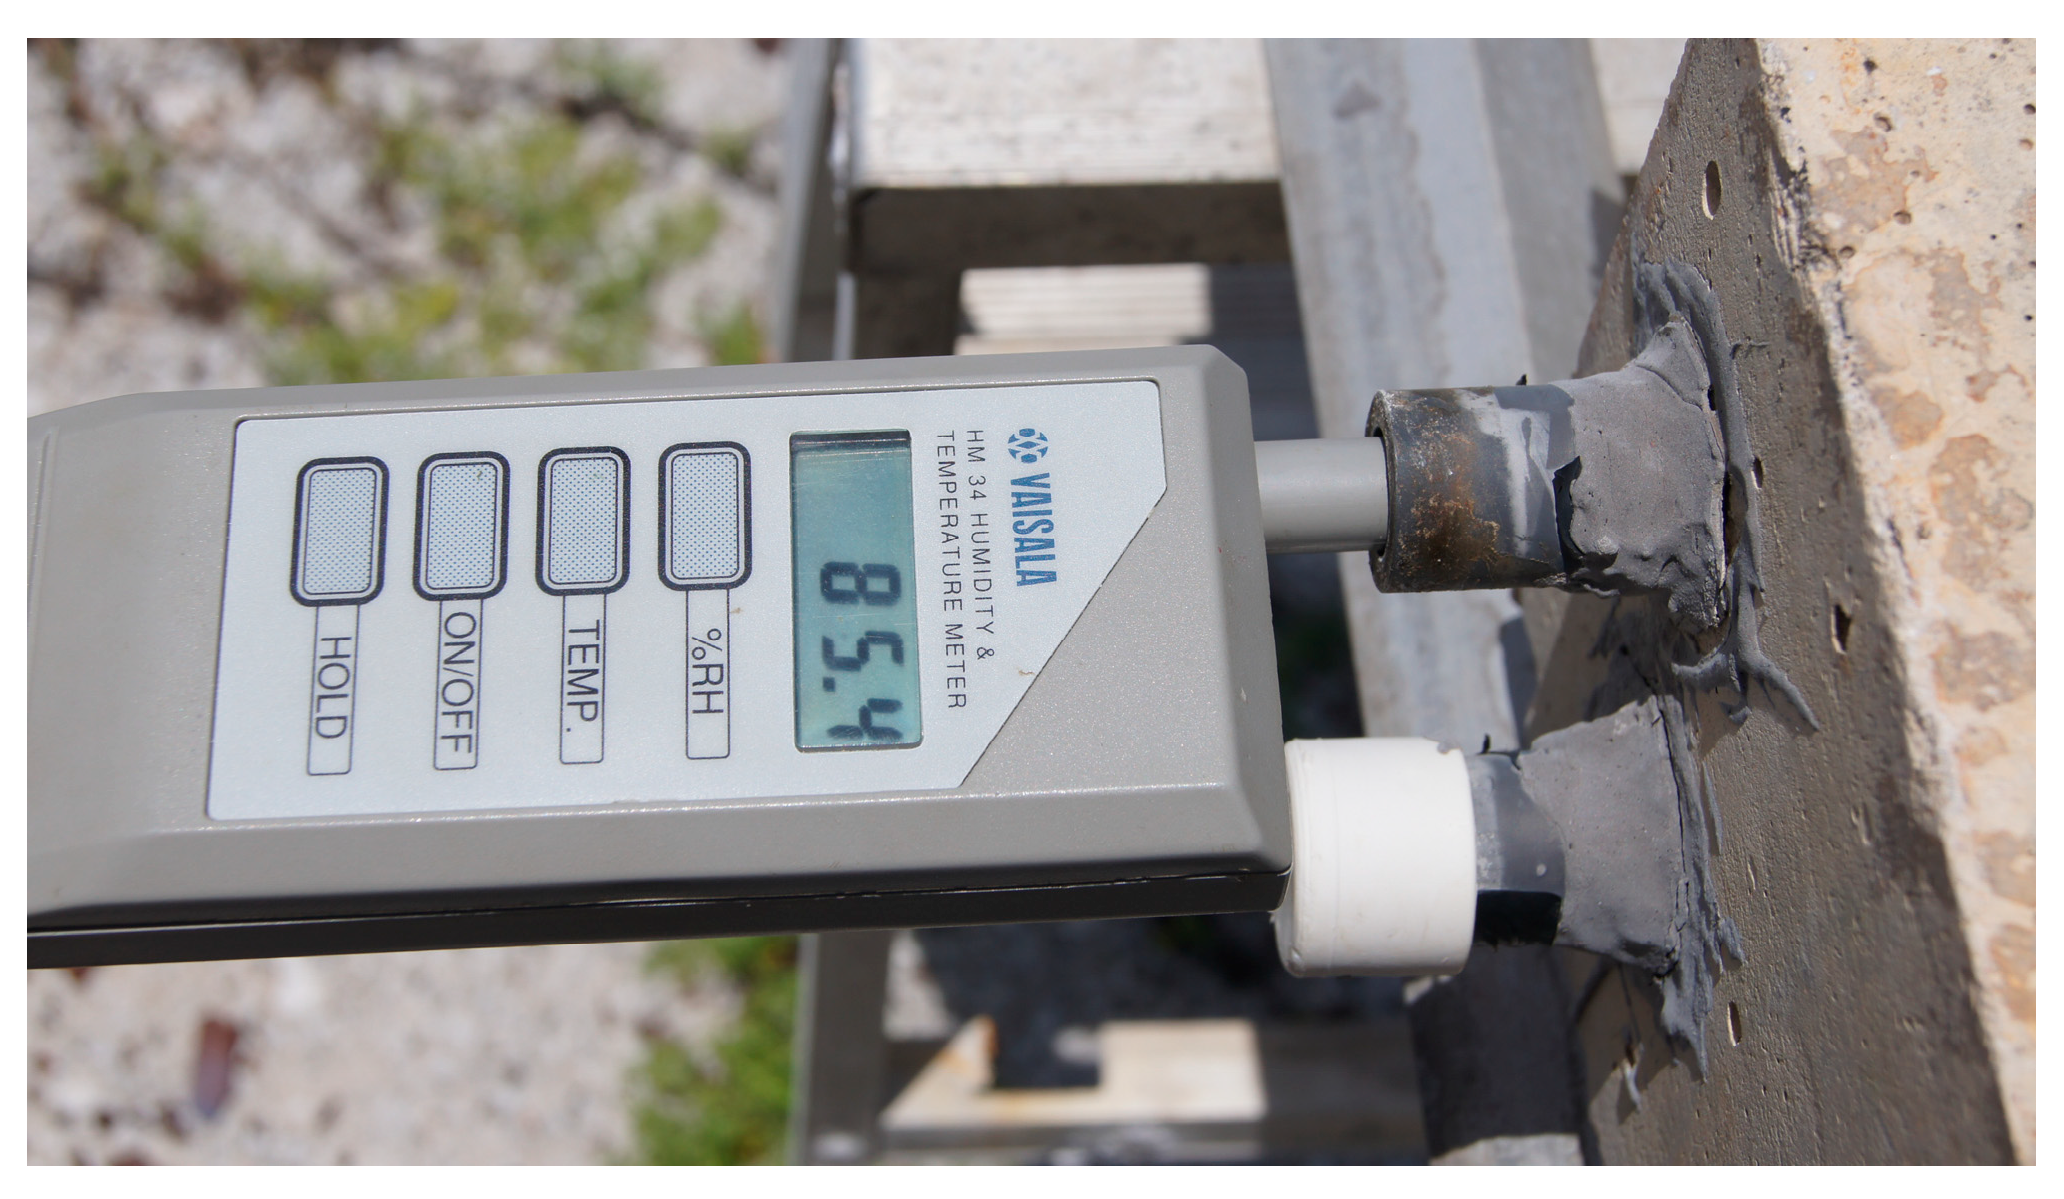
Using a portable probe (Figure 5), the internal relative humidity and temperature of the concrete were measured to identify their influence on the depassivation of the reinforcing steel or their impact at early ages on the electrochemical behavior of the reinforcements according to different design methods.
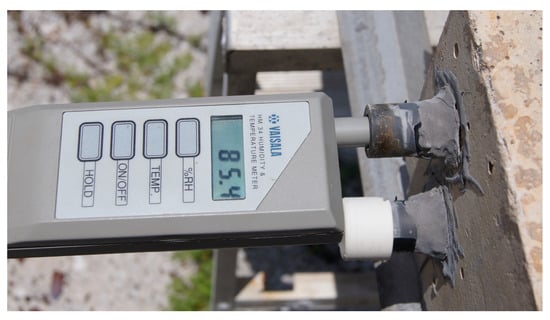
Figure 5.
Monitoring of internal relative humidity and temperature.
3. Results
The evaluation criteria of the electrochemical parameters obtained in this study can be consulted in the Mexican standards [34,35,36].
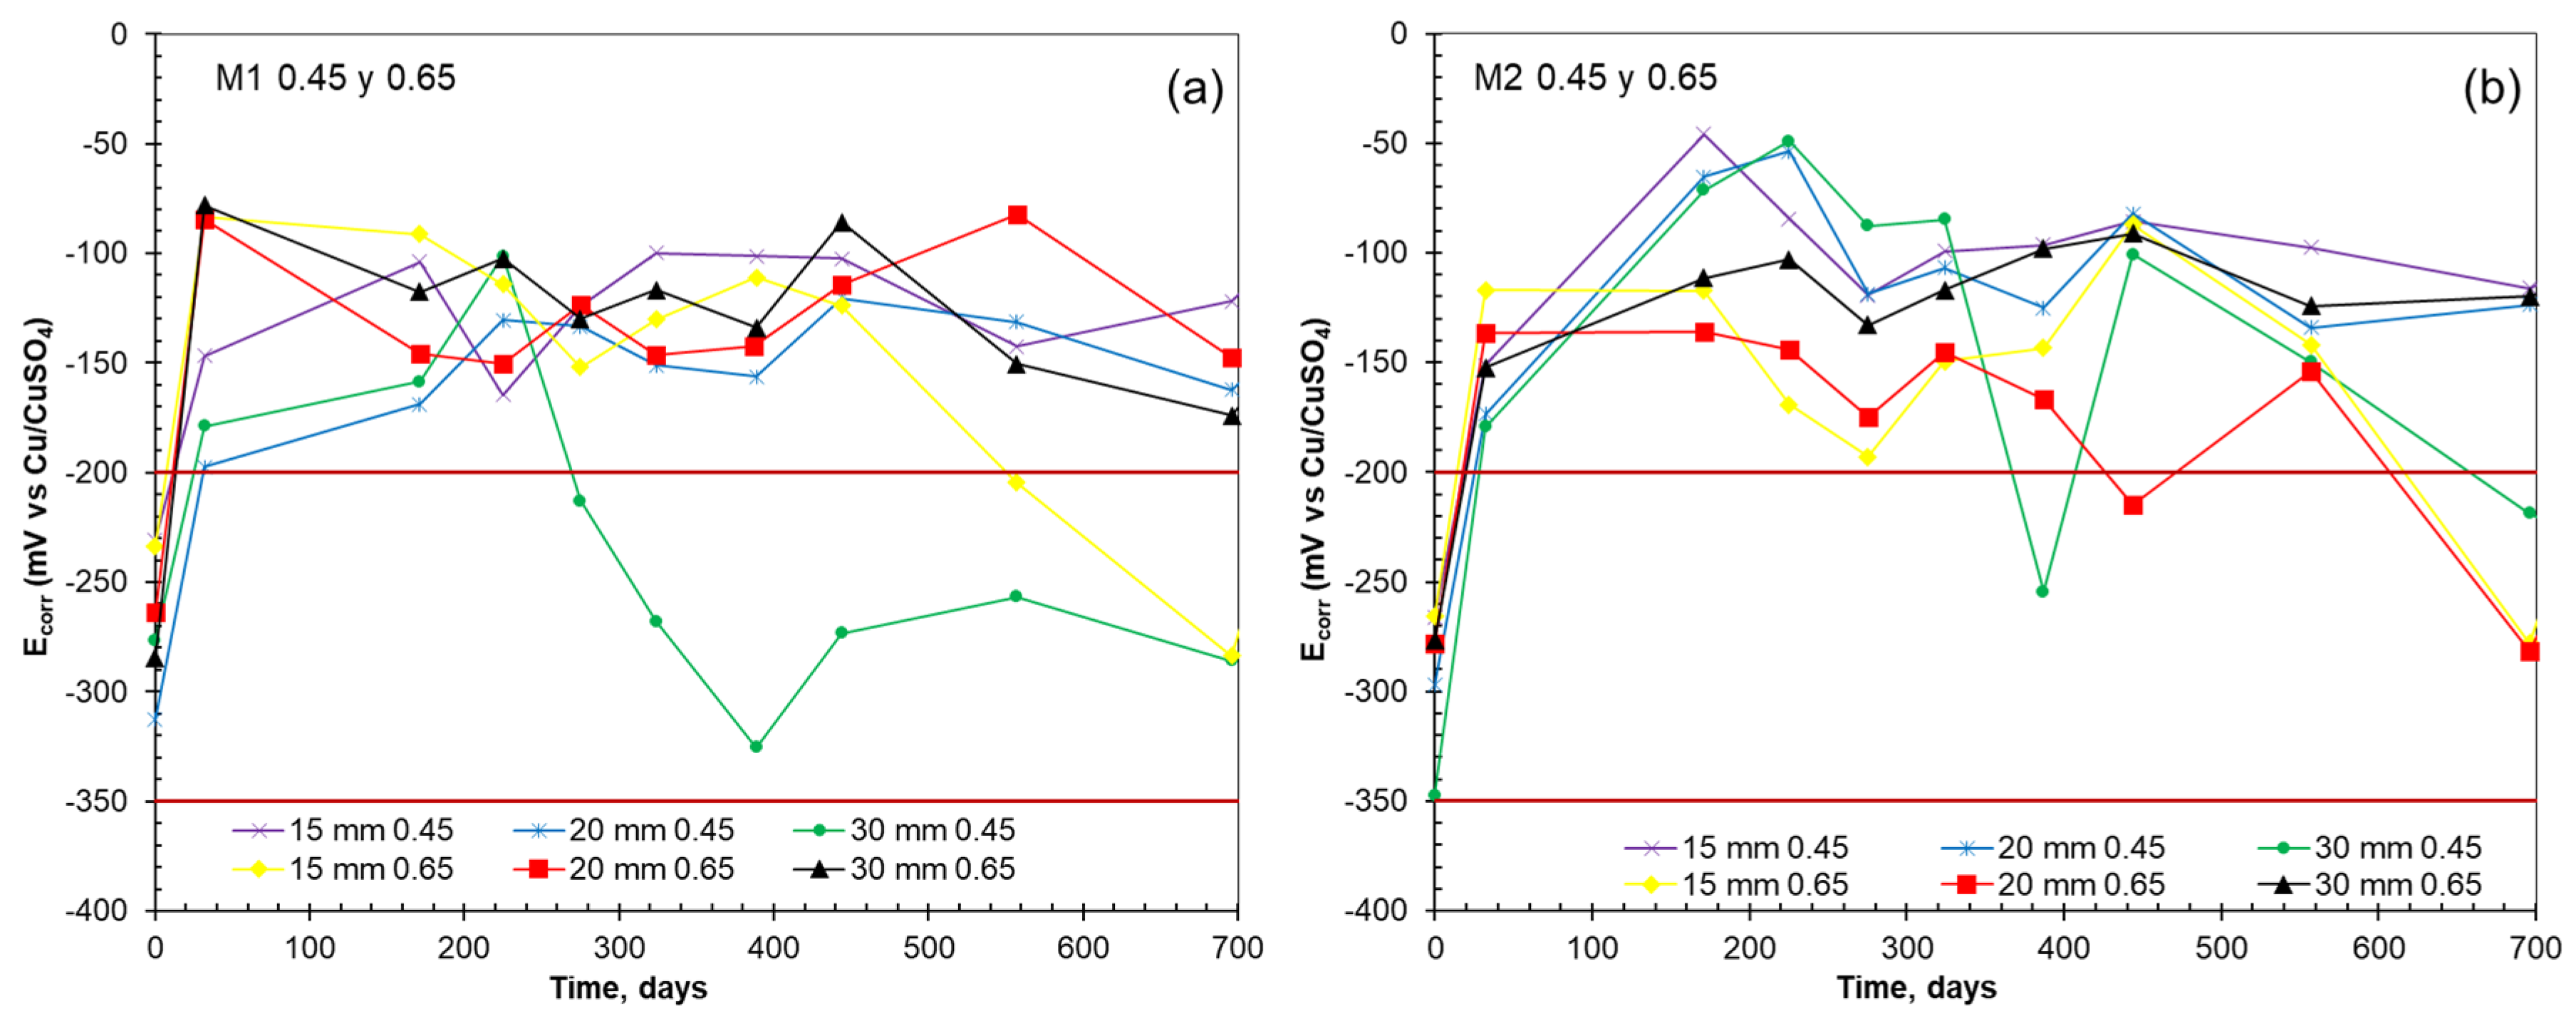
The results of Ecorr in Figure 6a, M1, show that the potential remains stable in the passive zone except for what is observed in the reinforcement placed at 30 mm and with a 0.45 w/c ratio (green trend) and at 15 mm and with a 0.65 w/c ratio (yellow trend). In the first case (green trend), a different behavior than expected is shown, since, within the applied methodology, it presents a greater cover thickness and a low w/c ratio, conditions in which aggressive agents would theoretically take longer to arrive; however, more negative values are presented in the potential, reaching the uncertainty zone according to the criteria of the regulations [36]. This w/c ratio corresponds to dense concretes with lower moisture content, which leads to a slow mobility of Cl− and, therefore, a reduction in the accumulation of Cl− on the surface of the reinforcing steel [20,37]. This behavior will be discussed later. In the second case (yellow trend), where the reinforcement is in concrete with a high w/c ratio and a depth of 15 mm, there is a tendency to the uncertainty zone, which is consistent with what is expected, where the concrete matrix is less dense, and with greater proximity to the surface. On the other hand, in the specimens designed with M2, Figure 6b, it can be observed that reinforcements with a cover thickness of 15 mm and 20 mm with a 0.45 w/c ratio, and 30 mm with a 0.65 w/c ratio, remain in the passivation zone at the end of the reported period. It is also noted that there is a difference in potential between the 0.45 and 0.65 w/c ratios, where at 15 and 20 mm the electrochemical activity is similar for each w/c ratio. The behavior of the green trend could be influenced by external factors. For the corrosion potential data to have a more complete meaning, it is important to analyze the behavior of the corrosion rate below.
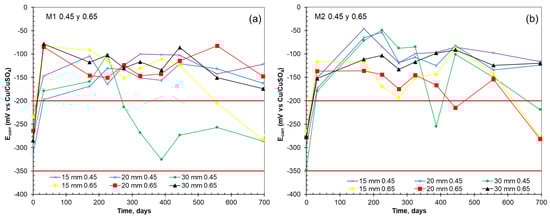
Figure 6.
Ecorr vs. time for 0.45 and 0.65 w/c ratios, (a) M1 and (b) M2.
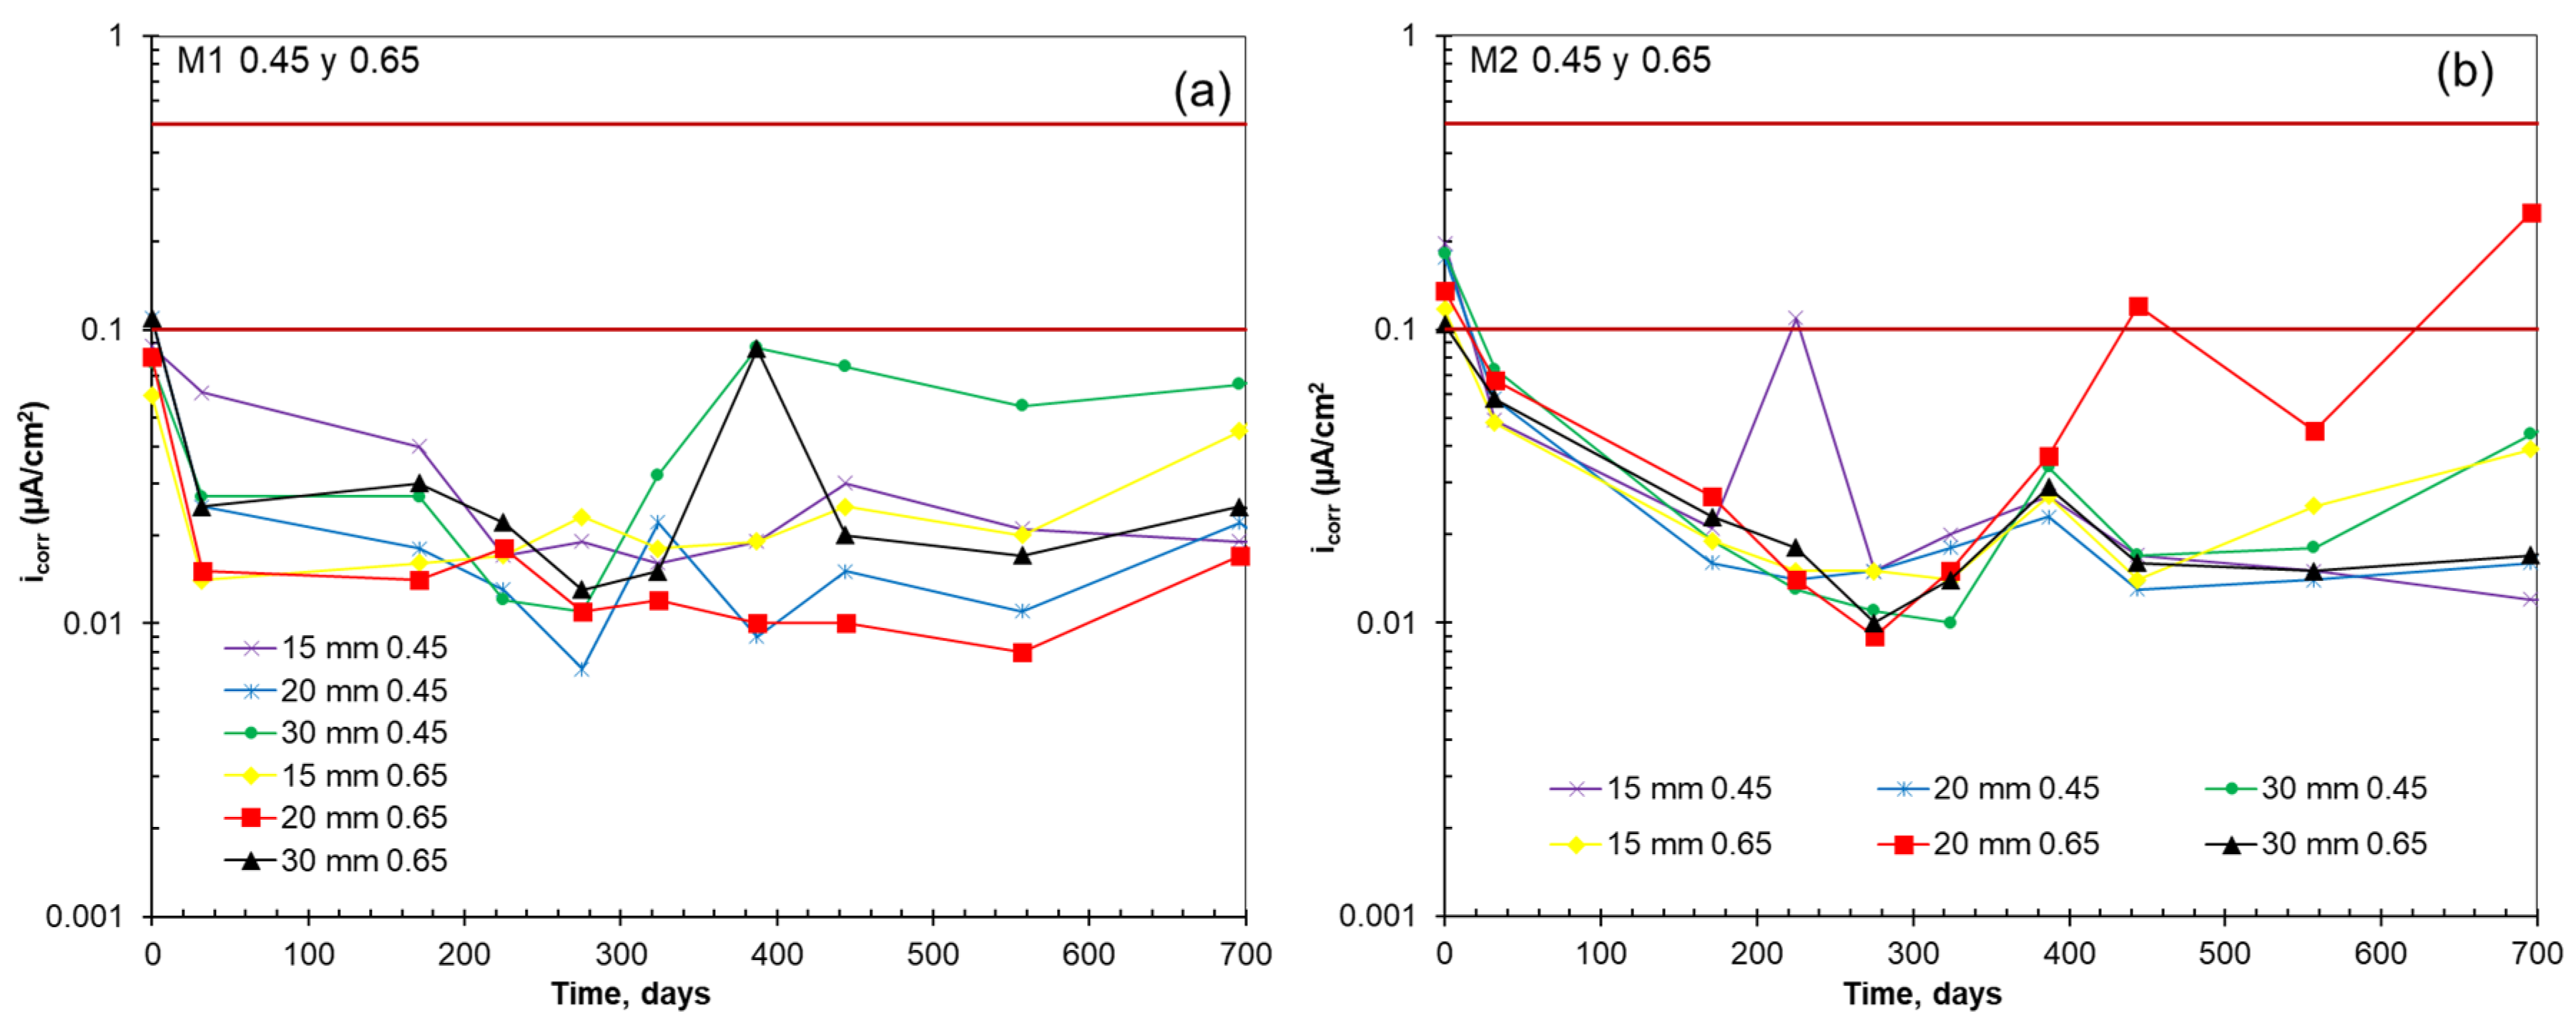
In Figure 7a,b, the results obtained from the analysis of icorr are presented, where the data of M1 specimens show greater dispersion in the entire study, unlike what occurs in the concrete with M2, which, in the first 300 days, presents a similar behavior in all the reinforcing steels. The two previous behaviors can be attributed to differences in the method design since, as mentioned above, M2 has a lower cement content and more aggregates, which causes a greater tortuosity and less penetration of aggressive agents into the reinforcing steel. Figure 7a shows that all steels, for M1, are below the lower corrosion threshold according to Mexican regulations [35]. In Figure 7b, the behavior of the reinforcement located at 20 mm in the M2 concrete for the 0.65 w/c ratio stands out, implying that, despite having good behavior in initial periods, at the end, it begins to approach the stage of depassivation, and this may be due to the characteristics of the aggregates used in the mix. In the Yucatán Peninsula region, aggregates come from limestone and could influence the durability of concrete due to their high porosity [38].
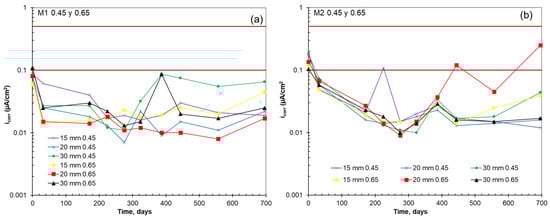
Figure 7.
icorr vs. time for 0.45 and 0.65 w/c ratios, (a) M1 and (b) M2.
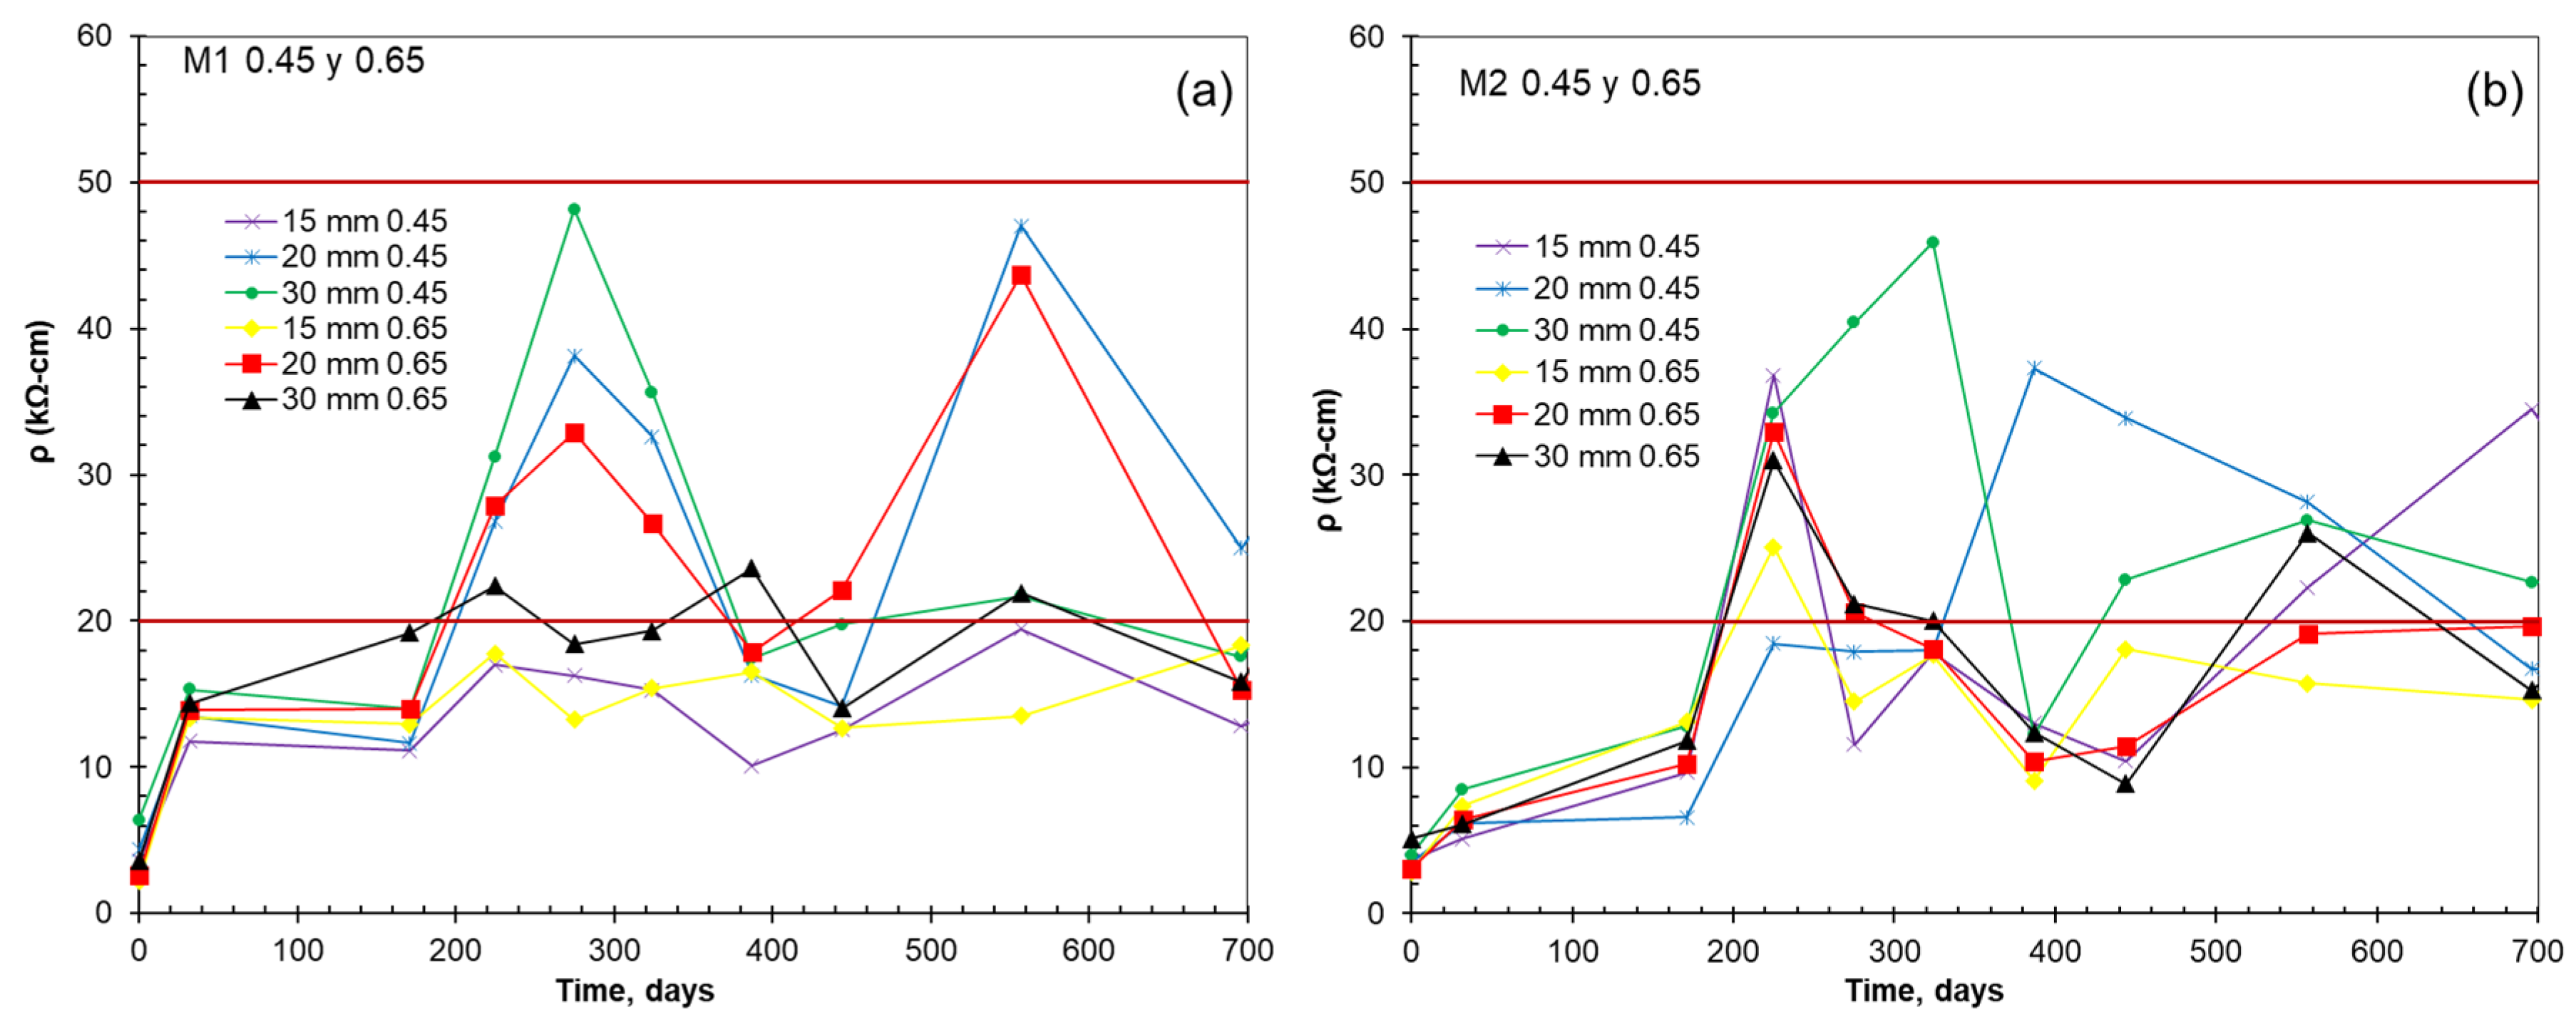
Figure 8a,b show the behavior of apparent resistivity of the two concrete design methods; at least at 700 days of exposure, there is no clear influence of concrete resistivity on the electrochemical behavior of the reinforcements regardless of the design method. However, it can be observed that resistivities, at least during the study period, are at the minimum level required to have durable concretes [34].
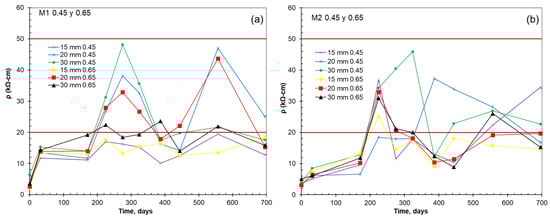
Figure 8.
ρ vs. time for 0.45 and 0.65 w/c ratios, (a) M1 and (b) M2.
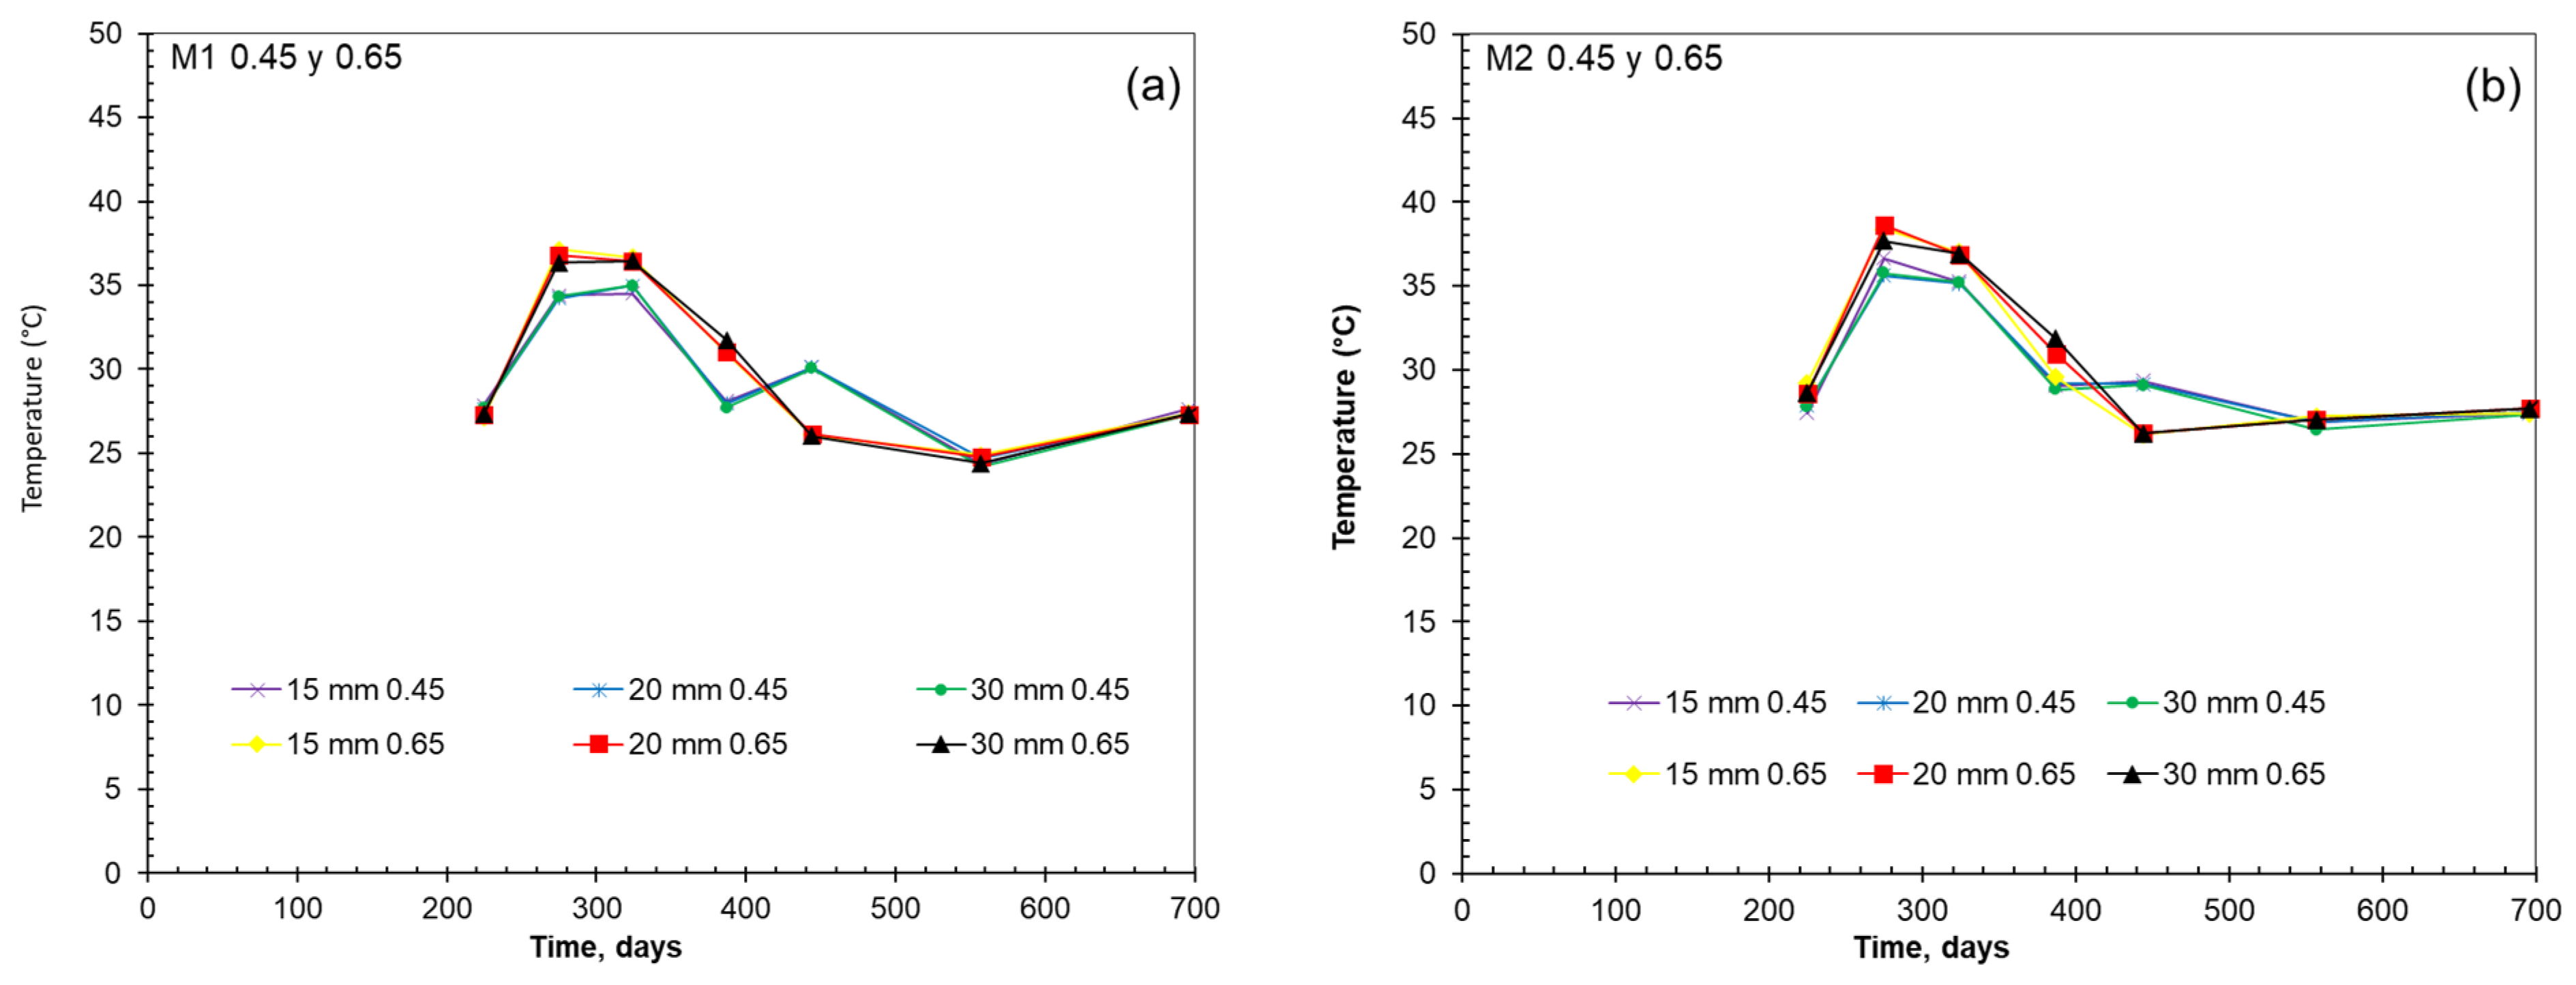
Figure 9, Figure 10, Figure 11 and Figure 12 show the fluctuations in temperature and relative humidity regarding time, which can be attributed to the different internal microstructures of the aggregates. Although they come from the same source, this would not be a restriction to having a different porosity or fragility. These differences could manifest in their coefficients of thermal expansion, which could cause microcracks [39,40]. It can be observed that there is a similar behavior in all reinforcing steels regardless of their cover thickness (15, 20, or 30 mm) or the design method used (Figure 9a,b), regarding the water/cement ratios. It can also be noted that, regardless of the design method, the samples with the lowest water/cement ratio have a smaller gap between the minimum and maximum temperature.
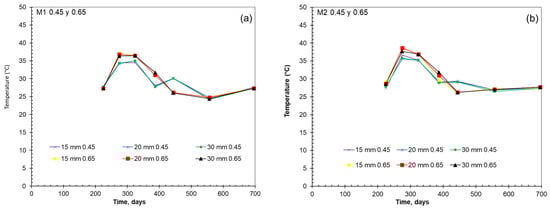
Figure 9.
T vs. time for 0.45 and 0.65 w/c ratios, (a) M1 and (b) M2.
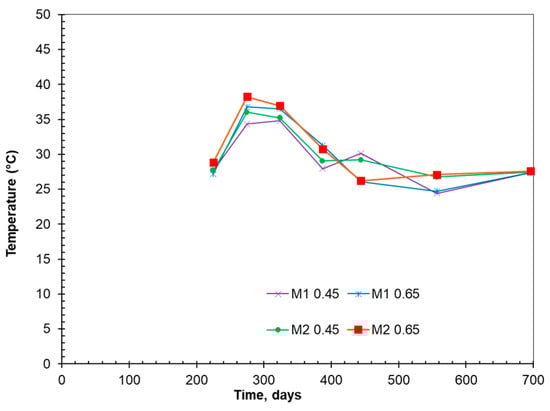
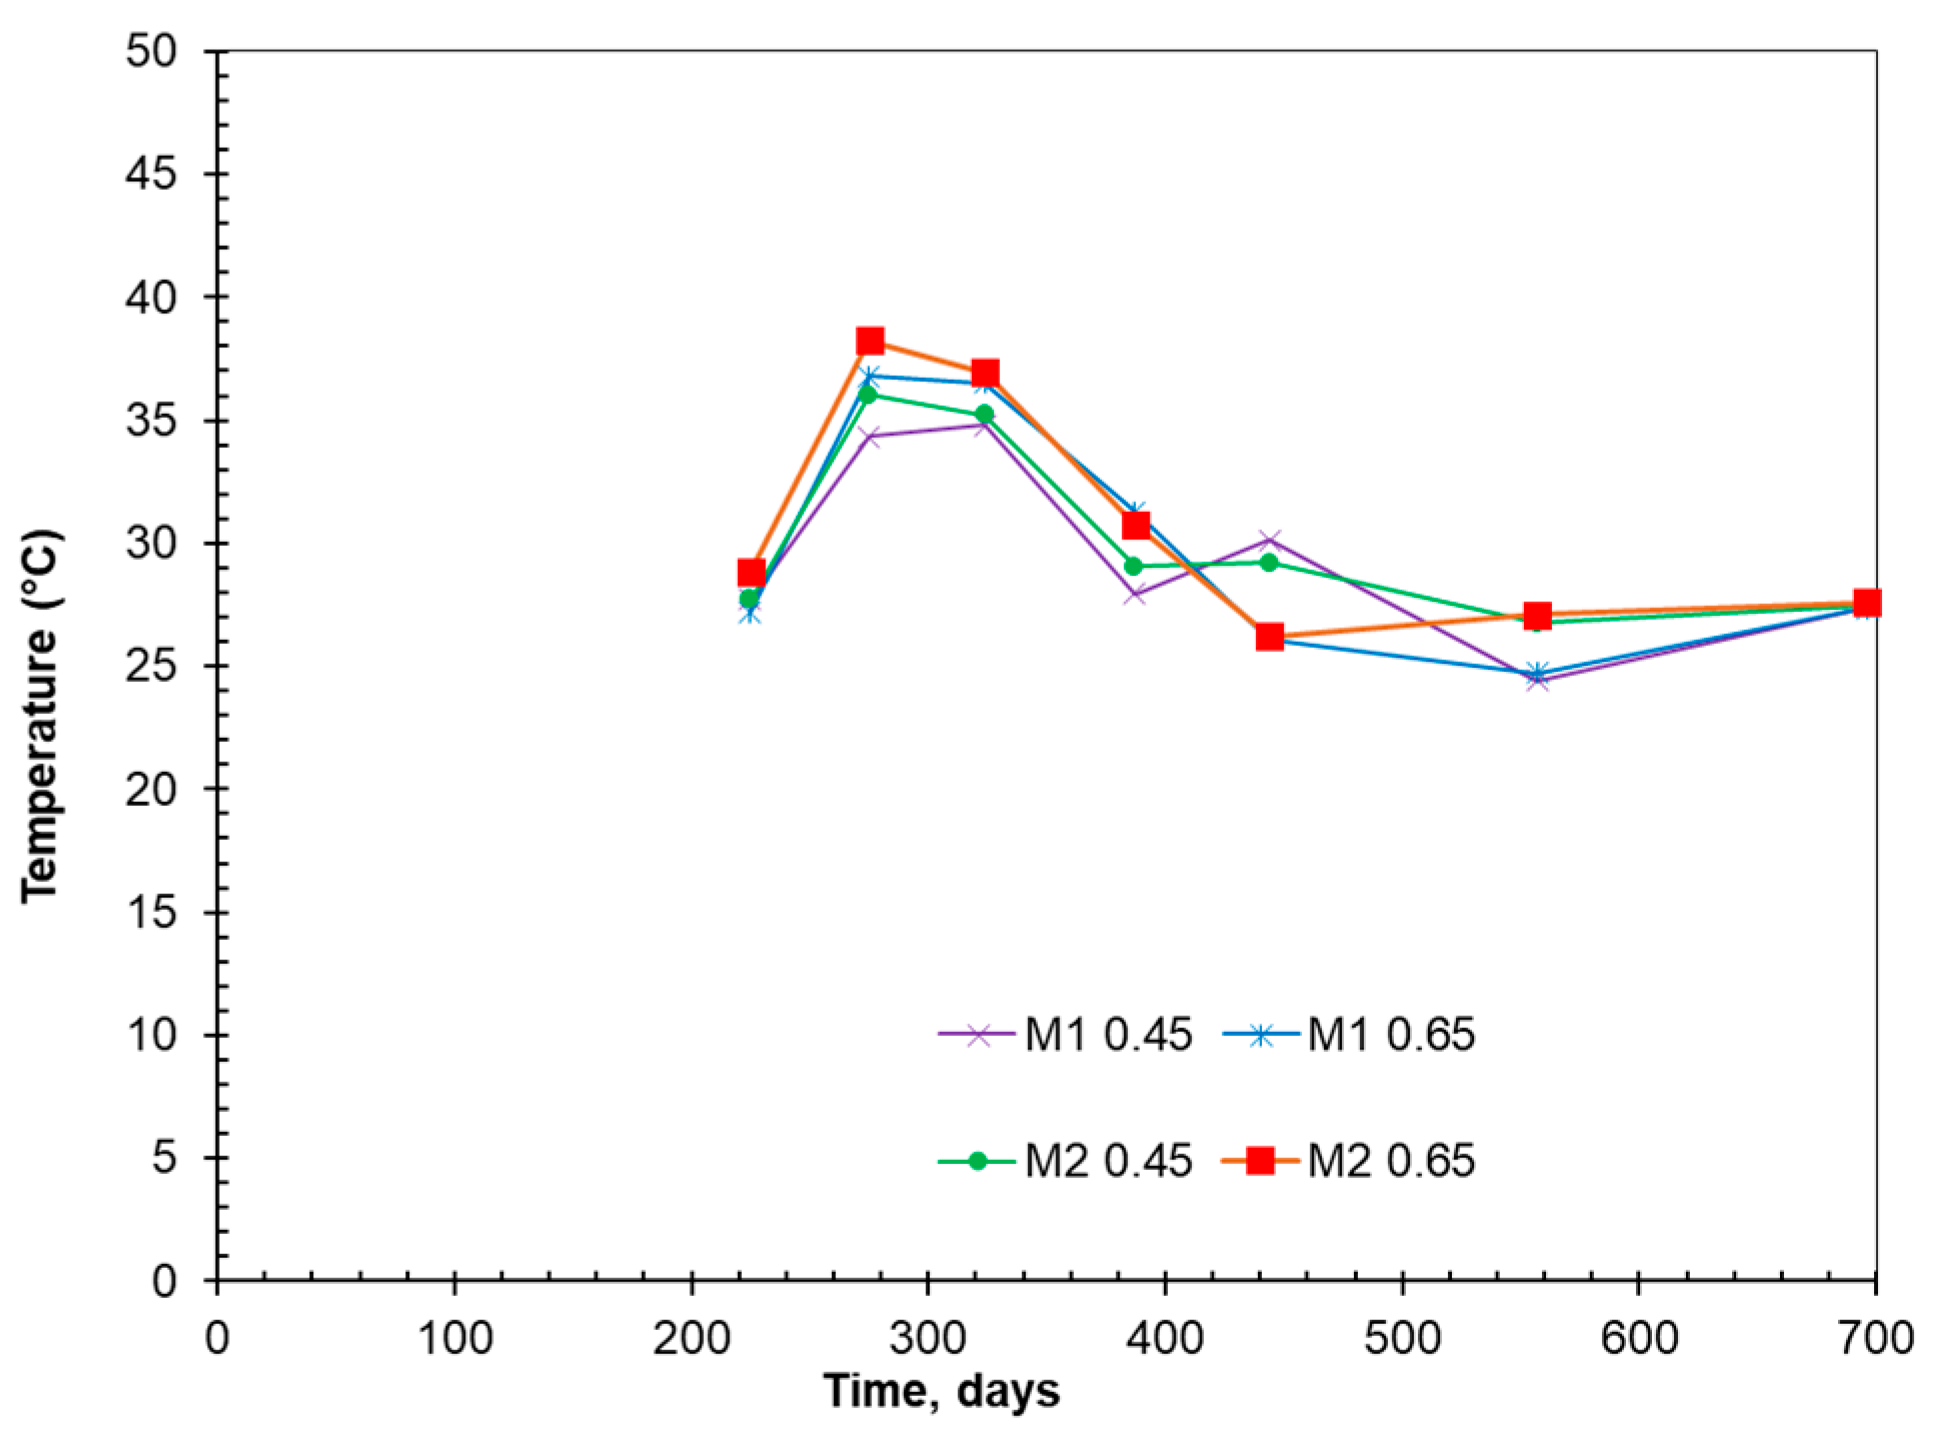
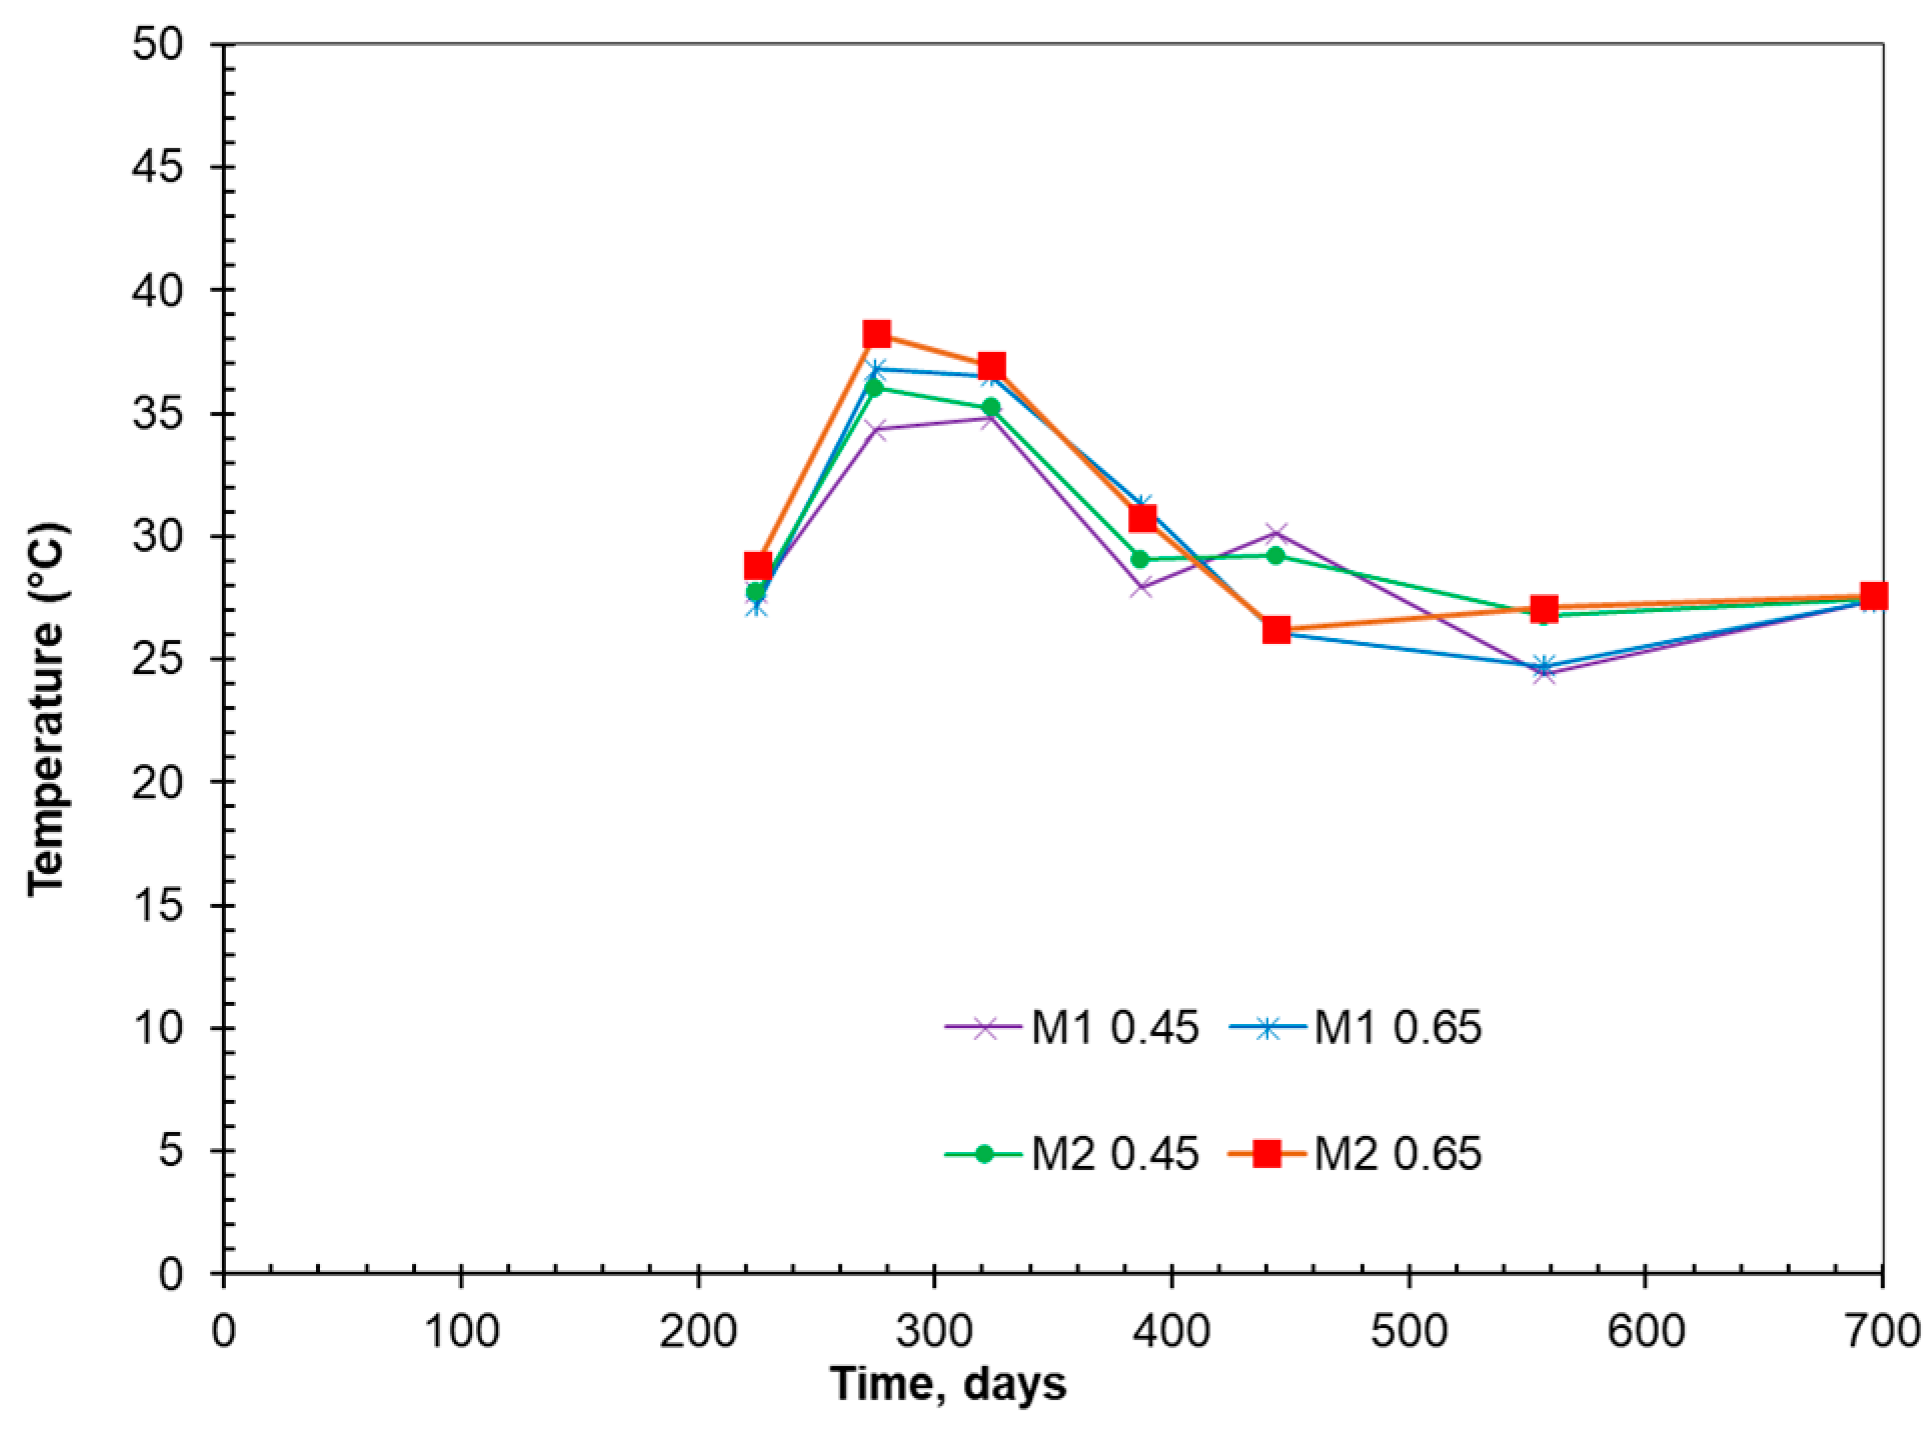
Figure 10.
Mean T vs. time for 0.45 and 0.65 w/c ratios in M1 and M2.
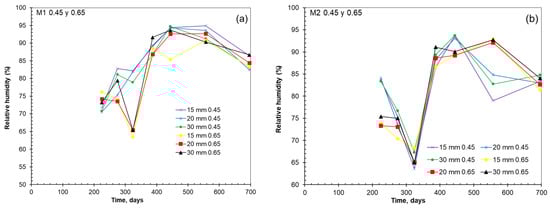
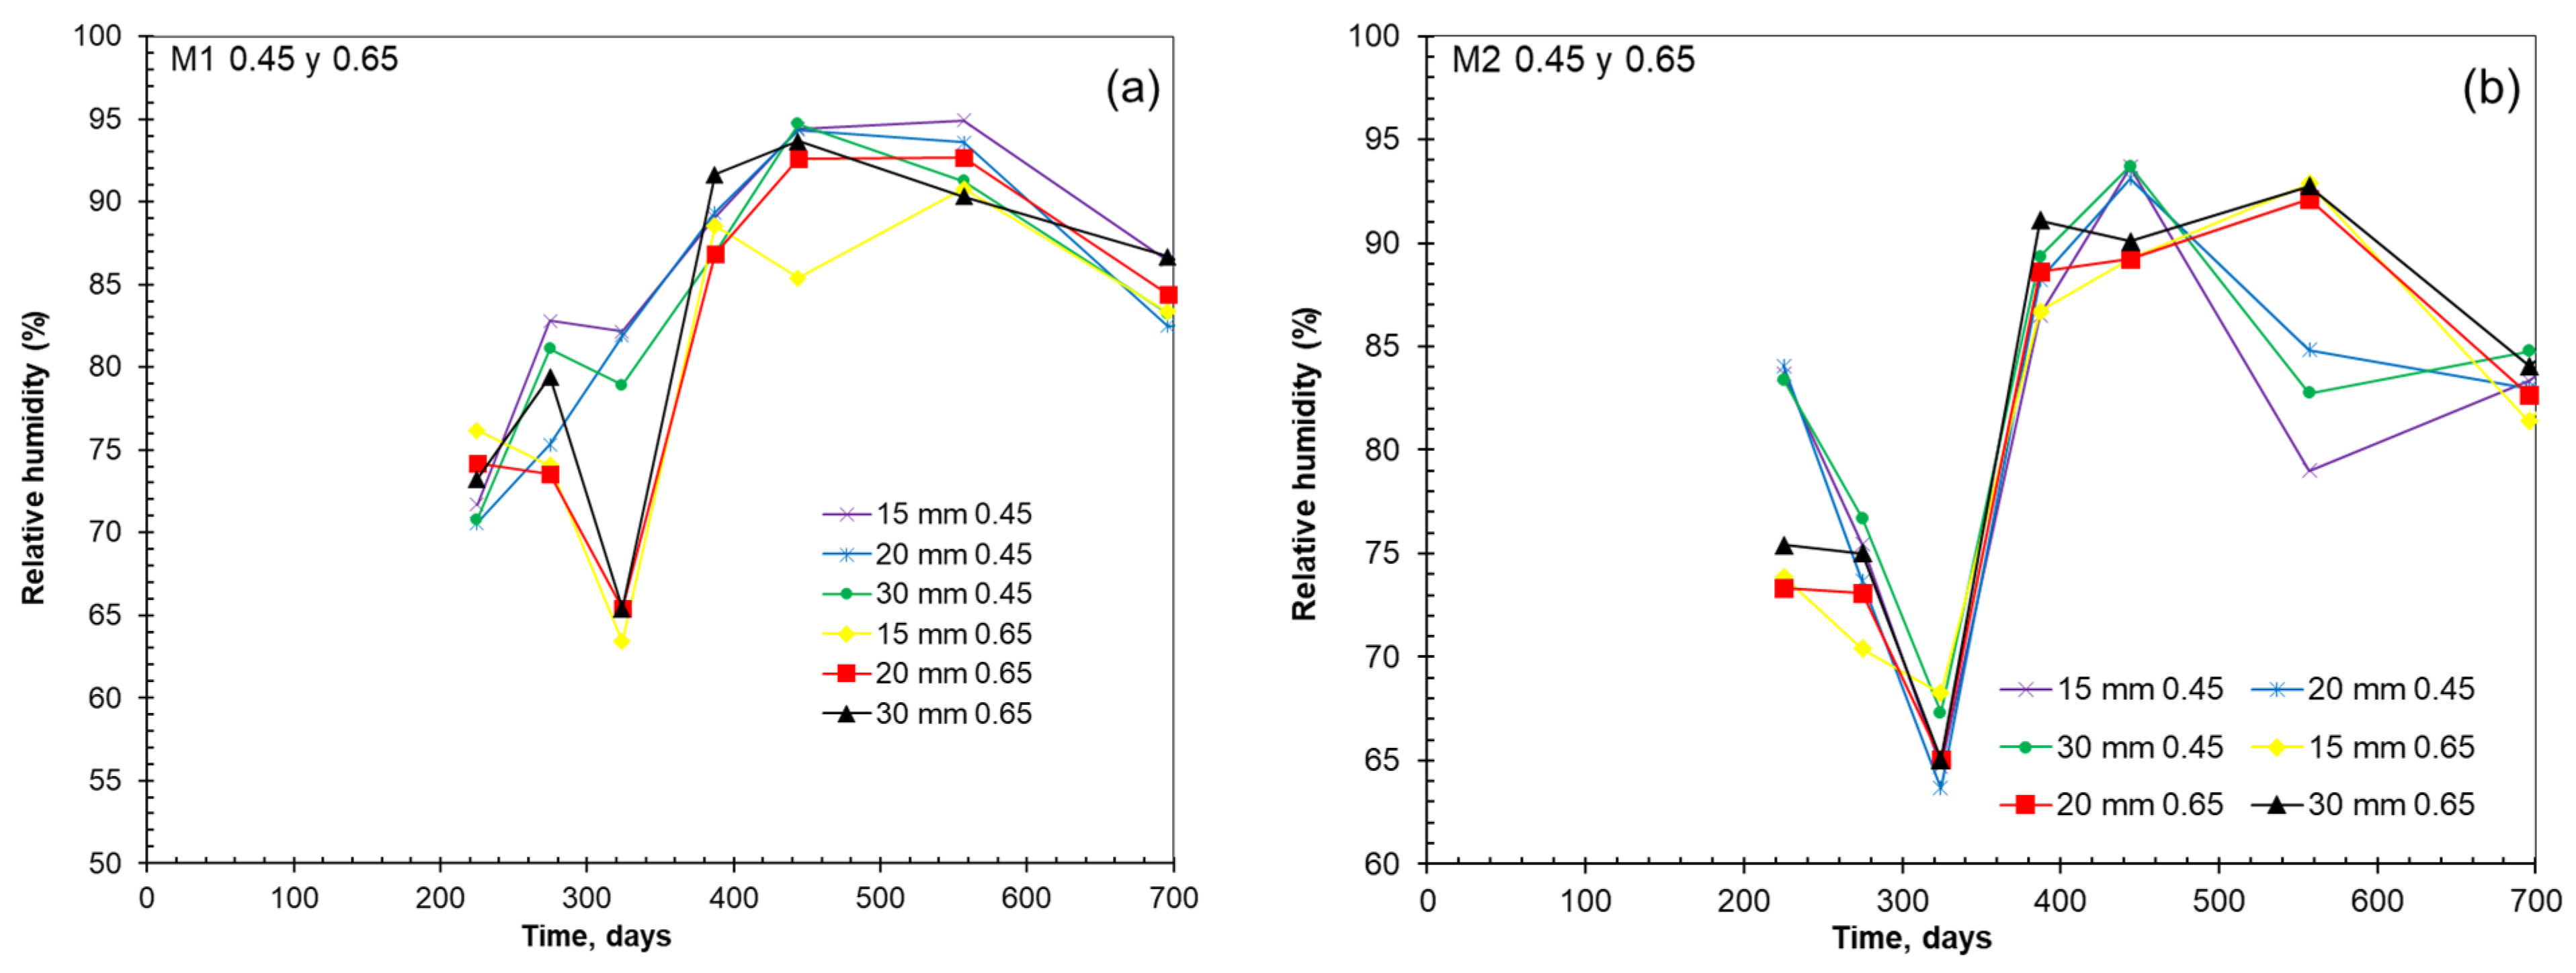
Figure 11.
RH vs. time for 0.45 and 0.65 w/c ratios, (a) M1 and (b) M2.
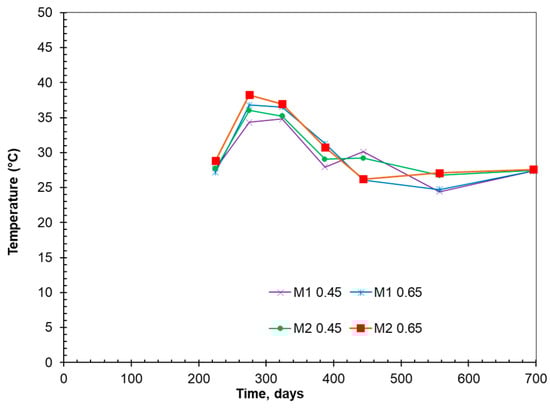
Figure 12.
Mean RH vs. time for 0.45 and 0.65 w/c ratios, with M1 and M2.
Figure 10 shows the mean temperatures for each design method and the w/c ratio. As in the previous figure, there is no marked difference between the two methods that would justify [2,41] the observed behaviors in Figure 6, Figure 7 and Figure 8.
In general, the behavior of RH follows an identical pattern for both methods, except for some specific cases. For example, beams with a 0.45 w/c ratio, using M1, showed high RH at 315 days of exposure (Figure 11a). Similarly, M2 beams with a 0.45 w/c ratio showed high RH at 200 days and low RH at 550 days of exposure (Figure 11b). Both cases could be considered isolated, and the information gathered may not be sufficient to establish relationships between them. This is confirmed by the information provided in Figure 12.
The various results shown so far do not clearly reveal the differences between the observed trends based on the w/c ratio, the design method (M1 and M2), or even among bars at different depths. Therefore, it is necessary to analyze the results from a different perspective, which is discussed below.
4. Discussion
Analysis of the areas under the curve (cumulative data) of the studied parameters (Ecorr, icorr, ρ, T, and RH) allows obtaining a clearer understanding of the differences between the two concrete mix design methods (M1 and M2) during the passivity state. These areas provide valuable information on the behavior of the parameters over time, rather than just isolated changes that may be due to various external factors [42]. Although these data do not always have a direct physical interpretation, they indicate qualitative differences among several parameters. When applied in this context, they could provide valuable insights into what occurs before passivation, allowing the implementation of preventive measures [43]. Cumulative data analysis was first introduced by Andrade [44].
The cumulative data are calculated by integrating the area under the curve of each electrochemical and internal condition parameter (Ecorr, icorr, ρ, T, and RH) over the 700-day exposure period. This approach transforms discrete measurements into continuous trends, which highlight long-term behavior rather than transient fluctuations. The trapezoidal rule (numerical integration) is applied to compute the area under the curve for each parameter at each time interval, as shown in Equation (4), for the cumulative corrosion rate.
where tk represents measurement intervals.
Figure 13, Figure 14, Figure 15 and Figure 16 are presented together with their respective subsections (a) and (b). These figures show the cumulative values of corrosion potential, corrosion rate, resistivity, temperature, and relative humidity, depending on depth and each method (M1 and M2).
4.1. Cumulative Corrosion Potential
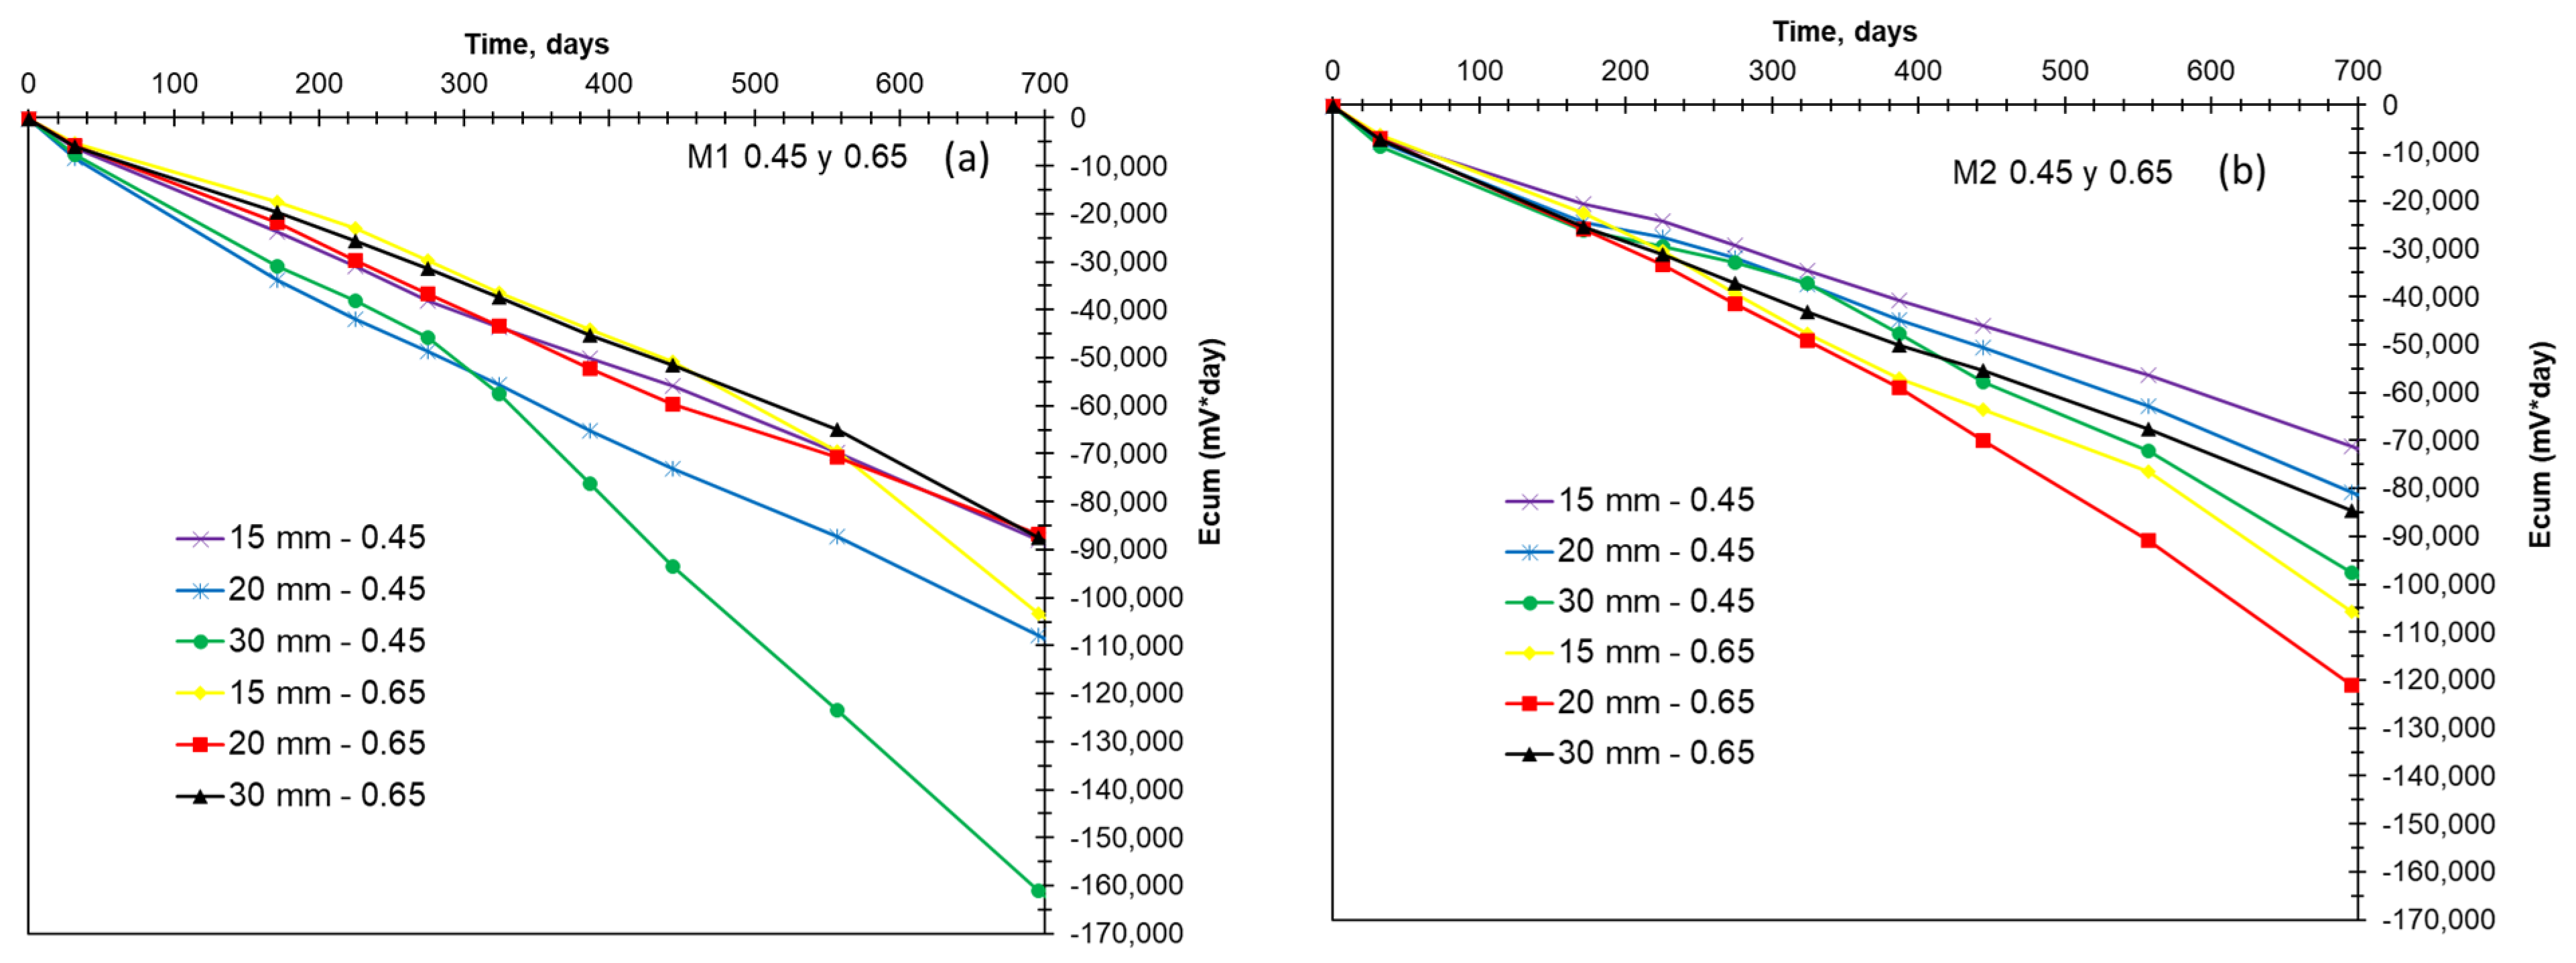
Figure 13 presents the cumulative data of the corrosion potential (Ecum) for the two concrete mix design methods (M1 and M2). These data are only qualitative but can provide information that contributes to the description of the electrochemical behavior of the specimens. In Figure 13a, corresponding to M1, it is observed that the cumulative corrosion potential remains quite stable over time. However, at 300 days, the steel at 30 mm and with a w/c ratio of 0.45 shows a tendency to depassivation due to a large change in slope, which could be influenced by the edge effect [45]. The edge effect occurs when chloride contamination originates not only in the X direction (wind direction) but also in the Y direction (evaporation of soil water and access of atmospheric chlorides to the underside of the beam). Thus, penetration occurs along the X and Y axes for the 30 mm coating, while only along the X axis for the 20 and 15 mm coatings. Therefore, the interaction between environmental exposure and geometric discontinuities might have intensified chloride accumulation at the corners or edges of the beam, even at 30 mm depth, and then the electrochemical parameters. In the case of the upper part of the beam, this phenomenon is not observed, perhaps because the time of wetness must be shorter than in the lower part. It is necessary to analyze the data within a longer period to observe the overall influence of the edge effect for both the bottom and upper part, since they were not protected against environmental agents’ penetration to simulate real conditions. In contrast, in Figure 13b with M2, fewer variations in the accumulated potential are observed, with a greater tendency for reinforcements located at a w/c ratio of 0.65, which could indicate better performance in those made by this method, by having a strategic distribution of aggregates to minimize pore size. This cumulative representation, like that presented in Figure 14 (cumulative corrosion rate) and Figure 15 (cumulative resistivity), allows the global evolution of electrochemical parameters to be visualized over time, complementing the specific measurements shown in Figure 6, Figure 7, Figure 8, Figure 9, Figure 10, Figure 11 and Figure 12. Together, these graphs provide a more comprehensive view of the electrochemical behavior of the specimens, highlighting differences between the methods. In this context, while individual measurements may fluctuate due to environmental factors and the inherent variability of the system, cumulative data provide global information.
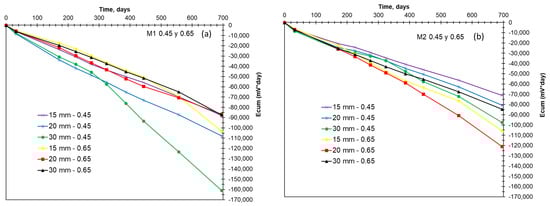
Figure 13.
Ecum data vs. time for 0.45 and 0.65 w/c ratios, (a) M1 and (b) M2.
Figure 13.
Ecum data vs. time for 0.45 and 0.65 w/c ratios, (a) M1 and (b) M2.
4.2. Cumulative Corrosion Rate
The cumulative corrosion rate (icum) (which kinetically has electrochemical significance) data (Figure 14a,b) reveal that the M2 method has a greater tendency towards early depassivation compared with M1. It remains uncertain whether this trend will persist afterward, as the specimens transition from the passive to the active state. However, it indicates that even with equal w/c ratios, M2, despite being a method that manipulates aggregate size and pore tortuosity, does not guarantee slower deterioration while the specimens are in the passive state. While M2 is more sustainable due to its lower cement usage, it also reduces the amount of calcium hydroxide available in the concrete matrix. Calcium hydroxide is essential for maintaining passivity in the sample through an alkaline environment that protects the reinforcing steel from corrosion [46]. In these circumstances, and if the trend continues during the active state, it is essential to compensate for the minimized cement content with additional protection, ensuring that this approach remains sustainable, as the lower amount of cement can affect the concrete’s ability to resist chloride penetration, especially in aggressive marine environments.
Although M2 uses a strategic distribution of aggregates to minimize pore size and increase tortuosity, this effect does not appear to be sufficient to compensate for the reduction in cement content during the study period. It is expected that tortuosity will begin to have a greater influence in the later stage, when the electrochemical behavior approaches a consolidated depassivation [21], in terms of icorr.
Specimens with a 0.65 w/c ratio show a greater tendency to depassivation compared with those with a 0.45 w/c ratio, regardless of the design method. This is expected, as a higher w/c ratio results in a more porous and permeable concrete matrix, which facilitates the penetration of chlorides and other corrosive agents [47].
Specimens with a 0.65 w/c ratio and a cover thickness of 20 mm show a behavior closer to the uncertainty zone, suggesting that these conditions are the most unfavorable for concrete durability. This may be due to the edge effect, consistent with previously reported findings [45]. This effect requires caution and further investigation to determine whether depassivation will result from environmental influences on the exposed surface or from wetting and drying cycles due to environmental interactions with the soil, despite being at a height of 1.0 m above ground level.
The cumulative icorr data show two major changes in the slope for the 0.65 w/c ratio in M2, indicating that, according to P. Castro-Borges et al. [42], depassivation is imminent due to the interaction of all variables. In contrast, the behavior of the accumulated icorr for the 0.45 w/c ratio at 30 mm of cover thickness has one change in slope, meaning that there is a probability of corrosion. In contrast, all remaining reinforcements have small slopes, which means that they will remain passive for a longer period.
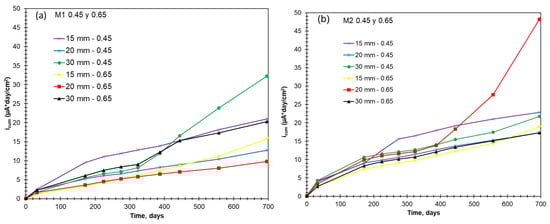
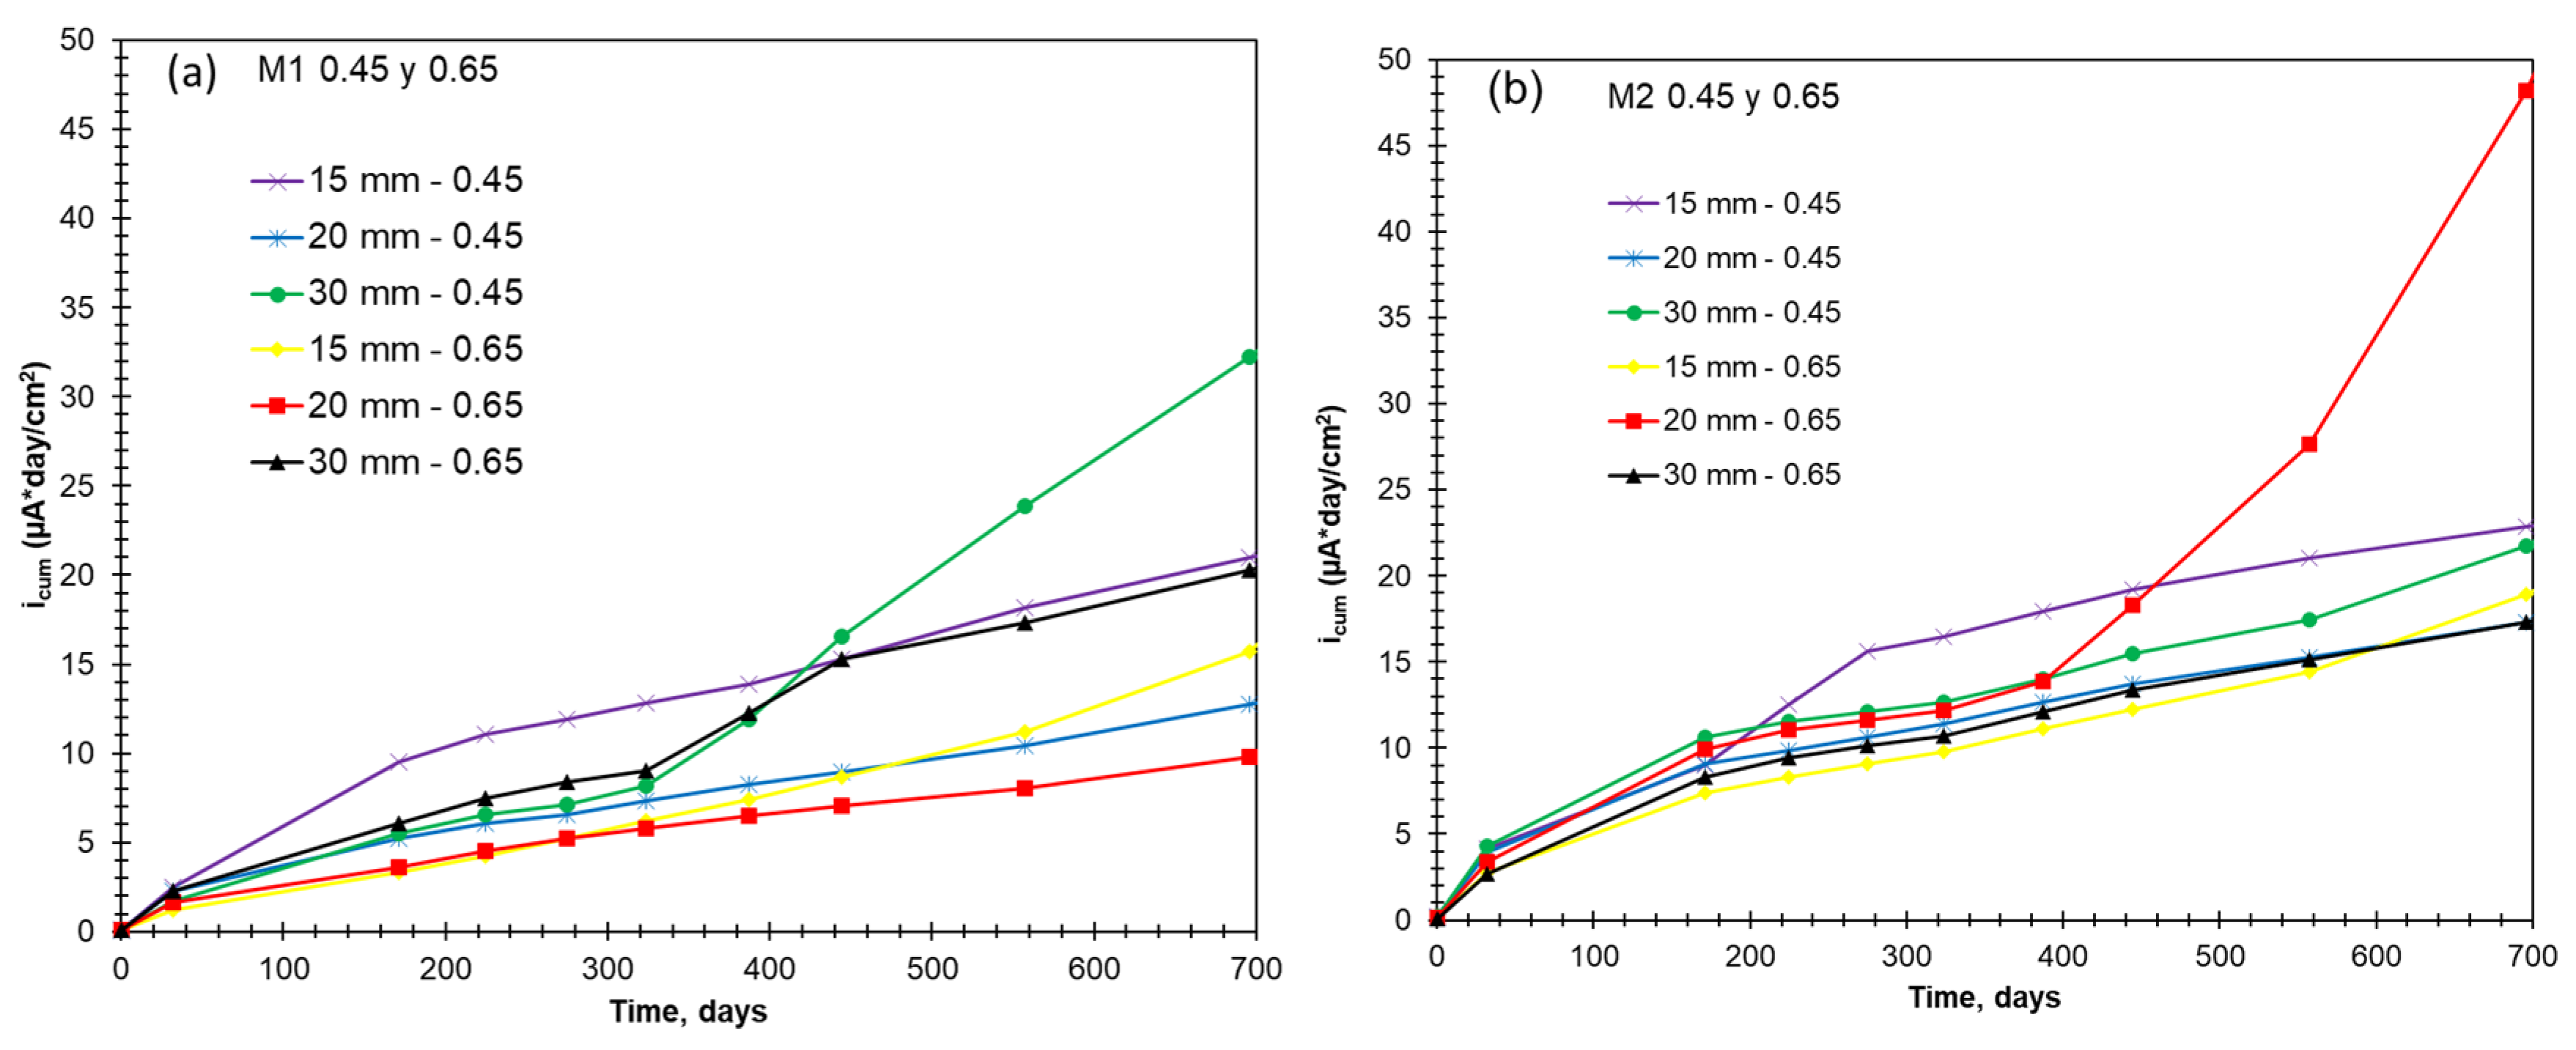
Figure 14.
icum data vs. time for 0.45 and 0.65 w/c ratios, (a) M1 and (b) M2.
Figure 14.
icum data vs. time for 0.45 and 0.65 w/c ratios, (a) M1 and (b) M2.
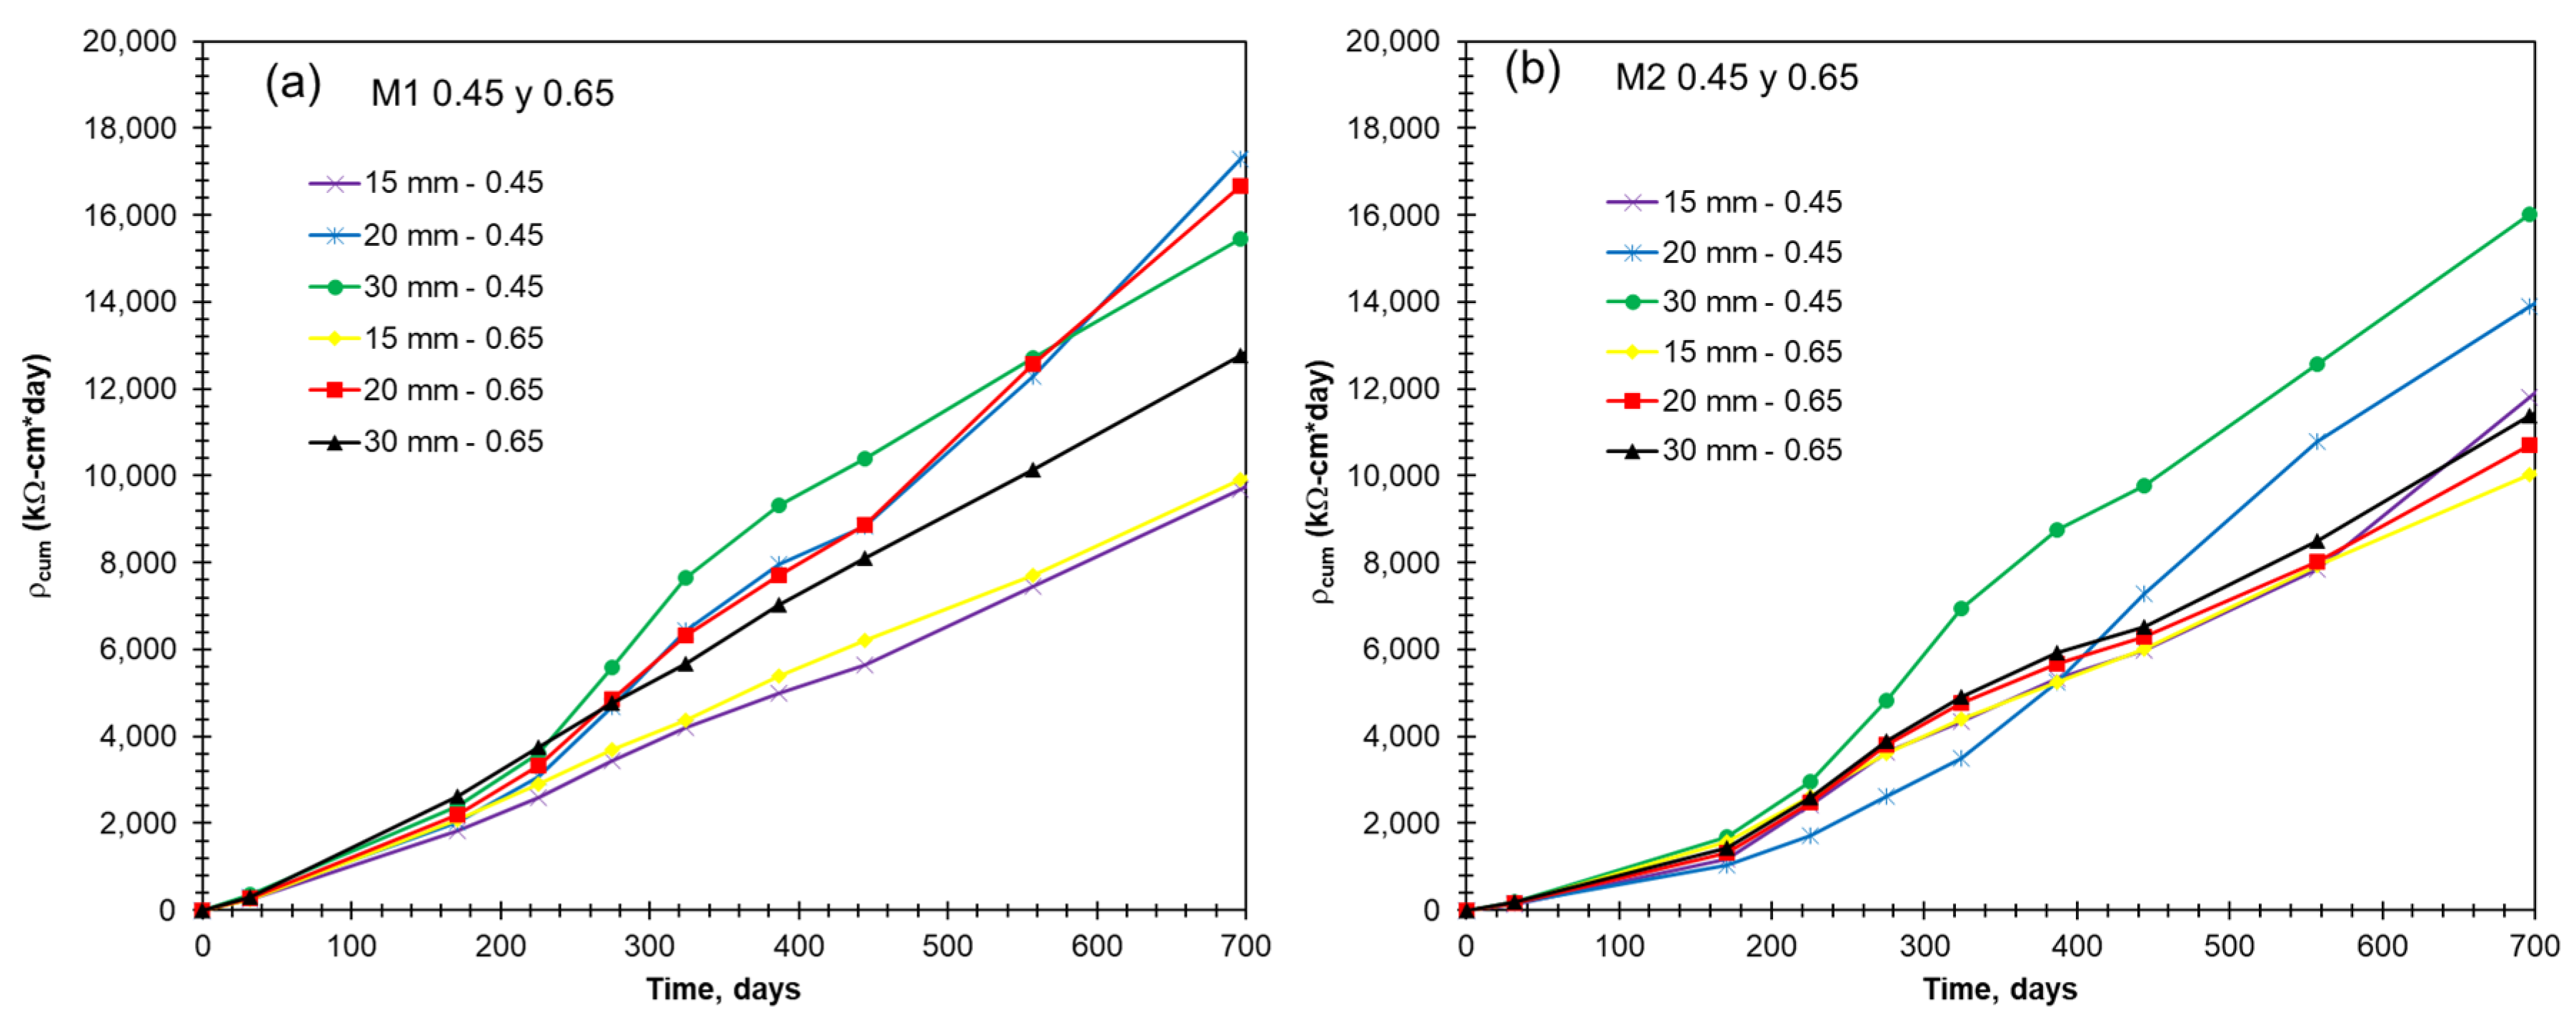
4.3. Cumulative Resistivity
The cumulative resistivity (ρcum) of concrete (Figure 15a,b) is an important indicator of its ability to resist penetration by corrosive agents. Although quantitatively these values may not seem significant, qualitatively they are. As can be seen, during the first three months of exposure, the resistivity remains similar in both methods, regardless of the w/c ratio or depth, suggesting that differences in mix design do not have a significant impact at this early stage. However, from this point onward, resistivities begin to diverge. One factor that could be influencing the behavior of the beams is the tortuosity of the M2 mixtures, along with the possible carbonation of the concrete.
In the M1 method, specimens with a 0.65 w/c ratio show increased resistivity after three months of exposure. This could indicate a more advanced carbonation process in these specimens, as carbonation reduces the alkalinity of the concrete, seals pores, and apparently increases its resistivity [48]. In contrast, the M2 method, with its higher pore tortuosity, could delay CO2 penetration, which would explain why resistivity does not increase as much as in M1. Although resistivity does not show a direct influence on the electrochemical behavior of the reinforcements during the study period, it is likely that chlorides will begin to have a more significant impact after depassivation. In this sense, and based on what was observed in the specimens, the tortuosity of the pores in M2 could be beneficial in delaying the penetration of chlorides in later stages [21].
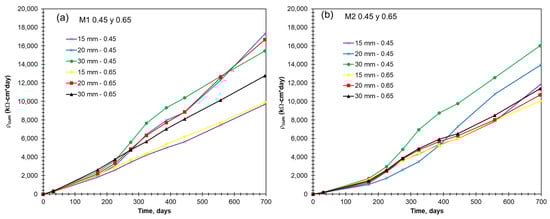
Figure 15.
ρcum data vs. time for 0.45 and 0.65 w/c ratios, (a) M1 and (b) M2.
Figure 15.
ρcum data vs. time for 0.45 and 0.65 w/c ratios, (a) M1 and (b) M2.
4.4. Cumulative Temperature and Relative Humidity
Temperature and relative humidity measurements (Figure 16 and Figure 17) show no significant differences between the two design methods. Temperature plays an important role in the events that lead to depassivation. Although cumulative temperature values may not directly reflect the underlying processes, they do provide qualitative information through the area under the curve. This representation helps to better understand, in qualitative terms, the cycles that occur within the concrete at the three depths studied. In addition, it serves as a point of comparison, validation, and correction against the kinetic data of cumulative corrosion.
Figure 16a M1 and Figure 16b M2 show the cumulative behavior of temperature (Tcum). Regardless of depth or w/c ratio, the cumulative temperatures are almost identical for both M1 and M2. As we delve deeper into the accumulated moisture data, they remain consistent across the three variables studied (design method, w/c ratio, and depth of the steel bar). This implies that, during this pre-depassivation stage, chemical factors may outweigh physical ones, at least that of temperature, in the determination of the order of depassivation according to the variables studied.

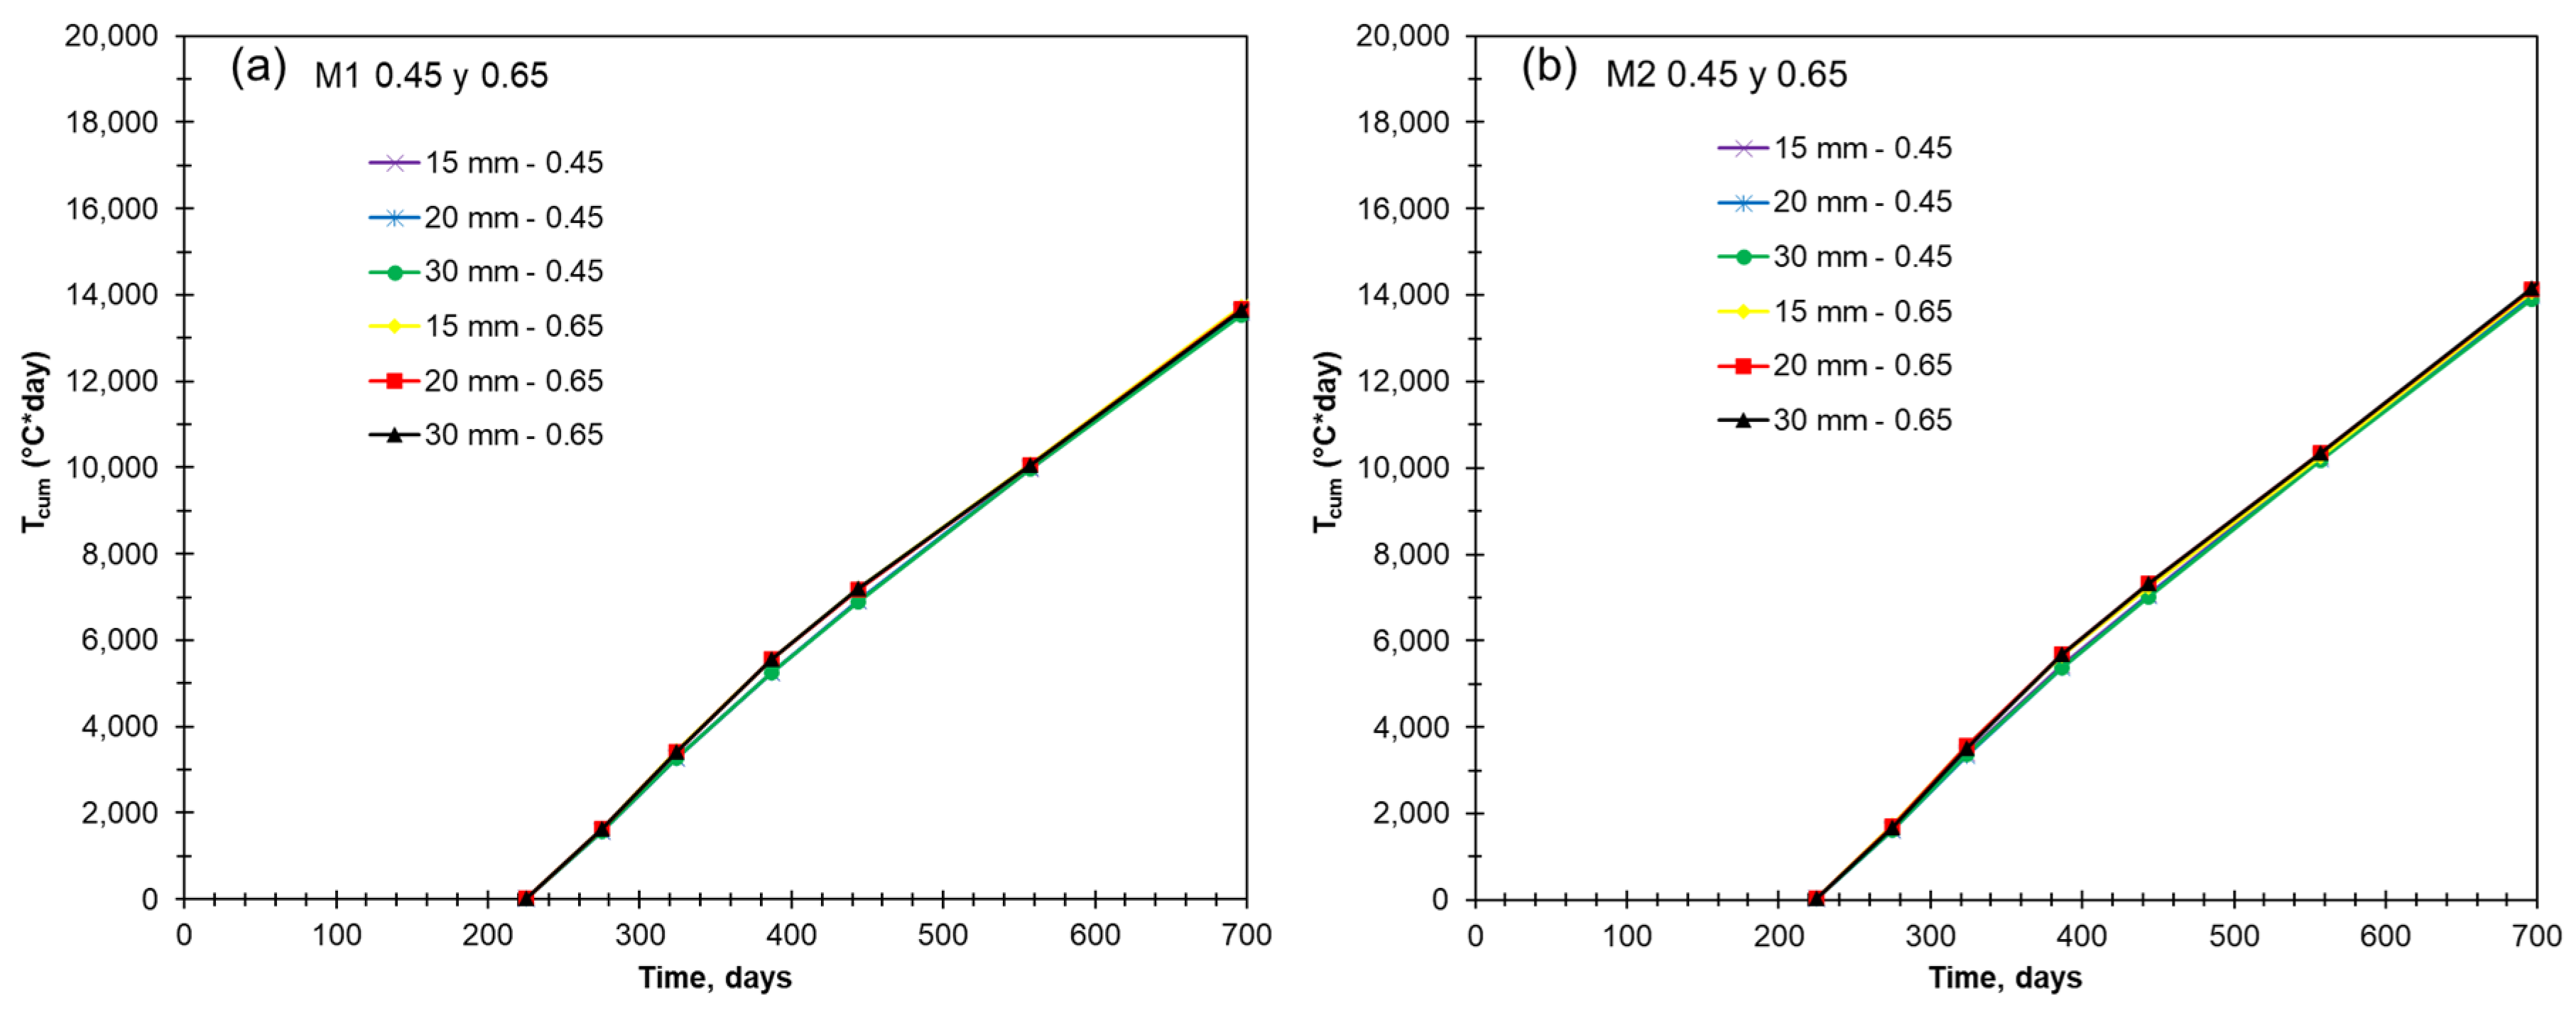
Figure 16.
Tcum data vs. time for 0.45 and 0.65 w/c ratios, (a) M1 and (b) M2.
Figure 16.
Tcum data vs. time for 0.45 and 0.65 w/c ratios, (a) M1 and (b) M2.
Along with the aforementioned variables, relative humidity (RH) plays an important role, in synchrony with temperature, in understanding corrosion behavior before depassivation. Like cumulative temperature, resistivity, corrosion rate, and potential, cumulative RH (RHcum) lacks quantitative validity, but offers qualitative information for interpretation. Figure 17a M1 and Figure 17b M2 present the data on accumulated internal humidity. During the 2-year exposure period, it is observed that the M1 data show a slight difference between the two w/c ratios, with a higher accumulated moisture in the specimens with the 0.45 w/c ratio. This can be attributed to the fact that the density of the concrete matrix at this w/c ratio does not allow for effective moisture exchange with the external environment, especially under the prevailing temperature conditions during the study. On the other hand, in M2, this slight difference in relative humidity is not observed, which is attributed to the greater tortuosity of the pores in this method. This tortuosity helps regulate the exchange of moisture with the environment. As expected, this indicates that the microstructure of the concrete, designed to minimize voids among aggregates, influences the dynamics of the internal moisture of the concrete. Consequently, the wetting time of the reinforcing steel, at any depth and during this passive stage, is similar across all w/c ratios and depths. For practical purposes, given the near-constant humidity and temperature conditions, future depassivation is likely to be influenced by localized defects in the concrete, such as microcracks or areas of increased porosity. These defects could even randomly trigger corrosion in certain rebars, regardless of their depth. In this context, the alkalinity of the concrete will also begin to play an important role, either due to its reduction by carbonation or to the penetration of chlorides, accelerating depassivation.
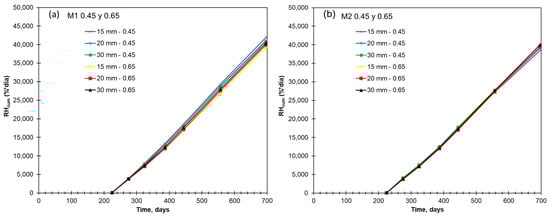
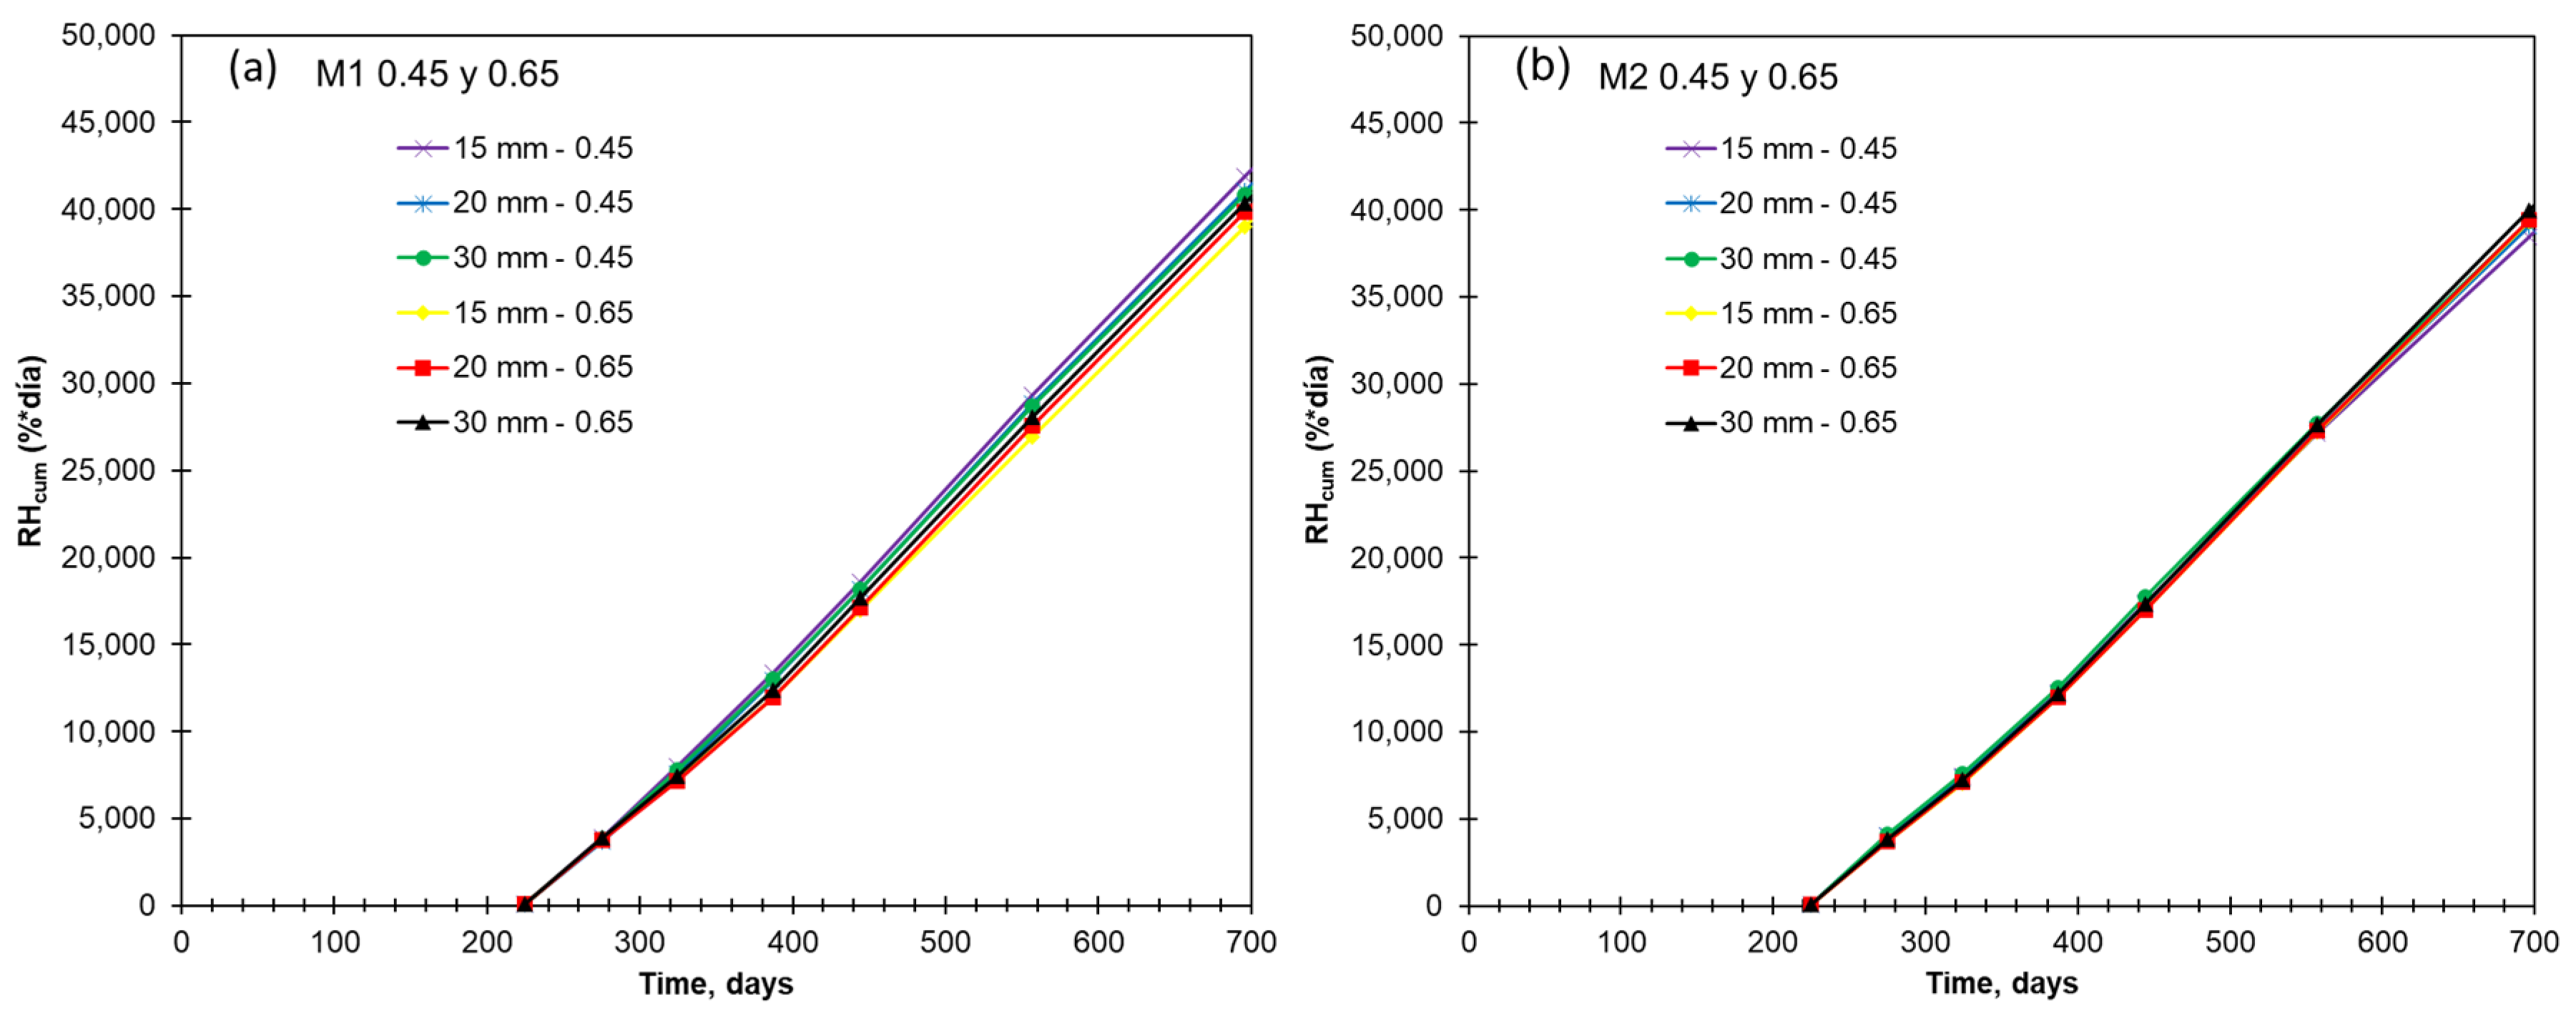
Figure 17.
RHcum data vs. time for 0.45 and 0.65 w/c ratios, (a) M1 and (b) M2.
Figure 17.
RHcum data vs. time for 0.45 and 0.65 w/c ratios, (a) M1 and (b) M2.
As mentioned before, the small differences in accumulated temperature and relative humidity, not detected in the point measurements, could be related to the formation of microcracks in the concrete, especially in specimens with a 0.65 w/c ratio. These microcracks could facilitate the penetration of aggressive agents, accelerating the depassivation process [40]. Thermal and humidity variations at an early age and later stages can cause internal stresses in the concrete, leading to the formation of microcracks. These fissures, although not visible to the naked eye, can act as pathways for the penetration of chlorides and other corrosive agents. This phenomenon could be more pronounced in specimens with a 0.65 w/c ratio, where the concrete matrix is less dense. Wetting and drying cycles can also influence the durability of concrete. During wetting periods, water can transport chlorides into concrete, while, during drying periods, water evaporation can concentrate chlorides on the surface of the reinforcing steel, accelerating corrosion.
After analyzing the accumulated data of the variables studied, the following conclusions can be drawn.
5. Conclusions
Under passivity conditions, corresponding to the testing period (two years), the cumulative data of corrosion rates, supported qualitatively by the cumulative resistivity data, corrosion potential, humidity, and temperature, allow for the identification of slightly different trends between both concrete proportioning design methods as follows:
- Mix design performance:
Method 1 (M1, strength-focused) demonstrated better corrosion resistance during the 700-day passive state (consistent performance), attributed to higher cement content.
Method 2 (M2, sustainability-focused) showed susceptibility to depassivation despite optimized aggregate arrangement. However, improved pore tortuosity may delay chloride ingress long-term, with potential post-depassivation benefits (needs to be verified beyond 700 days).
- Key influencing factors:
Thicker covers (30 mm) delayed but did not prevent depassivation in aggressive environments, especially for M2.
Low w/c (0.45) improved durability, but M2’s sustainable benefits (lower cement content) still could not be seen during the tested period.
Reinforcements at 20 mm cover were vulnerable, highlighting geometric impacts on corrosion initiation.
- Environmental interaction:
Internal RH/T fluctuations had a minimal direct impact on electrochemical trends, emphasizing material properties as the dominant factor.
Cumulative data analysis provided clearer differentiation between method behavior than point-in-time measurements.
A key finding revealed that M2, despite its sustainable advantage, tended to depassivation before M1, at least during the two years of exposure and while in the passive state.
Author Contributions
All authors contributed significantly to this study and the general design of the project, but the individual contributions are as follows: conceptualization, P.C.-B., D.N.-M., and E.J.P.-G.; methodology, J.A.B.-M., M.G.B.-Z., P.C.-B., D.N.-M., and E.J.P.-G.; validation, J.A.B.-M., and P.C.-B.; formal analysis, M.G.B.-Z., and J.A.B.-M.; investigation, P.C.-B., M.G.B.-Z., and J.A.B.-M.; data curation, M.G.B.-Z., and J.A.B.-M.; writing—original draft preparation, M.G.B.-Z., and J.A.B.-M.; writing—review and editing, P.C.-B., and J.A.B.-M. All authors have read and agreed to the published version of the manuscript.
Funding
The research and the APC was funded by Centro de Investigación y de Estudios Avanzados, Cinvestav (Center for Research and Advanced Studies).
Data Availability Statement
Data are contained within the article. Additional research data may be available upon request from the corresponding author (P.C.-B.).
Acknowledgments
The authors would like to express their gratitude to the Centro de Investigación y de Estudios Avanzados, Cinvestav (Center for Research and Advanced Studies) and the Secretaría de Ciencias, Humanidades, Tecnología e Innovación, Secihti (Ministry of Science, Humanities, Technology, and Innovation, Secihti), and M.Sc. Alexia Zozaya Ortíz.
Conflicts of Interest
The authors declare no conflicts of interest.
References
- Çiftçioğlu, A.Ö; Kazemi, F.; Shafighfard, T. Grey wolf optimizer integrated within boosting algorithm: Application in mechanical properties prediction of ultra high-performance concrete including carbon nanotubes. Appl. Mater. Today 2025, 42, 102601. [Google Scholar] [CrossRef]
- Bertolini, L.; Elsener, B.; Pedeferri, P.; Redaelli, E.; Polder, R. Corrosion of Steel in Concrete—Prevention, Diagnosis, Repair, 2nd ed.; Wiley-VCH: Weinheim, Germany, 2013. [Google Scholar] [CrossRef]
- Koch, G.; Varney, J.; Thompson, N.; Moghissi, O.; Gould, M.; Payer, J. International Measures of Prevention, Application, and Economics of Corrosion Technologies Study; NACE International: Houston, TX, USA, 2016. [Google Scholar]
- Nie, J.; Wang, J.; Gou, S.; Zhu, Y.; Fan, J. Technological development and engineering applications of novel steel-concrete composite structures. Higher Educ. Press. 2019, 13, 1–14. [Google Scholar] [CrossRef]
- Demis, S.; Papadakis, V.G. Durability design process of reinforced concrete structures—Service life estimation, problems and perspectives. J. Build. Eng. 2019, 26, 100876. [Google Scholar] [CrossRef]
- Alexander, M.G. Service life design and modelling of concrete structures—Background, developments, and implementation. Rev. ALCONPAT 2018, 8, 224–245. [Google Scholar] [CrossRef]
- Afzal, M.; Liu, Y.; Cheng, J.C.P.; Gan, V.J.L. Reinforced concrete structural design optimization: A critical review. J. Clean. Prod. 2020, 260, 120623. [Google Scholar] [CrossRef]
- Valdés, A.C.; Pérez, F.C.; Pech, I.P.; Águila, R.M.; Bastidas-Arteaga, E. Durability Requirements for Reinforced Concrete Structures Placed in a Hostile Tropical Coastal Environment. Buildings 2024, 14, 2494. [Google Scholar] [CrossRef]
- Worrell, E.; Price, L.; Martin, N.; Hendriks, C.; Meida, L.O. Carbon Dioxide Emission from the Global Cement Industry. Annu. Rev. Energy Environ. 2001, 26, 303–329. [Google Scholar] [CrossRef]
- Labaran, Y.H.; Mathur, V.S.; Farouq, M.M. The carbon footprint of construction industry: A review of direct and indirect emission. J. Sustain. Constr. Mater. Technol. 2021, 6, 101–115. [Google Scholar] [CrossRef]
- Han, Q.; Chang, J.; Liu, G.; Zhang, H. The Carbon Emission Assessment of a Building with Different Prefabrication Rates in the Construction Stage. Int. J. Environ. Res. Public Health 2022, 19, 2366. [Google Scholar] [CrossRef]
- Mindess, S. Sustainability of concrete. In Developments in the Formulation and Reinforcement of Concrete; Elsevier: Amsterdam, The Netherlands, 2019; pp. 3–17. [Google Scholar] [CrossRef]
- Su, W.; Liu, C.; Bao, W.; Zheng, Z.; Ma, G.; Deng, Y.; Ye, W. Study on the Mechanical Performance, Durability, and Microscopic Mechanism of Cement Mortar Modified by a Composite of Graphene Oxide and Nano-Calcium Carbonate. Buildings 2024, 14, 2236. [Google Scholar] [CrossRef]
- Moolchandani, K.; Sharma, A.; Kishan, D. Enhancing Concrete Performance with Crumb Rubber and Waste Materials: A Study on Mechanical and Durability Properties. Buildings 2024, 14, 161. [Google Scholar] [CrossRef]
- de Larrard, F. Concrete Mixture Proportioning: A Scientific Approach; CRC Press: Boca Raton, FL, USA, 2011. [Google Scholar]
- California Department of Transportation. Structure Construction Review of Concrete Mix Designs. In Concrete Technology Manual; California Department of Transportation: Sacramento, CA, USA, 2013; Chapter 3. [Google Scholar]
- The Role of Aggregates in Concrete Strength|Base Concrete. Available online: https://www.baseconcrete.co.uk/the-role-of-aggregates-in-concrete-strength/ (accessed on 2 April 2025).
- Tilak, U.V.; Reddy, A.N. Effect of Different Percentage Replacement of Weathered Aggregate in Place of Normal Aggregate on Young’s Modulus of Concrete to Produce High strength and Flexible/Ductile Concrete for use in Railway Concrete Sleepers. SSRG Int. J. Civ. Eng. 2015, 2, 24–29. [Google Scholar] [CrossRef]
- British Geological Survey. Construction aggregates. In Mineral Planning Factsheet; British Geological Survey: Nottingham, UK, 2020. [Google Scholar]
- Wilson, M.L.; Tennis, P.D. Design and Control of Concrete Mixtures, 17th ed; Portland Cement Association: Washington, DC, USA, 2021. [Google Scholar]
- Dehghan, A.; Maher, M.L.J.; Navarra, M. The Effects of Aggregate Properties on Concrete Mix Design and Behaviour. In Proceedings of the Canadian Society of Civil Engineering Annual Conference 2021; Walbridge, S., Nik-Bakht, M., Ng, K.W., Shome, M., Shahria, M., el Damatty, A., Lovegrove, G., Eds.; Springer: Singapore, 2021; Volume 248, pp. 457–468. [Google Scholar] [CrossRef]
- Jin, L.; Yu, W.; Du, X.; Yang, W. Meso-scale simulations of size effect on concrete dynamic splitting tensile strength: Influence of aggregate content and maximum aggregate size. Eng. Fract. Mech. 2020, 230, 106979. [Google Scholar] [CrossRef]
- Xing, Z.; Beaucour, A.L.; Hebert, R.; Noumowe, A.; Ledesert, B. Influence of the nature of aggregates on the behaviour of concrete subjected to elevated temperature. Cem. Concr. Res. 2011, 41, 392–402. [Google Scholar] [CrossRef]
- Mindeguia, J.C.; Pimienta, P.; Carré, H.; La Borderie, C. On the influence of aggregate nature on concrete behaviour at high temperature. Eur. J. Environ. Civ. Eng. 2012, 16, 236–253. [Google Scholar] [CrossRef]
- Chen, Y.; Han, X.; Hu, X.; Li, Q. Design of concrete fracture property by average aggregate size. Cem. Concr. Compos. 2021, 122, 104105. [Google Scholar] [CrossRef]
- Rong, Z.; Ouyang, H.; Gao, Y.; Chen, H. The Pore Structure Characteristics of Mortar and Its Application in the Study of Chloride Ion Transport Performance. Buildings 2025, 15, 383. [Google Scholar] [CrossRef]
- Mussey, B.K.; Damoah, L.N.W.; Akoto, R.N.A.; Bensah, Y.D. Optimization of concrete mix design for enhanced performance and durability: Integrating chemical and physical properties of aggregates. Cogent Eng. 2024, 11, 2347370. [Google Scholar] [CrossRef]
- ACI Committee 211. Selecting Proportions for Normal-Density and High-Density Concrete-Guide; American Concrete Institute: Farmington Hills, MI, USA, 2022; Available online: www.concrete.org (accessed on 17 September 2024).
- O’Reilly, V.A. Métodos para Dosificar Mezclas de Hormigón, 1st ed.; Científico-Técnico: La Habana, Cuba, 1990. [Google Scholar]
- Andrade, C.; Alonso, C. Corrosion rate monitoring in the laboratory and on-site. Constr. Build. Mater. 1996, 10, 315–328. [Google Scholar] [CrossRef]
- de Rincón, O.T.; Carruyo, A.R.; Andrade, C.; Helene, P.R.L.; Díaz, I. Manual de Inspección, Evaluación y Diagnóstico de Corrosión en Estructuras de Hormigón Armado, 2nd ed.; CYTED: Cambridge, UK, 1998. [Google Scholar]
- Andrade, C.; Alonso, C. Test methods for on-site corrosion rate measurement of steel reinforcement in concrete by means of the polarization resistance method. Mater. Struct. 2004, 37, 623–643. [Google Scholar] [CrossRef]
- Feliu, V.; González, J.A.; Feliu, S. Corrosion estimates from the transient response to a potential step. Corros. Sci. 2007, 49, 3241–3255. [Google Scholar] [CrossRef]
- NMX-C-514-ONNCCE-2019; Industria de la Construcción—Resistividad Eléctrica del Concreto Hidráulico—Especificaciones y Método de Ensayo. ONNCCE: Ciudad de México, Mexico, 2019; pp. 1–14.
- NMX-C-501-ONNCCE-2015; NMX-C-501-ONNCCE-2015, Industria de la Construcción—Durabilidad de Estructuras de Concreto Reforzado—Medición de Velocidad de Corrosión en Campo—Especificaciones y Método de Ensayo. ONNCCE: Ciudad de México, Mexico, 2015; pp. 1–19.
- NMX-C-495-ONNCCE-2015 (reapproved 2021); Industria de la Construcción—Durabilidad de Estructuras de Concreto Reforzado—Medición de Potenciales de Corrosión del Acero de Refuerzo sin Revestir, Embebido en Concreto—Especificaciones y Método de Ensayo. ONNCCE: Ciudad de México, Mexico, 2021; pp. 1–19.
- Petterson, K. Corrosion Threshold Value and Corrosion Rate in Reinforced Concrete; Swedish Cement and Concrete Research Institute: Stockholm, Sweden, 1992. [Google Scholar]
- Chan, J.L.Y.; Solís, R.C.; Moreno, É.I. Influencia de los agregados pétreos en las características del concreto. Ingeniería 2003, 7, 39–46. Available online: http://www.redalyc.org/resumen.oa?id=46770203 (accessed on 2 April 2025).
- Troxell, G.E.; Davis, H.E.; Kelly, J.W. Composition and Properties of Concrete; McGraw-Hill: New York, NY, USA, 1968. [Google Scholar]
- Bui, D.C.; Nakarai, K.; Nishikawa, H. Effects of early-age thermal microcracking on material properties and structural performance of limestone aggregate concrete. Cem. Concr. Compos. 2021, 124, 104267. [Google Scholar] [CrossRef]
- Sagues, A.; Moreno, E.I.; Morris, W.; Andrade, C. Carbonation in Concrete and Effect on Steel Corrosion. 1997. Available online: http://ntl.bts.gov/lib/20000/20000/20046/PB98106735.pdf (accessed on 2 April 2025).
- Castro-Borges, P.; Balancán-Zapata, M.; López-González, A. Analysis of tools to evaluate chloride threshold for corrosion onset of reinforced concrete in tropical marine environment of Yucatán, México. J. Chem. 2013, 2013, 208619. [Google Scholar] [CrossRef]
- Castro-Borges, P.; Balancán-Zapata, M.; Zozaya-Ortiz, A. Electrochemical meaning of cumulative corrosion rate for reinforced concrete in a tropical natural marine environment. Adv. Mater. Sci. Eng. 2017, 2017, 6973605. [Google Scholar] [CrossRef]
- Andrade, C.; Rebolledo, N.; Pedrosa, F. From the instantaneous corrosion rate to a representative value. In Concrete Repair, Rehabilitation and Retrofitting III—Proceedings of the 3rd International Conference on Concrete Repair, Rehabilitation and Retrofitting, ICCRRR 2012; CRC Press: Boca Raton, FL, USA, 2012; pp. 59–63. [Google Scholar] [CrossRef]
- Briceño-Mena, J.A.; Balancán-Zapata, M.G.; Castro-Borges, P. Edge effect in the corrosion process at early ages. In MEMORIAS CONPAT 2019; ALCONPAT INTERNACIONAL: Merida, Mexico, 2019; (In Spanish). [Google Scholar] [CrossRef]
- Miller, S.A.; Myers, R.J. Environmental Impacts of Alternative Cement Binders. Environ. Sci. Technol. 2020, 54, 677–686. [Google Scholar] [CrossRef]
- Aïtcin, P.C. The importance of the water-cement and water-binder ratios. In Science and Technology of Concrete Admixtures; Elsevier Inc.: Amsterdam, The Netherlands, 2016; pp. 3–13. [Google Scholar] [CrossRef]
- Angst, U.; Moro, F.; Geiker, M.; Kessler, S.; Beushausen, H.; Andrade, C.; Lahdensivu, J.; Köliö, A.; Imamoto, K.I.; von Greve-Dierfeld, S.; et al. Corrosion of steel in carbonated concrete: Mechanisms, practical experience, and research priorities-a critical review by RILEM TC 281-CCC. RILEM Tech. Lett. 2020, 5, 85–100. [Google Scholar] [CrossRef]
Disclaimer/Publisher’s Note: The statements, opinions and data contained in all publications are solely those of the individual author(s) and contributor(s) and not of MDPI and/or the editor(s). MDPI and/or the editor(s) disclaim responsibility for any injury to people or property resulting from any ideas, methods, instructions or products referred to in the content. |
© 2025 by the authors. Licensee MDPI, Basel, Switzerland. This article is an open access article distributed under the terms and conditions of the Creative Commons Attribution (CC BY) license (https://creativecommons.org/licenses/by/4.0/).