Article

Chemical Realkalization of Carbonated Concrete: Influence of Cement Composition on Alkalinity Restoration and Portlandite Formation

by
Giovana Costa Réus
1,*,
Renan Pícolo Salvador
2,
Juarez Hoppe Filho
3,
Diego Jesus De Souza
4 and
Marcelo H. F. de Medeiros
5
1
Department of Engineering and Exact Sciences, Federal University of Paraná, Curitiba 81530-000, PR, Brazil
2
Department of Civil Engineering, São Judas Tadeu University, São Paulo 05503-001, SP, Brazil
3
Center for Exact Sciences and Technologies, Federal University of Western Bahia, Bahia 47808-021, BH, Brazil
4
DTU-Sustain, Section of Materials and Durability, Technical University of Denmark, 2800 Lyngby, Denmark
5
Center for Studies in Civil Engineering (CESEC), Federal University of Paraná, Curitiba 81530-000, PR, Brazil
*
Author to whom correspondence should be addressed.
Buildings 2025, 15(8), 1318; https://doi.org/10.3390/buildings15081318
Submission received: 28 March 2025 / Revised: 7 April 2025 / Accepted: 15 April 2025 / Published: 16 April 2025

Abstract

:
This study examines the carbonation and realkalization dynamics of various cementitious systems, with a focus on the influence of cement composition on their susceptibility to carbonation and potential for realkalization. Four cement types were evaluated: CEM I, CEM II/A-LL, CEM II/A-V, and CEM II/B-W. Carbonation depth measurements revealed that blended cements, particularly CEM II/A-LL, showed greater carbonation susceptibility due to their lower portlandite content and increased porosity. In contrast, realkalization experiments demonstrated that blended cements exhibited enhanced ionic transport, resulting in deeper penetration of the alkaline solution. CEM II/A-V showed the highest realkalization depth, while CEM I displayed the lowest, highlighting the role of microstructural characteristics in realkalization efficiency. Thermogravimetric analysis (TGA) and X-ray diffraction (XRD) confirmed that carbonation led to portlandite depletion and the formation of calcium carbonate, with limited portlandite regeneration upon realkalization. Thermodynamic simulations further supported the experimental findings, revealing that realkalization only partially restored alkalinity, with no significant dissolution of carbonation products. These results emphasize the need for tailored realkalization strategies, considering cement composition and pore structure, to optimize remediation efforts and enhance the long-term durability of concrete structures.

1. Introduction

Concrete structures are susceptible to degradation due to environmental exposure, with carbonation and chloride-induced corrosion being major concerns [1,2,3,4,5,6]. Carbonation, the focus of the present study, is a physicochemical process in which atmospheric CO2 dissolves in the pore solution of concrete, reacting primarily with portlandite [Ca(OH)2], calcium silicate hydrate (C-S-H), and aluminate phases to form calcium carbonate (CaCO3) and other CO2-dependent phases [7,8,9]. This reaction reduces the pH of the pore solution, leading to the depassivation of embedded steel reinforcement and thereby increasing its susceptibility to corrosion [8,10,11]. While carbonation can decrease porosity due to CaCO3 precipitation, it also causes shrinkage, microcracking, and alterations in permeability, affecting durability [12]. The rate of carbonation depends on environmental factors such as CO2 concentration and humidity, as well as concrete properties, including binder composition and porosity [13]. In urban and industrial environments, accelerated carbonation presents a significant challenge to reinforced concrete structures. Therefore, once this process starts in the field, any technique capable of delaying or stopping it is of great value; among these, the realkalization of concrete has emerged as a promising technique.
Realkalization is a remediation technique used to restore the alkalinity of carbonated concrete and protect embedded steel reinforcement from corrosion [14]. By raising the pH of the pore solution, realkalization prevents further degradation and extends the service life of the structure, making it especially valuable for concrete exposed to aggressive environments such as coastal areas or industrial sites [15]. Realkalization process can be performed using electrochemical or chemical methods. Electrochemical realkalization (ER) involves the application of an external electrical current to drive alkaline ions into the concrete, typically using an external electrolyte and temporary anodes on the concrete surface [16,17,18,19]. In contrast, chemical realkalization (CR) relies on the passive ingress of alkaline solutions into the concrete matrix through absorption and diffusion mechanisms [14,15,20]. While ER is more complex and requires specialized equipment, CR, the focus of this study, is a simpler and cost-effective alternative that does not require an external power source.
CR involves exposing the concrete to alkaline solutions, allowing them to penetrate the matrix and increase the pH of the pore solution [15]. The transport of these solutions occurs through diffusion, permeability, absorption, and capillary suction, with the dominant mechanism depending on factors such as solution viscosity, application method, and concrete microstructure [17,18,19,20,21]. Studies have shown that solutions containing KOH, NaOH, and Na2CO3 are effective in restoring alkalinity [15]. However, despite the established transport mechanisms of liquids in concrete, the chemical interactions between the alkaline solutions and the ions in the pore solution remain poorly understood [16,22,23,24,25,26]. Specifically, there is a lack of research on the nature of the reactions involved and the composition of the products formed during CR. Addressing this gap is crucial for optimizing realkalization techniques and enhancing the long-term durability of carbonated concrete structures.
Several factors, including the properties of the concrete, the type and concentration of alkaline solutions, and the method of application, influence the efficiency and rate of CR [14,15,17,18,20]. Among these, the composition of the cementitious material is particularly significant, as it affects both the porosity and the alkaline reserve of the concrete [27]. The incorporation of supplementary cementitious materials (SCMs), such as silica fume and metakaolin, modifies the microstructure of concrete by refining its pore structure and altering its chemical composition [9,28,29,30,31,32,33]. Pozzolanic reactions consume calcium hydroxide (CH) to form secondary C-S-H, increasing paste density and reducing permeability [34]. This densification limits the ingress of CO2, slowing carbonation [27]. However, the simultaneous reduction in the alkaline reserve may affect the efficiency of CR, as lower initial alkalinity could lead to different realkalization behaviors [35]. Studies have shown that the use of metakaolin and silica fume accelerates carbonation, with an observed increase of 32% when replacing 10% of cement [36]. However, their impact on CR remains uncertain, as reduced permeability could also slow the penetration of alkaline solutions.
Additionally, carbonation alters the permeability and absorption properties of concrete, which in turn influences the transport of alkaline solutions during CR [35,37]. While highly carbonated concretes exhibit increased porosity due to the dissolution of CH, the precipitation of CaCO3 can reduce permeability [38,39]. Consequently, concrete with a high carbonation rate does not necessarily exhibit a high realkalization rate. Understanding these interactions is crucial for optimizing CR techniques and enhancing their application in various concrete compositions.
While previous studies have explored carbonation resistance and various realkalization techniques, the underlying chemical mechanisms governing realkalization efficiency remain poorly understood, particularly in cementitious systems with supplementary cementitious materials (SCMs). This study advances the current knowledge by integrating experimental analyses with thermodynamic simulations to provide a comprehensive understanding of realkalization-induced phase transformations. Unlike conventional studies that focus solely on empirical carbonation and realkalization depth measurements, this work employs Gibbs Energy Minimization (GEMS) modeling to predict equilibrium phase assemblages and ionic interactions within the pore solution. By bridging experimental observations with thermodynamic predictions, this study offers novel insights into the extent of alkalinity restoration, portlandite reformation, and carbonate phase stability after chemical realkalization. These findings are crucial for optimizing realkalization strategies and ensuring the long-term durability of carbonated concrete structures.

2. Materials and Methods

The study involved both concrete and cement paste samples, with sample selection based on the requirements of each test. Concrete specimens were prepared for compressive strength testing and for measuring the depths of carbonation and alkalization. Cement paste samples were used for X-ray diffraction (XRD), thermogravimetric analysis (TGA), apparent porosity measurements, and pH determinations. The methodologies employed for each test are outlined in the following sections.

2.1. Materials

The experimental program utilized four types of cement: CEM I, CEM II/A-LL, CEM II/A-V, and CEM II/B-W, as per BS EN 197-1 (2011). These cements were selected based on their varied chemical compositions and real-world applicability, including different levels of fly ash and limestone content, to assess their performance in carbonation and realkalization processes. The chemical and physical properties of the cements are presented in Table 1 and Table 2, respectively. The manufacturers of the cements used in the research conducted these tests.
The chemical properties of the cements are detailed in Table 1. The CEM I has the highest content of calcium oxide (CaO) at 61.56%, whereas CEM II/B-W, which contains the highest percentage of fly ash (≈approximately 24%), has a lower CaO content of 45.18%. The fly ash in CEM II/A-V and CEM II/B-W contributes to their higher silica (SiO2) and alumina (Al2O3) contents. Additionally, the loss on ignition is higher in the blended cements, especially for CEM II/A-V and CEM II/B-W, indicating the presence of higher amounts of fly ash.
Table 2 summarises the physical and mechanical properties of the cements. CEM I exhibits the highest compressive strength at 28 days, while the CEM II/B-W cement, which includes the fly ash addition, shows a 28-day compressive strength of 46.0 MPa. CEM II/A-LL has the lowest early-age strength, with 1-day and 3-day compressive strengths of 17.1 MPa and 30.1 MPa, respectively. CEM I displays the shortest initial and final setting times, compared to the other cement types, which have progressively longer setting times due to the higher content of pozzolanic materials.
In addition to the cementitious materials, natural fine aggregate with a specific gravity of 2.68 g/cm3 was used. The coarse aggregate consisted of gneiss, with a characteristic maximum diameter of 12.50 mm, classified as crushed stone 0. The dry specific gravity of the coarse aggregate was 2.57 g/cm3, with a fineness modulus of 6.0, a fines content of 0.89% passing through a 0.075 mm sieve, and a shape index of 2.57.

2.2. Study on Concrete Samples

The preparation and testing of concrete samples followed a systematic procedure, as outlined in Figure 1. The experimental process consisted of concrete mixing, sample curing, accelerated carbonation, realkalization treatment, and subsequent testing to assess the depths of carbonation and realkalization.

2.2.1. Concrete Mixing and Specimen Preparation

Concrete was produced using CEM I, CEM II/A-LL, CEM II/A-V, and CEM II/B-W cements, with a mix ratio of 1.00:2.60:3.20 (cement:sand:coarse aggregate) and a water-to-cement ratio of 0.70. It is worth noting that although significantly high, the w/b ratio was selected to facilitate the carbonation process. The mixing process was conducted in a 120 L capacity mixer. Cylindrical specimens with a diameter of 10 cm and a height of 20 cm were prepared for compressive strength tests. Smaller cylindrical samples (5 cm diameter × 10 cm height) were used for assessing the carbonation and realkalization depth. Compaction was performed using a vibrating table for 5 s in a single layer.

2.2.2. Curing and Conditioning

Specimens were cured in a moist chamber for 28 days. After curing, the compressive strength of the 10 cm × 20 cm specimens was evaluated in accordance with ASTM C39/C39M-20 (2020). The test was conducted using a hydraulic press, with steel plates and Neoprene discs, to ensure uniform load distribution. The load was applied at a rate of 0.45 MPa/s, and three specimens of each concrete type were tested.
The 5 cm × 10 cm samples designated for carbonation and realkalization studies were washed to remove any residue from the release agent and then conditioned in a dry chamber at 22 ± 2 °C and 50 ± 10% relative humidity for 28 days. This pre-conditioning step ensured uniform moisture distribution within the specimens, facilitating the homogeneous advancement of the carbonation front.

2.2.3. Accelerated Carbonation

Carbonation was induced in a controlled carbonation chamber with a CO2 concentration of 5%, relative humidity of 65 ± 5%, and temperature of 23 ± 1 °C. These conditions promote an accelerated carbonation process. The samples remained in the chamber until complete carbonation was achieved. Three specimens per cement type were selected from different chamber locations to assess carbonation depth, thereby minimizing positional variability. The samples were fractured using a hammer and chisel, and loose dust and fragments were removed with a brush. The decision to fracture the samples with a hammer and chisel, rather than cut them, was made to preserve the integrity of the carbonated phases. To address the potential variability in carbonation depth due to the fracture method, we ensured that only the most perpendicular fractures and representative fragments were selected for analysis. Carbonation depth was determined by spraying a phenolphthalein solution (1% phenolphthalein in a solvent mixture of 70% ethyl alcohol and 29% distilled water, as per [9]) on the fractured surface. The uncarbonated regions turned pink or magenta (pH > 10), while the carbonated areas remained colorless (pH < 8–10). Eight measurements were taken per sample using a caliper, and the average was recorded. Although widely used due to its simplicity and visual clarity, the phenolphthalein method is limited to detecting regions where pH exceeds approximately 9.0. As a result, partially carbonated zones exhibiting intermediate pH values may not be identified, potentially leading to a slight underestimation of carbonation depth, especially in blended cements with more gradual pH transitions. To address this, the phenolphthalein test was complemented by pH measurements and phase analysis (as explained in Section 2.3), thereby enhancing confidence in the interpretation of carbonation extent. The carbonation process continued until all sample types reached full carbonation, ensuring that realkalization was conducted at the same age for all specimens. The carbonation coefficient (KCO2) was then calculated based on Tuutti’s publication for corrosion initiation, using the formula KCO2 = carbonation depth (mm)/√days, where the carbonation depth was measured at regular intervals, and the time of exposure in days was used to calculate the coefficient, expressed in terms of mm/√days.

2.2.4. Realkalization Treatment

Once fully carbonated, the specimens underwent realkalization using an immersion method. Samples were submerged in a potassium hydroxide (KOH) solution with a concentration of 2.67 mol/L (149.80 g/L). This concentration was selected based on previous studies, particularly Réus and Medeiros (2020) [15], which demonstrated its effectiveness in reintroducing alkalinity into carbonated cementitious matrices. The 2.67 M KOH solution provides a high-pH environment (~13.4) that facilitates the diffusion of hydroxyl ions while maintaining chemical stability and avoiding adverse reactions, such as excessive leaching or matrix degradation. At predefined intervals, samples were fractured to assess realkalization depth. The remaining portion of each fractured specimen was re-immersed for continued treatment. The process was repeated until complete realkalization was achieved across all cement types.

2.2.5. Measurement of Realkalization Depth

The realkalization depth was assessed using the same procedure as the carbonation measurement. Three specimens per cement type were fractured, and their surfaces were dried with a hot air jet for 5 min before applying the phenolphthalein solution. A heater was used for this drying step to remove residual moisture that could interfere with the color reaction. The depth of realkalized zones was measured at eight points per specimen, and the average value was recorded. The experiment concluded when all samples exhibited full realkalization.

2.3. Study on Cement Paste Samples

In addition to the concrete samples, cement paste specimens were prepared and tested to evaluate the effects of carbonation and realkalization. The experimental procedure followed the sequence outlined in Figure 2.

2.3.1. Sample Preparation and Conditioning

Cement paste samples were produced using the same cement types specified for the concrete specimens, with a water-to-cement ratio of 0.70. The pastes were mixed using a benchtop mortar mixer and cast into prismatic molds (1.7 × 1.7 × 9.2 cm). After molding, the samples underwent 28 days of moist curing, followed by an additional 28 days of conditioning in a dry chamber at 22 ± 2 °C and 50 ± 10% relative humidity to achieve internal moisture equilibrium.
To assess potential changes induced by carbonation and realkalization, the specimens were categorized into three groups: reference (REF), carbonated (CARB), and realkalized (REALK). The REF specimens were stored in a desiccator at 23 ± 1 °C with sodium nitrite to maintain approximately 65% relative humidity. Barium hydroxide was added to prevent carbonation. The CARB samples were exposed to accelerated carbonation in a chamber with 5% CO2, 65 ± 5% relative humidity, and 23 ± 1 °C until full carbonation was achieved. The REALK samples were subjected to the same carbonation process as the CARB specimens.
After carbonation, REF samples were immersed in water to maintain the same moisture conditions as the REALK samples. The CARB specimens were also immersed in water, while the REALK samples were submerged in a potassium hydroxide (KOH) solution at a concentration of 2.67 mol/L.
Prior to testing, the hydration of the cement paste was halted following the methodology of Hoppe Filho et al. (2021) [40]. The samples were immersed in ethyl alcohol for 24 h and then dried in an oven at 40 °C for an additional 24 h. The specimens were then stored in a desiccator until they were subjected to testing.

2.3.2. X-Ray Diffraction (XRD) Analysis

To evaluate the mineralogical composition, samples were pulverized with a mortar and pestle to a maximum particle size of 0.075 mm (200 mesh). The finely ground powder was pressed into a 24 mm diameter, 1 mm deep sample holder. XRD analysis was conducted using a SHIMADZU XRD-7000 diffractometer operating at 40 kV and 20 mA, with a copper X-ray tube (λ = 0.154 nm) and a scintillator detector. The angular sweep ranged from 5° to 75° 2θ, with a step size of 0.02° 2θ and a dwell time of 1 s per step. The sample remained stationary in the goniometer’s center, with a divergent slit of 0.2°.

2.3.3. Thermogravimetric Analysis (TGA)

For thermogravimetric analysis (TGA), the samples were ground to a particle size of ≤0.075 mm (200 mesh). Testing was performed on a Shimadzu DTG-60 analyzer under a nitrogen atmosphere (50 mL/min) within a temperature range of 30 °C to 1000 °C, at a heating rate of 10 °C/min. A sample mass of 20 mg was placed in an uncovered platinum crucible.
Following [41], mass loss between room temperature and 380 °C corresponds to the decomposition of hydrated phases, including C-S-H, ettringite (AFt), and monosulfate (AFm). Portlandite dehydration occurs between 450 °C and 600 °C, while calcium carbonate decarbonation occurs between 500 °C and 800 °C. The chemically bound water content was determined as the percentage of mass loss up to 380 °C. The Portlandite content was calculated by multiplying the mass loss between 380 °C and 500 °C by the molar mass ratio of calcium oxide to Portlandite. The same approach was used to determine the percentage of calcite versus vaterite based on mass loss between 650 °C and 800 °C.

2.3.4. Apparent Porosity

Cement paste specimens were manually fragmented into particles ≤1 cm3, with approximately 3 g of material used per test. The mass was recorded in three states: (i) saturated surface-dry (mssd), (ii) oven-dried at 105 ± 5 °C for 24 h (mdry), and (iii) submerged in water (msub). The samples were pre-saturated for 24 h before measuring mssd, ensuring uniform moisture absorption. Apparent porosity (%) was calculated using Equation (1), as described by [40,42]:
A p p a r e n t   P o r o s i t y   ( % ) = M S S D M D R Y M S S D M s u b × 100

2.3.5. pH Measurement

The pH of the cement paste was determined using a suspension method, which involves mixing powdered cement paste with distilled water [43,44]. The procedure was adapted from Pu et al. [43], who demonstrated a strong correlation between the pH of powder suspensions and pore solutions. Therefore, to ensure consistency, the following conditions were maintained:
  • Consistent and fine particle size distribution.
  • Constant powder-to-water ratio (40–60% solid content).
  • Standardized powder extraction and stirring methods.
  • Stable temperature (±10 °C variation).
Pu et al. [43] used a water-to-solid ratio of 100 g/1 g, ensuring the complete dissolution of portlandite, which accounts for 20–25% of the hydrated cement paste solids [45]. The present study maintained the same ratio, using 2 g of powder mixed with 200 mL of distilled water. After manual stirring for 1 min, the suspension was left undisturbed for 96 h, after which the pH was measured. For sample preparation, flakes were removed from the paste specimens, ground with a mortar and pestle, and sieved through a 0.075 mm (200 mesh) sieve. The fine fraction was used for pH testing.

2.4. Thermodynamic Modelling

Thermodynamic modeling was used to simulate the phase transformations in cementitious materials under carbonation and realkalization conditions. The modeling was performed using the Gibbs Energy Minimization Selektor (GEMS v3) [46], which calculates equilibrium phase assemblages and speciation in complex geochemical systems. The primary thermodynamic data were sourced from the PSI/Nagra database [47], with additional solubility data for cement hydrates [48].
The composition of C-S-H was modeled using the “CSHQ” model [49], which accounts for the incorporation of alkali ions [48]. Kinetically constrained phases, including quartz (SiO2), dolomite (CaMg(CO3)2), goethite (FeOOH), hematite (Fe2O3), and selected zeolitic phases (natrolite, heulandite, and stilbite), were excluded from equilibrium calculations due to their slow formation rates under the investigated conditions. This exclusion ensured that the simulations remained representative of practical timescales relevant to cementitious materials.
The simulations assumed full clinker reactivity and a partial fly ash reaction degree of 35%. This estimate for the fly ash was based on a separate modified Chapelle test performed on fly ash from the same supplier, which showed a Ca(OH)2 consumption of 0.44 g/g [50,51,52], indicative of moderate pozzolanic activity. Although not conducted on the exact fly ash batch used in the experimental mixes, the assumed reactivity provides a reasonable approximation for modeling purposes. Limitations associated with fly ash variability and test method sensitivity were acknowledged in the interpretation of the simulation outcomes.
The modeling accounted for variations in pore solution chemistry due to carbonation and subsequent realkalization, enabling the prediction of pH shifts, portlandite depletion, and calcite formation. All calculations were performed at 23 °C, consistent with standard laboratory conditions for hydrated cementitious systems.

3. Results

3.1. Concrete Specimens Analysis

3.1.1. Compressive Strength

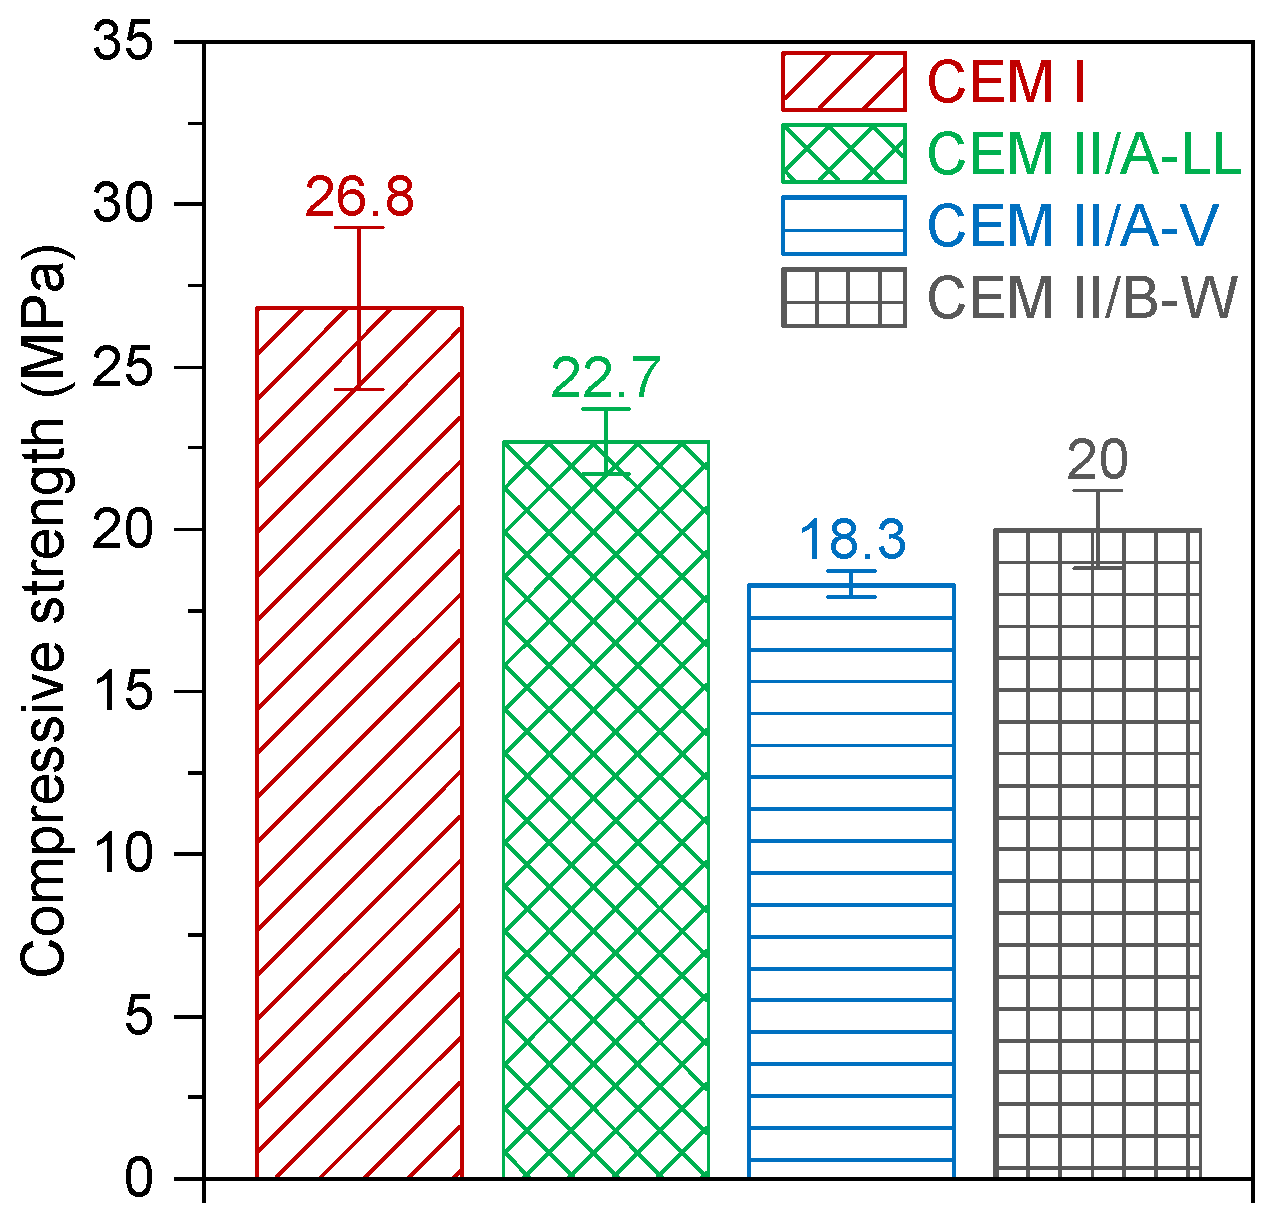
The 28-day compressive strength of the concrete mixtures varied depending on the cement type (Figure 3). The highest strength was observed in the CEM I mixture (26.8 MPa), followed by CEM II/A-LL (22.7 MPa) and CEM II/B-W (20.0 MPa). The lowest strength was recorded for CEM II/A-V (18.3 MPa). The reduction in strength in blended cement is attributed to the lower clinker content and the presence of a higher volume of fly ash, which generally results in a reduced early-age strength development compared to pure Portland cement (CEM I).

3.1.2. Carbonation Depth

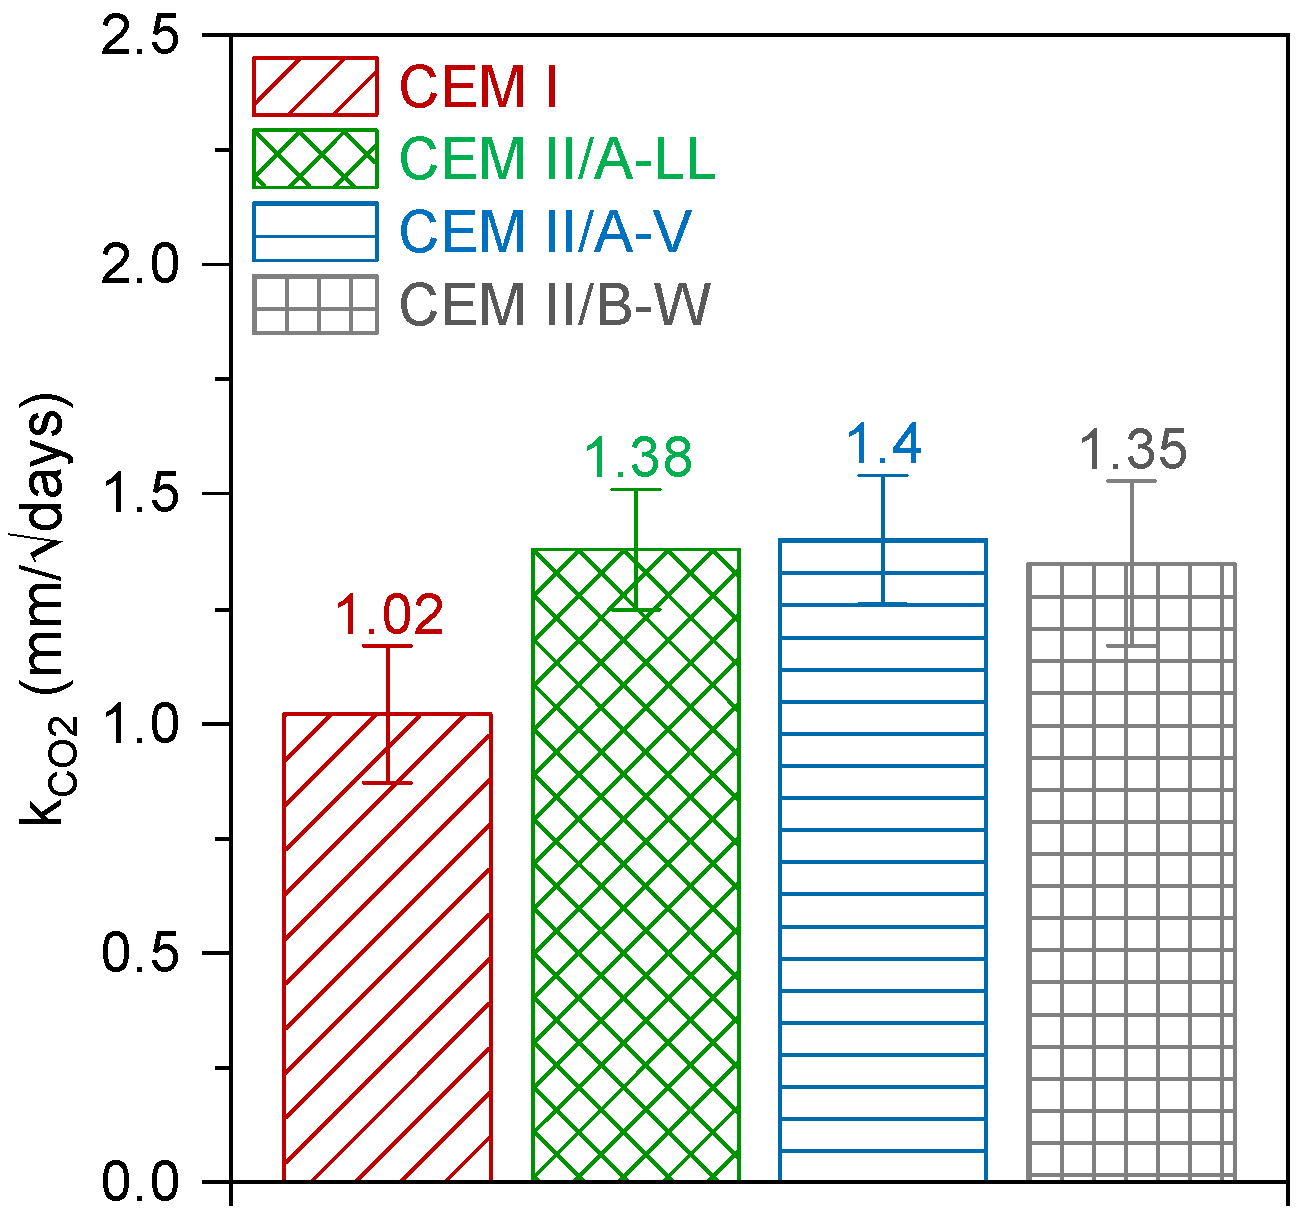
The progression of carbonation depth over time is presented in Figure 4. At 91 days, the highest carbonation depth was observed in CEM II/A-LL (15.0 mm), followed by CEM II/A-V (10.4 mm), CEM II/B-W (10.3 mm), and CEM I (9.5 mm). The carbonation rate was further assessed using the carbonation coefficient KCO2 (Figure 5), as proposed by [53]. The blended cement mixtures exhibited higher carbonation coefficients compared to CEM I, with CEM II/A-V showing the highest value (1.40 mm/√days), followed by CEM II/A-LL (1.38 mm/√days) and CEM II/B-W (1.35 mm/√days). The lowest carbonation coefficient was recorded for CEM I (1.02 mm/√days). The increased carbonation susceptibility in blended cements is consistent with their trend of precipitating lower portlandite levels, which reduces buffering capacity against CO2 ingress.

3.1.3. Realkalization Depth

Realkalization depth measurements over time are shown in Figure 6. At 91 days, CEM II/A-LL reached a depth of 15.0 mm, followed by CEM I at 12.8 mm. The highest realkalization depth was observed at 56 days for CEM II/A-V (20.0 mm) and CEM II/B-W (17.3 mm), as data beyond this period were not available for these mixtures.
The realkalization coefficient KRealk values (Figure 7) indicate that CEM II/A-V had the highest rate (5.05 mm/√days), followed by CEM II/B-W (3.79 mm/√days) and CEM II/A-LL (3.39 mm/√days). CEM I exhibited the lowest realkalization coefficient (2.51 mm/√days). The higher realkalization rates in blended cement mixtures can be attributed to their increased porosity, which enhances ionic transport, thereby facilitating the penetration of the alkaline solution into the carbonated zone.

3.2. Cement Paste Analysis

3.2.1. Apparent Porosity

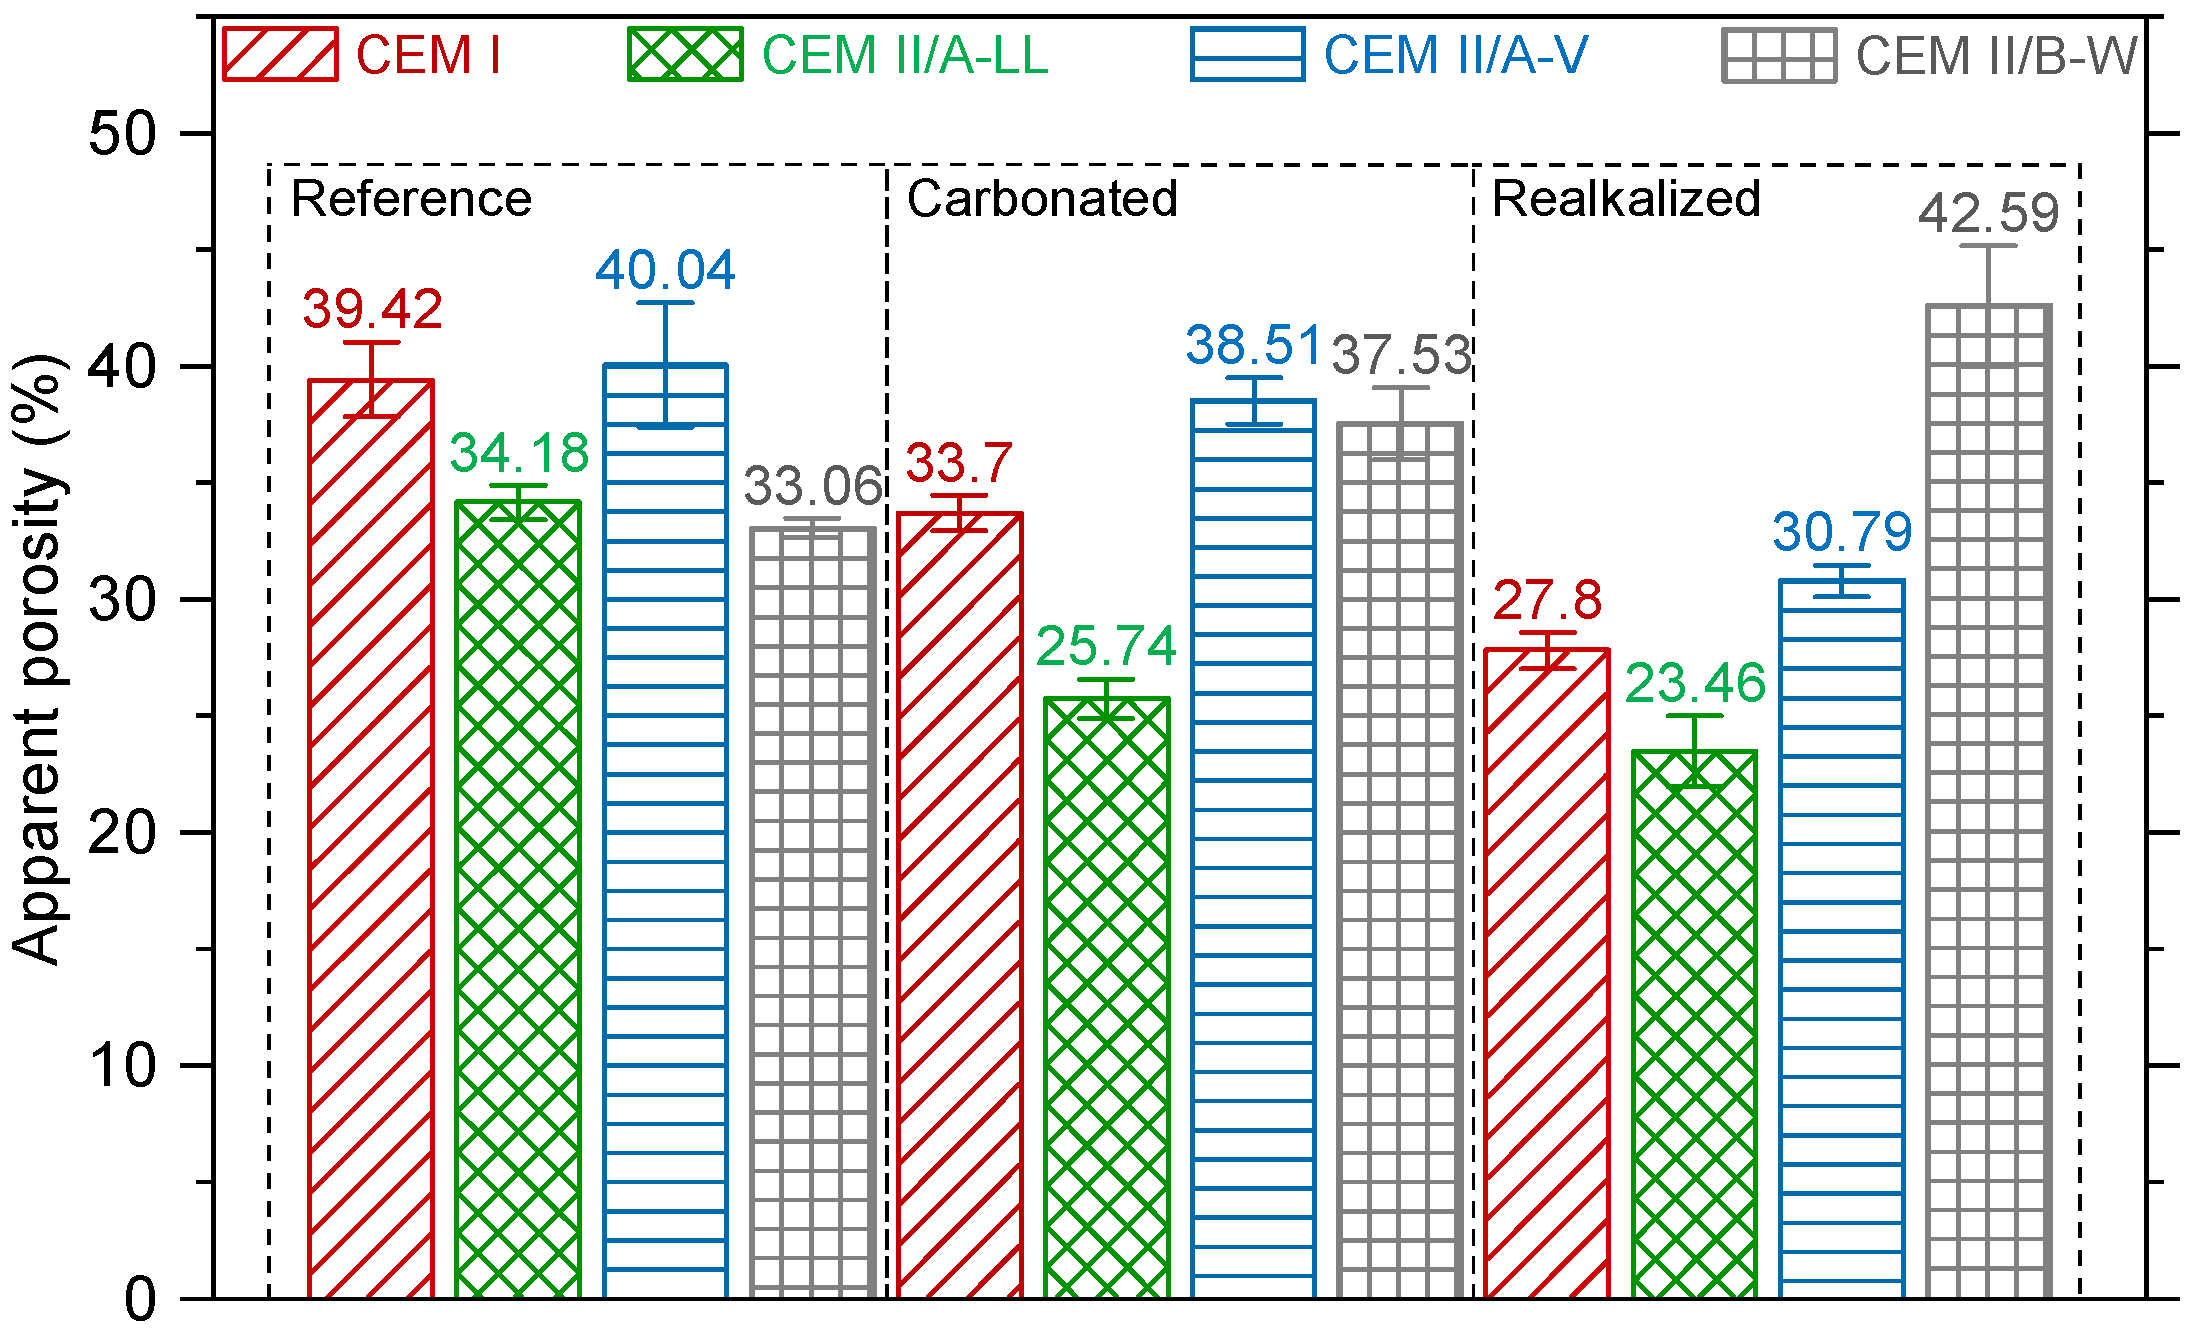
The apparent porosity of the cement paste samples varied depending on the carbonation and realkalization conditions (Figure 8). In the reference samples, CEM II/A-V exhibited the highest porosity (40.04%), followed by CEM I (39.42%), while CEM II/B-W showed the lowest value (33.06%). Upon carbonation, a reduction in porosity was observed for CEM I (33.7%) and CEM II/A-LL (25.74%), while an increase was noted for CEM II/B-W (37.53%). CEM II/A-V showed only a slight reduction in porosity after carbonation (38.51%). Following realkalization, the porosity of CEM I and CEM II/A-LL decreased further to 27.8% and 23.46%, respectively, whereas CEM II/A-V experienced a more significant reduction, down to 30.79%. In contrast, CEM II/B-W exhibited a substantial increase in porosity after realkalization (42.59%).

3.2.2. pH Measurements

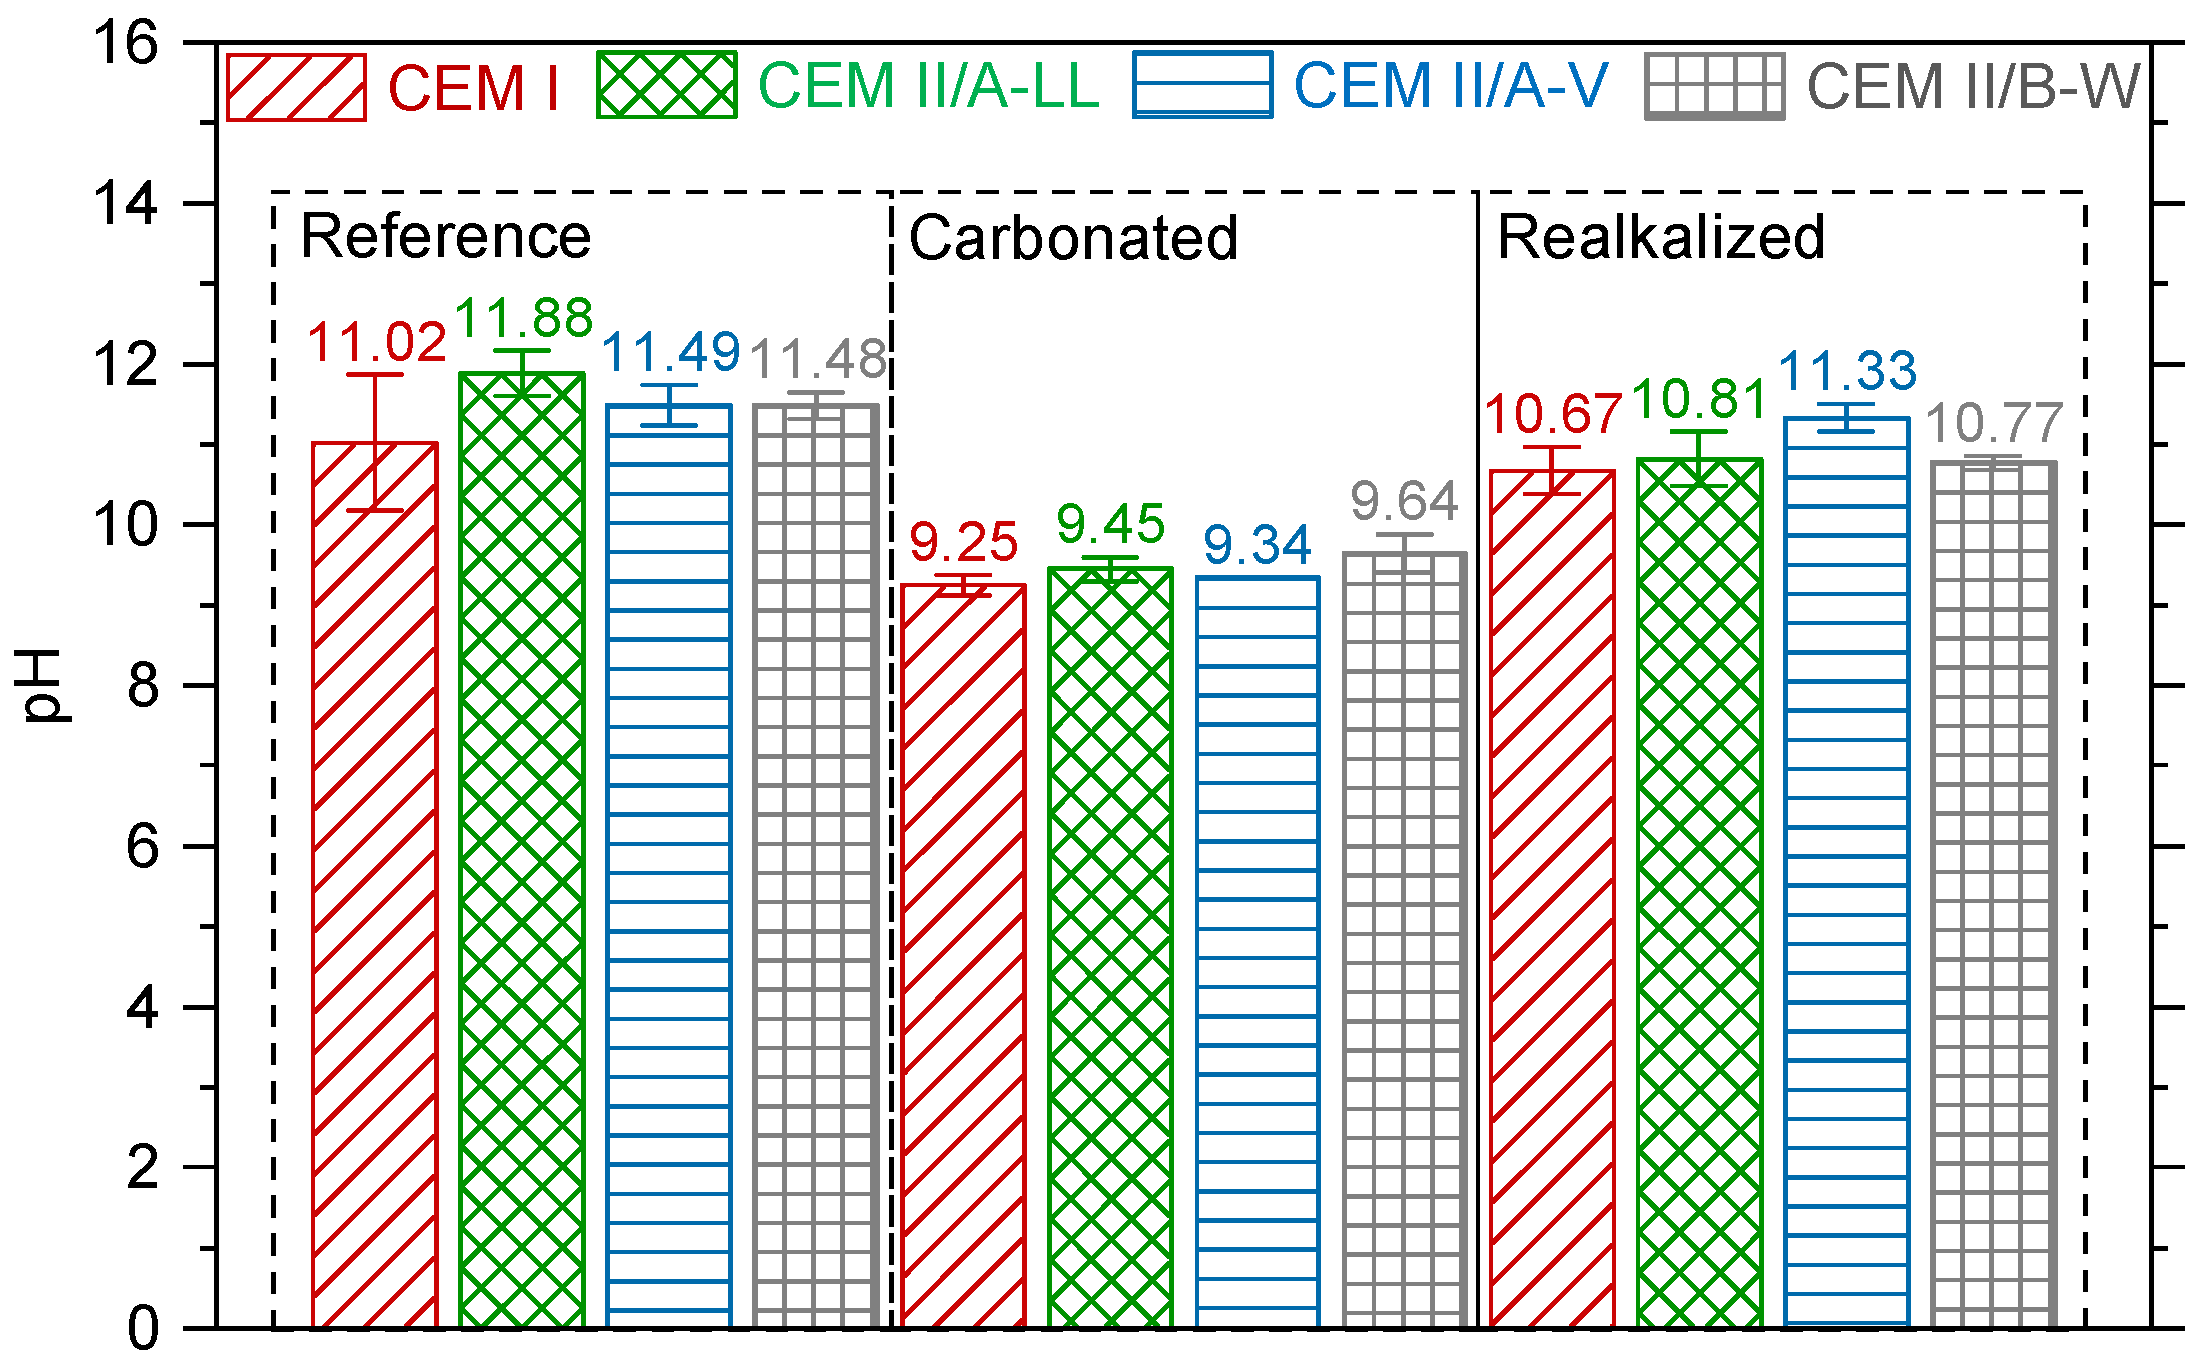
The pH values of the cement paste suspensions are presented in Figure 9. The reference samples exhibited alkaline pH values ranging from 11.02 (CEM I) to 11.88 (CEM II/A-LL). After carbonation, a reduction in pH was observed across all mixtures, with values ranging from 9.25 (CEM I) to 9.64 (CEM II/B-W), indicating the neutralization of alkalinity due to carbonation-induced reactions. Following realkalization, the pH of all samples increased but did not fully recover to their initial values. CEM II/A-V achieved the highest post-realkalization pH (11.33), approaching its original level of 11.49. The other mixtures exhibited partial recovery, with final pH values ranging from 10.67 (CEM I) to 10.81 (CEM II/A-LL), indicating the limited but effective restoration of alkalinity.

3.2.3. X-Ray Diffraction (XRD)

The XRD analysis, illustrated in Figure 10, revealed distinct phase compositions across the reference, carbonated, and realkalized cement pastes. In the reference samples, all mixtures exhibited characteristic peaks corresponding to ettringite (AFt), monosulfate (AFm), portlandite, and calcite. Notably, CEM II/B-W displayed more pronounced AFt and AFm peaks, suggesting a higher content of these hydration products, while its portlandite peaks were relatively lower than those observed in other mixtures.
In the carbonated samples, the XRD diffractograms predominantly displayed peaks of calcite and vaterite, with the complete disappearance of portlandite. This transformation confirms the progression of carbonation, wherein portlandite reacts with atmospheric CO2 to form calcium carbonate polymorphs.
Following realkalization, the major crystalline phases remained calcite and vaterite in all mixtures, indicating that the carbonation-induced calcium carbonate phases were not dissolved or transformed. However, portlandite peaks were also observed in the realkalized samples, albeit at lower intensities compared to the reference mixtures. This suggests the partial regeneration of portlandite, likely due to the penetration of hydroxyl ions from the alkaline treatment, which contributed to the partial reversal of carbonation effects.

3.2.4. Thermogravimetric Analysis (TGA)

The thermogravimetric analysis results for chemically bound water, portlandite, and carbonate contents are summarised in Figure 11 and Table 3.
The mass loss up to 380 °C was highest in the reference samples, with values ranging from 15.1% (CEM I) to 11.9% (CEM II/B-W). Upon carbonation, a significant reduction in bound water content was observed across all mixtures, with values decreasing to 8.9% (CEM I) and 7.3% (CEM II/B-W). After realkalization, further reductions were recorded, with bound water contents ranging from 7.9% (CEM I) to 6.3% (CEM II/B-W), indicating ongoing microstructural changes and potential dissolution of hydration products.
The Portlandite content in the reference samples varied significantly, with CEM I exhibiting the highest amount (21.0%) and CEM II/B-W the lowest (8.6%). After carbonation, portlandite was completely depleted in all mixtures, confirming its full consumption during carbonation reactions. Following realkalization, only a minimal recovery of portlandite was observed, with values ranging from 1.2% (CEM I and CEM II/A-LL) to 1.9% (CEM II/A-V), suggesting limited reformation of this phase under alkaline conditions.
The total carbonate content (calcite + vaterite) increased substantially after carbonation, with values ranging from 48.4% (CEM II/B-W) to 61.12% (CEM II/A-LL), confirming extensive carbonation. After realkalization, the carbonate content remained largely unchanged, with only minor variations, indicating that the alkaline treatment did not dissolve or alter the carbonated phases. The highest carbonate content after realkalization was observed in CEM II/A-V (64.8%), whereas CEM II/B-W exhibited a slight reduction to 47.1%.

3.3. Thermodynamic Modelling

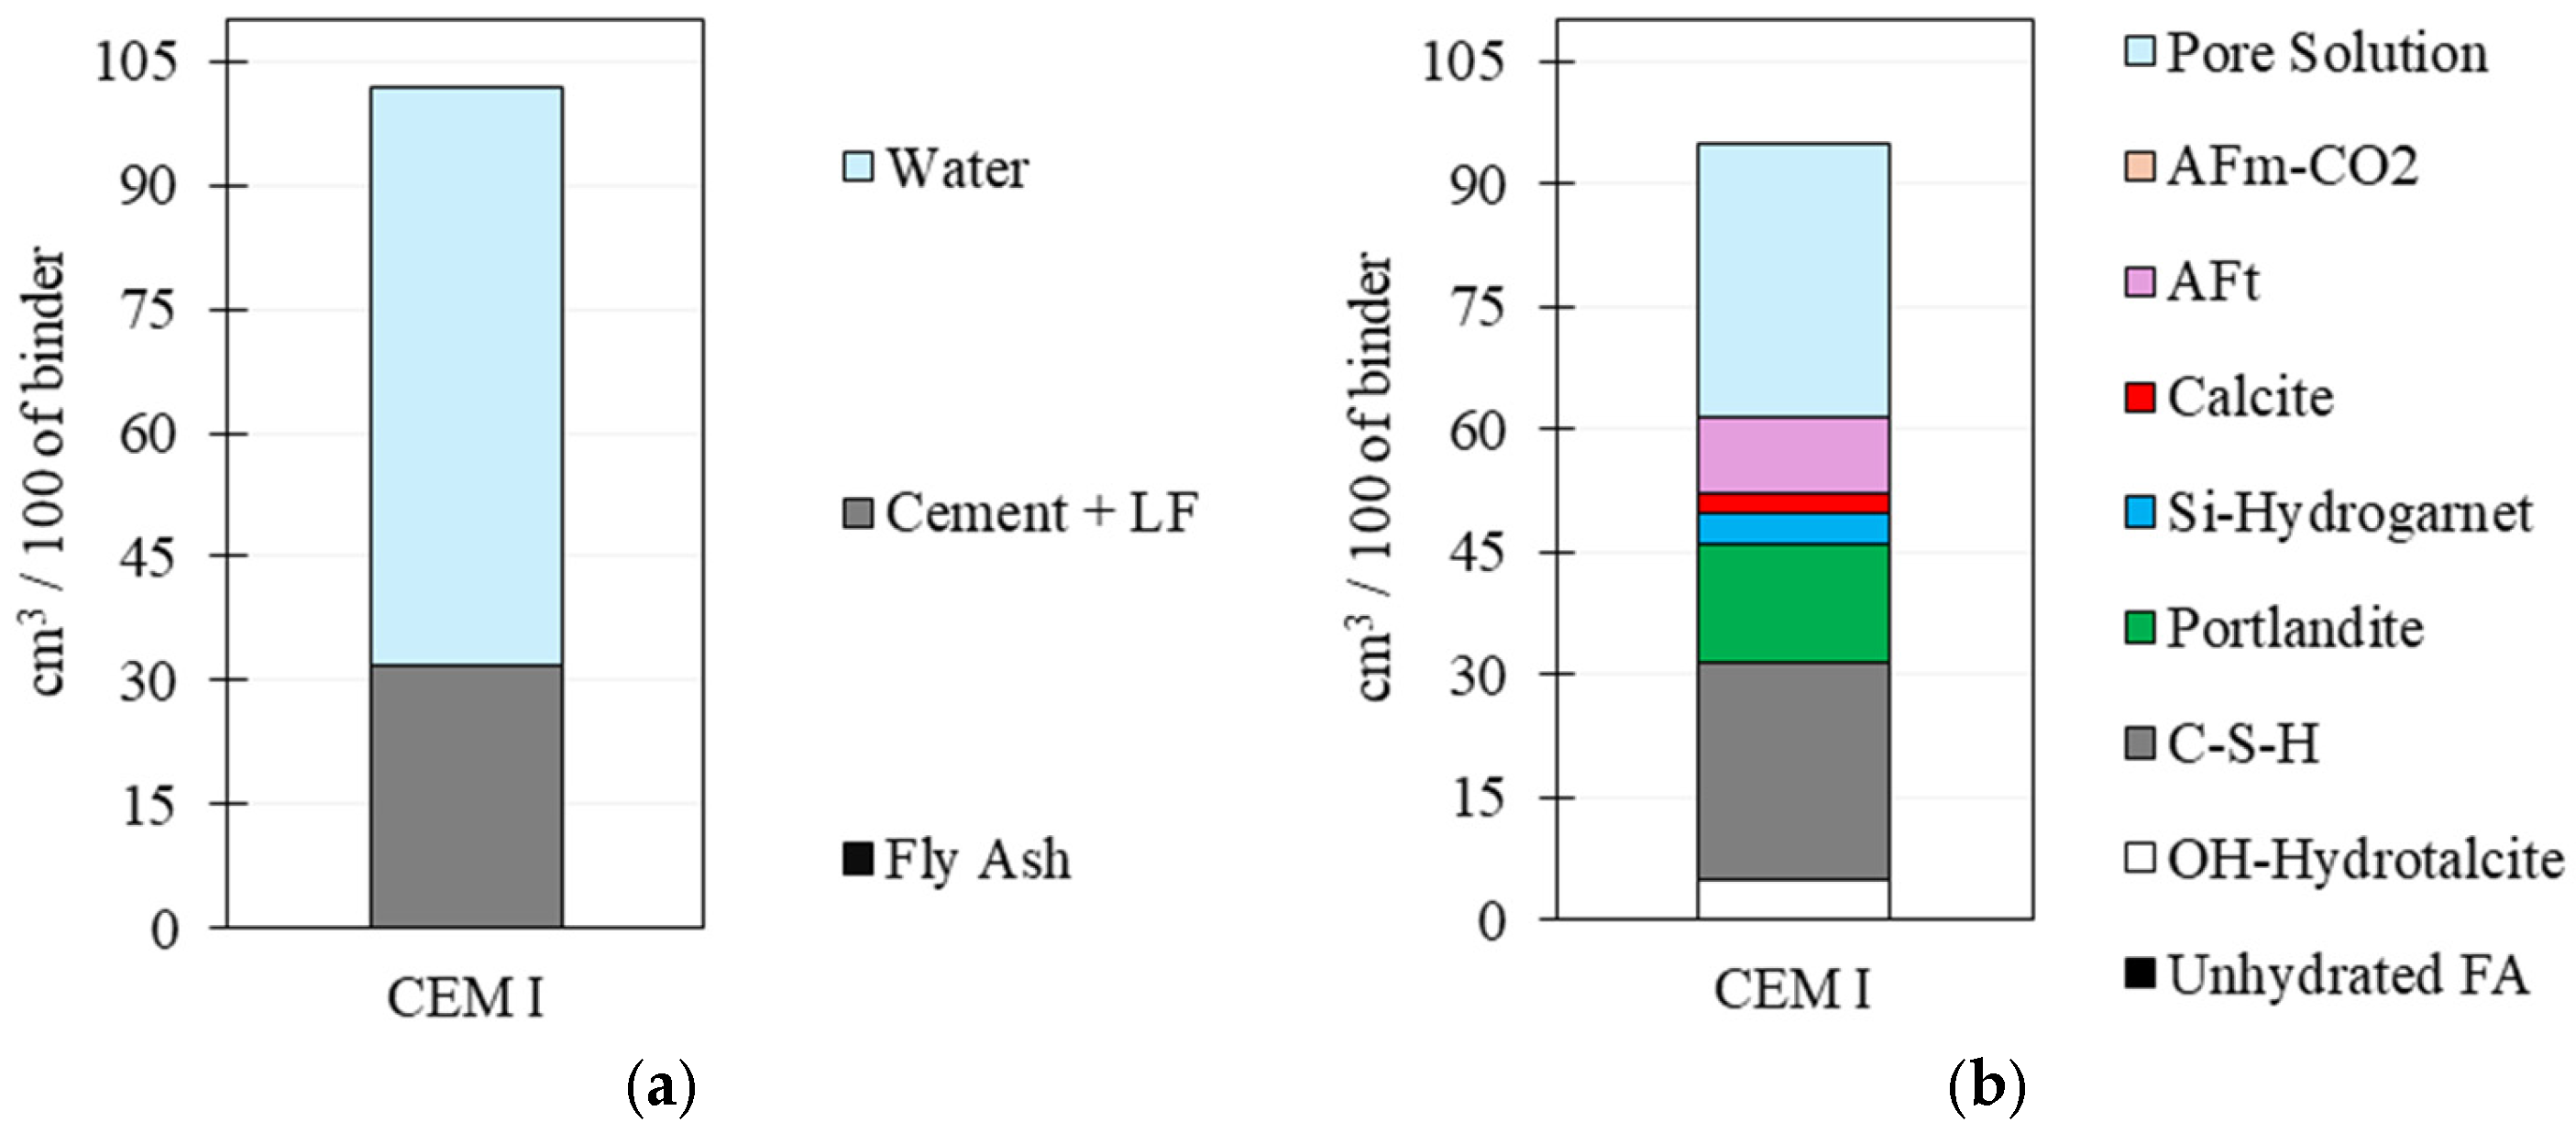
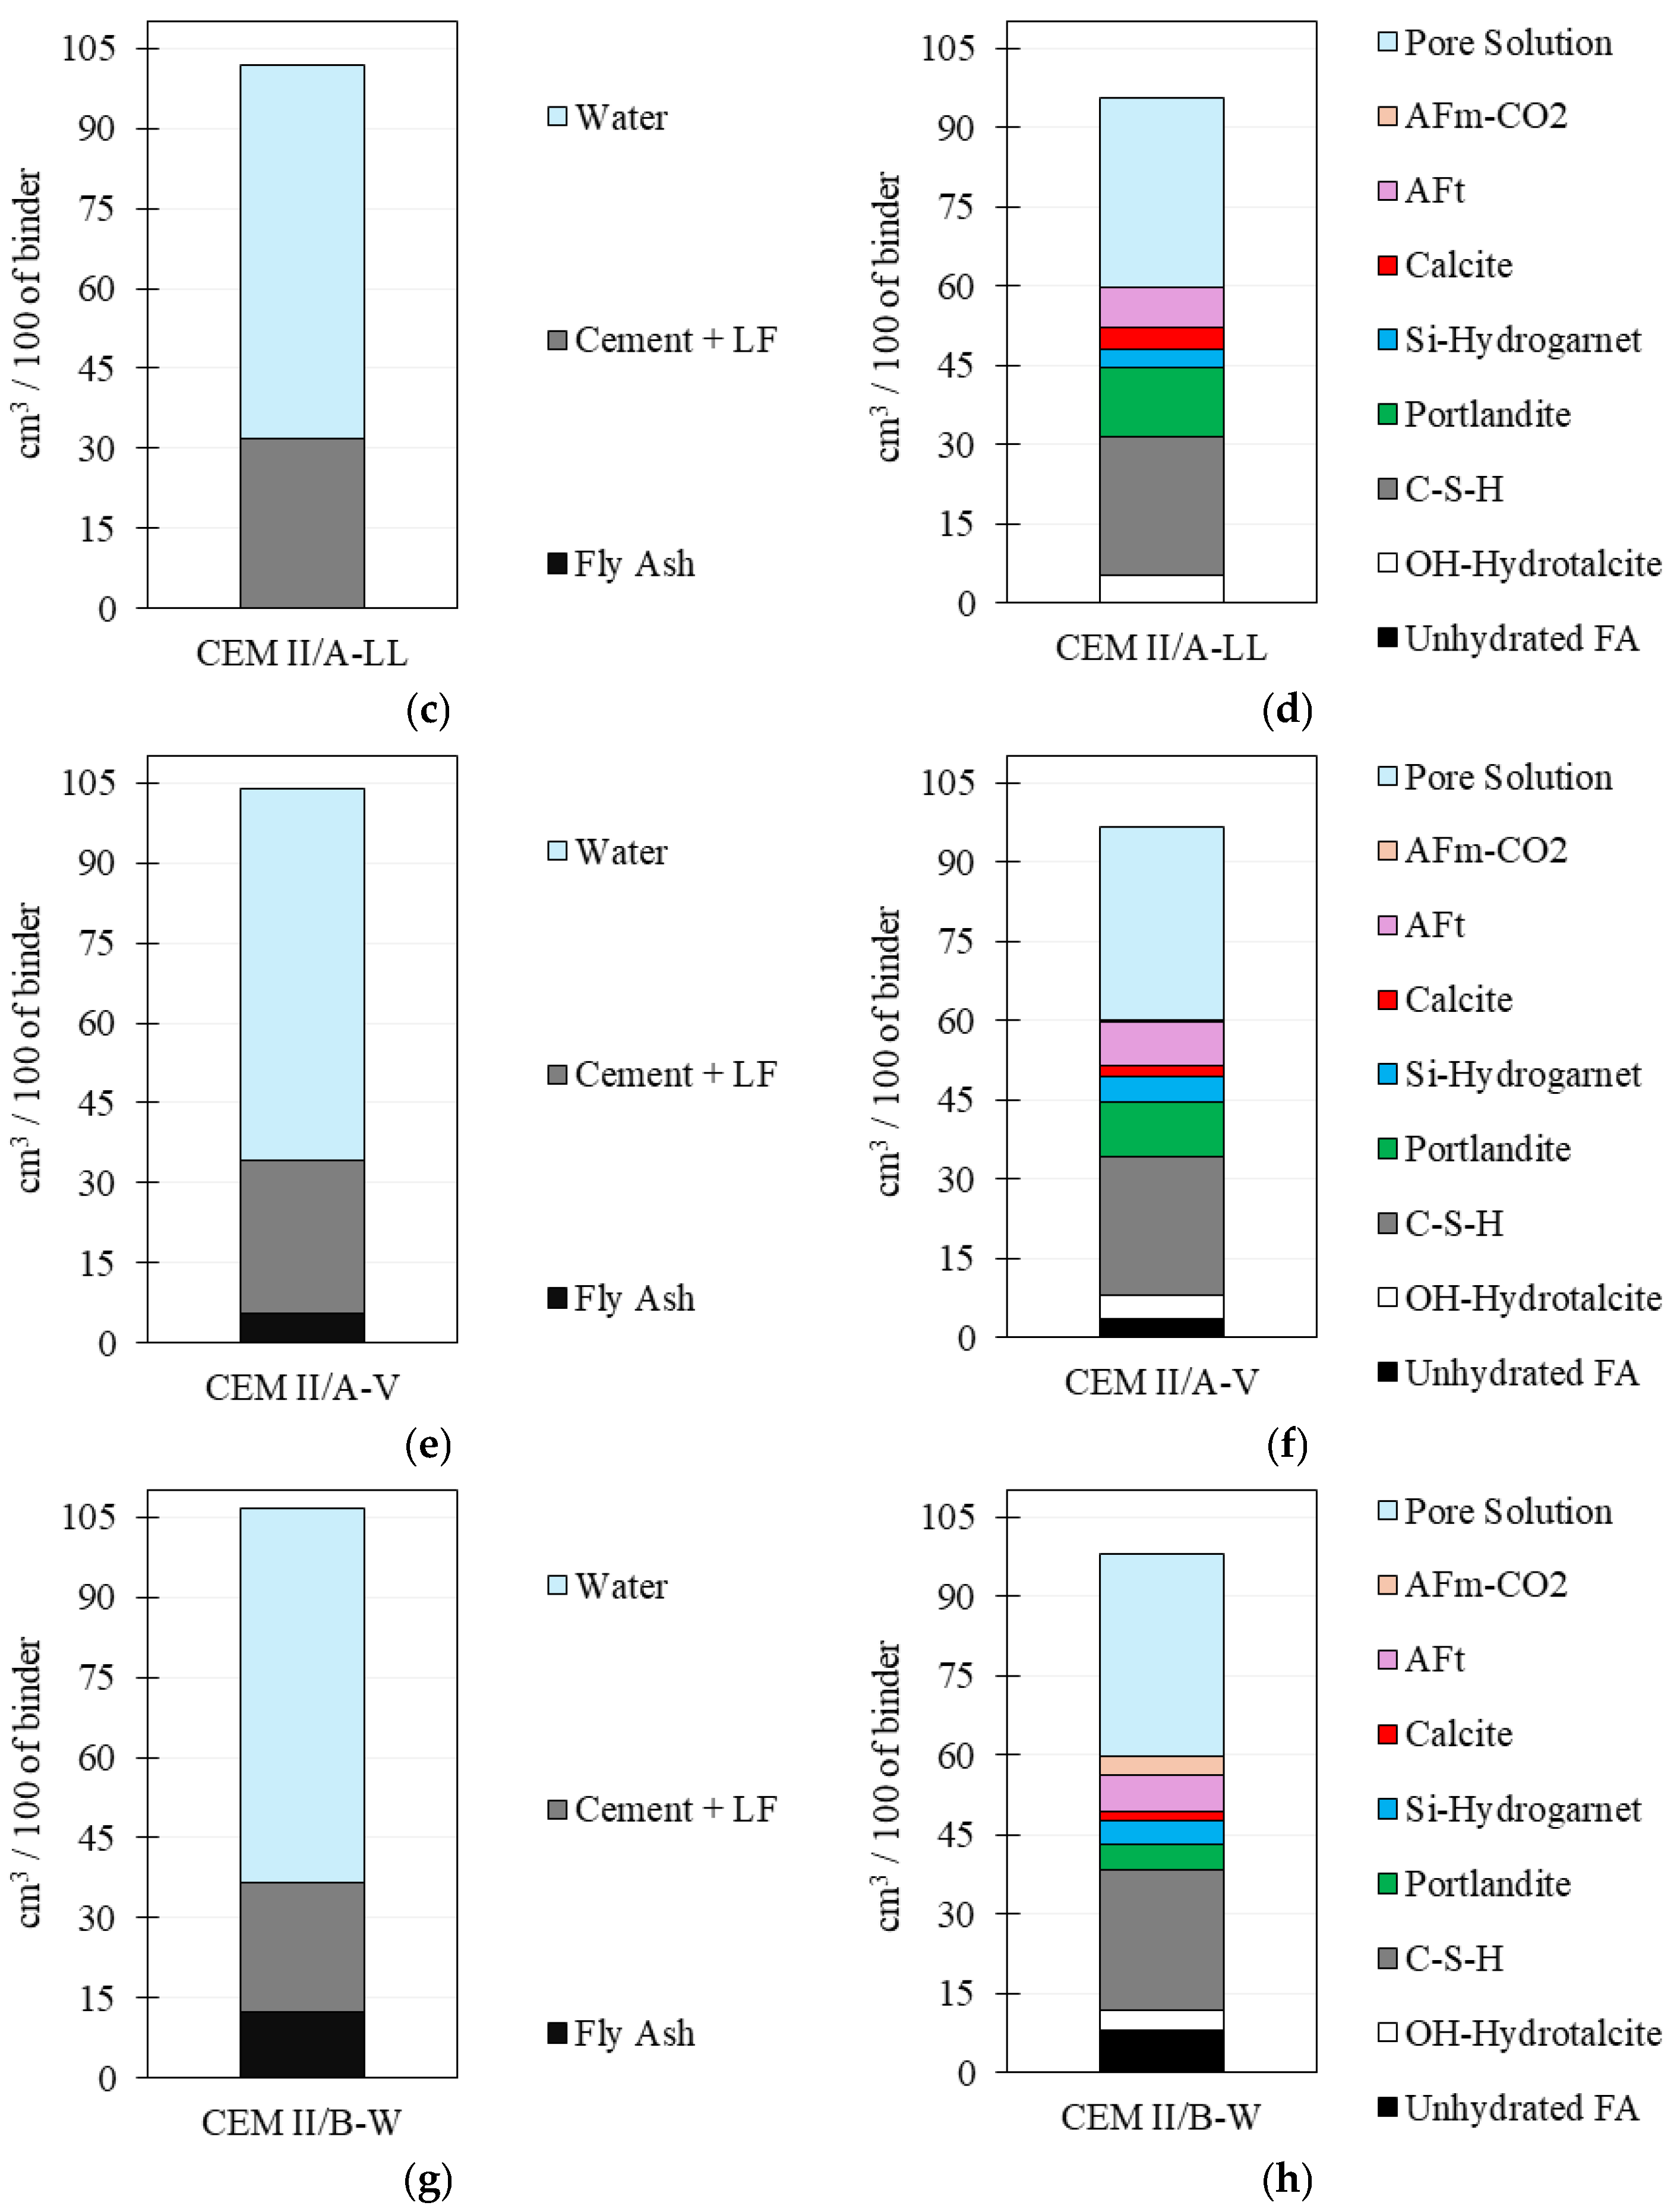
Thermodynamic modeling was conducted to predict the phase assemblage and porosity of hydrated cement pastes with different binder compositions. The results for each system, assuming full clinker reactivity and partial fly ash reaction (when applicable), are presented in Figure 12.
The paste composition for CEM I consisted of 70 g of water and 100 g of cement, with approximately 5% CaCO3 (Figure 12a). Upon hydration, the modeled phase assemblage (Figure 12b) revealed that the primary phases formed included C-S-H (26.26 cm3), portlandite (14.73 cm3), ettringite (AFt) (8.99 cm3), and OH-hydrotalcite (5.06 cm3). The total calculated pore solution volume was 33.59 cm3. Chemical shrinkage, determined from the difference between the initial and hydrated paste volumes, was 7.04 cm3. The total porosity, comprising chemical shrinkage and the pore solution volume, was 39.9%. This value does not account for air-entrained admixtures or the interfacial transition zone (ITZ) effects caused by aggregate incorporation, representing only the paste matrix.
The CEM II/A-LL system contained 70 g of water and 100 g of cement, with a higher CaCO3 content (approximately 11%) than CEM I (Figure 12c). The phase assemblage (Figure 12d) showed slightly lower volumes of portlandite (12.99 cm3) and ettringite (7.45 cm3) compared to CEM I, while calcite content increased to 4.43 cm3. The total pore solution volume was 35.79 cm3. Chemical shrinkage was calculated to be 6.40 cm3, resulting in a total porosity of 41.4%, which is slightly higher than that of CEM I, due to changes in phase formation and water retention characteristics.
In the CEM II/A-V system, 70 g of water, 89 g of cement, and approximately 11% of fly ash were used (Figure 12e). The phase assemblage (Figure 12f) reflected the contribution of the fly ash reaction, with lower portlandite content (10.38 cm3) and the presence of unhydrated fly ash (3.67 cm3). The pore solution volume (36.36 cm3) was higher than in CEM I and CEM II/A-LL. The chemical shrinkage was 7.59 cm3, resulting in a total porosity of 42.2%, which is slightly higher than that of the previous systems, due to the influence of fly ash on hydration and phase stability.
The CEM II/B-W paste mix contained 70 g of water, 76 g of cement, and approximately 24% fly ash (Figure 12g). The thermodynamic model (Figure 12h) indicated a substantial reduction in Portlandite content (4.84 cm3) compared to the other systems, with an increased volume of unhydrated fly ash (8.00 cm3) and AFm-CO2 (3.43 cm3), suggesting altered phase formation due to the higher fly ash content. The pore solution volume was 38.37 cm3, the highest among all studied mixtures. Chemical shrinkage was 8.46 cm3, resulting in a total porosity of 43.9%, indicating that higher fly ash replacement levels increased porosity and altered the hydration product distribution.
The predictions in the transformation of the phase assemblage with the progressive carbonation, represented by an increasing CO2 content per 100 g of binder, are displayed in Figure 13.
In CEM I paste, portlandite was the primary buffering phase, exhibiting a steady decrease from 14.7 cm3 at the initial state to complete depletion at approximately 19.95 g CO2/100 g binder. This depletion coincided with a significant increase in calcite formation, which reached 41.8 cm3 at the highest CO2 level. C-S-H remained relatively stable until advanced carbonation, where its volume declined sharply after 25.1 g CO2/100 g binder was added. The pH remained constant at 13.18 until portlandite exhaustion, after which it progressively decreased to 7.31 at full carbonation. Amorphous silica, M-S-H, Gypsum, Al(OH)3, and zeolites emerged in the final stages of the carbonation process, indicating the decalcification and destabilization of C-S-H, AFt, OH-hydrotalcite, and Si-hydrogarnet.
The presence of limestone filler in CEM II/A-LL influenced carbonation resistance, as portlandite depletion occurred earlier (15.85 g CO2/100 g binder). The C-S-H content showed a similar trend to CEM I but underwent an earlier decline, while calcite formation reached 37.8 cm3 at full carbonation. The pH drop followed a similar pattern, decreasing from 13.17 to 7.31.
The inclusion of fly ash in CEM II/A-V resulted in a reduced initial portlandite content (10.6 cm3), leading to earlier buffering exhaustion at approximately 12.59 g CO2/100 g binder. This accelerated pH decline caused faster C-S-H degradation, with a sharp reduction observed beyond 19.95 g CO2/100 g binder. Calcite precipitation reached 35.2 cm3 at full carbonation, which is slightly lower than that of CEM I and CEM II/A-LL, due to the lower availability of portlandite. The formation of aluminosilicate phases, including zeolites, was more pronounced, reflecting pozzolanic contributions from the fly ash.
CEM II/B-W, incorporating a significant proportion of siliceous additions, exhibited the lowest initial portlandite content (7.5 cm3) and its earliest depletion at 10.0 g CO2/100 g binder. The reduction in C-S-H volume was evident from the early stages, with increased amorphous silica formation as carbonation progressed. Unlike other mixtures, a notable presence of aluminosilicate hydrates persisted even at advanced carbonation, suggesting a stabilizing effect from pozzolanic hydration products. Calcite formation peaked at 32.1 cm3, with pH dropping from 13.15 to 7.30.

4. Discussions

The effectiveness of chemical realkalization (CR) as a remediation strategy for carbonated concrete is strongly influenced by cement composition and the incorporation of supplementary cementitious materials (SCMs). This study aimed to elucidate the transport mechanisms and chemical interactions that govern the efficiency of CR in various cementitious systems. The results highlight the interplay between compressive strength, carbonation susceptibility, pore structure, and realkalization kinetics in CEM I, CEM II/A-LL, CEM II/A-V, and CEM II/B-W mixtures.

4.1. Carbonation and Realkalization Dynamics

The carbonation depth measurements revealed that blended cements were more susceptible to carbonation than CEM I, as indicated by their higher carbonation depths and lower portlandite content. CEM II/A-LL exhibited the deepest carbonation (15.0 mm at 91 days), followed by CEM II/A-V (10.4 mm), CEM II/B-W (10.3 mm), and CEM I (9.5 mm). This trend affected the carbonation coefficient (KCO2), where CEM II/A-V exhibited the highest value (1.40 mm/√days), indicating the influence of clinker dilution and the presence of SCMs on carbonation resistance. The increased porosity associated with SCM-rich cements facilitated CO2 diffusion, accelerating the carbonation process. Additionally, the consumption of portlandite in pozzolanic reactions further reduced the buffering capacity, particularly in CEM II/A-V and CEM II/B-W. It is acknowledged that the use of phenolphthalein may slightly underestimate carbonation depth in blended systems, due to its insensitivity to partially carbonated zones with pH values between 8.5 and 9.5. However, this limitation was mitigated by combining visual pH indication with quantitative portlandite analysis and pH measurements, providing a more comprehensive evaluation of carbonation progression.
The realkalization depth measurements demonstrated the influence of cement composition on alkaline solution penetration. CEM II/A-V exhibited the most profound realkalization depth (20.0 mm at 56 days), followed by CEM II/B-W (17.3 mm). In contrast, CEM I showed the lowest realkalization depth (12.8 mm at 91 days). The realkalization coefficient (KRealk) confirmed that the higher porosity in blended cements facilitated deeper ionic transport, leading to more effective penetration of alkaline solutions. CEM I, with its lower porosity, exhibited the lowest realkalization rate (2.51 mm/√days), highlighting the role of SCM-induced microstructural modifications in enhancing realkalization efficiency.
Phase analysis after realkalization demonstrated the reformation of portlandite, particularly in CEM I and CEM II/A-LL, where the pH increase was most pronounced. Thermodynamic modeling supported these findings, showing that once pH surpassed ~13.7, portlandite precipitation occurred, facilitated by calcite dissolution. This confirmed that realkalization was not only effective in restoring alkalinity but also in promoting the recrystallization of portlandite. The presence of limestone filler in CEM II/A-LL and CEM II/B-W influenced the phase transformations by promoting carboaluminate formation, further stabilizing the microstructure.
These results reinforced the significant role of cement composition in carbonation resistance and realkalization efficiency. While SCM-rich cements were more susceptible to carbonation, they exhibited superior realkalization due to their higher permeability.

4.2. Microstructural Evolution: Porosity and pH

The evolution of apparent porosity demonstrated distinct effects of carbonation and realkalization on the cementitious matrices. Carbonation led to a reduction in porosity for CEM I (33.7%) and CEM II/A-LL (25.74%), indicating a densification effect likely caused by the precipitation of calcium carbonate within the pore network. Conversely, CEM II/B-W exhibited an increase in porosity (37.53%), suggesting that carbonation-induced reactions modified its microstructure differently, potentially due to interactions between CO2 and pozzolanic phases that resulted in the formation of additional pore spaces.
Following realkalization, porosity trends varied depending on cement composition. CEM I (27.8%) and CEM II/A-V (30.79%) showed a decrease in porosity, suggesting that the alkaline solution contributed to pore refinement, likely by promoting secondary hydration reactions. In contrast, CEM II/B-W experienced a significant increase in porosity (42.59%), indicating that realkalization altered its pore network. The increased porosity observed in CEM II/B-W after realkalization can be primarily attributed to the higher volume of fly ash (approximately 24%) in the mix. Fly ash has lower reactivity compared to clinker, meaning that a more significant proportion of it remains unreacted during hydration. Despite maintaining a consistent water-to-binder ratio, the higher fly ash content leads to a cement matrix with more unreacted, glassy phases. When exposed to the high-pH KOH solution during realkalization, these unreacted phases may undergo partial dissolution, which could contribute to decreasing porosity; however, in the studied case, this was not sufficient. Moreover, the partial dissolution theory of the not yet reacted glassy phases of the fly ash may have been leached out during the realkalization, increasing porosity.
The pH evolution aligned with these microstructural changes. Carbonation significantly reduced the pH across all cement types, with CEM I exhibiting the lowest post-carbonation pH (9.25), which is consistent with the complete depletion of portlandite, as confirmed by thermodynamic modeling. The pH reductions were less severe in CEM II/B-W and CEM II/A-V, where pozzolanic phases influenced the buffering capacity. Realkalization resulted in partial pH recovery, with CEM II/A-V reaching the highest final pH (11.33). This suggests that CEM II/A-V enabled the effective diffusion of alkaline species, thereby enhancing pH restoration. However, none of the systems fully regained their initial pH, reinforcing that carbonation-induced changes were not entirely reversible under the studied conditions.
Thermodynamic modeling supported these observations, predicting that pH restoration was influenced by calcite stability and limited portlandite regeneration. As realkalization solutions diffused into the carbonated zones, the dissolution of calcite helped increase the pH, but the extent of portlandite reformation remained limited. This explained why, despite significant pH recovery, the phase assemblage did not revert to its original state.

4.3. Phase Transformations: XRD and TGA Analyses

XRD and TGA analyses confirmed the occurrence of significant phase transformations during carbonation and realkalization. Carbonation resulted in the complete depletion of portlandite, leading to the precipitation of calcium carbonate polymorphs, primarily calcite and vaterite. The absence of portlandite indicated that carbonation had significantly altered the cementitious matrix, reducing its buffering capacity against further CO2 ingress. The preferential formation of calcite suggested that carbonation reactions followed thermodynamically stable pathways, where the conversion of portlandite to calcium carbonate was nearly complete under the exposure conditions.
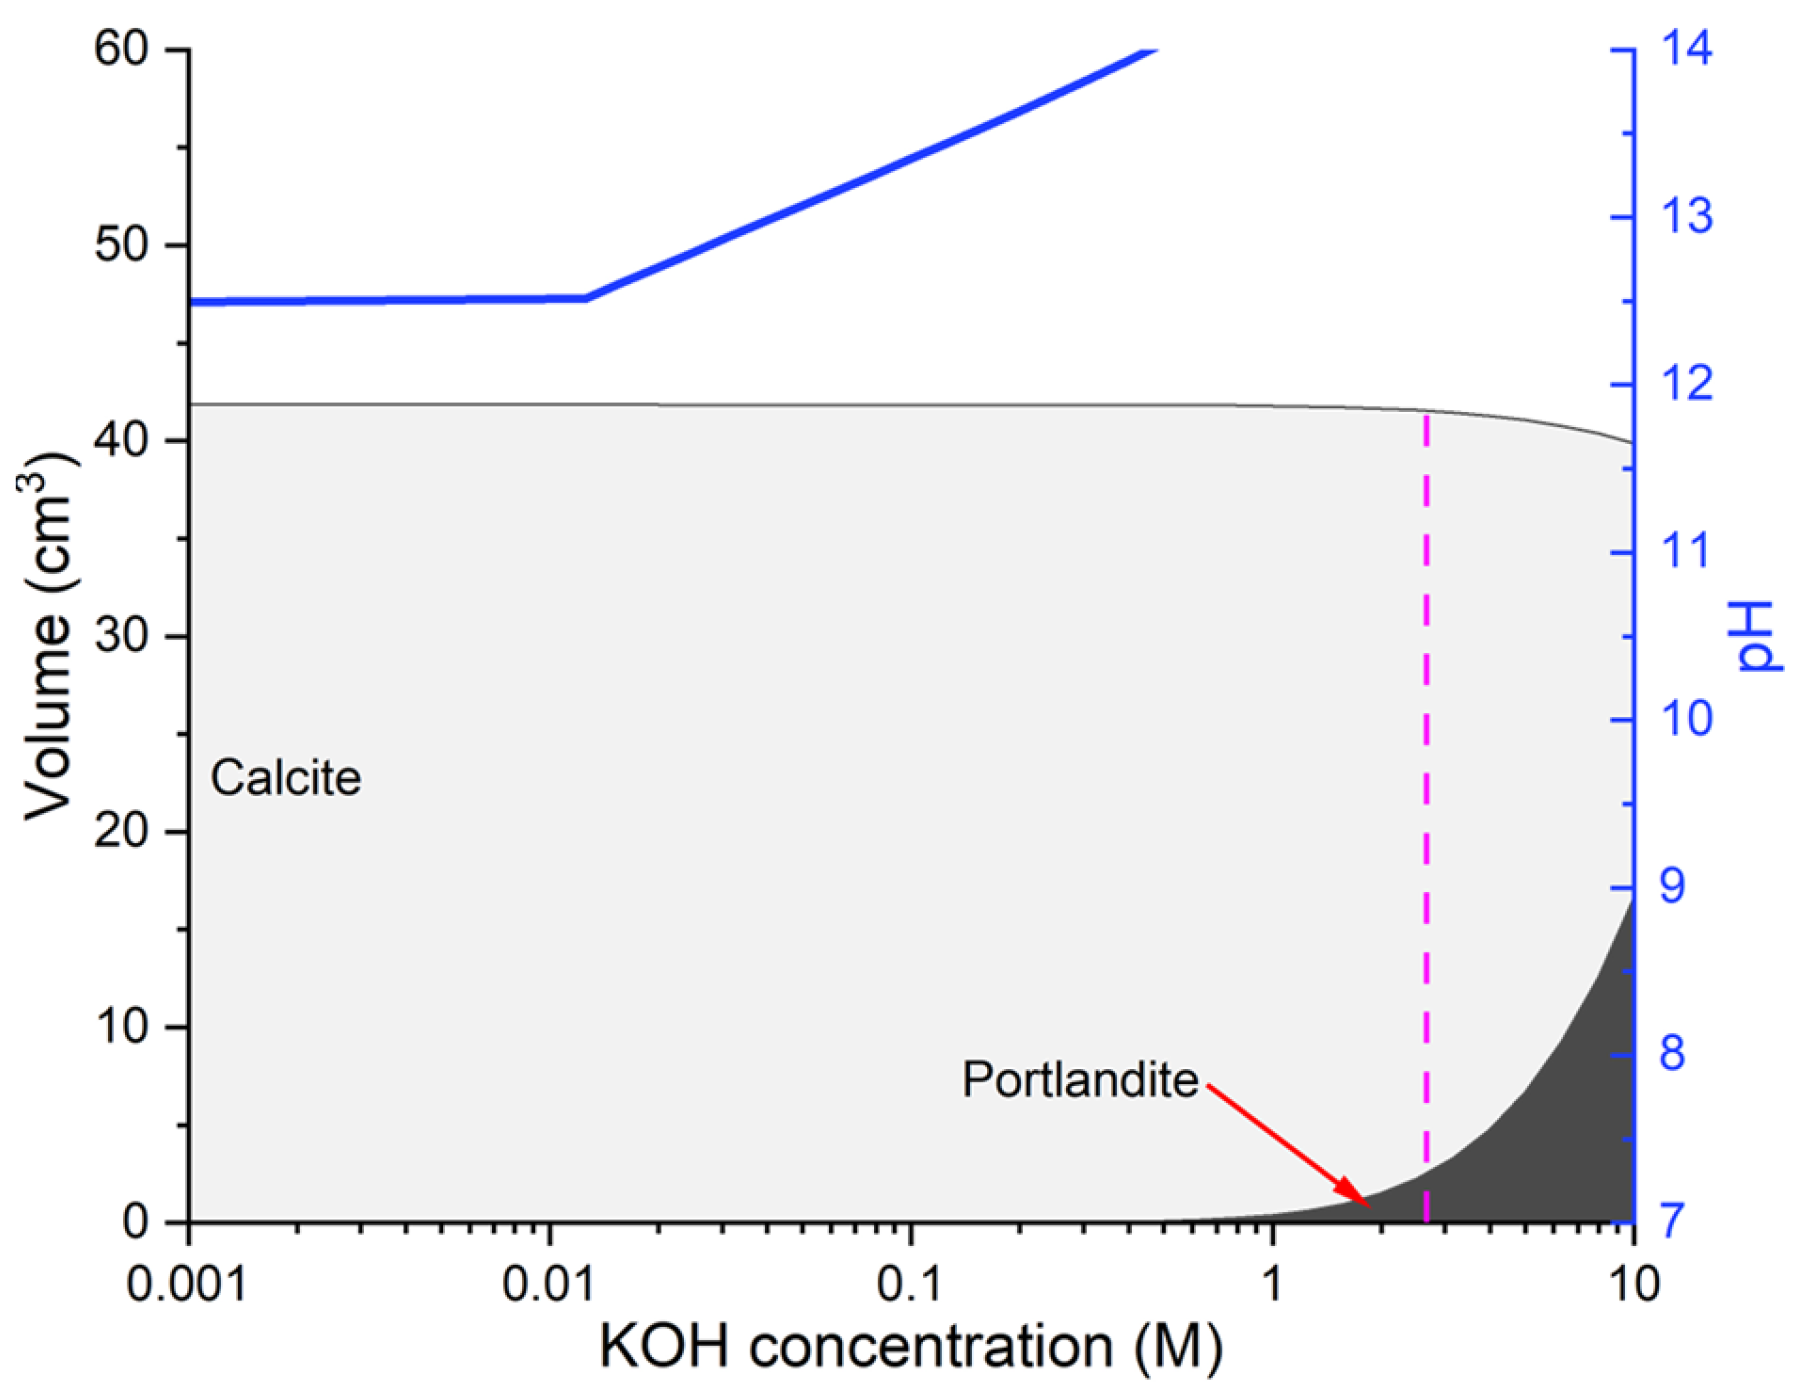
Realkalization partially restored alkalinity but did not substantially reverse carbonation-induced phase changes. The limited reformation of Portlandite (1.2–1.9%) suggests that hydroxyl ion penetration did not effectively dissolve carbonation products, thereby regenerating the original hydrated phases. Instead, the alkaline solution primarily increased the pH within the pore network, mitigating further acidification but without fully re-establishing the initial phase composition. Nevertheless, the regenerated portlandite, although limited in quantity, was formed under highly alkaline conditions (pH > 13.7), as supported by thermodynamic modeling (Figure 14). This indicates that the portlandite formed during realkalization was chemically stable and potentially reactive within the pore solution environment.
Furthermore, the pH recovery data (Figure 9) confirmed that the realkalized specimens reached high alkalinity levels, approaching the conditions necessary for steel passivation. This suggests that the effectiveness of realkalization lies not solely in mineralogical recovery but in the restoration of a chemically protective environment. While direct electrochemical assessment of passivation was beyond the scope of this work, the restored pH and presence of newly formed portlandite collectively support the potential for corrosion mitigation.
Thermodynamic modeling provided further comprehension of these transformations (Figure 14), demonstrating that increasing KOH concentration elevated pH but did not lead to significant calcite dissolution. Even at higher alkalinity levels, calcite remained stable, implying that realkalization primarily functioned by replenishing hydroxyl ions rather than reversing carbonation. The partial portlandite reformation at 2.67 M KOH aligned with experimental results, reinforcing the notion that conventional realkalization conditions were insufficient to regenerate the hydration products lost during carbonation. Nonetheless, they were sufficient to re-establish a chemically favorable environment that may contribute to the repassivation of embedded steel.

4.4. Thermodynamic Modelling: Phase Assemblage and Pore Solution Evolution

Thermodynamic modeling provided a comprehension of the phase assemblage and porosity evolution during carbonation and realkalization. The modeling results (Figure 12) showed that the calculated porosity values were in agreement with experimental measurements, with CEM II/B-W exhibiting the highest porosity (43.9%) and CEM I the lowest (39.9%). These findings align with the known influence of cement composition on porosity, as higher pozzolanic content typically leads to increased porosity due to the formation of less dense hydration products.
The modeling also corroborated the experimental observation that carbonation resulted in the depletion of portlandite, which was compensated by the formation of calcite. Upon realkalization, only partial regeneration of portlandite was observed, consistent with the limited recovery of alkaline reserves noted in the XRD and TGA results. This partial recovery reinforces the idea that realkalization cannot completely reverse the carbonation process, underscoring the limitations of current methods in restoring full alkalinity.

4.5. Implications for Realkalization Strategies

The results of this study underscored the significant influence of cement composition on the efficiency of realkalization strategies. Blended cements, such as CEM II/A-V and CEM II/B-W, exhibited enhanced ionic transport and deeper penetration of alkaline solutions, which are critical factors for effective realkalization. However, their lower Portlandite content hindered the complete recovery of alkalinity, as observed in both the experimental and thermodynamic simulation results. This finding highlights the trade-off between increased porosity and enhanced ionic mobility in blended cements, which allows for better penetration but limits the full regeneration of portlandite.
In contrast, CEM I demonstrated superior buffering capacity due to its higher portlandite content. While this composition could theoretically support greater realkalization, its lower permeability restricted the depth of alkaline solution penetration. As a result, realkalization in CEM I was less effective in terms of the volume of material treated, despite the greater availability of portlandite.
These findings emphasize the necessity for tailored remediation strategies that account for variations in binder composition and pore structure to optimize realkalization effectiveness. Specifically, the higher permeability of blended cements may facilitate deeper penetration of alkaline solutions, but their reduced portlandite content limits the extent of alkalinity recovery. Conversely, CEM I’s lower permeability might restrict solution penetration but could be more suitable for systems where full alkalinity recovery is a priority.
Future research should focus on refining the properties of alkaline solutions and exposure conditions to improve realkalization outcomes across diverse cementitious systems further. By considering both material composition and treatment conditions, more effective realkalization strategies can be developed to restore the durability of carbonated concrete.

5. Conclusions

This study offers a valuable understanding of the dynamics of carbonation and realkalization in cementitious systems, highlighting the impact of cement composition on these processes.
The experimental results confirmed that blended cements, particularly those with higher supplementary cementitious materials (SCMs), exhibited greater susceptibility to carbonation than CEM I. This increased susceptibility was attributed to their lower Portlandite content and higher porosity, which facilitated the ingress of CO2. Among the blended cements, CEM II/A-LL demonstrated the highest carbonation depth, while CEM I exhibited the lowest, confirming the critical role of clinker content and microstructural characteristics in carbonation resistance.
  • In contrast, the realkalization process was more effective in blended cements, with CEM II/A-V showing the deepest realkalization depth, followed by CEM II/B-W. The higher porosity in these mixtures enhanced the penetration of alkaline solutions, contributing to deeper ionic transport and partial recovery of alkalinity. CEM I, with its lower porosity, exhibited the lowest realkalization depth and slower realkalization rate, further emphasizing the influence of cement microstructure on remediation efficiency.
  • The phase transformation analysis, supported by thermogravimetric (TGA) and X-ray diffraction (XRD) results, revealed that carbonation led to the depletion of portlandite and the formation of calcium carbonate polymorphs. While realkalization resulted in some regeneration of portlandite, it did not fully reverse the carbonation-induced changes, which were further corroborated by thermodynamic simulations. These simulations also demonstrated the limited effect of high alkaline concentrations in dissolving carbonation products, reinforcing the partial nature of realkalization in restoring the original cement matrix.
  • Based on the results, the 2.67 M KOH solution provided sufficient alkalinity to induce partial portlandite reformation and raise the pH. However, exposure durations should be tailored according to the cement composition. Blended cements, such as CEM II/A-V and CEM II/B-W, with higher permeability, responded well to shorter treatment periods (28–56 days), whereas denser systems, like CEM I, required prolonged immersion (up to 91 days) to achieve comparable pH recovery levels. These observations align with the thermodynamic modeling, which indicated that solution pH, rather than the dissolution of carbonation products, governed the potential for portlandite regeneration.
  • Overall, this study underscores the importance of tailoring realkalization strategies to the specific characteristics of the cementitious materials used, considering both their carbonation resistance and realkalization potential. Future research should focus on optimizing realkalization methods, particularly the properties of alkaline solutions and exposure conditions, to improve the recovery of cementitious systems with varying compositions.

Author Contributions

Conceptualization, G.C.R. and M.H.F.d.M.; methodology, G.C.R. and M.H.F.d.M.; validation, G.C.R., R.P.S., J.H.F., D.J.D.S. and M.H.F.d.M.; formal analysis, G.C.R., D.J.D.S. and M.H.F.d.M.; investigation, G.C.R., R.P.S., J.H.F., D.J.D.S. and M.H.F.d.M.; data curation, G.C.R., D.J.D.S. and M.H.F.d.M.; writing—original draft preparation, G.C.R., D.J.D.S. and M.H.F.d.M.; writing—review and editing, G.C.R., R.P.S., J.H.F., D.J.D.S. and M.H.F.d.M.; visualization, G.C.R., R.P.S., J.H.F., D.J.D.S. and M.H.F.d.M.; project administration, J.H.F. and M.H.F.d.M. All authors have read and agreed to the published version of the manuscript.

Funding

Foundation for the financial support dedicated to the development of this research through equipment and scholarships. We are grateful for the FINEP CT-INFRA 793/2004-UFPR and 3080/2011-UFPR projects for the availability of the XRD equipment. We also thank the Graduate Program in Civil Engineering (PPGEC) of the Federal University of Paraná (UFPR), the Laboratory of Materials and Structures of the Department of Civil Construction of UFPR (LaME-DCC), and the Center for Studies in Civil Engineering (CESEC).

Data Availability Statement

The original contributions presented in the study are included in the article, further inquiries can be directed to the corresponding author.

Conflicts of Interest

The authors declare no conflict of interest.

References

  1. Vázquez, E.; Barra, M.; Aponte, D.; Jiménez, C.; Valls, S. Improvement of the Durability of Concrete with Recycled Aggregates in Chloride Exposed Environment. Constr. Build. Mater. 2014, 67, 61–67. [Google Scholar] [CrossRef]
  2. Papadakis, V.G. Effect of Supplementary Cementing Materials on Concrete Resistance against Carbonation and Chloride Ingress. Cem. Concr. Res. 2000, 30, 291–299. [Google Scholar] [CrossRef]
  3. Machner, A.; Zajac, M.; Ben Haha, M.; Kjellsen, K.O.; Geiker, M.R.; De Weerdt, K. Stability of the Hydrate Phase Assemblage in Portland Composite Cements Containing Dolomite and Metakaolin after Leaching, Carbonation, and Chloride Exposure. Cem. Concr. Compos. 2018, 89, 89–106. [Google Scholar] [CrossRef]
  4. Al-Sodani, K.A.A.; Al-Amoudi, O.S.B.; Maslehuddin, M.; Shameem, M. Efficiency of Corrosion Inhibitors in Mitigating Corrosion of Steel under Elevated Temperature and Chloride Concentration. Constr. Build. Mater. 2018, 163, 97–112. [Google Scholar] [CrossRef]
  5. De Weerdt, K.; Wilson, W.; Machner, A.; Georget, F. Chloride Profiles—What Do They Tell Us and How Should They Be Used? Cem. Concr. Res. 2023, 173, 107287. [Google Scholar] [CrossRef]
  6. Kannan, V.; Ganesan, K. Chloride and Chemical Resistance of Self Compacting Concrete Containing Rice Husk Ash and Metakaolin. Constr. Build. Mater. 2014, 51, 225–234. [Google Scholar] [CrossRef]
  7. Houst, Y.F.; Wittmann, F.H. Influence of Porosity and Water Content on the Diffusivity of CO2 and O2 through Hydrated Cement Paste. Cem. Concr. Res. 1994, 24, 1165–1176. [Google Scholar] [CrossRef]
  8. Qiu, Q. A State-of-the-Art Review on the Carbonation Process in Cementitious Materials: Fundamentals and Characterization Techniques. Constr. Build. Mater. 2020, 247, 118503. [Google Scholar] [CrossRef]
  9. Bernal, S.A.; Dhandapani, Y.; Elakneswaran, Y.; Gluth, G.J.G.; Gruyaert, E.; Juenger, M.C.G.; Lothenbach, B.; Olonade, K.A.; Sakoparnig, M.; Shi, Z.; et al. Report of RILEM TC 281-CCC: A Critical Review of the Standardised Testing Methods to Determine Carbonation Resistance of Concrete; Springer: Dordrecht, The Netherlands, 2024; Volume 57, ISBN 0123456789. [Google Scholar]
  10. Medeiros, M.H.F.; Helene, P. Surface Treatment of Reinforced Concrete in Marine Environment: Influence on Chloride Diffusion Coefficient and Capillary Water Absorption. Constr. Build. Mater. 2009, 23, 1476–1484. [Google Scholar] [CrossRef]
  11. Macioski, G.; De Souza, D.J.; Capraro, A.P.B.; Medeiros, M.H.F. Analysis of Steel Bars Corrosion as a Function of the Environment PH. Alconpat J. 2016, 6, 141–151. [Google Scholar] [CrossRef]
  12. Phung, Q.T.; Maes, N.; Jacques, D.; Bruneel, E.; Van Driessche, I.; Ye, G.; De Schutter, G. Effect of Limestone Fillers on Microstructure and Permeability Due to Carbonation of Cement Pastes under Controlled CO2 Pressure Conditions. Constr. Build. Mater. 2015, 82, 376–390. [Google Scholar] [CrossRef]
  13. Von Greve-Dierfeld, S.; Lothenbach, B.; Vollpracht, A.; Wu, B.; Huet, B.; Andrade, C.; Medina, C.; Thiel, C.; Gruyaert, E.; Vanoutrive, H.; et al. Understanding the Carbonation of Concrete with Supplementary Cementitious Materials: A Critical Review by RILEM TC 281-CCC. Mater. Struct. 2020, 53, 136. [Google Scholar] [CrossRef]
  14. Bier, T.A.; Kropp, J.; Hilsdorf, H.K. Carbonation and Realkalinization of Concrete and Hydrated Cement Paste. In Durability of Construction Materials; RILEM: Paris, France; Chapman & Hall Publishers: London, UK, 1987. [Google Scholar]
  15. Réus, G.C.; Medeiros, M.H.F. Chemical Realkalization for Carbonated Concrete Treatment: Alkaline Solutions and Application Methods. Constr. Build. Mater. 2020, 262, 120880. [Google Scholar] [CrossRef]
  16. Al-Jabari, M. Concrete Durability Problems: Physicochemical and Transport Mechanisms. In Integral Waterproofing of Concrete Structures; Woodhead Publishing: Sawston, UK, 2022; ISBN 978-0-12-824354-1. [Google Scholar]
  17. Chatterji, S. Simultaneous Chloride Removal and Realkalinization of Old Concrete Structures. Cem. Concr. Res. 1994, 24, 1051–1054. [Google Scholar] [CrossRef]
  18. Oliveira, R.L.N.; Bragança, M.O.G.P.; Medeiros-Junior, R.A. Effect of Coarse Aggregate Size on Corrosion of Reinforced Concrete Exposed to Carbonation and Chloride Ingress by Electrochemical Measurements. Constr. Build. Mater. 2022, 361, 129665. [Google Scholar] [CrossRef]
  19. Mazer, W.; Ferreira, E.O.; da Silva, M.T.Q.; Basso Tokarski, R. Rehabilitation Technologies. In Durability of Concrete Structures; Delgado, J.M.P.Q., Ed.; Springer International Publishing: Cham, Switzerland, 2021; pp. 63–83. ISBN 978-3-030-62825-3. [Google Scholar]
  20. de Oliveira, F.G.X.; de Oliveira, F.R.X. Evaluation and Repair of a Reinforced Concrete Structure: A Case Study; Rehabend; David Publishing: Wilmington, DE, USA, 2018; pp. 1913–1921. [Google Scholar] [CrossRef]
  21. Girčienė, O.; Ramanauskas, R.; Gudavičiūtė, L.; Martušienė, A. Inhibition Effect of Sodium Nitrite and Silicate on Carbon Steel Corrosion in Chloride-Contaminated Alkaline Solutions. Corrosion 2011, 67, 125001–125012. [Google Scholar] [CrossRef]
  22. Ma, Y.; Zhang, J.; Yang, X.; Yang, Z.; Zhang, Z. Assessing the Long-Term Chloride Resistance of Alkali-Activated Fly Ash/Slag Concrete by Natural Chloride Diffusion Test and Rapid Chloride Migration Test. Constr. Build. Mater. 2025, 472, 140823. [Google Scholar] [CrossRef]
  23. Wang, J.; Fu, M.; Zheng, K.; Zhang, K.; Fan, Y.; Niu, D. Ion Transport Mechanism and Diffusion Model Establishment in Recycled Aggregate Concrete Subjected to Magnesium, Sulfate, and Chloride Attack. Constr. Build. Mater. 2024, 428, 136273. [Google Scholar] [CrossRef]
  24. Saloni; Parveen; Lim, Y.Y.; Pham, T.M.; Negi, P. Performance Enhancement of Rubberised-Alkali-Activated-Concrete Utilising Ultra-Fine Slag and Fly Ash. Clean. Mater. 2022, 4, 100080. [Google Scholar] [CrossRef]
  25. Zhu, C.; Liu, X.; Liu, C.; Yu, W.; Bai, G. Study on the Chloride Ion Transport Mechanism of Recycled Mixed Aggregate Concrete Based on Evolution Characteristics of Pore Structure. Constr. Build. Mater. 2022, 353, 129101. [Google Scholar] [CrossRef]
  26. Xie, M.; Su, D.; Mayer, K.U.; MacQuarrie, K.T.B. Reactive Transport Investigations of the Long-Term Geochemical Evolution of a Multibarrier System Including Bentonite, Low-Alkali Concrete and Host Rock. Appl. Geochem. 2022, 143, 105385. [Google Scholar] [CrossRef]
  27. de Medeiros, M.H.F.; Raisdorfer, J.W.; Hoppe Filho, J.; Medeiros-Junior, R.A. Partial Replacement and Addition of Fly Ash in Portland Cement: Influences on Carbonation and Alkaline Reserve. J. Build. Pathol. Rehabil. 2017, 2, 4. [Google Scholar] [CrossRef]
  28. Filho, J.H.; Medeiros, M.D.; Pereira, E.; Helene, P.; Isaia, G.C. High-Volume Fly Ash Concrete with and without Hydrated Lime: Chloride Diffusion Coefficient from Accelerated Test. J. Mater. Civ. Eng. 2013, 25, 411–418. [Google Scholar] [CrossRef]
  29. Valcarce, M.B.; Vázquez, M. Carbon Steel Passivity Examined in Alkaline Solutions: The Effect of Chloride and Nitrite Ions. Electrochim. Acta 2008, 53, 5007–5015. [Google Scholar] [CrossRef]
  30. Chang, J.J. Bond Degradation Due to the Desalination Process. Constr. Build. Mater. 2003, 17, 281–287. [Google Scholar] [CrossRef]
  31. Anstice, D.J.; Page, C.L.; Page, M.M. The Pore Solution Phase of Carbonated Cement Pastes. Cem. Concr. Res. 2005, 35, 377–383. [Google Scholar] [CrossRef]
  32. Yohai, L.; Valcarce, M.B.; Vázquez, M. Testing Phosphate Ions as Corrosion Inhibitors for Construction Steel in Mortars. Electrochim. Acta 2016, 202, 316–324. [Google Scholar] [CrossRef]
  33. Tonoli, G.H.D.; Santos, S.F.; Savastano, H.; Delvasto, S.; Mejía De Gutiérrez, R.; Lopez De Murphy, M.D.M. Effects of Natural Weathering on Microstructure and Mineral Composition of Cementitious Roofing Tiles Reinforced with Fique Fibre. Cem. Concr. Compos. 2011, 33, 225–232. [Google Scholar] [CrossRef]
  34. Lothenbach, B.; Scrivener, K.; Hooton, R.D. Supplementary Cementitious Materials. Cem. Concr. Res. 2011, 41, 1244–1256. [Google Scholar] [CrossRef]
  35. Zhang, Y.M.; Sun, W.; Yan, H.D. Hydration of High-Volume Fly Ash Cement Pastes. Cem. Concr. Compos. 2000, 22, 445–452. [Google Scholar] [CrossRef]
  36. Medeiros, M.H.F.D.; Raisdorfer, J.W.; Hoppe Filho, J. Influence of silica fume and metakaolin on carbonation rate of concrete: Relationship with strength, absorption and w/c ratio. Ambient. Construído 2017, 17, 125–139. [Google Scholar] [CrossRef]
  37. Hoppe Filho, J.; Gobbi, A.; Pereira, E.; Tanaka, R.S.; De Medeiros, M.H.F. Atividade Pozolânica de Adições Minerais Para Cimento Portland (Parte Ii): Índice de Atividade Pozolânica Com Cimento Portland (IAP), Difração de Raios-x (DRX) e Termogravimetria (TG/DTG). Rev. Mater. 2017, 22, e11873. [Google Scholar] [CrossRef]
  38. Kirchheim, A.P.; Rheinheimer, V.; Dal Molin, D.C.C. Comparative Study of White and Ordinary Concretes with Respect of Carbonation and Water Absorption. Constr. Build. Mater. 2015, 84, 320–330. [Google Scholar] [CrossRef]
  39. Zhang, D.; Shao, Y. Effect of Early Carbonation Curing on Chloride Penetration and Weathering Carbonation in Concrete. Constr. Build. Mater. 2016, 123, 516–526. [Google Scholar] [CrossRef]
  40. Hoppe Filho, J.; Rodrigues, C.S.; Ribeiro, L.S.O.P.; Medeiros, M.H.F. Evaluation of Sample Drying Methods to Determine the Apparent Porosity and Estimation of Degree of Hydration of Portland Cement Pastes. J. Build. Pathol. Rehabil. 2021, 6, 1. [Google Scholar] [CrossRef]
  41. Scrivener, K.; Snellings, R.; Lothenbach, B. A Practical Guide to Microstructural Analysis of Cementitious Materials; Scrivener, K., Snellings, R., Lothenbach, B., Eds.; CRC Press: Boca Raton, FL, USA; Taylor & Francis Group: New York, NY, USA, 2016; ISBN 9781498738675. [Google Scholar]
  42. De Souza, D.J.; Antunes, L.R.; Sanchez, L.F.M. The Evaluation of Wood Ash as a Potential Preventive Measure against Alkali-Silica Reaction Induced Expansion and Deterioration. J. Clean. Prod. 2022, 358, 131984. [Google Scholar] [CrossRef]
  43. Pu, Q.; Jiang, L.; Xu, J.; Chu, H.; Xu, Y.; Zhang, Y. Evolution of PH and Chemical Composition of Pore Solution in Carbonated Concrete. Constr. Build. Mater. 2012, 28, 519–524. [Google Scholar] [CrossRef]
  44. Behnood, A.; Van Tittelboom, K.; De Belie, N. Methods for Measuring PH in Concrete: A Review. Constr. Build. Mater. 2016, 105, 176–188. [Google Scholar] [CrossRef]
  45. Mehta, P.K.; Monteiro, P.J.M. Concrete: Microstructure, Properties, and Materials, 3rd ed.; McGraw Hill: New York, NY, USA, 2013; ISBN 0-07-146289-9. [Google Scholar]
  46. Kulik, D.A.; Wagner, T.; Dmytrieva, S.V.; Kosakowski, G.; Hingerl, F.F.; Chudnenko, K.V.; Berner, U.R. GEM-Selektor Geochemical Modeling Package: Revised Algorithm and GEMS3K Numerical Kernel for Coupled Simulation Codes. Comput. Geosci. 2013, 17, 1–24. [Google Scholar] [CrossRef]
  47. Thoenen, T.; Hummel, W.; Berner, U.; Curti, E. The PSI/Nagra Chemical Thermodynamic Database 12/07, PSI Report 14-04; Paul Scherrer Institut: Villigen, Switzerland, 2014. [Google Scholar]
  48. Lothenbach, B.; Kulik, D.A.; Matschei, T.; Balonis, M.; Baquerizo, L.; Dilnesa, B.; Miron, G.D.; Myers, R.J. Cemdata18: A Chemical Thermodynamic Database for Hydrated Portland Cements and Alkali-Activated Materials. Cem. Concr. Res. 2019, 115, 472–506. [Google Scholar] [CrossRef]
  49. Kulik, D.A. Improving the Structural Consistency of C-S-H Solid Solution Thermodynamic Models. Cem. Concr. Res. 2011, 41, 477–495. [Google Scholar] [CrossRef]
  50. De Souza, D.J.; Sanchez, L.F.M.; Hoppe Filho, J.; Medeiros, M.H.F. Development of a Durability Indicator to Forecast the Efficiency of Preventive Measures against External Sulphate Attack. Cem. Concr. Compos. 2024, 145, 105349. [Google Scholar] [CrossRef]
  51. De Souza, D.J.; Medeiros, M.H.F.; Hoppe, J.; Sanchez, L.F.M. The Uses of Finely Ground Materials to Mitigate the External Sulphate Attack (ESA) on Cementitious Materials; Springer: Cham, Switzerland, 2020; Volume 21. [Google Scholar]
  52. De Souza, D.J. Capacity of Minerals Additions to Mitigate the Sodium and Magnesium Sulfate Attack in Portland Cement Mortars; Universidade Federal do Paraná: Curitiba, Brazil, 2016. [Google Scholar]
  53. Tuutti, K. Corrosion of Steel in Concrete; Swedish Cement and Concrete Research Institute: Stockholm, Sweden, 1982. [Google Scholar]
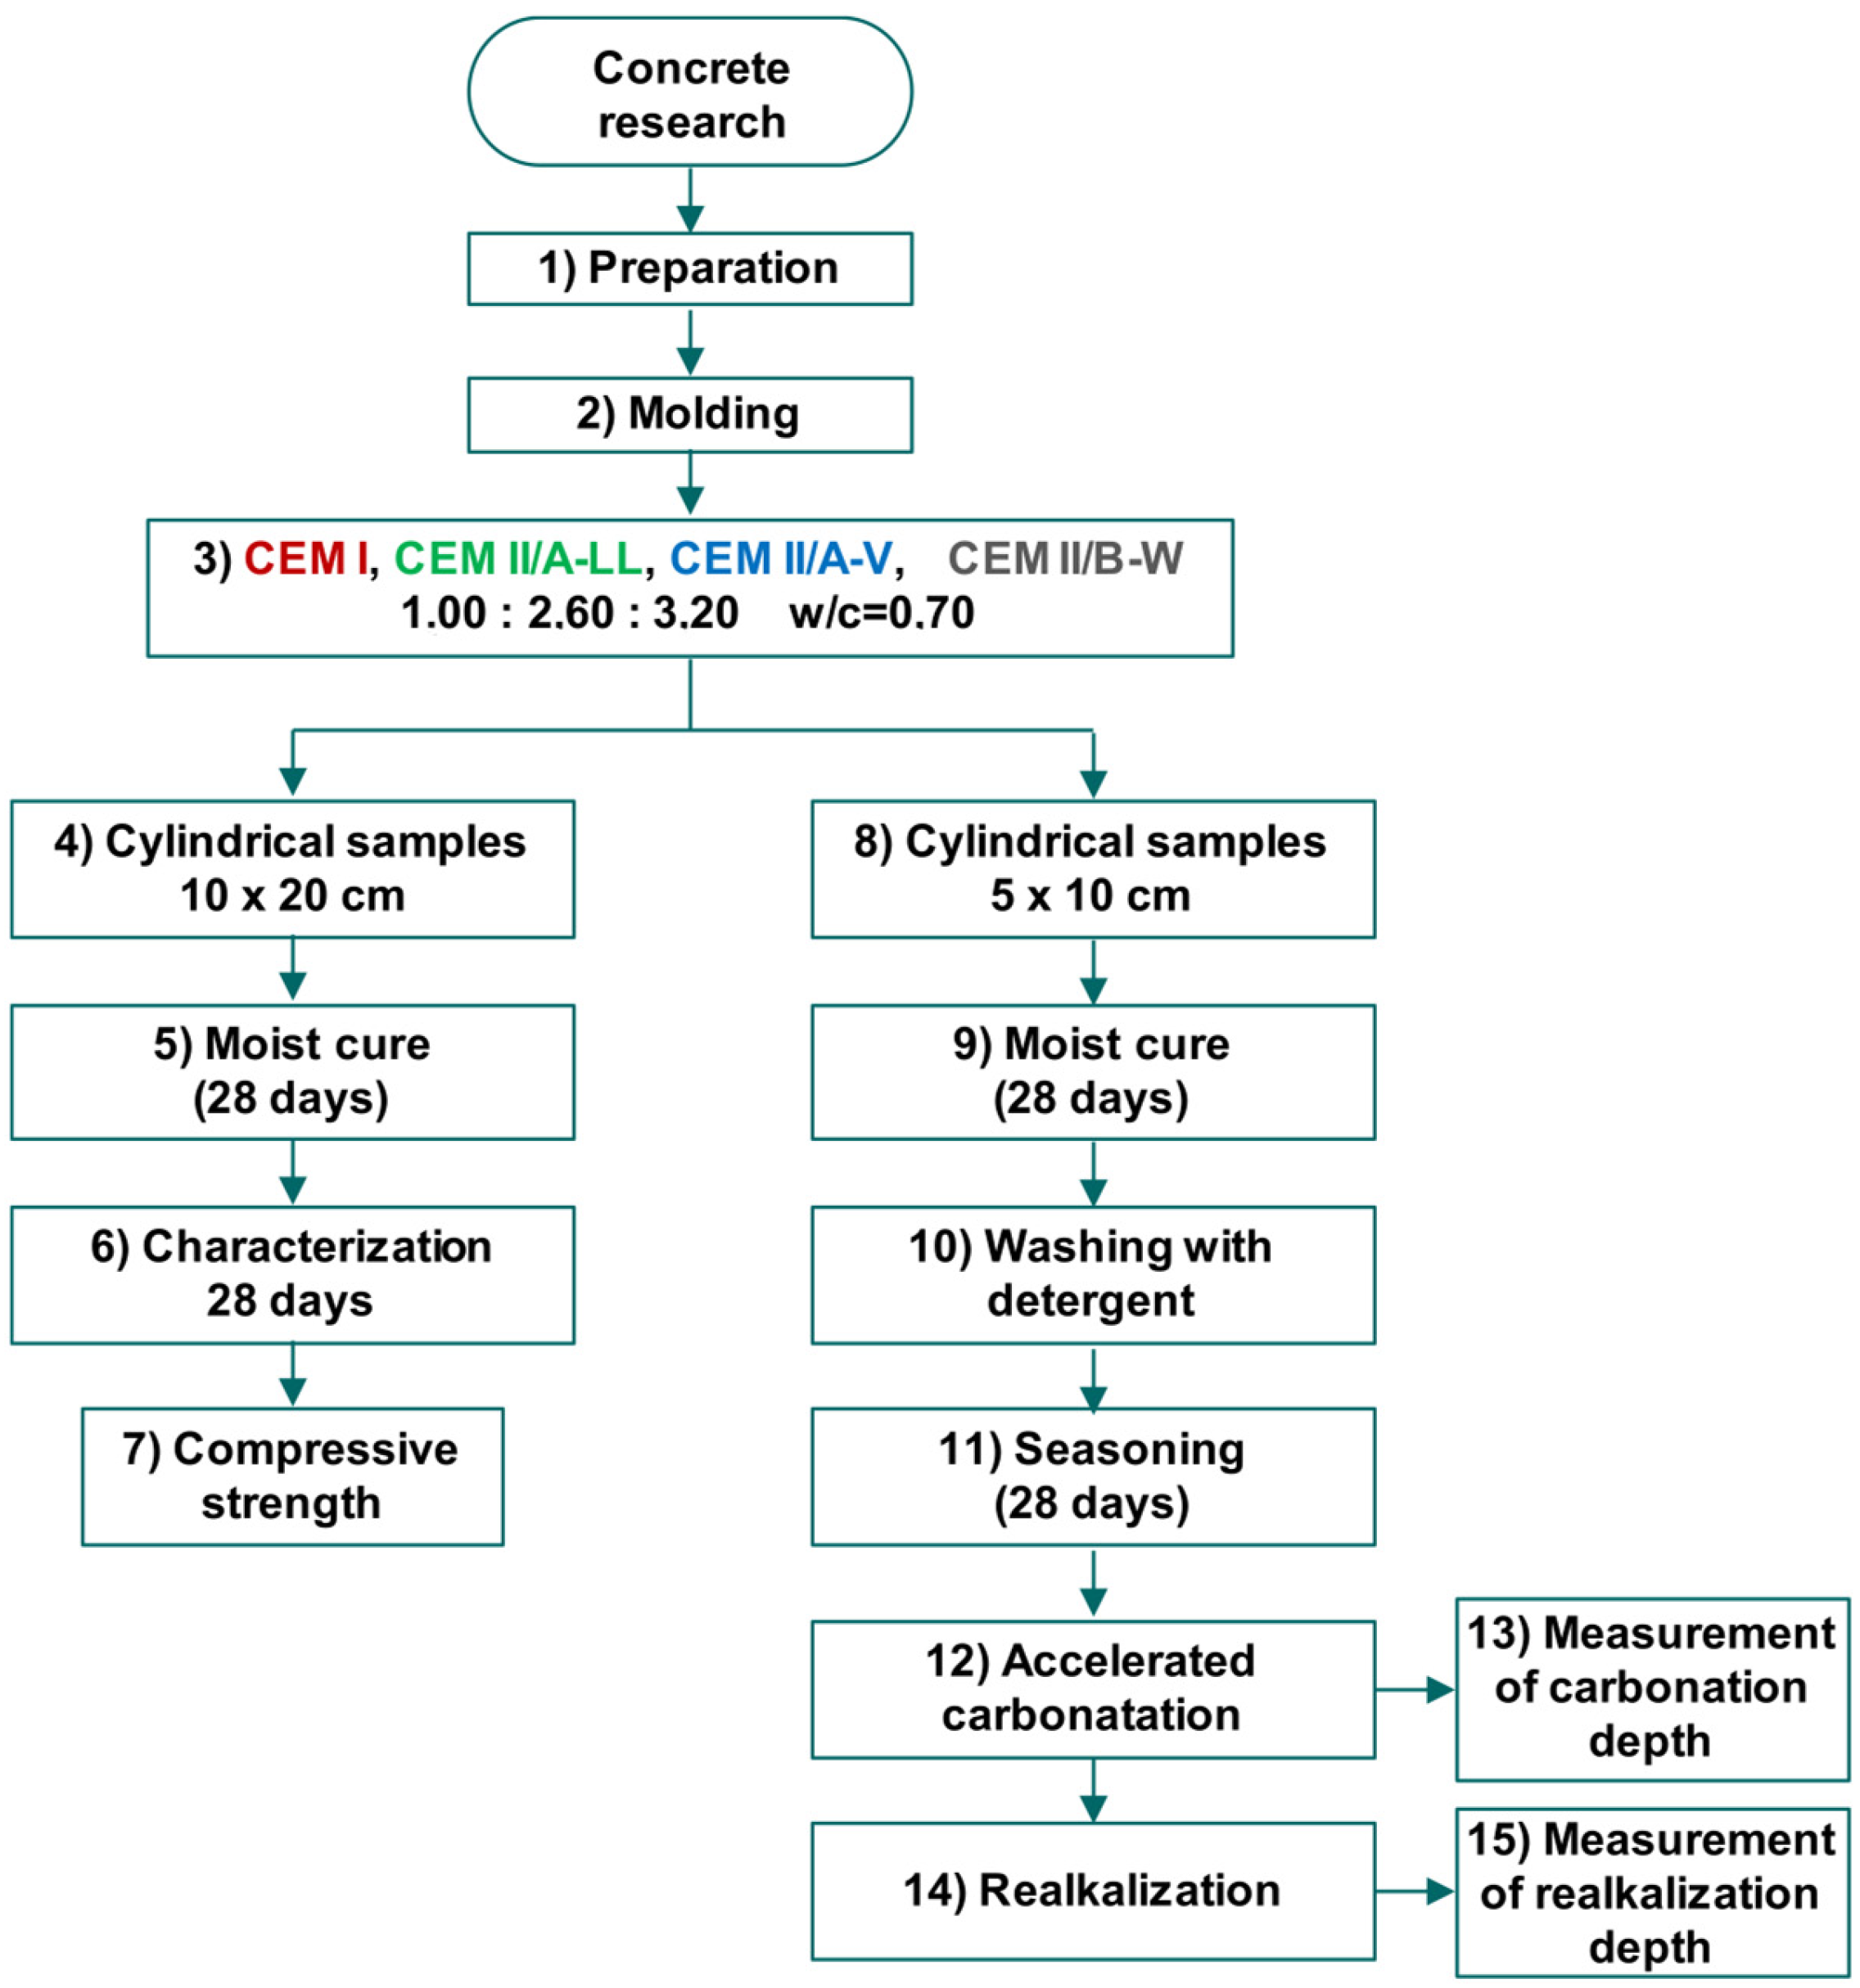
Figure 1. Diagram of concrete sample preparation and tests.
Buildings 15 01318 g001
Figure 2. Diagram of cement paste sample preparation and tests.
Buildings 15 01318 g002
Figure 3. Compressive strength of concrete samples after 28 days of curing.
Buildings 15 01318 g003
Figure 4. Carbonation depth over time in concrete specimens after the initial 28 days of moist curing.
Buildings 15 01318 g004
Figure 5. Coefficient of carbonation in concrete samples made of CEM I, CEM II/A-LL, CEM II/A-V, and CEM II/B-W.
Buildings 15 01318 g005
Figure 6. Realkalization depth over time in concrete specimens after the initial 28 days of moist curing.
Buildings 15 01318 g006
Figure 7. Coefficient of carbonation in concrete samples made from CEM I, CEM II/A-LL, CEM II/A-V, and CEM II/B-W.
Buildings 15 01318 g007
Figure 8. Apparent porosity of cement paste samples.
Buildings 15 01318 g008
Figure 9. Indirect measurement of the pH of cement paste suspensions.
Buildings 15 01318 g009
Figure 10. X-ray diffraction patterns of cement paste samples.
Buildings 15 01318 g010
Figure 11. Thermogravimetric analysis of cement paste samples.
Buildings 15 01318 g011
Figure 12. Thermodynamic modeling results: (a) total volume of materials for CEM I mixture before reaction, (b) phase assemblage of CEM I mixture, (c) total volume of materials for CEM II/A-LL mixture before reaction, (d) phase assemblage of CEM II/A-LL mixture, (e) total volume of materials for CEM II/A-V mixture before reaction, (f) phase assemblage of CEM II/A-V mixture, (g) total volume of materials for CEM II/B-W mixture before reaction, (h) phase assemblage of CEM II/B-W mixture.
Buildings 15 01318 g012aBuildings 15 01318 g012b
Figure 13. Predicted phase transformation and pH changes over the progressive increase in CO2 for hydrated (a) CEM I, (b) CEM II/A-LL, (c) CEM II/A-V, and (d) CEM II/B-W mixtures.
Buildings 15 01318 g013
Figure 14. Thermodynamic simulation of the regeneration of portlandite after realkalization with potassium hydroxide (KOH). The pink-dashed line indicates the concentration of 2.67 M KOH used in this study as a realkalization method for carbonated concrete and paste specimens.
Buildings 15 01318 g014
Table 1. Chemical properties of the cements.
CEM ICEM II/A-LLCEM II/A-VCEM II/B-W
Al2O34.344.196.449.51
SiO218.5618.7523.3129.06
Fe2O32.862.743.164.16
CaO61.5661.9653.6245.18
MgO3.673.943.122.67
SO33.032.562.732.17
Loss on ignition3.655.867.914.03
Free CaO 1.400.900.760.87
Insoluble residue0.771.0411.1324.52
Alkali equivalent0.670.680.871.17
% of limestone filler≈5≈11--
% of Fly Ash--≈11≈24
Table 2. Physical and mechanical properties of the cements.
PropertyCEM ICEM II/A-LLCEM II/A-VCEM II/B-W
Hot expansion (mm)0.001.000.500.00
Initial set time (h)3:103:504:204:30
Final set time (h)4:004:305:155:15
Water for normal consistency (%)29.226.427.429.8
Blaine Specific Surface Area (cm2/g)4410317036204190
% Sieve Retention #200 (%)0.101.702.600.40
% Sieve Retention #350 (%)0.509.7010.402.60
Compressive strength 1 day (MPa)25.217.113.613.6
Compressive strength 3 days (MPa)41.630.126.524.9
Compressive strength 7 days (MPa)47.136.931.431.6
Compressive strength 28 days (MPa)48.843.236.546.0
Table 3. Thermogravimetric data of cement paste samples for the three distinct temperature regions as marked in the plots of Figure 11. Ref—reference sample, Carb—Carbonated samples, and Realk—Samples after realkalization.
MixtureChemically Bound Water (wt.%)Portlandite (wt.%)Carbonates, Calcite + Vaterite (wt.%)
RefCarbRealkRefCarbRealkRefCarbRealk
CEM I15.18.97.92101.215.560.561.3
CEM II/A-LL12.786.918.501.217.961.1260.6
CEM II/A-V12.47.66.79.301.928.457.864.8
CEM II/B-W11.97.36.38.601.322.348.447.1
Disclaimer/Publisher’s Note: The statements, opinions and data contained in all publications are solely those of the individual author(s) and contributor(s) and not of MDPI and/or the editor(s). MDPI and/or the editor(s) disclaim responsibility for any injury to people or property resulting from any ideas, methods, instructions or products referred to in the content.