Article

Effect of Local Strengthening on the Overall Seismic Performance of Reinforced Concrete Frame Structures

1
School of Civil Engineering, Zhengzhou University, Zhengzhou 450001, China
2
Zhengzhou Ruijie Structure Reinforcing Engineering Co., Ltd., Zhengzhou 450053, China
3
Xu Hui Design Co., Ltd., Zhengzhou 450046, China
*
Author to whom correspondence should be addressed.
Buildings 2025, 15(8), 1326; https://doi.org/10.3390/buildings15081326
Submission received: 24 March 2025 / Revised: 9 April 2025 / Accepted: 15 April 2025 / Published: 17 April 2025
(This article belongs to the Section Building Structures)

Abstract

:
The seismic performance of industrial and civil buildings is severely challenged by natural or man-made actions over a long period of time in service. Local strengthening is often carried out to avoid extensive strength reduction. However, current research primarily focuses on enhancing the mechanical performance of individual strengthened members, with little attention to the impact of local strengthening on the overall structure. In this study, the effect of layout symmetry on the overall seismic performance of a six-story reinforced concrete (RC) frame when locally strengthened by the strengthening bonding method is investigated by means of finite element analysis. Four strengthening schemes are considered: single-corner asymmetric, single-end asymmetric, quadrilateral symmetric, and central symmetric strengthening. The modal analysis confirms the enhanced stiffness in the strengthened structure. Asymmetric schemes yield uneven stiffness distributions, leading to pronounced vertical vibrations in higher modes. Conversely, symmetrical strengthening minimizes stiffness disparities through an optimized layout, yielding superior stiffness enhancements. The pushover analysis reveals a 53.6% increase in the lateral load-bearing capacity relative to the original configuration. Increasing the strengthening layers in symmetrical schemes further improves the lateral stiffness and performance reserve. However, when the number of strengthening layers exceeds four, the benefits become limited, and asymmetric strengthening significantly increases the inter-story drift ratio compared to its symmetric counterpart. Additionally, asymmetric strengthening leads to substantial lateral displacement discrepancies, thereby diminishing the overall structural coordination. Therefore, practical applications should adopt a holistic approach by favoring symmetrical strengthening and selecting an optimal number of strengthening layers to maximize the benefits.

1. Introduction

Currently, many buildings have been in service for extended periods or have suffered varying degrees of aging and damage due to natural disasters and human-induced effects. The strengthening and renovation of damaged buildings can restore their structural performance with lower investment [1,2]. As one of the primary structural systems, the overall strengthening of reinforced concrete frames has been extensively studied and applied in practical projects [3,4]. However, overall strengthening requires the prolonged suspension of normal structural use and significantly restricts the available space [5], leading to the common practice of local strengthening in practical projects. However, research on the impact of local strengthening on the overall seismic performance of structures remains scarce.
Numerous methods exist for the strengthening of RC structures, including the section enlargement method [6,7,8], fiber composite material strengthening method [9,10,11,12,13,14,15], and steel bonding strengthening method [16,17,18]. Among these, the section enlargement method improves a structure’s load-bearing capacity and stability by enlarging its cross-sectional area [6,7,8]. Although the section enlargement method is simple in construction and can significantly improve the mechanical performance of components, it substantially occupies usable space and increases the dead weight, which is detrimental to the seismic resistance of structures. Fiber-reinforced polymer (FRP) and fabric-reinforced cementitious matrix (FRCM) strengthening methods augment the load-carrying capacity and stability by bonding high-performance fiber materials to structural members and curing them in place [9,10,11,12,13]. Although both FRP and FRCM exhibit advantages, such as simple construction, a light weight, and high strength, their high costs and susceptibility to interfacial delamination remain critical limitations. Compared with the increasing section method, the steel bonding strengthening method can significantly enhance a member’s load-bearing capacity with a minimal increase in the cross-sectional dimensions. In comparison to the FRP/FRCM strengthening methods, the steel bonding strengthening method can prevent interface stripping via mechanical anchorage [16]. Recently, Ciampa et al. [17] proposed a more accurate model for the interfacial bond strength between steel plates and concrete, Zhang et al. [18] improved the low-temperature resistance and fast curing ability of conventional adhesives, and Tang et al. [19] proposed a new strategy to enhance the corrosion resistance of the adhesive–steel plate interface. These works provide guidance for the prevention of the interfacial spalling of adhered steel plates and the more accurate evaluation of mechanical properties. Therefore, the pasted steel plate strengthening technique has significant potential in the field of structural strengthening.
RC frame structures are widely utilized in both industrial and civil buildings. In seismic-prone regions, earthquake actions pose significant challenges to the structural safety of RC frames [20]. Ren et al. [21] and Baran et al. [22] conducted strengthening studies on earthquake-damaged frames using FRCM and proposed effective strategies to enhance the seismic performance of RC frames. However, these analyses have been limited to individual frames, lacking evaluations of multi-story and multi-span frame structures, primarily due to testing cost constraints. Recently, Sadeq et al. [23] employed finite element techniques to analyze the seismic performance of a strengthened eighteen-story, multi-span RC frame. Nevertheless, the influence of the strengthening layout symmetry on the seismic performance of retrofitted RC frames has been overlooked. Notably, Zhang et al. [24] investigated the local strengthening of a stairwell in a six-story RC frame and observed that stresses on certain frame columns increased substantially post-strengthening, thereby compromising the structural safety. This phenomenon is attributed to localized stiffness increases caused by asymmetric partial strengthening, subsequently altering the global stress distribution of the structure. Consequently, there is an urgent need to investigate how the symmetry of partial strengthening layouts affects the overall seismic performance of RC frames.
Based on the aforementioned discussion, this study aimed to investigate the influence of layout symmetry in local strengthening on the seismic performance of RC frames. Using a six-story RC frame as an engineering case, we employed the steel bonding strengthening method to design four distinct partial strengthening schemes. The effects of different partial strengthening configurations and the number of strengthened stories on the seismic behavior of the RC frame were systematically examined. Through finite element modeling in the SAP2000 software (v15.1), a modal analysis and pushover analysis were conducted to evaluate key parameters before and after strengthening, including the vibration modes, periods, base shear vs. vertex displacement relationships, seismic performance points, floor displacements, and inter-story drift ratios. Finally, practical recommendations for strengthening design in engineering applications are proposed.

2. Engineering Background

2.1. Structural Parameters of the Project

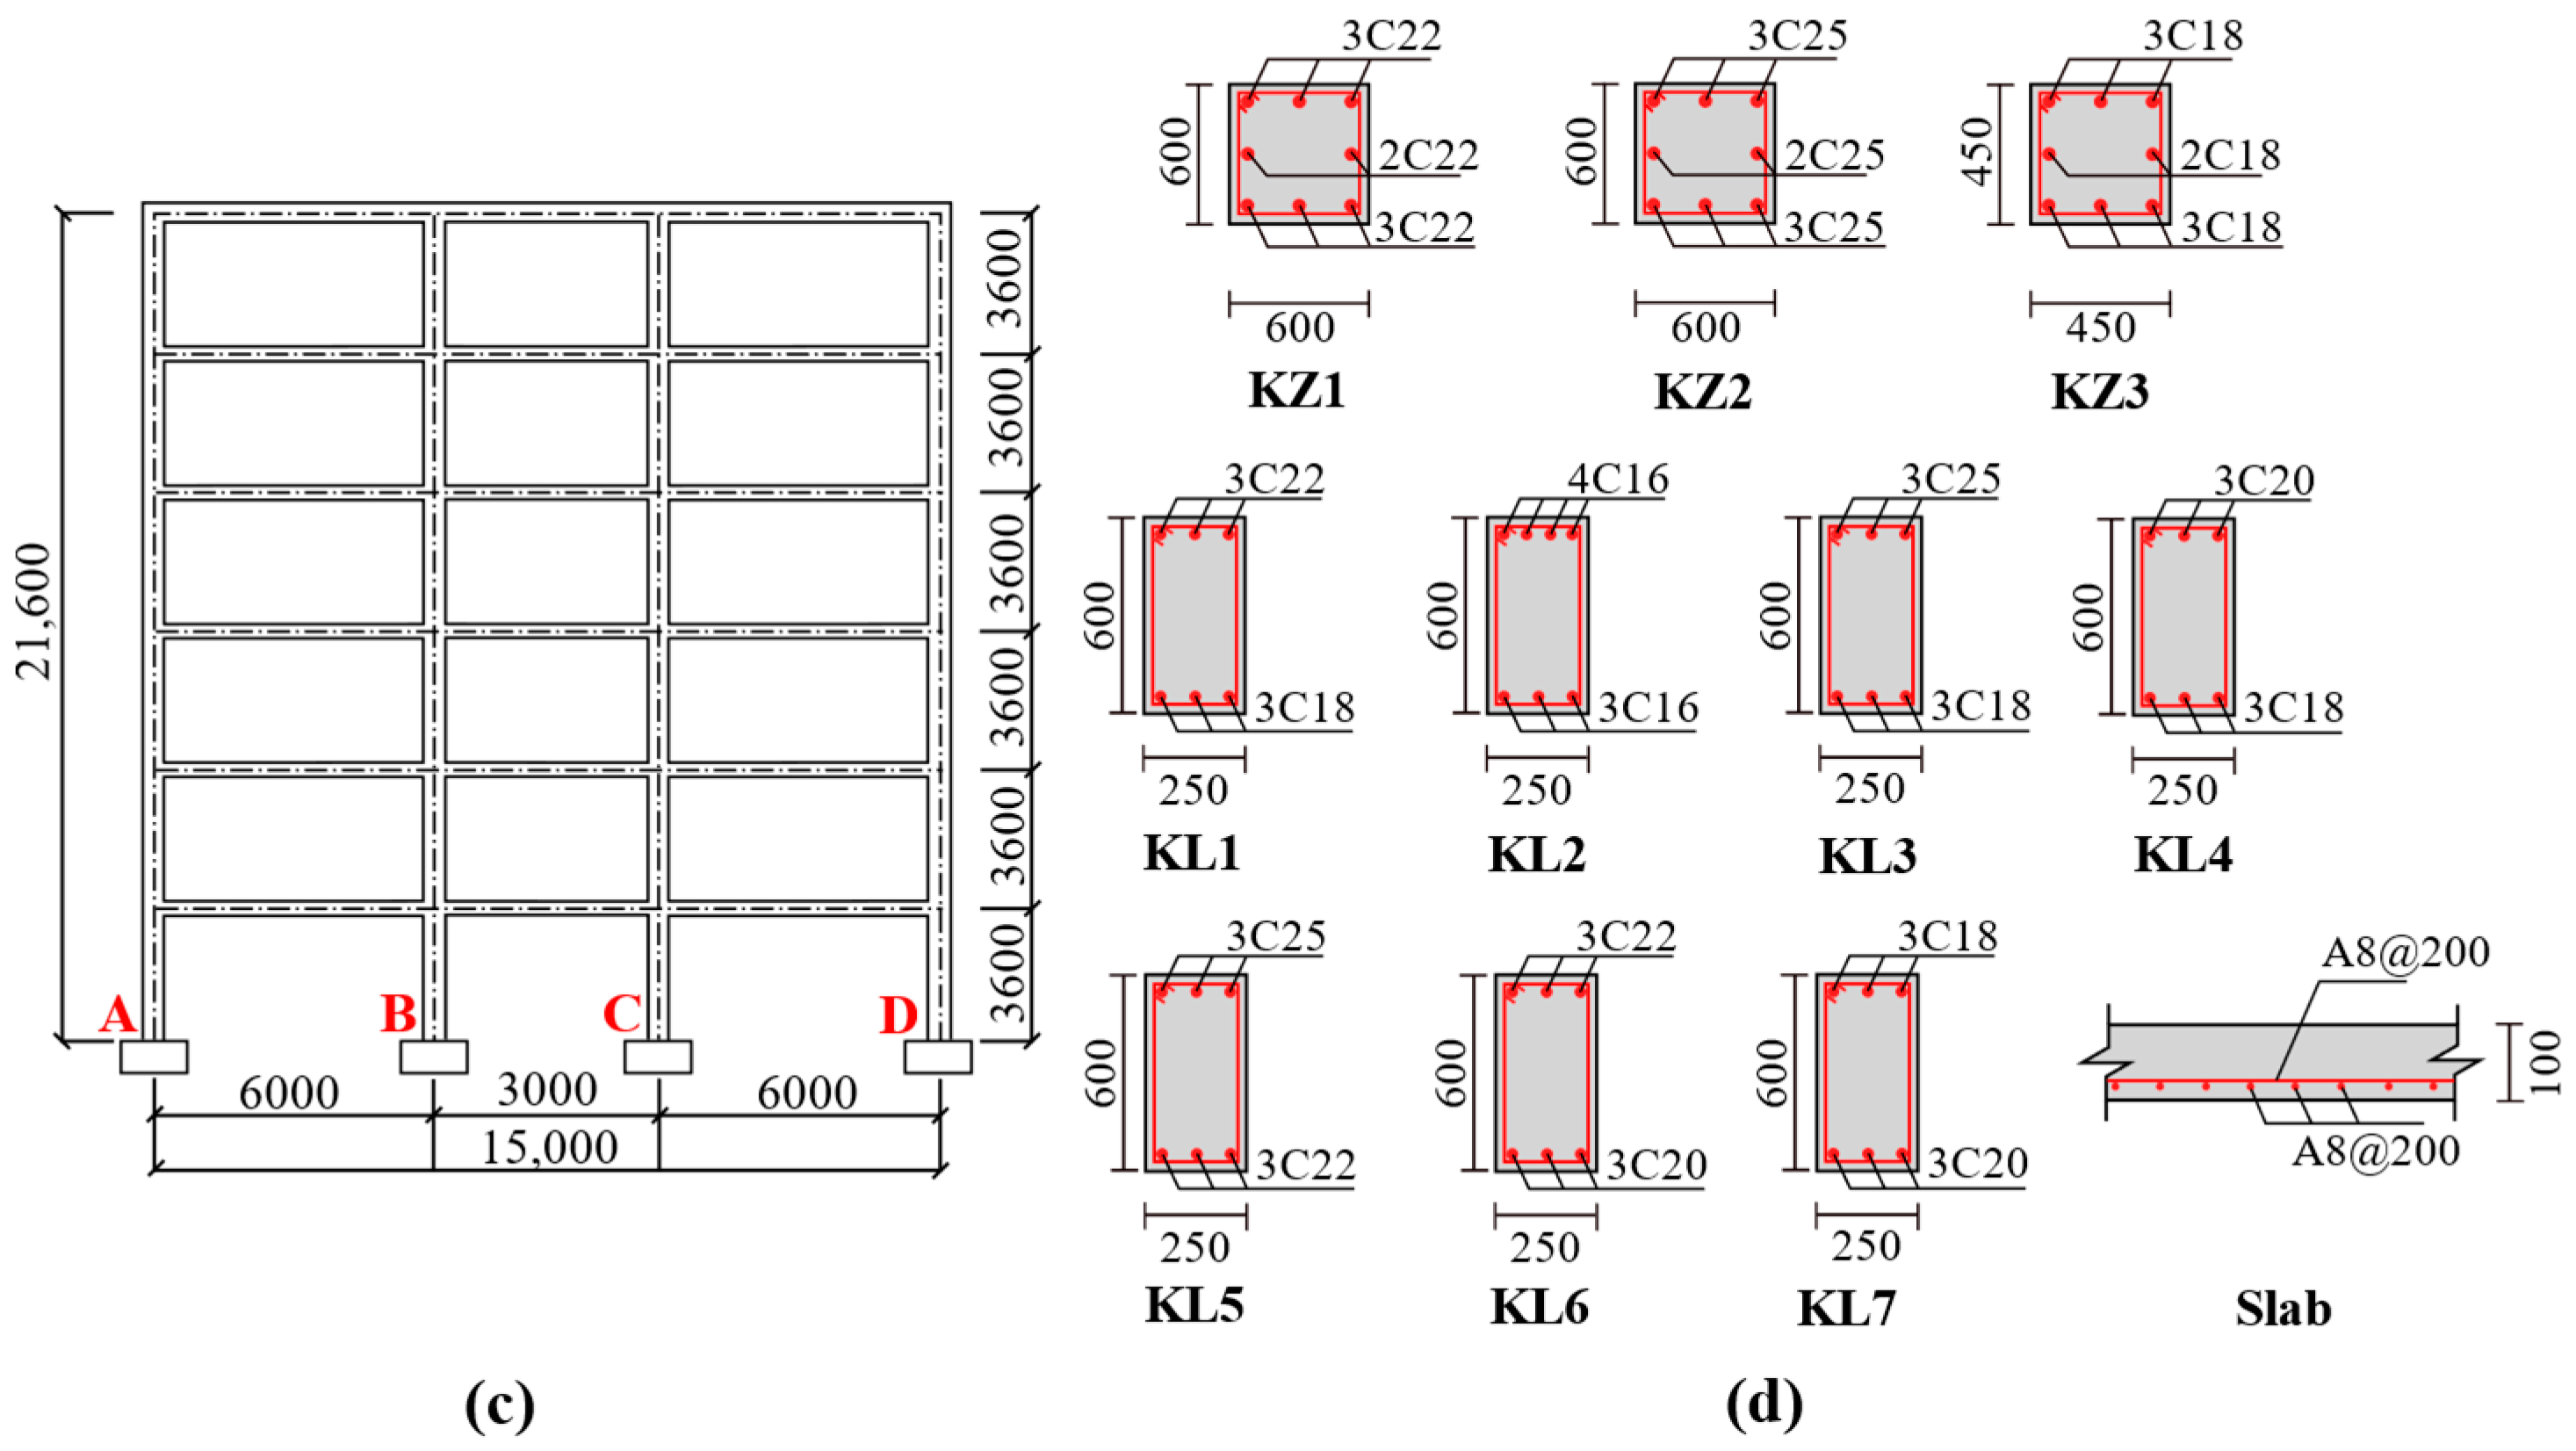
To evaluate the effects of different local strengthening schemes on the mechanical behavior of reinforced concrete (RC) frames, an actual engineering case was selected for structural analysis. The structural layout, including plan and elevation views, is presented in Figure 1a–c. The six-story frame structure comprised three spans with total dimensions of 21.6 m (height) × 15 m (width) × 48 m (length), featuring uniform story heights of 3.6 m. The dimensional details and reinforcement configurations of the beams, columns, and slabs are illustrated in Figure 1d. The beam cross-sections measured 250 mm × 600 mm. The column dimensions were 600 mm × 600 mm for perimeter frames and 450 mm × 450 mm for interior columns, with the slab thickness standardized at 100 mm. All structural components were constructed using concrete with compressive strength of 36.1 MPa. Longitudinal reinforcement in the beams and columns utilized hot-rolled ribbed steel bars with yield and tensile strengths of 443 MPa and 610.9 MPa, respectively. The stirrups in the beams/columns and slab reinforcement employed hot-rolled plain bars demonstrating yield and tensile strengths of 438.7 MPa and 628.3 MPa, respectively. The stirrup spacing was specified as 100 mm in the encrypted section and 200 mm in the non-encrypted section for both beams and columns. Both the main and distribution reinforcements in slabs were arranged at 200 mm spacing.

2.2. Strengthening and Retrofitting Scheme

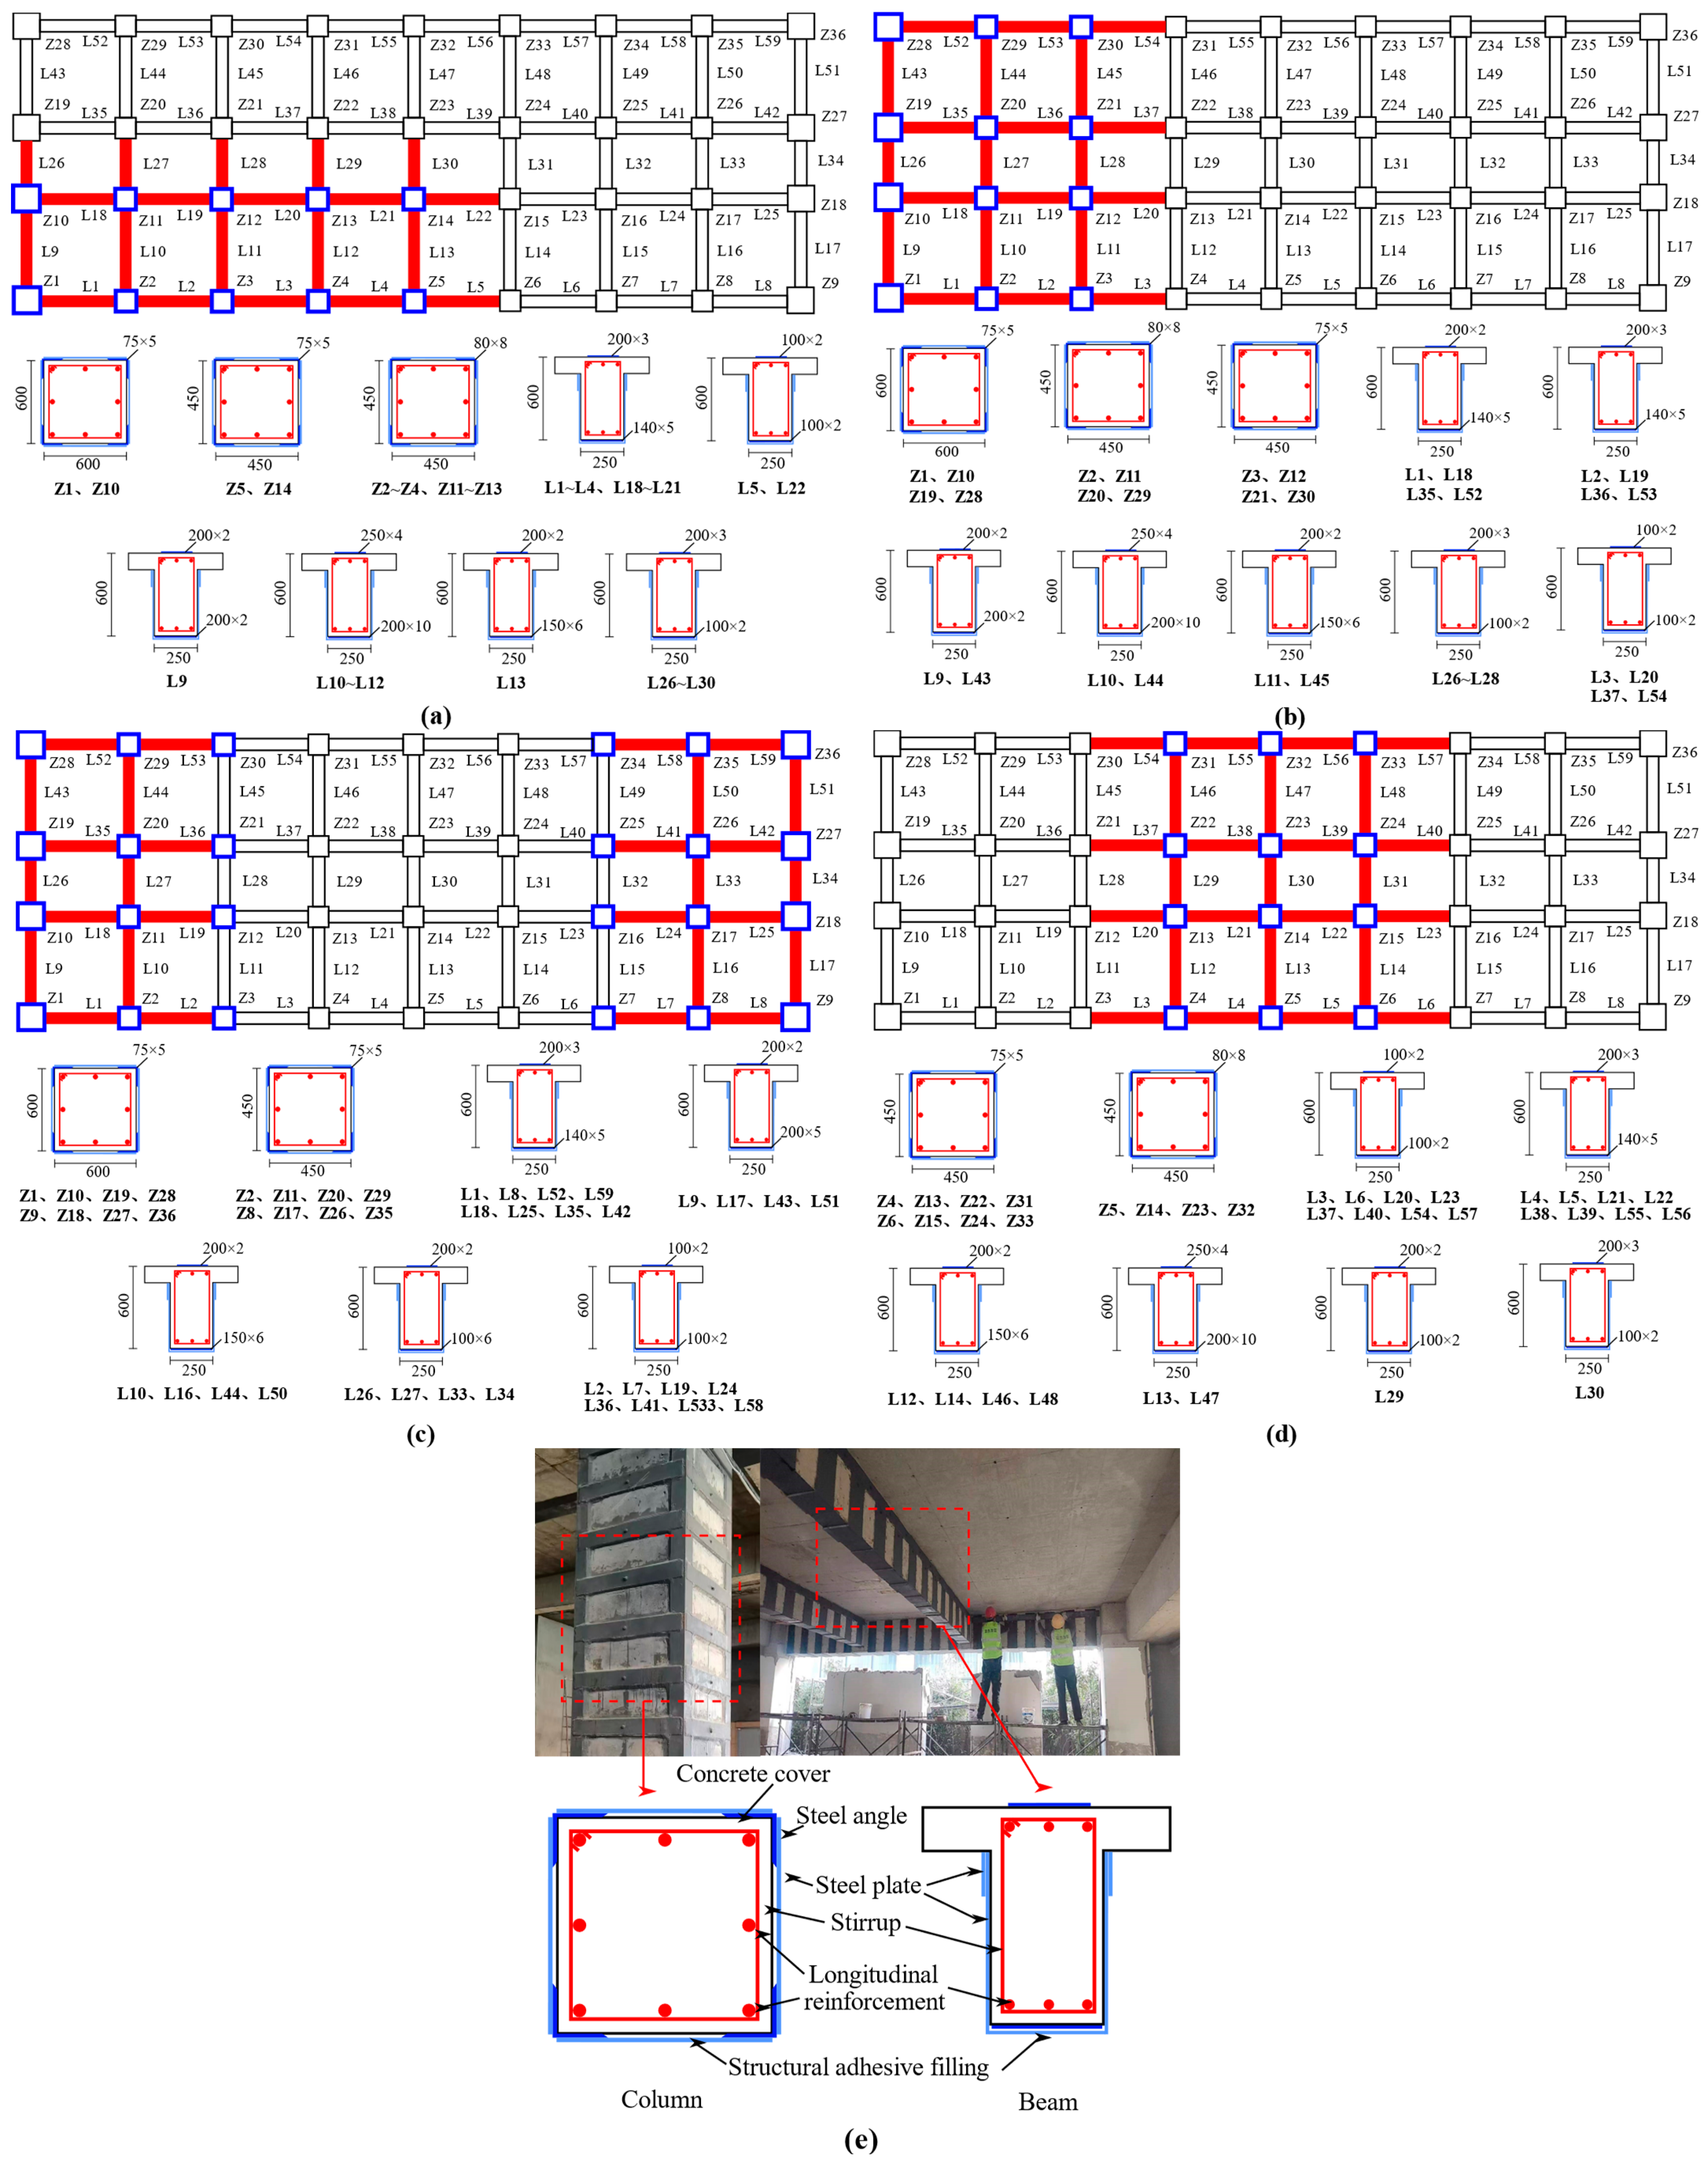
According to specification [25], this study designed four strengthening schemes with varying strengthening positions as variables, as shown in Table 1, and designated them as Schemes 1 to 4. Each strengthening scheme included five situations: strengthening only the first layer, strengthening from the first to the second layer, and progressively strengthening up to the fifth layer. Variations in local strengthening positions result in different strengthening amounts for each frame beam and column. To ensure clarity and avoid conflicts with the numbering system, “KL” is replaced with “L” and “KZ” with “Z”, with the beams and columns sequentially numbered. Additionally, the original structure and the locally strengthened models under the four strengthening schemes are designated as M0, M1, M2, M3, and M4. Due to space constraints, Figure 2a–d present only the strengthening of frame beams and columns when the first layer of the original structure was partially strengthened under the four schemes. The strengthening design of the remaining layers followed that of the first layer. The length of the hoop plate used for column strengthening matched the column height, while its width and thickness corresponded to those of the strengthening angle steel. The thickness of the U-shaped hoop plates used for beam strengthening equaled that of the steel plates strengthening the beam bottom. Their length was 250 mm, with spacing of 250 mm along the beam length. The thickness of the layering strips matched that of the U-shaped hoop plates, with a width of 150 mm. The cross-sectional structure of the strengthened beam and column is illustrated in Figure 2e.

2.3. Mechanical Properties of Strengthened Materials

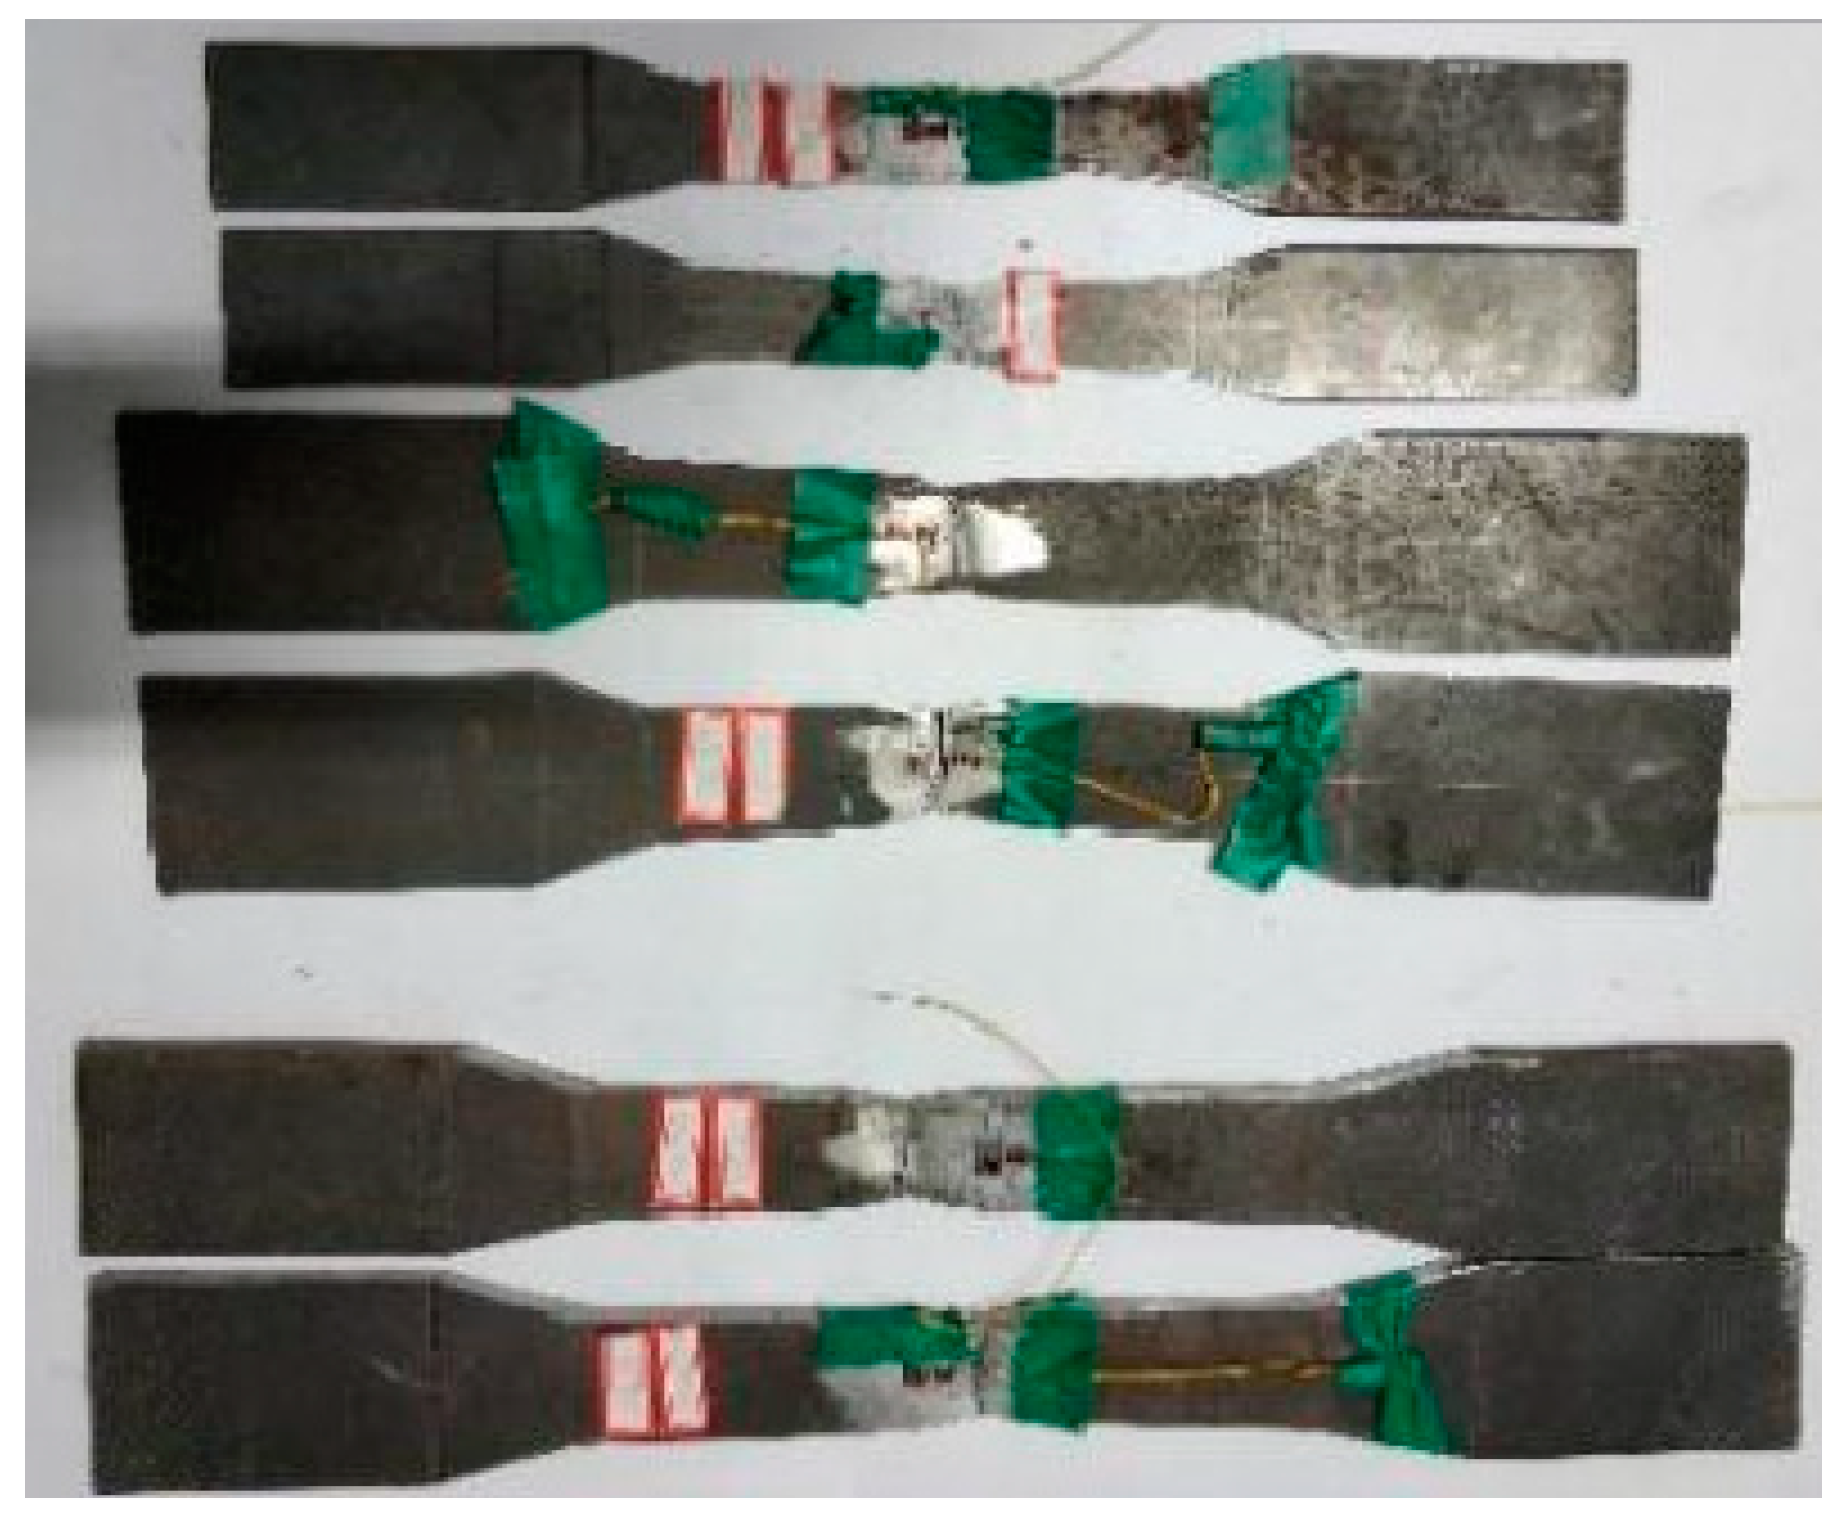
Given that the mechanical properties of the steel and concrete of the original structure could not be tested directly, their data were provided by the Ruijie Structural Strengthening Engineering Co., Ltd., Zhengzhou, China (see Section 2.1). The mechanical properties of the steel plates used for structural strengthening were obtained from laboratory tests. The steel plates used for the strengthening of the RC frame were Q345. Three samples of each thickness of the steel plates used in strengthening were prepared for uniaxial tensile testing [26]. The adhesive used for strengthening was an injected glue produced by the Otelli New Technology Group Co., Ltd., Beijing, China. Its material performance parameters, provided by the manufacturer, complied with specification [27]. The steel sample is illustrated in Figure 3, and the experimental material property data are presented in Table 2.

3. Finite Element Modeling Procedure

3.1. Description of the RC Frame Model

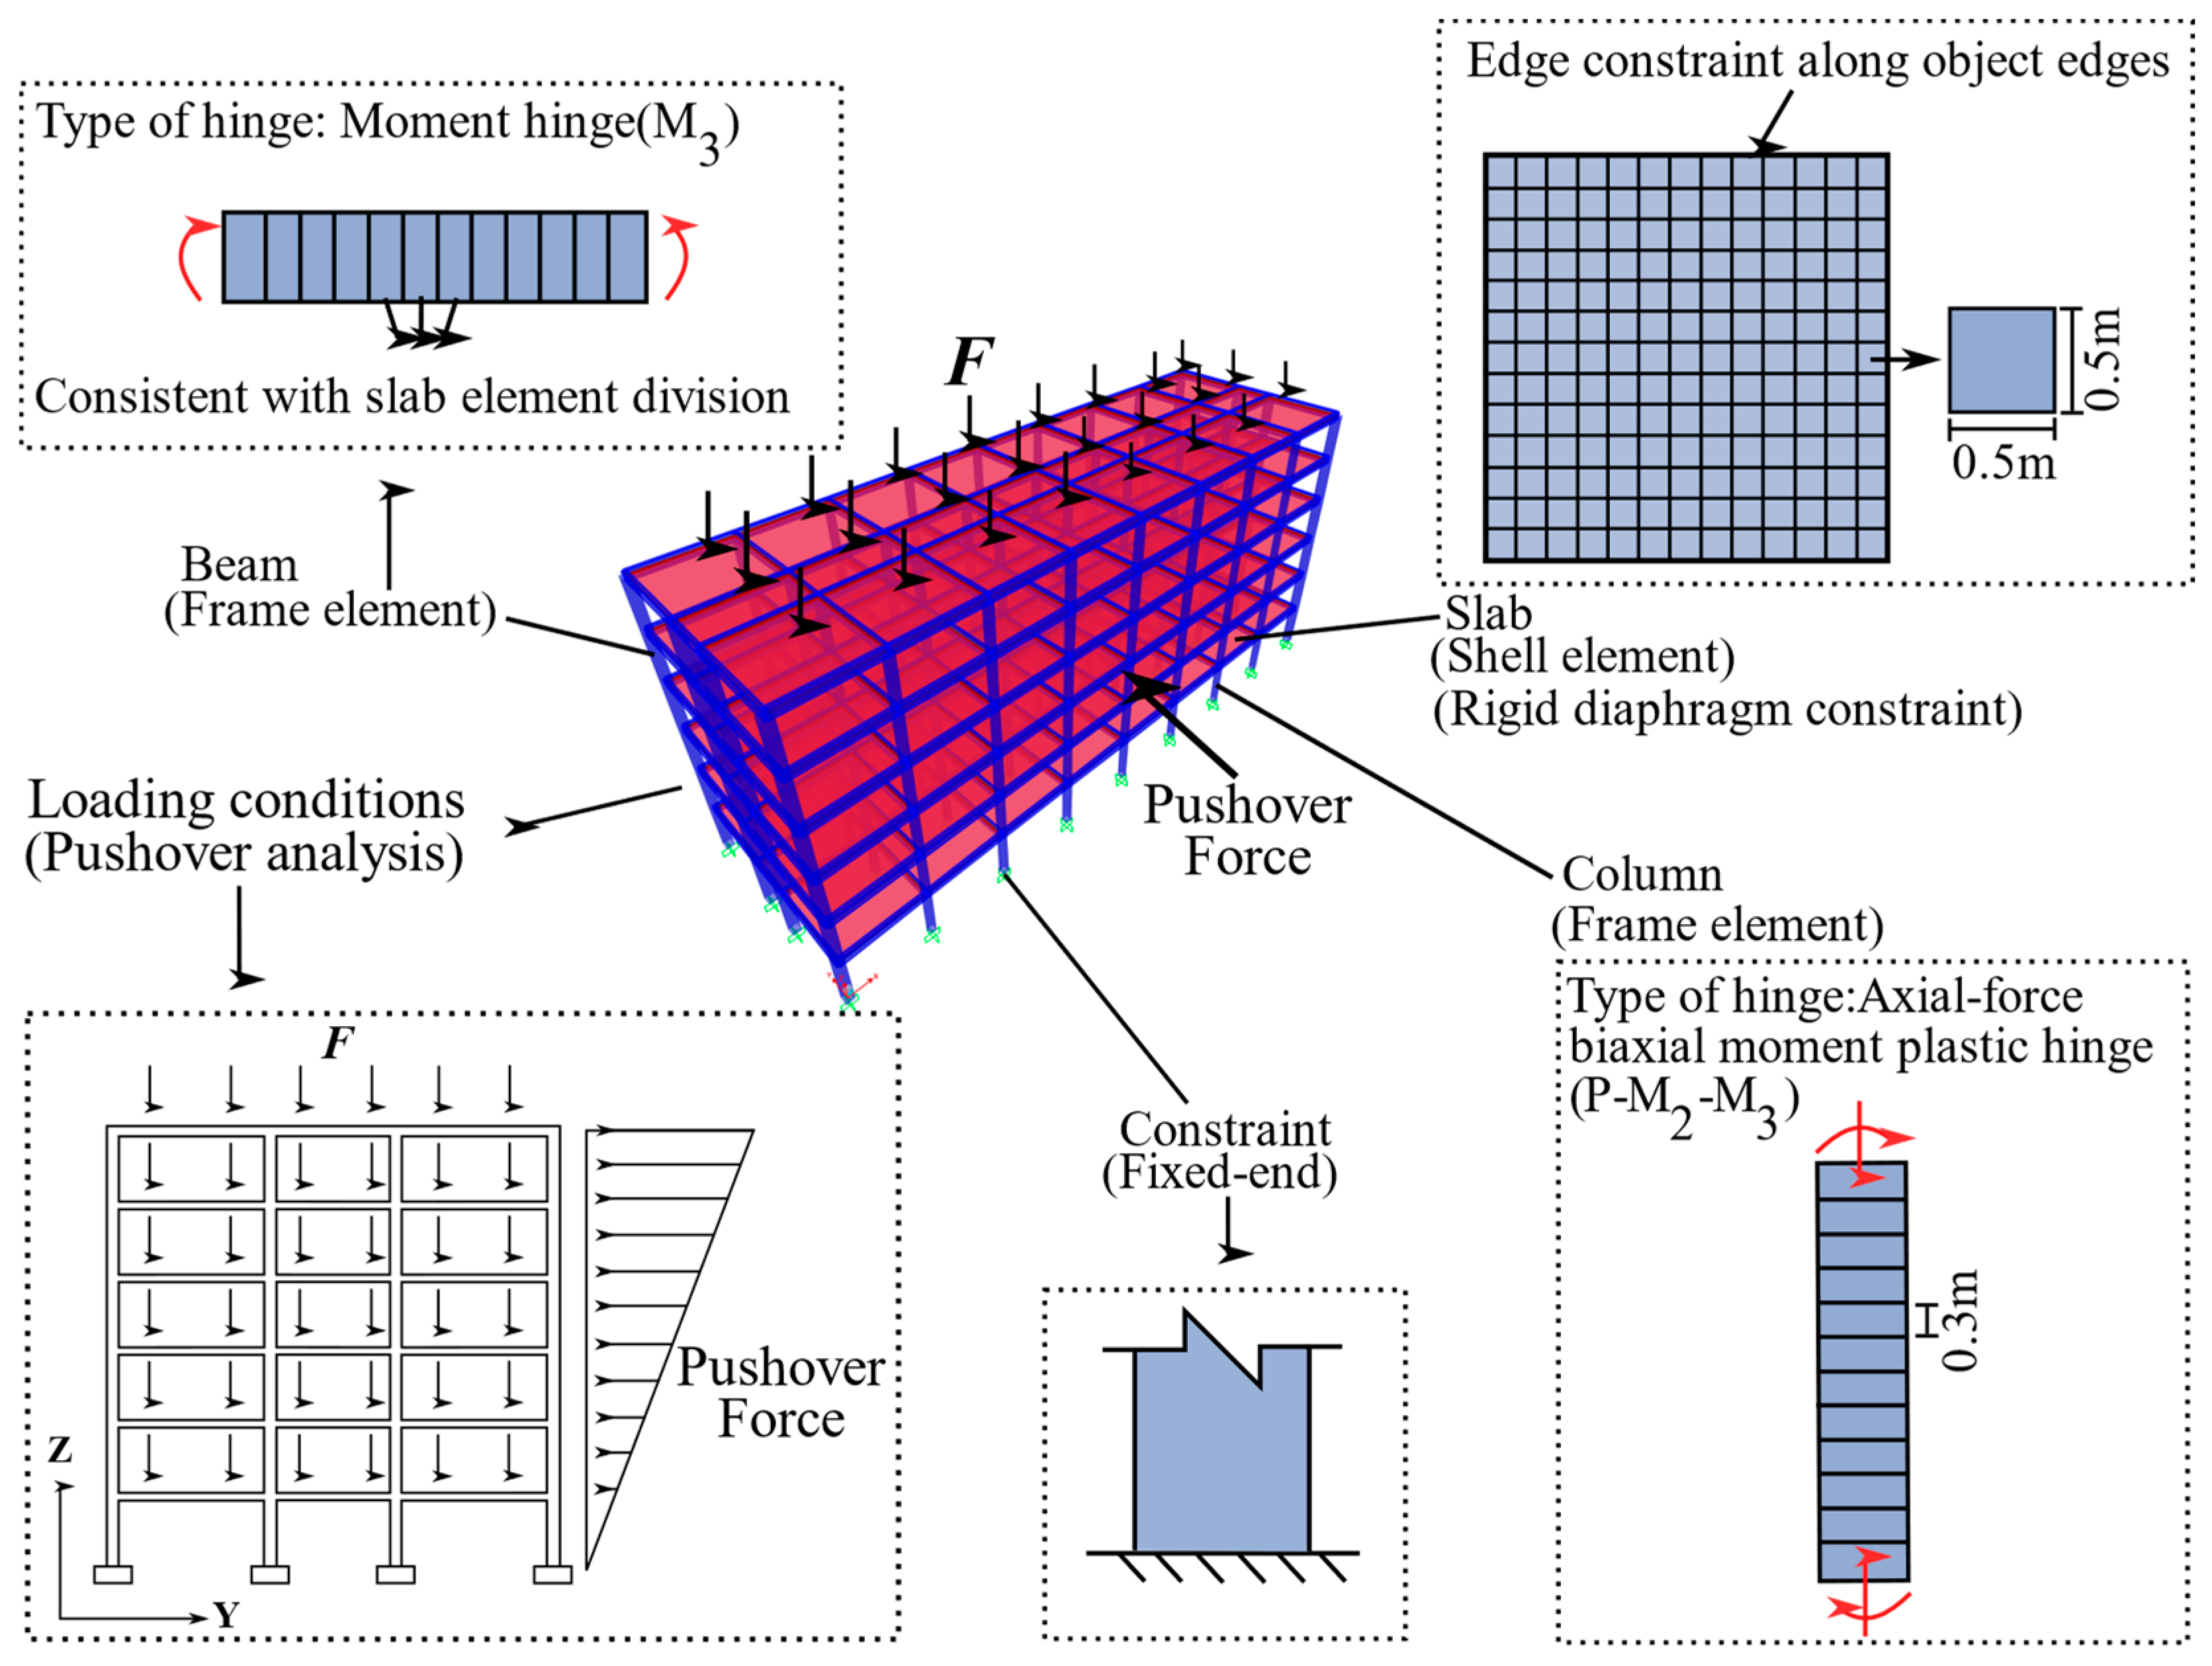
Figure 4 illustrates the finite element model of the six-story RC frame after local strengthening. The model was built using the SAP2000 software [28,29,30] with the dimensions described in Section 2.1. In the model, the element types for beams and columns were set as frame elements, while the slabs were modeled as thin shell elements, with the reinforcement for the beams and columns configured according to Section 2.1. This study analyzed only the above-ground main structure, assuming that the base of the first-story columns was embedded in the top surface of the foundation, which was achieved by setting the boundary conditions of the column bases as fixed-end constraints in the model. At the same time, the in-plane deformations of the slabs were neglected, assuming that the structure had infinite in-plane stiffness. This was achieved by assigning node constraints (rigid diaphragm constraints) to the nodes. To ensure the coordinated deformation of the slabs, the “generate edge constraints along object edges” option was assigned to the slab elements, ensuring continuous displacement between them. To account for the effect of cross-sectional overlap at the beam–column joints on the structural stiffness, an automatic end offset was applied at the beam–column joints in the model, allowing the software to automatically calculate the offset length at the frame ends. In the model, the slab elements were divided into sizes of 0.5 m × 0.5 m using the automatic mesh generation function. Since the beams were directly connected to the slabs, they were defined to be divided at the nodes of the slab elements, while the column elements were automatically divided into segments of 0.3 m based on the maximum segment length [31]. It should be noted that, during the pushover analysis, the two ends of the frame beams were specified as moment hinges (M3 hinges), and the two ends of the original frame columns were specified as axial force–biaxial moment plastic hinges (PMM hinges).

3.2. Material Model

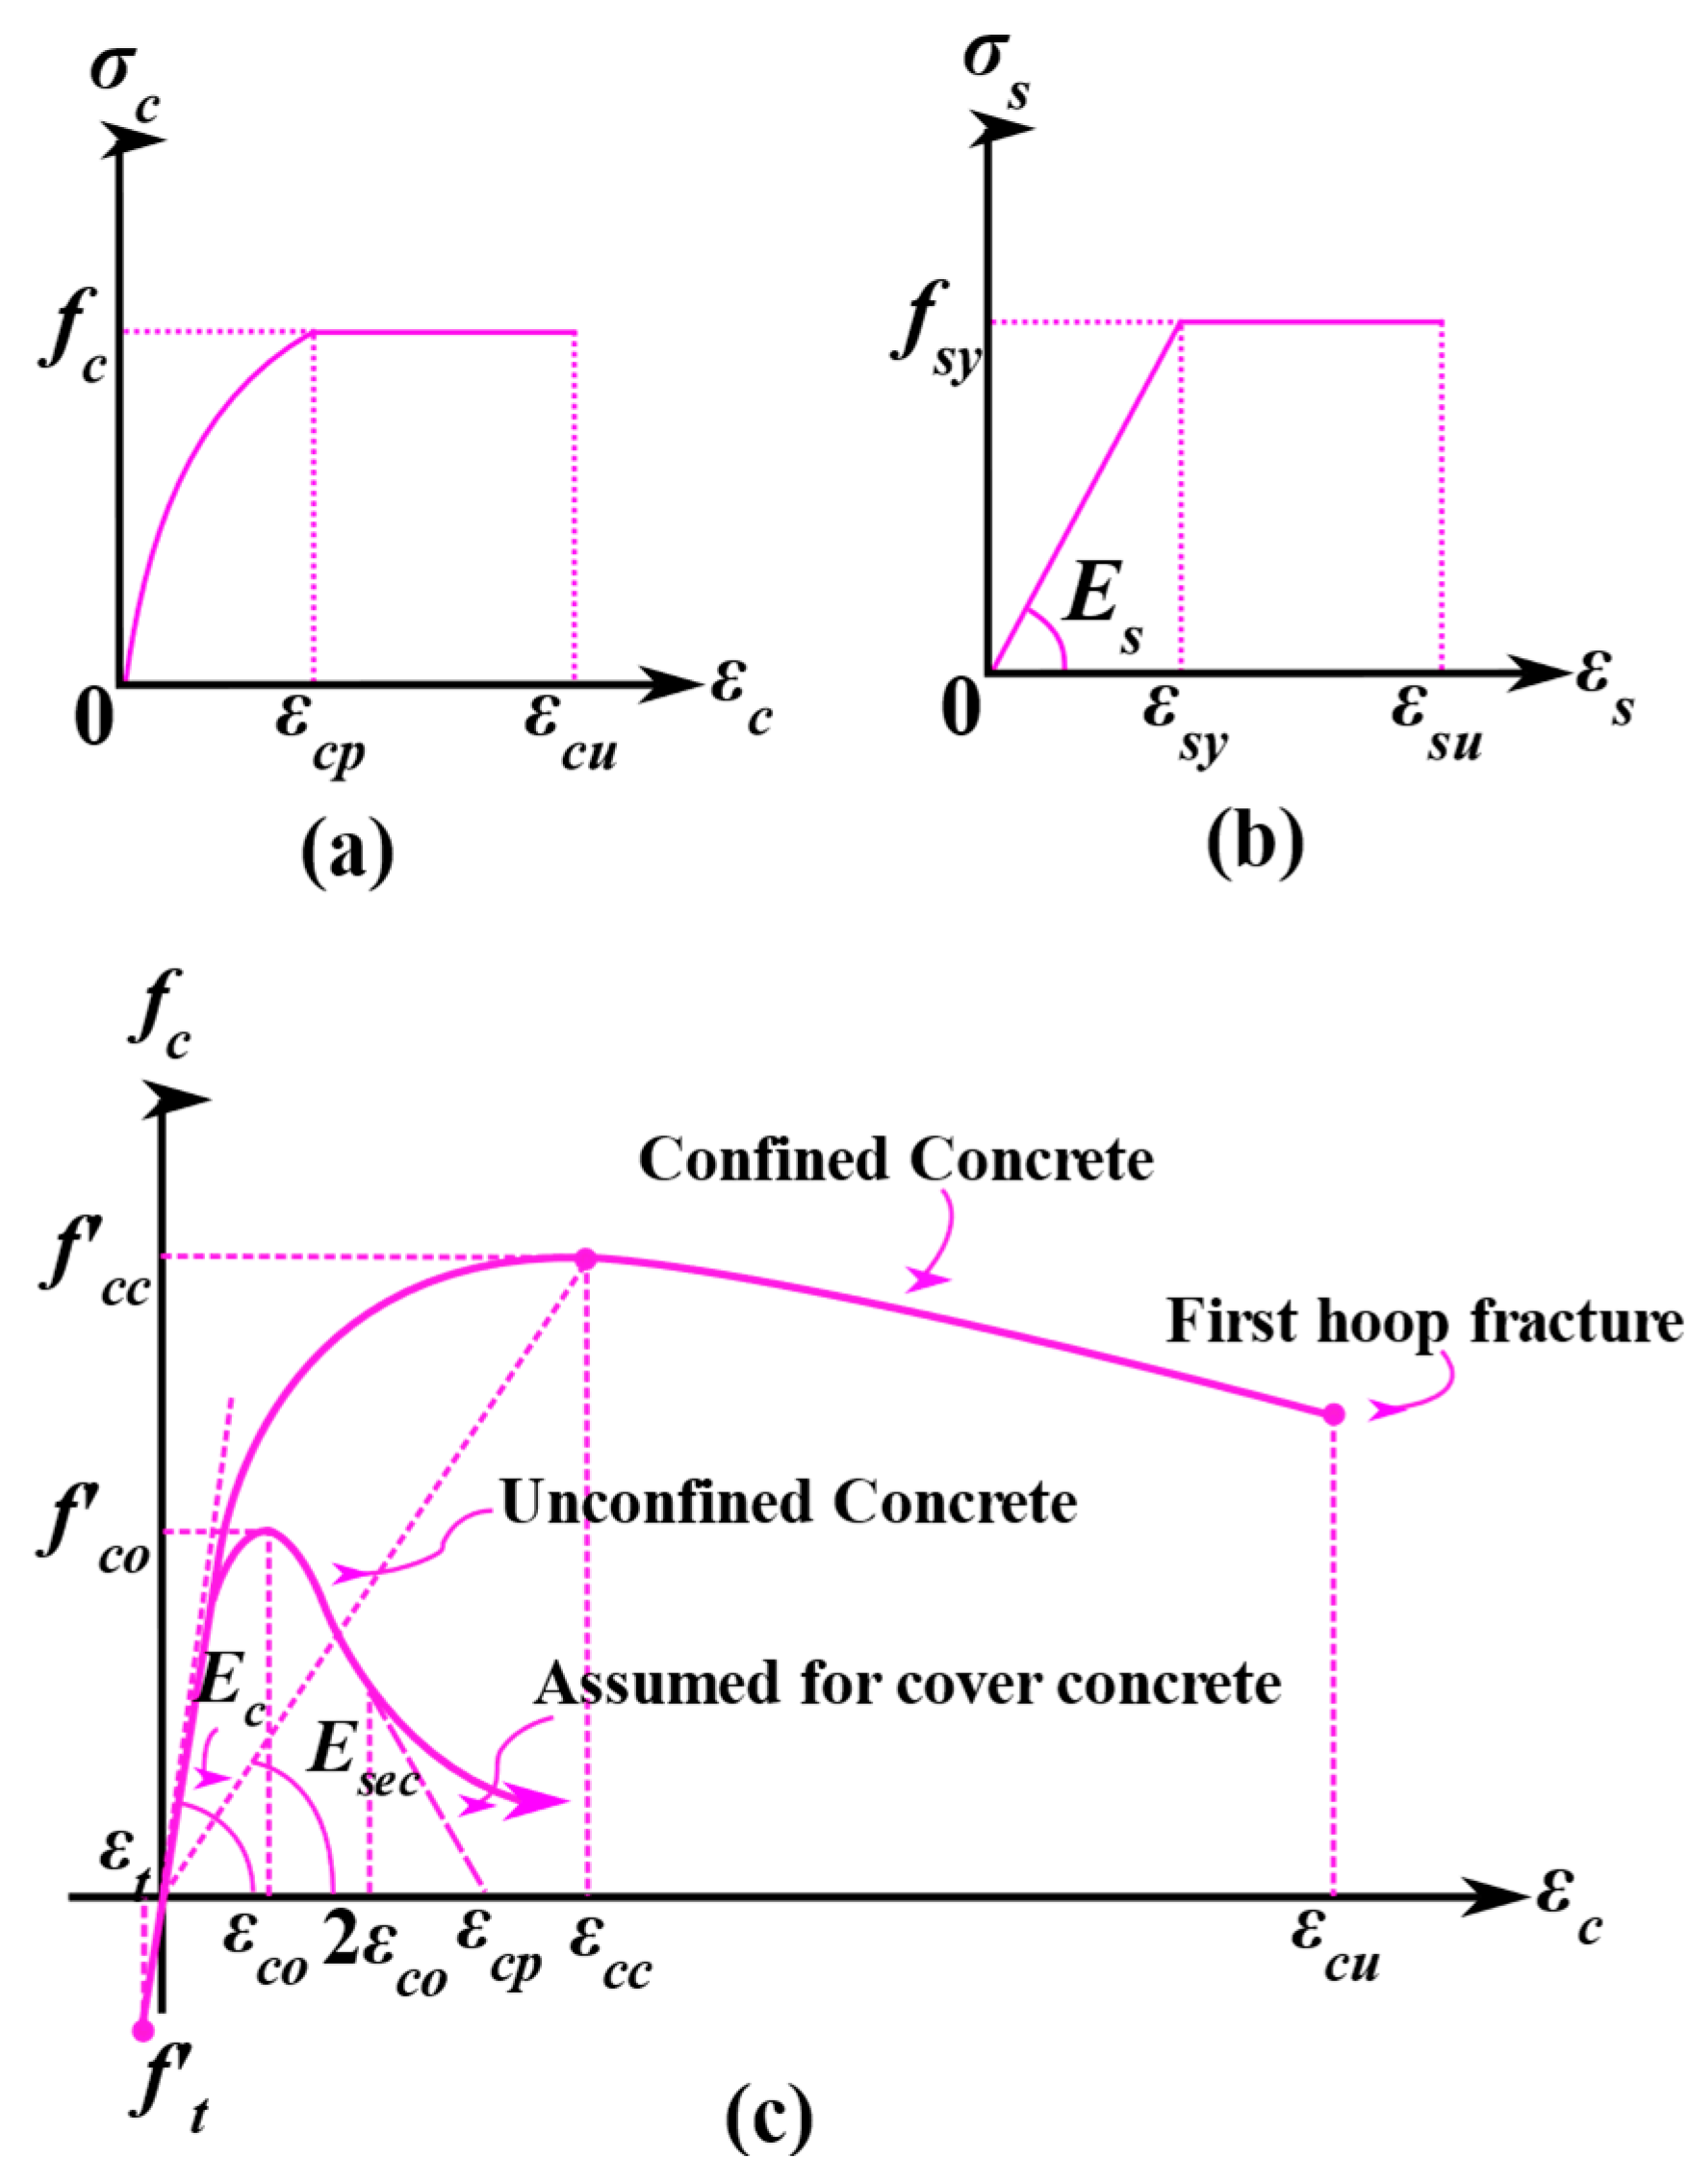
The stress–strain curve of the original frame beam and column concrete is shown in Figure 5a, consisting of a quadratic parabola and a horizontal straight line. The stress–strain expression of the uniaxial compression is given by Equations (1) and (2) [32].
σ c = f c 2 ε c ε c p ε c ε c p 2 ,             0 ε c ε c p
σ c = f c ,             ε c p ε c ε c u
where σc is the compressive stress of concrete; εc is compressive strain of concrete; fc is the compressive strength of concrete; εcp is the compressive strain of concrete at peak stress, taken as 0.002; and εcu is the ultimate compressive strain of concrete, taken as 0.0033.
The elastic–plastic bilinear model is adopted for the rebar and steel plate, as shown in Figure 5b, and the stress–strain expression is given by Equations (3) and (4) [33].
σ s = E s ε s ,             0 ε s ε s y
σ s = f s y ,             ε c s y ε s ε s u
where σs is the tensile stress of the steel bar and steel plate; εs is the tensile strain of the steel bar and steel plate; Es is the elastic modulus of the steel bar and steel plate; fsy is the yield stress of the steel bar and steel plate; εsy is the yield strain of the steel bar and steel plate; and εsu is the ultimate tensile strain of the steel bar and steel plate.
A steel plate can restrain the transverse deformation of concrete columns and delay the development of cracks, thus significantly improving the ductility and load-bearing capacity of concrete. In order to consider the constraining effect of steel plates on concrete, the Mander confined concrete model [34] is adopted for the reinforced column concrete, as shown in Figure 5c, and the stress–strain expression is given by Equations (5)–(10).
f c = f c c x r r 1 + x
x = ε c ε c c
ε c c = ε c o 1 + 5 f c c r 1 + x 1
r = E c E c E s e c
E c = 5000 f c o MPa
E s e c = f c c ε c c
where fc is the uniaxial compressive strength of concrete; εc is the compressive strain of concrete; f′cc is the compressive strength of restrained concrete; εcc is the peak strain of concrete; f′co and εco are the compressive strength and peak strain of unconfined concrete; r is the constraint concrete stress–strain coefficient; Ec is the elastic modulus of plain concrete; and Esec is the peak secant modulus of confined concrete.

3.3. Loading Conditions

In the pushover analysis, the lateral horizontal loading mode of an inverted triangle in the Y direction (MODEL-Y) is adopted, and the maximum load of each stage increases by 100 kN. While the structure is subjected to a horizontal nappe load, the influence of gravity loads on the structure should also be considered. Based on the requirements of the Chinese code [35,36], gravity loads are combined according to Equations (11)–(13).
F = 1.0 G + 0.5 Q
G = ( g f + g r ) × S s + q l b
Q = ( q f + q r ) × S s
where F is the total value of the load; G is the total value of a constant load; Q is the total live load; gf is the floor constant load, taken as 1.5 kN/m2; gr is the roof constant load, taken as 3.5 kN/m2; Ss is the total floor area; q is the concrete hollow block filling wall, where the load on the beam line is converted to 11.8 kN/m; lb is the total length of all beams; qf is the floor live load, taken as 2.0 kN/m2; and qr is the roof live load, taken as 2.0 kN/m2. The mass of the structure is equal to the combined load divided by the gravitational acceleration g.

4. Results and Discussion

In this study, there is no direct validation of the analyzed results with the experimental results. The main reason for this is that this study considers the full-scale modelling of the actual frame structure, and the corresponding model tests are difficult to perform. Nonetheless, we are still confident in the results of the analyses. In 2012, Paul and Agarwal [28] carried out pushover analyses of the RC frame model using SAP2000 and compared the results of the analyses with the experimental results. The differences in the loads and displacements were 7.69% and 17% in yielding and 15% and 3% in the ultimate limit state, respectively. In 2014, Moehle et al. [29] conducted a comprehensive comparison of RC component modeling using SAP2000 with experimental results in the literature, with prediction accuracy of 93%. Interestingly, similar research also occurred in the study of M.O. Aboualam [30]. These studies prove that the correlation between the experimental results and the analytical model proposed based on SAP2000 is considered acceptable. The modeling process in this study has been carried out in strict accordance with the standardized procedure proposed by Paul and Moehle et al. [28,29,30]; therefore, the analytical results are credible.

4.1. Mode of Vibration

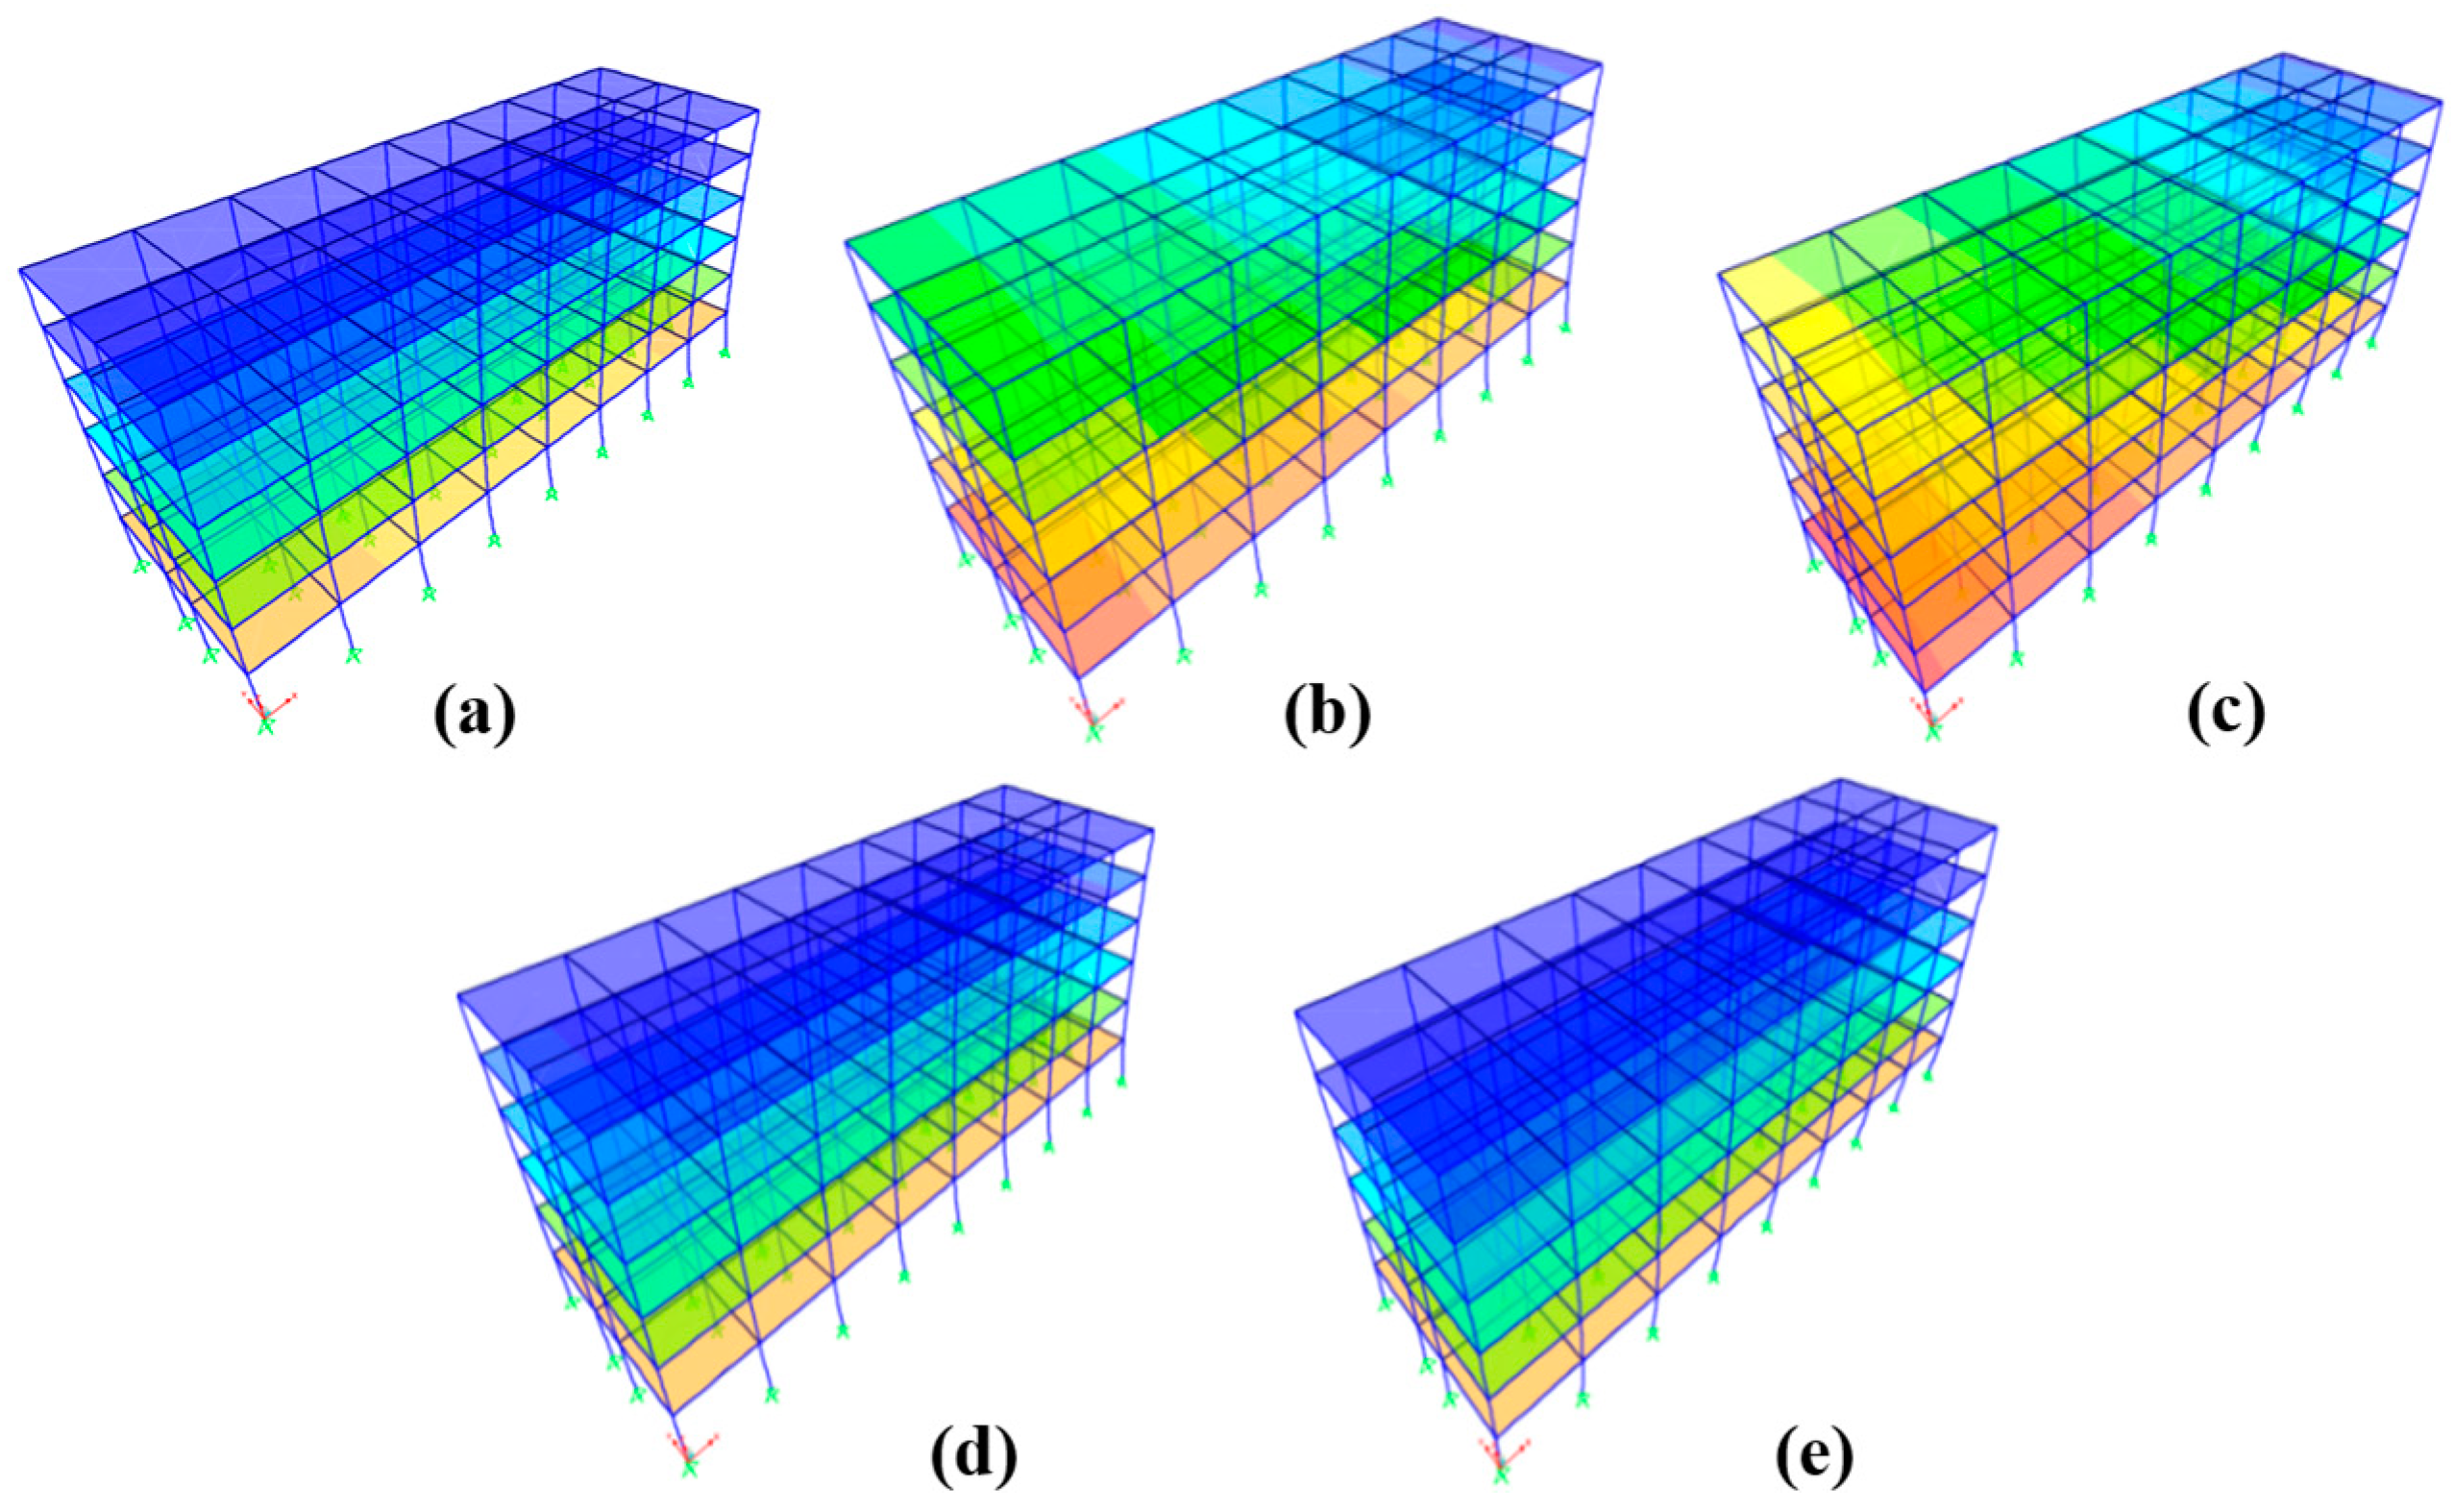
Figure 6 shows the first three mode shapes of M0. In the analysis, for both M0 and the four strengthened models, the first mode shape is a translation along the Y direction, the second mode shape is a translation along the X direction, and the third mode shape is a torsional mode about the Z axis. In these mode shapes, the blue regions exhibit the largest displacement, while the red regions exhibit the smallest displacement. Figure 7, Figure 8 and Figure 9 present the mode shapes of M0 and the four strengthening models. From Figure 7, it can be seen that, under the first-order lateral translational mode, the displacements at both longitudinal ends of the edge frames on the same floor for M0, M3, and M4 are essentially equal. For M1 and M2, the mode shape displacements in the strengthened regions are significantly smaller than those in the unstrengthened regions. The fundamental reason for this difference lies in the asymmetry of the stiffness distribution, which leads to non-uniform vibration responses. Similar phenomena are observed in the second and third mode shapes. It is worth noting that, in the higher-order vertical mode shapes, local vertical vibrations occur at different locations. Figure 8 and Figure 9 show that, in the 13th mode shape, both M0 and the four strengthening models exhibit first-order vertical vibrations, while, in the 14th mode shape, they all exhibit second-order vertical vibrations. The vertical vibration of M0 is characterized by the overall vertical movement of the frame, whereas the vertical vibration characteristics of the strengthening models are closely related to the strengthening layout. Specifically, the vertical displacement in the strengthened regions is significantly smaller, while that in the unstrengthened regions is larger, with the local vertical vibration phenomenon being particularly pronounced in M1. The main reason for this is the significant stiffness difference between the strengthened and unstrengthened regions, which renders the unstrengthened areas weak points where local vibrations typically occur. Due to the discontinuity in stiffness, the occurrence of local vibrations further emphasizes the importance of an appropriate strengthening layout in reducing local deformations.

4.2. Period

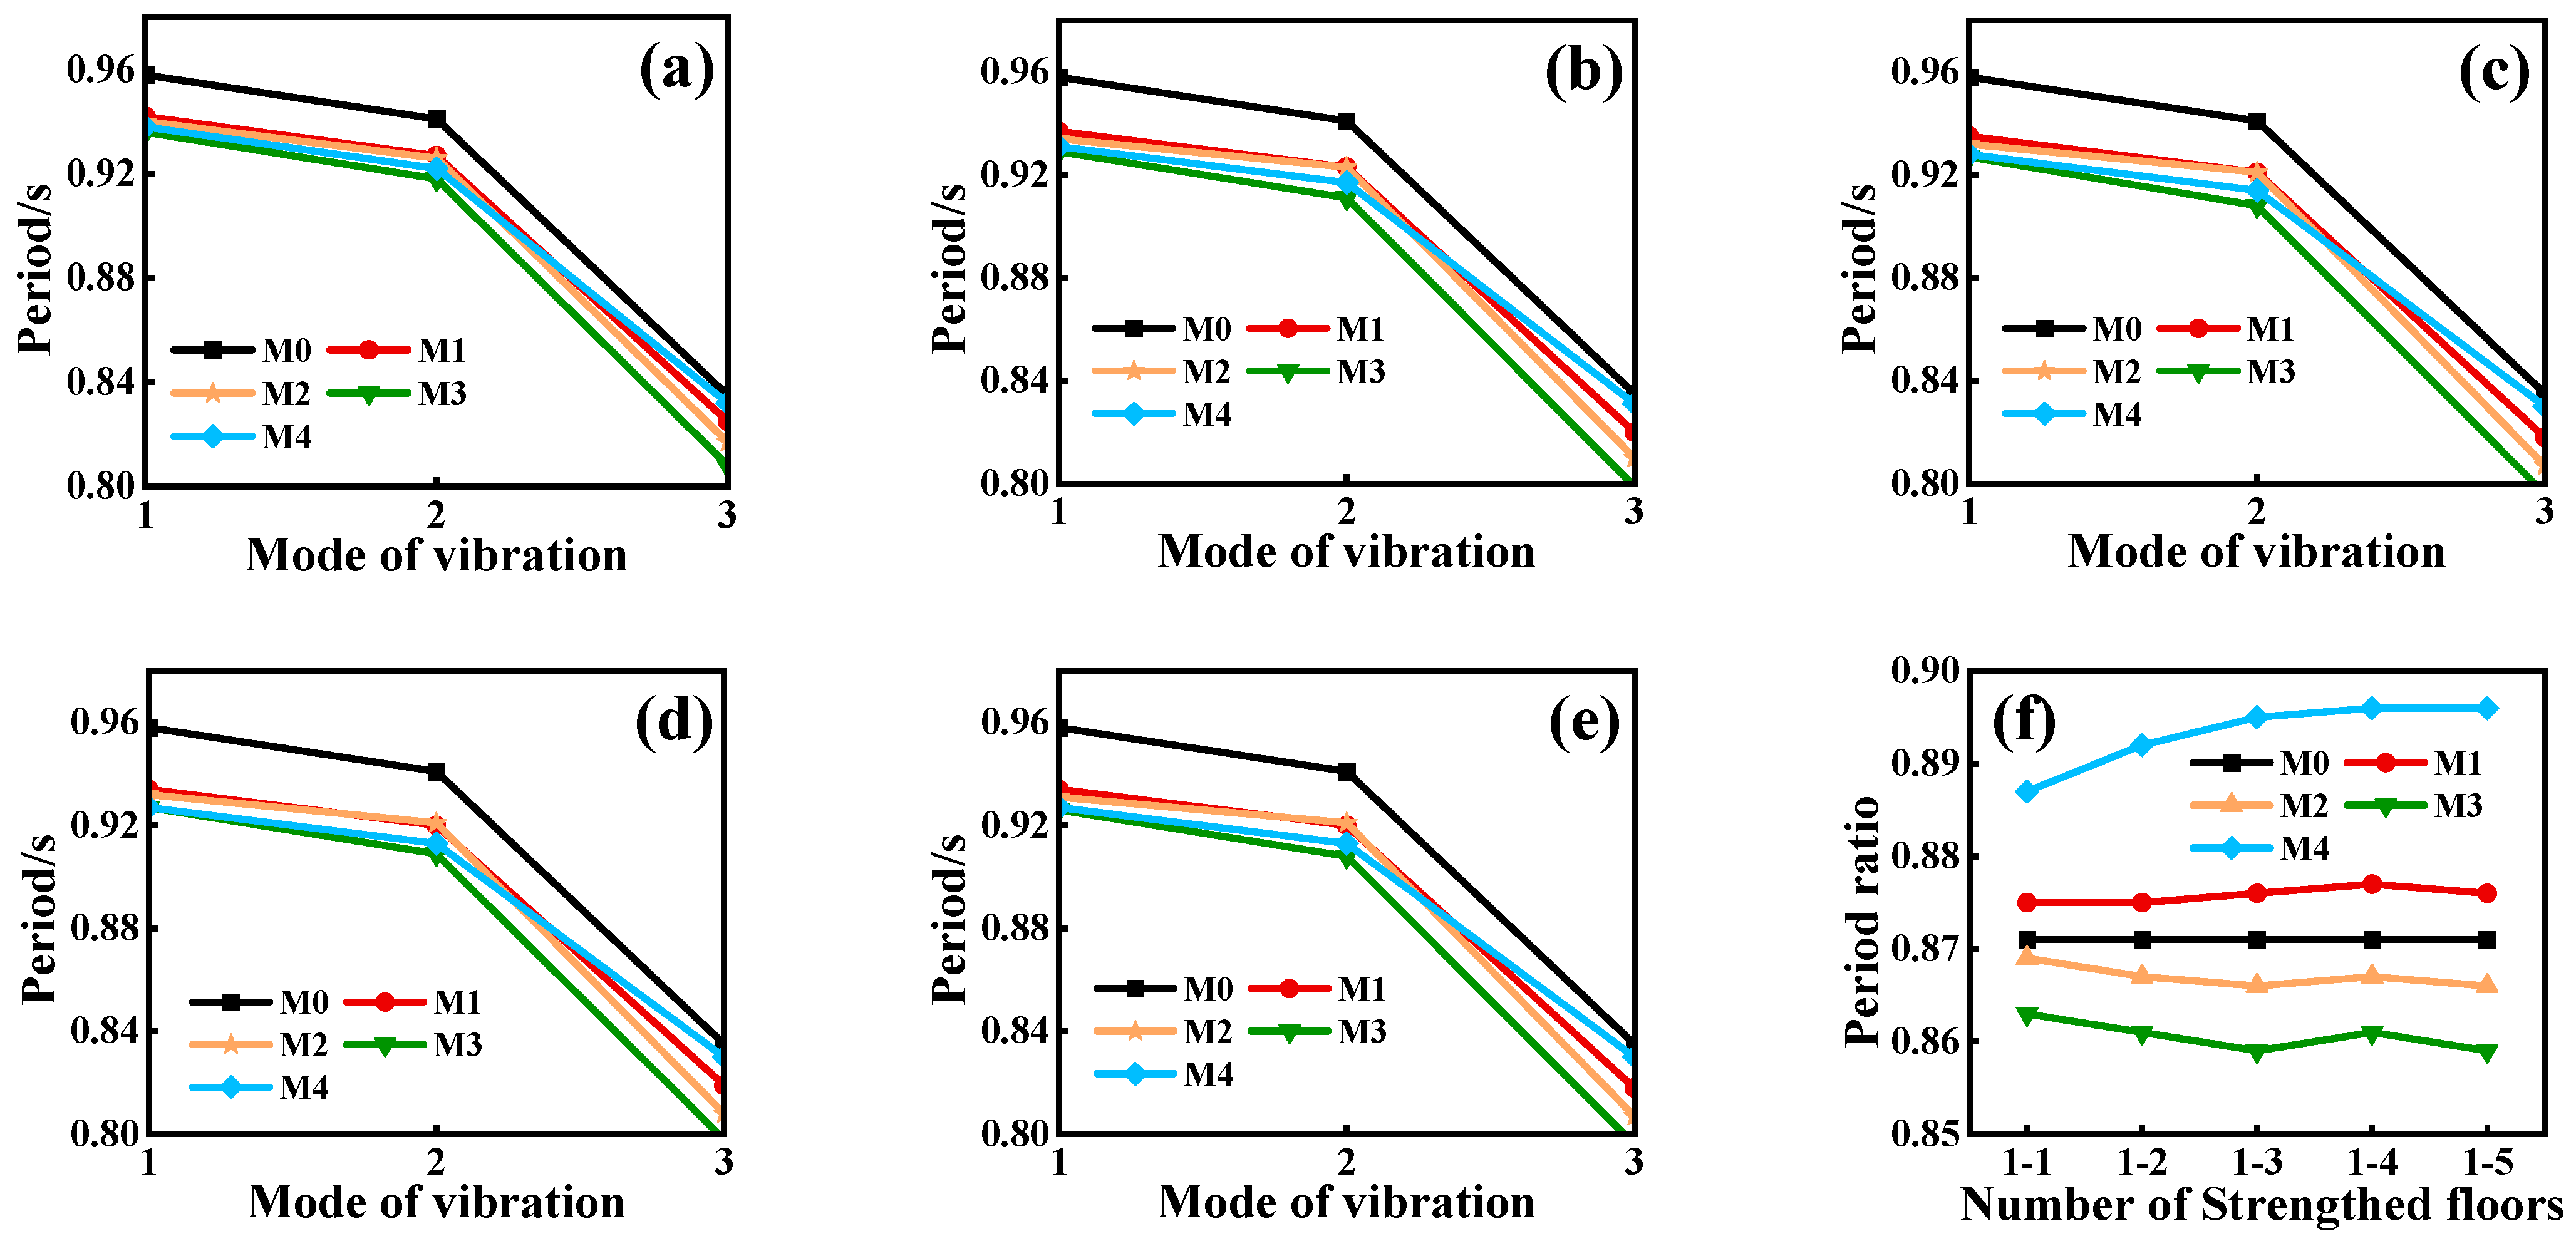
Figure 10 shows the variation in the period and period ratios of structures with different numbers of strengthening layers. Since the first three mode shapes dominate the overall response of the structure, this section provides a detailed analysis of the periods corresponding to these modes. Overall, the periods of the strengthened models are consistently shorter than that of M0, indicating that the strengthening effectively enhances the overall stiffness of the structure. As the number of strengthening layers increases, the natural periods of the models gradually decrease; this trend is particularly evident in M2 and M3, indicating a more significant improvement in stiffness for these models. In Figure 10f, “1-1” indicates that only the first floor is strengthened, “1-2” indicates that floors 1 to 2 are strengthened, and so on. The vertical axis in Figure 10f represents the period ratio, defined as the ratio of the first torsional period (Tt) to the first translational period (T1) of the structure (i.e., Tt/T1). From Figure 10f, it can be observed that M4 exhibits the highest period ratio, whereas M3 exhibits the lowest. The period ratio reflects the relative relationship between the lateral stiffness and torsional stiffness: M3, which is strengthened at the four corners, shows increased torsional stiffness, while M4, strengthened at the center, demonstrates enhanced lateral stiffness. The period ratios for M1 and M4 slightly increase as the number of strengthening layers grows; however, they do not exceed the limit of 0.9 stipulated by the Chinese code (JGJ3-2010) [37], indicating that the number of strengthening layers is not the primary factor affecting the structural period. The trend in the period ratio indicates that asymmetric strengthening schemes (M1 and M2) contribute relatively less to the overall stiffness enhancement, whereas symmetric strengthening schemes (M3 and M4) exhibit a superior improvement in the overall stiffness.

4.3. Base Shear vs. Vertex Displacement

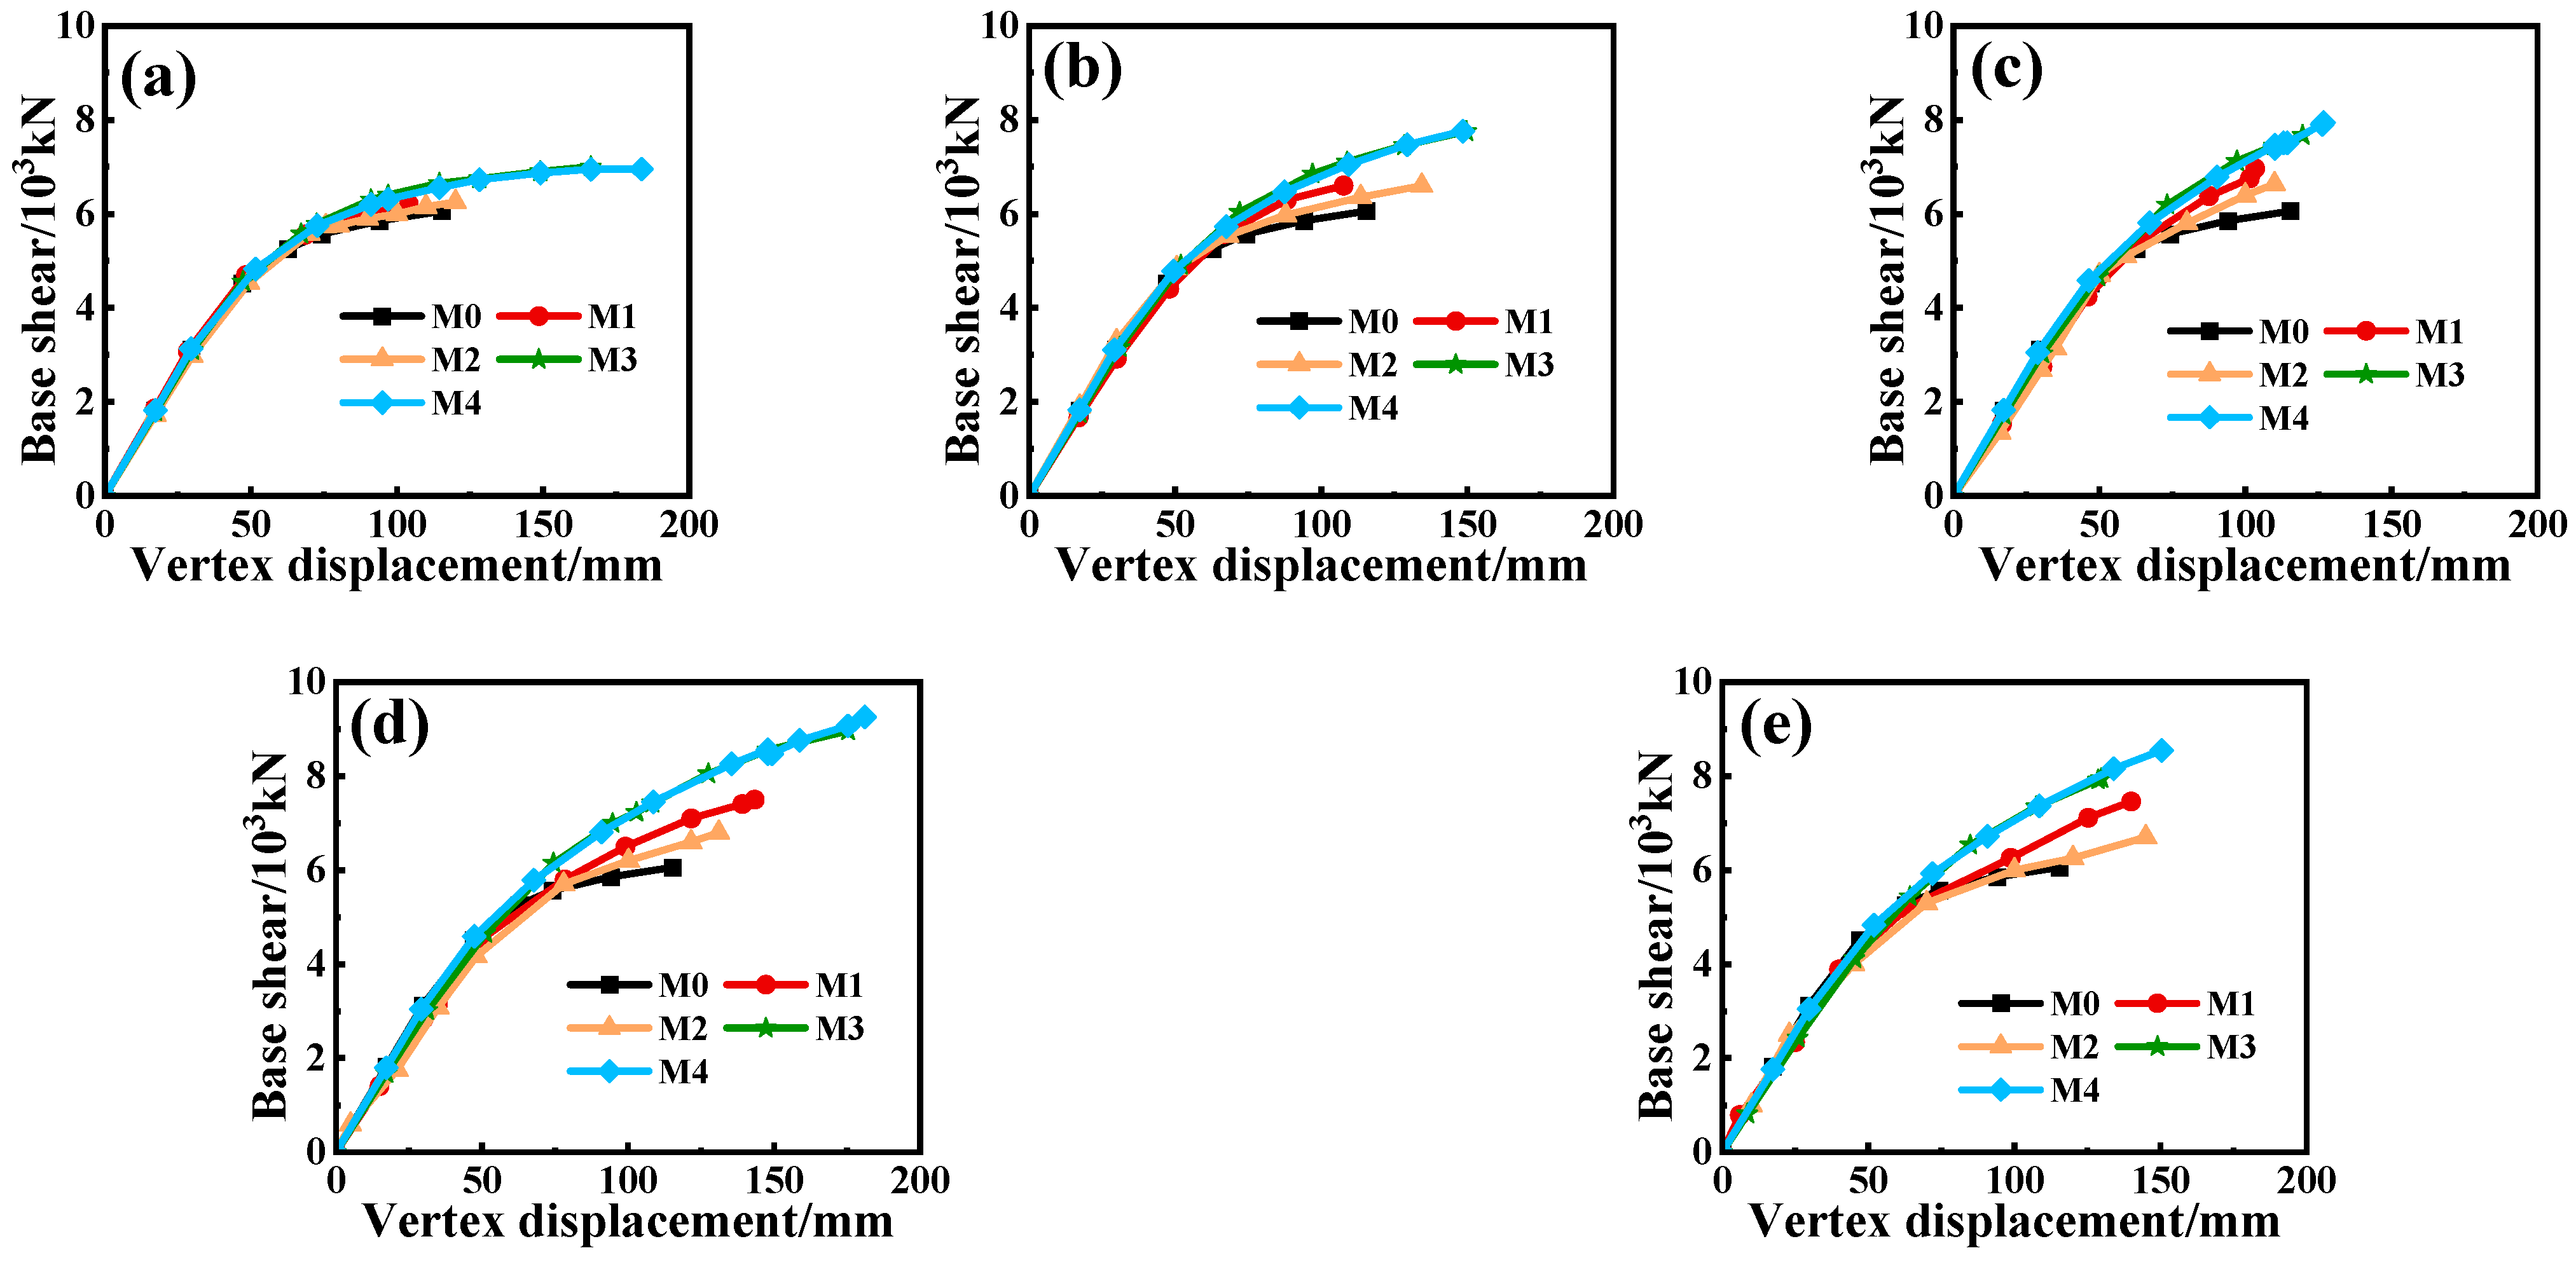
Figure 11 shows the curves of the base shear and vertex displacement for each model as the number of strengthening layers changes. Overall, Figure 11 reveals that the structure is in the linear elastic phase at the initial stage of loading, with the curves of all strengthening schemes nearly overlapping, indicating that their initial stiffnesses are similar. As the load increases, the structure gradually enters a nonlinear stage, and the base shear of the strengthened models is significantly higher than that of the original structure, indicating that the strengthening measures effectively enhance the overall lateral stiffness of the structure. The base shear–vertex displacement curve of the original structure enters the yield stage earlier and exhibits lower peak shear. After strengthening, the structure shows improvements in both its lateral load-carrying capacity and ductility. When the number of strengthening layers is the same, the base shear of M3 and M4 is consistently greater than that of M1 and M2, indicating that symmetric strengthening is more effective in enhancing the lateral stiffness than asymmetric strengthening; notably, M4 exhibits the largest improvement in the lateral load-carrying capacity, with an increase of approximately 53.6% compared to the original structure. As the number of strengthening layers increases, the overall stiffness of each structure improves, as evidenced by an increase in the base shear at the same vertex displacement, and the lateral load-carrying capacity of the structure gradually increases; among the models, M4 consistently demonstrates a higher ultimate load capacity than the other schemes, indicating that its strengthening effect is the best. Furthermore, when the number of strengthening layers exceeds four, the trend of the base shear–vertex displacement curves for the strengthened models shows little change, suggesting that the benefits of adding more than four strengthening layers may be limited.

4.4. Performance Point

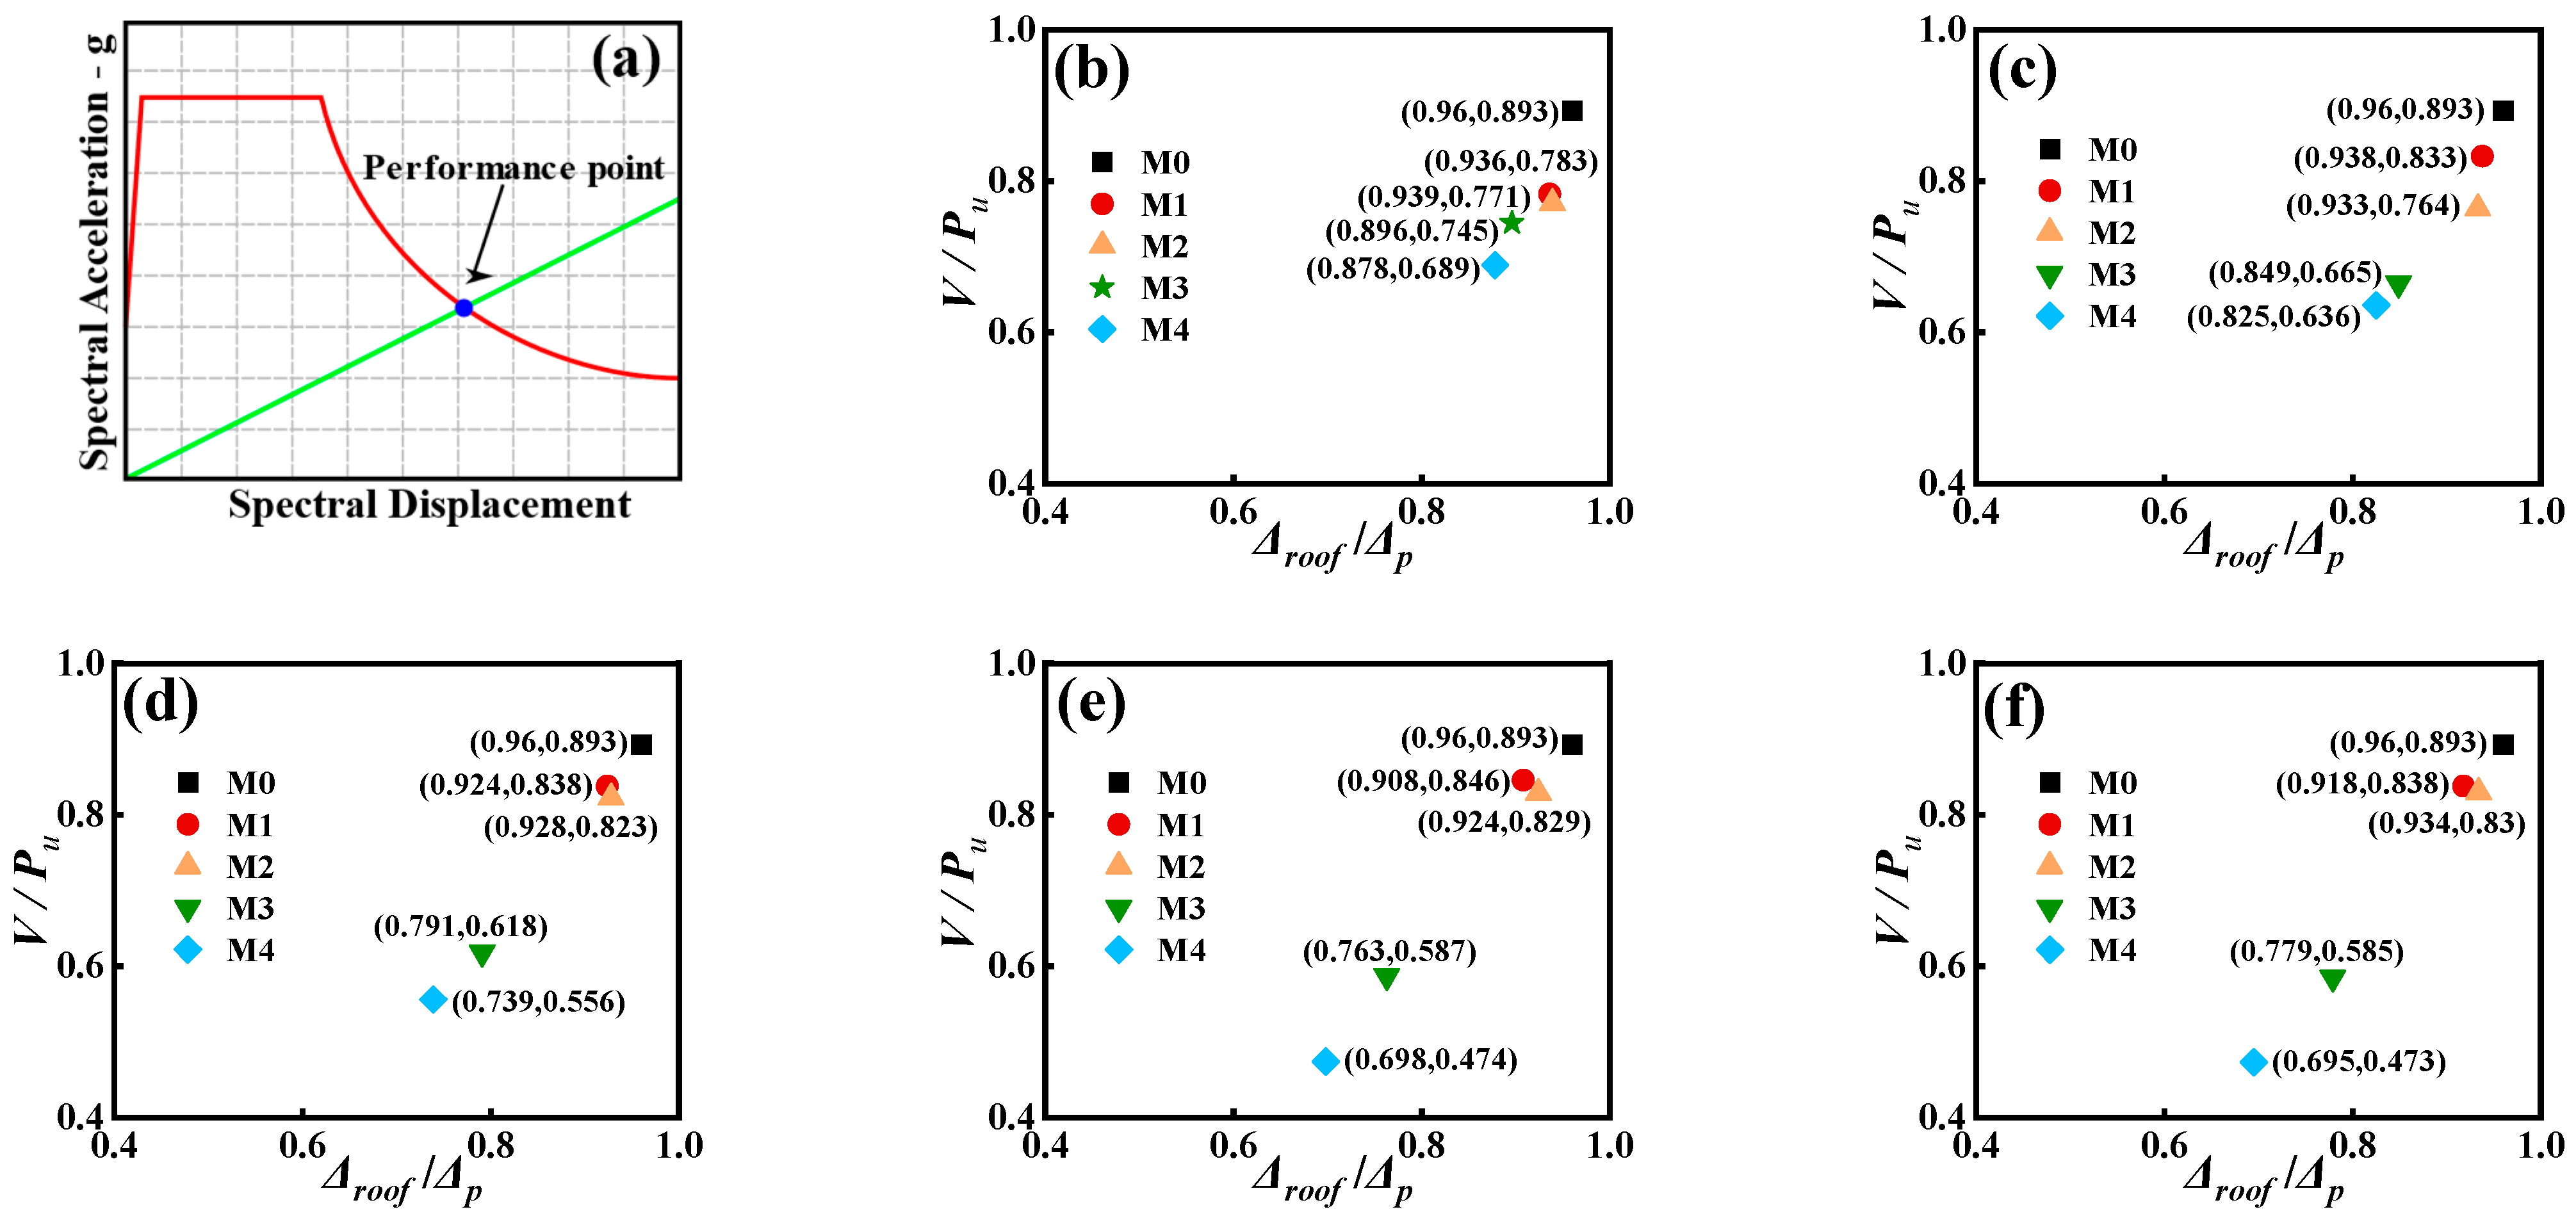
The seismic performance point, also known as the target displacement point, refers to the displacement response of a structure when a specified seismic design target is reached. In this study, the seismic performance point of the structure was determined using the capacity spectrum method as adopted in the US ATC-40 [38]. The basic principle of the capacity spectrum method is as follows: two spectrum curves with a common baseline are established—one being the capacity spectrum, obtained by converting the load–displacement curve, and the other being the demand spectrum, derived from the acceleration response spectrum. These two curves are plotted on the same graph, and their intersection point is defined as the seismic performance point of the structure, as shown in Figure 12a.
Because the response spectra in the US and Chinese codes differ, the Chinese code [36] determines seismic forces using design response spectrum accelerations and ground motion parameters, while the US code [38] adjusts the response spectra based on the site classification and risk categories. Therefore, the response spectra of the two countries must be converted. The specific conversion formula is as follows:
η 2 α m a x = 2.5 C A
T g = T s = C V 2.5 C A
In this formula, η2αmax and 2.5CA correspond to the first inflection points of the Chinese and US code response spectra, respectively, while Tg and Ts = CV/(2.5CA) correspond to the second inflection points of the Chinese and US code response spectra, respectively. By equating the values at the inflection points of the two spectra, CA and CV can be determined, thereby completing the conversion of the response spectrum. According to the Chinese codes (GB 55002-2021) [39] and (GB50011-2010) [36], under rare earthquake events, the maximum horizontal seismic influence coefficient (αmax) is 0.50, the characteristic period (Tg) is 0.4 s, and, for a building with a damping ratio of 0.05, the damping adjustment factor (η2) of the seismic influence coefficient curve is set to 1.0. Therefore, in the US code response spectrum, CA = CV = 0.2.
Figure 12 shows the ratios of the base shear and vertex displacement at the performance point to the ultimate load and peak displacement for each model. In the figure, Pu represents the ultimate load, V represents the base shear at the performance point, Δroof represents the vertex displacement at the performance point, and Δp represents the peak displacement. The ultimate load and peak displacement are obtained from the base shear–vertex displacement curves shown in Figure 11. After strengthening, the structures exhibit increased base shear and vertex displacement at the performance point, while the ratios V/Pu and Δroof/Δp decrease, indicating that the strengthening enhances both the stiffness and ductility of the structure. When the number of strengthening layers is the same, the V/Pu ratios consistently follow the trend M0 > M1 > M2 > M3 > M4, indicating that structures with symmetric strengthening have greater lateral stiffness than those with asymmetric strengthening. As for Δroof/Δp, M0 exhibits the highest value; M1 and M2 are slightly lower than M0, with little difference, while M3 is greater than M4 and both are lower than M1 and M2. This suggests that the seismic performance reserves of structures with asymmetric strengthening are not significantly different from those of the original structure, whereas symmetric strengthening can enhance the seismic performance reserve. When only the first floor is strengthened, the base shear at the performance point for each model is 0.893Pu, 0.783Pu, 0.771Pu, 0.745Pu, and 0.689Pu, respectively, while the vertex displacement at the performance point is 0.96Δp, 0.936Δp, 0.939Δp, 0.896Δp, and 0.878Δp, respectively. When floors 1 through 5 are strengthened, the base shear at the performance point for each model is 0.893Pu, 0.838Pu, 0.83Pu, 0.585Pu, and 0.473Pu, respectively, and the vertex displacement at the performance point is 0.96Δp, 0.918Δp, 0.934Δp, 0.779Δp, and 0.695Δp, respectively. From Figure 12, it can be observed that, as the number of strengthening layers increases, the V/Pu ratio for structures with asymmetric strengthening increases, with little change in Δroof/Δp, whereas, for structures with symmetric strengthening, both V/Pu and Δroof/Δp gradually decrease. This indicates that, although increasing the number of strengthening layers can enhance the base shear for M1 and M2, the lateral capacity of the structure does not change significantly. This may be because the increase in the number of strengthening layers accentuates the stiffness irregularity associated with asymmetric strengthening, requiring greater base shear to counteract this adverse effect; in contrast, structures with symmetric strengthening exhibit a more uniform stiffness distribution, thereby improving the overall performance as the number of strengthening layers increases. Furthermore, Figure 12e,f show that the reductions in V/Pu and Δroof/Δp for M3 and M4 are very small, which further confirms the conclusion in Section 4.3 that the benefits of adding more than four strengthening layers may be limited. In summary, for practical strengthening, symmetric strengthening is preferred, and an appropriate number of strengthening layers should be selected to ensure the maximum benefit.

4.5. Floor Displacement

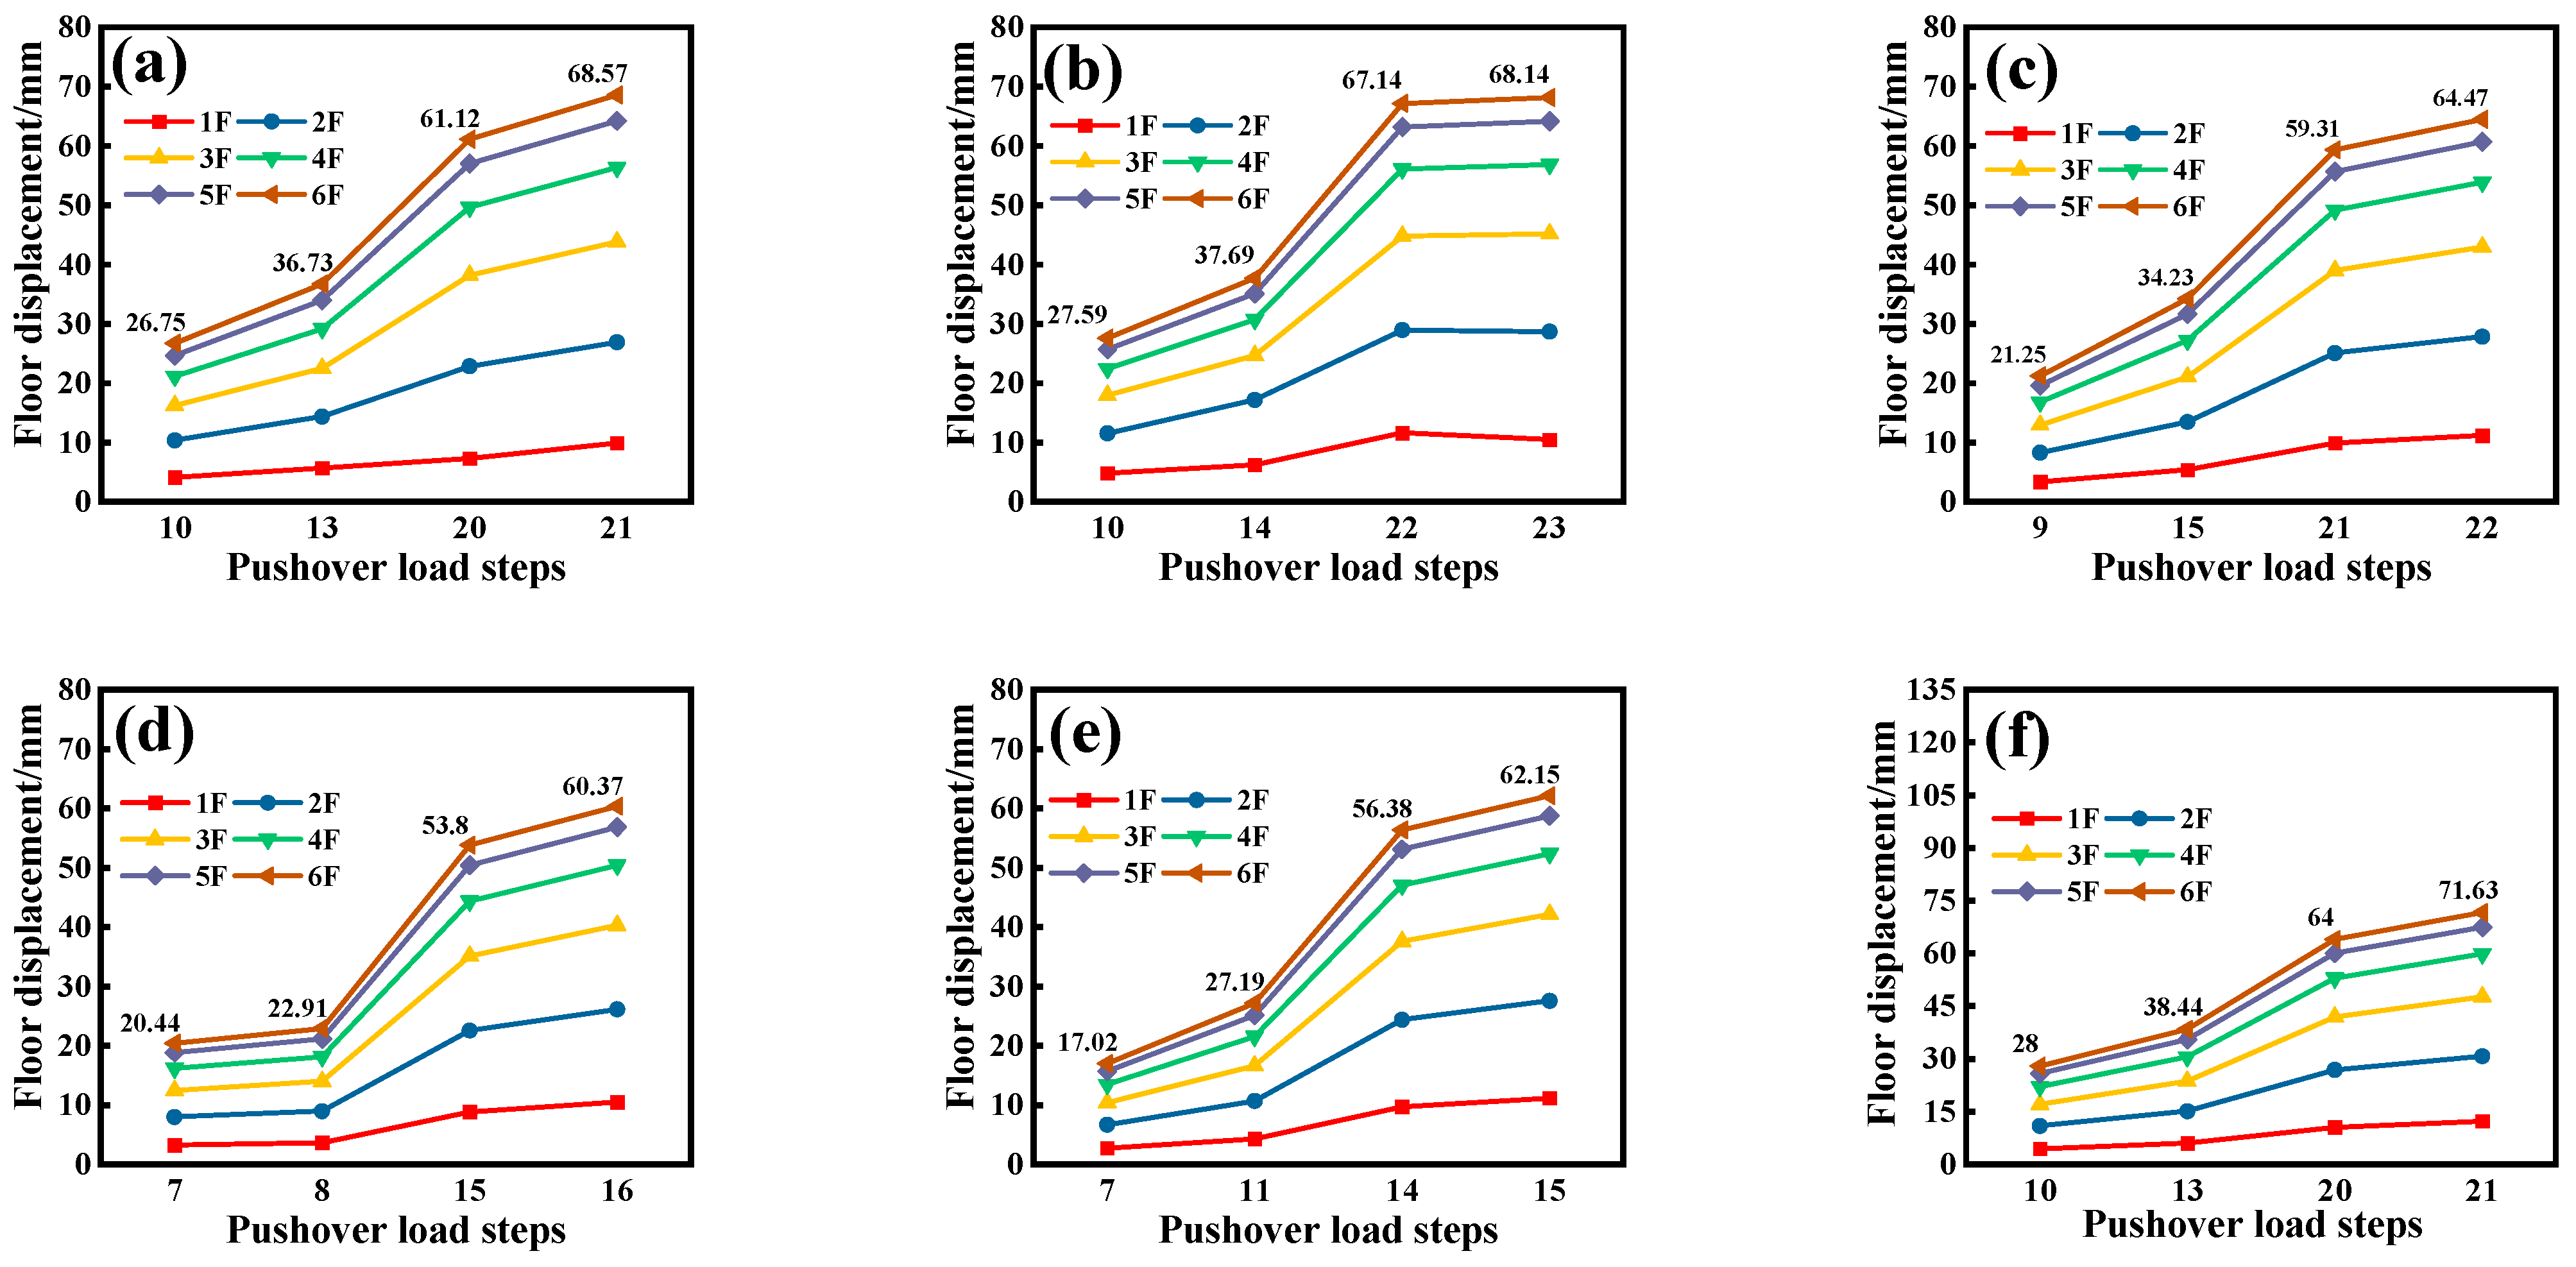
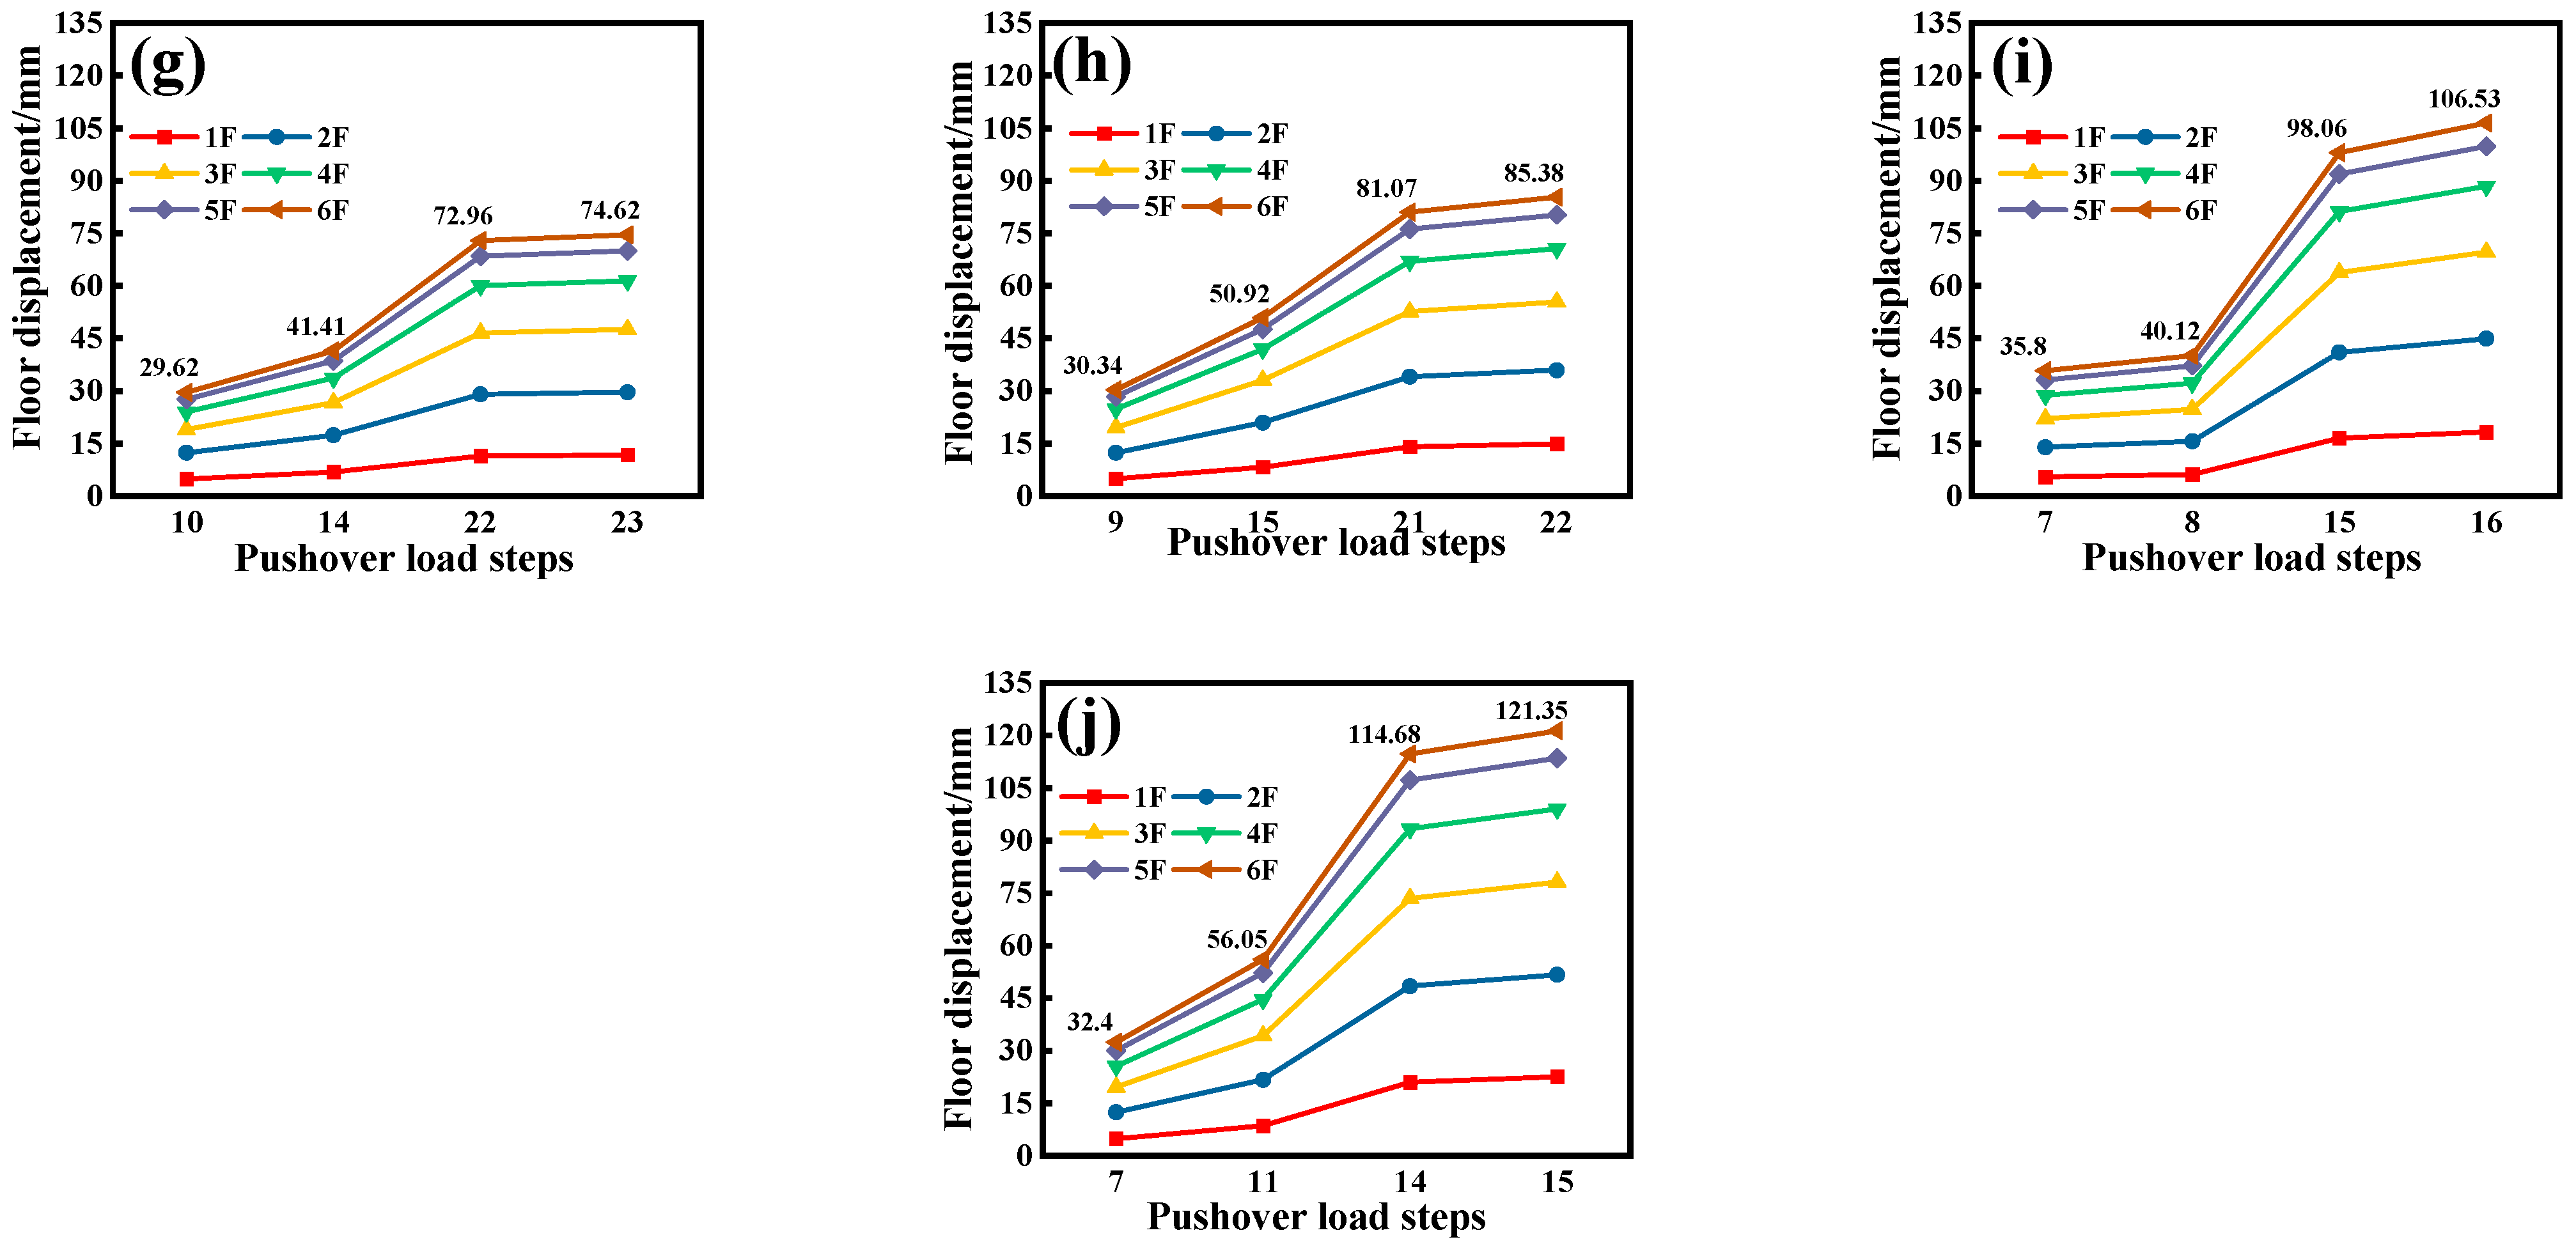
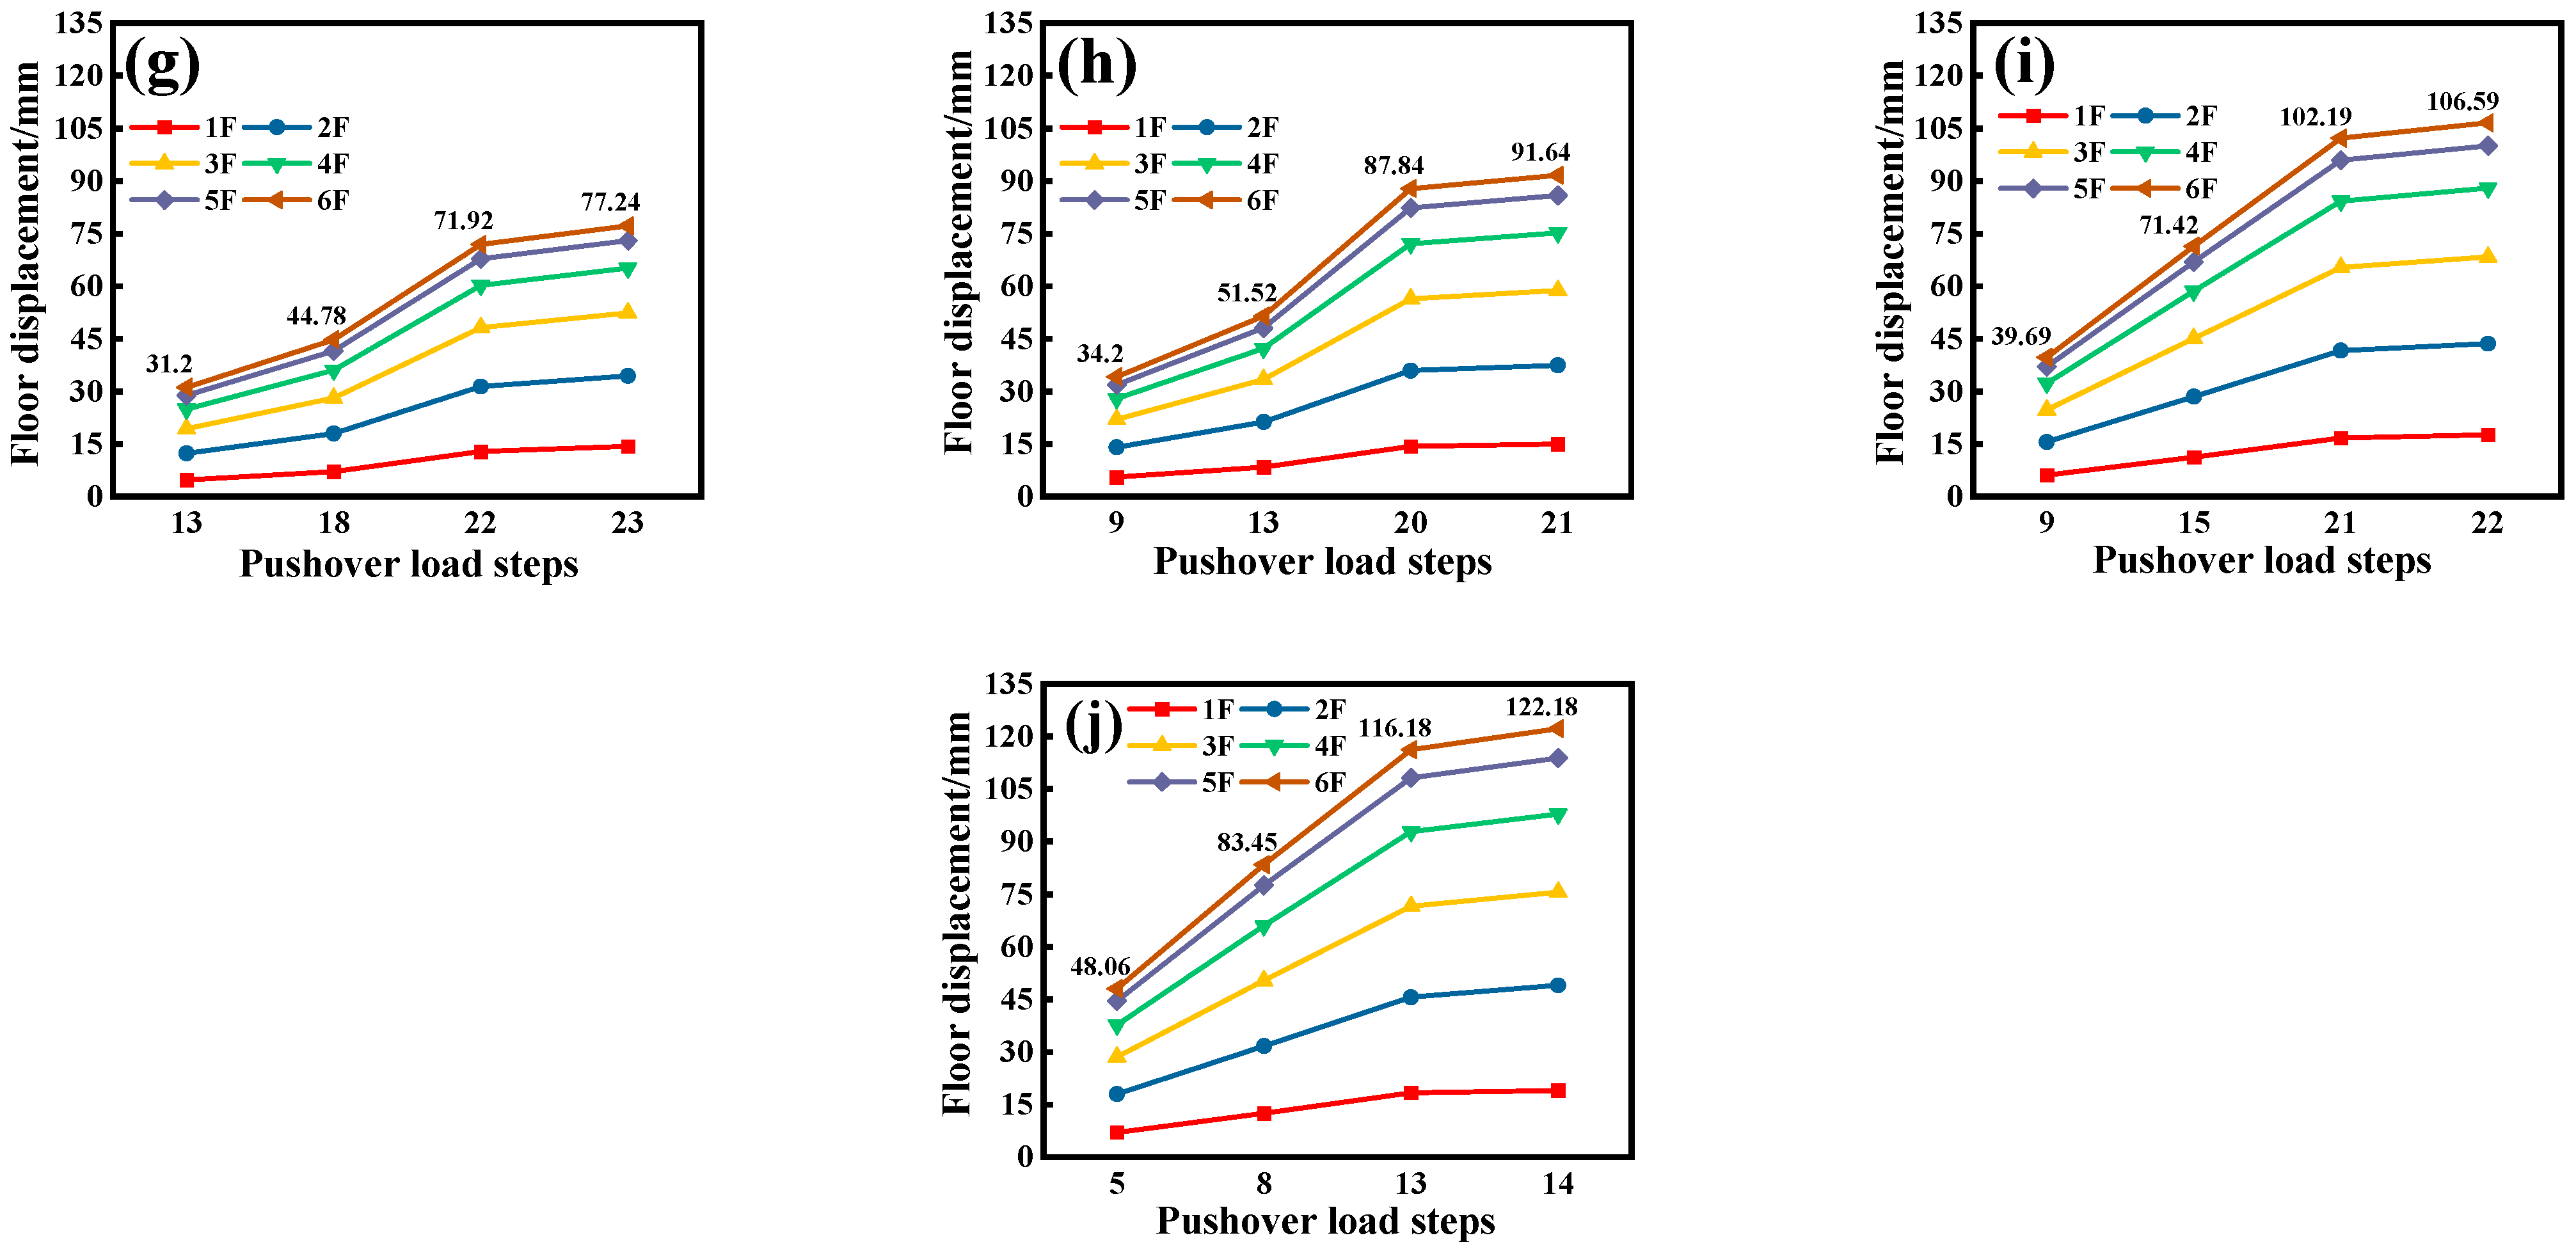
During loading, the stiffness at the two longitudinal ends of M1 and M2 differs, and this difference becomes more pronounced as the number of local strengthening layers increases. Since M3 and M4 are symmetrically strengthened, the floor displacement differences at the two longitudinal ends are minimal. Therefore, this paper focuses on the relationship between the evolution of the floor displacement at the two longitudinal ends (denoted as axis 1 and axis 9, respectively) of M1 and M2 and the increase in pushover load steps. Figure 13 and Figure 14 present the distribution of the floor displacements of the frames at axis 1 and axis 9 for M1 and M2 under different pushover load steps. The pushover load steps, from left to right, correspond to the following states: the occurrence of the first set of beam hinges, the occurrence of the first set of column hinges, the state before reaching the performance point, and the state after reaching the performance point. It can be observed from the figures that, when the number of strengthening layers is the same, as the pushover load steps increase, the floor displacements of the frames at axis 1 and axis 9 for M1 and M2 gradually increase, and the displacement difference between the two frames also progressively enlarges. Taking the vertex displacement of M1 as an example, when the first set of beam hinges appears in M1, the vertex displacement difference between the two frames increases with the number of strengthening layers, with values of 1.25 mm, 2.03 mm, 9.09 mm, 14.56 mm, and 15.38 mm, respectively. When the first set of column hinges appears, the displacement difference is further enlarged to 1.71 mm, 3.72 mm, 16.69 mm, 17.21 mm, and 28.86 mm. When the structure approaches the performance point (taking the floor displacements just before reaching the performance point), the vertex displacement difference between the two frames further increases to 2.88 mm, 5.82 mm, 21.76 mm, 46.16 mm, and 59.20 mm. This indicates that, with an increasing number of strengthening layers, the deformation coordination between the two frames deteriorates, leading to the exacerbation of the displacement imbalance between them. At lower pushover load steps, the floor displacement distribution in models with different numbers of strengthening layers is relatively uniform, with a relatively small displacement difference between axis 1 and axis 9. However, as the pushover load steps increase, particularly after entering the plastic development stage, the displacement differences increase significantly. For example, in the case of strengthening floors 1 through 5, the vertex displacement difference of M1 is only 15.38 mm at pushover load step 7, but it increases to 59.2 mm at step 15, representing an increase of 285%. In addition, the increase in displacement at axis 9 is much greater than that at axis 1, indicating that the growth in flexibility at this location is more pronounced, which may be related to local stiffness changes and an uneven force distribution. Overall, at the same pushover stage, the greater the number of strengthening layers, the larger the floor displacement difference between axis 1 and axis 9. This phenomenon indicates that, when an asymmetric strengthening scheme is employed, increasing the number of strengthening layers may lead to a reduction in the overall coordination of the frame, resulting in a significant torsional effect that adversely affects the overall seismic performance of the structure. Therefore, in strengthening design, it is necessary to reasonably control the stiffness distribution while enhancing the shear capacity, in order to avoid excessive lateral displacement differences caused by uneven stiffness, which can adversely affect the seismic performance of the structure.

4.6. Inter-Story Drift Ratio

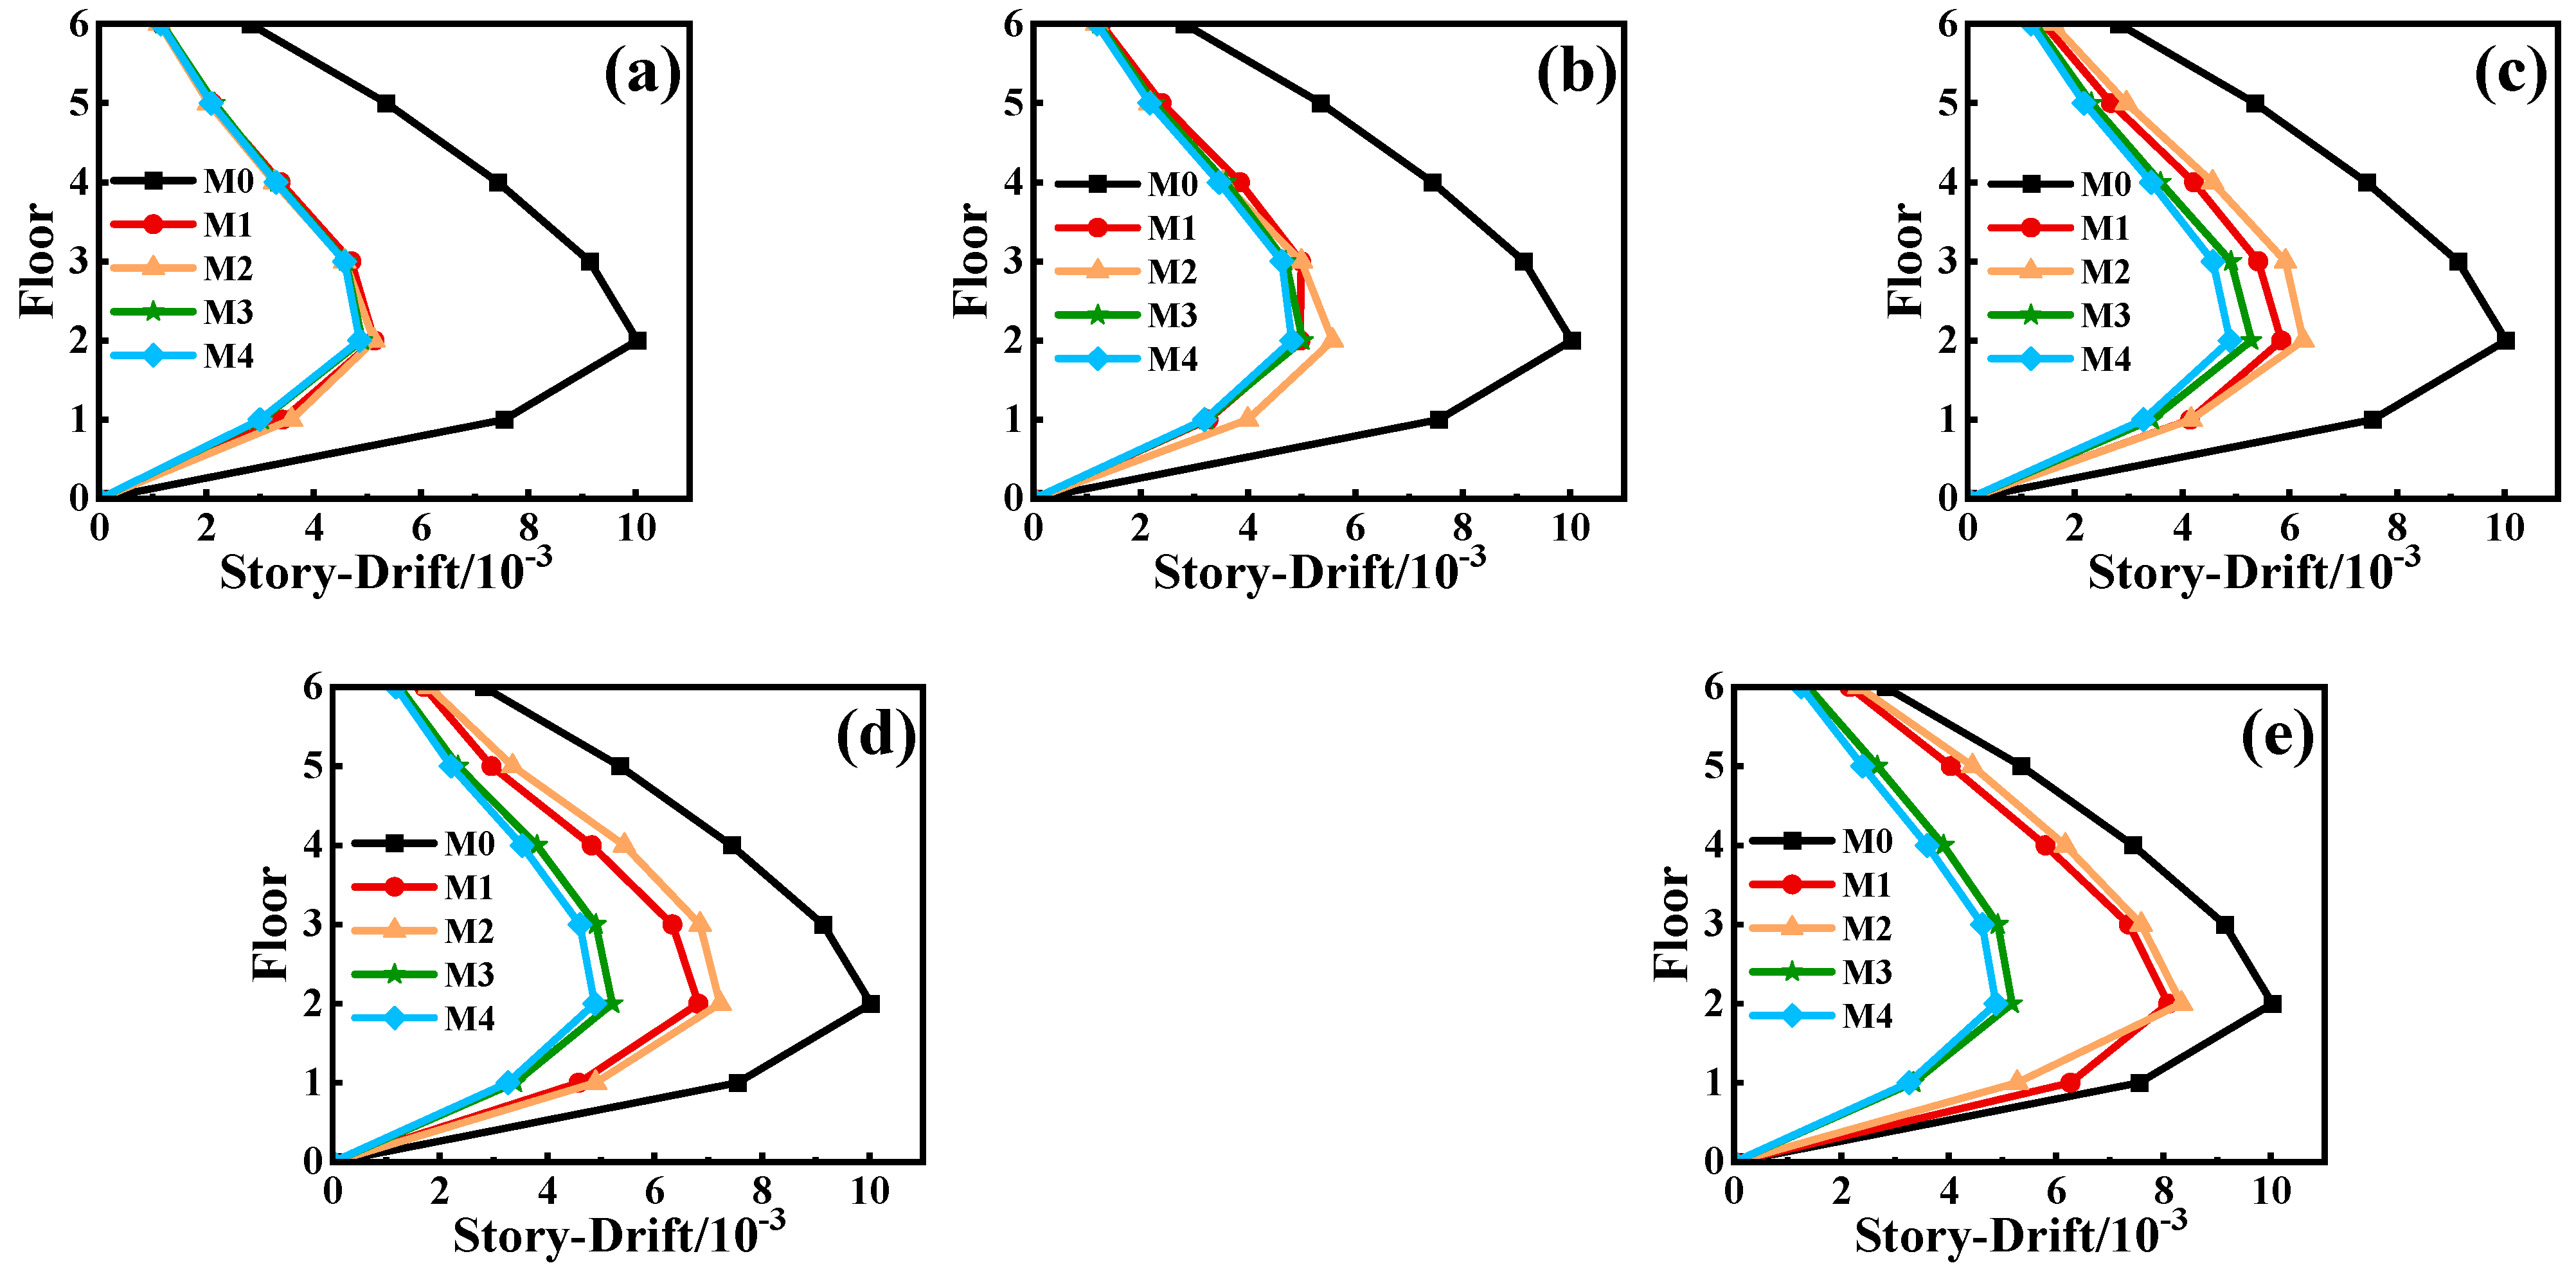
Figure 15 illustrates the inter-story drift ratios for each model. As shown in the figure, regardless of the number of strengthened stories, the inter-story drift ratios of all strengthened models are lower than that of M0. Furthermore, all models remain below the elastic–plastic inter-story drift ratio limit of 1/50 specified in the Chinese code (GB/T50011-2010) [36], indicating that the structures remain within an acceptable safety range. The maximum inter-story drift ratio for both the original and strengthened models occurs at the second story, suggesting that this level may be a weak point in the structure and is more susceptible to seismic effects. As the number of strengthened stories increases, the variation in the inter-story drift ratios between different stories becomes more pronounced, highlighting the significant impact of the strengthening schemes on the structural deformation pattern. When only the first story is strengthened, the inter-story drift ratios for the fourth to sixth stories remain relatively close among the four models, whereas noticeable differences are observed in the first to third stories. This suggests that single-story strengthening does not uniformly enhance the overall stiffness, potentially causing abrupt stiffness transitions and localized increases in inter-story drift. Compared to strengthening only the first story, strengthening both the first and second stories leads to a significant increase in the inter-story drift ratios of stories 1 to 3 in M2 and stories 4 to 5 in M1, while the inter-story drift ratios in M3 and M4 remain nearly unchanged, indicating a more uniform stiffness distribution in the latter two models. Due to the non-uniform increase in stiffness, when the strengthening extends to the first three stories, the inter-story drift ratios of M1 and M2 increase significantly, with M2 exhibiting the most pronounced growth, far exceeding the values observed in other models. In contrast, M3 and M4 experience only slight increases, likely due to the uneven changes in the overall structural stiffness, which introduce fluctuations in the inter-story drift ratios. When the strengthening is extended to the first four and five stories, the inter-story drift ratios in M1 and M2 continue to increase rapidly, significantly surpassing those of M3 and M4. This confirms that asymmetric strengthening induces substantial stiffness irregularities, leading to greater deformation discrepancies among stories. Conversely, M3 and M4 exhibit a slight decrease in their inter-story drift ratios, suggesting that a uniformly distributed strengthening strategy enhances the overall stiffness and promotes a more balanced deformation response. Additionally, the inter-story drift ratio of M3 is slightly higher than that of M4, possibly due to the greater lateral stiffness of M4. In summary, the inter-story drift ratios of all strengthened models are lower than those of the original structure. However, asymmetric strengthening tends to introduce significant stiffness irregularities, resulting in larger floor deformations. Therefore, in practical applications, symmetric strengthening should be prioritized to ensure a more uniform stiffness distribution and improved seismic performance.

5. Conclusions

In this study, a six-story RC frame model was strengthened with a bonded steel plate, and the effect of the symmetry of the strengthening layout on the overall structural seismic performance was investigated. The main conclusions are as follows.
  • All strengthened structures exhibit a shorter fundamental period, indicating that local strengthening effectively enhances the overall stiffness. Quadrangle symmetric strengthening (M3) best improves the torsional stiffness, whereas middle symmetric strengthening (M4) more effectively enhances the lateral stiffness. However, asymmetric strengthening schemes (M1 and M2) yield uneven stiffness distributions, potentially inducing localized vibrations and torsional effects.
  • Symmetric strengthening more effectively improves the lateral stiffness and shear capacity of the structure compared to asymmetric strengthening. Notably, middle symmetric strengthening (M4) increases the lateral load-bearing capacity by 53.6% compared to the original structure.
  • The pushover analysis shows that symmetric strengthening provides greater lateral stiffness and seismic performance reserves. With more strengthened stories, the adverse effects in asymmetric schemes intensify, while the symmetric performance improves steadily.
  • Asymmetric strengthening results in significant stiffness variations, causing torsional effects and larger displacement differences. Increasing the number of strengthened stories sharply elevates the inter-story drift ratios, posing safety risks. Conversely, symmetric strengthening promotes a uniform stiffness distribution, ensuring better deformation coordination and structural integrity. Thus, symmetric strengthening is recommended in high-seismic regions. Asymmetric strengthening is suitable for localized strengthening but requires displacement monitoring and additional torsional control measures.

6. Limitations

While this study has yielded valuable strengthening strategies based on the proposed finite element model, certain limitations inherent to the modeling approach must be acknowledged. First, the investigated model represents a simple, regular multi-story RC frame. Second, the initial structural damage was not considered in the modeling approach [10,40]. In future research, we intend to model irregular or geometrically complex structures while accounting for initial structural damage, with plans to conduct scaled physical model tests to validate the applicability of our theoretical framework. Furthermore, moderate-to-strong seismic actions will be introduced in the model to identify critical structural components requiring strengthening and evaluate the impact of localized retrofitting on the overall seismic performance.

Author Contributions

Conceptualization, G.Z. and D.Z.; methodology, G.Z.; software, C.L. and H.D.; validation, G.Z. and D.Z.; formal analysis, C.L.; investigation, C.L. and H.D.; writing—original draft preparation, C.L.; writing—review and editing, G.Z. and Q.L.; supervision, D.Z. and Q.L.; project administration, D.Z.; Funding acquisition, G.Z. All authors have read and agreed to the published version of the manuscript.

Funding

This research was funded by the National Natural Science Foundation of China, grant number 52478286.

Data Availability Statement

Data will be made available on request.

Acknowledgments

We gratefully acknowledge the support of the National Natural Science Foundation of China.

Conflicts of Interest

Author Qing Li was employed by the company Zhengzhou Ruijie Structure Reinforcing Engineering Co., Ltd. Author Huiying Du was employed by the company Xu Hui Design Co., Ltd. The remaining authors declare that the research was conducted in the absence of any commercial or financial relationships that could be construed as a potential conflict of interest.

References

  1. Khan, F.A.; Khan, S.; Khan, W. Seismic performance of RC-ECC composite frame by eliminating shear reinforcement in beam-column joint: Shake table tests. Adv. Struct. Eng. 2022, 25, 2966–2980. [Google Scholar] [CrossRef]
  2. Yuan, F.; Hu, R. Flexural behaviour of ECC and ECC–concrete composite beams reinforced with hybrid FRP and steel bars. Adv. Struct. Eng. 2021, 24, 3171–3183. [Google Scholar] [CrossRef]
  3. Dautaj, A.; Kadiri, Q.V.; Kabashi, N. Experimental study on the contribution of masonry infill in the behavior of RC frame under seismic loading. Eng. Struct. 2018, 165, 27–37. [Google Scholar] [CrossRef]
  4. Bikçe, M.; Emsen, E.; Erdem, M.M.; Bayrak, O.F. An investigation on behavior of RC frames with non-interacting infill wall. Eng. Struct. 2021, 245, 112920. [Google Scholar] [CrossRef]
  5. Alhusban, M.; Parvin, A. Local Strengthening of Reinforced Concrete Frames Using Textile Reinforced Mortar Jackets under Gravity and Cyclic Loadings. Pract. Period. Struct. Des. Constr. 2023, 28, 04023050. [Google Scholar] [CrossRef]
  6. Alcocer, S.M. RC frame connections rehabilitated by jacketing. J. Struct. Eng.—ASCE 1993, 119, 1413–1431. [Google Scholar] [CrossRef]
  7. Guo, H. The Reliability of Enlarging the Cross-Section in Reinforcing the Frame Construction Buildings. Adv. Mater. Res. 2011, 189–193, 4365–4369. [Google Scholar] [CrossRef]
  8. Cheong, H.K.; MacAlevey, N. Experimental behavior of jacketed reinforced concrete beams. J. Struct. Eng.—ASCE 2000, 126, 692–699. [Google Scholar] [CrossRef]
  9. Zhao, D.P.; Li, K.; Fan, J.J.; Wang, Y.; Zhu, J.T. Shear behavior of RC beams strengthened with high-strength steel strand mesh reinforced ECC: Shear capacity, cracking and deformation. Eng. Struct. 2024, 298, 117081. [Google Scholar] [CrossRef]
  10. Zhao, D.; Wang, S.; Li, K.; Fan, J.; Zhou, X.; Liang, Y. Effect of residual strains in damaged RC beam after unloading on the flexural and shear behaviours of SSS-ECC repaired beams. Eng. Struct. 2025, 332, 120144. [Google Scholar] [CrossRef]
  11. Zhang, Z.; Liu, D.; Abdalla, J.A.; Hawileh, R.A.; Qin, F.; Xu, X. Flexural behavior of reinforced concrete beams externally strengthened with ECC and FRP grid reinforcement. Constr. Build. Mater. 2024, 446, 137964. [Google Scholar] [CrossRef]
  12. Attari, N.; Amziane, S.; Chemrouk, M. Flexural strengthening of concrete beams using CFRP, GFRP and hybrid FRP sheets. Constr. Build. Mater. 2012, 37, 746–757. [Google Scholar] [CrossRef]
  13. Zhao, D.P.; Li, K.; Zhu, J.T.; Fan, J.J.; Yuan, F.G. Shear Performance of RC Beams Strengthened with Steel Strand Wire Mesh-Reinforced Engineered Cementitious Composites under Cyclic Loading. J. Compos. Constr. 2024, 28, 04024058. [Google Scholar] [CrossRef]
  14. Shafighfard, T.; Kazemi, F.; Asgarkhani, N.; Yoo, D.-Y. Machine-learning methods for estimating compressive strength of high-performance alkali-activated concrete. Eng. Appl. Artif. Intell. 2024, 136, 109053. [Google Scholar] [CrossRef]
  15. Shafighfard, T.; Kazemi, F.; Bagherzadeh, F.; Mieloszyk, M.; Yoo, D.-Y. Chained machine learning model for predicting load capacity and ductility of steel fiber–reinforced concrete beams. Comput.—Aided Civ. Infrastruct. Eng. 2024, 39, 3573–3594. [Google Scholar] [CrossRef]
  16. Arslan, G.; Sevuk, F.; Ekiz, I. Steel plate contribution to load-carrying capacity of retrofitted RC beams. Constr. Build. Mater. 2008, 22, 143–153. [Google Scholar] [CrossRef]
  17. Ciampa, E.; Ceroni, F.; De Angelis, A.; Pecce, M.R. Bond tests on concrete elements externally bonded with steel plates and assessment of bond strength models. Eng. Struct. 2023, 296, 116835. [Google Scholar] [CrossRef]
  18. Zhang, G.H.; Song, C.Z.; Han, X.H.; Lu, B. Research on the development of low-temperature-resistant fast-curing structural adhesive and steel plate strengthening concrete beam flexural test. Civ. Eng. J.—Staveb. Obz. 2024, 33, 78–91. [Google Scholar] [CrossRef]
  19. Tang, F.; Yao, Y.; Yang, S. Corrosion mechanism and resistance of g-C3N5@PDA nanosheets modified epoxy-coated carbon steel. Prog. Org. Coat. 2025, 200, 109048. [Google Scholar] [CrossRef]
  20. Tena-Colunga, A.; Godínez-Domínguez, E.A.; Hernández-Ramírez, H. Seismic retrofit and strengthening of buildings. Observations from the 2017 Puebla-Morelos earthquake in Mexico City. J. Build. Eng. 2022, 47, 103916. [Google Scholar] [CrossRef]
  21. Ren, H.M.; Zhang, F.W.; Mao, C.X.; Fan, Q.Q.; Lu, Z. Numerical and experimental analysis in seismic performance of post-earthquake reinforced concrete frame retrofitted with ECC. Adv. Struct. Eng. 2024, 27, 3–16. [Google Scholar] [CrossRef]
  22. Baran, M. Comparison of seismic performances of reinforced concrete frames strengthened by different techniques. Lat. Am. J. Solids Struct. 2021, 18, e350. [Google Scholar] [CrossRef]
  23. Sadeq, S.F.; Muhammad, B.R.; Al-zuheriy, A.J. Seismic behaviour of rc building located in erbil, Iraq and strengthening by using steel frame sections precast bolt-connected steel-plate reinforced concrete. IOP Conf. Ser. Earth Environ. Sci. 2022, 961, 012012. [Google Scholar] [CrossRef]
  24. Zhang, W.; Xu, S.; Li, Q. Influence of Local Members Strengthening on Overall Performance of Reinforced Concrete Frame Structure. J. Disaster Prev. Mitig. Eng. 2013, 33, 140–146. [Google Scholar]
  25. GB 55021-2021; General Code for Assessment and Rehabilitation of Existing Buildings. China Architecture and Architecture Press: Beijing, China, 2021.
  26. GB/T228.1-2021; Metallic Materials—Tensile Testing—Part 1: Method of Test at Room Temperature. China Architecture and Architecture Press: Beijing, China, 2021.
  27. JG/T 271-2019; Structural Adhesives for Strengthening Structures with Steel Plate. China Architecture and Building Press: Beijing, China, 2019.
  28. Paul, G.; Agarwal, P. Experimental verification of seismic evaluation of RC frame building designed as per previous is codes before and after retrofitting by using steel bracing. Asian J. Civ. Eng. 2012, 13, 165–179. Available online: https://sid.ir/paper/298922/en (accessed on 14 April 2025).
  29. Moehle, J. Seismic Design of the Reinforced Concrete Buildings; McGraw Hill Professional: New York, NY, USA, 2014. [Google Scholar]
  30. Aboualam, M.O.; Maree, A.F.; Maksoud, A.M.A.; Tork, B.S. Monorail guideway structures performance under seismic loads. Structures 2024, 70, 107793. [Google Scholar] [CrossRef]
  31. Romero, M.; Museros, P. Learning Structural Analysis with K’NEX and SAP2000: A Practical Experience in Spain. Comput. Civ. Build. Eng. 2000, 2000, 1141–1147. [Google Scholar] [CrossRef]
  32. ASTM C109/C109M-16a; Standard Test Method for Compressive Strength of Hydraulic Cement Mortars (Using 2-in. or [50-mm] Cube Specimens). ASTM International: West Conshohocken, PA, USA, 2016.
  33. Qin, F.; Zhang, Z.; Yin, Z.; Di, J.; Xu, L.; Xu, X. Use of high strength, high ductility engineered cementitious composites (ECC) to enhance the flexural performance of reinforced concrete beams. J. Build. Eng. 2020, 32, 101746. [Google Scholar] [CrossRef]
  34. Mander, J.B.; Priestley, M.J.N.; Park, R. Theoretical Stress-Strain Model for Confined Concrete. J. Struct. Eng. 1988, 114, 1804–1826. [Google Scholar] [CrossRef]
  35. GB 50009-2012; Load Code for the Design of Building Structures. China Architecture and Architecture Press: Beijing, China, 2012.
  36. GB/T50011-2010; Code for Seismic Design of Buildings. China Architecture and Architecture Press: Beijing, China, 2024.
  37. JGJ3-2010; Technical Specification for Concrete Structures of Tall Building. China Architecture and Building Press: Beijing, China, 2010.
  38. Applied Technology Council. Seismic Evaluation and Retrofit of Concrete Buildings, Report No. SSC 96-01: ATC-40 1; California Seismic Safety Commission: West Sacramento, CA, USA, 1996. [Google Scholar]
  39. GB 55002-2021; General Code for Seismic Precaution of Buildings and Municipal Engineering. China Architecture and Architecture Press: Beijing, China, 2021.
  40. Yurdakul, Ö.; Vnenk, P.; Routil, L.; Culek, B.; Avşar, Ö. Post-damage recovery of substandard RC columns by CFRPs. Eng. Struct. 2024, 306, 117806. [Google Scholar] [CrossRef]
Figure 1. Detailed framework structure, where KZ is frame column, KL is frame beam: (a) floor plan of levels 1–5, (b) floor plan of level 6, (c) cross-sectional view of the framework, (d) reinforcement details of beams, columns, and slabs.
Buildings 15 01326 g001aBuildings 15 01326 g001b
Figure 2. Detailed diagram of strengthening scheme: (a) scheme one, (b) scheme two, (c) scheme three, (d) scheme four, (e) strengthening section.
Buildings 15 01326 g002
Figure 3. Steel sample.
Buildings 15 01326 g003
Figure 4. RC frame model details (The red curved arrow represents the moment and the red straight arrow represents the axial force).
Buildings 15 01326 g004
Figure 5. Material constitutive relation: (a) concrete, (b) steel bar and steel plate, (c) Mander confined concrete.
Buildings 15 01326 g005
Figure 6. Mode shapes of M0 in the first three modes: (a) first mode, (b) second mode, (c) third mode.
Buildings 15 01326 g006
Figure 7. First mode shape of the models before and after strengthening: (a) M0, (b) M1, (c) M2, (d) M3, (e) M4.
Buildings 15 01326 g007
Figure 8. Thirteenth mode shape of the models before and after strengthening: (a) M0, (b) M1, (c) M2, (d) M3, (e) M4.
Buildings 15 01326 g008
Figure 9. Fourteenth mode shape of the models before and after strengthening: (a) M0, (b) M1, (c) M2, (d) M3, (e) M4.
Buildings 15 01326 g009
Figure 10. Variations in structural periods and period ratios with different numbers of strengthened stories: (a) strengthening only the first story, (b) strengthening the first two stories, (c) strengthening the first three stories, (d) strengthening the first four stories, (e) strengthening the first five stories, (f) variation in period ratio with the number of strengthened stories.
Buildings 15 01326 g010
Figure 11. Base shear–vertex displacement curves of each model: (a) strengthening only the first story, (b) strengthening the first two stories, (c) strengthening the first three stories, (d) strengthening the first four stories, (e) strengthening the first five stories.
Buildings 15 01326 g011
Figure 12. Base shear and top displacement at the performance point for different numbers of strengthened stories: (a) schematic diagram of the performance point, the red curve represents the demand spectrum, the green curve represents the capacity spectrum. (b) strengthening only the first story, (c) strengthening the first two stories, (d) strengthening the first three stories, (e) strengthening the first four stories, (f) strengthening the first five stories.
Buildings 15 01326 g012
Figure 13. Floor displacement of M1 under different numbers of strengthened stories: (ae) floor displacement at axis 1 from strengthening only the first story to strengthening the first five stories, (fj) floor displacement at axis 9 from strengthening only the first story to strengthening the first five stories.
Buildings 15 01326 g013aBuildings 15 01326 g013b
Figure 14. Floor displacement of M2 under different numbers of strengthened stories: (ae) floor displacement at axis 1 from strengthening only the first story to strengthening the first five stories, (fj) floor displacement at axis 9 from strengthening only the first story to strengthening the first five stories.
Buildings 15 01326 g014aBuildings 15 01326 g014b
Figure 15. Inter-story drift ratios of each model: (a) strengthening only the first story, (b) strengthening the first two stories, (c) strengthening the first three stories, (d) strengthening the first four stories, (e) strengthening the first five stories.
Buildings 15 01326 g015
Table 1. Strengthening scheme design.
NumberStrengthening PositionStrengthening Level
M1single-corner asymmetric1, 1~2, 1~3, 1~4, 1~5
M2single-end asymmetric1, 1~2, 1~3, 1~4, 1~5
M3quadrangle symmetric1, 1~2, 1~3, 1~4, 1~5
M4central symmetric1, 1~2, 1~3, 1~4, 1~5
Table 2. Experimental data on material properties.
MaterialCompressive Strength (MPa)Yield
Strength (MPa)
Tensile Strength (MPa)Shear Strength (MPa)Bending Strength (MPa)
AvgCovAvgCovAvgCovAvgCovAvgCov
Steel plate2 mm411.70.006510.00.002
3 mm423.70.001511.00.002
4 mm417.30.001531.30.002
5 mm425.70.002513.30.002
6 mm404.30.002525.00.002
8 mm446.70.002543.70.002
10 mm447.70.004523.00.003
Adhesive80.754.425.275.8
Disclaimer/Publisher’s Note: The statements, opinions and data contained in all publications are solely those of the individual author(s) and contributor(s) and not of MDPI and/or the editor(s). MDPI and/or the editor(s) disclaim responsibility for any injury to people or property resulting from any ideas, methods, instructions or products referred to in the content.