Article

Artificial Neural Network Model for Evaluating Load Capacity of RC Deep Beams

1
Department of Building and Construction Techniques Engineering, Northern Technical University, Mosul 41000, Iraq
2
Department of Geomatics Techniques Engineering, Northern Technical University, Mosul 41000, Iraq
3
Department of Engineering and Chemical Sciences, Karlstad University, 651 88 Karlstad, Sweden
*
Author to whom correspondence should be addressed.
Buildings 2025, 15(8), 1371; https://doi.org/10.3390/buildings15081371
Submission received: 27 March 2025 / Revised: 11 April 2025 / Accepted: 18 April 2025 / Published: 20 April 2025
(This article belongs to the Section Building Structures)

Abstract

:
Using artificial neural networks (ANN), numerous models were developed for predicting the ultimate shear strength of reinforced concrete deep beams. Many experimental result databases from earlier research were carefully gathered for this study. Two hundred fifty-three findings from experiments were included in this database. The ultimate shear strength was the output parameter, while ten factors were determined as input parameters for the ANN model based on the completed literature research. The required model was constructed using a back propagation neural network. The model of the neural networks was determined using the trial-and-error method. It was discovered that, inside the range of the input boundaries considered, the ANN model could accurately estimate the ultimate shear strength of deep beams. The measured shear strength and the shear strength predicted by the ANN model have a high correlation coefficient of 0.97, indicating a strong relationship between the predicted and actual values. The results show that, given the range of input parameters, ANN offers an excellent agreement of interest as a practical technique for estimating the ultimate shear strength. A parametric investigation was performed using the trained neural network model to assess how the input parameters affected the shear strength capacity of deep beams.

1. Introduction

Deep beams are essential to many concrete structures, especially those that need to support heavy loads with negligible deflection. They are frequently utilized in foundations: deep beams efficiently transfer loads to the ground, providing stability and support for structures, particularly multi-story buildings. For example, deep beams support multi-story buildings against seismic load to help create open-free areas of columns, increasing the design’s architectural flexibility. By increasing the beam’s depth while maintaining the stable extension’s length, the member becomes very solid, transferring the practical load over the tension and compression areas (strut and tie method) instead of bending and shear (see Figure 1). This can be indicated as the membrane, while such a member has historically been identified as the deep beam [1,2,3].
There is currently no worldwide agreement on distinguishing between deep and shallow beams. For example, in [1,4], the guide uses the length/depth ratio to decide the deep reinforced beam, while the Canadian code [5] employs the length/depth of the shear concept. The CEB-FIP [4] treated the continual support as a deep beam when the length/depth was less than 2 and 2.5, respectively.
For flexural applications, ACI code 318-19 [1] designates a beam as deep if its apparent span to depth ratio is less than 1.25 for supported beams and 2.5 for continuous beams. For shear applications, it is classified as a deep beam if its clear-span/depth percentage is fewer than five for beams supported on one face and supported on the opposite face to allow for the development of compression struts between loads and supports [4]. According to ACI code 318-19 [1], in order to generate compression struts among the loads and supports, deep beams are elements that are stressed on one face with support on the other. They can have concerted loads within double the depth from their support side, or clear lengths that are at least four times the total component depth. If a beam’s cross-sectional depth to active length is above specific limits, the Euro code designates it as a deep beam, as shown in below: [6].
  • Simple beams h/le > 0.5
  • Continuous beam end spans h/le > 0.4
  • Continuous beam inner spans h/le > 0.3
  • Cantilever beams h/le > 1
where h is the depth of the beam and le represents the effective span length.

1.1. The Problem of Deep Beams

Because of the rapid and brittle failure caused by shear act and the absence of logical calculations in building regulations, structural engineers are still concerned about the behavior and design of reinforced concrete deep beams under shear. Shear failure styles, fight mechanisms in fractured steps, and the importance of different elements are now being discussed by researchers. There is currently no well-recognized method for forecasting the strength of RC deep beams, despite much investigation. This is mostly because reinforced concrete beam failures exhibit extremely nonlinear behavior [2].
Furthermore, there is no reliable theory for predicting the ultimate shearing force of a deep beam. In addition, the vast number of parameters controlling beam strength directed to an incomplete understanding of shear failure. Various theories and formulas exist for predicting the deep beam capacity, but none produces an accurate solution [1,5,6,7,8]. Many researchers use neural networks as a modeling approach [9,10,11,12,13]. As a result, our research goals to develop an Excel model that can predict the ultimate strength of deep beams based on neural network techniques. A simple model requires little user knowledge and works with Excel. The findings from this study provide a more reliable predictive model that can accommodate the complexities associated with deep beam behavior. By leveraging neural networks’ capabilities, we hope to enhance the understanding of shear failure mechanisms and improve engineering practices in structural design. This research has practical implications, as it can guide engineers in predicting the strength of RC deep beams and contribute to the development of more effective design practices.

1.2. Behavior of Deep Beams

A compression thrust connects the load with the reaction in deep beams, carrying a large quality of stress to the supports. The strut-and-tie model depends on diagonal compression and tension along beam bars. This linked arch movement is known as the force transfer mechanism of deep beams. A ‘compression strut’ is a structural element that carries compression forces in a diagonal direction, and it might fail due to compression strut crushing or beam bar anchorage loss [2]. Shear forces, compared to flexural ones, largely control deep beams. Directly acting on the supports, ‘arch action’ is a structural behavior where the beam’s curvature and the compressive forces it generates act like an arch, applying a considerable compressive force. Only if the deep beam is intact can a linear elastic analysis be considered valid. But, in most deep beams, tensile cracks usually appear between one-third and one-half of the ultimate load. As a result, tension reinforcement is considered while designing deep beams. Plane stress in concrete may be calculated because the principle loads and responses work inside the member’s plane [2].
Based on earlier studies like [14,15,16], several fundamental factors govern the shear strength of deep beams, covering the concrete’s cylinder compressive strength, shear span, the adequate depth of the beam, the beam thickness, and effective span. In addition to those mentioned above, more characteristics are crucial for the behavior of deep beams. These include the bearing and loading zone dimensions and the anchoring of longitudinal steel into supports [17]. In a complete shear failure, the deep beam would nearly shear off from the support, with the crack shape almost vertical or following the direction of the compression trajectory. Therefore, furthermore vertical shear reinforcement laterally to the span, deep beams require horizontal reinforcement through the height of the beam to prevent vertical cracking.

1.3. Scope and Motivation of the Research

The main problem with deep beams arises from the fact that several parameters that affect the shear behavior lead to a imperfect understanding of the shear behaviors and the prediction of the ultimate capacity, see [18,19]. Li [7] mentions that, although much research has been conducted, no agreed-upon logical procedure is available for forecasting the power of deep reinforced concrete beams. This is mostly due to the non-linear behavior related with the failure of reinforced concrete beams, which several researchers have described.

1.4. Research Objectives

These are the study’s goals:
Creating an artificial intelligence model that can forecast the deep beams’ maximum load capacity.
-
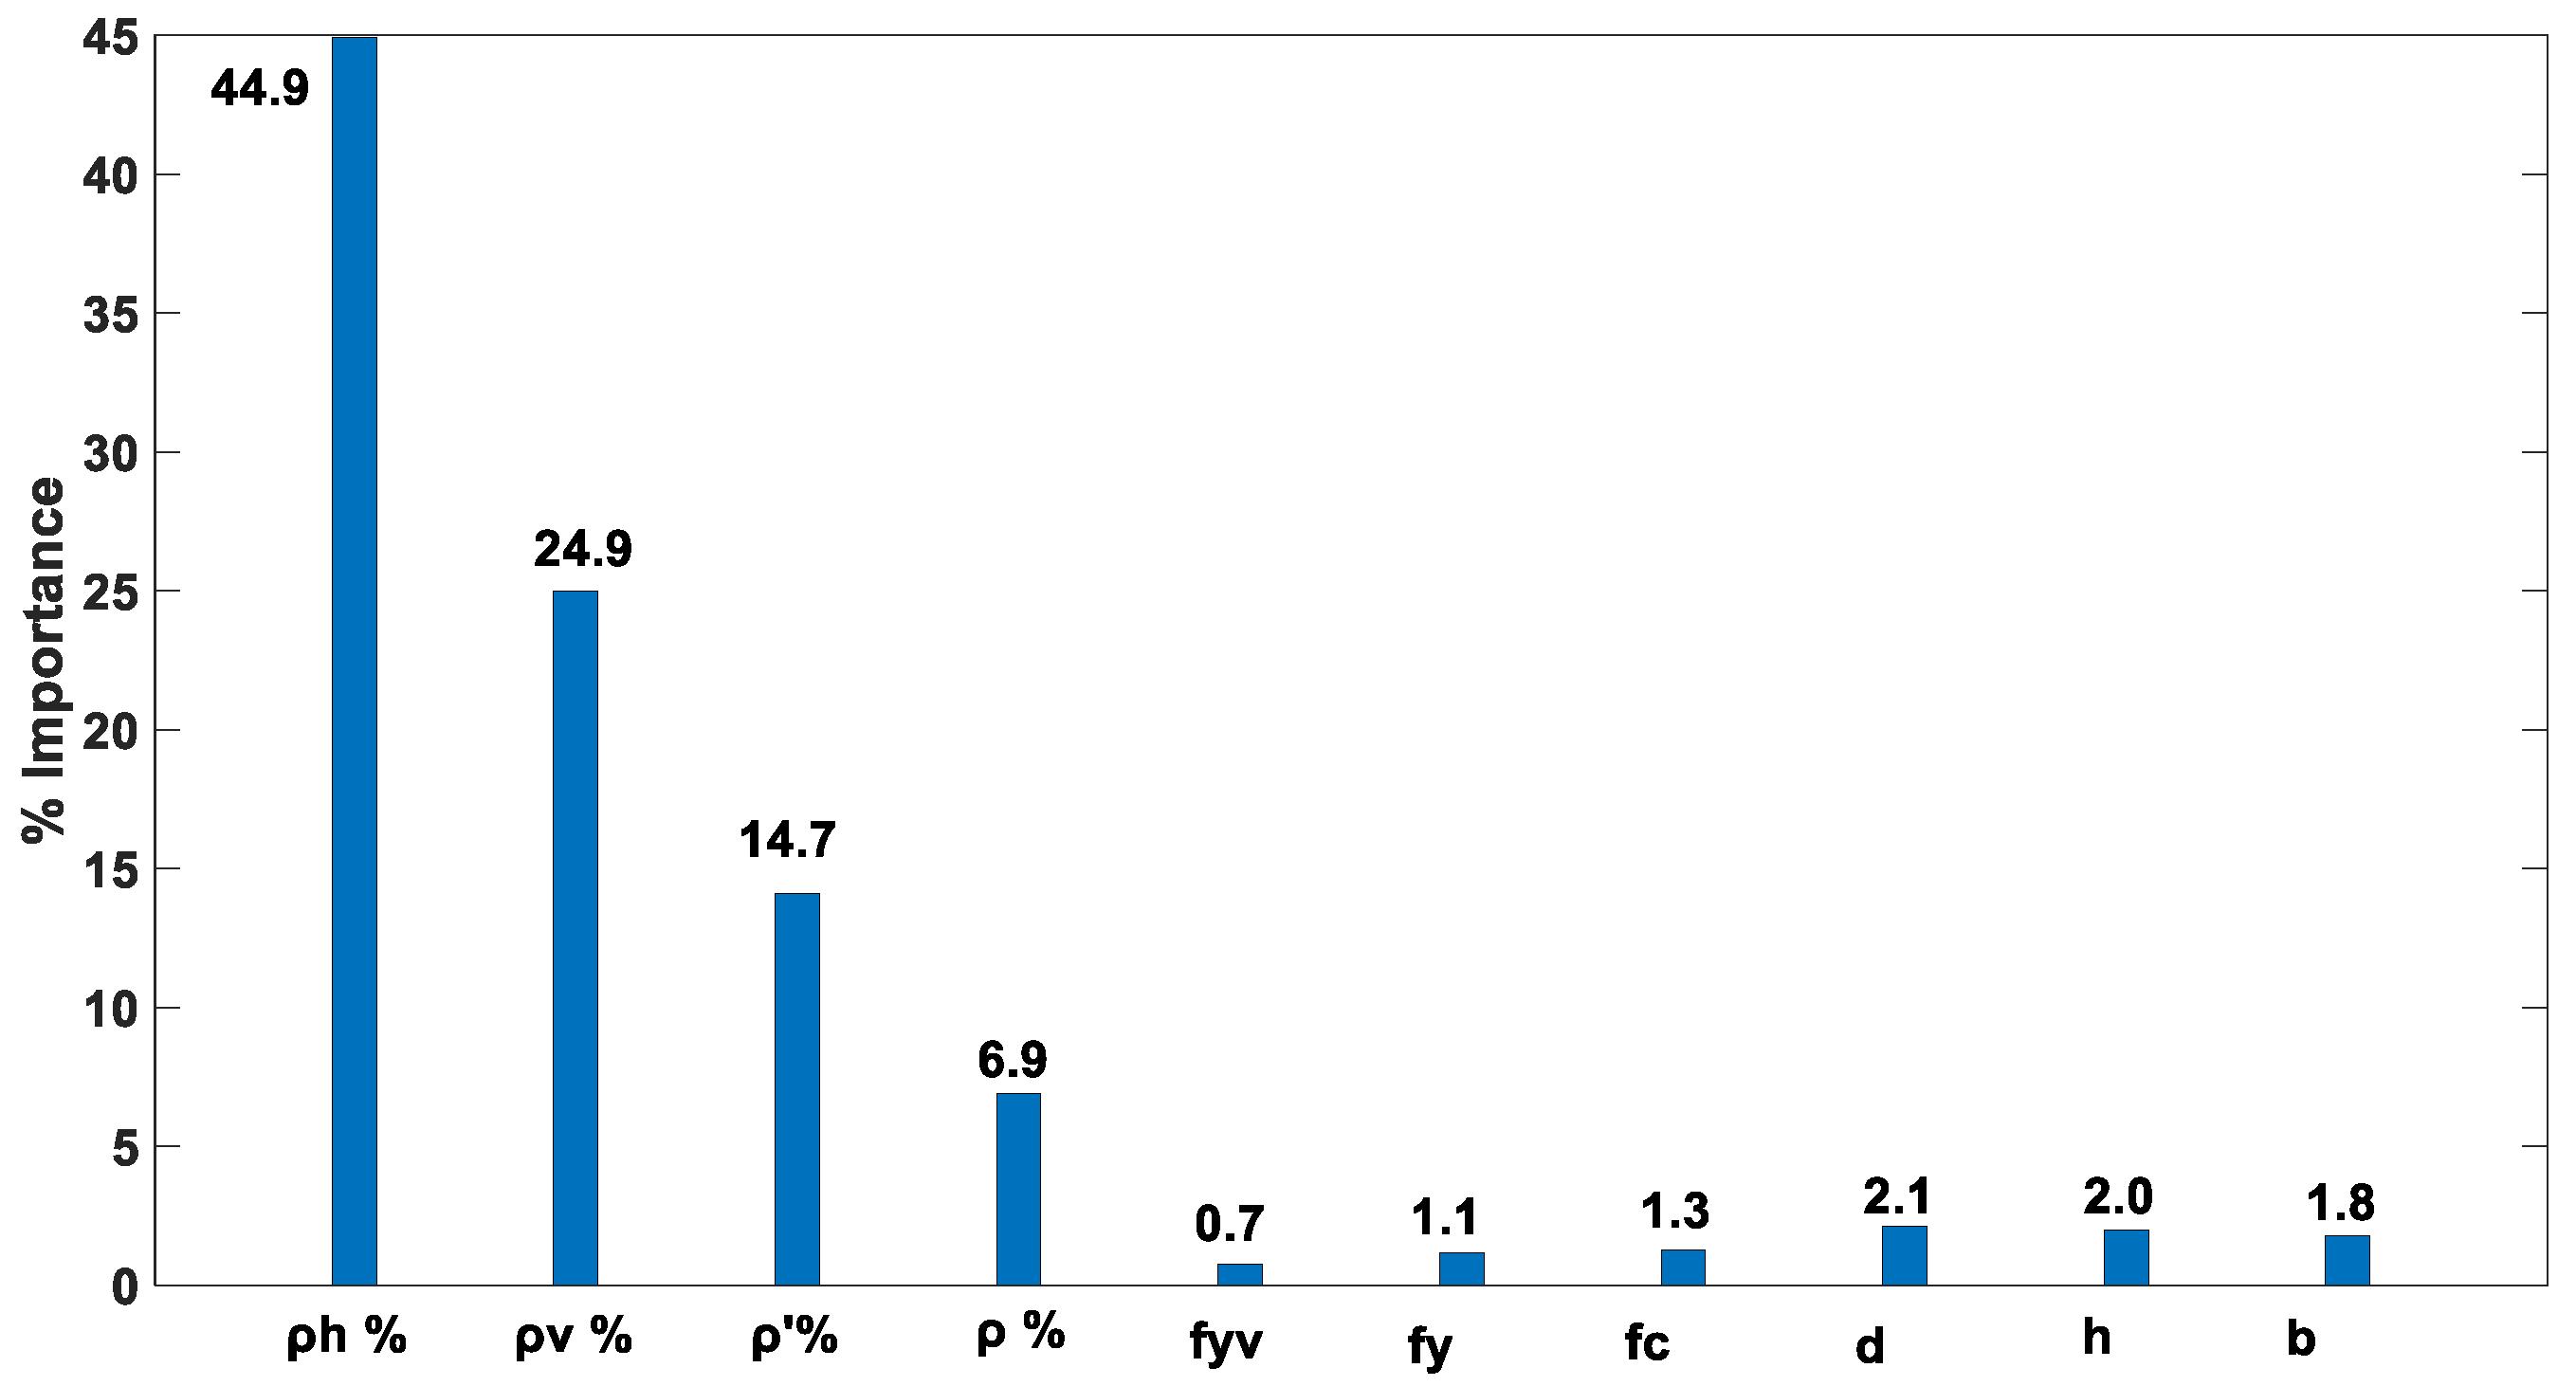
A standard investigation using the trained neural network is conducted to determine the importance of each criterion that affects the shear capacity of the deep beams.
Comparing the expected capacity of the deep beams using ANN with those measured from experimental lab.
-
An equation from the practical results is derived to estimate the ultimate of the deep beams.
-
Study the influence of each input factor on the strength capacity of the deep beams is conducted.

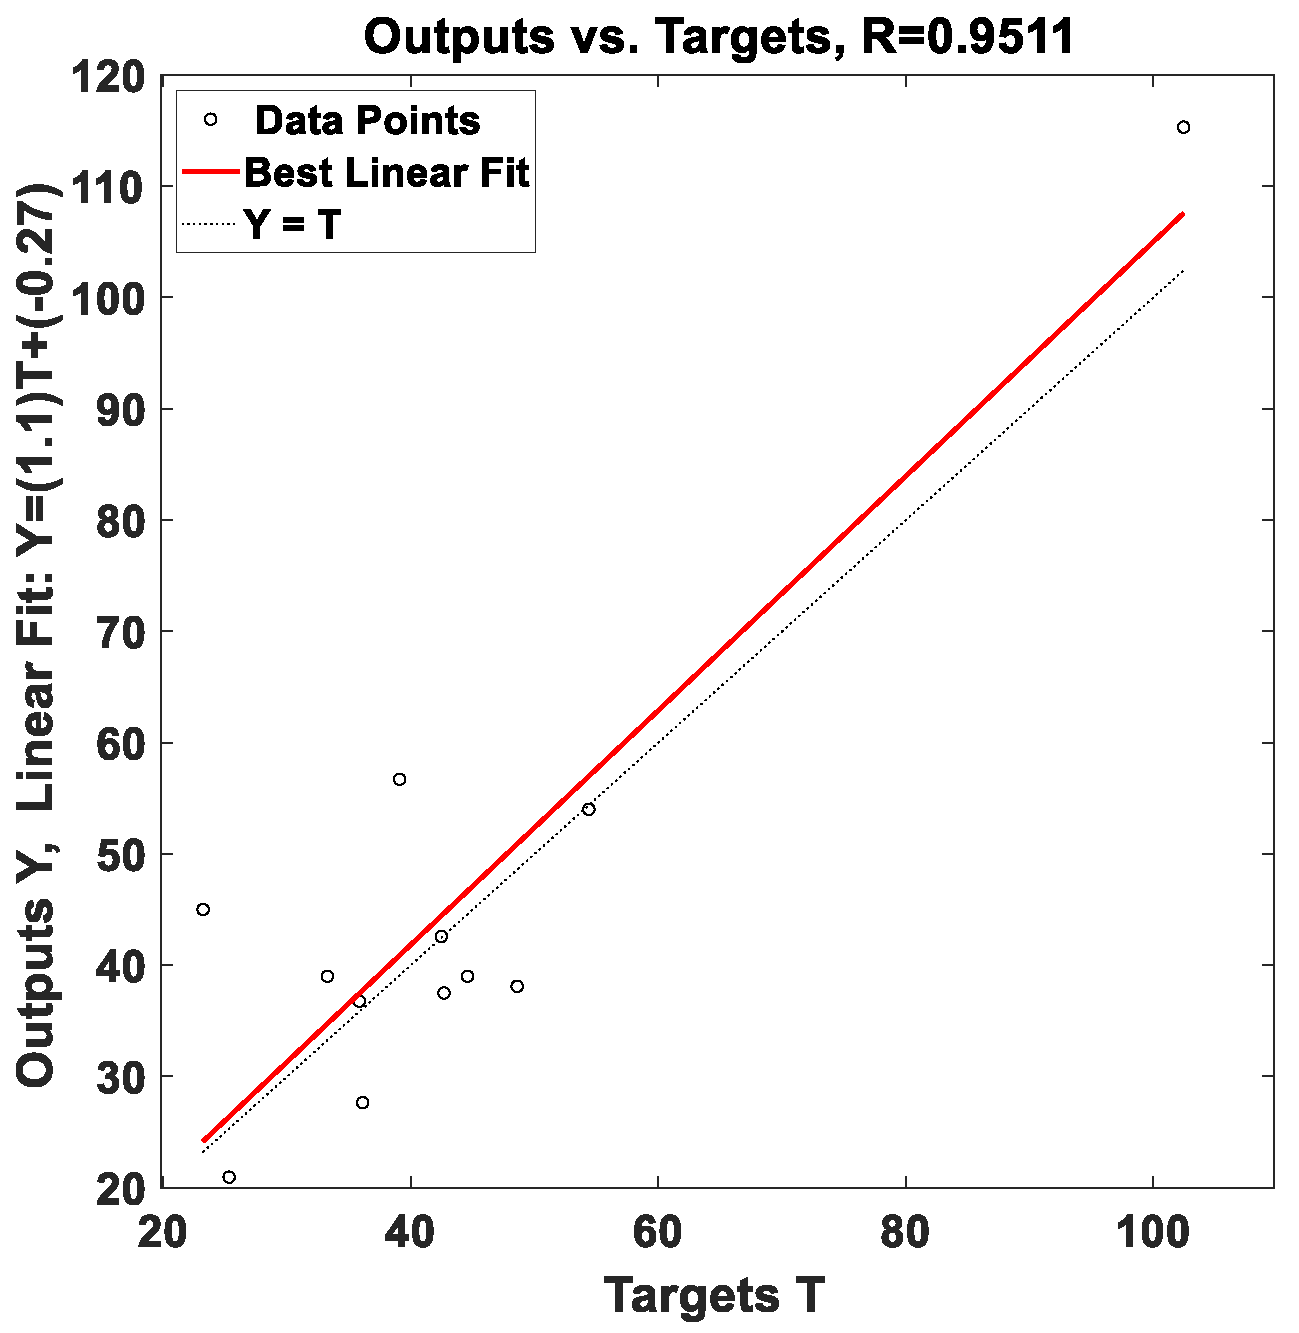
2. Artificial Neural Networks

Many people utilize artificial neural networks (ANNs) to approximate complicated schemes that are hard to represent via traditional modelling methods, such as mathematical modeling. They solve various structural, geotechnical, and management issues in civil engineering. Perception Training was performed using multilayer networks and a back-propagation technique. The neural network under study as developed and trained using the multi-layer feed forward back-propagation technique, which employs the sigmoid transform function.
An ANN is a collection of many linked processing elements, often named nodes or neurons. Unidirectional communication channels, or connections, bind the neurons together. Numbers, typically called weights, represent the strength of the networks between the neurons. A collection of weights stores knowledge. Each processing element (PE) aggregates the weighted input signals and incorporates a threshold value or bias (j). This combined input (Ij) is then processed by a nonlinear transfer function, such as a sigmoid function, to produce the PE output (yj). One PE’s output provides the subsequent stage’s PE input. An inefficient trial-and-error method is needed to determine the optimal amount of hidden neurons for a network’s performance. Each link has a weight that modifies the output of the neurons. To achieve exact results, these weights are adjusted during the training process [10]. An ANN can also be described as a type of artificial intelligence that attempts to replicate the life face of the human brain and nervous scheme through their architecture [11]. For additional information regarding the ANN, see, for instance [9,20].

Data Collection and Preparation

The ultimate shear capacity of deep beams with varying dimensions, reinforcement, and characteristics has been the subject of numerous previous studies. The ANN can be trained on prior data if the same information is required to benefit from it, as shown in Table 1. There are 253 deep concrete beams in the current study [14,15,16,17,18,21,22,23,24,25,26,27,28,29,30,31]. Two hundred twenty-five beams were used for neural network training, and the remaining twenty-eight beams were used to evaluate (test) the model taken from the training data.
Figure 2 shows how the neural network was used to train the data until the coefficient of correlation was 0.96, suggesting that the resistance capacity of the deep beams using the neural network produces results nearly identical to those gathered from earlier practical studies. The ultimate load capacity estimated using the ANN model was comparable to the estimated capacity force in experimental investigations, indicating the same compatibility when testing the 28 data points. Figure 3 illustrates this.

3. Results and Discussion

At the start of the data analysis, the ten input parameters displayed in Table 1 were examined. The partitioning weights approach, which was suggested by Garson [32], was applied in this work to estimate the virtual significance of the different input factors.
Figure 4 shows that the horizontal reinforcement ratio in the model was most likely to influence the deep beam’s final shear capacity at 44%. The vertical reinforcing ratio of concrete deep beams came next with a 24.9% impact. The third effect ratio, with a ratio of 14.7, shows the percentage of reinforcement in the compression zone. The reinforcement ratio in the tensile zone came in fourth and was 6.9%. The remaining components were negligible, with each factor being close to 2%.

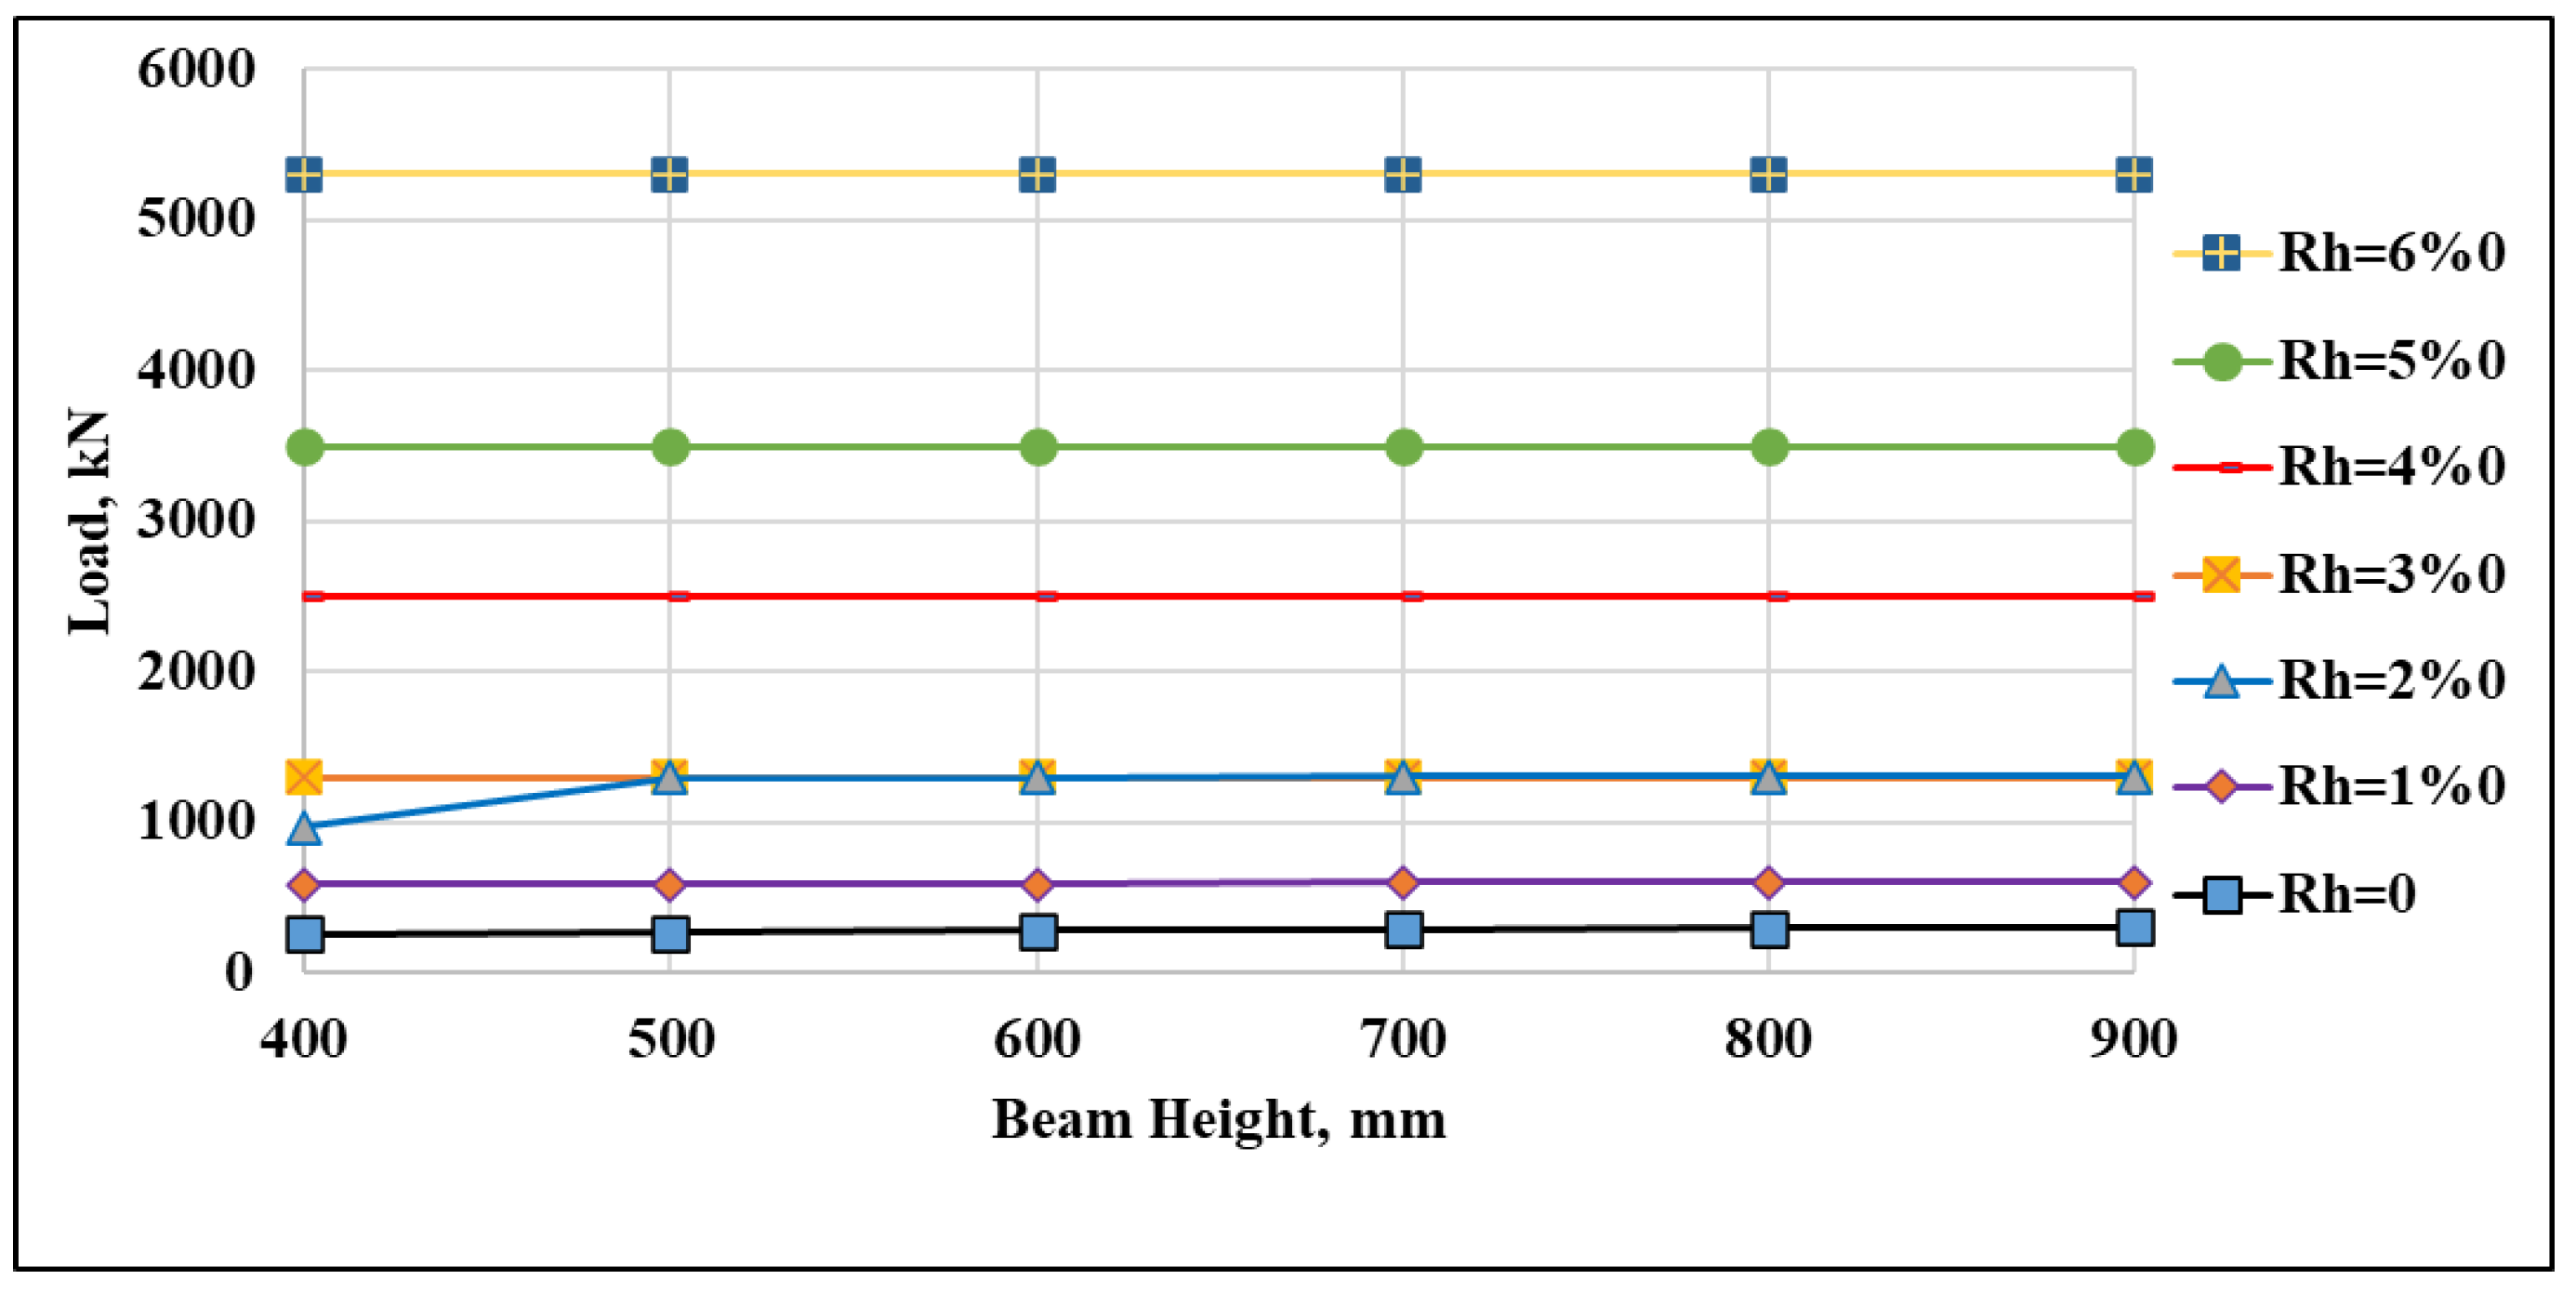
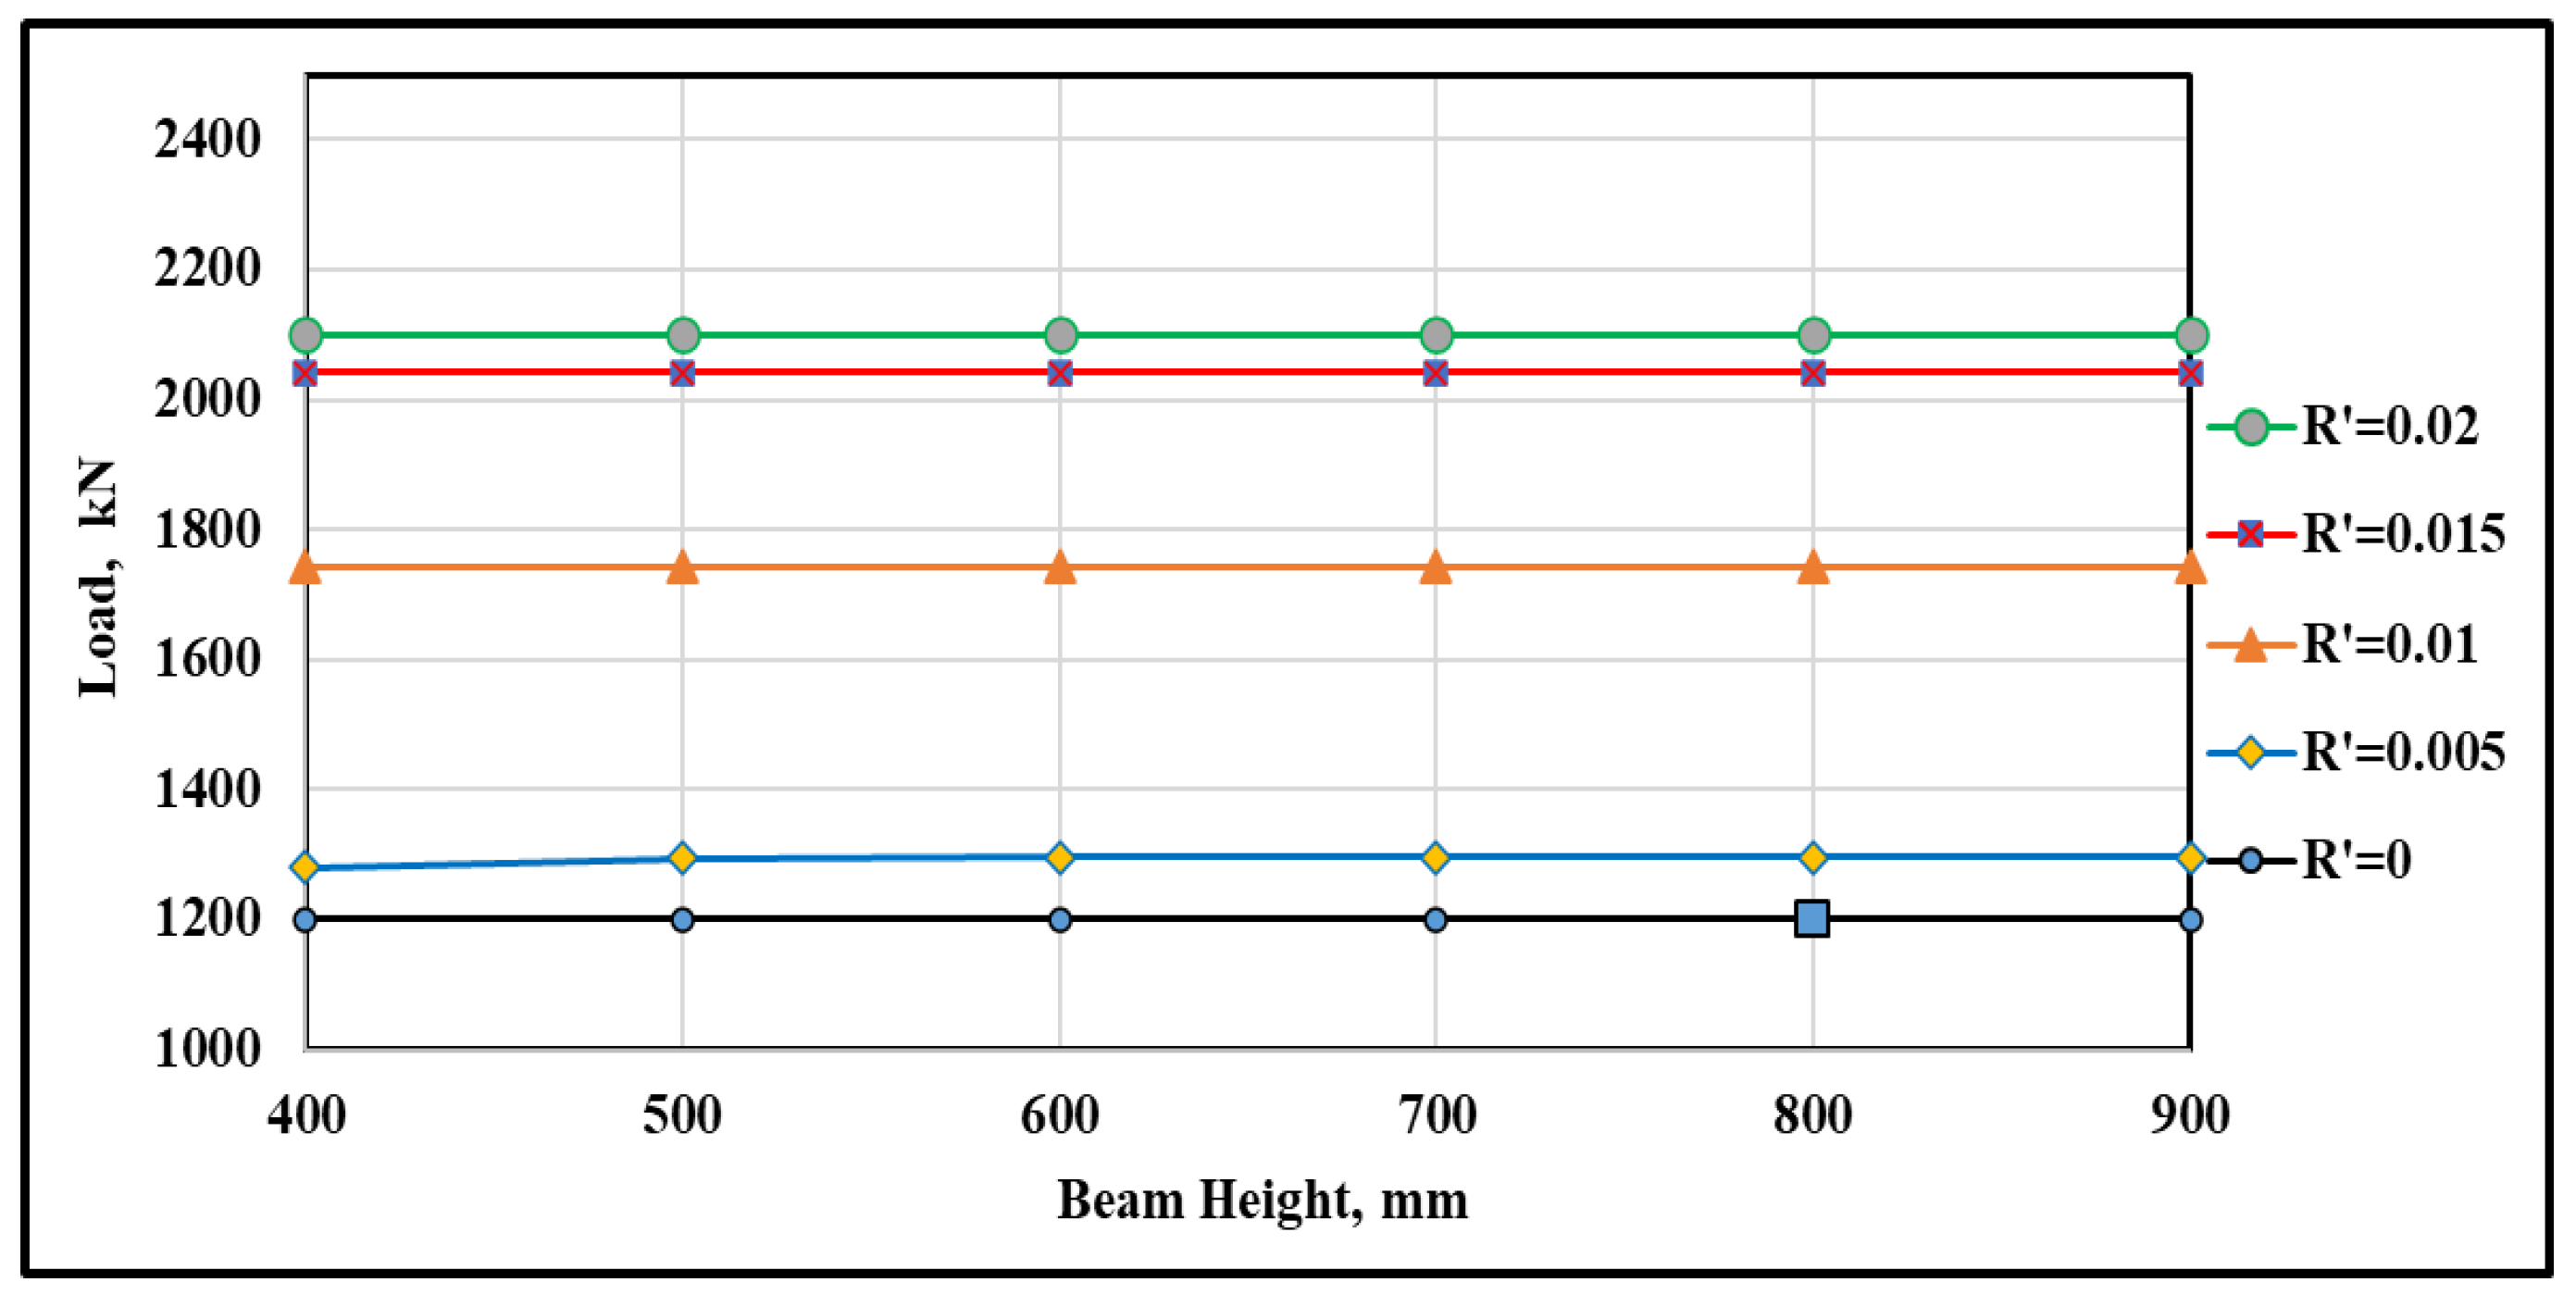
3.1. Influence of the Horizontal Reinforcement %

When horizontal reinforcement is leaning perpendicular to the main axis of diagonal cracks, it effectively reduces the size of cracks and increases the strength of deep beams. The beam’s resistance to shear stresses is enhanced by this procedure [33] Figure 5 shows the effect of the horizontal reinforcing ratio on the deep concrete beams’ ultimate capacity. Deep beams seem to have a greater capacity for higher reinforcement ratios, which agrees with the conclusions of other practical investigations [33,34]. By containing the concrete [33,35] and growing the efficiency of diagonal compression struts, horizontal reinforcement helps deep beams resist shear. Research indicates that increasing the horizontal reinforcement ratio increases the ultimate load capacity, although this effect is typically less noticeable than longitudinal reinforcement or vertical stirrups.

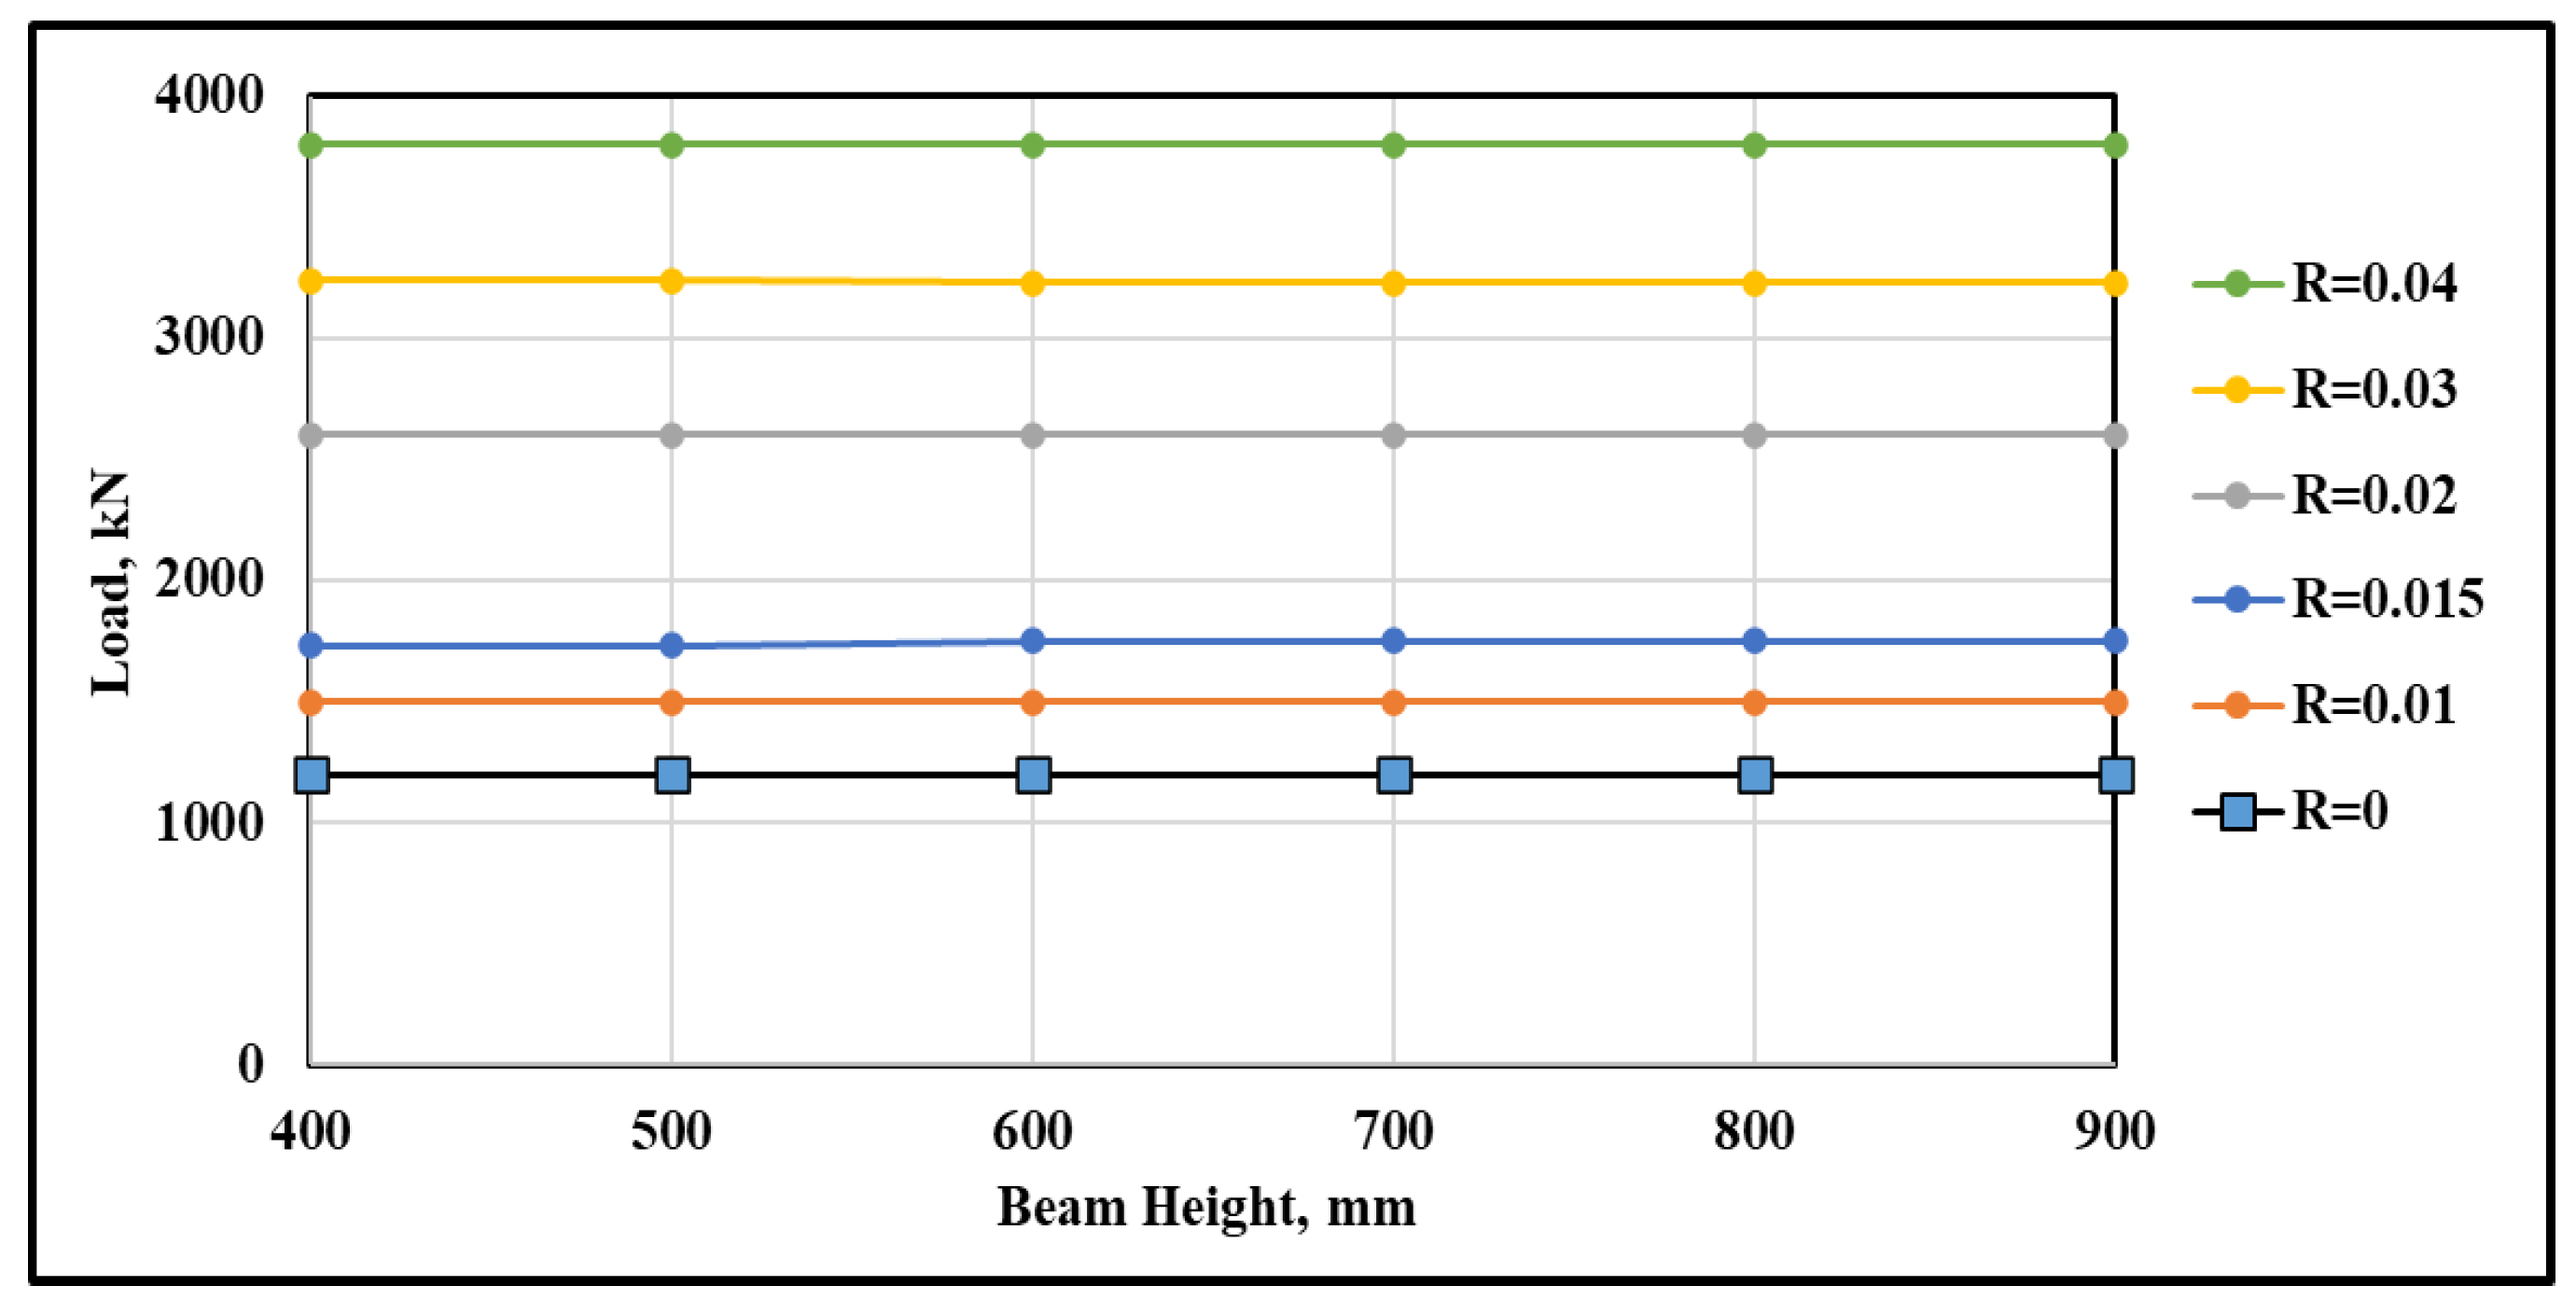
3.2. Influence of the Vertical Reinforcement %

Cracking and ultimate loads can be improved by growing the proportion of vertical shear reinforcement. Figure 6 illustrates the impact of the vertical reinforcing ratio on the deep concrete beams’ ultimate capacity. Deep beams have a bigger capacity due to a higher vertical reinforcement ratio. This behavior matches [30,35] other helpful researchers’ results.

3.3. Influence of the Compression Reinforcement %

The percentage of compression reinforcement has a main influence on deep beams’ strength. The basic idea is that deep beams’ shear strength capacity is increased by increasing reinforcement ratios; however, detailed studies on compression reinforcement are less in-depth. Figure 7 displays the effect of reinforcement in the compression area. The reinforcement on the web exhibited the same behavior. The resistance of the deep beam increases with the compression zone reinforcement [33,34]. It should be mentioned that concrete struts with compression reinforcement can achieve greater compressive strengths before cracking because it reduces transverse tensile strains.

3.4. Influence of the Tension Reinforcement %

Additional tension reinforcement improves deep beams’ ultimate loads and cracking resistance. Figure 8 shows the effects of reinforcement in the tension area, where the web’s reinforcing behaved the same way. As the tension zone reinforcement recovers, so does the deep beam’s ultimate load capacity, and this agrees with the findings in [33]. It should be mentioned that increasing the tension reinforcement ratio in deep beams significantly enhances their ultimate load capacity due to its critical character in resisting tensile forces and refining the strut-and-tie mechanism.

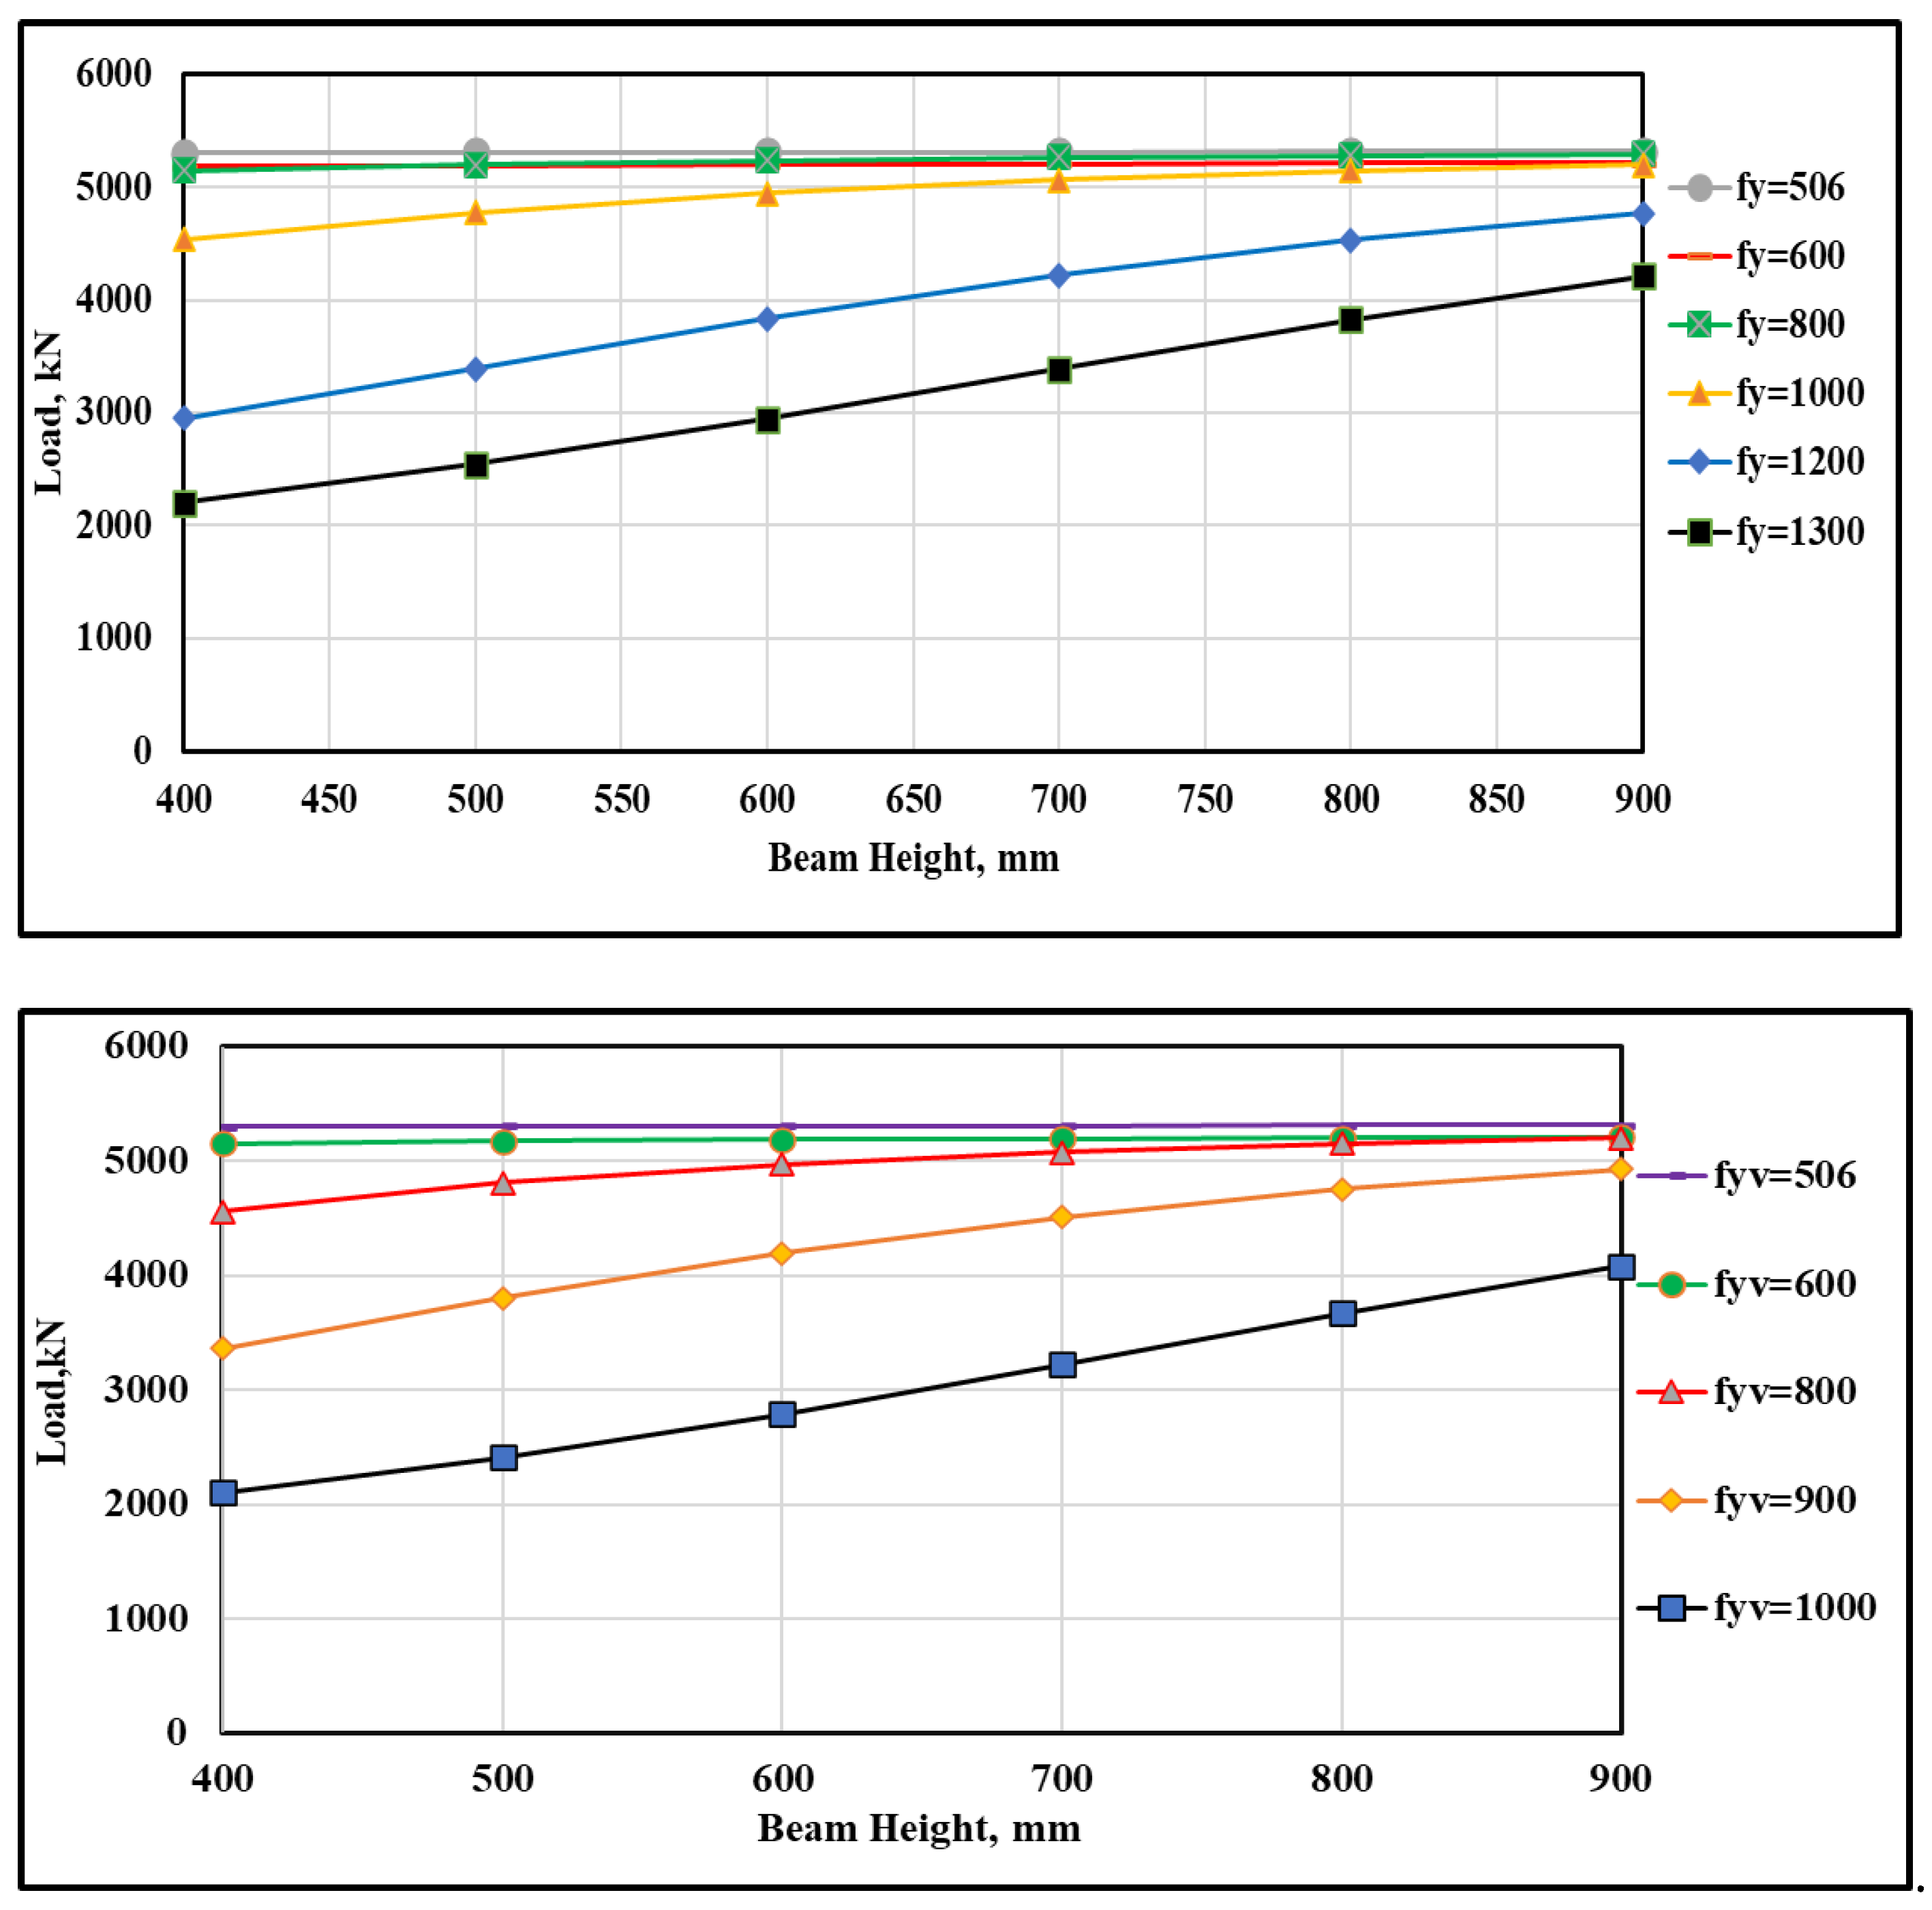
3.5. Effects of the Tensile Yields of Vertical and Horizontal Steel Bars

The flexural strength and ductility of deep beams are significantly influenced by the tensile yield of reinforcement bars. But, too much tensile reinforcement can make a material less ductile and more brittle. The capacity to start plastic deformation before failure (ductileness) is meaningly impacted by the yield strengths of horizontal and vertical steel reinforcement bars (stirrups) in deep beams. The main conclusions from experimental and analytical research are summarized in [30,36]. A similar behavior is shown in the neural network model, as shown in Figure 9 and Figure 10.

3.6. The Impact of the Compressive Strength of Concrete

Increasing the concrete’s compressive strength greatly increases the ultimate load capacity of deep beams, although this effect is dependent on the geometry and reinforcing factors. Shear strength in deep beams is strongly related to the concrete strength, with tests indicating a basically linear relationship between FC and the ultimate load capacity [36,37].
Figure 10. Variation in deep beams’ capacity with changes in the compressive strength of concrete.
Buildings 15 01371 g010

4. ANN Model Advancements for Predicting the Load Capacity of Deep Beams

Using multi-layer perceptions for model training using the back-propagation training, the ANN model is utilized to construct a design formula to determine the ultimate load strength of deep beams. The model has ten inputs representing the horizontal reinforcement % (ρh%), the vertical reinforcement % (ρv%), the compression reinforcement % (ρ′%), the tension reinforcement (ρ%), the tensile yield of vertical steel bars (fyv), the tensile yield of horizontal steel bars (fy), the compressive strength of concrete (fC),the effective depth of the beam (d), the height of the beam (h), and the thickness of the beam (th). Their values are recorded in Table 1. The model’s ten inputs are listed in Table 1; for more information about derivation equations, see [9]. Figure 11 depicts the ideal ANN model’s structure.
The application of Equation (1) for estimating the ultimate load capacity of deep beams is shown below; the input parameters are shown in Table 1.
P u n o r m a l i z e = 1 1 + e θ 19 + w 11 : 19 1 + e x 1 + w 12 : 19 1 + e x 2 + w 13 : 19 1 + e x 3 + w 14 : 19 1 + e x 4 + w 15 : 19 1 + e x 5 + w 16 : 19 1 + e x 6 + w 17 : 19 1 + e x 7 + w 18 : 19 1 + e x 8
where
x 1 = θ 11 + w 11 : 1 ρ h + w 11 : 2 ρ v + w 11 : 3 ρ + w 11 : 4 ρ + w 11 : 5 f y v + w 11 : 6 f y + w 11 : 7 f c + w 11 : 8 d + w 11 : 9 h + w 11 : 10 b
x 2 = θ 12 + w 12 : 1 ρ h + w 12 : 2 ρ v + w 12 : 3 ρ + w 12 : 4 ρ + w 12 : 5 f y v + w 12 : 6 f y + w 12 : 7 f c + w 12 : 8 d + w 12 : 9 h + w 12 : 10 b
x 3 = θ 13 + w 13 : 1 ρ h + w 13 : 2 ρ v + w 13 : 3 ρ + w 13 : 4 ρ + w 13 : 5 f y v + w 13 : 6 f y + w 13 : 7 f c + w 13 : 8 d + w 13 : 9 h + w 13 : 10 b
x 4 = θ 14 + w 14 : 1 ρ h + w 14 : 2 ρ v + w 14 : 3 ρ + w 14 : 4 ρ + w 14 : 5 f y v + w 14 : 6 f y + w 14 : 7 f c + w 14 : 8 d + w 14 : 9 h + w 14 : 10 b
x 5 = θ 15 + w 15 : 1 ρ h + w 15 : 2 ρ v + w 15 : 3 ρ + w 15 : 4 ρ + w 15 : 5 f y v + w 15 : 6 f y + w 15 : 7 f c + w 15 : 8 d + w 15 : 9 h + w 15 : 10 b
x 6 = θ 16 + w 16 : 1 ρ h + w 16 : 2 ρ v + w 16 : 3 ρ + w 16 : 4 ρ + w 16 : 5 f y v + w 16 : 6 f y + w 16 : 7 f c + w 16 : 8 d + w 16 : 9 h + w 16 : 10 b
x 7 = θ 17 + w 17 : 1 ρ h + w 17 : 2 ρ v + w 17 : 3 ρ + w 17 : 4 ρ + w 17 : 5 f y v + w 17 : 6 f y + w 17 : 7 f c + w 17 : 8 d + w 17 : 9 h + w 17 : 10 b
x 8 = θ 18 + w 18 : 1 ρ h + w 18 : 2 ρ v + w 18 : 3 ρ + w 18 : 4 ρ + w 18 : 5 f y v + w 18 : 6 f y + w 18 : 7 f c + w 18 : 8 d + w 18 : 9 h + w 18 : 10 b
The connection weights wij and threshold levels θ 11 θ 18 are shown in Table A1 in Appendix A.
It should be mentioned that for the data ranges in Table 1, all input parameters must be scaled from 0.1 to 0.9 using Equation (1) before utilizing Equation (2) through Equation (9), respectively. Additionally, it should be mentioned that the estimated ultimate load derived from Equation (1) is scaled between 0.1 and 0.9; to determine the actual amount, this predicted load P u a c t u a l   must be re-unscaled as follows:
P u a c t u a l = P u n o r m l i z e × P U m a x P U m i n 0.8 0.9 P U m a x P U m i n 0.8 + P U m a x
where P U m a x and P U m i n represent the maximum and minimum values of the load capacity that were obtained from experimental lab.

5. Conclusions

In addition to assessing the data collected in earlier research, it was found that the main factors influencing the capacity of deep beams are the horizontal and vertical reinforcement ratios in the web (stirrups). The effect of the reinforcement percentage in the compression and tensile areas is as follows: the greater the ratios of reinforcement, the greater the load capacity.
Additionally, deep beams reinforced with high-strength steel bars exhibited a lower load capacity because the increases in the tensile yields of vertical and horizontal reinforcement bars reduces their elasticity.
The neural network model was quite accurate in predicting the ultimate load capacity of deep beams. When the practical results were compared to the estimated outcomes of the neural network model, it was discovered that the accuracy was 95%.

Author Contributions

Methodology, A.A.; Formal analysis, M.A.-G.; Writing—original draft, A.A.A. All authors have read and agreed to the published version of the manuscript.

Funding

This research received no external funding.

Data Availability Statement

The original contributions presented in the study are included in the article, further inquiries can be directed to the corresponding author/s.

Conflicts of Interest

The authors declare no conflict of interest.

Appendix A

Table A1. Weights and threshold levels for the ANN model.
Hidden Layer NodesWeight Transfer from Node i in the Input Layer to Node j in the Hidden Layer.Hidden Threshold
i = 1i = 2i = 3i = 4i = 5i = 6i = 7i = 8i = 9i = 10 θ i j
J = 119.0221.2−150.9−32.80.50.9−1.82.3−12.7−8.7−2.2
J = 12−262.5352.3−149.025.816.512.8−5.8−13.25.416.8−3.0
J = 13−491.9−254.0−52.0−72.180.00240.0019−0.03190.00030.00060.0027−72.1
J = 14−443.5−29.7148.4−0.630.0024−0.00010.0259−0.00300.0006−0.0032−0.63
J = 15−458.169.6−36.42.0−10.0−15.1−16.7−36.8−26.1−84.2−0.4
J = 16322.7195.4−113.6−82.520.412.924.5−3.5−11.81.41.7
J = 17−104.6202.4−66.015.66.1−1.4−1.449.0−53.315.43.0
J = 18324.2118.9−46.7107.20.00.00.00.00.00.01.2
Output layer nodesweight between hidden layer node i to output layer node j
671.6−311.347.8−61.7−6.02.3−12.2−0.6−1.36.5

References

  1. ACI-318-19; 318-19 Building Code Requirements for Structural Concrete and Commentary. American Concrete Institute: Farmington Hills, MI, USA, 2019. [CrossRef]
  2. Kong, F.K. Reinforced Concrete Deep Beams; Taylor & Francis: New York, NY, USA, 2003. [Google Scholar]
  3. Starčev-Ćurčin, A.; Rašeta, A.; Malešev, M.; Kukaras, D.; Radonjanin, V.; Šešlija, M.; Žarković, D. Experimental Testing of Reinforced Concrete Deep Beams Designed by Strut-And-Tie Method. Appl. Sci. 2020, 10, 6217. [Google Scholar] [CrossRef]
  4. Telford, T. CEB-FIP: Model Code 1990 for Concrete Structures; Comite Euro-International du Beton, Lausanne: London, UK, 1993. [Google Scholar]
  5. CSA Technical Committee on Reinforced Concrete Design, Design of Concrete Structures; Canadian Standards Association: Toronto, ON, Canada, 1994.
  6. Eurocode 2: Design of Concrete Structures—Part 1-1: General Rules and Rules for Buildings; British Standards Institution (BSI): London, UK, 2014.
  7. Liu, M.-Y.; Li, Z.; Zhang, H. Probabilistic Shear Strength Prediction for Deep Beams Based on Bayesian-Optimized Data-Driven Approach. Buildings 2023, 13, 2471. [Google Scholar] [CrossRef]
  8. Megahed, K. Prediction and reliability analysis of shear strength of RC deep beams. Sci. Rep. 2024, 14, 14590. [Google Scholar] [CrossRef]
  9. Al-Gburi, M.; Jonasson, J.E.; Yousif, S.T.; Nilsson, M. Simplified Methods for Crack Risk Analyses of Early Age Concrete Part 2: Restraint Factors for Typical Case Wall-on-Slab. Nord. Concr. Res. 2012, 46, 39–56. [Google Scholar]
  10. Al-Gburi, M. Restraint Effects in Early Age Concrete Structures; Lulea University of Technology: Luleå, Sweden, 2015. [Google Scholar]
  11. Al-Gburi, M.; Yusuf, S.A. Investigate the effect of mineral additives on concrete strength using ANN. Asian J. Civ. Eng. 2022, 23, 405–414. [Google Scholar] [CrossRef]
  12. Lagaros, N.D. Artificial Neural Networks Applied in Civil Engineering. Appl. Sci. 2023, 13, 1131. [Google Scholar] [CrossRef]
  13. Kafeh, A. Applications of Artificial Neural Networks and Machine Learning in Civil Engineering; Springer: Cham, Switzerland, 2024. [Google Scholar]
  14. Foster, S.J.; Golbert, R.I. Experimental studies on high-strength concrete deep beams. ACI Struct. J. 1998, 95, 382–390. [Google Scholar]
  15. Moody, K.G.; Viest, I.M.; Elstner, R.C.; Hognestad, E. Shear strength of reinforced concrete beams part 1—Tests of simple beams. ACI J. 1954, 51, 317–332. [Google Scholar]
  16. Rogowsky, D.M.; MacGregor, J.G.; Ong, S.Y. Tests of reinforced concrete deep beams. ACI J. 1986, 83, 614–623. [Google Scholar]
  17. Williams, C.S.; Deschenes, D.J.; Bayrak, O. Strut-And-Tie Model Design Examples for Bridges; Center for Transportation Research: Austin, TX, USA, 2012. [Google Scholar]
  18. Oh, J.-K.; Shin, S.-W. Shear Strength of Reinforced High-Strength Concrete Deep Beams. Struct. J. 2001, 98, 164–173. [Google Scholar]
  19. Li, S.; Wu, Z.; Zhang, J.; Xie, W. Experimental Study and Calculation Methods of Shear Capacity for High-Strength Reinforced Concrete Full-Scale Deep Beams. Materials 2022, 15, 6017. [Google Scholar] [CrossRef] [PubMed]
  20. Al-Gburi, M.; Jonasson, J.E.; Nilsson, M. Using Artificial Neural Network to Predict the Restraint in Concrete Tunnel at Early Age. Struct. Eng. Int. 2015, 25, 258–265. [Google Scholar] [CrossRef]
  21. Birrcher, D.B.; Tuchscherer, R.G.; Huizinga, M.; Bayrak, O. Depth effect in deep beams. ACI Struct. J. 2014, 111, 31–740. [Google Scholar] [CrossRef]
  22. Brown, M.D.; Sankovich, C.L.; Bayrak, O.; Jirsa, J. Behavior and efficiency of bottle shaped struts. ACI Struct. J. 2006, 103, 348–355. [Google Scholar]
  23. Clark, A.P. Diagonal tension in reinforced concrete beams. ACI J. 1951, 48, 145–156. [Google Scholar]
  24. Hassan, T.K.; Seliem, H.M.; Dwairi, H.; Rizkalla, S.H.; Zia, P. Shear behavior of large concrete beams reinforced with high-strength steel. ACI Struct. J. 2008, 105, 179–190. [Google Scholar]
  25. Matsuo, M.; Lertsrisakulrat, T.; Yanagawa, A.; Niwa, J. Shear behavior of RC deep beams with stirrups. Trans. Jpn. Concr. Inst. 2002, 385–390. [Google Scholar]
  26. Morrow, J.; Viest, I.M. Shear strength of reinforced concrete frame members without web reinforcement. ACI J. 1957, 53, 833–869. [Google Scholar]
  27. Tanimura, Y.; Sato, T. Evaluation of shear strength of deep beams with stirrups. Q. Rep. RTRI 2005, 46, 53–58. [Google Scholar] [CrossRef]
  28. Walraven, J.C.; Lehwalter, N. Size effects in short beams loaded in shear. ACI Struct. J. 1994, 91, 585–593. [Google Scholar]
  29. Watstein, D.; Mathey, R.G. Strains in beams having diagonal cracks. ACI J. 1958, 55, 717–729. [Google Scholar]
  30. Yang, K.-H.; Chung, H.-S.; Lee, E.-T.; Eun, H.-C. Shear characteristics of high-strength concrete deep beams without shear reinforcements. Eng. Struct. 2003, 25, 1343–1352. [Google Scholar] [CrossRef]
  31. Zhang, N.; Tan, K.-H. Size effect in RC deep beams: Experimental investigation and STM verification. Eng. Struct. 2007, 29, 3241–3254. [Google Scholar] [CrossRef]
  32. Garson, G.D. Interpreting Neural Network Connection Weights. Artif. Intell. 1991, 6, 47–51. [Google Scholar]
  33. Li, S.S.; Jin, T.C.; Zheng, L.A.; Zhang, G.Y.; Li, H.M.; Chen, A.J.; Xie, W. Experimental Study of Shear Performance of High-Strength Concrete Deep Beams with Longitudinal Reinforcement with Anchor Plate. Materials 2023, 16, 6023. [Google Scholar] [CrossRef]
  34. Al-khreisat, A.; Abdel-Jaber, M.; Ashteyat, A. Shear Strengthening and Repairing of Reinforced Concrete Deep Beams Damaged by Heat Using NSM–CFRP Ropes. Fibers 2023, 11, 35. [Google Scholar] [CrossRef]
  35. Charif, A.; Mourad, S.M.; Khan, M.I. Flexural behavior of beams reinforced with steel bars exceeding the nominal yield strength. Lat. Am. J. Solids Struct. 2016, 13, 945–963. [Google Scholar] [CrossRef]
  36. Sheikh-Sobeh, A.; Kachouh, N.; El-Maaddawy, T. Numerical Analysis of Concrete Deep Beams Reinforced with Glass Fiber-Reinforced Polymer Bars. Buildings 2023, 13, 2767. [Google Scholar] [CrossRef]
  37. Sayhood, E.K.; Mohammed, N.S.; Hilo, S.J.; Salih, S.S. Comprehensive Empirical Modeling of Shear Strength Prediction in Reinforced Concrete Deep Beams. Infrastructures 2024, 9, 67. [Google Scholar] [CrossRef]
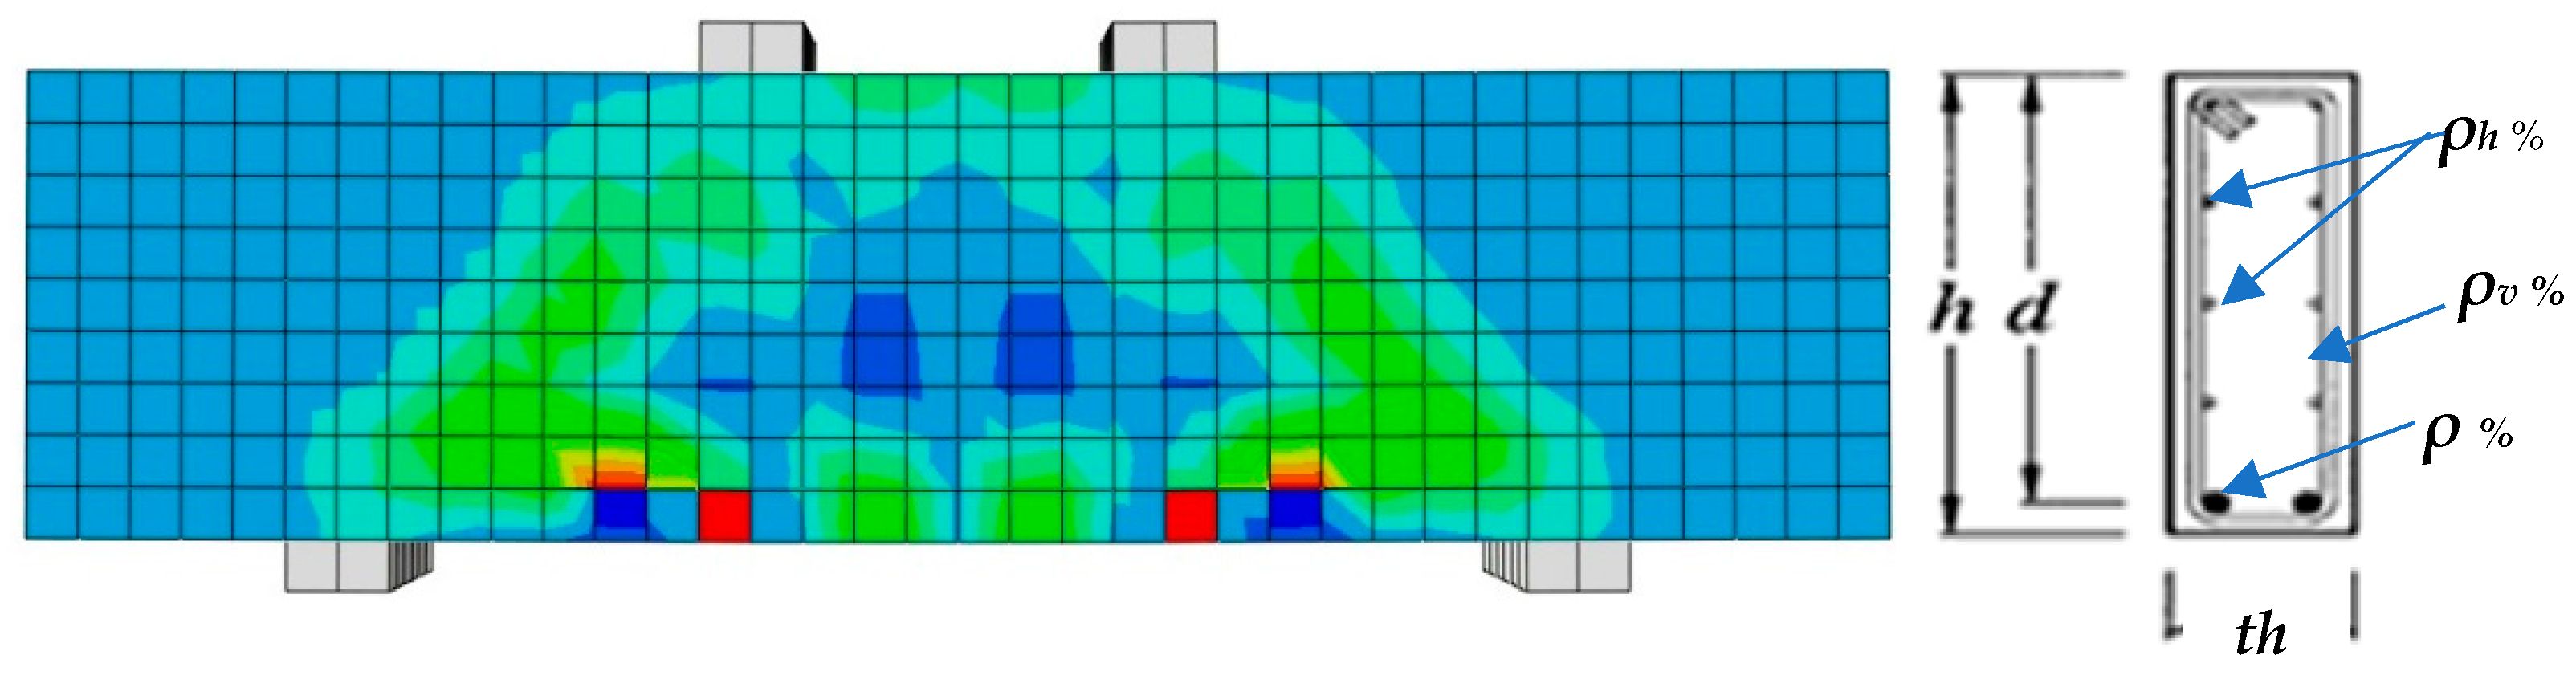
Figure 1. Stress distribution in the deep beam. The horizontal reinforcement % (ρh%), vertical reinforcement % (ρv%), compression reinforcement % (ρ′%), tension reinforcement (ρ%), the effective depth of the beam (d), height of the beam (h), and thickness of the beam (th) are shown. High-stress locations are indicated by red space. Less stress is covered with yellow, and finally, less stress is associated with green areas.
Buildings 15 01371 g001
Figure 2. Training the ANN model.
Buildings 15 01371 g002
Figure 3. Comparison between the experimental data and ANN model.
Buildings 15 01371 g003
Figure 4. Relative importance of input data in the ultimate load capacity of deep beams.
Buildings 15 01371 g004
Figure 5. Changing the ratio of horizontal web reinforcement at various beam heights will thus change the capacity of deep beams.
Buildings 15 01371 g005
Figure 6. Changing the ratio of vertical web reinforcement at various beam heights will thus change the capacity of deep beams. Variations in the ultimate capacity by variation of.
Buildings 15 01371 g006
Figure 7. Changing the ratio of reinforcement via webs to compression reinforcement at different beam heights will change the beams’ capacity.
Buildings 15 01371 g007
Figure 8. Varying the ratio of reinforcement via webs to tension reinforcement at different beam heights will change the deep beams’ capacity.
Buildings 15 01371 g008
Figure 9. Variation in deep beams’ capacity with changing tensile yields for vertical and horizontal steel bars.
Buildings 15 01371 g009
Figure 11. Structure of the ideal ANN model used to forecast the load strength of deep beams. The numbers are displayed in Equations (1–9), while the colors simply indicate clear that each input element is linked to each node in the following layer.
Buildings 15 01371 g011
Table 1. List of factors and their range used in calculations of the ultimate load capacity of deep beams.
InputDescriptionMinMaxParametric StudyUnits
ρh%Horizontal reinforcement %00.610.4-
ρv%Vertical reinforcement %01.220.5-
ρ’%Compression reinforcement %02.130-
ρ%Tension reinforcement %04.250-
fyvTensile yield of vertical steel bars01051503MPa
fyTensile yield of horizontal steel bars01330503MPa
fCCompressive strength of concrete13.810430MPa
dEffective Depth of beam3552000350mm
hHeight of the beam 4002050400mm
thThickness of the beam125915200mm
Note: While keeping all other parameters constant, the parametric analysis carefully investigates each parameter’s individual impact on the deep beam capacity values.
Disclaimer/Publisher’s Note: The statements, opinions and data contained in all publications are solely those of the individual author(s) and contributor(s) and not of MDPI and/or the editor(s). MDPI and/or the editor(s) disclaim responsibility for any injury to people or property resulting from any ideas, methods, instructions or products referred to in the content.

