Article

Exploring the Complex Effects and Their Spatial Associations of the Built Environment on the Vitality of Community Life Circles Using an eXtreme Gradient Boosting–SHapley Additive exPlanations Approach: A Case Study of Xi’an

School of Human Settlement and Civil Engineering, Xi’an Jiaotong University, No. 28 Xianning West Road, Xi’an 710049, China
*
Author to whom correspondence should be addressed.
Buildings 2025, 15(8), 1372; https://doi.org/10.3390/buildings15081372
Submission received: 17 February 2025 / Revised: 17 April 2025 / Accepted: 17 April 2025 / Published: 20 April 2025

Abstract

:
Disentangling the effects of the built environment on urban vitality at the scale of community life circles is crucial for informing precise urban planning and design, particularly in the context of urban renewal. However, studies examining the complex relationships and spatial heterogeneity in these effects remain limited, hindering the identification of built environment characteristics that may generate sustainable benefits. Therefore, this study took Xi’an, a typical high-density city in Northwest China, as an example. The eXtreme Gradient Boosting (XGBoost) model and the SHapley Additive exPlanations (SHAP) method were utilized to reveal threshold effects and spatial correlations between the built environment and community life circles’ vitality across varying buffer zones. The results show that (1) there is a significant spatial correlation between the built environment and the core–periphery structure of community life circles’ vitality. (2) Indicators, such as facility accessibility, the floor area ratio, intersection density, and the residential land use ratio, contribute significantly to community life circles’ vitality. (3) While the micro-built environment and socio-economic factors show limited contributions, their collaboration with the macro-built environment can enhance their individual effects, highlighting the necessity of taking them into account together. These findings provide new insights into supporting community life circles’ vitality through urban planning and design.

1. Introduction

Global urbanization continues to expand, with one of its distinctive features being the increasing density of the population in urban areas [1]. The proportion is projected to increase to 68% by 2050. Although a high population density can negatively impact quality of life, such as environmental pollution, increased pressure on infrastructure, and depletion of the natural environment [2,3,4], the physical changes in the built environment brought about by urbanization have long been widely recognized as having positive effects in terms of social, economic, and cultural development [5,6]. In China, rapid urbanization has driven economic growth since the reform and opening-up policy of 1978. As urbanization progresses, a significant migration from rural and small- or medium-sized cities to big cities and metropolitan areas continues to occur [7]. According to the National Bureau of Statistics, the urbanization rate of China’s resident population reached 66.16% by the end of 2023 and is expected to increase further to 70% by 2030. However, while the urban population continues to grow, the urbanization process has gradually slowed down, presenting new challenges to urban development. In response, the Chinese government has proposed a people-centered urbanization strategy, aiming to achieve sustainable development and improve the quality of life for residents through urban renewal and community life circles. Therefore, there is an urgent need for a deeper understanding of how the physical built environment influences the formation of high-quality urban spaces.
Strengthening urban vitality is an important task in urban development. Urban vitality is closely linked to quality of life. Jacobs observed that urban vitality arises from interactions between people in street spaces, which infuse a city with energy and appeal [8]. Montgomery suggested that urban vitality is the outward performance of diverse human activities interacting with the surrounding physical environment [9]. From the perspective of urban morphology, Lynch emphasized that urban vitality reflected how the urban form supports human functional needs and ecological adaptability [10]. Recent studies have explored urban vitality from various dimensions, including social, economic, cultural, and cyberspace [11,12]. Although interpretations of urban vitality differ depending on research perspectives, there is consensus that the built environment has a direct impact on urban vitality, which is most visibly reflected through the behavior and activity patterns of residents in urban spaces.
Building on this foundation, an increasing number of studies have focused on how built environment features influence the generation and sustainability of urban vitality through key pathways, such as land use mix, spatial heterogeneity, and human-scale design. In A Pattern Language, Alexander argued that a healthy city was grounded in complex and flexible spatial structures that accommodate diverse usage needs and foster everyday social interactions and community cohesion [13]. Salingaros and Mehaffy, in Design for a Living Planet, further emphasized that geometric characteristics of cities (such as nesting, network connectivity, and fractal structures) were fundamental to enhancing urban vitality and sustainability [14]. Meanwhile, Carlos Moreno’s concept of the “ city The 15-min city” centered on accessibility and functional balance at the neighborhood scale, advocating for compact, polycentric urban forms that enable efficient, convenient, and vibrant daily life [15].
Drawing on these theoretical frameworks, this study focuses on community life circles as meso-scale units between the urban-scale and the street-scale. The concept of community life circles aligns closely with the idea of the 15-min city, emphasizing accessibility to essential services within a short walking distance to enhance quality of life. This study explores how the built environment characteristics of community life circles affect residents’ spatial behaviors, thereby shaping urban vitality at the community level.

1.1. The Quantification of Urban Vitality

Quantifying urban vitality is essential for assessing the quality of urban development and measuring the sustainability of the urban physical environment. Early studies relied on traditional methods, including participatory observation and video recording [16]. In recent years, advances in big data collection and analysis technologies have offered new opportunities. More and more studies have begun to adopt multi-source big data to quantitatively assess urban vitality (see Appendix A, Table A1). Among these, location-based services data are widely used, as they directly reflect human activities, including mobile phone positioning data, transit smart card data, shared mobility spatial data, Wi-Fi hotspot access data, and social media data. For example, Zeng et al. analyzed the spatial distribution of urban vitality in Shanghai using bike-sharing track data, observing that urban vitality exhibited an aggregation pattern during morning and evening peak hours while showing a random spatial distribution during midday off-peak hours [17]. He et al. quantified urban vitality in the Wuhan downtown area based on Baidu heatmap data and revealed the spatial differentiation pattern of urban vitality [18]. Sulis et al. proposed a method to measure urban vitality using Twitter data, where the number of geotagged tweets served as a proxy for human activity, and analyzed the spatial and temporal dynamics of urban vitality throughout the day [19]. In addition, when location-based services data are not available, researchers can also utilize nighttime light data and points of interest data (POIs) as alternative indicators to indirectly capture the spatial characteristics of urban vitality [20,21].
Establishing appropriate spatial units is key to measuring urban vitality. Some studies have used traffic analysis zones [22], while other studies have chosen street blocks or communities/neighborhoods as study units [23,24,25]. Although these studies have focused on the differentiated distribution patterns of urban vitality across various spatial units, the vitality of community life circles, which are closely tied to the daily lives of residents, has not been fully explored [18] (see Appendix A, Table A1). In China, in the context of people-centered urbanization, the community life circle concept has become a key spatial unit for providing daily services within walking distance to residents [26]. It provides a wide range of public service facilities, such as commercial, medical, educational, cultural, and recreational facilities. By emphasizing efficient functional integration, compact spatial layout, and convenient public service provision, it aims to build a more livable and sustainable urban environment. This concept was formally incorporated into the “Urban Residential Area Planning Standards” [27] in 2018 and has been widely promoted in several cities, including Shanghai, Guangzhou, Shenzhen, Hangzhou, and Xi’an, closely linked with urban renewal initiatives. Therefore, assessing urban vitality from the perspective of community life circles can facilitate the optimization of urban space and enhance residents’ quality of life.

1.2. The Impacts of the Built Environment

Although researchers have worked to identify and analyze factors that influence urban vitality, the built environment has always been recognized as a key determinant [5]. The built environment refers specifically to the physical characteristics of urban spaces that influence human activities, particularly in relation to urban form, land use, and accessibility. The built environment shapes human behavior through five dimensions (5Ds), including density, diversity, design, destination accessibility, and distance to transit [28,29]. In The Life and Death of Great American Cities, Jacobs indicated that land use diversity, short block sizes, building age, and high-density development are all closely related to urban vitality [8]. In recent years, the application of big data in urban environments has significantly improved the measurement of the built environment. The availability of high-resolution and geo-referenced data has enabled the spatial and temporal characteristics of built environments to be more accurately portrayed [30]. For example, researchers quantified land use mixing by calculating the number, density, accessibility, diversity, and concentration of POIs and found that the accessibility and diversity of POIs had a significant positive impact on urban vitality [20,31]. Zhang et al. used remotely sensed imagery and open-source street data to analyze how land use and road networks impact urban vitality [32]. However, an increasing number of researchers suggest that individuals’ subjective perception also plays a crucial role in understanding the relationship between the built environment and urban vitality [18,33]. This is because personal perception can significantly modulate behavior [34].
The application of semantic segmentation technology for street view images (SVIs) offers a novel approach to quantifying the built environment from a human-centered perspective [34,35]. It addresses the limitations of traditional remote sensing imagery and land use data in capturing micro-environmental characteristics [36]. SVIs allow us to capture environmental information based on human eye levels, such as the ratio of buildings to streets, the ratio of sidewalks to streets, and the percentage of various physical elements (e.g., vegetation, sidewalks, fences, walls, sky, and terrain) [37,38]. These micro-built environmental elements are aligned with actual perceived spatial features and are strongly correlated with individual behavior [39]. However, the existing studies focus on macro-built environment characteristics (e.g., density, land use mix, road connectivity, and accessibility), with limited exploration of the micro-built environment [18]. This gap has resulted in an insufficient understanding of how the built environment impacts urban vitality, particularly at the scale of community life circles, which directly influences residents’ daily behaviors.
To explore the mechanism of the built environment’s influence on urban vitality, many studies have relied on linear regression models. However, recent studies have gradually questioned the applicability of this linear assumption [12,40]. With the growing application of machine learning models in urban vitality studies, researchers have begun to use these advanced models to analyze the complex interactions between the built environment and urban vitality. For example, Lin et al. employed the Random Forest model to rank the importance of various built environment factors driving urban vitality [41]. Wang et al. used the Gradient Boosting Decision Tree (GBDT) model to identify 71 key factors contributing to urban vitality [12]. Xiao et al. combined the Light Gradient Boosting Machine (LightGBM) model with SHapley Additive exPlanations (SHAP) to uncover the threshold effects of the built environment on vitality [42]. Furthermore, most studies have confirmed the spatial heterogeneity in the relationship between the built environment and urban vitality. Researchers typically apply spatial analyses, such as geographically weighted regression (GWR) or multi-scale geographically weighted regression (MGWR), to reveal regional differences [18,43]. However, these methods still rely on linear assumptions and fail to fully capture the potential complex effects between the built environment and urban vitality (see Appendix A, Table A1). Therefore, it is necessary to explore an analytical approach that incorporates complex relationships and spatial heterogeneity to reveal the complex interactions between the built environment and urban vitality at the scale of community life circles.

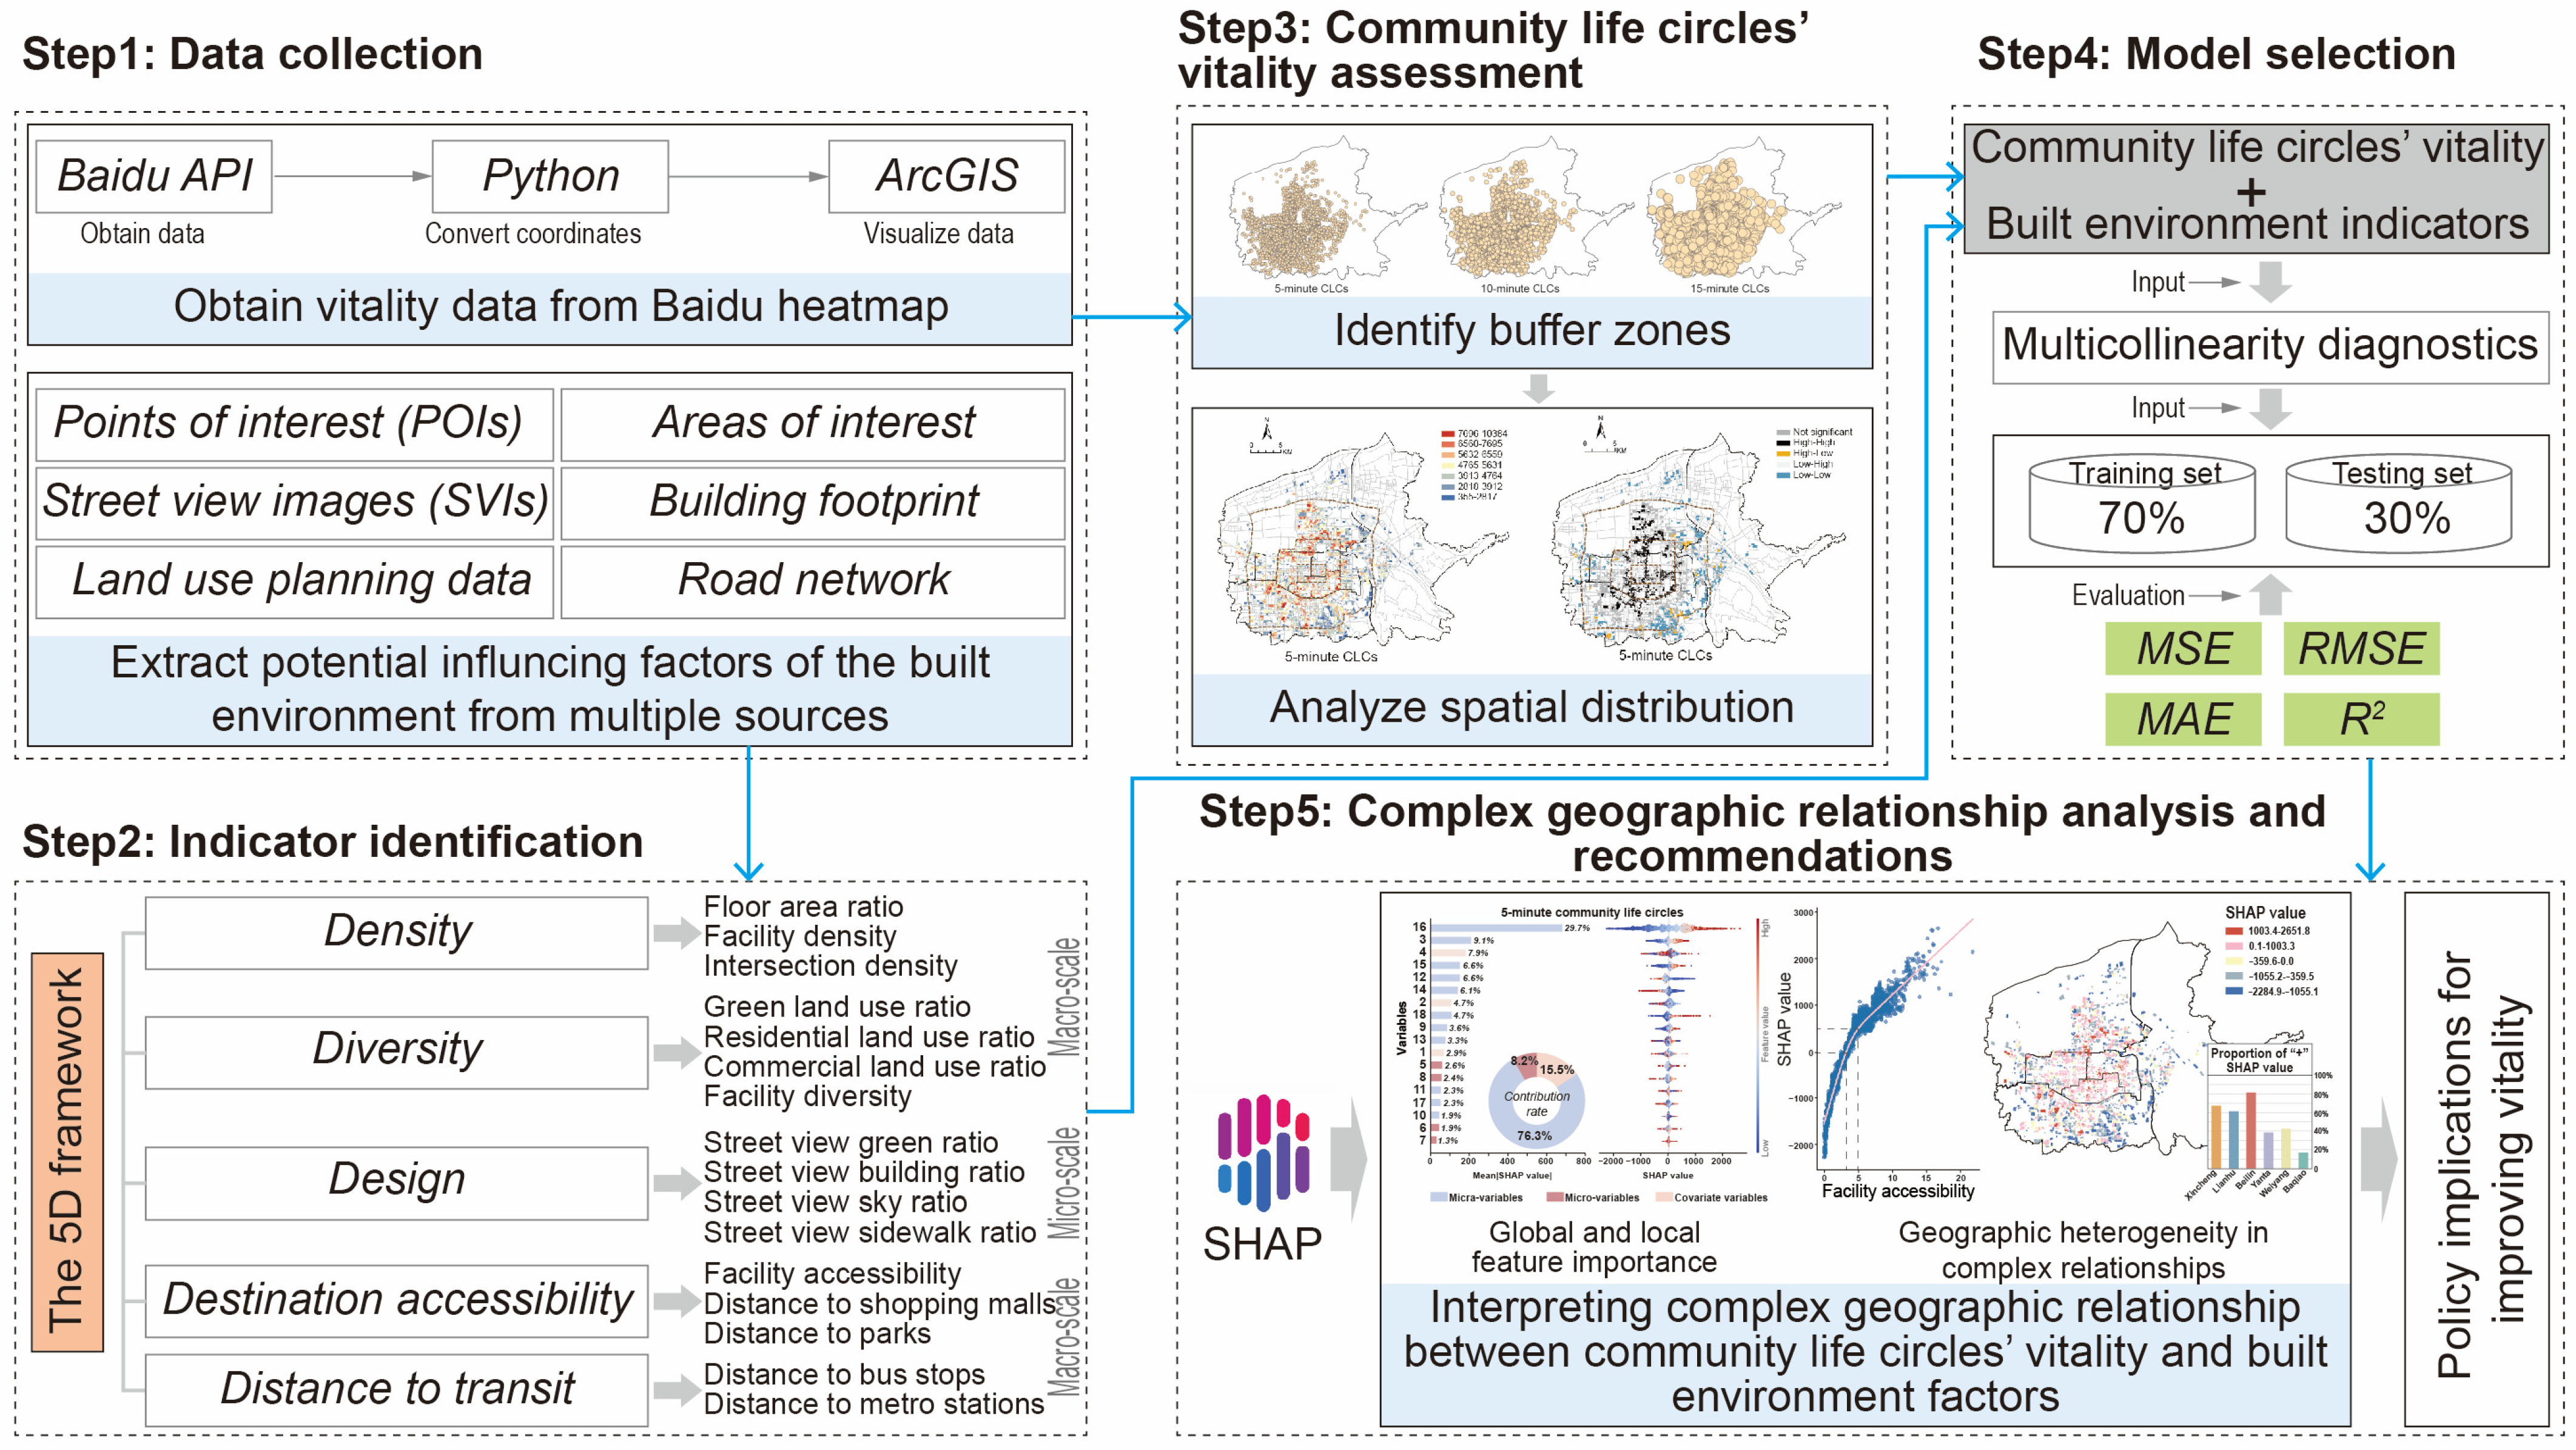
1.3. Research Framework

To address the above limitations, this study proposes a research framework to explore the drivers of community life circles’ vitality (Figure 1). It takes Xi’an as an example and focuses on enhancing the quality of life for residents and improving the efficiency of existing urban land use. First, Baidu heatmap data, based on location-based services, is applied to assess community life circles’ vitality across different buffer zones. Second, multi-source data are integrated to extract both macro- and micro-built environmental characteristics. These characteristics are quantified to capture the accessible built environment from vertical and horizontal perspectives within community life circles. Third, after data preprocessing, multiple machine learning models are evaluated, and the best predictive model is combined with the SHAP method to identify complex relationships between key explanatory variables and community life circles’ vitality. Additionally, the spatial heterogeneity in the built environment’s impact on community life circles’ vitality is examined through the spatial representation of SHAP values.
This study advances the existing body of knowledge on the relationship between the built environment and urban vitality in four key aspects: (1) It shifts the focus from broader urban and neighborhood scales to community life circles, addressing a critical gap in the research by emphasizing the role of residents’ daily activity spaces in shaping urban vitality. (2) It develops a comprehensive framework for measuring the built environment, integrating both objective spatial attributes and residents’ perceptual factors, thereby enriching the methodological approach to urban vitality studies. (3) By leveraging machine learning models and the interpretable SHAP tool, this study quantifies the impact of built environment features on community life circles’ vitality and identifies optimal intervention thresholds, offering refined, data-driven insights for urban planning and policy-making. (4) Moving beyond traditional linear analyses, this study employs geo-visualization techniques to capture and represent the spatial heterogeneity in complex relationships between built environment characteristics and community life circles’ vitality, providing a more nuanced and dynamic assessment framework for urban design interventions.

2. Methods

2.1. Study Area

Xi’an, located in northwest China, is a typical high-density city (Figure 2a). By the end of 2023, its urbanization rate had reached 79.88%, with a resident population of 13,078,200. The result of the seventh national census shows that the population growth ratio of Xi’an is more than 40% compared to the sixth census. In contrast, neighboring cities, such as Tongchuan, Baoji, Weinan, and Shangluo, experienced population declines of over 10%. This change indicates that Xi’an’s growing economic and social attractiveness has attracted a large population influx from surrounding regions. The population growth has brought new challenges to the allocation of urban resources.
In response, Xi’an has focused on improving quality of life and stimulating urban vitality through the integration of urban resources and sustainable renewal within community life circles. According to the Public Announcement of Review Results of Urban Renewal Actions in 2024 issued by the Ministry of Finance, Xi’an was selected as one of the first fifteen cities to support urban renewal pilots. Therefore, Xi’an is a representative case for this study. Given its high population density and urbanization levels, this study focuses on the central city of Xi’an (Figure 2b), which includes six urban districts: Xincheng, Lianhu, Beilin, Yanta, Baqiao, and Weiyang.
Community life circles are basic spatial units that provide facilities and services to meet residents’ daily needs, such as shopping, healthcare, education, transportation, recreation, and social services [44]. The selected study area is not only the area with the highest concentration of residential land, but it also covers all land use types related to community life circles. According to the “Urban Residential Area Planning Standards” [27], community life circles are divided into three categories, i.e., 5-min, 10-min, and 15-min, corresponding to walking distances of 300 m, 500 m, and 1000 m, respectively. Therefore, this study investigated the vitality of 5-min, 10-min, and 15-min community life circles of 3346 residential housings based on walking distances (Figure 2c). These residential housings were selected because they have complete information on house prices and building age in the study area, which are important variables that affect community life circles’ vitality.

2.2. Selection of Variables

2.2.1. Dependent Variable: The Vitality of Community Life Circles

This study utilizes Baidu heatmap data to quantify community life circles’ vitality. Baidu heatmap data, derived from users’ real-time locations, can reflect the change in human movement in specific time periods or locations and provide the spatial distribution and density of human activities [18]. Due to their high spatial and temporal resolution, Baidu heatmap data have been widely used in urban vitality studies. Previous studies have validated the reliability of Baidu heatmap data as an urban vitality indicator, showing that they effectively represent urban human activity patterns; thus, they are widely used in vitality research [18,40,41]. Additionally, our comparative analysis of different data sources (such as social media check-ins, mobile trajectory data, or POI visit data) within the study area revealed that Baidu heatmap data maintain strong temporal continuity throughout the week while ensuring full spatial coverage of all community life circles. Meanwhile, compared to traditional statistical data, Baidu heatmap data overcome the limitations of data accuracy, offering a low-cost, high-precision measure and full spatial coverage of urban vitality. These data can be pinpointed to specific streets, transport stops, or shopping areas [40,45].
In this study, Baidu heatmap data were collected every 2 h from 19 to 25 October 2020 (one consecutive week) via the Baidu Application Programming Interface, including weekdays and weekends. The average Baidu heatmap values within 300 m, 500 m, and 1000 m buffer zones were calculated using ArcGIS 10.2 as the corresponding vitality values for the 5-min, 10-min, and 15-min community life circles. To minimize the potential interference from residents who stay at home for long periods, this study focused only on Baidu heatmap data during the period from 8:00 a.m. to 8:00 p.m., ensuring that the values accurately reflected community life circles’ vitality generated by human activities.

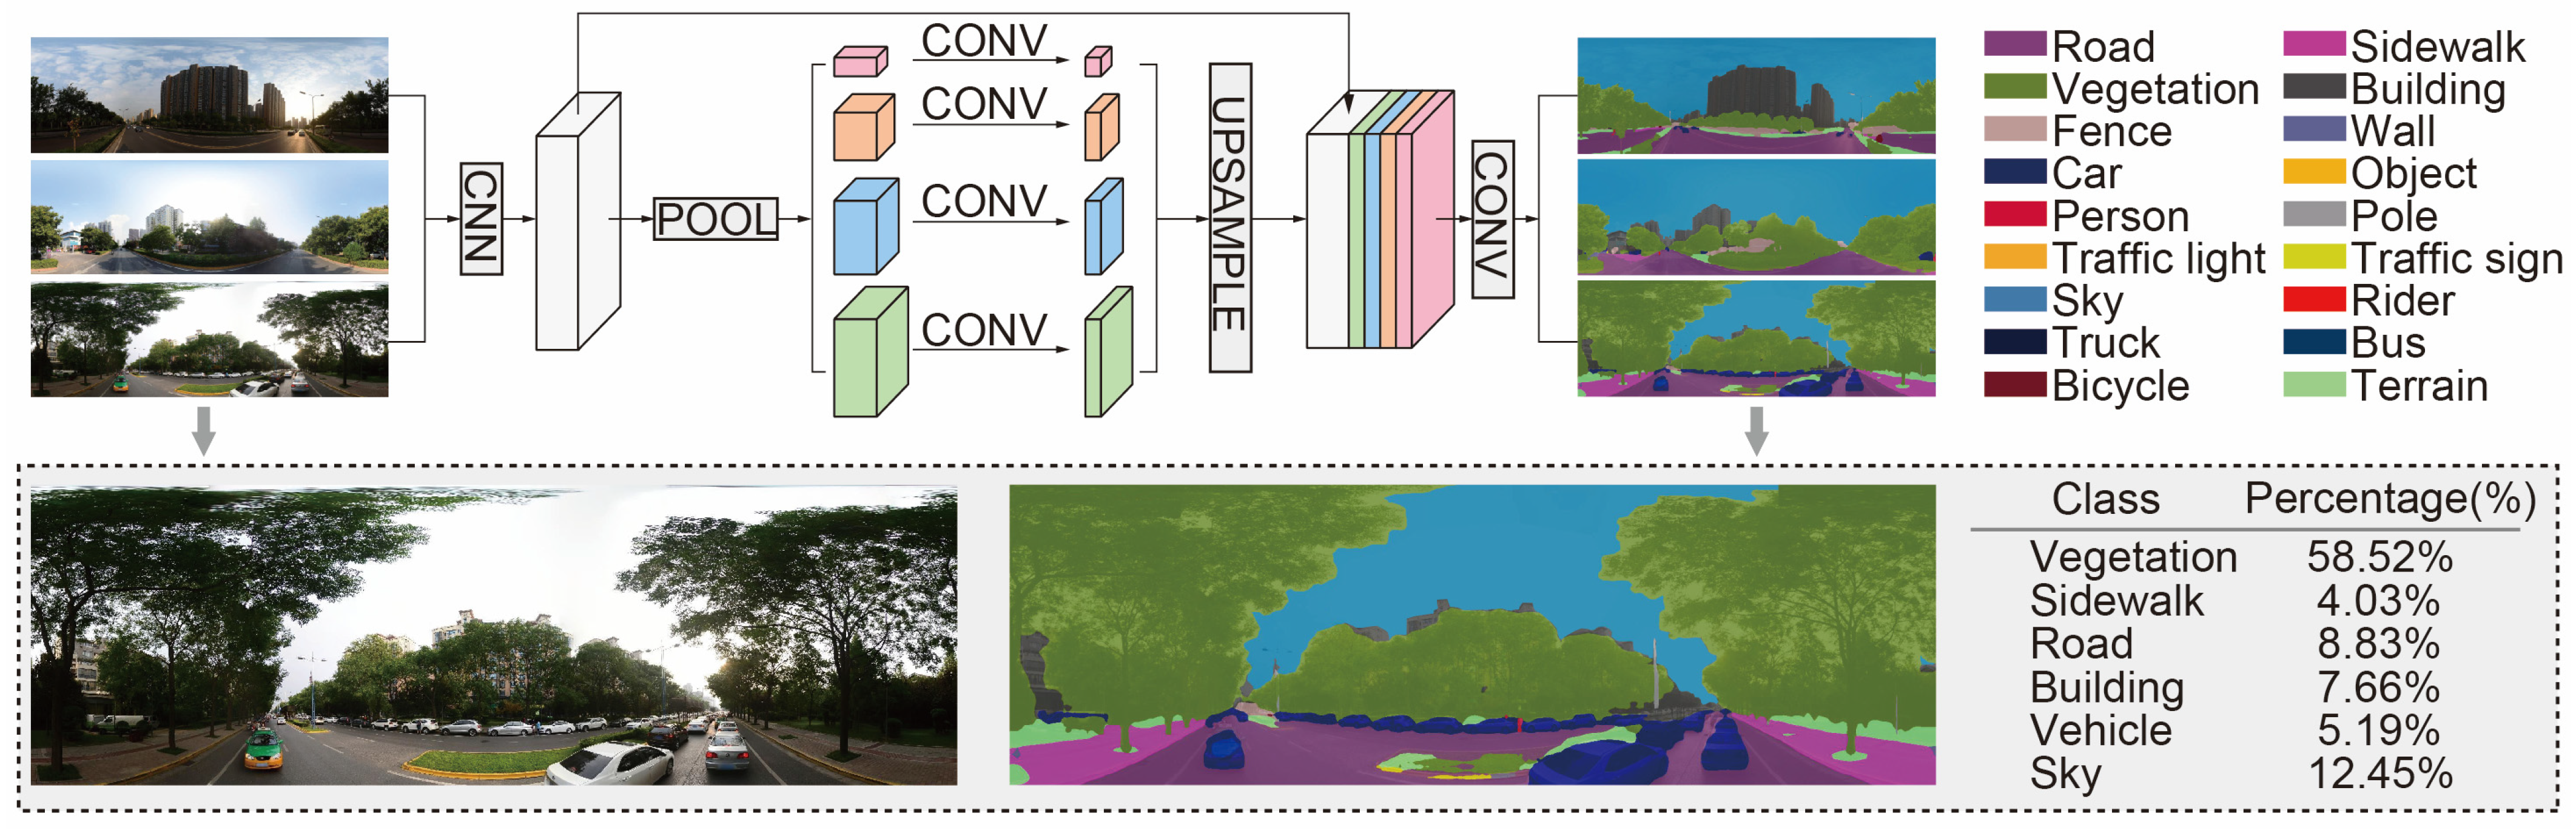
2.2.2. Independent Variables: Built Environment Characteristics

This study extracted 16 built environment variables to quantify the macro- and micro-built environment characteristics based on density, diversity, design, destination accessibility, and distance to transit [28,29]. These selected variables were informed by existing studies.
The density dimension included the floor area ratio, facility density, and intersection density [6,21]. For the diversity dimension, this study selected the green land use ratio, the residential land use ratio, the commercial land use ratio, and facility diversity [12,46]. The design dimension was mainly related to micro-built environment features, which are closely related to personal perception. Therefore, using street view images and semantic segmentation tools, this study extracted variables such as the street view green ratio, the street view buildings ratio, the street view sky ratio, and the street view sidewalk ratio [18,45]. Destination accessibility was defined as facility accessibility, the distance to the nearest shopping malls and parks [6,45]. In addition, distance to transit included distance to the nearest bus stop and metro station [6]. These variables are shown in Table 1.
To measure the above built environment variables, this study integrated multi-source geographic big data. First, based on the “Urban Residential Area Planning Standards” [27] and the “Spatial Planning Guidance: Community Life Unit”, POI data obtained from AMap (https://ditu.amap.com/, accessed on 20 April 2023) were classified into 5 main categories, i.e., commerce, education, healthcare, recreation, and transportation, and 26 subcategories (Table 2). The Shannon entropy index and the cumulative opportunity method were applied to measure facility diversity and accessibility [18,47]. Second, the building data, including geographic coordinates, footprint, and number of floors, were purchased. Road network data were obtained from OpenStreetMap (https://www.openstreetmap.org/, accessed on 20 April 2023). Land use data were obtained using area of interest data from AMap and land use planning data from the government. In addition, sampling points were set up every 100 m along the road network, and panoramic images with four orientations were captured at each sampling point via the Baidu Map Application Programming Interface, resulting in a total of 85,514 SVIs collected in the study area. The PSPNet semantic segmentation model trained on the Cityscapes dataset (https://www.cityscapes-dataset.com, accessed on 1 August 2024) was used to extract the micro-built environment elements (Figure 3). This method has been widely used to quantify the perception of urban environment [48,49].

2.2.3. Covariates

The effects of the built environment on community life circles’ vitality may also be moderated by socio-economic factors. Previous studies have demonstrated that variables such as building age and housing prices play a crucial role in shaping urban vitality. For example, Li et al. found that building age was positively related to urban vitality [5]. Yu et al. identified an inverted U-shaped relationship between housing prices and urban vitality based on an analysis of 288 Chinese cities [50]. Jin et al. highlighted that the spatial explanation of the built environment on urban vitality exhibits significant heterogeneity between established and newly developed urban areas [51]. Additionally, some researchers have emphasized the importance of incorporating social equity into urban vitality studies, particularly considering aging groups [52,53]. The age structure of a population directly influences the behavioral patterns and needs of different demographic groups [54]. Therefore, to fully understand the drivers and spatial differentiation of urban vitality, it is essential to consider both the built environment and socio-economic factors. In this study, the average building age and housing prices, as well as the proportion of the older adult population within community life circles (older adults are those 60 years and above), were included as covariates.
Building age and house price data were obtained from Anjuke (https://xa.fang.anjuke.com/, accessed on 25 April 2023), which is a leading real estate trading platform in China. Population age data were derived from the 100 m precision population density dataset provided by WorldPop 2020 (https://www.worldpop.org/, accessed on 25 April 2023) and revised based on the seventh national census. This process accounted for the limitations of the lower spatial precision of the census data and compensated for the absence of age information in the high-resolution population density dataset.

2.3. Spatial Autocorrelation

Moran’s I was applied to explore the spatial distribution of community life circles’ vitality. This study mapped community life circles’ vitality on the corresponding 3346 residential housing boundaries as spatial units. Global Moran’s I takes a value within the range of [−1, 1], where a value close to 0 indicates a spatially random distribution, and vice versa. Its formula is shown below:
I = n W × i = 1 n j = 1 n w i j X i X ¯ X j X ¯ i = 1 n X i X ¯ 2
In Formula (1), n is the total number of spatial units, w i j is the spatial weight matrix of i and j , W is the sum of all spatial weight matrices, and X i and X j are the values of vitality in spatial units i and j . X ¯ is the average value of vitality in all spatial units.
Local Moran’s I serves as a local indicator of spatial association, which can reflect the spatial difference between a spatial unit and its surroundings in detail. When the value of Local Moran’s I is positive, it means that there is a spatial pattern of “high–high or low–low” aggregation, whereas if the value is negative, there is a dispersion between high and low values. The formula is shown below:
I i = X i X ¯ S i 2 j = 1 , j i n w i j X j X ¯
S i 2 = j = 1 , j i n w i j X j X ¯ 2 n 1
In Formulas (2) and (3), S i 2 is the local variance in spatial unit i . In this study, ArcGIS was used to calculate and visualize the spatial distribution patterns of high and low values of community life circles’ vitality to target key areas for urban planning interventions.

2.4. Machine Learning Models

2.4.1. Model Selection

In this study, three commonly used machine learning models were built, and the best-performing model was selected as the final modeling tool by comparing the performance of each model.
  • Random Forest (RF) is a decision tree algorithm based on the idea of bagging in integrated learning. RF is able to handle input samples with high-dimensional features without dimensionality reduction. Therefore, it is adaptable to the dataset.
  • Gradient Boosting Decision Tree (GBDT) is a decision tree algorithm based on the idea of boosting in integrated learning. It uses the gradient boosting method of continuous iteration to gradually correct residuals, so it has advantages in dealing with regression problems.
  • eXtreme Gradient Boosting (XGBoost) is an optimization machine learning algorithm proposed by Chen et al. [55] based on GBDT. XGBoost adds a regularization term, which is helpful in preventing the overfitting of the model, and performs a second-order Taylor expansion of the loss function. Therefore, the generality and applicability of this model are better.
In this study, built environment and socio-economic variables served as explanatory variables and community life circles’ vitality served as the dependent variable, which were used to conduct experiments using different machine learning regression algorithms. Four metrics, including MSE, RMSE, MAE, and R2, were used to evaluate model performance. The formula is shown below:
M S E = 1 m i = 1 m ( y i y ^ i ) 2
R M S E = 1 m i = 1 m ( y i y ^ i ) 2
M A E = 1 m i = 1 m y i y ^ i
R 2 = 1 i ( y i y ^ i ) 2 i ( y ¯ i y i ) 2
In Formulas (4)–(7), y i is the true value of vitality and y ^ i is the corresponding predicted value generated by the model.

2.4.2. Machine Learning Interpretation Tool—SHAP

Although machine learning models have high predictive accuracy, their complexity often leads them to be regarded as “black box” models. To improve model interpretability, interpretable machine learning (IML) tools, such as Partial Dependency Plots (PDPs), SHapley Additive exPlanations (SHAP), and Local Interpretable Model-agnostic Explanations (LIME), can be employed to reveal the transparency of the model decision-making process. These tools help to visualize model results and provide clear explanations of the contribution of each variable to the predictions and their complex effects.
In this study, SHAP was selected to assess the importance of the variables in predicting community life circles’ vitality. SHAP offers greater explanatory ability and stability than PDPs and LIME. This is because, while PDPs are typically used to identify the global impact of variables, they do not provide explanations at the individual level. LIME focuses on localized explanations but struggles to comprehensively evaluate the overall contribution of variables. SHAP is based on the principle of fair distribution from game theory. By calculating the marginal contribution of variables across all possible combinations, SHAP can provide local explanations for each individual sample while also revealing the global importance of variables [56]. This makes SHAP more advantageous than PDPs and LIME in urban studies.
While SHAP can quantify the importance of variables and reveal their threshold effects, it cannot directly capture spatial differences. Models, such as geographically weighted regression (GWR) and multi-scale geographically weighted regression (MGWR), can analyze the spatial heterogeneity in variables. However, they are still fundamentally based on the assumption of simple linear relationships, which limits their ability to capture complex effects. To address this gap, this study employed geographic visualization of SHAP values to show the spatial variation in SHAP values. This approach allowed for a more in-depth exploration of the contribution of each variable to vitality and its spatial heterogeneity, thereby providing more refined decision support.

3. Results

3.1. Spatial Distribution of Community Life Circles’ Vitality

Figure 4 illustrates the spatial characterization of community life circles’ vitality with different buffer zones and the statistics of vitality in each district. As shown in Figure 4a, community life circles’ vitality shows a more pronounced core–edge pattern as the buffer zone increases. Areas with high vitality (dark red) are mainly concentrated between the first and second ring roads, as well as the southwest and north sides of the second ring road. Figure 4b shows that the clustering pattern of vitality is relatively stable across the buffer zones. High–high clusters are predominantly located near the south and north second ring roads, which include the traditional core residential areas and the emerging commercial areas of Xi’an. Conversely, low–low clusters are concentrated on the southwest side of the third ring road, where historic and cultural preservation zones and low-density residential areas dominate, and urban development is comparatively less intense.
The statistical results of community life circles’ vitality (Figure 4c) indicate that there is a significant difference in vitality across different districts. Beilin has the highest level of vitality, followed by Xincheng and Lianhu. These three districts are close to the center of Xi’an and benefit from earlier development, higher population densities, and well-developed public services. In contrast, Baqiao, a peripheral urban district, has the lowest level of vitality, which may be related to its relatively slower urban development process.

3.2. Data Preprocessing and Modeling

To improve the predictive accuracy of the machine learning models, data preprocessing was conducted on the 19 explanatory variables. First, the overall distribution characteristics of the variables were analyzed using box plots, and outliers were removed to ensure the stability and reliability of the data. Second, variable selection was applied as an important step to reduce data dimensionality and improve model generalization. In this study, the Pearson correlation coefficient and variance inflation factor (VIF) were used as criteria for selecting variables and addressing multicollinearity (Figure 5). Variables with a Pearson correlation coefficient greater than 0.8 and a VIF over 10 were excluded. In the end, 18 variables were retained, except for facility density.
After preprocessing the 3346 samples, 70% of the data was used for model training, while the remaining 30% was reserved as the test set for model validation and comparison. This study referred to optimal hyperparameter configurations from the previous literature and employed grid search combined with cross-validation to optimize model performance across multiple hyperparameter combinations. The models were evaluated using several metrics: MSE, RMSE, MAE, and R2 (Table 3). The results showed that XGBoost exhibited the best overall predictive performance. The final hyperparameter configurations were as follows: learning_rate = 0.001, max_depth = 10, and n_estimators = 1000.

3.3. Interpretation of Complex Relationships Based on XGBoost-SHAP

3.3.1. Contribution of Explanatory Variables to Community Life Circles’ Vitality

This study utilized the feature importance of SHAP values to reveal the effect of explanatory variables on community life circles’ vitality (Figure 6).
Figure 6 illustrate the contribution of built environment features to community life circles’ vitality and the SHAP feature importance analysis within the 5-min, 10-min, and 15-min community life circles, respectively. The pie chart on the left represents the contribution rate of built environment features to the community life circles’ vitality. Different colors indicate the contribution proportions of the micro-variables, macro-variables, and covariate variables. A higher percentage suggests a greater importance of that category in influencing vitality. The plot on the right visualizes the SHAP feature importance, demonstrating the direction and magnitude of each variable’s impact on vitality. Red indicates high feature values, while blue represents low feature values. If a high feature value corresponds to positive SHAP values, the variable has a positive impact on vitality. Conversely, if a high feature value corresponds to a negative SHAP value, the variable negatively influences vitality. Table 4 presents the top five built environment variables most strongly associated with community life circles’ vitality.
As shown in Figure 6, the macro-built environment contributes significantly to community life circles’ vitality. Within the 15-min community life circles, it has the highest contribution of 83.3% to vitality. Among them, both facility accessibility and the floor area ratio show stable positive effects. As the buffer zones increase, the positive contribution of facility accessibility increases from 29.7% to 41.2%, while the positive contribution of the floor area ratio does not change significantly. This suggests that at a larger spatial scale, facility accessibility has a stronger effect than the floor area ratio in enhancing spatial attractiveness.
For the 5-min community life circles, except for facility accessibility and the floor area ratio, distance to the nearest park and metro station are two macro-built environment variables that rank high in terms of contribution. The further away the park is from the residential housings, the higher the 5-min community life circles’ vitality. This may be due to the fact that if parks are located too close to residential housing, their overly homogenous functionality could limit the variety of activities available to residents. In contrast, parks located at a reasonable distance from residential housings encourage longer walking activities, promoting the use of additional facilities and diversifying activity spaces and social opportunities. This, in turn, helps to enhance the overall community life circles’ vitality. Distance to the nearest metro station has a negative effect. This may be related to the convenient transport services provided by metro stations.
For the 10-min and 15-min community life circles, in addition to facility accessibility and the floor area ratio, the variables that contributed significantly were, in order, intersection density and the residential land use ratio. Intersection density is positively related to vitality. This relationship is primarily related to road connectivity and accessibility. More intersections usually mean a better walking experience and greater accessibility, which promotes more social and economic activities and enhances community life circles’ vitality. The residential land use ratio is also positively correlated with vitality. This may be because a higher proportion of residential land use typically implies a denser residential population. Higher population density promotes more social interactions, greater demand for public services, and a higher level of commercial activities, all of which contribute to the community life circles’ vitality. Additionally, a higher residential land use ratio often facilitates the development of essential neighborhood services, such as shops, schools, healthcare, and green spaces. These services better meet the daily needs of residents, making the area more convenient. Moreover, well-developed services not only improve residents’ quality of life but also attract new residents and businesses, further boosting the community life circles’ vitality.
The contribution of the built environment and socio-economic variables is significantly lower compared to the macro-built environment. The micro-built environment has the highest contribution to vitality in the 5-min buffer zones, accounting for 8.2%. The street view green ratio and the sidewalk ratio have positive effects. This is related to the fact that both can improve the walking experience and thus can motivate more residents to walk around. However, as the buffer zones increase, the contribution of the micro-built environment in the 15 min community life circles decreases to 2.3%. This suggests that whilst the micro-built environment can influence vitality locally, it becomes nearly negligible at a larger scale. In contrast, the influence of socio-economic variables on community life circles’ vitality shows a more stable contribution across different buffer zones, contributing 15.5%, 14.3%, and 14.4%, respectively. Among them, the proportion of the older adult population has a significant negative impact on the 5-min community life circles’ vitality. The higher the proportion, the lower the vitality. This result could be related to the reduced physical activity levels of older adults. For the 15-min community life circles, building age is negatively correlated with vitality, suggesting that newer buildings generally have lower vitality.

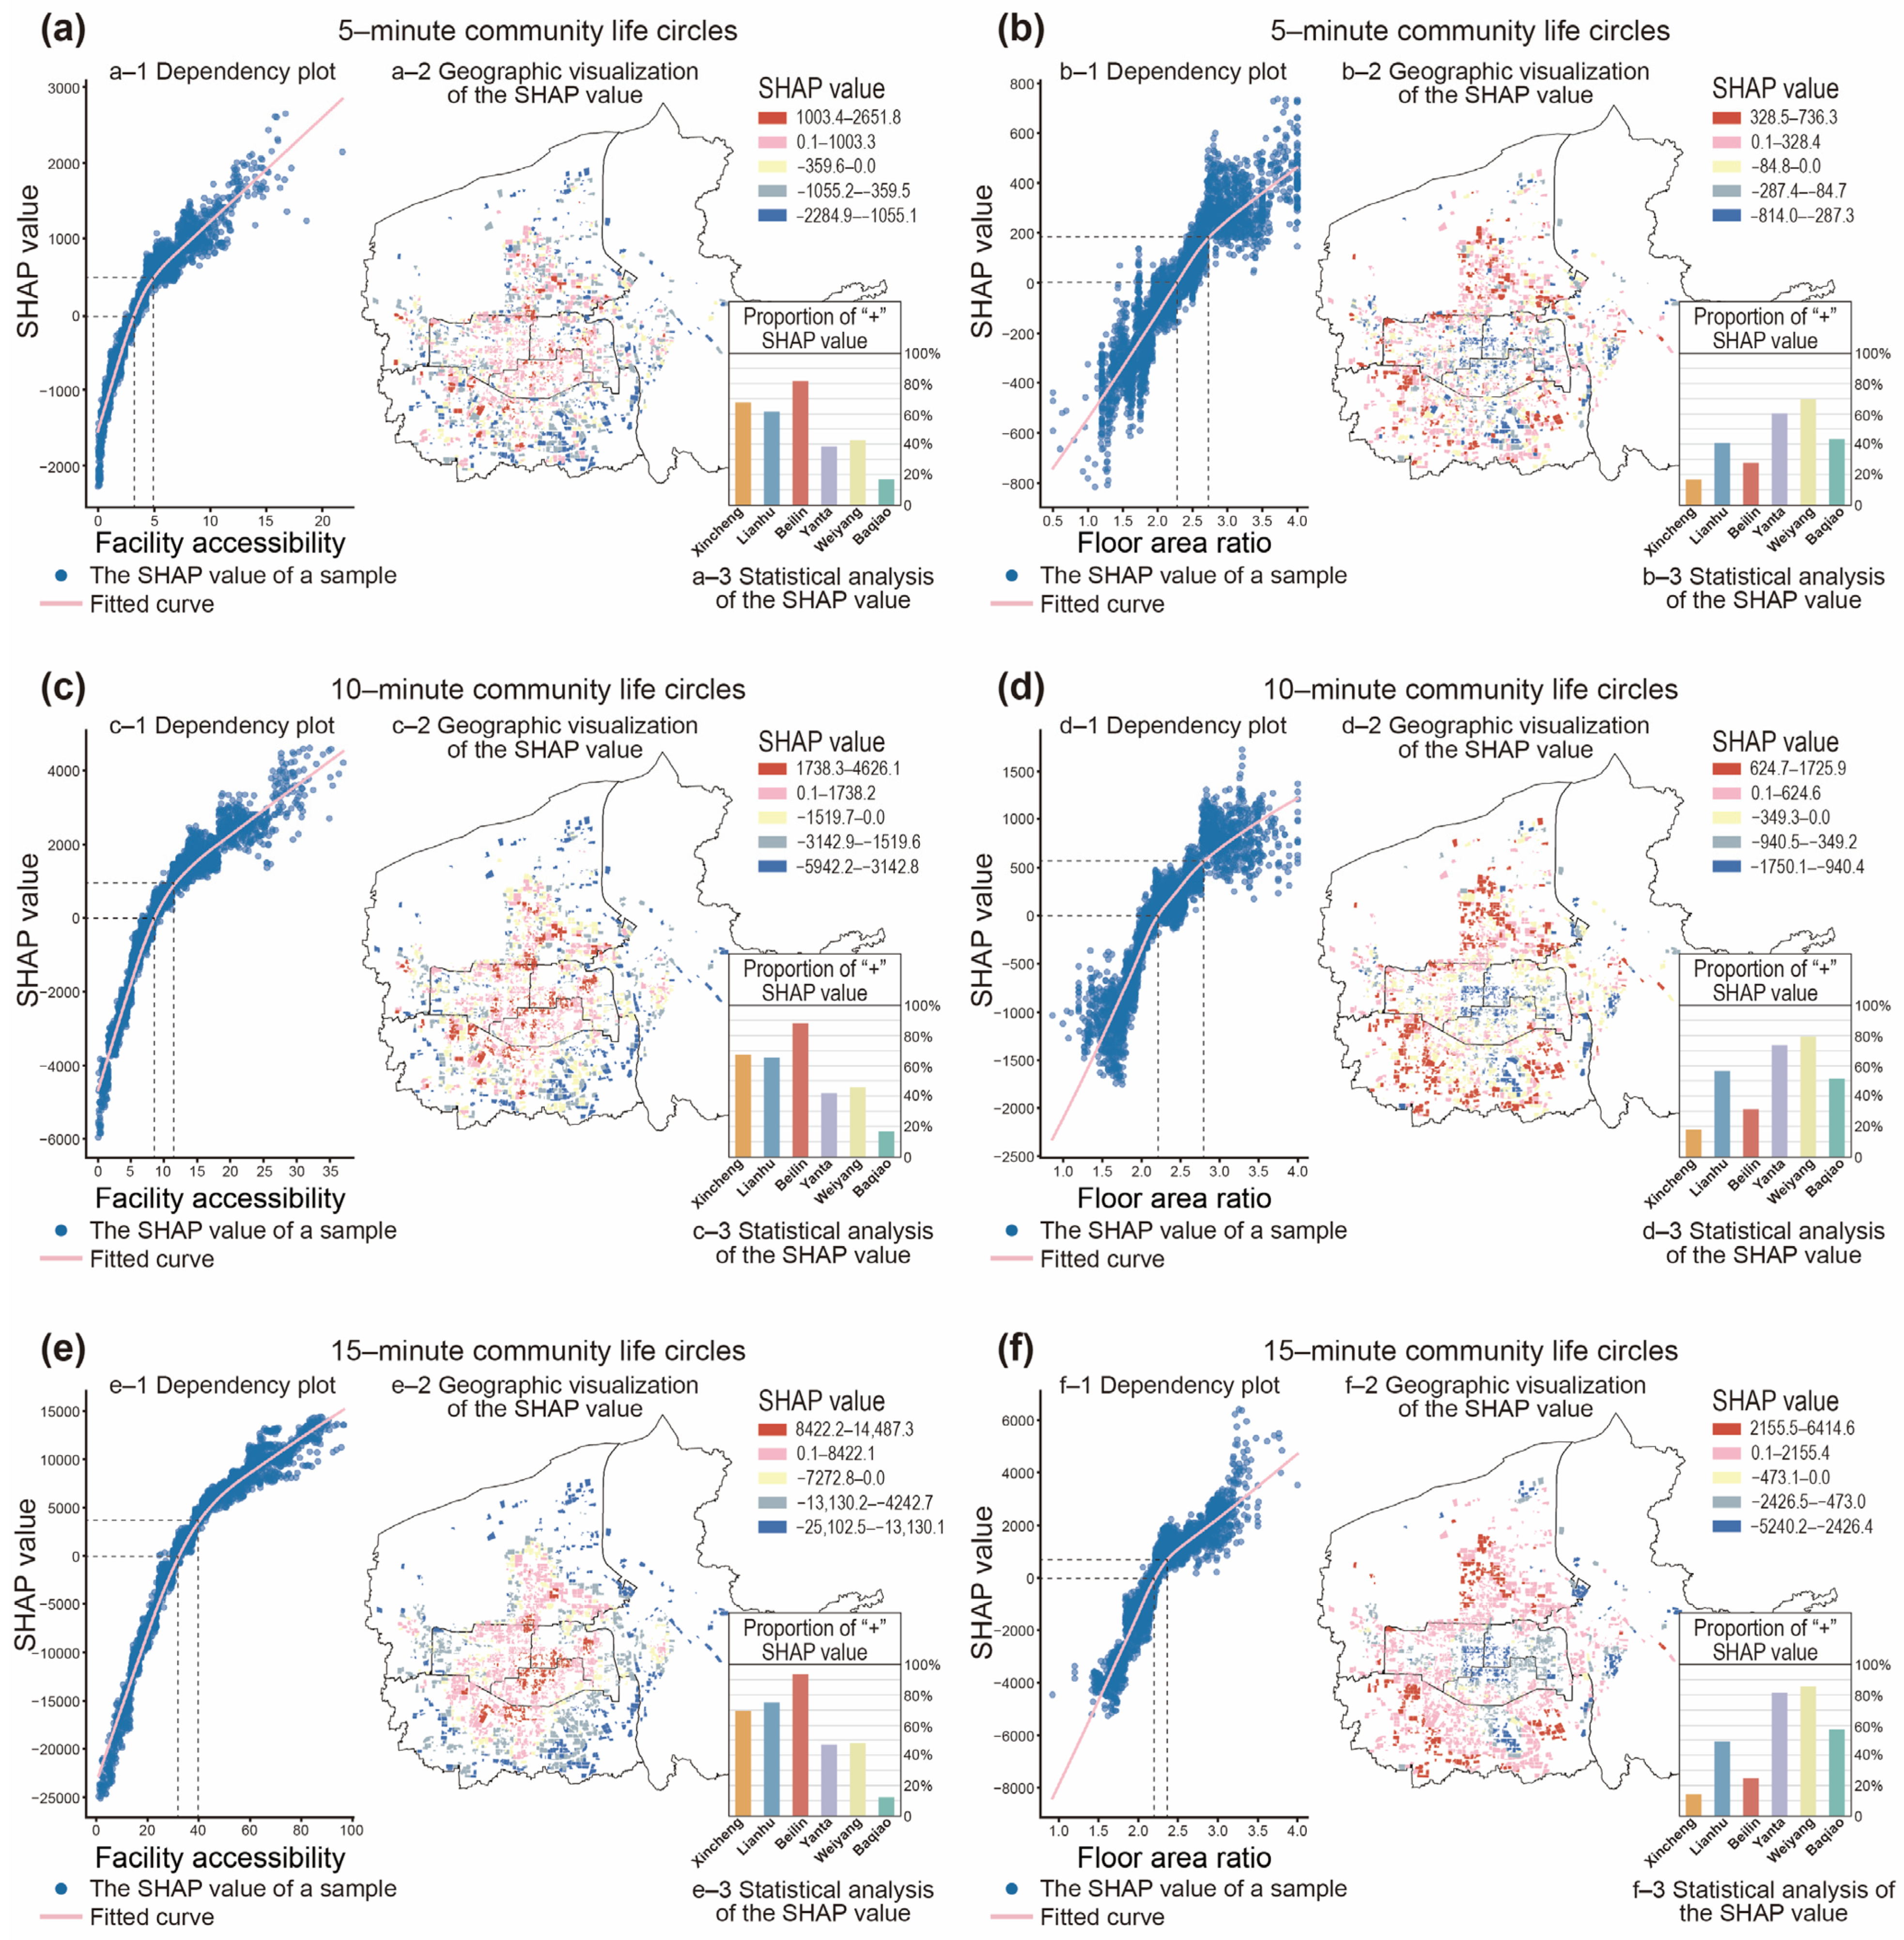
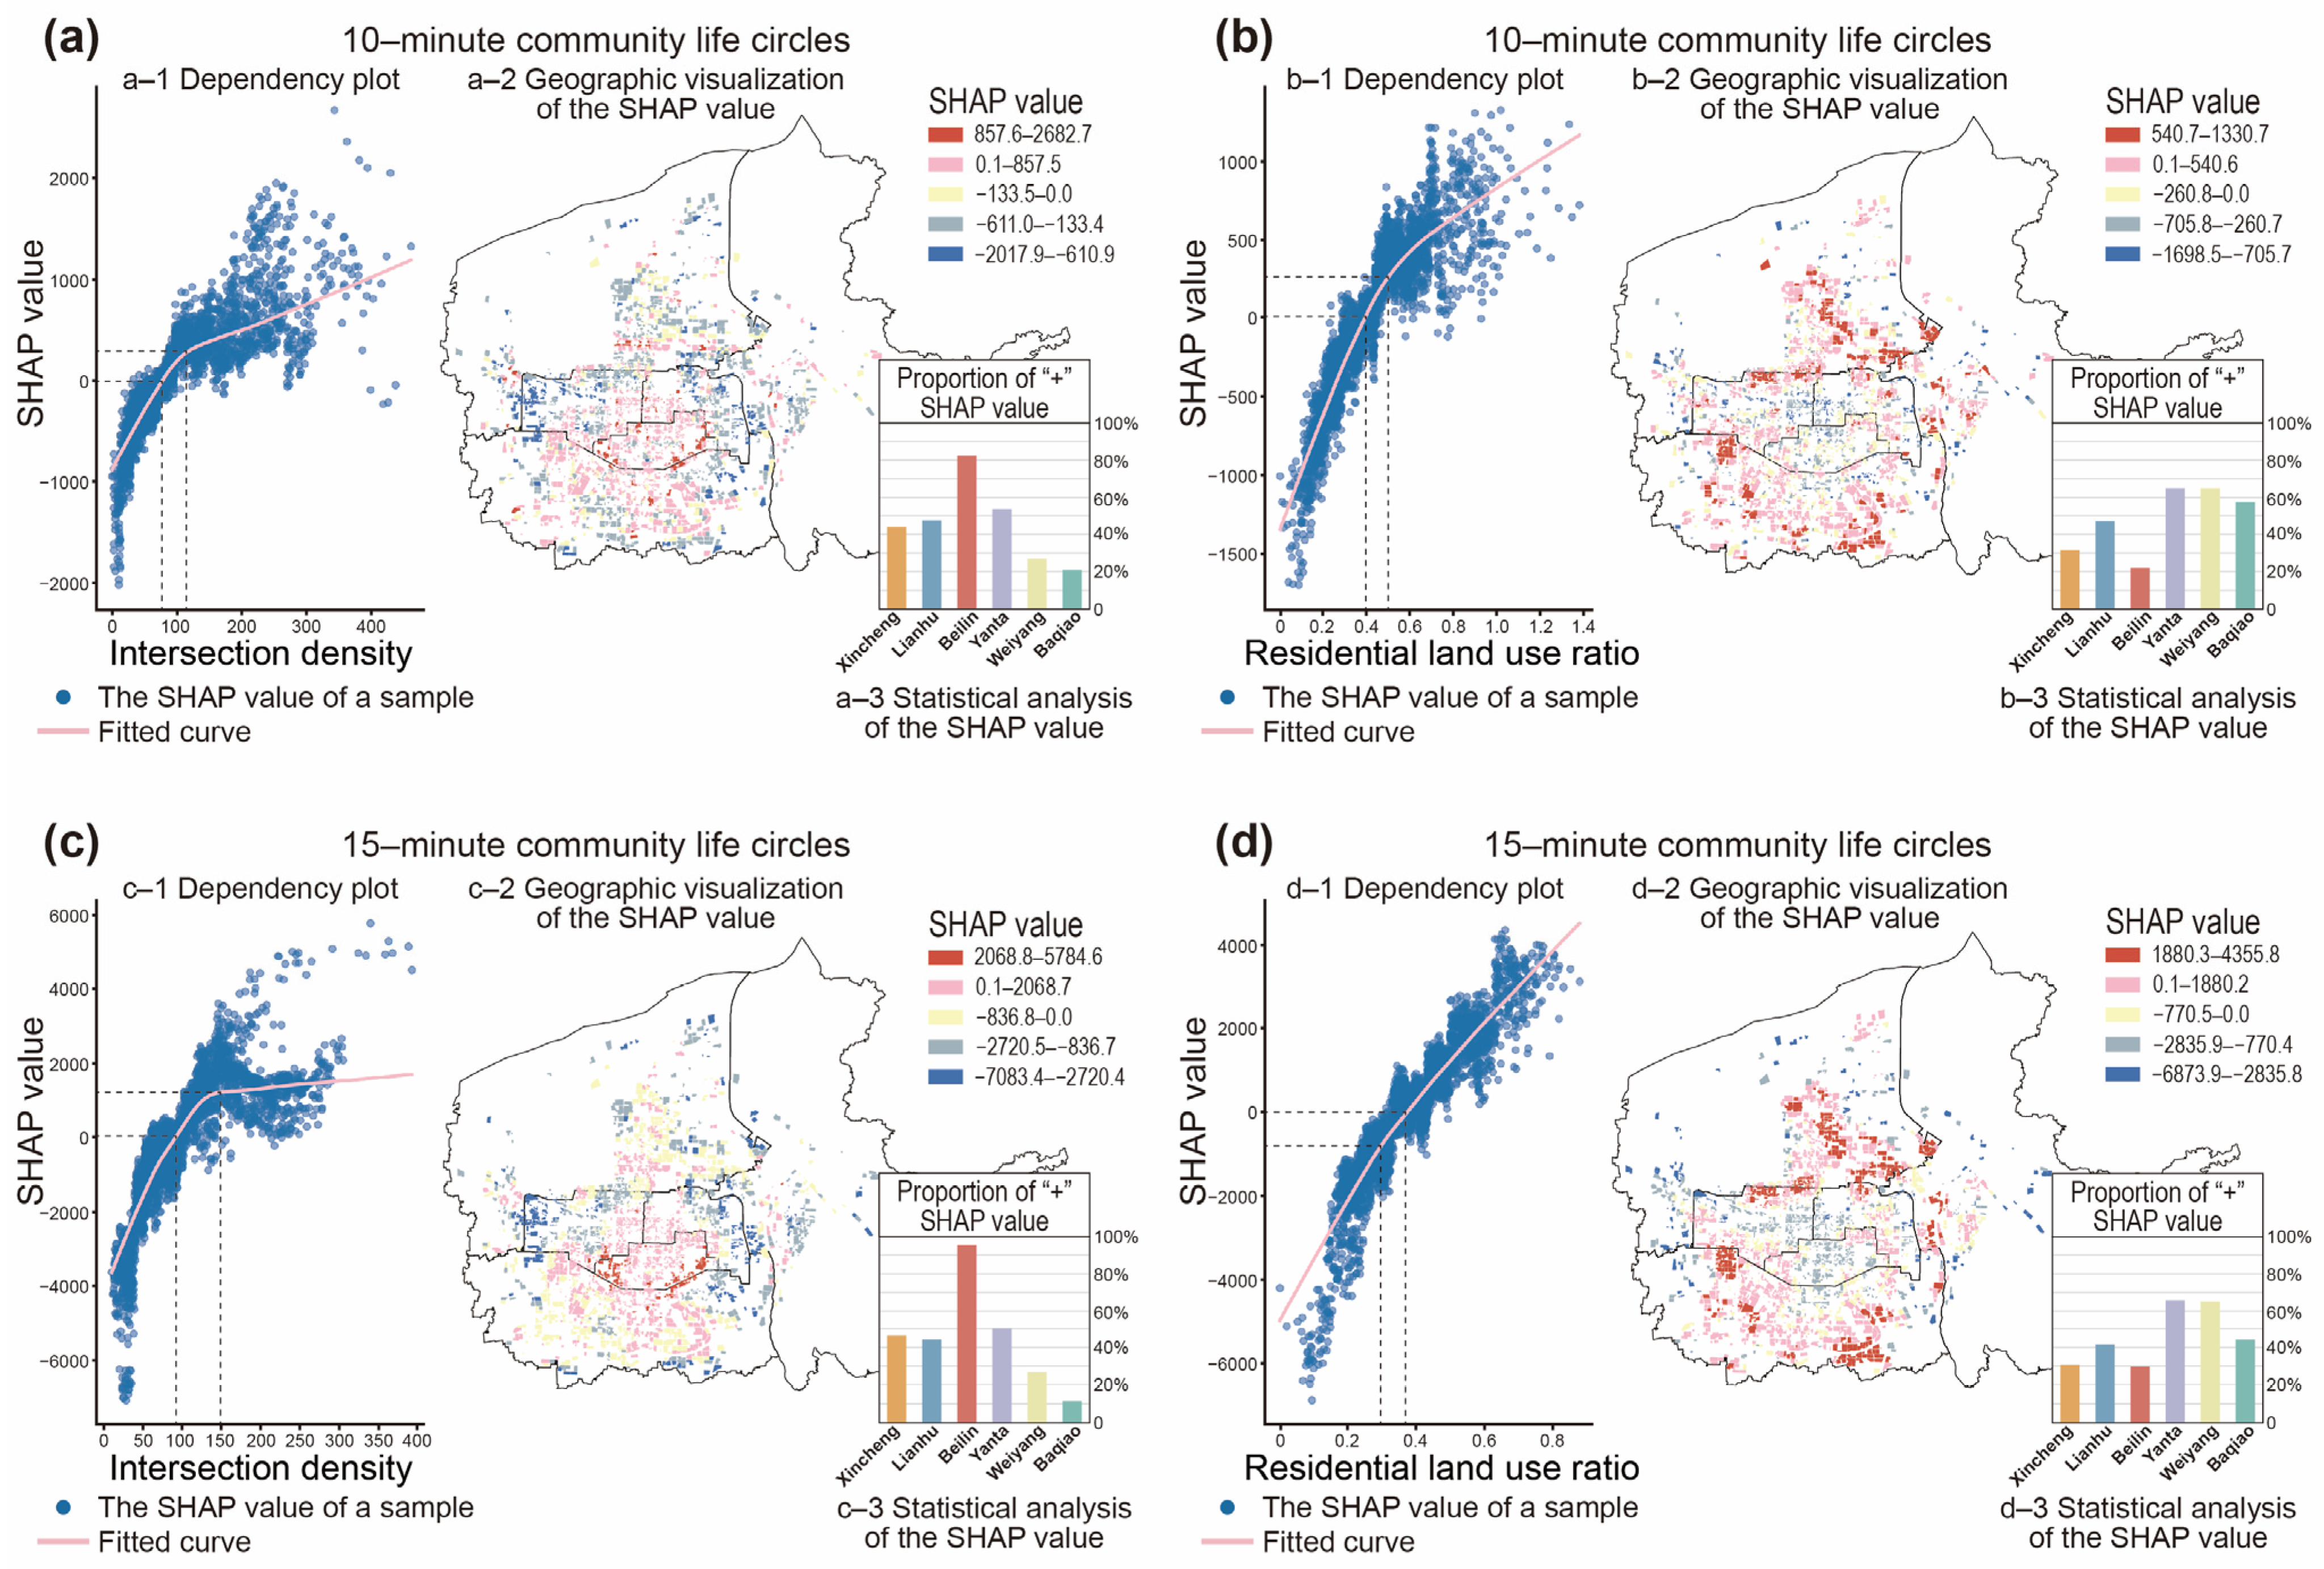
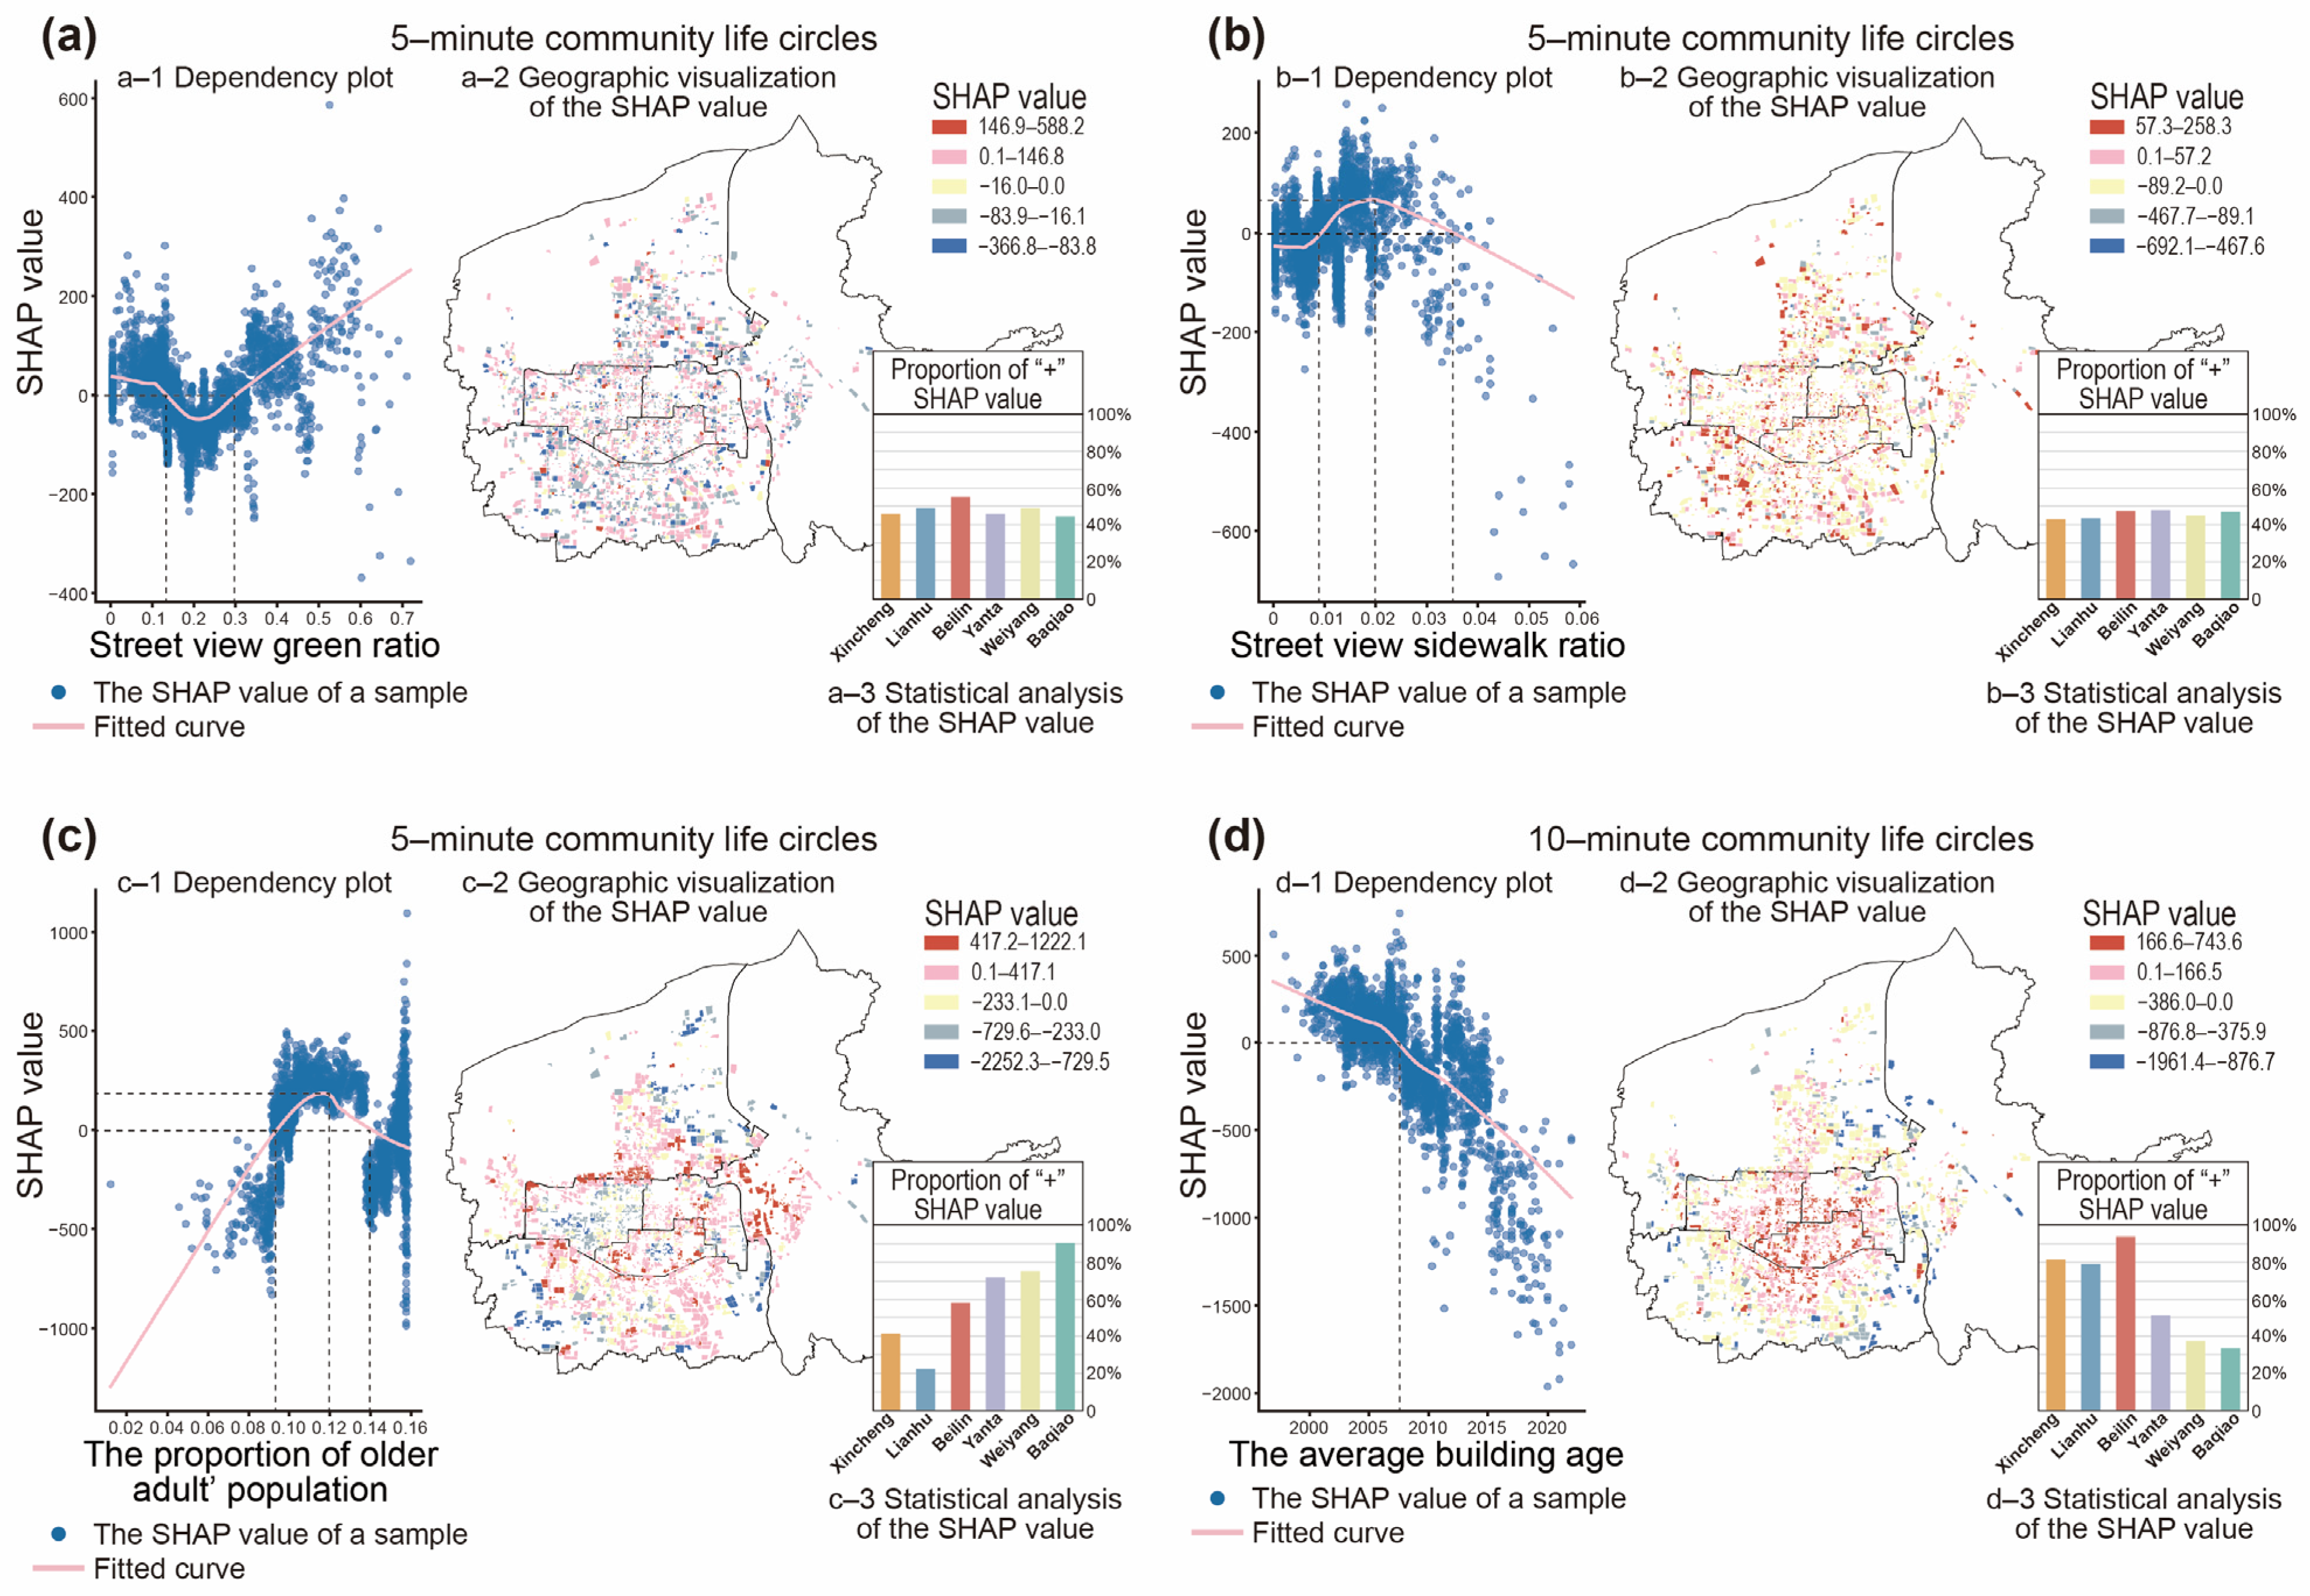
3.3.2. Geographic Relationships Between the Built Environment and Community Life Circles’ Vitality

To reveal the threshold effects and spatial heterogeneity in the impacts of each explanatory variable on community life circles’ vitality, first, this study utilized SHAP feature dependency plots to explore the complex relationships between the explanatory variables and vitality. These dependency plots clearly illustrate the distinct patterns of influence that each explanatory variable has on vitality, particularly highlighting any threshold effects or inflection points that emerge as specific variables change within defined ranges. Second, this study further investigates the geospatial variations in these complex relationships by conducting a geographic visualization of the SHAP values. This approach is able to present the spatial heterogeneity in the effects of each explanatory variable in different regions, providing quantitative support for future urban renewal or planning. Building on this visualization, we calculated Moran’s I for the SHAP values of each variable to statistically assess spatial clustering patterns (see Appendix A, Table A2). The results indicate that the Moran’s I values of the SHAP variables are significantly close to 0, suggesting a high degree of spatial heterogeneity in the effects of the built environment on community life circles’ vitality. Finally, a statistical analysis of the SHAP values within different districts was conducted to better understand the differential impacts of the explanatory variables on vitality in various urban contexts. This analysis provided a foundation for targeted adjustments to urban planning strategies.
Figure 7, Figure 8 and Figure 9 illustrate the impact trends and spatial heterogeneity in the selected built environment variables within the vitality of different community life circles. The scatter plots on the left depict the relationship between each variable and the community life circles’ vitality, with the pink line representing the fitted trend. The SHAP values on the vertical axis indicate the magnitude and direction of the variable’s impact, where positive values suggest a positive effect on vitality and negative values indicate a negative effect. The geographic visualization on the right presents the spatial distribution of the SHAP values, illustrating the regional variations in each variable’s influence on the community life circles’ vitality. The red areas indicate regions where a variable has a strong positive effect, while the blue areas represent regions with a negative influence. The bar charts further summarize the proportion of positive SHAP values in different districts, highlighting the spatial heterogeneity in each variable’s impact.
Figure 7 demonstrates the complex effects of facility accessibility and the floor area ratio across different buffer zones. For facility accessibility, significant positive effects on vitality are observed at values between 3 and 5, 9 and 11, and 32 and 40; then, these positive effects gradually decrease (Figure 7a,c,e). These positive effects are mainly concentrated in the central urban districts (e.g., Xincheng, Lianhu, Beilin), whereas, in the peripheral urban districts (e.g., Yanta, Weiyang, Baqiao), the relationships between facility accessibility and vitality are negative. Regarding the floor area ratio, when it is at 2.3–2.7, 2.2–2.8, and 2.2–2.4, it has positive effects on vitality; then, the effects gradually decrease (Figure 7b,d,f). The positive effects of the floor area ratio are particularly pronounced in Yanta and Weiyang.
Intersection density is positively correlated with vitality when the intersection density reaches 80–120 per km2 and 90–150 per km2 in the 10-min and 15-min community life circles, respectively. Beyond these thresholds, the positive effect gradually stabilizes with further increases in intersection density (Figure 8a,c). The positive effect of intersection density on vitality is particularly significant in Beilin. When the residential land use ratio exceeds 0.4 within 10-min community life circles and 0.3 within 15-min community life circles, it is positively correlated with vitality, and this positive effect is particularly prominent in Yanta and Weiyang, respectively (Figure 8b,d). This phenomenon can be attributed to the large-scale residential development projects implemented in these two regions.
Figure 9 illustrates the complex effect of the micro-built environment characteristics (street view green ratio, street view sidewalk ratio) on the 5-min community life circles’ vitality and socio-economic factors (proportion of older adult population, building age) on the 5-min and 15-min community life circles’ vitality. The street view green and sidewalk ratios have a significant threshold effect on the 5-min community life circles’ vitality (Figure 9a,b). Both are positively associated with vitality when the street view green ratio is higher than 0.3 and the sidewalk ratio is between 0.009 and 0.035; these positive effects are more evenly distributed across the study area. The proportion of the older adult population is positively correlated with the 5-min community life circles’ vitality when it falls between 0.09 and 0.14, peaking at 0.12 (Figure 9c). This positive effect is particularly significant in peripheral urban districts (e.g., Yanta, Weiyang, Baqiao). After 2007, the relationship between building age and the 15-min community life circles’ vitality shifted from positive to negative (Figure 9d). The positive effect is significant in the central urban districts (e.g., Xincheng, Lianhu, Beilin), while the negative effect is mainly concentrated in the peripheral urban districts (e.g., Yanta, Weiyang, Baqiao).

4. Discussion

4.1. Complex Geographic Relationships Between Multi-Factors and Community Life Circles’ Vitality

China’s urbanization has entered a new phase, and promoting population growth has become a crucial resource for urban development. In recent years, Xi’an has improved its urban environment and public service through the implementation of policies, such as urban renewal, further enhancing urban vitality and quality of life for residents. According to the 2022 China Urban Vitality Report, Xi’an ranks 12th nationwide in terms of its overall urban vitality index. Although the drivers of urban vitality have gained widespread attention, the existing studies have focused on the urban or neighborhood scale, often overlooking the importance of community life circles’ vitality in the context of new urbanization. Moreover, in addition to macro-built environment factors, resident perception plays an equally crucial role in fostering community life circles’ vitality. Therefore, this study explores the drivers of community life circles’ vitality in Xi’an, which is characterized by dense residential populations and a long history of urban development. It innovates by focusing on the variation in built environment impacts on community life circles’ vitality across different distance scales (5, 10, and 15-min). It also develops a comprehensive measurement system for assessing both the macro- and micro-aspects of built environment features, using tools like semantic segmentation to capture variables, such as the street view green ratio and the buildings ratio. Furthermore, this study explores the spatial heterogeneity in built environment impacts on community life circles’ vitality, identifying specific areas where interventions would be most effective. This study aims to provide both theoretical support and practical guidance for enhancing urban life quality and promoting urban vitality.
The results show that community life circles’ vitality is strongly influenced by the built environment and exhibits both significant threshold effects and spatial heterogeneity. First, the macro-built environment contributes significantly to community life circles’ vitality, especially in the 15-min community life circles. Its contribution can reach 83.3%. Facility accessibility contributes the most, consistent with the findings of previous studies [5,57]. This is because facility accessibility can improve residents’ ability to access services, which promotes the clustering of people, commercial prosperity, and social interaction [58]. All of these contribute to increased vitality. This study further explores the above findings by using the XGBoost model and SHAP method, and the findings show that the impact of facility accessibility on community life circles’ vitality has a scale effect. As the buffer zones increased, the contribution of facility accessibility is 29.7%, 30.2%, and 41.2%, respectively, indicating that facility accessibility is a determinant of the 15-min community life circles’ vitality. Moreover, the optimal thresholds of facility accessibility in the 5-min, 10-min, and 15-min community life circles are between 3 and 5, 9 and 11, and 32 and 40, respectively. Notably, this positive effect of facility accessibility gradually decreases from the urban center to the periphery. This suggests that in central urban areas, where facility density is already high, the focus should be on optimizing the layout of facilities to enhance service efficiency. In contrast, in peripheral areas, there is a need for targeted planning and additional facilities to strengthen vitality, thereby maximizing the overall community life circles’ vitality.
Second, the floor area ratio is the second most significant factor influencing community life circles’ vitality, contributing approximately 9%. As a key indicator for quantifying the intensity of land use development, the floor area ratio is widely recognized for promoting the agglomeration of populations and activities and enhancing the capacity to provide facilities, which, in turn, boosts urban vitality [12]. He et al. found that an increase in the floor area ratio significantly enhanced urban vitality [18]. However, unlike their finding, this study identifies a greater spatial heterogeneity in the effect of the floor area ratio on community life circles’ vitality. The positive effect is mainly concentrated in the peripheral urban districts (e.g., Yanta, Weiyang, Baqiao), with an optimal threshold of 2.2–2.8. Therefore, for the central urban districts (e.g., Xincheng, Lianhu, Beilin), the floor area ratio should be increased appropriately to optimize land use efficiency and promote the effective use of spatial resources. However, for peripheral urban districts, although an improved floor area ratio can help enhance vitality, attention must be paid to the threshold effect of the floor area ratio to prevent potential negative impacts of overdevelopment, such as traffic congestion, excessive residential density, and the deterioration of environmental quality.
Third, intersection density and the residential land use ratio contribute positively to the vitality of the 10- and 15-min community life circles, with contribution rates reaching no less than 7%, making them the second most significant factors after the floor area ratio. This finding aligns with similar studies, such as those by Jacobs and Wang et al. [8,12]. A higher intersection density typically indicates a more compact and well-connected street network, which enhances the accessibility of urban spaces and promotes pedestrian activity [18]. The complex analysis reveals that the positive impact of intersection density peaks at 80–120 intersections/km2 in the 10-min community life circles and performs optimally at 90–150 intersections/km2 in the 15-min community life circles. In addition, the positive impact of intersection density is more significant in Beilin, which is closely tied to recent efforts to optimize the urban road network in this district through measures such as opening up cut-off roads, widening feeder roads, and opening up closed-yard gates. These urban renewal efforts have effectively increased the density of the road network, making this district the first to meet the relevant provisions of the “Urban Comprehensive Transport System Planning Standards” [59]. In addition, the positive impact on vitality gradually increases after the residential land use ratio reaches 0.4. Comparing the requirements in the “Urban Residential Area Planning Standards” [27] (at least 0.6 for 10-min community life circles and at least 0.48 for 15-min community life circles), this finding suggests that the existing standards for residential land use can effectively promote the agglomeration of residents, thus contributing to community life circles’ vitality.
Fourth, although the micro-built environment contributes significantly less to community life circles’ vitality than the macro-built environment, variables such as the street view green and sidewalk ratios positively influence the 5-min community life circles’ vitality, contributing about 2.5%. One possible reason for this is that the effects of the micro-environment are typically highly localized [58,60]. As a result, the influence of these variables tends to be overshadowed by macro-built environment characteristics, especially at the scale of larger buffer zones. Within the 5-min community life circles, positive impacts are observed when the street view green ratio reaches 30% and the sidewalk ratio exceeds 2%. However, these positive impacts are more dispersed across the study area. Therefore, we recommend integrating strategies to optimize streetscape greenery and sidewalk design with improvements in the macro-built environment to maximize the positive effect of the micro-built environment on community life circles’ vitality.
In addition, although the built environment is a key explanatory factor for community life circles’ vitality, this study also reveals a non-negligible effect of building age and the proportion of the older adult population. Building age has a negative effect on the 15-min community life circles’ vitality, which aligns with the findings of previous studies [5,61]. This negative effect is particularly prominent in peripheral urban districts (e.g., Yanta, Weiyang, Baqiao). A possible reason for this is that newly built residential housings are mostly located in these districts and are usually monofunctional with inadequate services and facilities. As a result, residents tend to rely on external transport for commuting, leading to limited social interaction and low vitality [62]. In contrast, older residential housings are often located close to the urban center and benefit from mature and highly accessible commercial and public service facilities. Compared to building age, the proportion of the older adult population has received less attention in previous studies. This study points out that there is a significant threshold effect of the proportion of the older adult population on 5-min community life circles’ vitality. Its positive effect peaks when the proportion of the older adult population is about 12%. In contrast to some studies that argue that aging leads to lower urban vitality [52,53], our study argues that older people can be an important driver of community life circles’ vitality. Therefore, in response to an increasingly aging population, we recommend optimizing the pedestrian environment, enhancing neighborhood commercial and service facilities, and developing public spaces that cater to the needs of age-friendly communities to fully harness their potential contribution to urban vitality.

4.2. Spatial Heterogeneity in the Effects of the Built Environment on Community Life Circles’ Vitality: The Role of Building Typologies

This study highlights significant spatial heterogeneity in the influence of built environment variables on community life circles’ vitality, including facility accessibility, the floor area ratio, intersection density, and residential land proportion. While the design of building typologies was not directly quantified in this study, the indirect relationship between these variables and architectural design underscores the relevance of our findings to discussions on urban morphology. Incorporating perspectives from building design can help to better understand the mechanisms behind these spatial differences.
In central urban districts, facility accessibility and intersection density have particularly strong positive effects on community life circles’ vitality. This is attributed to the traditional urban fabric, characterized by compact blocks and a dense street network. Also, these districts often feature mid-rise or low-rise residential buildings with active ground floors hosting retail stores, services, or communal spaces. As a result, these buildings create human-scaled street interfaces that enhance walkability and visual engagement. Such building characteristics promote informal social interactions, contributing to the vibrancy of community life circles.
In contrast, peripheral urban districts are typically dominated by high-rise residential buildings with large setbacks and gated compounds. These buildings often lack ground-floor commercial use or active façades, leading to inactive and disconnected public realms. Meanwhile, the absence of well-designed, mixed-use building forms limits the potential for dynamic, pedestrian-oriented environments. In such settings, the floor area ratio and residential land proportion become the main contributors to vitality by concentrating the population.

4.3. Policy Implications for Improving Community Life Circles’ Vitality

Based on the discussed findings regarding the complex geographic relationship between community life circles’ vitality and various drivers, this study proposes the following strategies for the vitality-oriented design of community life circles:
(1)
Prioritize an improvement in facility accessibility and the floor area ratio. In central urban districts (e.g., Xincheng, Lianhu, Beilin), although there is a high density of facilities, there are still problems of uneven spatial distribution, overlapping services, or mismatch between supply and demand. Therefore, areas in these districts with low community life circles’ vitality should focus on improving facility accessibility to values of 3–5 (300 m buffer zones), 9–11 (500 m buffer zones), and 32–40 (1000 m buffer zones). In peripheral urban districts (e.g., Yanta, Weiyang, Baqiao), the floor area ratio should be moderately increased (e.g., controlled within the range of 2.2–2.8) to promote compact development and improve land use efficiency, thereby improving vitality.
(2)
Optimize road network connectivity and the residential land use layout within a 500–1000 m buffer zone. For areas in central urban districts (e.g., Xincheng, Lianhu, Beilin) with low 10-min and 15-min community life circles’ vitality, road network connectivity can be enhanced by adding branch roads, opening disconnected roads, and increasing the intersection density to 90–120/km2. In peripheral urban districts (e.g., Yanta, Weiyang, Baqiao), the residential land use ratio should be in accordance with the requirements of the “Urban Residential Area Planning Standards” and the clustering effect of land use should be capitalized to enhance community life circles’ vitality.
(3)
Enhance the quality of the micro-environment within a 300 m buffer zone to improve the walking experience. In addition to macro-environmental improvements, targeted interventions in areas with low 5-min community life circles’ vitality should focus on increasing the streetscape greenery ratio to at least 30% and upgrading the sidewalk design through renewal projects. These measures can create a pedestrian-friendly environment, encouraging residents to engage in walking activities and enhancing the overall community life circles’ vitality.
(4)
Implement age-friendly renovation and improve the convenience of living based on regional characteristics. For areas located in peripheral urban districts (e.g., Yanta, Weiyang, Baqiao), where the proportion of the older adult population in 5-min community life circles reaches 12%, it is crucial to complete age-friendly renovations within a 300 m buffer zone as soon as possible. The potential contribution of older adults to community life circles’ vitality should be fully tapped by creating public spaces suitable for their participation, especially in 5-min community life circles. At the same time, for areas with low vitality in 15-min community life circles, priority should be given to the establishment of “15 min 15-min convenient life circles”. This action is an important urban renewal policy that Xi’an has implemented in recent years. It aims to improve the convenience of residents living within a 15-min walking distance.
These strategies will provide flexible solutions for adjusting the built environment to improve community life circles’ vitality and the quality of life for residents.

5. Conclusions

As the basic spatial unit of urban life, community life circles shape a livable urban space through the rational allocation of built environment elements that align with the activity patterns of residents. Therefore, in-depth analyses of the influence of the built environment on urban vitality at the scale of community life circles can help to accurately guide the implementation of urban planning in the context of urban renewal. Taking Xi’an as an example, this study reveals the core–periphery structure of community life circles’ vitality by using Baidu heatmap data. A multi-source dataset consisting of 18 indicators, encompassing macro- and micro-characteristics of the built environment and socio-economic factors, is developed to identify and assess the key drivers of community life circles’ vitality.
Compared to previous studies, this study employs the XGBoost model with SHAP analysis and geo-visualization to address the complex relationships and spatial heterogeneity between the built environment and different community life circles’ vitality (5, 10, and 15-min). By integrating objective macro- and micro-variables, this approach provides a more comprehensive assessment of the built environment. Unlike traditional linear regression methods, our complex geographic approach effectively captures spatial dependence and heterogeneity at the building scale, offering refined, data-driven insights for urban planning in complex urban environments. The results indicate that (1) the macro-built environment has a significantly greater influence on community life circles’ vitality than the micro-built environment and socio-economic factors. (2) Facility accessibility and the floor area ratio emerge as the top two influential built environment variables on the vitality of community life circles. Intersection density and the residential land use ratio are the third and fourth critical variables to vitality in larger-scale community life circles (10-min and 15-min), while the micro-built environment (e.g., the street view green and sidewalk ratios) contributes positively to 5-min community life circles’ vitality. (3) The influence of each factor on community life circles’ vitality exhibits threshold effects and spatial heterogeneity. As a result, it is recommended that urban renewal strategies be differentiated according to the characteristics of central urban districts (e.g., Xincheng, Lianhu, Beilin) and peripheral urban districts (e.g., Yanta, Weiyang, Baqiao). (4) In addition to enhancing built environments, established urban renewal policies, such as age-friendly renovations and 15-min convenient life circles, should be combined. Emphasis should be placed on improving infrastructure and environmental conditions while considering the diversity of social groups and their needs, ultimately fostering broader community life circles’ vitality enhancement. These findings provide a scientific basis and data support for planning community life circles to enhance urban vitality.
However, this study has four limitations. First, the factors influencing community life circles’ vitality may differ between daytime and nighttime, as well as between weekdays and weekends. While this study primarily focused on overall community life circles’ vitality patterns, we acknowledge that the temporal dimension requires further exploration, particularly in areas that exhibit significant differences from others. Building on our findings regarding the spatial heterogeneity in the built environment’s impact on community life circles’ vitality, future studies could focus on a specific district and utilize high-resolution GPS tracking devices to capture detailed mobility trajectories, allowing for a more precise analysis of temporal variations in community life circles’ vitality. Second, this study primarily relied on Baidu heatmap data to assess community life circles’ vitality, given their broad spatial coverage and ability to directly reflect the human activity distribution. However, we acknowledge that this approach may not fully capture the multifaceted nature of urban vitality. Alternative data sources, such as social media check-ins, mobile trajectory data, and POI visit data, offer valuable insights but also have limitations, such as biased user demographics, dependency on the infrastructure distribution, or selective POI representation. Future studies could achieve a more comprehensive assessment of community life circles’ vitality by integrating multiple data sources with broader spatial and temporal coverage. This could be facilitated through collaborations with relevant research institutions and data providers to access high-resolution, multi-source datasets, enabling a more holistic understanding of community life circles’ vitality. Third, while this study addressed the complex effects of the studied variables using the SHAP method and by identifying the relative contributions of various built environment features, we acknowledge that the potential issue of endogeneity between the built environment and vitality exists. Future studies can incorporate causal inference techniques (e.g., the two-way causality between the built environment and vitality) to further validate the robustness of the results and ensure the reliability of the findings. Fourth, although this study highlights the influence of built-environment-related variables, such as facility accessibility and the floor area ratio, it does not directly include metrics of building typologies or architectural interfaces. This omission limits a deeper understanding of how building form and ground-floor design contribute to vitality. Future research could consider incorporating typological data from 3D city models, remote sensing, or street-level imagery to better explore the link between building typologies and residents’ behaviors.

Author Contributions

Conceptualization, K.L. and Y.Q.; methodology, K.L.; software, K.L., M.Z. and Y.R.; data curation, K.L., M.Z. and Y.W.; writing—original draft preparation, K.L.; writing—review and editing, Y.Q. and D.Z.; visualization, K.L. and J.W.; supervision, Y.Q. and D.Z.; project administration, D.Z. All authors have read and agreed to the published version of the manuscript.

Funding

This research received no external funding.

Data Availability Statement

The data that support the findings of this study are available from the corresponding author upon reasonable request.

Conflicts of Interest

The authors declare no conflicts of interest.

Appendix A

Table A1. Study scale, measurements of vitality, and study methods.
Study Area and ScaleDataset TypesMeasurement of VitalityMethods
Wuhan, 1025 community blocks [5]The street view images from Baidu MapSix categories of street elements; the values were summed to denote urban vitality after normalizationSpatial lag multivariate regression model (SLM)
Xi’an, 1251 natural blocks [6]Baidu heatmap dataA population heat index selected for weekdays and weekends; the average was introduced to represent vitalityMultiple linear regression model (MLR)
Nanjing, 27,201 units (500 m × 500 m) [12] Baidu heatmap data and social media data from Sina WeiboThe weighted calculation results of two kinds of data were used to characterize vitalitySpatial machine learning model (SML)
Wuhan, 1057 communities [15]Baidu heatmap dataThe average value of the population heat indexMulti-scale geographically weighted regression (MGWR)
Shenzhen, 491 traffic analysis zones [17]The POI dataset from Amap, social media check-ins from Sina Weibo, and Mobile phone positioning records The average value of three kinds of data to represent vitalityGeographically weighted regression (GWR)
Nanjing, 8209 traffic analysis zones [19]Mobile phone data and the nighttime light dataThe average value of two kinds of data to represent vitalityGeographic neural network weighted regression (GNNWR)
Shenzhen, street blocks [20]The POI dataset from AmapThe distribution of POI was defined as vitalityNegative binomial regression
Five Chinese megacities, street blocks [21]Business check-in records from Dianping and nighttime light data from the VIIRS DNBUrban daytime and nighttime vitality were measured using small catering business and nighttime light data, respectivelyLocal Moran’s I statistics
Table A2. Moran’s I of variables.
VariableCommunity Life CirclesVariableCommunity Life Circles
5-min10-min15-min5-min10-min
Facility accessibility0.1714640.0270620.390711Street view green ratio0.000986
Floor area ratio0.2415640.3619240.445573Street view sidewalk ratio0.002875
Intersection density 0.1997160.363063Proportion of the older adult population0.100209
Residential land use ratio 0.1546590.165901Building age 0.225967

References

  1. Johnson, M.T.J.; Munshi-South, J. Evolution of life in urban environments. Science 2017, 358, eaam8327. [Google Scholar] [CrossRef] [PubMed]
  2. Liu, D.; Zhou, R.; Ma, Q.; He, T.; Fang, X.; Xiao, L.; Hu, Y.; Li, J.; Shao, L.; Gao, J. Spatio-temporal patterns and population exposure risks of urban heat island in megacity Shanghai, China. Sustain. Cities Soc. 2024, 108, 105500. [Google Scholar] [CrossRef]
  3. Xu, R.; Yue, W.; Wei, F.; Yang, G.; He, T.; Pan, K. Density pattern of functional facilities and its responses to urban development, especially in polycentric cities. Sustain. Cities Soc. 2022, 76, 103526. [Google Scholar] [CrossRef]
  4. Bille, R.A.; Jensen, K.E.; Buitenwerf, R. Global patterns in urban green space are strongly linked to human development and population density. Urban For. Urban Green. 2023, 86, 127980. [Google Scholar] [CrossRef]
  5. Li, X.; Li, Y.; Jia, T.; Zhou, L.; Hijazi, I.H. The six dimensions of built environment on urban vitality: Fusion evidence from multi-source data. Cities 2022, 121, 103482. [Google Scholar] [CrossRef]
  6. Li, J.; Chen, Y.; Zhao, D.; Zhai, J. The Impact of Built Environment on Mixed Land Use: Evidence from Xi’an. Land 2024, 13, 2214. [Google Scholar] [CrossRef]
  7. He, C.; Chen, T.; Mao, X.; Zhou, Y. Economic transition, urbanization and population redistribution in China. Habitat Int. 2016, 51, 39–47. [Google Scholar] [CrossRef]
  8. Jacobs, J.M. The Death and Life of Great American Cities; Vintage: London, UK, 1962. [Google Scholar]
  9. Montgomery, J. Making a city: Urbanity, vitality and urban design. J. Urban Des. 1998, 3, 93–116. [Google Scholar] [CrossRef]
  10. Lynch, K.M. A Theory of Good City Form; MIT Press: Cambridge, MA, USA, 1981. [Google Scholar]
  11. Qing-ming, W. Evaluation of Urban Vitality Based on Fuzzy Matter-Element Model. Geogr. Geo-Inf. Sci. 2010, 26, 73–77. [Google Scholar]
  12. Wang, Z.; Wang, X.; Liu, Y.; Zhu, L. Identification of 71 factors influencing urban vitality and examination of their spatial dependence: A comprehensive validation applying multiple machine-learning models. Sustain. Cities Soc. 2024, 108, 105491. [Google Scholar] [CrossRef]
  13. Alexander, C.; Silverstein, M.; Ishikawa, S. A Pattern Language; Oxford University Press: Oxford, UK, 1977. [Google Scholar]
  14. Salingaros, N.A.; Mehaffy, M.W. Design for a Living Planet: Settlement, Science, and the Human Future; Sustasis Foundation: Cook, WA, USA, 2015. [Google Scholar]
  15. Moreno, C.; Allam, Z.; Chabaud, D.; Gall, C.; Pratlong, F. Introducing the “15-Minute City”: Sustainability, Resilience and Place Identity in Future Post-Pandemic Cities. Smart Cities 2021, 4, 93–111. [Google Scholar] [CrossRef]
  16. Ewing, R.; Handy, S.; Brownson, R.C.; Clemente, O.; Winston, E. Identifying and Measuring Urban Design Qualities Related to Walkability. J. Phys. Act. Health 2006, 3, S223–S240. [Google Scholar] [CrossRef]
  17. Zeng, P.; Wei, M.; Liu, X. Investigating the Spatiotemporal Dynamics of Urban Vitality Using Bicycle-Sharing Data. Sustainability 2020, 12, 1714. [Google Scholar] [CrossRef]
  18. He, S.; Zhang, Z.; Yu, S.; Xia, C.; Tung, C.-L. Investigating the effects of urban morphology on vitality of community life circles using machine learning and geospatial approaches. Appl. Geogr. 2024, 167, 103287. [Google Scholar] [CrossRef]
  19. Sulis, P.; Manley, E.; Zhong, C.; Batty, M. Using mobility data as proxy for measuring urban vitality. J. Spatial Inf. Sci. 2018, 16, 137–162. [Google Scholar] [CrossRef]
  20. Tu, W.; Zhu, T.; Xia, J.; Zhou, Y.; Lai, Y.; Jiang, J.; Li, Q. Portraying the spatial dynamics of urban vibrancy using multisource urban big data. Comput. Environ. Urban Syst. 2020, 80, 101428. [Google Scholar] [CrossRef]
  21. Jin, X.; Long, Y.; Sun, W.; Lu, Y.; Yang, X.; Tang, J. Evaluating cities’ vitality and identifying ghost cities in China with emerging geographical data. Cities 2017, 63, 98–109. [Google Scholar] [CrossRef]
  22. Yang, Y.; Wang, H.; Qin, S.; Li, X.; Zhu, Y.; Wang, Y. Analysis of Urban Vitality in Nanjing Based on a Plot Boundary-Based Neural Network Weighted Regression Model. ISPRS Int. J. Geo-Inf. 2022, 11, 624. [Google Scholar] [CrossRef]
  23. Ye, Y.; Li, D.; Liu, X. How block density and typology affect urban vitality: An exploratory analysis in Shenzhen, China. Urban Geogr. 2018, 39, 631–652. [Google Scholar] [CrossRef]
  24. Xia, C.; Yeh, A.G.-O.; Zhang, A. Analyzing spatial relationships between urban land use intensity and urban vitality at street block level: A case study of five Chinese megacities. Landsc. Urban Plan. 2020, 193, 103669. [Google Scholar] [CrossRef]
  25. Mouratidis, K.; Poortinga, W. Built environment, urban vitality and social cohesion: Do vibrant neighborhoods foster strong communities? Landsc. Urban Plan. 2020, 204, 103951. [Google Scholar] [CrossRef]
  26. Wang, J.; Kwan, M.-P.; Xiu, G.; Deng, F. A robust method for evaluating the potentials of 15-minute cities: Implications for sustainable urban futures. Geogr. Sustain. 2024, 5, 597–606. [Google Scholar] [CrossRef]
  27. GB50180-2018; Urban Residential Area Planning Standards. Ministry of Housing and Urban-Rural Development of the People’s Republic of China: Beijing, China, 2018.
  28. Handy, S.L.; Boarnet, M.G.; Ewing, R.; Killingsworth, R.E. How the built environment affects physical activity: Views from urban planning. Am. J. Prev. Med. 2002, 23, 64–73. [Google Scholar] [CrossRef]
  29. Ewing, R.; Cervero, R. Travel and the Built Environment. J. Am. Plan. Assoc. 2010, 76, 265–294. [Google Scholar] [CrossRef]
  30. Chen, Y.; Yu, B.; Shu, B.; Yang, L.; Wang, R. Exploring the spatiotemporal patterns and correlates of urban vitality: Temporal and spatial heterogeneity. Sustain. Cities Soc. 2023, 91, 104440. [Google Scholar] [CrossRef]
  31. Yue, Y.; Zhuang, Y.; Yeh, A.G.O.; Xie, J.-Y.; Ma, C.-L.; Li, Q.-Q. Measurements of POI-based mixed use and their relationships with neighbourhood vibrancy. Int. J. Geogr. Inf. Sci. 2017, 31, 658–675. [Google Scholar] [CrossRef]
  32. Zhang, A.; Li, W.; Wu, J.; Lin, J.; Chu, J.; Xia, C. How can the urban landscape affect urban vitality at the street block level? A case study of 15 metropolises in China. Environ. Plan. B Urban Anal. City Sci. 2021, 48, 1245–1262. [Google Scholar] [CrossRef]
  33. Linwei, H.; Longyu, S.; Fengmei, Y.; Xue-qin, X.; Lijie, G. Method for the evaluation of residents’ perceptions of their community based on landsenses ecology. J. Clean. Prod. 2021, 281, 124048. [Google Scholar] [CrossRef]
  34. Zhu, D.; Song, D.; Zhu, B.; Zhao, J.; Li, Y.; Zhang, C.; Zhu, D.; Yu, C.; Han, T. Understanding complex interactions between neighborhood environment and personal perception in affecting walking behavior of older adults: A random forest approach combined with human-machine adversarial framework. Cities 2024, 146, 104737. [Google Scholar] [CrossRef]
  35. He, N.; Li, G. Urban neighbourhood environment assessment based on street view image processing: A review of research trends. Environ. Chall. 2021, 4, 100090. [Google Scholar] [CrossRef]
  36. Wang, H.; Yang, Y. Neighbourhood walkability: A review and bibliometric analysis. Cities 2019, 93, 43–61. [Google Scholar] [CrossRef]
  37. Yang, L.; Ao, Y.; Ke, J.; Lu, Y.; Liang, Y. To walk or not to walk? Examining non-linear effects of streetscape greenery on walking propensity of older adults. J. Transp. Geogr. 2021, 94, 103099. [Google Scholar] [CrossRef]
  38. Wang, M.; Chen, Z.; Rong, H.H.; Mu, L.; Zhu, P.; Shi, Z. Ridesharing accessibility from the human eye: Spatial modeling of built environment with street-level images. Comput. Environ. Urban Syst. 2022, 97, 101858. [Google Scholar] [CrossRef]
  39. Chen, L.; Jiang, X.; Tan, L.; Chen, C.; Yang, S.; You, W. Analysis of Spatial Vitality Characteristics and Influencing Factors of Old Neighborhoods: A Case Study of Ya’an Xicheng Neighborhood. Buildings 2024, 14, 3348. [Google Scholar] [CrossRef]
  40. Yang, J.; Cao, J.; Zhou, Y. Elaborating non-linear associations and synergies of subway access and land uses with urban vitality in Shenzhen. Transp. Res. Part A Policy Pract. 2021, 144, 74–88. [Google Scholar] [CrossRef]
  41. Lin, J.; Zhuang, Y.; Zhao, Y.; Li, H.; He, X.; Lu, S. Measuring the Non-Linear Relationship between Three-Dimensional Built Environment and Urban Vitality Based on a Random Forest Model. Int. J. Environ. Res. Public Health 2023, 20, 734. [Google Scholar] [CrossRef]
  42. Xiao, L.; Lo, S.; Liu, J.; Zhou, J.; Li, Q. Nonlinear and synergistic effects of TOD on urban vibrancy: Applying local explanations for gradient boosting decision tree. Sustain. Cities Soc. 2021, 72, 103063. [Google Scholar] [CrossRef]
  43. Ge, Y.; Gan, Q.; Ma, Y.; Guo, Y.; Chen, S.; Wang, Y. Spatial Vitality Detection and Evaluation in Zhengzhou’s Main Urban Area. Buildings 2024, 14, 3648. [Google Scholar] [CrossRef]
  44. Liu, T.; Chai, Y. Daily life circle reconstruction: A scheme for sustainable development in urban China. Habitat Int. 2015, 50, 250–260. [Google Scholar] [CrossRef]
  45. Rui, J.; Li, X. Decoding vibrant neighborhoods: Disparities between formal neighborhoods and urban villages in eye-level perceptions and physical environment. Sustain. Cities Soc. 2024, 101, 105122. [Google Scholar] [CrossRef]
  46. Zeng, Z.; Li, Y.; Tang, H. Multidimensional Spatial Driving Factors of Urban Vitality Evolution at the Subdistrict Scale of Changsha City, China, Based on the Time Series of Human Activities. Buildings 2023, 13, 2448. [Google Scholar] [CrossRef]
  47. Su, R.; Goulias, K. Untangling the relationships among residential environment, destination choice, and daily walk accessibility. J. Transp. Geogr. 2023, 109, 103595. [Google Scholar] [CrossRef]
  48. Yang, Y.; Peng, C.; Yeung, C.Y.; Ren, C.; Luo, H.; Lu, Y.; Yip, P.S.F.; Webster, C. Moderation effect of visible urban greenery on the association between neighbourhood deprivation and subjective well-being: Evidence from Hong Kong. Landsc. Urban Plan. 2023, 231, 104660. [Google Scholar] [CrossRef]
  49. Wu, W.; Tan, W.; Wang, R.; Chen, W.Y. From quantity to quality: Effects of urban greenness on life satisfaction and social inequality. Landsc. Urban Plan. 2023, 238, 104843. [Google Scholar] [CrossRef]
  50. Yu, L.; Cai, Y. Do rising housing prices restrict urban innovation vitality? Evidence from 288 cities in China. Econ. Anal. Policy 2021, 72, 276–288. [Google Scholar] [CrossRef]
  51. Jin, A.; Ge, Y.; Zhang, S. Spatial Characteristics of Multidimensional Urban Vitality and Its Impact Mechanisms by the Built Environment. Land 2024, 13, 991. [Google Scholar] [CrossRef]
  52. Fan, Z.; Duan, J.; Luo, M.; Zhan, H.; Liu, M.; Peng, W. How Did Built Environment Affect Urban Vitality in Urban Waterfronts? A Case Study in Nanjing Reach of Yangtze River. ISPRS Int. J. Geo-Inf. 2021, 10, 611. [Google Scholar] [CrossRef]
  53. Wu, C.; Zhao, M.; Ye, Y. Measuring urban nighttime vitality and its relationship with urban spatial structure: A data-driven approach. Environ. Plan. B Urban Anal. City Sci. 2022, 50, 130–145. [Google Scholar] [CrossRef]
  54. Poruthiyil, P.V.; Purandare, U. Reorienting vitality for ageing cities. Cities 2023, 137, 104268. [Google Scholar] [CrossRef]
  55. Chen, T.; Guestrin, C. XGBoost: A Scalable Tree Boosting System. In Proceedings of the 22nd ACM SIGKDD International Conference on Knowledge Discovery and Data Mining 2016, San Francisco, CA, USA, 13–17 August 2016. [Google Scholar]
  56. Liu, K.; Liao, C. Examining the importance of neighborhood natural, and built environment factors in predicting older adults’ mental well-being: An XGBoost-SHAP approach. Environ. Res. 2024, 262, 119929. [Google Scholar] [CrossRef]
  57. Ding, Z.; Wang, H. What are the key and catalytic external factors affecting the vitality of urban blue-green space? a case study of Nanjing Main Districts, China. Ecol. Indic. 2024, 158, 111478. [Google Scholar] [CrossRef]
  58. Jiang, Y.; Zhang, Y.; Liu, Y.; Huang, Z. A Review of Urban Vitality Research in the Chinese World. Trans. Urban Data Sci. Technol. 2023, 2, 81–99. [Google Scholar] [CrossRef]
  59. GB/T51328-2018; Urban Comprehensive Transport System Planning Standards. Ministry of Housing and Urban-Rural Development of the People’s Republic of China: Beijing, China, 2018.
  60. Wu, C.; Ye, Y.; Gao, F.; Ye, X. Using street view images to examine the association between human perceptions of locale and urban vitality in Shenzhen, China. Sustain. Cities Soc. 2023, 88, 104291. [Google Scholar] [CrossRef]
  61. Sung, H.; Lee, S. Residential built environment and walking activity: Empirical evidence of Jane Jacobs’ urban vitality. Transp. Res. Part D Transp. Environ. 2015, 41, 318–329. [Google Scholar] [CrossRef]
  62. Seong, E.Y.; Lee, N.H.; Choi, C.G. Relationship between Land Use Mix and Walking Choice in High-Density Cities: A Review of Walking in Seoul, South Korea. Sustainability 2021, 13, 810. [Google Scholar] [CrossRef]
Figure 1. Research framework.
Buildings 15 01372 g001
Figure 2. Study area. (a) Location of Xi’an. (b) The central area of Xi’an. (c) Buffer zones of three types of community life circles.
Buildings 15 01372 g002
Figure 3. Micro-built environment elements extracted via PSPNet.
Buildings 15 01372 g003
Figure 4. Spatial distribution of community life circles’ vitality. (a) Spatial characterization. (b) Local indicator of spatial association. (c) Statistical analysis.
Buildings 15 01372 g004
Figure 5. Correlation analysis. (a) Correlation results of 5-min community life circles. (b) Correlation results of 10-min community life circles. (c) Correlation results of 15-min community life circles. (d) Variance inflation factor.
Buildings 15 01372 g005
Figure 6. The feature importance of the SHAP values.
Buildings 15 01372 g006
Figure 7. Facility accessibility and the floor area ratio.
Buildings 15 01372 g007
Figure 8. Intersection density and the residential land use ratio.
Buildings 15 01372 g008
Figure 9. Micro-built environment and socio-economic factors.
Buildings 15 01372 g009
Table 1. Selected variables of the built environment.
Variable FormulaDescription
DensityFloor area ratio= S b u i l d i n g / S a r e a Ratio of building area to the community life circle area.
Facility density= N P O I / S a r e a Ratio of facility/intersection number to the community life circle area.
Intersection density= N i n t e r s e c t i o n / S a r e a
DiversityGreen land use ratio= S g r e e n / S a r e a Ratio of green/residential/commercial land use area to the community life circle area.
Residential land use ratio= S r e s i d e n t i a l / S a r e a
Commercial land use ratio= S c o m m e r c i a l / S a r e a
Facility diversity= i = 1 n P s ln P s P s represents the proportion of facility categories within the community life circles.
DesignStreet view green ratio= A v g _ p i x r v e g e t a t i o n Average pixel ratio of vegetation/building/sky/sidewalk in SVIs within the community life circles.
Street view buildings ratio= A v g _ p i x r b u i l d i n g
Street view sky ratio= A v g _ p i x r s k y
Street view sidewalk ratio= A v g _ p i x r s i d e w a l k
Destination accessibilityFacility accessibility= j O j f ( t i j ) O j represents the opportunities in the community life circles;   f t i j equals 1 if the distance is within the predetermined range and 0 otherwise.
Distance to shopping malls= N e a r e s t _ d i s s h o p p i n g Nearest distance to shopping malls/parks.
Distance to parks= N e a r e s t _ d i s p a r k
Distance to transitDistance to bus stops= N e a r e s t _ d i s b u s Nearest distance to bus stops/metro stations.
Distance to metro stations= N e a r e s t _ d i s m e t r o
Table 2. Facility categories.
Main CategoriesSubcategoriesMain CategoriesSubcategoriesMain CategoriesSubcategories
CommerceGroceryCommerceBank/ATMRecreationActivity center
Convenience storeEducationChildcare centerSenior daycare center
SupermarketKindergartenMultifunctional square
RestaurantElementary schoolGym/fitness facility
Shopping mallMiddle schoolHealthcareHealthcare center
PharmacyRecreationBookstoreClinic
BarberParkTransportationBus stop
LaundryCommunity gardenMetro station
Table 3. Metrics of models.
ModelCommunity Life Circles
5-min10-min15-min
MSERMSEMAER2MSERMSEMAER2MSERMSEMAER2
RF0.460.680.510.470.300.550.310.720.050.220.120.88
GBDT0.450.670.520.470.260.510.320.780.060.240.170.91
XGBoost0.430.660.520.530.200.450.350.790.060.240.190.94
Table 4. Top five influential built environment variables.
RankVariable (Contribution Rate)
5-min
Community Life Circles
10-min
Community Life Circles
15-min
Community Life Circles
1Facility accessibility (29.7%)Facility accessibility (30.2%)Facility accessibility (41.2%)
2Floor area ratio (9.1%)Floor area ratio (9.7%)Floor area ratio (9.1%)
3Proportion of the older adult population (7.9%)Intersection density (7.3%)Intersection density (7.3%)
4Distance to parks (6.6%)Residential land use ratio (7.0%) Residential land use ratio (7.1%)
5Distance to metro stations (6.6%)Distance to shopping malls (6.6%)Average building age (5.6%)
Disclaimer/Publisher’s Note: The statements, opinions and data contained in all publications are solely those of the individual author(s) and contributor(s) and not of MDPI and/or the editor(s). MDPI and/or the editor(s) disclaim responsibility for any injury to people or property resulting from any ideas, methods, instructions or products referred to in the content.

