
Shear Performance of Assembled Bamboo–Concrete Composite Structures Featuring Perforated Steel Plate Connectors


Abstract
:1. Introduction
2. Experimental Program
2.1. Material Properties
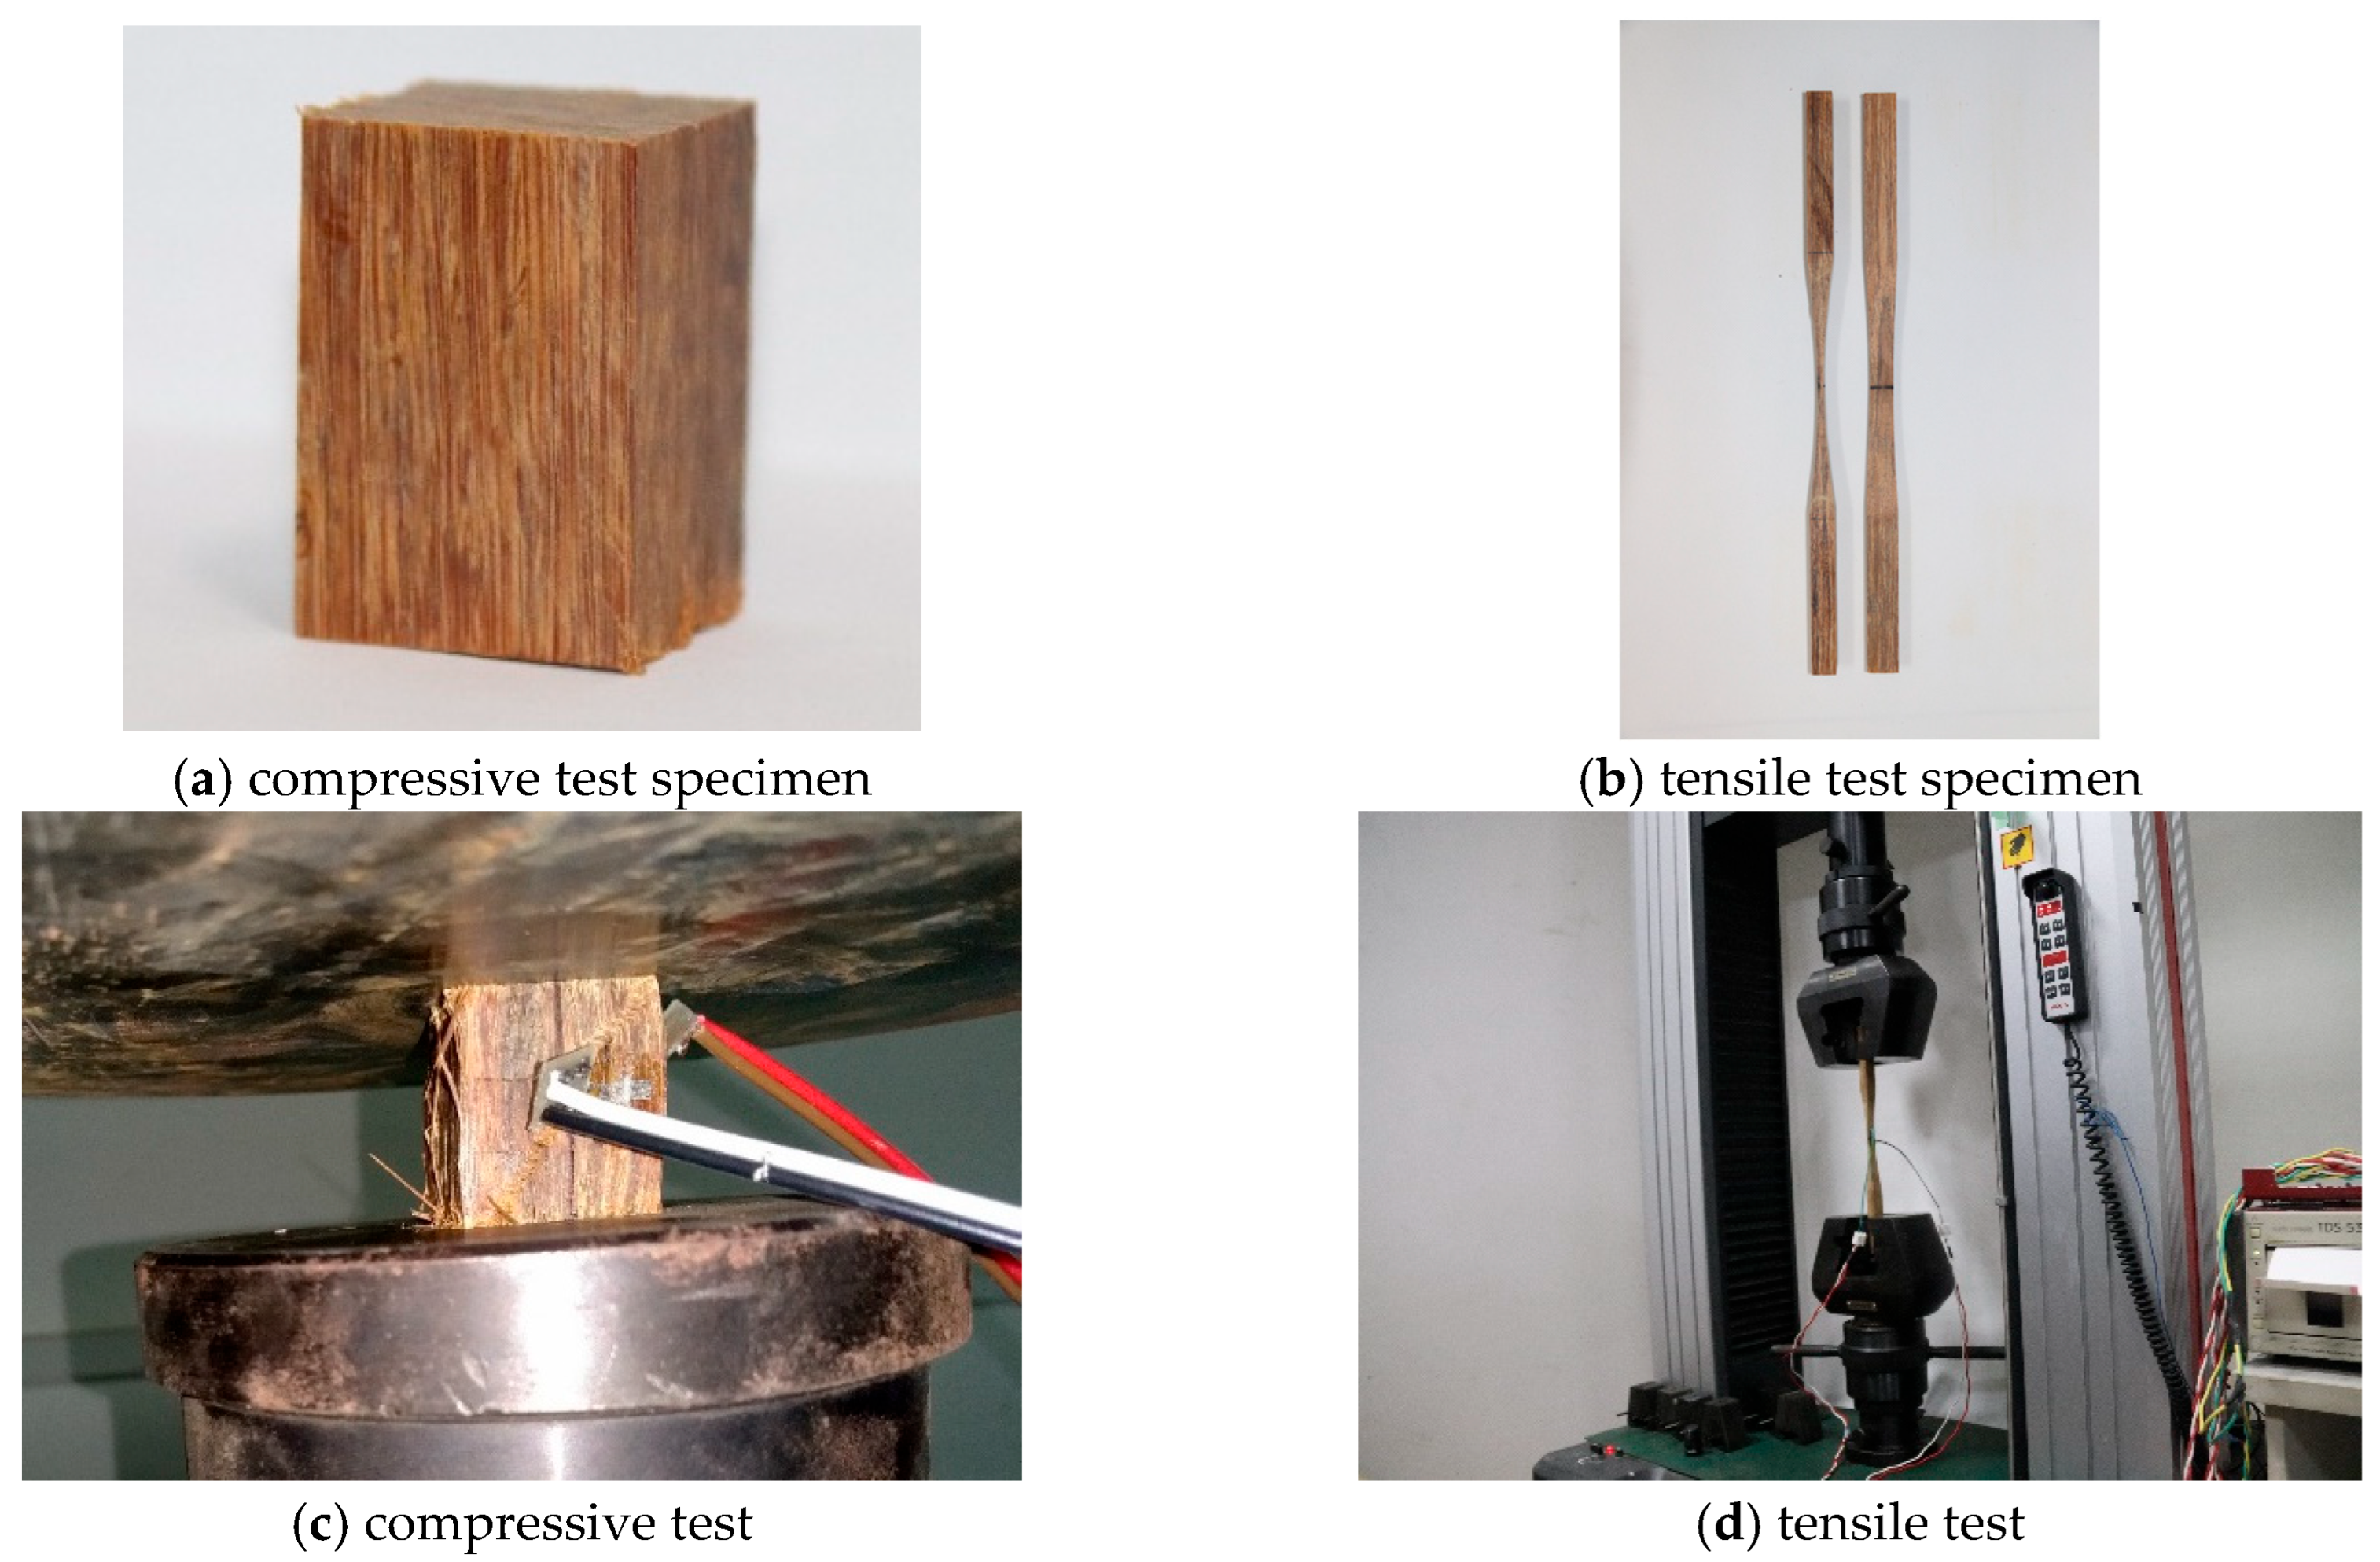
2.1.1. Bamboo
2.1.2. Concrete
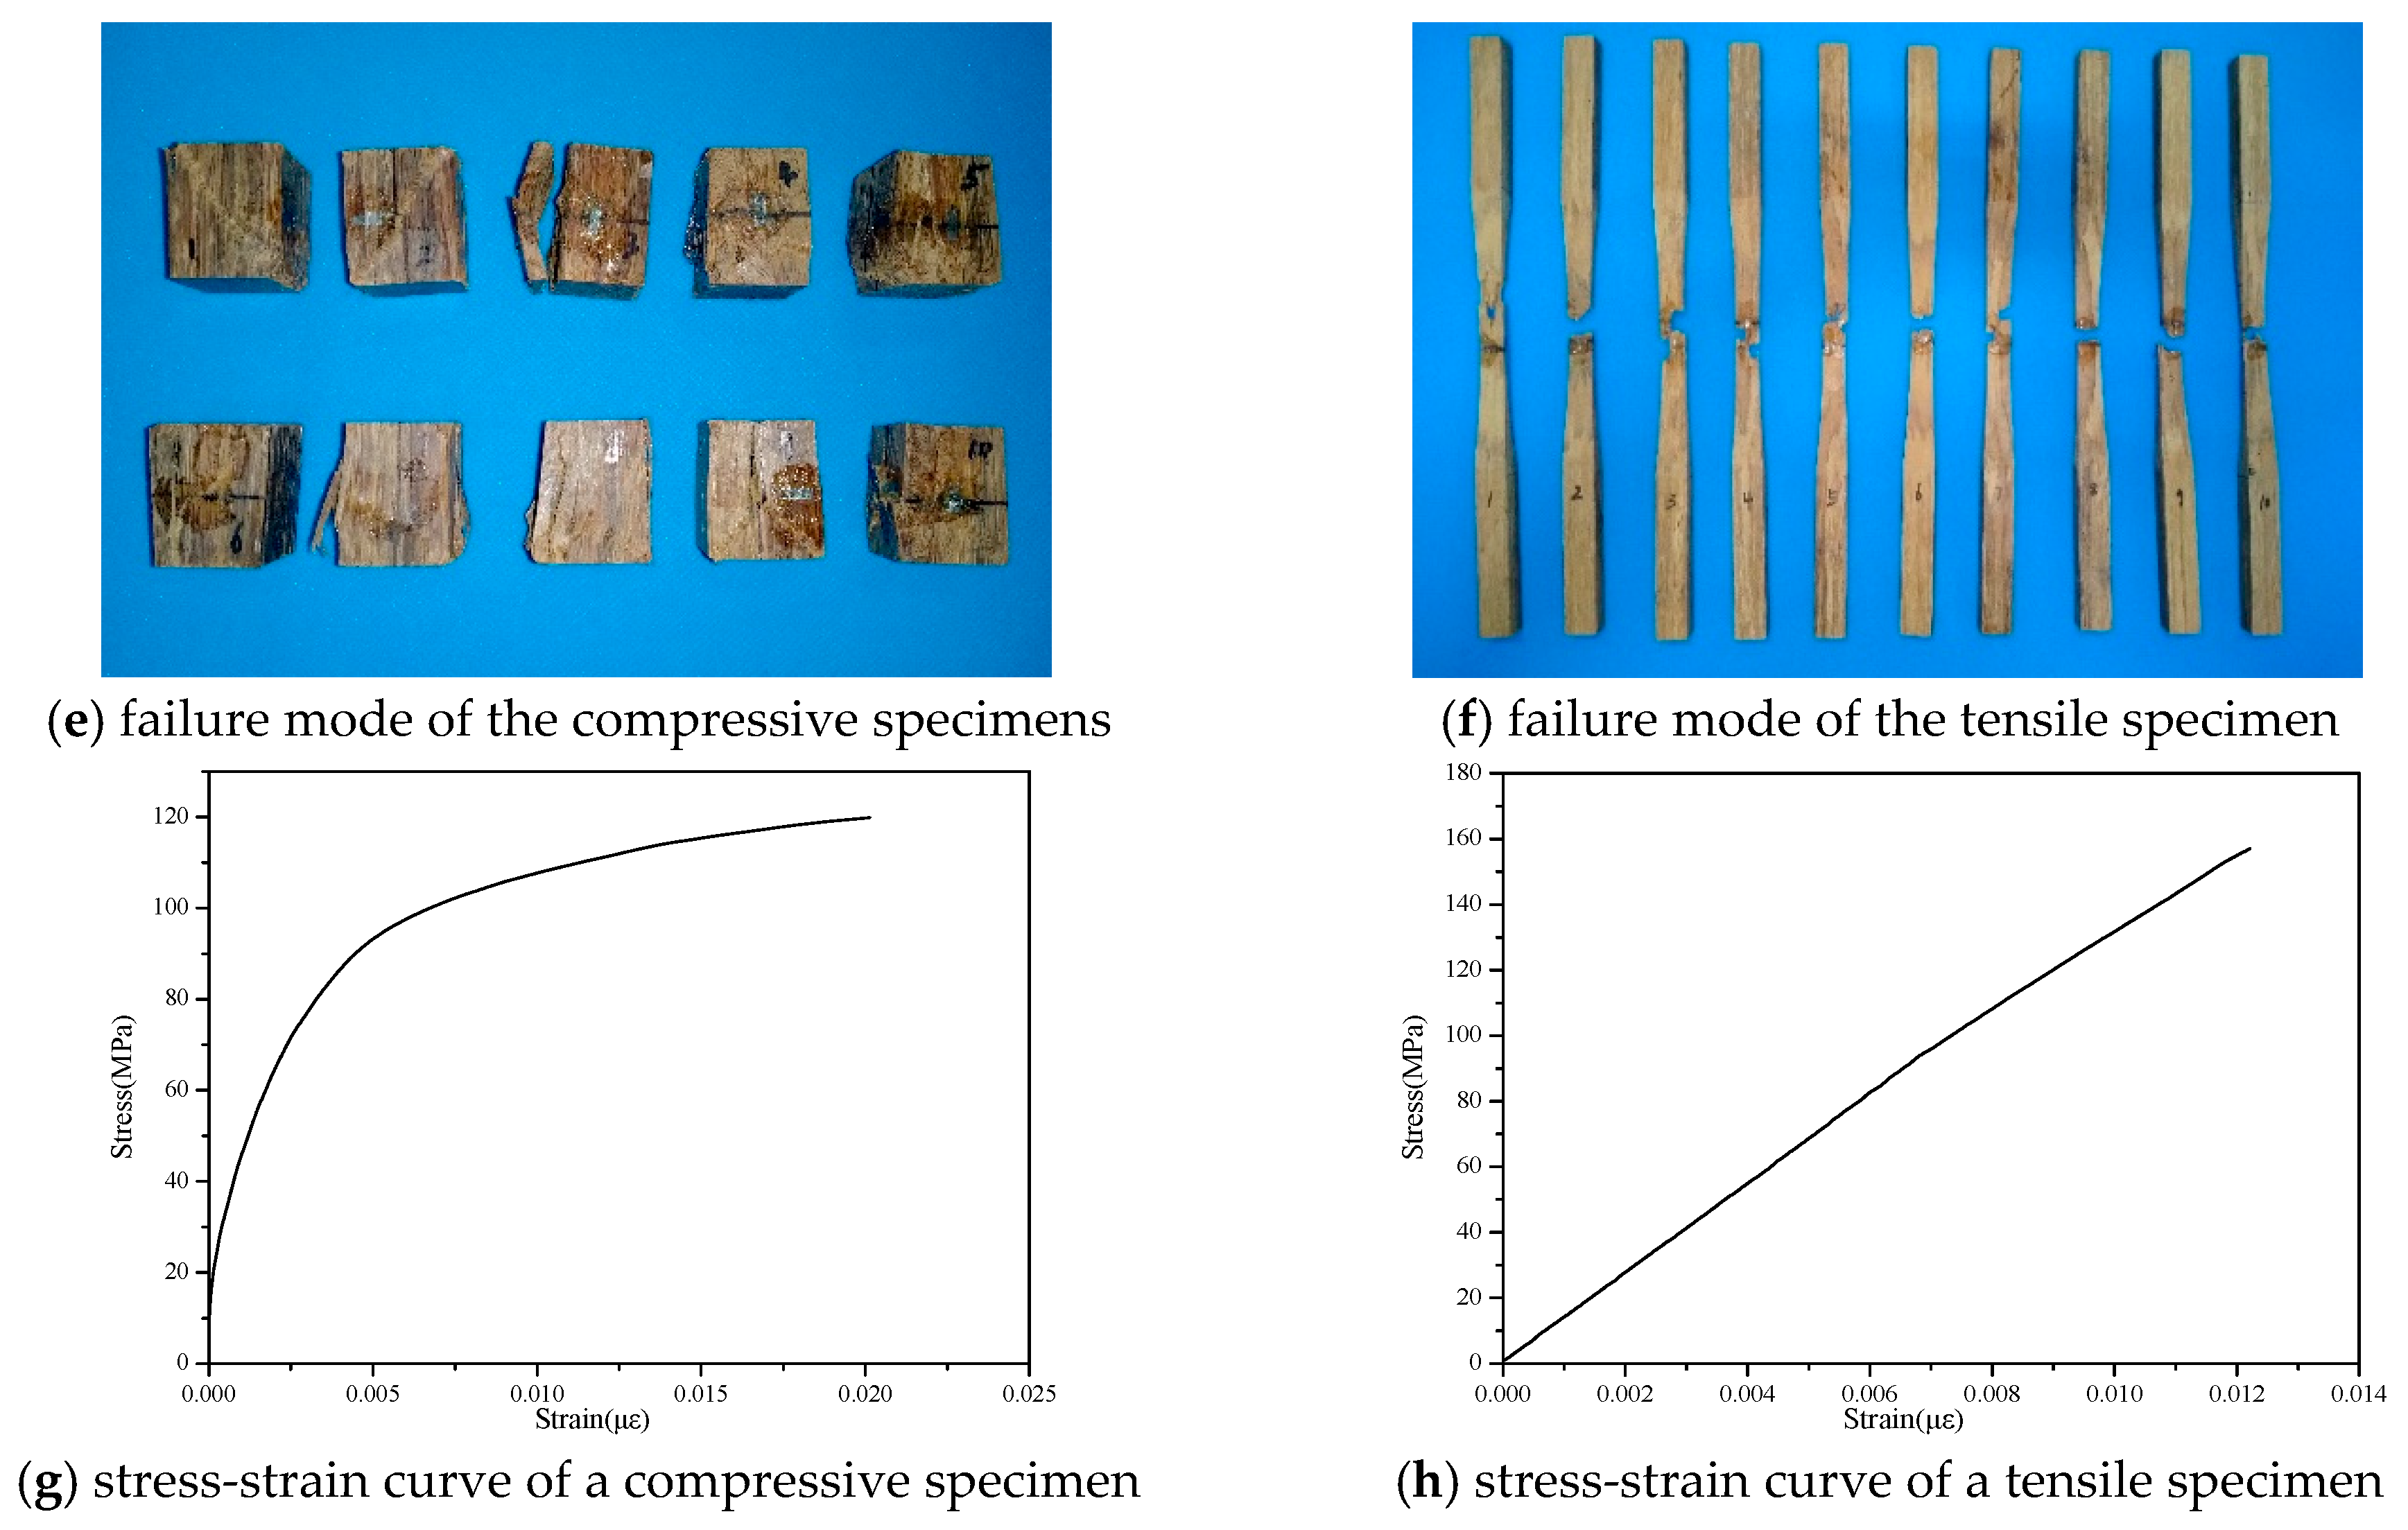
2.1.3. Steel Plate
2.1.4. Grout
2.1.5. Adhesive
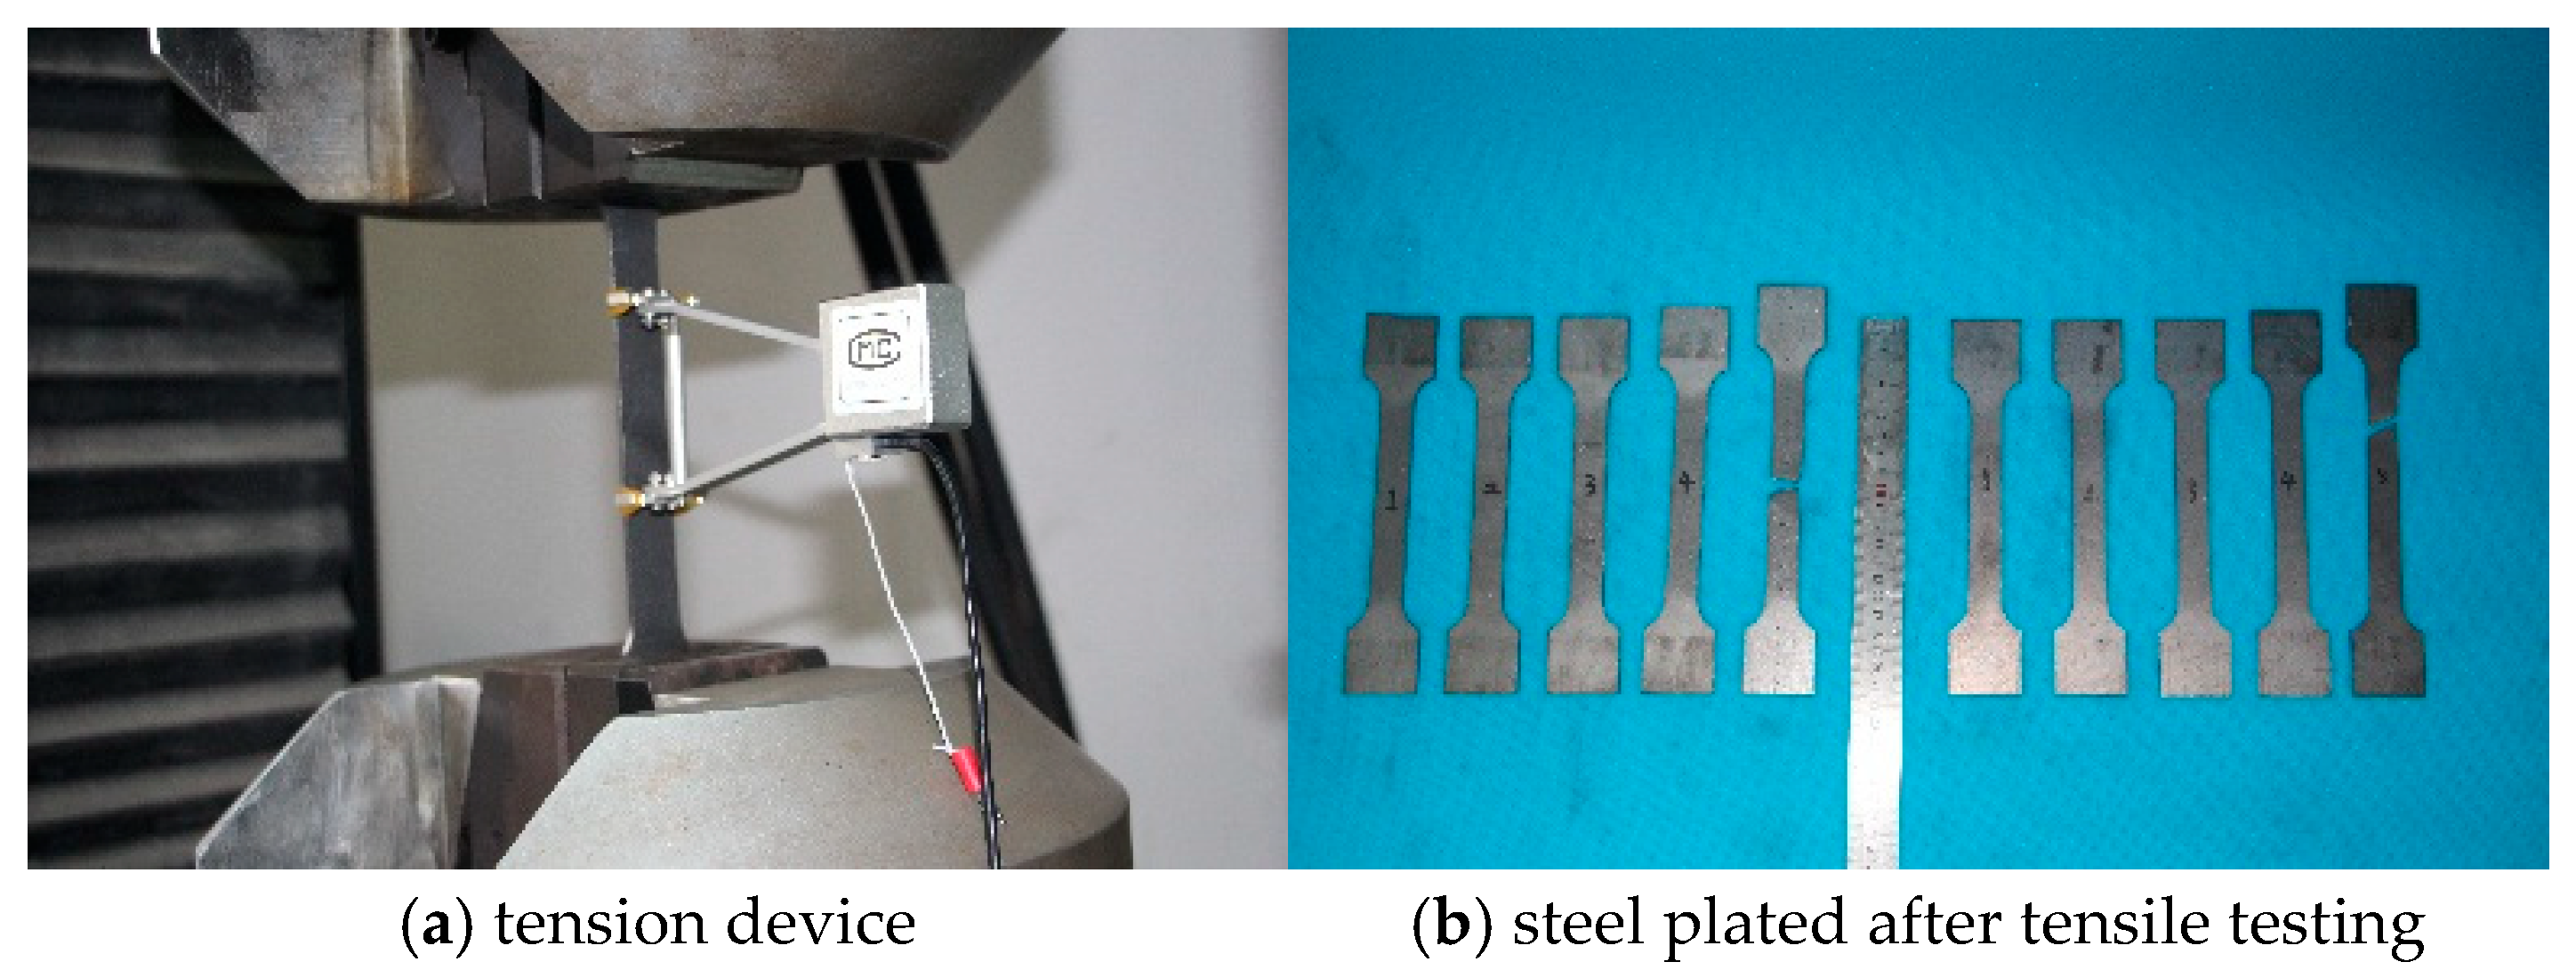
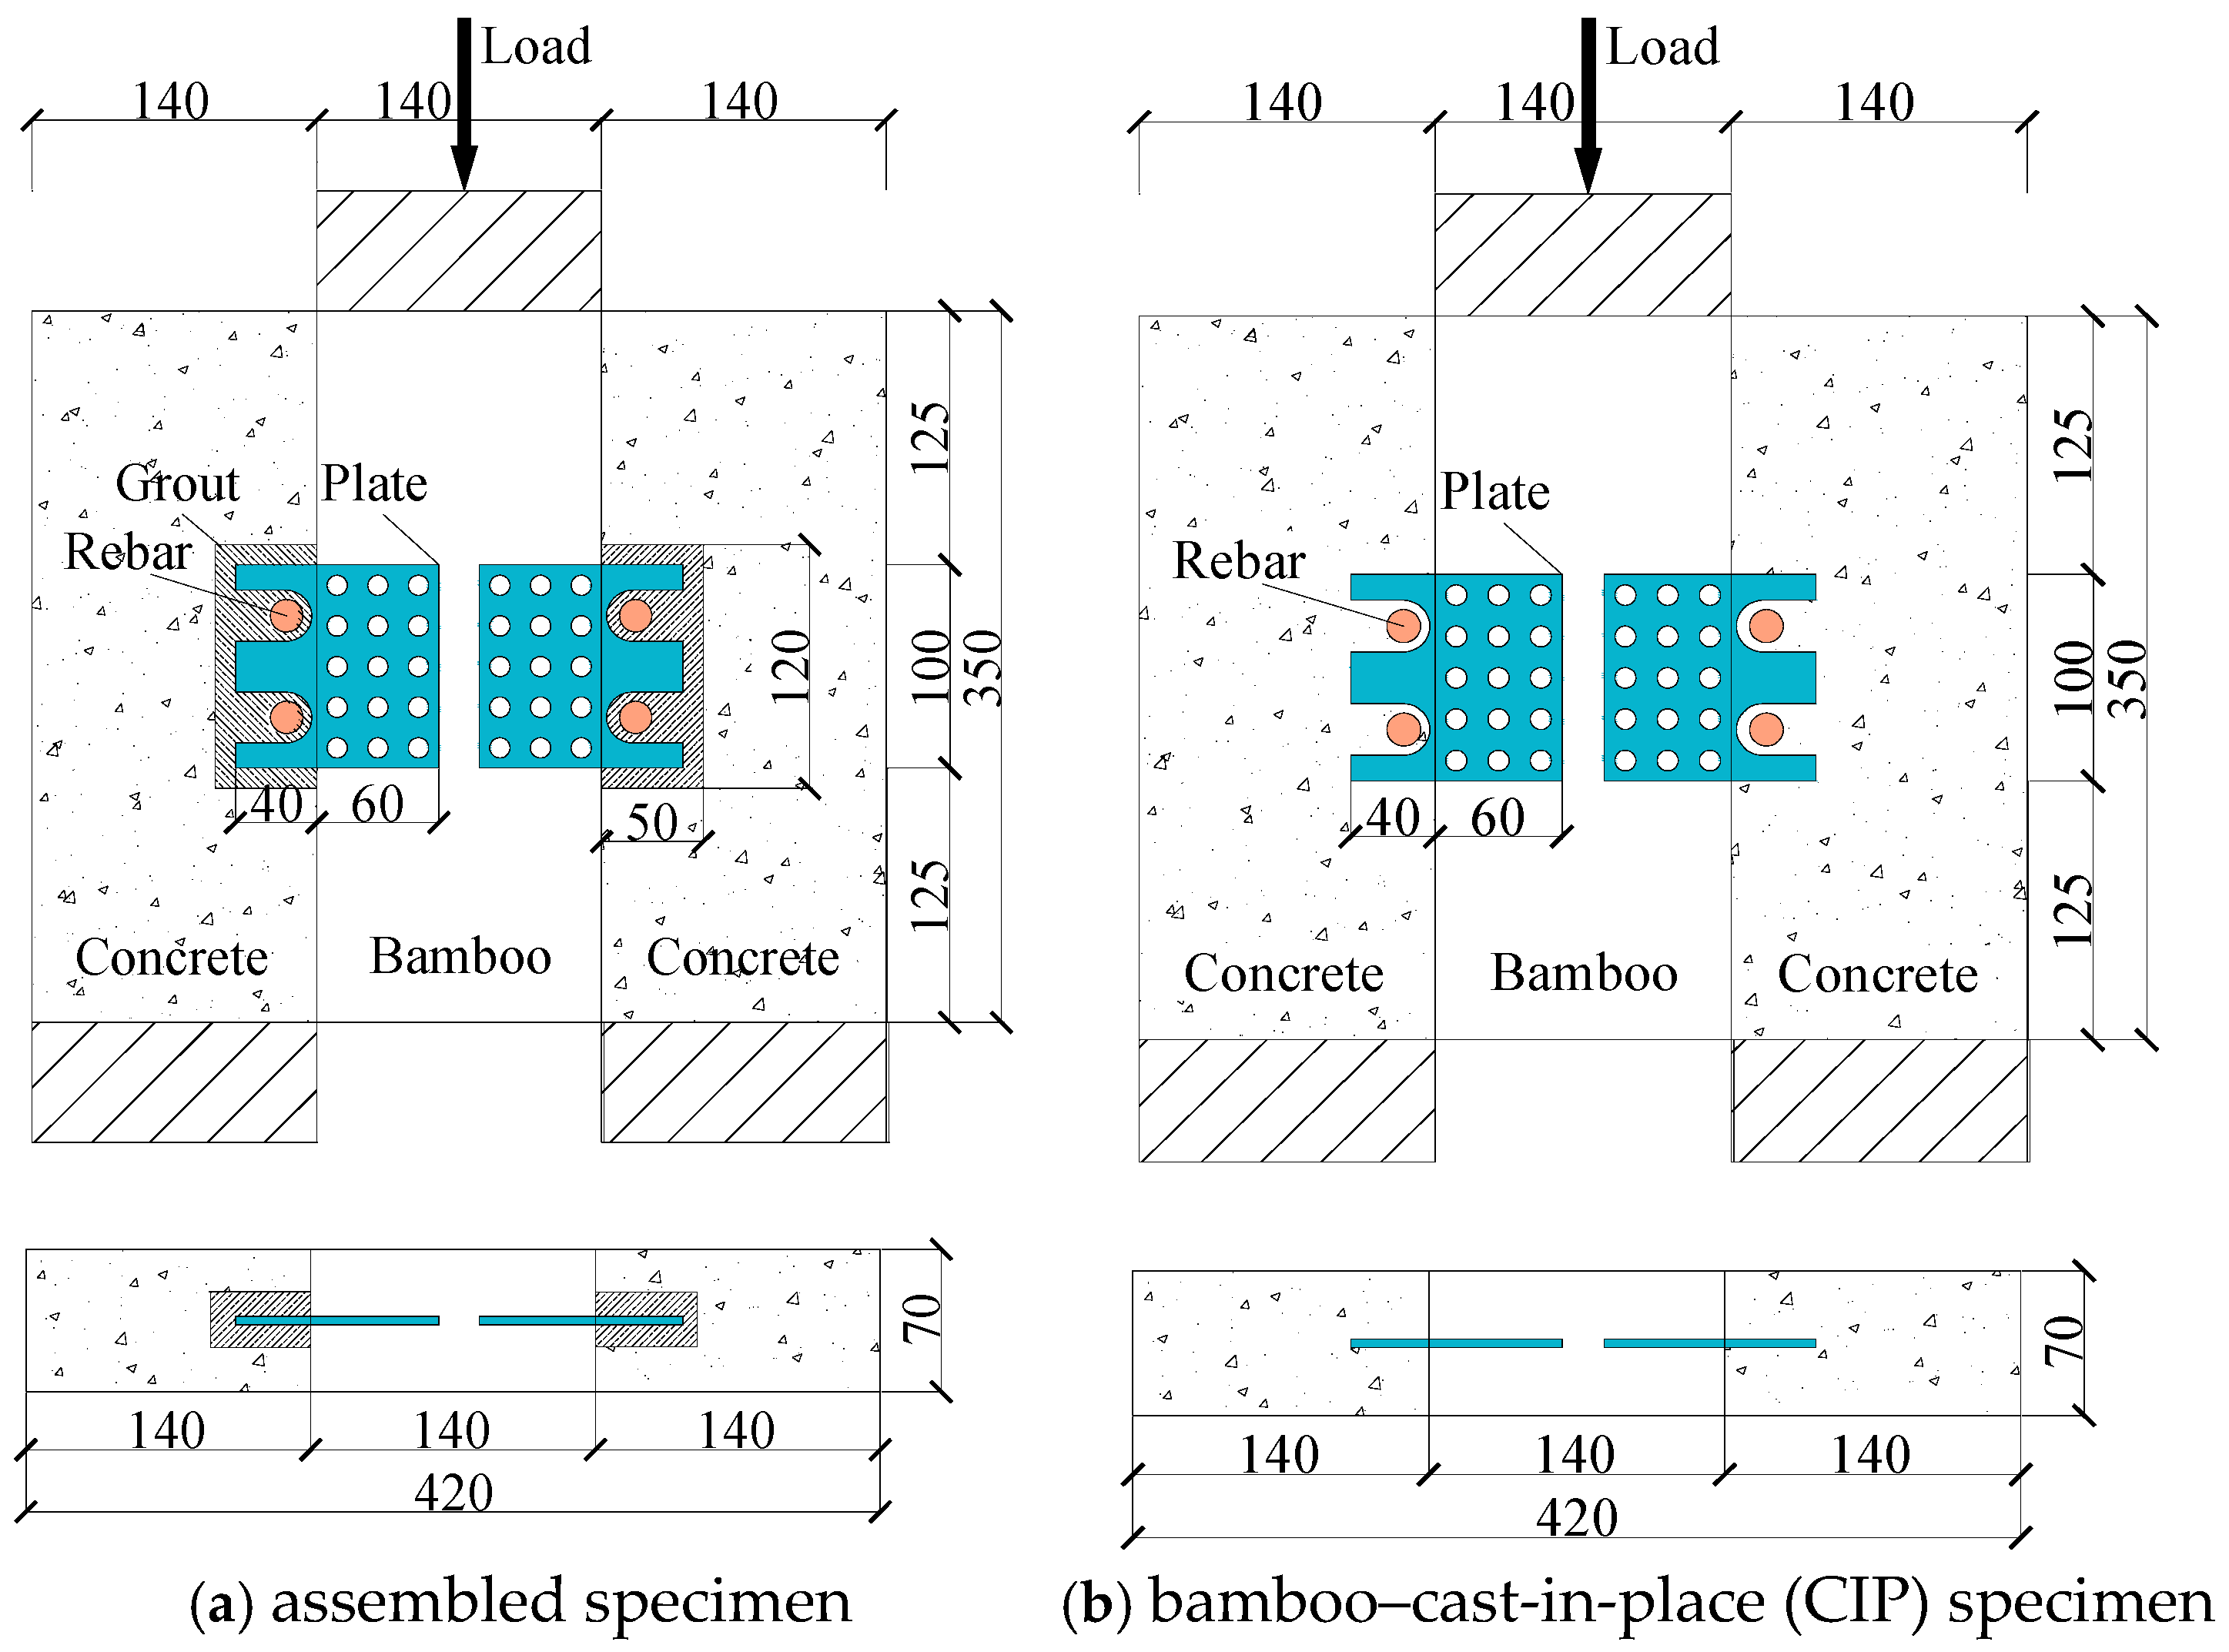
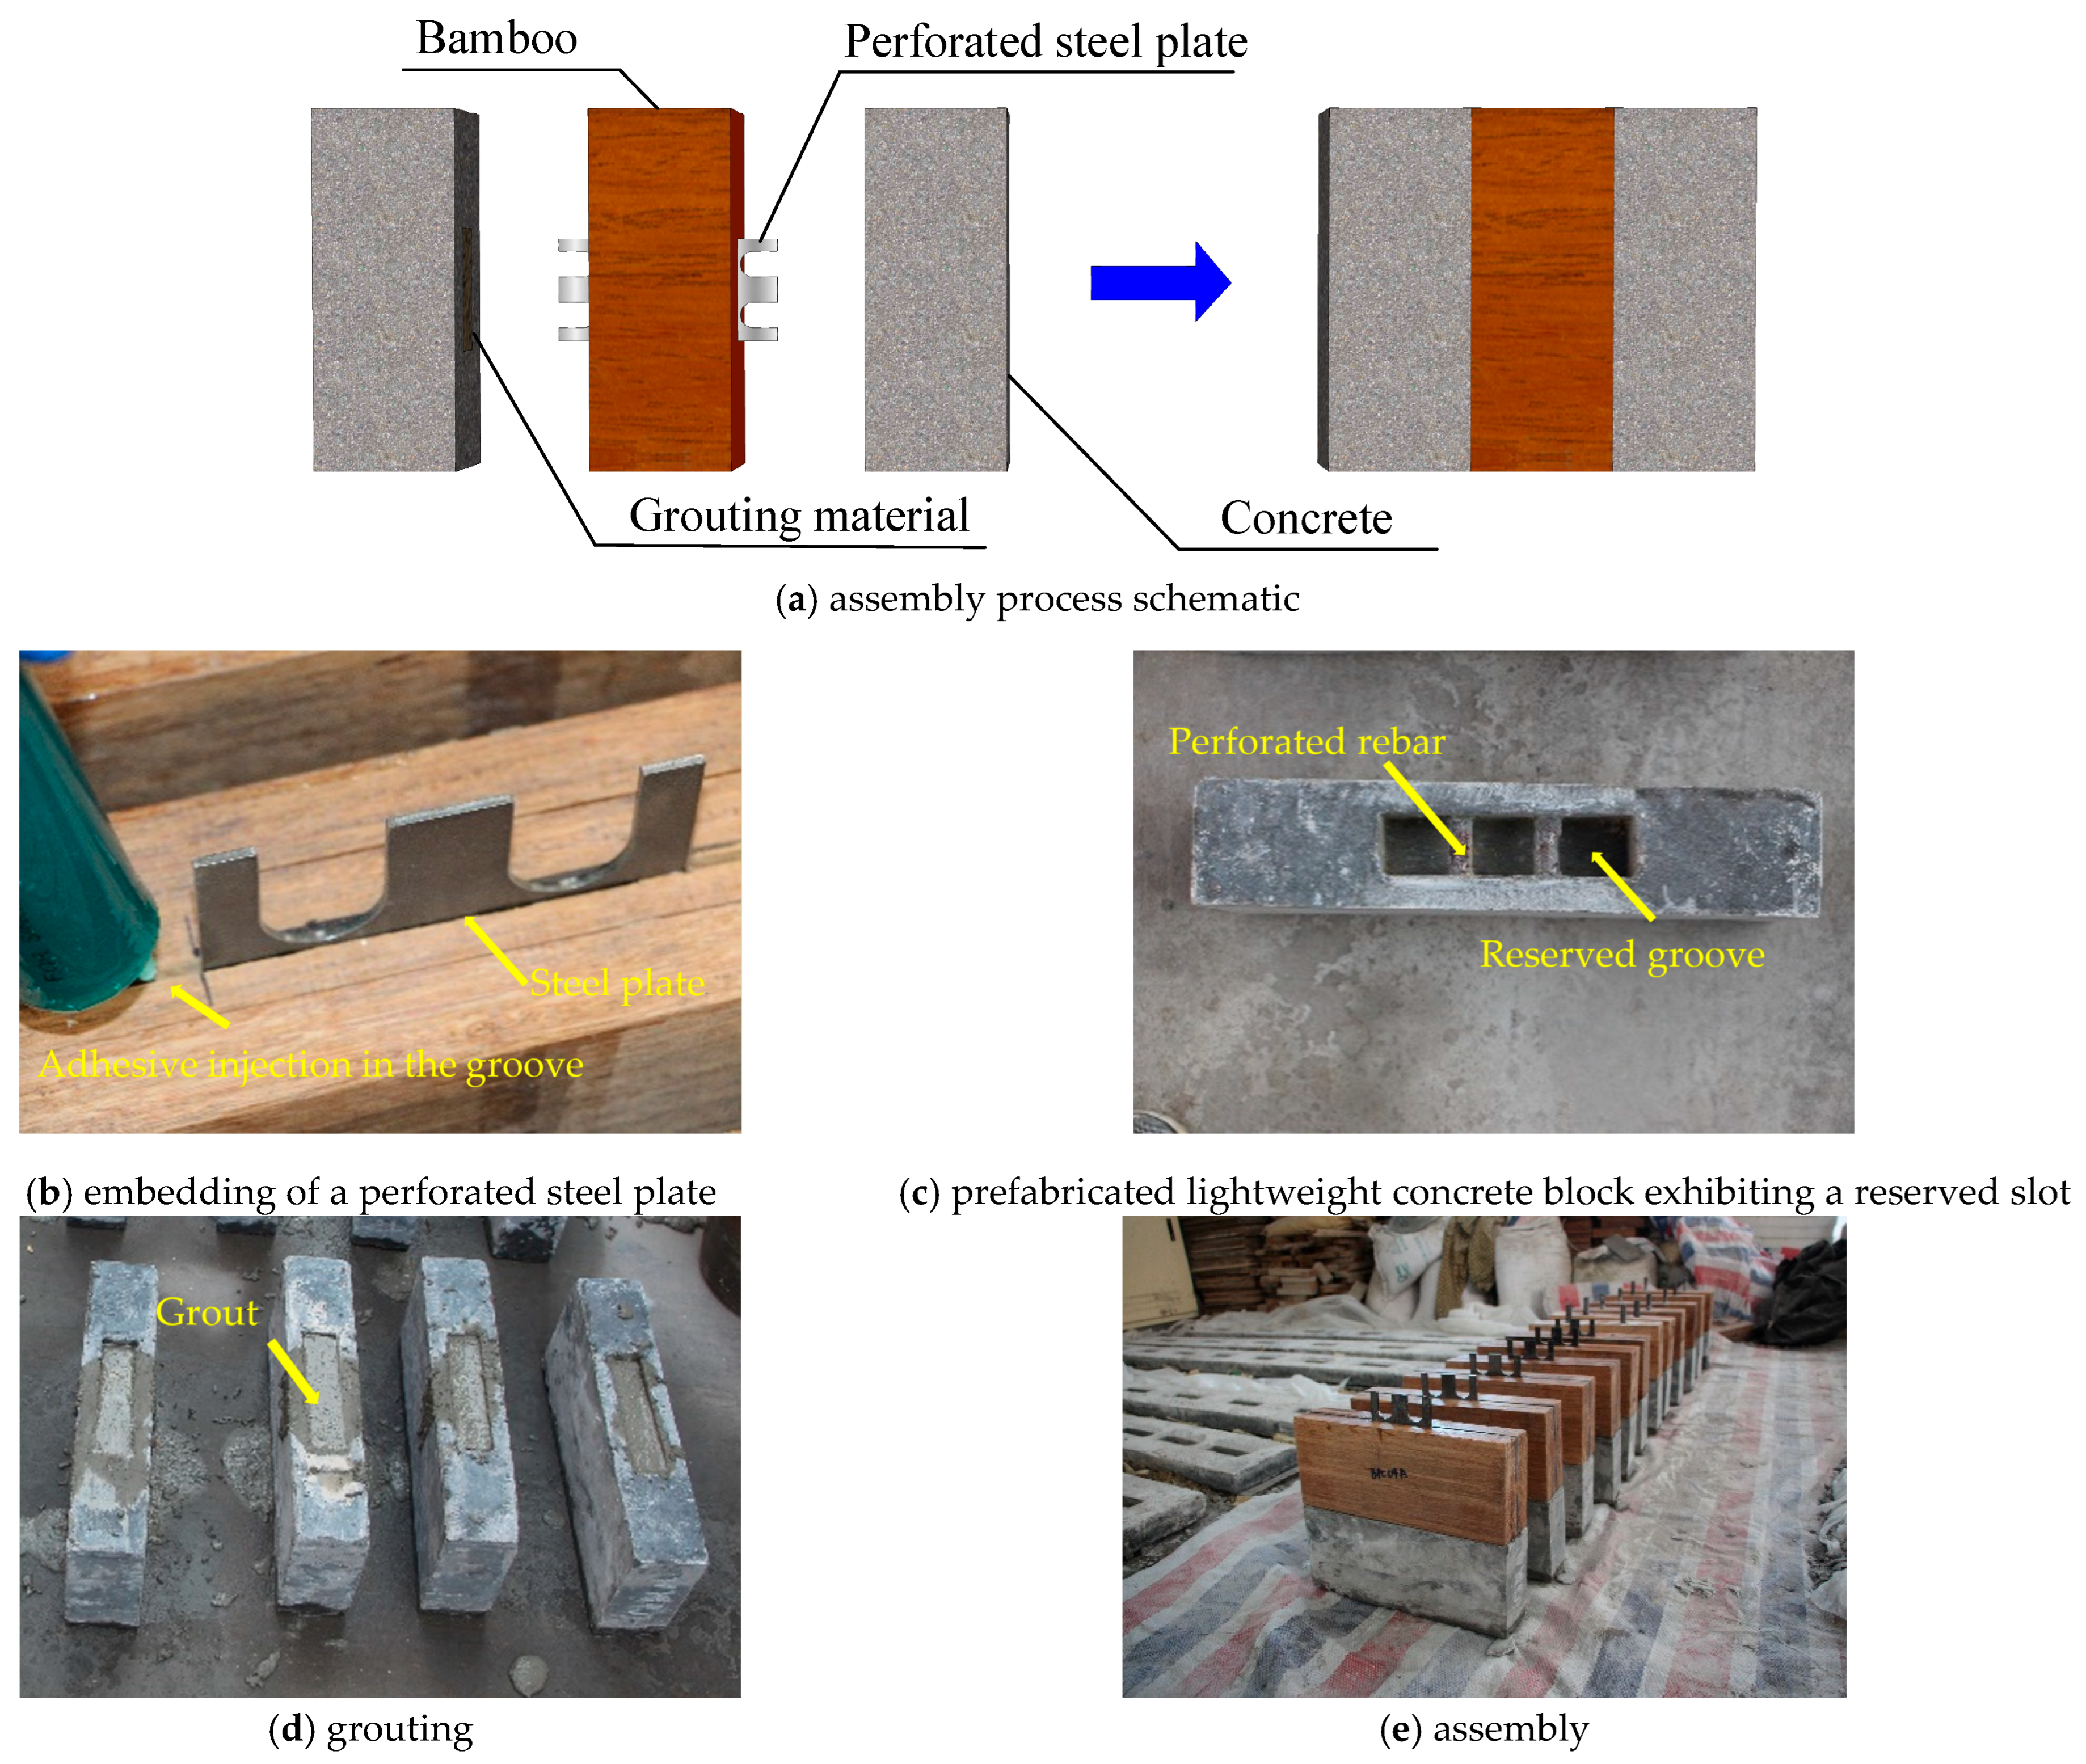
2.2. Design of the Shear Connections
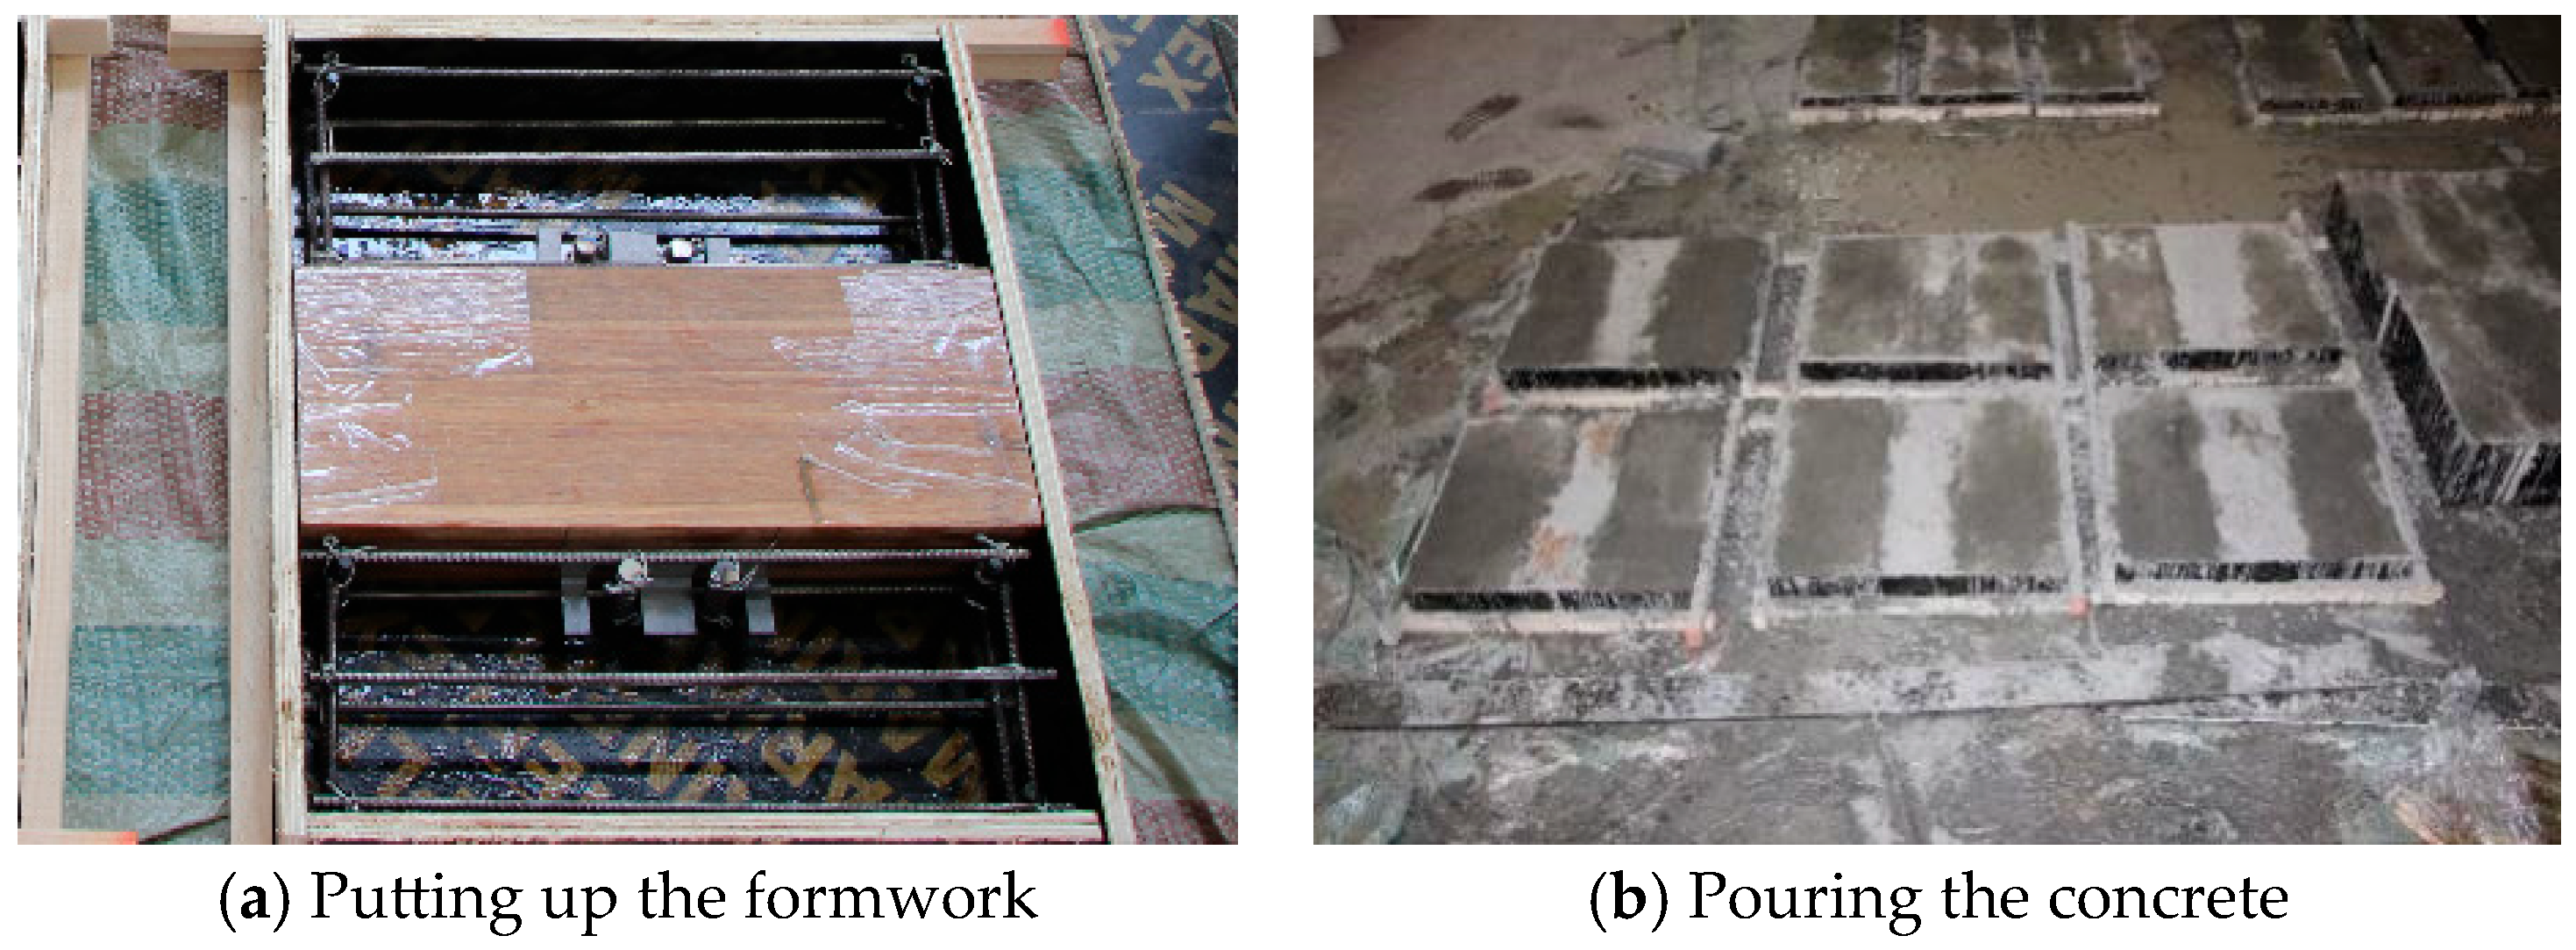
2.3. Construction of the Shear Connections
2.4. Shear Connection Test Setup
3. Results and Discussion
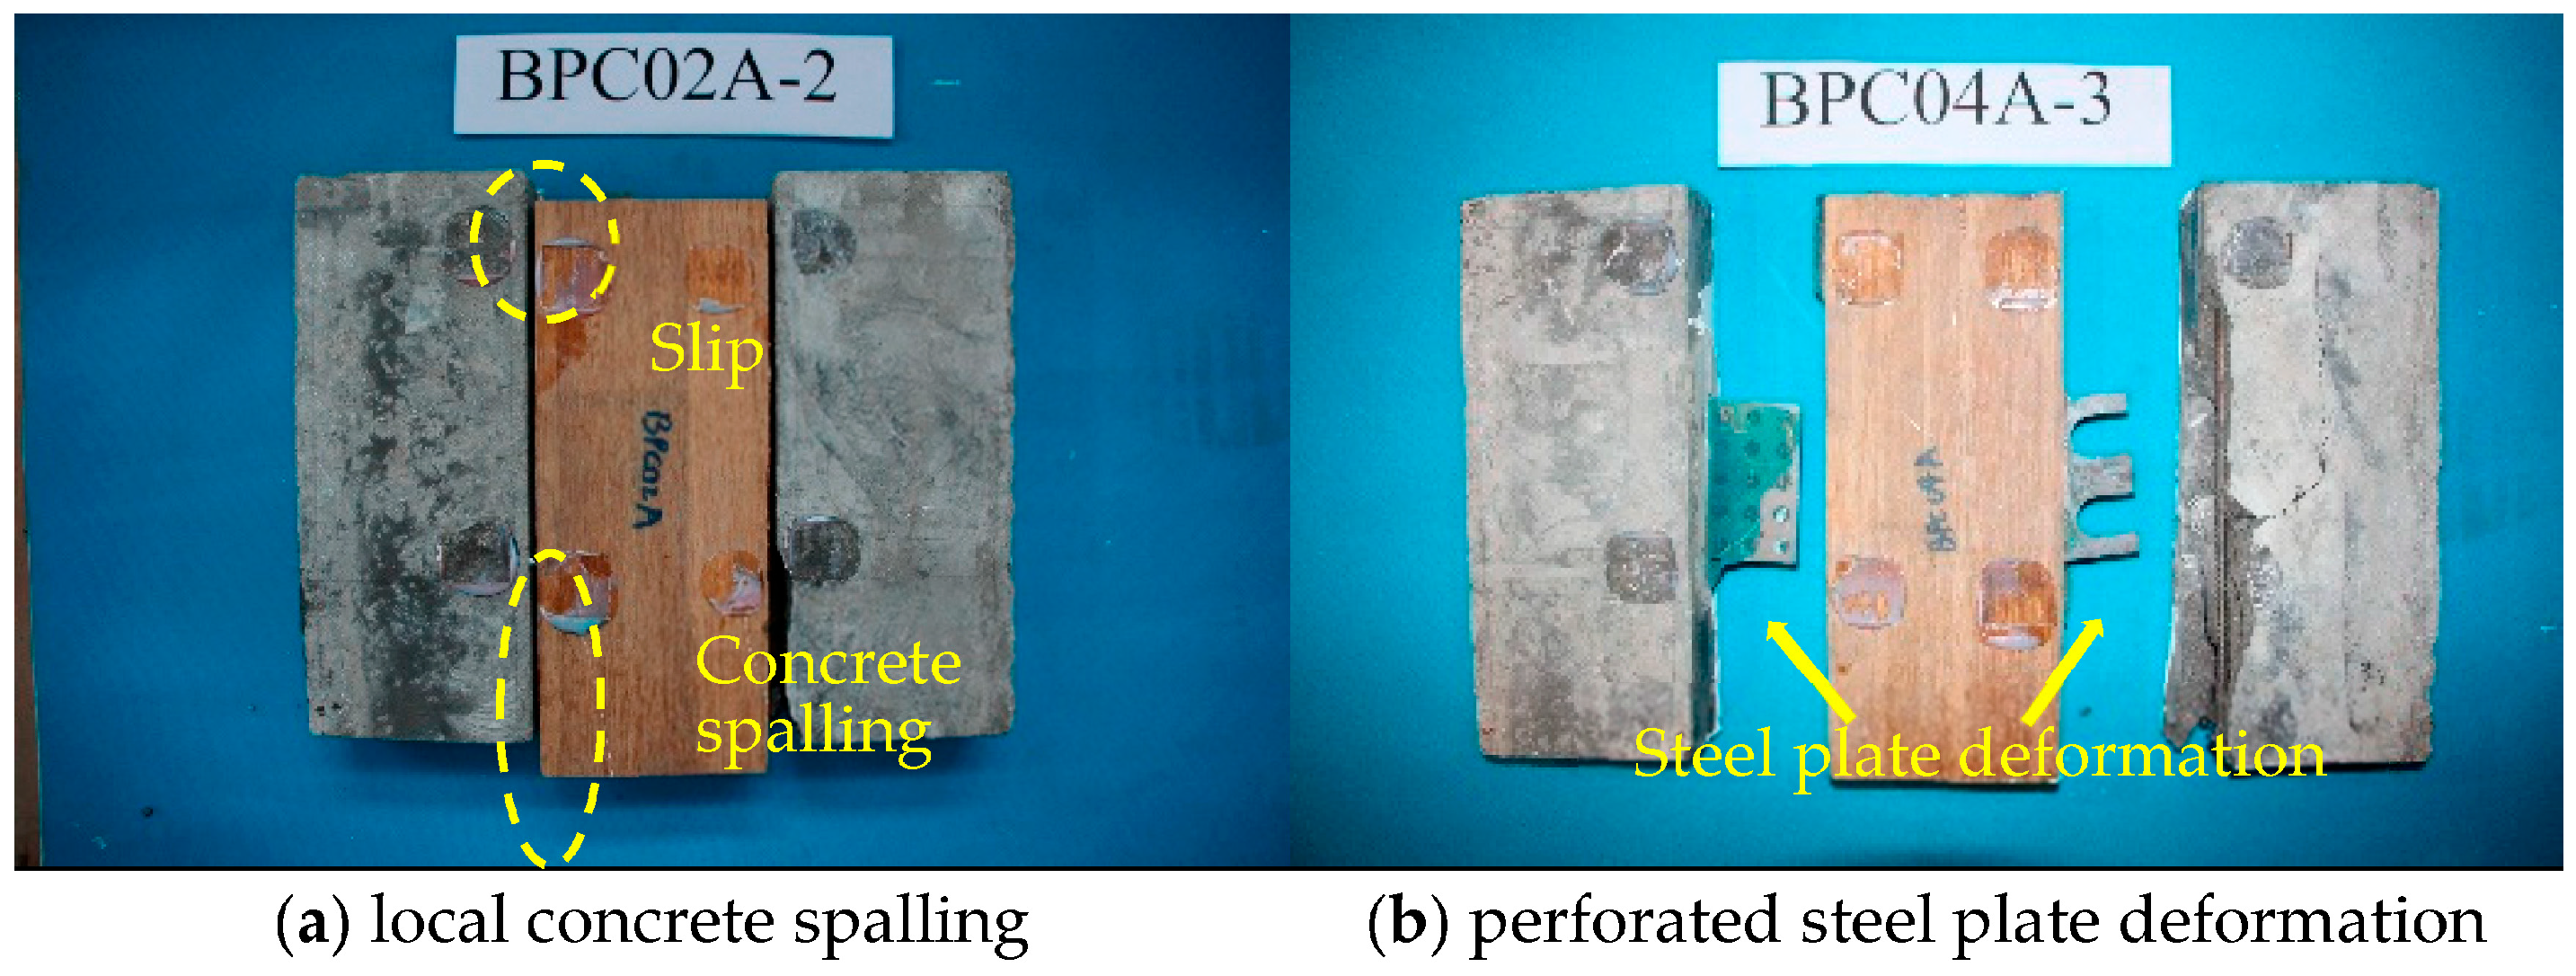
3.1. Observations and Failure Modes
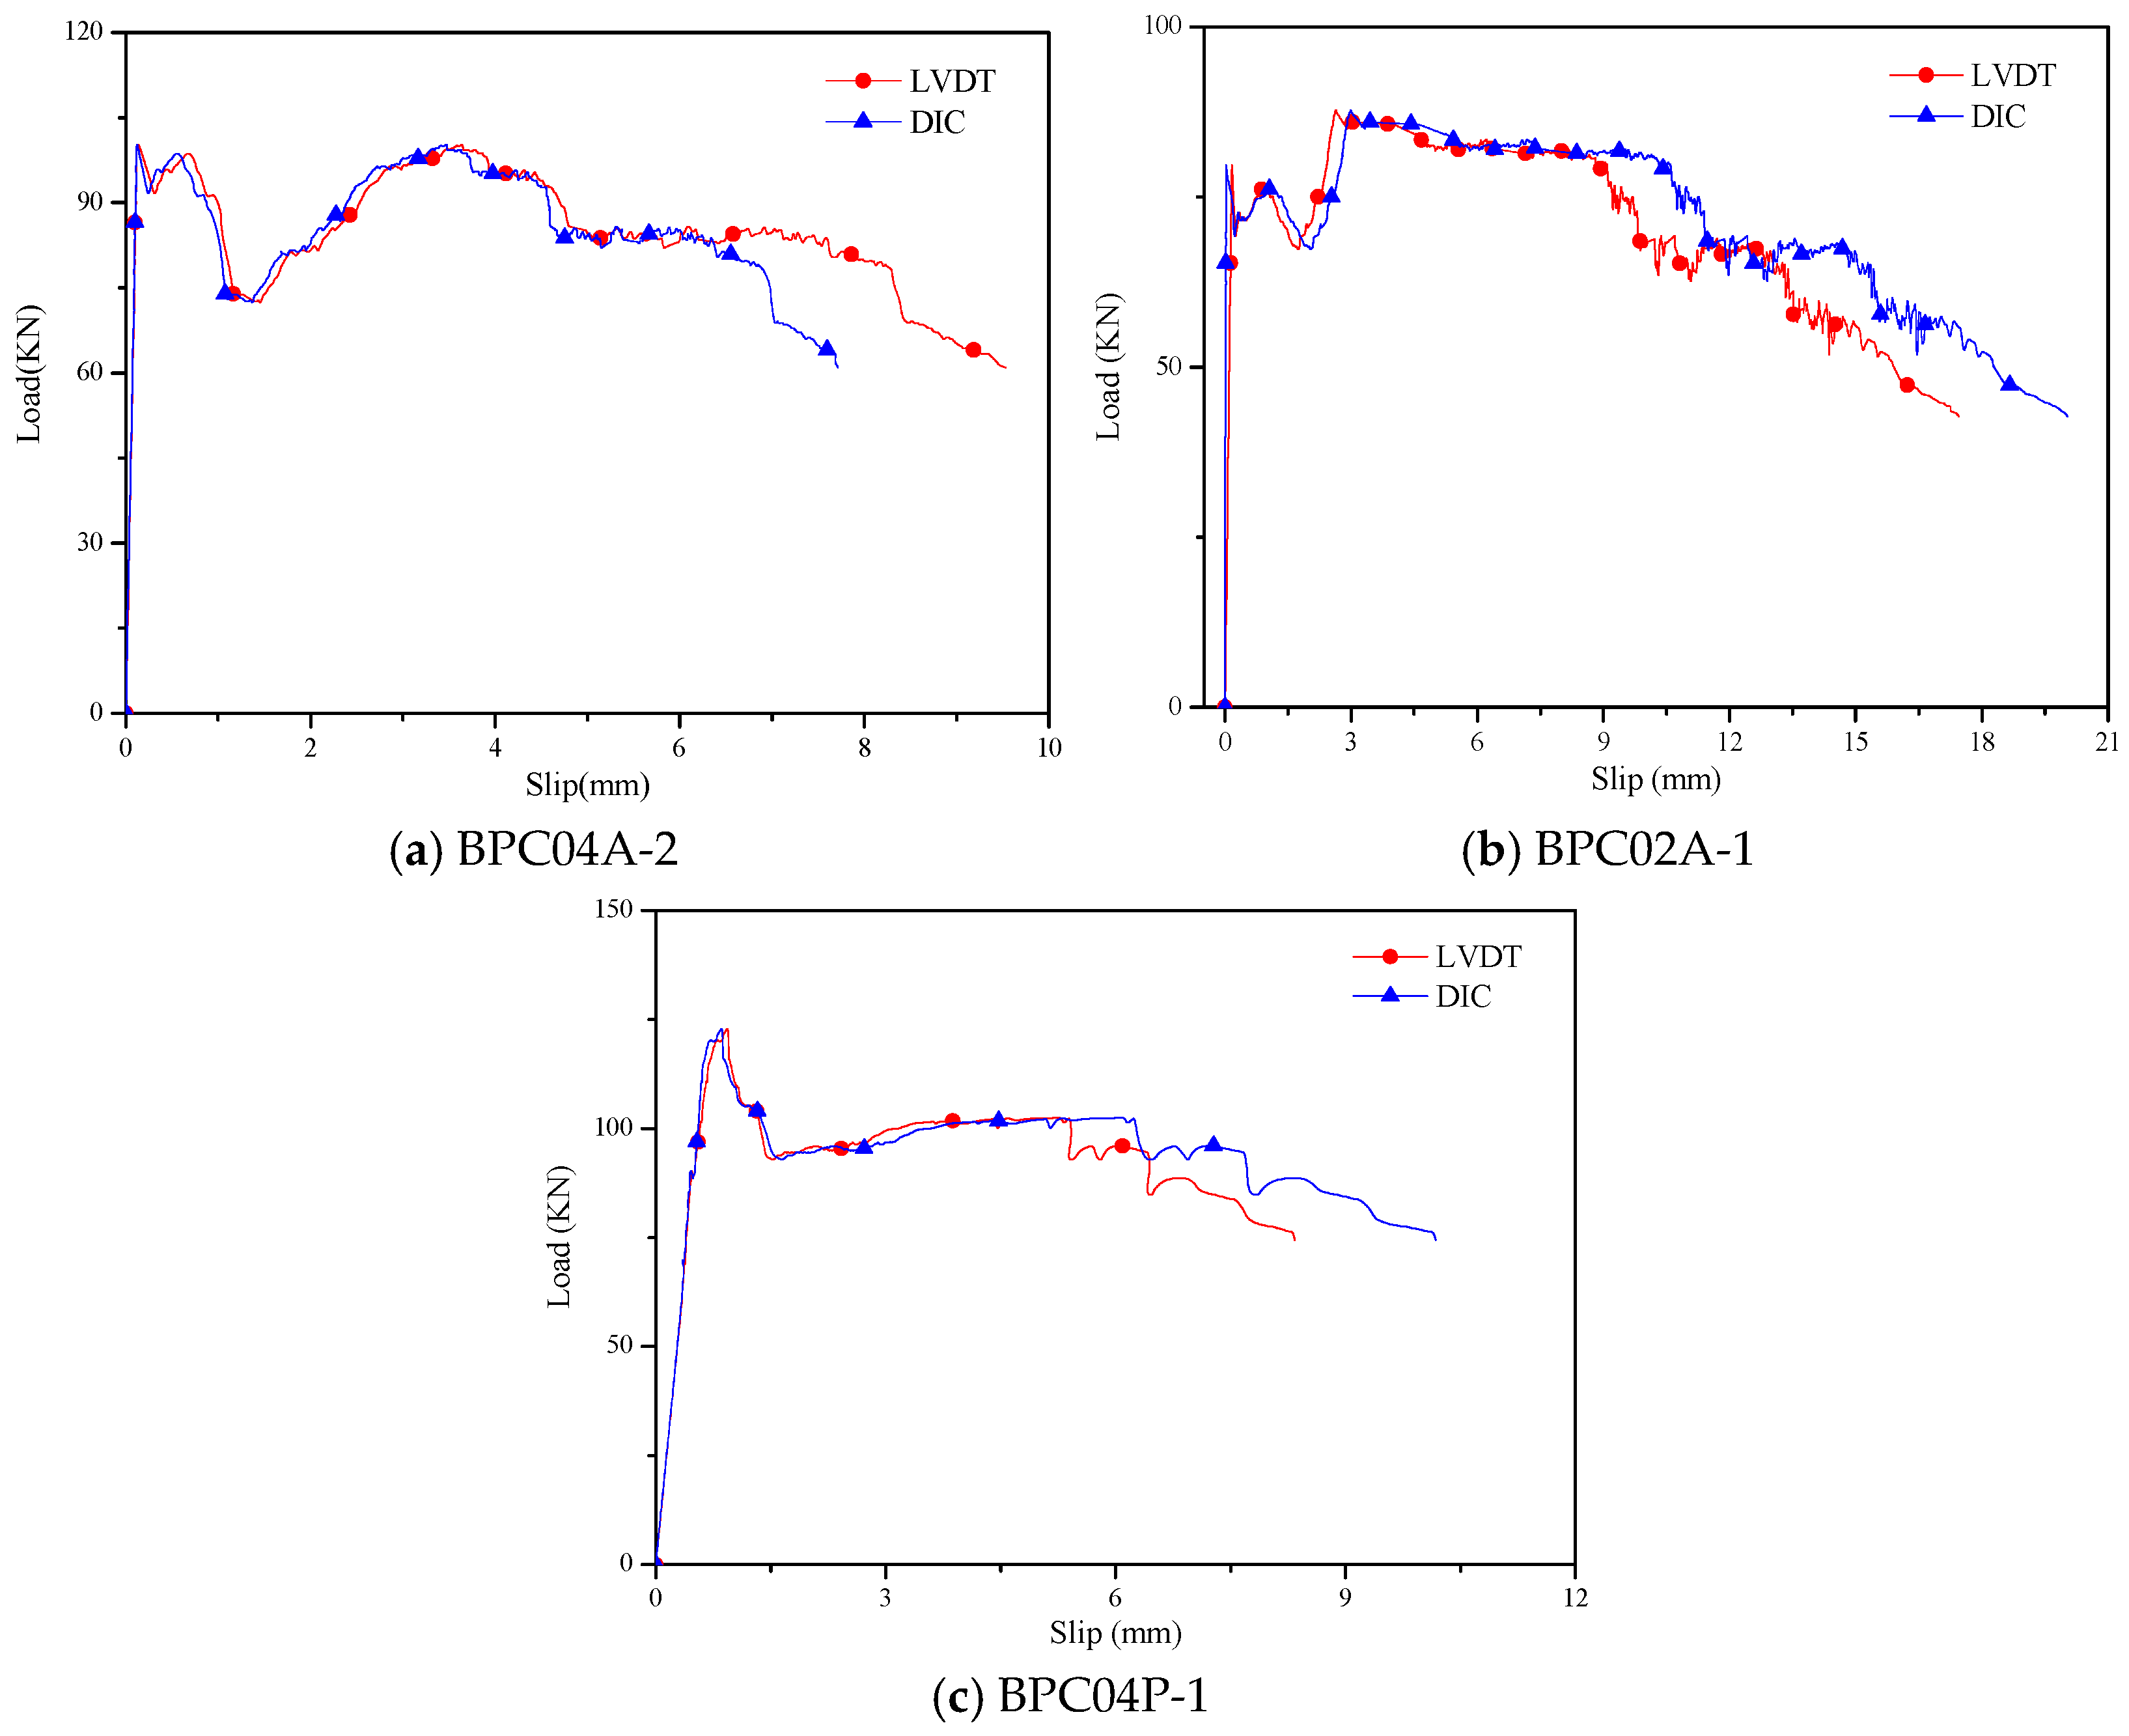
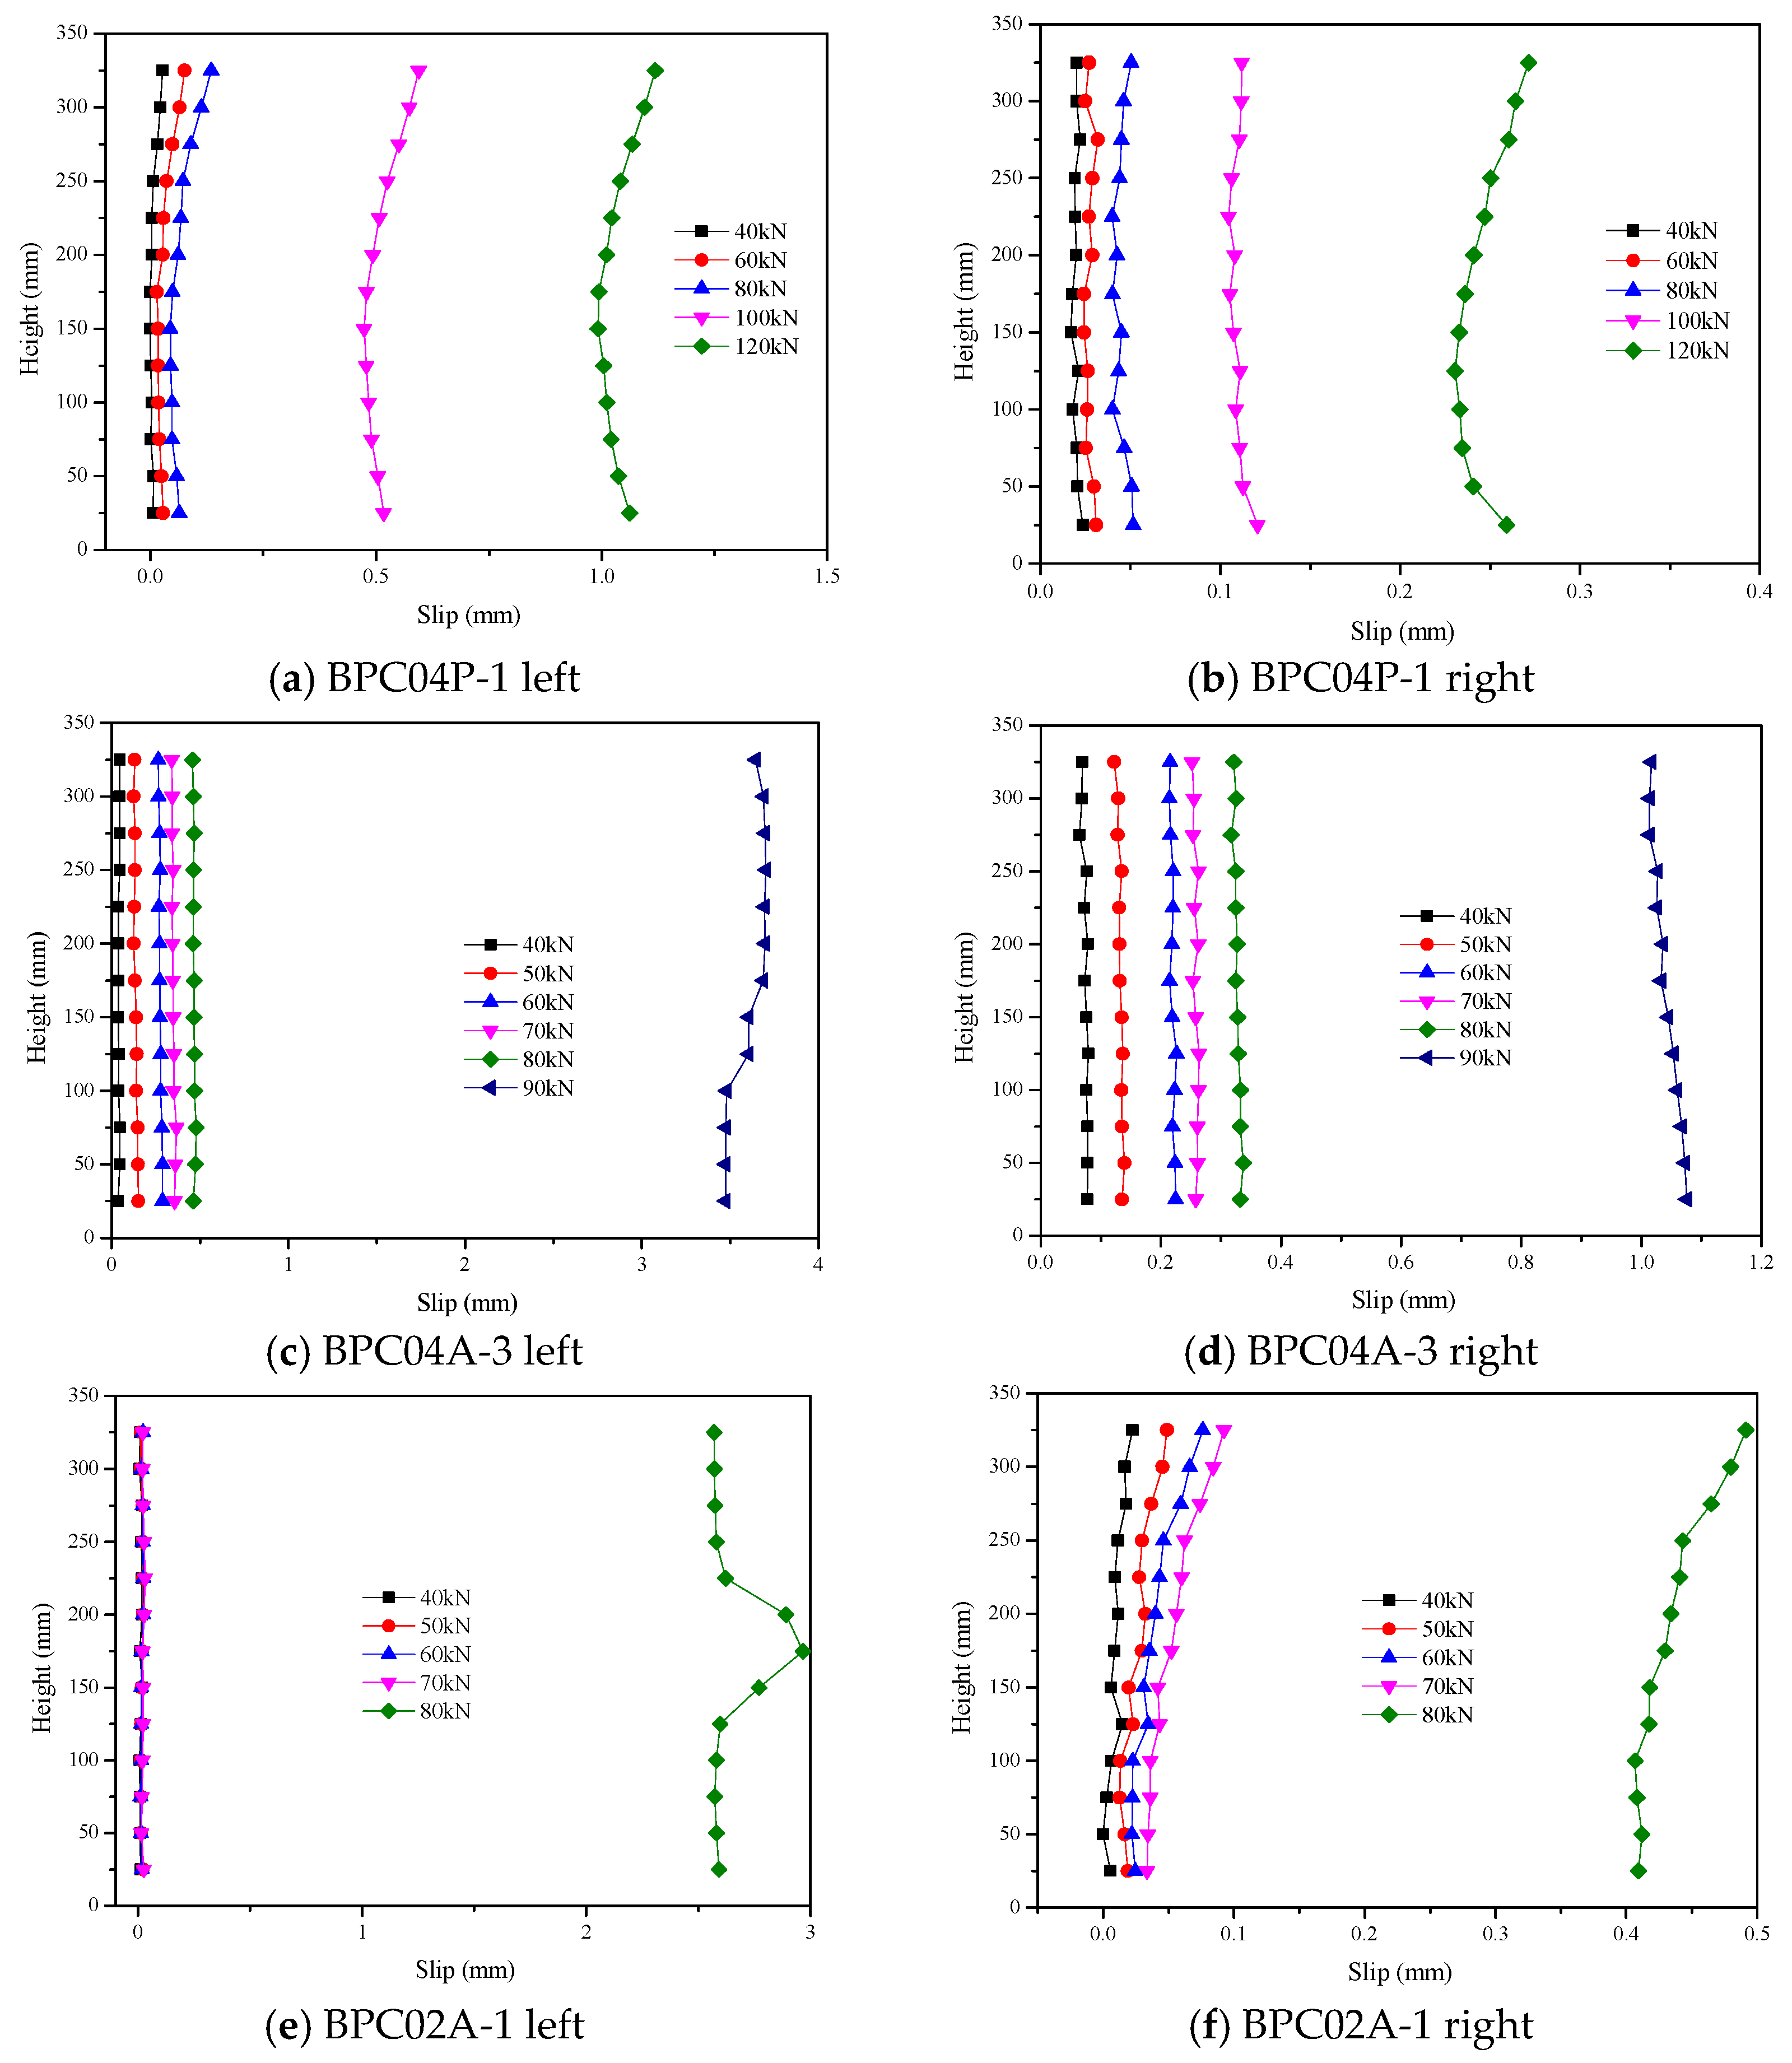
3.2. Load–Slip Curves and Slip Distribution
3.3. Flexural Stiffness and Capacity
4. Shear Capacity Analysis
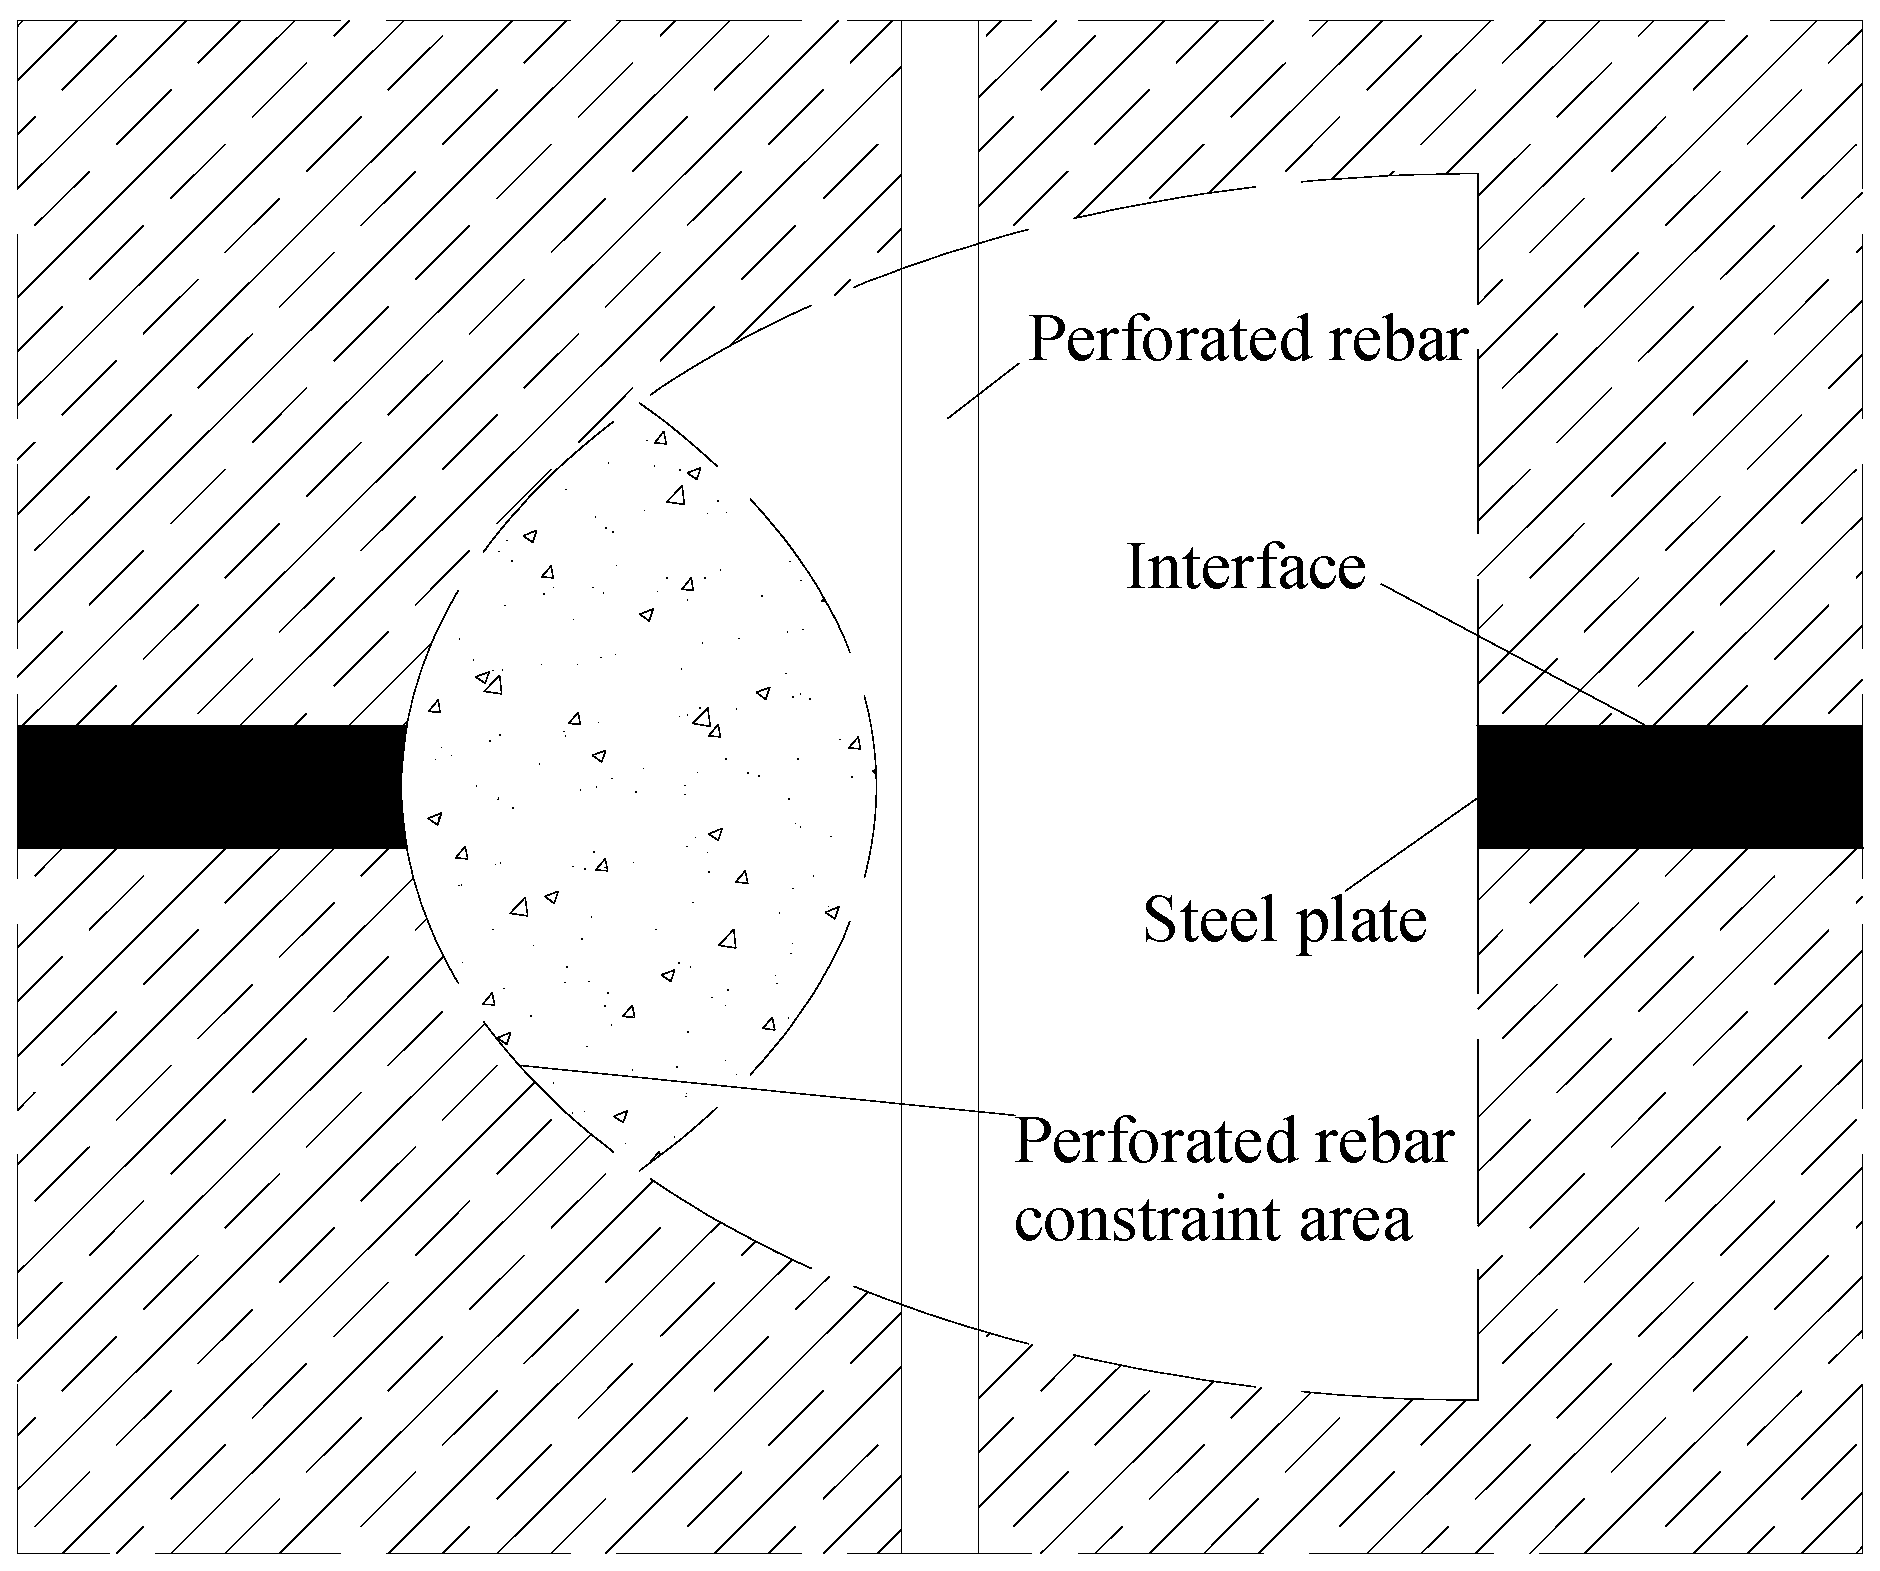
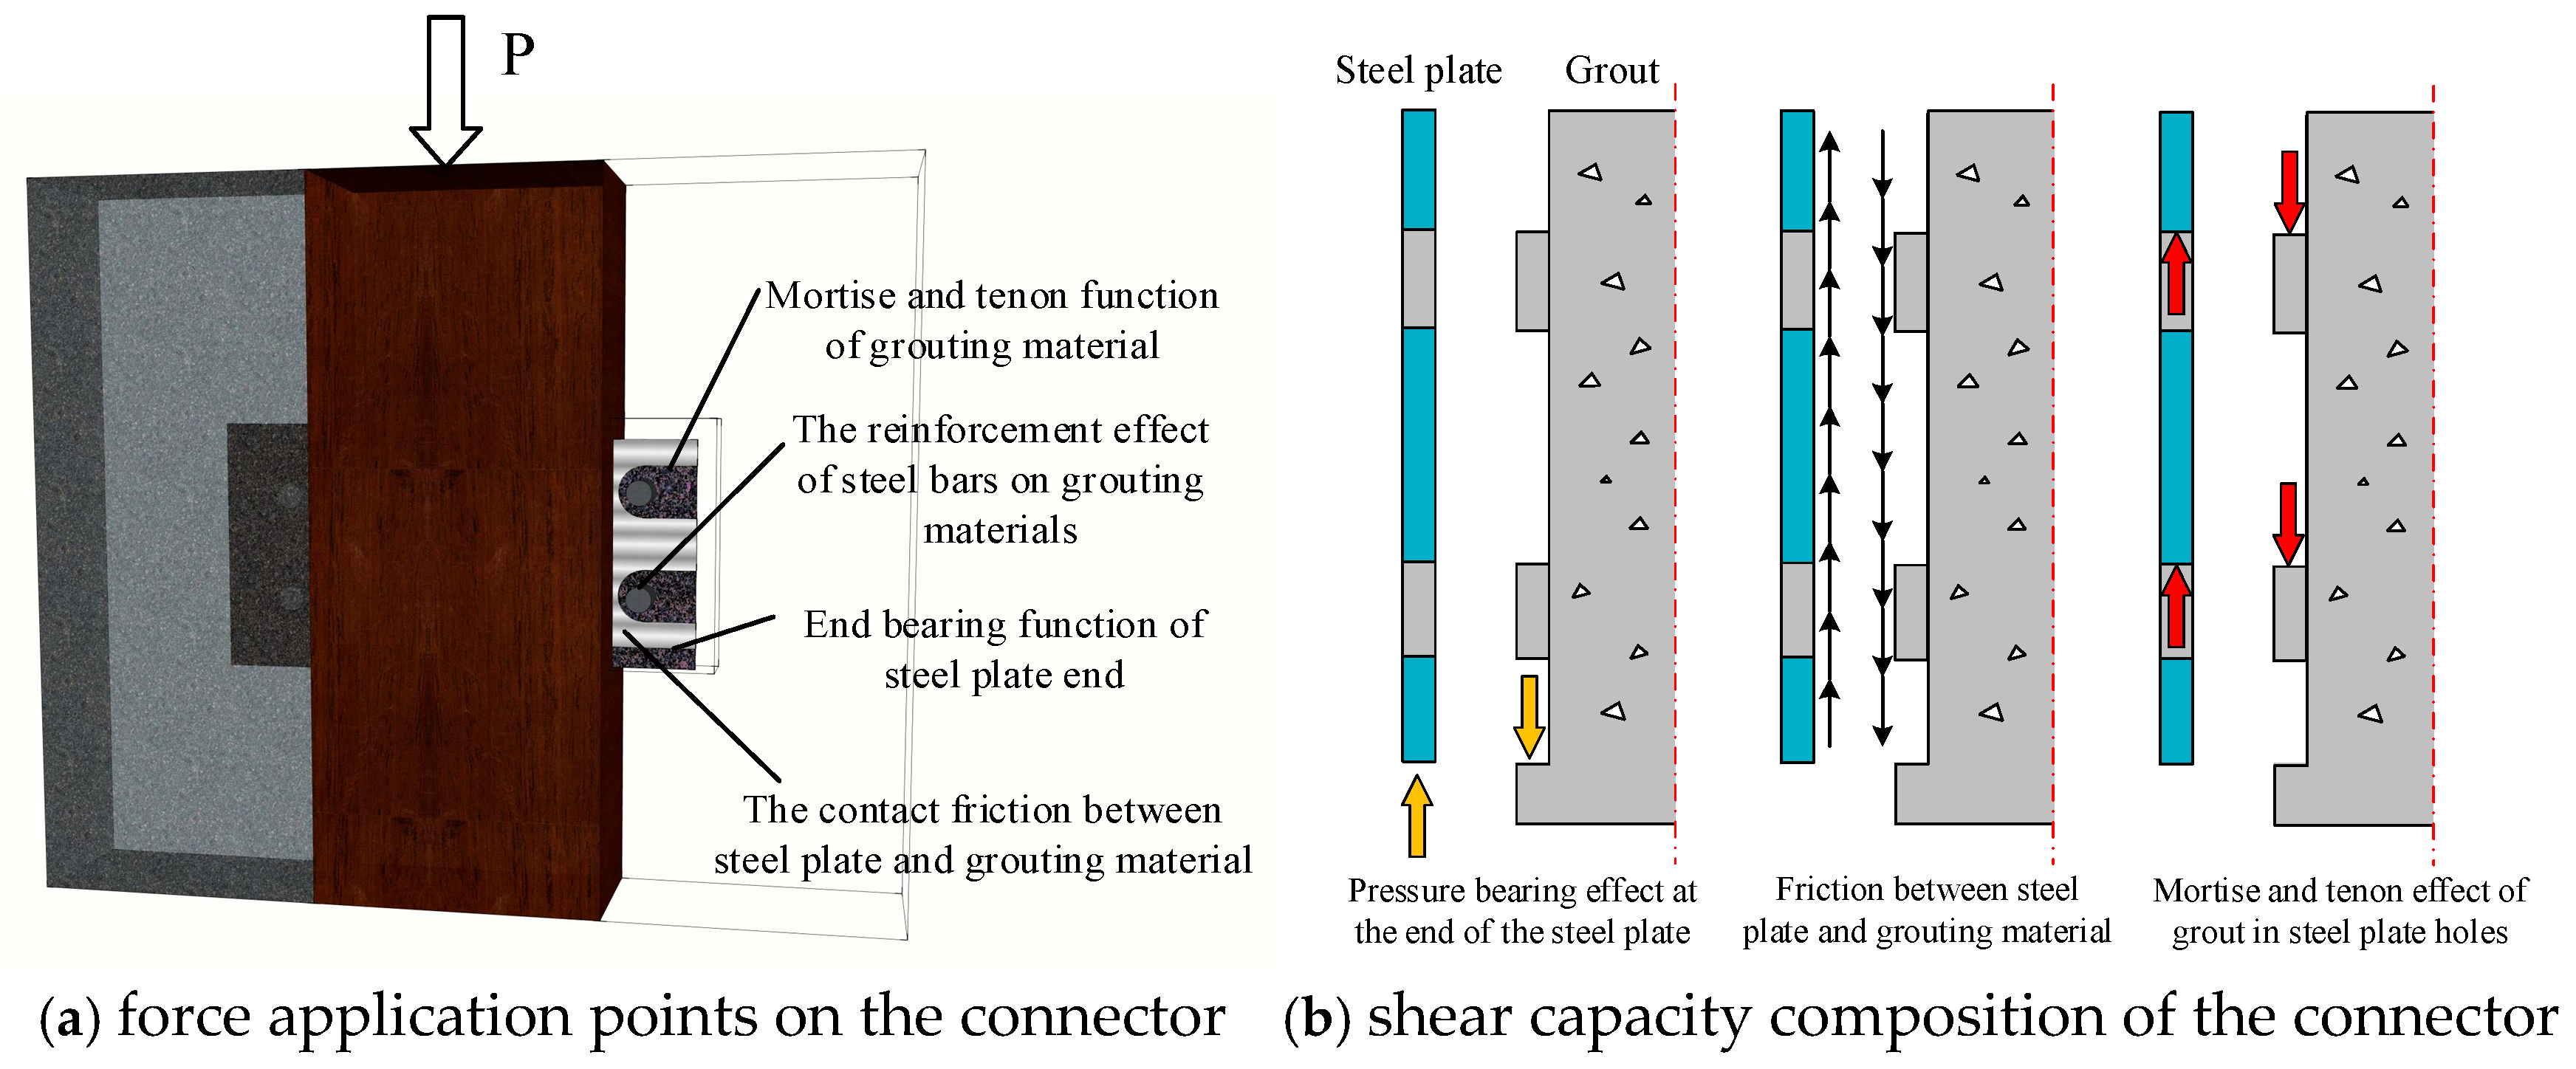
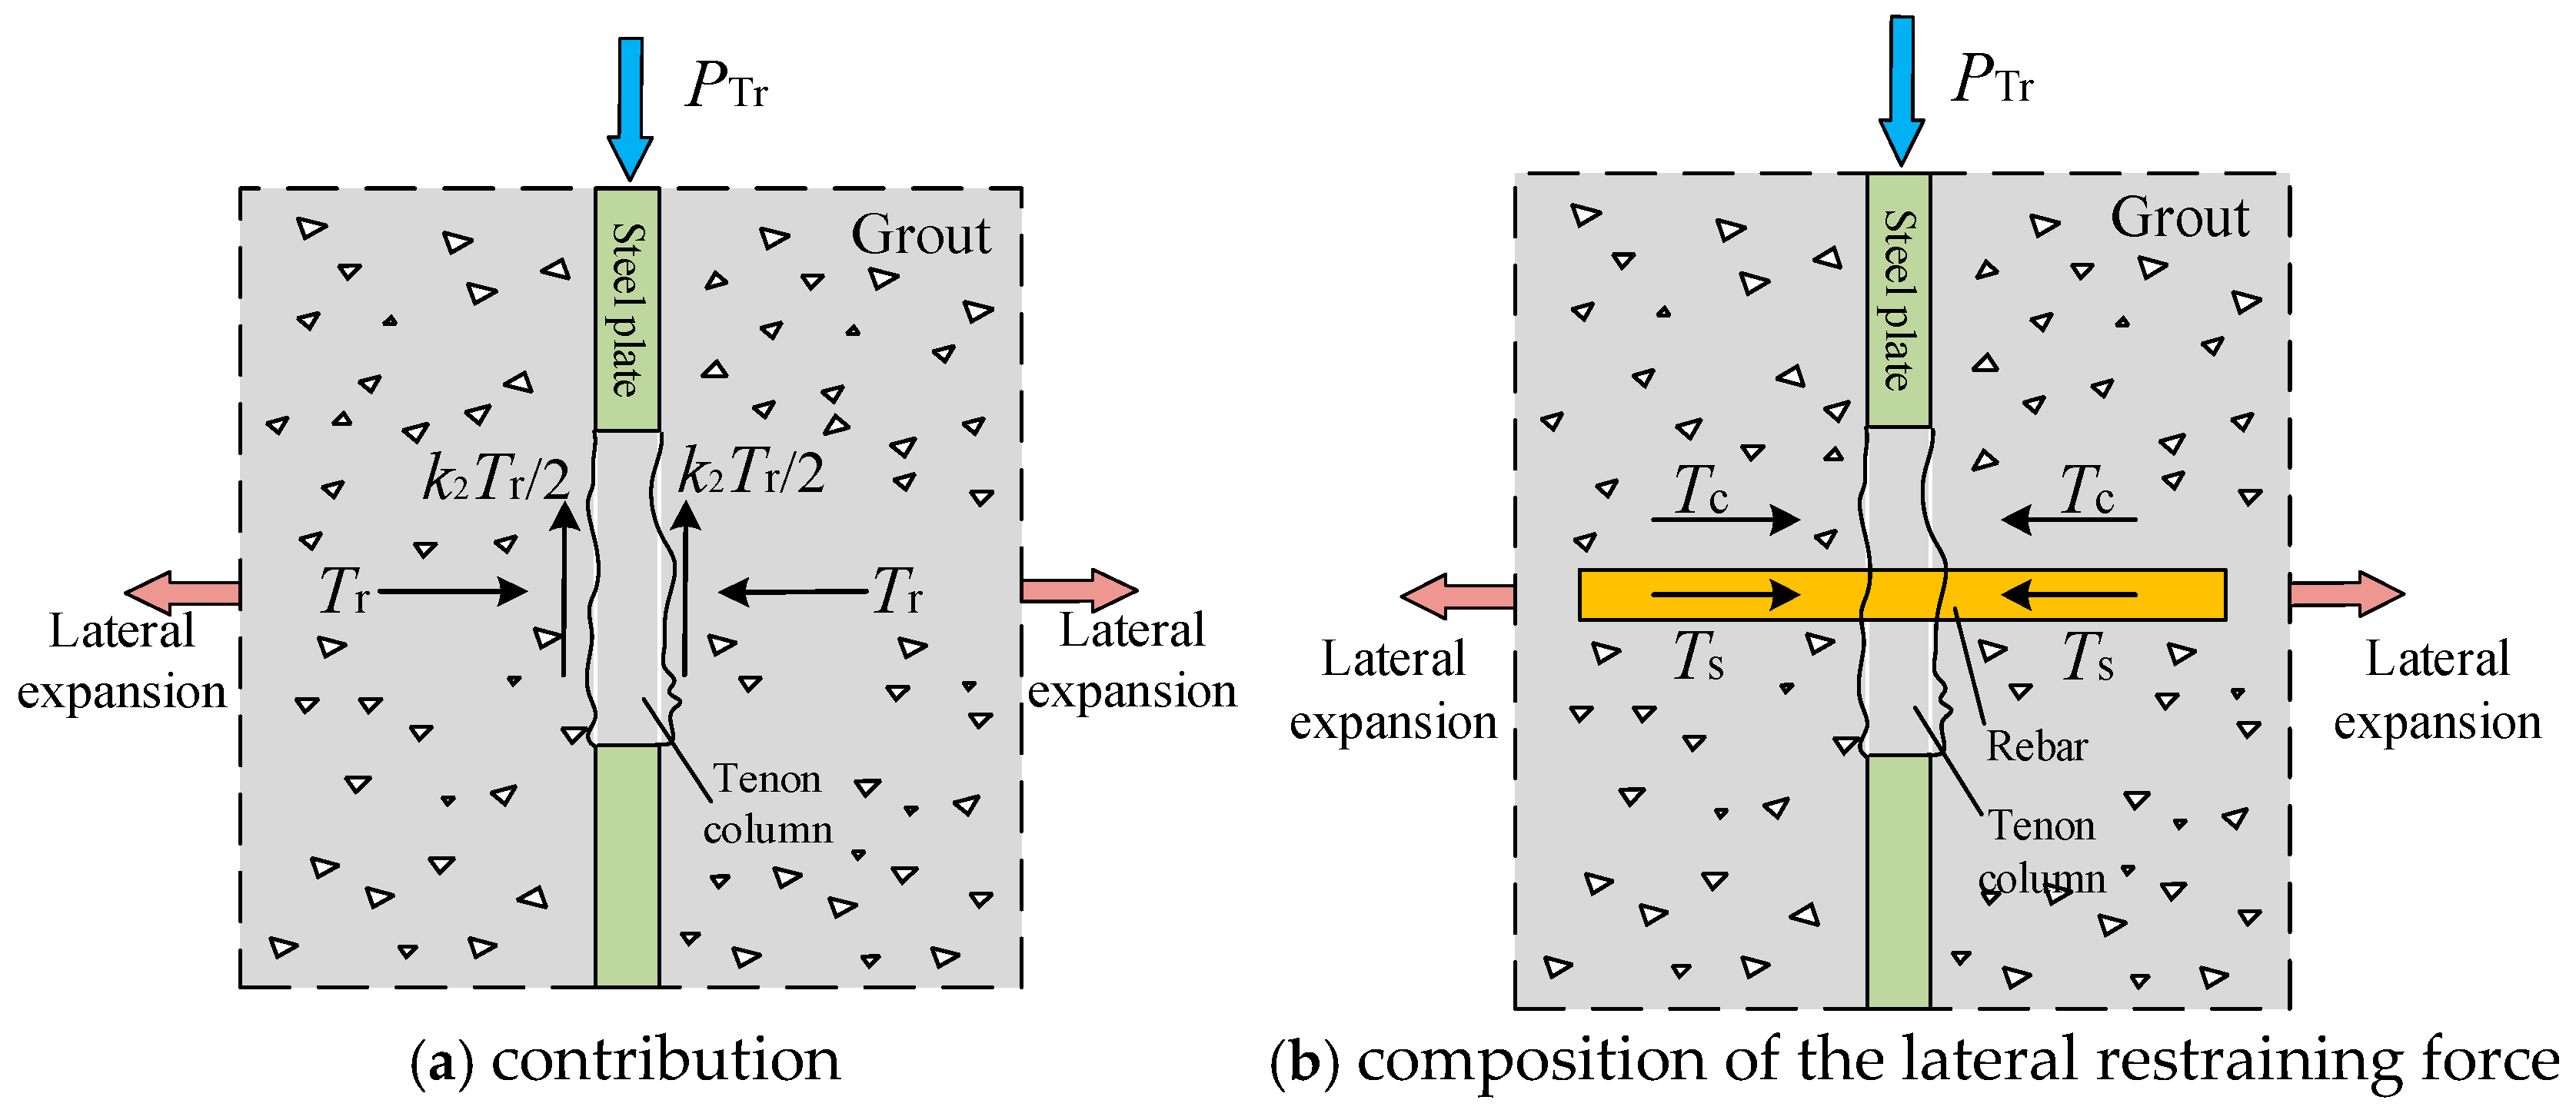
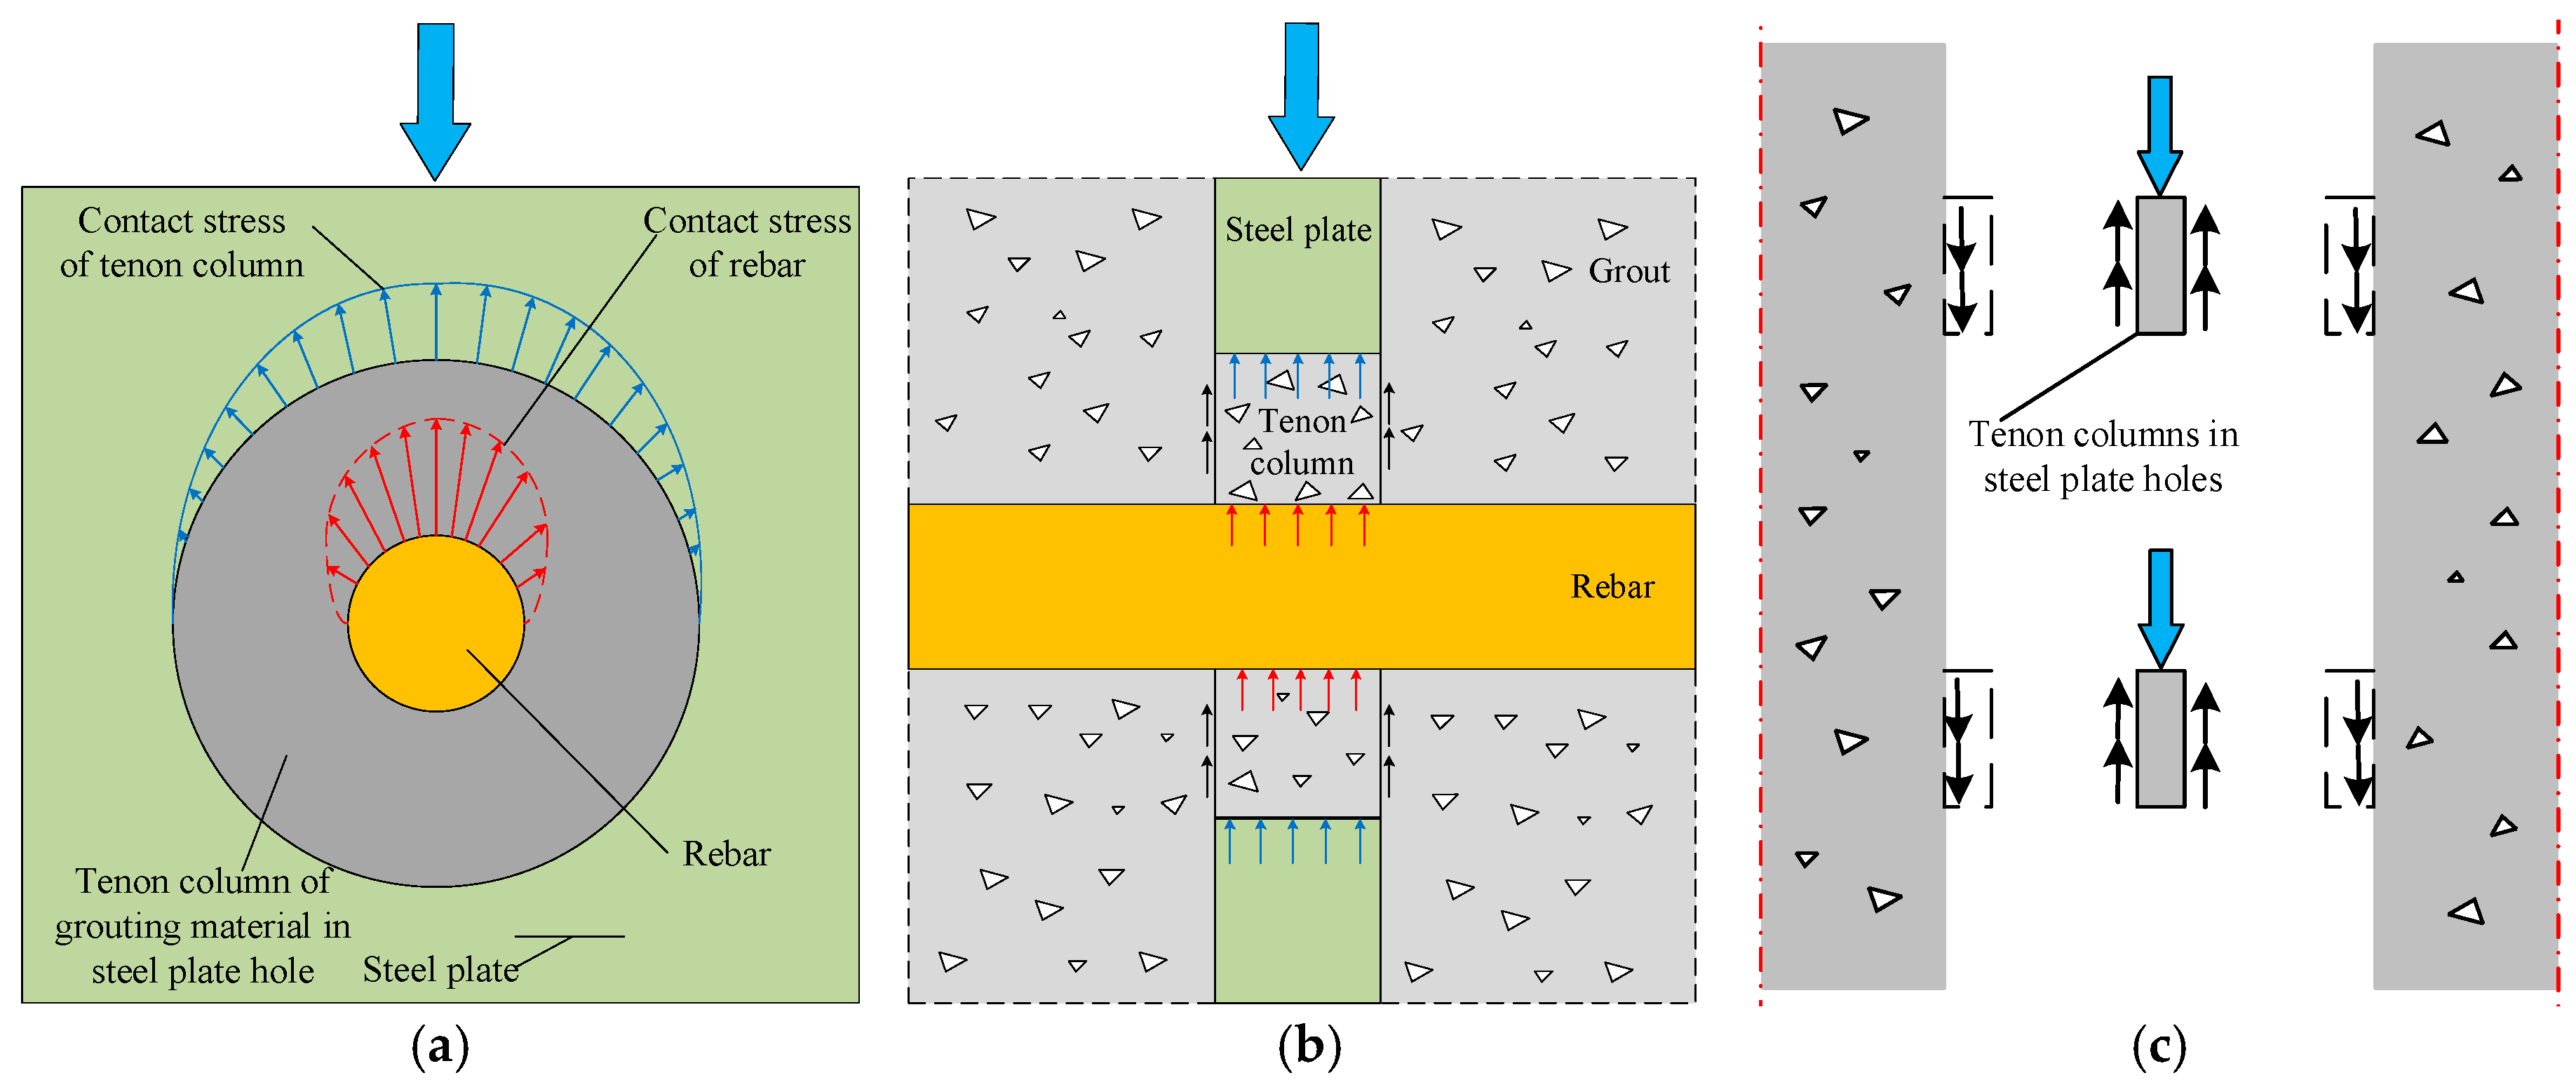
4.1. Analysis of the Perforated Steel Plate Connector Shear Mechanism
- (1)
- Bearing force at the end of the steel plate
- (2)
- Contact friction between the steel plate and concrete
- (3)
- Force due to the mortise and tenon effect of concrete in steel plate perforations
- (4)
- Contribution of the reinforcing impact of through-rebars
4.2. Determination of the Shear Capacity of the Perforated Steel Plate Connector
5. Conclusions
Author Contributions
Funding
Data Availability Statement
Conflicts of Interest
References
- Li, W.; Long, Y.; Huang, J.; Lin, Y. Axial load behavior of structural bamboo filled with concrete and cement mortar. Constr. Build. Mater. 2017, 148, 273–287. [Google Scholar] [CrossRef]
- Wang, Z.; Wei, Y.; Hu, Y.; Chen, S.; Zhao, K. An investigation of the flexural performance of bamboo-concrete composite beams with precast light concrete slabs and dowel connectors—ScienceDirect. J. Build. Eng. 2021, 41, 102759. [Google Scholar] [CrossRef]
- Wang, Z.; Wei, Y.; Li, N.; Zhao, K.; Ding, M. Flexural behavior of bamboo–concrete composite beams with perforated steel plate connections. J. Wood Sci. 2020, 66, 4. [Google Scholar] [CrossRef]
- Shan, B.; Wang, Z.Y.; Li, T.Y.; Xiao, Y. Experimental and Analytical Investigations on Short-Term Behavior of Glubam-Concrete Composite Beams. J. Struct. Eng. 2020, 146, 04019217. [Google Scholar] [CrossRef]
- Li, T.; Chen, J.Q.; Xiao, Y. Structural behavior of fully prefabricated glubam-concrete composite beams constructed of innovative connectors. Eng. Struct. 2024, 308, 117985. [Google Scholar] [CrossRef]
- Wang, Z.; Wang, F.; Liu, H. Digital image correlation-based investigation of the shear performance of connection systems of assembled bamboo scrimber–lightweight concrete composite beams. Materials 2024, 17, 3268. [Google Scholar] [CrossRef]
- Shan, B.; Li, T.; Deng, J. Experimental research on novel RPC-steel composite connections for prefabricated glubam-concrete composite beams. Constr. Build. Mater. 2022, 23, 127397. [Google Scholar] [CrossRef]
- Shan, B.; Xiao, Y.; Zhang, W.; Liu, B. Mechanical behavior of connections for glubam-concrete composite beams. Constr. Build. Mater. 2017, 143, 158–168. [Google Scholar] [CrossRef]
- Wang, Z.; Yang, W. Comparative study on mechanical behavior bamboo-concrete connections and wood-concrete connections. Front. Mater. 2020, 7, 587580. [Google Scholar] [CrossRef]
- Chen, S.; Wei, Y.; Wang, G.; Zhao, K.; Yang, B. Experimental investigation on shear behavior of bamboo-concrete composite structure with perforated steel plate connection. J. Build. Eng. 2023, 79, 107795. [Google Scholar] [CrossRef]
- Wei, Y.; Wang, Z.; Chen, S.; Zhao, K.; Zheng, K. Structural behavior of prefabricated bamboo-lightweight concrete composite beams with perforated steel plate connectors. Arch. Civ. Mech. Eng. 2021, 21, 15. [Google Scholar] [CrossRef]
- D143-09; Standard Test Method for Small Clear Specimens of Timber. ASTM: Philadelphia, PA, USA, 1994.
- GB/T 50081-2019; Standard for Test Methods of Concrete Physical and Mechanical Properties. Architecture & Building Press: Beijing, China, 2019.
- GB/T 228.1-2010; Metallic Materials-Tensile Testing-Part 1: Method of Test at Room Temperature. Standards Press of China: Beijing, China, 2010.
- GB/T 50448-2015; Technical Code for Application of Cementitious Grout. China Architecture & Building Press: Beijing, China, 2015.
- Chen, H.; Guo, Z.; Liu, Y. Experimental study on shear capacity of inclined PBL shear connector. J. Build. Struct. 2020, 41, 209–218. [Google Scholar] [CrossRef]
- Zhao, C.; Liu, Y.; Zheng, S. Experimental analysis of shear behavior of oval perfobond connector. In Proceedings of the 3rd International Conference on Transportation Engineering, Chengdu, China, 23–25 July 2011; ASCE: Reston, VA, USA, 2011; pp. 1983–1988. [Google Scholar] [CrossRef]
- Zhen, S.; Deng, G.; Yang, Y. Experimental study of bond-slip performance between steel and concrete in steel reinforced concrete structures. Eng. Mech. 2003, 20, 63–69. [Google Scholar]
- Hosaka, T.; Mitsukik, K.; Hiragih, H. An experimental study on shear characteristics of perfobond strip and its rational strength equations. J. Struct. Eng. 2000, 46, 1593–1604. [Google Scholar]
- Zhu, W.; Cui, Y.; Liu, Y. Research on shear strength of perfobond rib connectors. J. Build. Struct. 2017, 38, 129–136. [Google Scholar] [CrossRef]
- Zheng, S.; Liu, Y. Experimental investigation on shear and uplift behavior of notched perfobond connector. China J. Highw. Trans. 2013, 26, 119–124. [Google Scholar]
- Zheng, S.; Liu, Y.; Yoda, T. Parametric study on shear capacity of circular-hole and long-hole perfobond shear connector. J. Constr. Steel Res. 2016, 117, 64–80. [Google Scholar] [CrossRef]
- Kim, S.; Kim, K.; Park, S. Comparison of hysteretic performance of stubby Y-type perfobond rib and stud shear connectors. Eng. Struct. 2017, 147, 114–124. [Google Scholar] [CrossRef]
- Gu, J.; Liu, D.; Deng, W. Experimental study on the shear resistance of a comb-type perfobond rib shear connector. J. Constr. Steel Res. 2019, 158, 279–289. [Google Scholar] [CrossRef]
- Li, X.; Hu, Z.; Fan, L. Experimental investigation of perfobond hoop shear connector’s bearing capacity and slip. Eng. Struct. 2019, 198, 109461. [Google Scholar] [CrossRef]
- EN 1994-1-1; Eurocode 4: Design of Composite Steel and Concrete Structures—Part 1.1: General Rules and Rules for Buildings. European Committee for Standardization (CEN): Brusseles, Belguim, 2004.
- Leonhardt, F.; Andra, W.; Andra, H. Neues, vorteilhaftes verbundmittel für stahlverbund-tragwerke mit hoher dauerfestigkeit. Beton-und Stahlbetonbau 1987, 82, 325–331. [Google Scholar] [CrossRef]
- Hosaka, T. Study on shear strength and design method of perfobond strip. J. Struct. Eng. 2002, 48, 1265–1272. [Google Scholar]
- Nishiumi, K.; Okimoto, M. Shear strength of perfobond rib shear connector under the confinement. Doboku Gakkai Ronbunshu 2010, 633, 193–203. [Google Scholar] [CrossRef] [PubMed]
- Oguejiofor, E.; Hosain, M. Numerical analysis of push-out specimens with perfobond rib connectors. Comput. Struct. 1997, 62, 617–624. [Google Scholar] [CrossRef]
- Zong, Z.; Che, H. Study on static load and fatigue test of shear connectors. J. Fuzhou Univ. 1999, 27, 61–66. [Google Scholar]
- JTG D64-2015; Specifications for Design of Highway Steel Bridge. Communications Press: Beijing, China, 2015.
- Hu, J.; Hou, W.; Ye, M. Study of influence factors and formula for the bearing capacity of PBL shear connectors. J. Railw. Sci. Eng. 2007, 4, 12–18. [Google Scholar] [CrossRef]
- Xiao, L.; Qiang, S.; Li, X. Research on mechanical performance of PBL shear connectors considering the thickness of perforated plate. Eng. Mech. 2012, 29, 282–288. [Google Scholar] [CrossRef]
- AL-Darzi, S.; Chen, A.; Liu, Y. Finite element simulation and parametric studies of perfobond rib connector. Am. J. Appl. Sci. 2007, 4, 122–127. [Google Scholar] [CrossRef]
- Yang, Y.; Chen, Y. Experimental study on the shear capacity of PBL shear connectors. Eng. Mech. 2018, 35, 89–96. [Google Scholar] [CrossRef]
- Oguejiofor, E.; Hosain, M. A parametric study of perfobond rib shear connectors. Can. J. Civ. Eng. 1994, 21, 614–625. [Google Scholar] [CrossRef]


| Property | Number of Specimens | Average Value | Standard Deviation | Coefficient of Variation (%) |
|---|---|---|---|---|
| Tensile strength (MPa) | 10 | 149.62 | 15.91 | 10.63 |
| Tensile strain | 10 | 0.009 | 0.002 | 22.17 |
| Tensile modulus of elasticity (GPa) | 10 | 16.81 | 2.91 | 17.33 |
| Compressive strength (MPa) | 10 | 104.07 | 12.24 | 11.77 |
| Compressive strain | 10 | 0.031 | 0.012 | 40.43 |
| Compressive modulus of elasticity (GPa) | 10 | 13.43 | 5.77 | 42.98 |
| Specimen Type | Specimen | Mass (kg) | Density (kg/m3) | Ultimate Compressive Load (kN) | Compressive Strength (MPa) |
|---|---|---|---|---|---|
| Cube specimen | CU-1 | 6.39 | 1893.33 | 944.30 | 41.97 |
| CU-2 | 6.24 | 1848.89 | 965.00 | 42.89 | |
| CU-3 | 6.28 | 1860.74 | 922.50 | 41.00 | |
| Mean | 6.30 | 1867.65 | 943.93 | 41.95 | |
| SD | 0.06 | 18.79 | 17.35 | 0.77 | |
| COV | 1.01% | 1.01% | 1.84% | 1.84% | |
| Cylinder specimen | CY-1 | 9.59 | 1809.86 | 635.20 | 35.96 |
| CY-2 | 9.82 | 1853.27 | 626.80 | 35.49 | |
| CY-3 | 9.61 | 1813.64 | 617.70 | 34.97 | |
| Mean | 9.67 | 1825.59 | 626.57 | 35.47 | |
| SD | 0.10 | 19.63 | 7.15 | 0.40 | |
| COV | 1.08% | 1.08% | 1.14% | 1.14% |
| Specimen | Flexural Capacity (kN) | Flexural Strength (MPa) | Compressive Capacity (kN) | Compressive Strength (MPa) |
|---|---|---|---|---|
| G1 | 3.42 | 8.02 | 93.48 | 58.43 |
| 89.50 | 55.94 | |||
| G2 | 3.55 | 8.32 | 85.50 | 53.44 |
| 99.38 | 62.11 | |||
| G3 | 3.67 | 8.60 | 87.17 | 54.48 |
| 82.22 | 51.39 | |||
| Mean | 3.55 | 8.31 | 89.54 | 55.96 |
| SD | 0.10 | 0.24 | 5.60 | 3.50 |
| COV | 2.85% | 2.88% | 6.25% | 6.25% |
| Specimen Group | Specimen ID | Thickness of the Perforated Steel Plate (mm) | Fabrication Method | Number of Specimens |
|---|---|---|---|---|
| BPC02A | BPC02A-1/2/3 | 2 | Assembly | 3 |
| BPC04A | BPC04A-1/2/3 | 4 | Assembly | 3 |
| BPC04P | BPC04P-1/2/3 | 4 | CIP | 3 |
| Specimen ID | Ultimate Load | Load Capacity of a Single Shear Connector | Ultimate Slip | Stiffness |
|---|---|---|---|---|
| Pmax (kN) | 1/2 Pmax (kN) | ∆max (mm) | K (kN/mm) | |
| BPC04P | 129.74 | 64.87 | 0.74 | 182.92 |
| BPC04A | 108.87 | 54.44 | 1.29 | 449.63 |
| BPC02A | 109.91 | 54.95 | 2.33 | 316.44 |
| No. | Reference | Calculation Formula | Factors Contributing to Shear Capacity Considered | Specific Parameters Involved | Steel Plate Type |
|---|---|---|---|---|---|
| 1 | Eurocode 4 [26] | Through-rebars, concrete tenon | ①②③④ | Single perforation | |
| 2 | Leonhardt et al. [27] | Concrete tenon | ①③ | Single perforation | |
| 3 | Hosaka et al. [28] | Through-rebars, concrete tenon | ①②③④ | Single perforation | |
| 4 | Nishiumi et al. [29] | Through-rebars, concrete tenon | ①②③④ | Single perforation | |
| 5 | Oguejiofor et al. [30] | Through-rebars, concrete tenon, end bearing of the steel plate | ①②③④⑤⑥⑦ | Multiple perforations | |
| 6 | Zong et al. [31] | Through-rebars, concrete tenon | ①②③④⑧ | Single perforation | |
| 7 | JTG D64-2015 [32] | Through-rebars, concrete tenon | ①②③④ | Single perforation | |
| 8 | Hu et al. [33] | Through-rebars, concrete tenon, stirrups | ①②③④⑨⑩ | Single perforation | |
| 9 | Xiao et al. [34] | Through-rebars, concrete tenon | ①②③④⑥⑨⑩ | Single perforation | |
| 10 | Al-Darzi et al. [35] | Through-rebars, concrete tenon, end bearing of the steel plate | ①②③④⑤⑥ | Single perforation | |
| 11 | Yang et al. [36] | Through-rebars, concrete tenon, end bearing of the steel plate | ①②③④⑤⑥ | Single perforation | |
| 12 | Hosain et al. [37] | Through-rebars, concrete tenon, side friction of the steel plate | ①②③④⑤⑥⑦ | Multiple perforations |
| Specimen ID | Measured Value | Eurocode 4 [26] | Leonhardt et al. [27] | Hosaka et al. [28] | Nishiumi et al. [29] | Oguejiofor et al. [30] | Zong et al. [31] | JTG D64-2015 [32] | Hu et al. [33] | Xiao et al. [34] | Al-Darzi et al. [35] | Yang et al. [36] | Hosain et al. [37] |
|---|---|---|---|---|---|---|---|---|---|---|---|---|---|
| BPC02A | 55.23 | 89.69 | 125.21 | 249.22 | 100.49 | 161.14 | 272.02 | 260.22 | 268.28 | 104.51 | 277.20 | 307.45 | 192.60 |
| Measured value/calculate value | - | 0.61 | 0.44 | 0.22 | 0.55 | 0.34 | 0.20 | 0.21 | 0.20 | 0.53 | 0.20 | 0.18 | 0.29 |
| BPC04A | 55.05 | 89.69 | 125.21 | 249.22 | 100.49 | 181.28 | 272.02 | 260.22 | 268.28 | 118.17 | 280.61 | 330.51 | 192.60 |
| Measured value/calculate value | - | 0.61 | 0.43 | 0.22 | 0.54 | 0.30 | 0.20 | 0.21 | 0.20 | 0.46 | 0.19 | 0.16 | 0.28 |
| BPC04P | 65.15 | 61.07 | 79.36 | 220.64 | 63.69 | 160.22 | 225.31 | 232.63 | 266.79 | 113.21 | 274.33 | 319.82 | 183.74 |
| Measured value/calculate value | - | 1.06 | 0.82 | 0.29 | 1.02 | 0.40 | 0.29 | 0.28 | 0.24 | 0.57 | 0.24 | 0.20 | 0.35 |
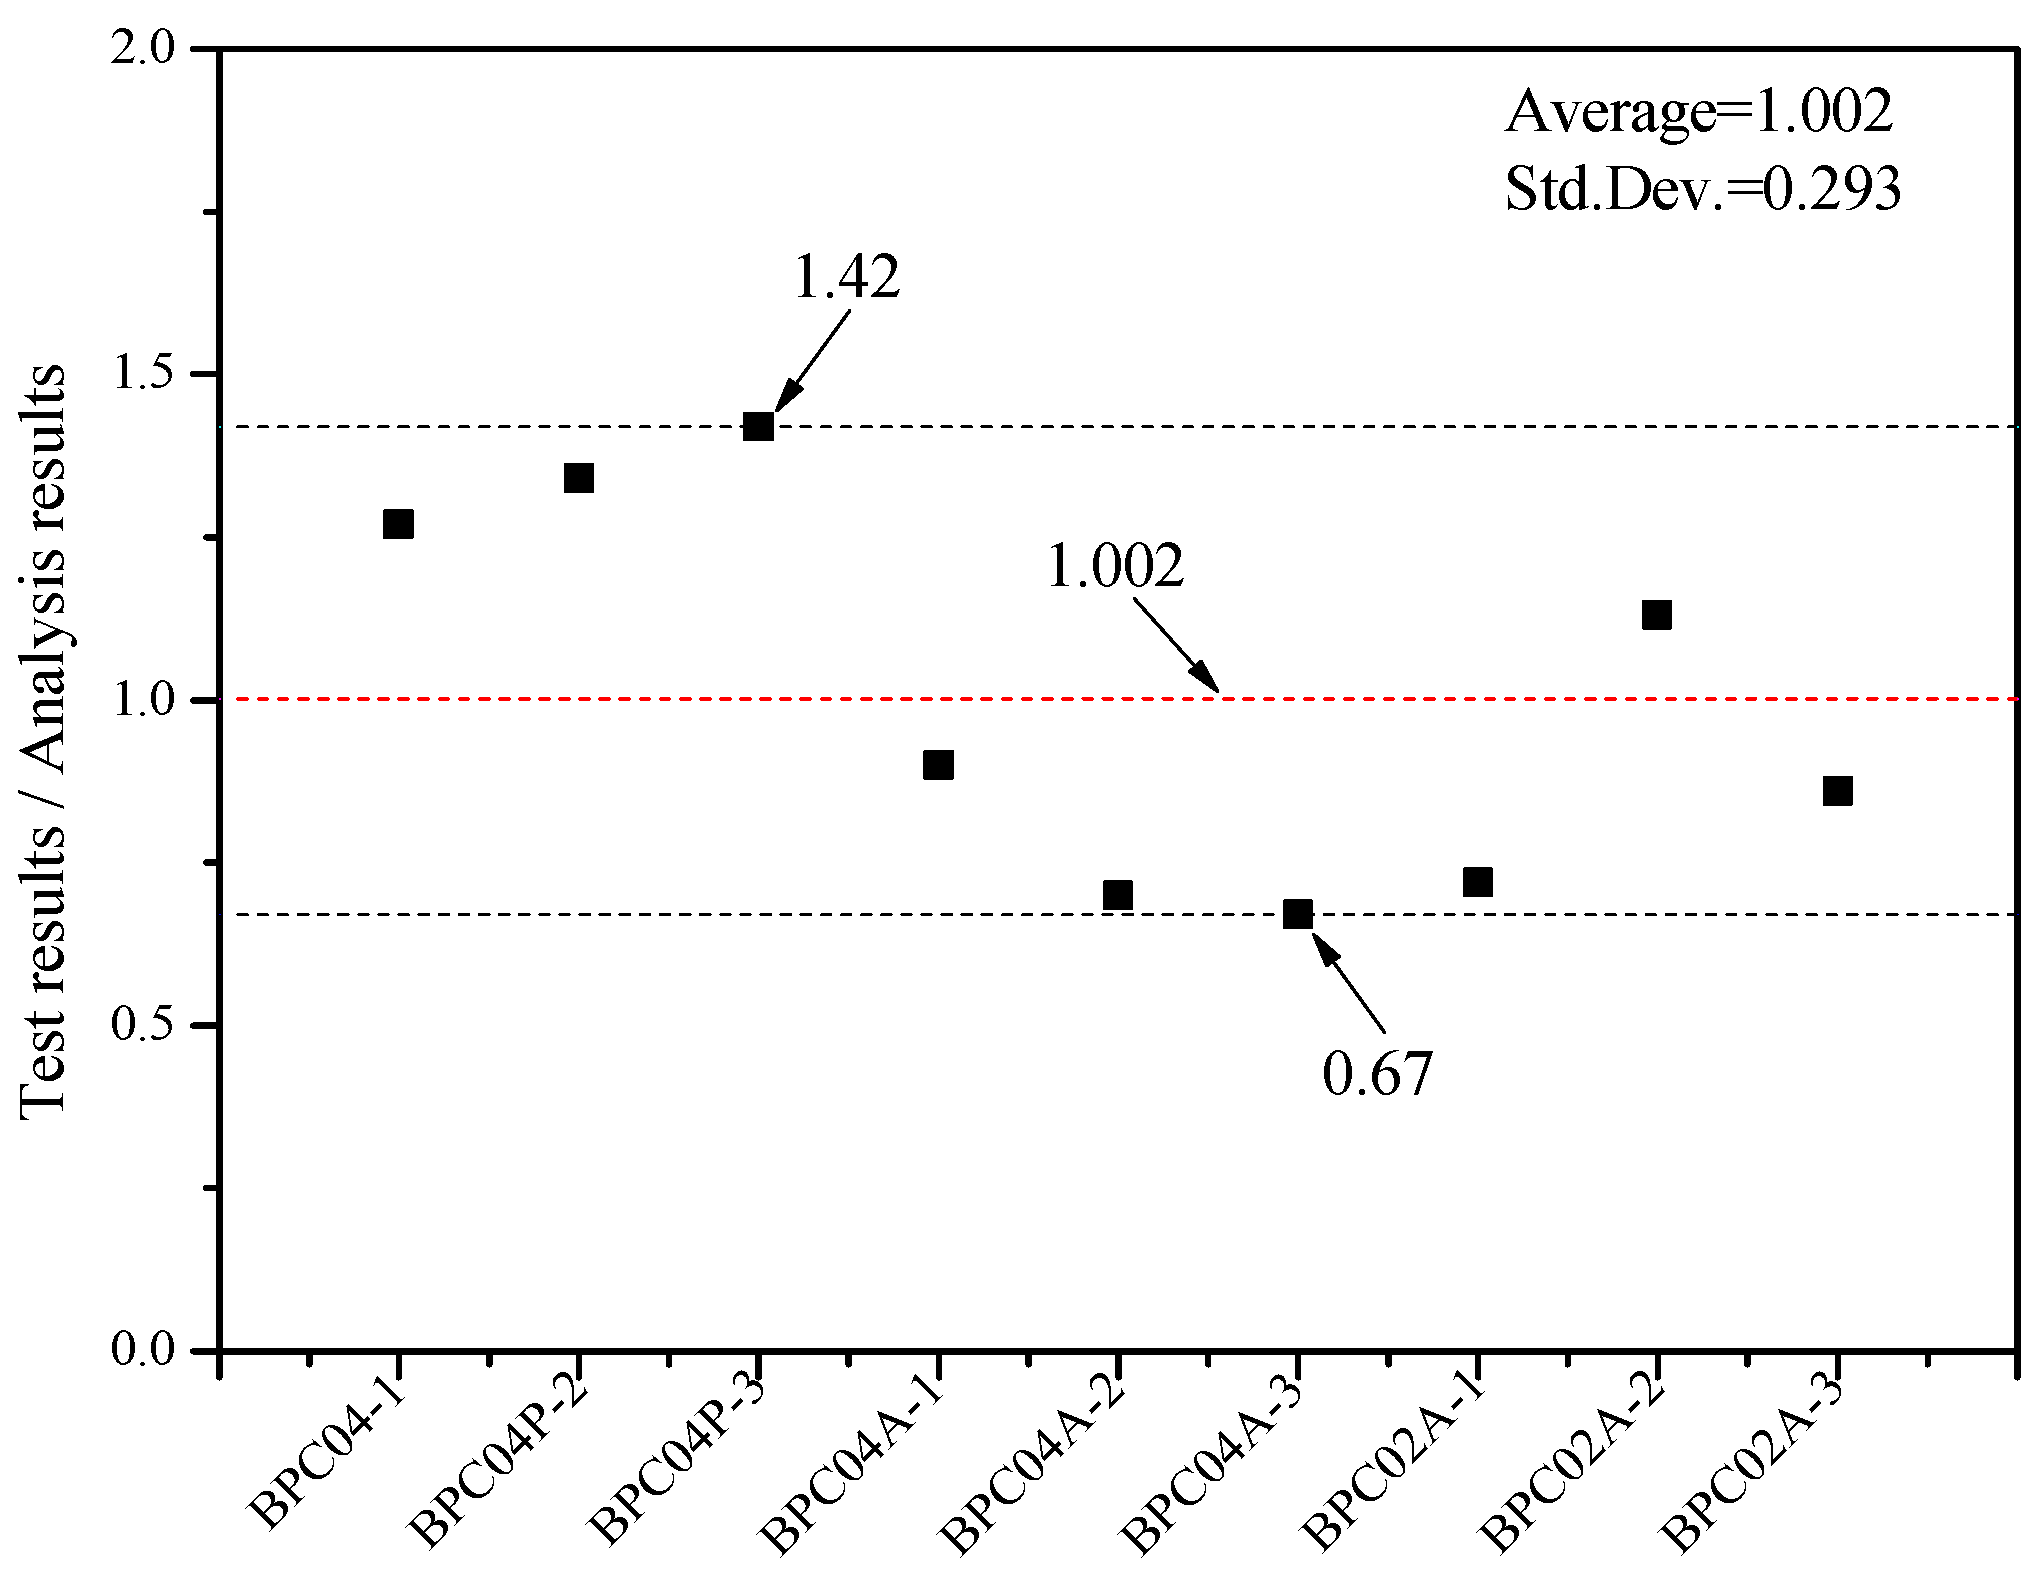
| Specimen ID | Measured Value (MPa) | Calculated Value (MPa) | Measured Value/Calculate Value |
|---|---|---|---|
| BPC04P-1 | 61.44 | 48.24 | 1.27 |
| BPC04P-2 | 64.75 | 48.24 | 1.34 |
| BPC04P-3 | 68.42 | 48.24 | 1.42 |
| BPC04A-1 | 64.76 | 71.92 | 0.90 |
| BPC04A-2 | 50.21 | 71.92 | 0.70 |
| BPC04A-3 | 48.34 | 71.92 | 0.67 |
| BPC02A-1 | 43.92 | 60.69 | 0.72 |
| BPC02A-2 | 68.58 | 60.69 | 1.13 |
| BPC02A-3 | 52.36 | 60.69 | 0.86 |
| AVE | / | / | 1.002 |
| SD | / | / | 0.293 |
| COV | / | / | 0.292 |
| Reference | Specimen ID | t (mm) | h (mm) | fc (MPa) | H (mm) | n | D (mm) | D (mm) | fy (MPa) | Measured Value (MPa) | Calculated Value (MPa) | Measured Value/Calculate Value |
|---|---|---|---|---|---|---|---|---|---|---|---|---|
| This work | BPC04P-1 | 4 | 40 | 35.47 | 100 | 2 | 25 | 12 | 534.88 | 61.44 | 48.24 | 1.27 |
| BPC04P-2 | 4 | 40 | 35.47 | 100 | 2 | 25 | 12 | 534.88 | 64.75 | 48.24 | 1.34 | |
| BPC04P-3 | 4 | 40 | 35.47 | 100 | 2 | 25 | 12 | 534.88 | 68.42 | 48.24 | 1.42 | |
| BPC04A-1 | 4 | 40 | 55.96 | 100 | 2 | 25 | 12 | 534.88 | 64.76 | 71.92 | 0.90 | |
| BPC04A-2 | 4 | 40 | 55.96 | 100 | 2 | 25 | 12 | 534.88 | 50.21 | 71.92 | 0.70 | |
| BPC04A-3 | 4 | 40 | 55.96 | 100 | 2 | 25 | 12 | 534.88 | 48.34 | 71.92 | 0.67 | |
| BPC02A-1 | 2 | 40 | 55.96 | 100 | 2 | 25 | 12 | 534.88 | 43.92 | 60.69 | 0.72 | |
| BPC02A-2 | 2 | 40 | 55.96 | 100 | 2 | 25 | 12 | 534.88 | 68.58 | 60.69 | 1.13 | |
| BPC02A-3 | 2 | 40 | 55.96 | 100 | 2 | 25 | 12 | 534.88 | 52.36 | 60.69 | 0.86 | |
| Wang [3] | P1 | 2 | 40 | 35.6 | 100 | 2 | 25 | 0 | 0 | 36.63 | 33.99 | 1.08 |
| P2 | 2 | 40 | 35.6 | 100 | 2 | 25 | 0 | 0 | 40.91 | 33.99 | 1.20 | |
| P3 | 2 | 40 | 35.6 | 100 | 2 | 25 | 0 | 0 | 34.75 | 33.99 | 1.02 | |
| Chen [10] | B502000 | 2 | 40 | 34.7 | 100 | 2 | 20 | 0 | 0 | 32.66 | 29.21 | 1.12 |
| B502008 | 2 | 40 | 34.7 | 100 | 2 | 20 | 8 | 618.13 | 37.48 | 32.94 | 1.14 | |
| B502012 | 2 | 40 | 34.7 | 100 | 2 | 20 | 12 | 593.05 | 34.46 | 37.25 | 0.93 | |
| B502016 | 2 | 40 | 34.7 | 100 | 2 | 20 | 16 | 615.45 | 36.96 | 44.05 | 0.84 | |
| B503000 | 2 | 40 | 34.7 | 100 | 2 | 30 | 0 | 0 | 35.44 | 37.93 | 0.93 | |
| B503008 | 2 | 40 | 34.7 | 100 | 2 | 30 | 8 | 618.13 | 33.81 | 41.65 | 0.81 | |
| B503012 | 2 | 40 | 34.7 | 100 | 2 | 30 | 12 | 593.05 | 33.34 | 45.97 | 0.73 | |
| B503016 | 2 | 40 | 34.7 | 100 | 2 | 30 | 16 | 615.45 | 38.46 | 52.77 | 0.73 |
Disclaimer/Publisher’s Note: The statements, opinions and data contained in all publications are solely those of the individual author(s) and contributor(s) and not of MDPI and/or the editor(s). MDPI and/or the editor(s) disclaim responsibility for any injury to people or property resulting from any ideas, methods, instructions or products referred to in the content. |
© 2025 by the authors. Licensee MDPI, Basel, Switzerland. This article is an open access article distributed under the terms and conditions of the Creative Commons Attribution (CC BY) license (https://creativecommons.org/licenses/by/4.0/).
Share and Cite
Chen, L.; Wang, Z.; Liu, H. Shear Performance of Assembled Bamboo–Concrete Composite Structures Featuring Perforated Steel Plate Connectors. Buildings 2025, 15, 1376. https://doi.org/10.3390/buildings15081376
Chen L, Wang Z, Liu H. Shear Performance of Assembled Bamboo–Concrete Composite Structures Featuring Perforated Steel Plate Connectors. Buildings. 2025; 15(8):1376. https://doi.org/10.3390/buildings15081376
Chicago/Turabian StyleChen, Lingling, Zhiyuan Wang, and Huihui Liu. 2025. "Shear Performance of Assembled Bamboo–Concrete Composite Structures Featuring Perforated Steel Plate Connectors" Buildings 15, no. 8: 1376. https://doi.org/10.3390/buildings15081376
APA StyleChen, L., Wang, Z., & Liu, H. (2025). Shear Performance of Assembled Bamboo–Concrete Composite Structures Featuring Perforated Steel Plate Connectors. Buildings, 15(8), 1376. https://doi.org/10.3390/buildings15081376