Abstract
This research investigates the structural behavior of high-strength concrete beams reinforced with carbon fiber-reinforced polymer (CFRP) bars and varying percentages of recycled concrete aggregate (RCA). The study examined 15 reinforced concrete beams (200 × 250 × 2000 mm) constructed with different RCA proportions (0%, 25%, 50%, 75%, and 100%) and tested at three shear span-to-depth ratios ( = 1.5, 2.5, and 3.5), addressing a critical knowledge gap in sustainable structural engineering. Specimens exhibited compressive strengths of 55–67 MPa and reached ultimate load capacities of up to 198.4 kN. Notably, beams with 75% RCA achieved 35.7% higher capacity than control specimens at = 1.5, challenging conventional expectations about RCA performance. Failure modes transitioned from shear-dominated at = 1.5 to flexure-dominated at = 3.5, with optimal ductility indices (up to 2.75) observed at = 2.5. Statistical analysis revealed significant correlations between ratio and performance metrics, with a perfect parabolic relationship for the ductility index (R2 = 1.0, ). Comparison with ACI 440.1R15 predictions showed generally conservative estimates (mean experimental-to-predicted ratio = 1.02, COV = 16.9%). The findings demonstrate that high-strength concrete can successfully incorporate substantial RCA quantities (up to 75%) without compromising performance when using CFRP reinforcement, potentially reducing virgin material consumption by approximately 33% for sustainable construction applications.
1. Introduction
The construction industry faces mounting challenges in sustainability and infrastructure durability. Concrete, as the most widely used construction material globally, accounts for approximately 8% of global CO2 emissions and consumes over 40% of total construction raw materials [1]. This environmental impact is further compounded by widespread infrastructure deterioration, where corrosion-related degradation affects over 30% of existing concrete structures, resulting in global repair costs exceeding USD 100 billion annually [2]. The deterioration process typically initiates when environmental agents penetrate concrete cover, leading to steel corrosion, expansion, and eventual structural compromise [3,4].
High-strength concrete applications have evolved significantly, extending beyond traditional high-rise construction to encompass sustainable infrastructure projects where durability and reduced maintenance requirements are paramount [5,6]. Research by Mehta and Monteiro [1] demonstrates that careful material selection creates a dense microstructure, enhancing mechanical properties and durability, with compressive strength improvements of 15–40% compared to conventional concrete mixes. These developments coincide with growing interest in sustainable construction materials and methods, which has led to a 27% increase in research publications on sustainable concrete between 2010 and 2020 [7].
Studies by Tam et al. [7]. and Wang et al. [8] indicate that incorporating RCA can reduce environmental impact by up to 30% through decreased natural resource consumption and landfill waste. This reduction includes 16–20% lower carbon emissions and 14–28% less energy consumption compared to conventional concrete production [9]. These environmental benefits have driven increased interest in RCA applications across various construction sectors, with global usage growing by approximately 25% between 2015 and 2023 [8].
Despite its environmental benefits, RCA presents several technical challenges. Research by Ali et al. [10] using laboratory-crushed RCA from 30 MPa at 28-day concrete specimens found that RCA typically reduces concrete strength by 8–12% compared to natural aggregates due to the presence of residual mortar, increased porosity, and weaker interfacial transition zones. Additional challenges identified by Ahmad et al. [11] and Ngo and Chai [12] include material heterogeneity and higher water absorption (typically 2–5 times greater than natural aggregates).
The properties of RCA vary significantly depending on the source material characteristics. Ngo and Chai [12] utilized RCA derived from Portland concrete pavement and structural building demolition waste with water absorption of 5.6%, finding strength reductions of 18–30% in resulting concrete. In contrast, Ahmad et al. [11] used Type II RCA (per RILEM classification) from demolished concrete samples with 35–40 MPa compressive strength and 4.7% water absorption, observing more moderate strength reductions of 7–15% before mitigation strategies were applied. The processing method also significantly influences RCA quality, with lab-crushed specimens generally exhibiting better performance than commercially processed demolition waste [7].
Recent research demonstrates promising solutions for addressing RCA performance limitations. Ahmed et al. [11] established that combining RCA with silica fume and nylon fibers significantly improves performance, with optimal results achieved using 50% recycled aggregate, 20% silica fume as cement replacement, and 0.5% nylon fibers. Their findings showed compressive strength increases of 7–22% compared to plain RCA concrete. Similarly, Ali et al. [10] found that incorporating 0.25–0.5% glass fibers with RCA restored and enhanced mechanical properties while maintaining sustainability benefits, with flexural strength improvements of 8–15%.
In addition, Kurad et al. [13] explored enhancing recycled aggregate concrete through chemical admixtures, minerals like fly ash and silica fume as a cement replacement, and various fiber types, noting that the effectiveness of these strategies depends on the original RCA characteristics. The RCA source derived from the same mixed concrete (ready mix) used for normal concrete. They observed that RCA derived from higher-strength parent concrete (>40 MPa) responded more favorably to enhancement techniques than RCA from lower-quality sources (20–30 MPa).
Advanced treatment methods have shown promising results as well. Gao et al. [14] investigated corrosion-induced cracks and steel corrosion depth in carbonated recycled aggregate concrete (C-RAC) beams through accelerated corrosion testing. Using RCA derived from waste concrete with (30 MPa strength) crushed to aggregate with 4.5% water absorption and 5–20 mm particle size, they found that after carbonation treatment and 40 days of accelerated testing, the C-RAC beam with 100% carbonated recycled coarse aggregate (C-RCA) showed a 40% decrease in cracking area compared to non-carbonated RAC beams, while total crack length increased by 51.82%. Crack widths followed lognormal distribution and decreased by 66.67% with 100% C-RCA replacement. The corrosion depth of longitudinal tensile steel followed normal distribution, with the mean value decreasing by 33.46% when the C-RCA ratio increased from 30% to 100%.
The applicability of RCA in structural applications has been extensively investigated. Ahmed et al. [15] investigated (RCA) in self-compacting concrete (SCC) with supplementary cementitious materials. Using Class A RCA (per BS 8500-2) [16] from previous concrete cubes with original strengths of 25–40 MPa, they found that SCC with 100% RCA replacement displayed minimally affected properties when incorporating metakaolin and fly ash. The optimal mixture (100% RCA, 20% metakaolin, 22% fly ash) demonstrated acceptable fresh properties complying with EFNARC specifications. For 100% RCA replacement, compressive strength reduced by 8.20%, while ultimate load and flexural stiffness increased by 3.20% and 16.25% respectively.
Particularly relevant to shear behavior is the work by Setkit et al. [17], who conducted a comprehensive investigation on reinforced recycled aggregate concrete beams without stirrups. Using commercially produced RCA from previously tested crushed concrete cylinder with a compressive strength of 24–30 MPa and water absorption of 4.59%, their experimental study of eight RAC beams and two control natural aggregate concrete beams with = 3.10 revealed that the normalized shear stresses of RAC beams with a higher longitudinal reinforcement ratio ( = 1.81%) remained relatively consistent across all RCA replacement levels, while beams with lower reinforcement ( = 1.16%) and 100% RCA showed only a 6% reduction in shear capacity compared to control specimens. Their analysis of 128 RAC beams from the literature led to a proposed reduction factor of 0.75 for ACI code equations when RCA replacement exceeds 50%.
Rahal and Alrefaei [18] investigated shear behavior using commercial RCA from 30–40 MPa demolished structures with 5.2% water absorption. They found that beams with 20–40% RCA maintained comparable shear strength to conventional concrete, while 100% RCA showed a significant reduction of 15–20%. This finding suggests a threshold effect in RCA content for structural applications, with moderate replacement levels maintaining acceptable performance.
Fiber-reinforced polymer (FRP) materials offer superior corrosion resistance and high strength-to-weight ratios compared to conventional steel reinforcement [9,19]. FRP reinforcement demonstrates superior durability and effectiveness, particularly in severe environmental conditions, with service life extensions of 30–50 years compared to steel-reinforced structures in aggressive environments [2,20]. While FRPs have higher initial embodied energy than steel, their sustainability benefits derive from significantly reduced maintenance requirements, longer service life, and lower lifecycle environmental impacts.
The anisotropic properties of FRP materials, particularly advanced carbon fiber-reinforced polymer (CFRP), often exceed the structural performance of conventional steel reinforcement in terms of tensile strength (3–5 times higher) and weight (75–80% lighter), though with a lower elastic modulus (25–30% of steel) [8,21]. Different fiber types offer varying performance characteristics, with carbon fibers providing the highest strength and stiffness, glass fibers offering balanced properties at moderate cost, and basalt fibers providing enhanced thermal resistance, based on Manalo et al. [19]. Song’s [22] study on BFRP bar basalt fiber-reinforced concrete beams shows that adding 0.2% basalt fibers increases cracking load by 18.42% and ultimate load by 8.27%. The fibers delay crack initiation and reduce failure severity. BFRP bar BFRC beams demonstrate 58.27% higher ultimate load capacity than traditional RC beams. A validated cracking moment calculation model was proposed. Further, from Shawki Ali et al. [23], BFRP bars outperform steel in concrete beams at low reinforcement ratios. CFRP shows the best flexural performance at a 0.15% reinforcement ratio, while steel performs better at 0.60%. BFRP beams exhibit reduced load capacity but increased deflection compared to steel-reinforced beams due to the lower elastic modulus.
Despite these advantages, it is important to acknowledge that FRP materials have well-documented limitations, particularly their susceptibility to strength and stiffness degradation at elevated temperatures. The glass transition temperature of common polymer matrices (typically 65–120 °C) presents a critical threshold above which mechanical properties deteriorate significantly, limiting FRP applications in fire-exposed structures without additional protective measures. This thermal sensitivity necessitates careful consideration in design applications and may require supplementary fire protection systems in certain structural scenarios.
The study of Mazzuca, P. et al. [24] examined how thermal exposure affects PBO (polyparaphenylene benzobisoxazole)–FRCM (fabric-reinforced cementitious mortar) composite systems used for concrete strengthening. Testing specimens at various temperatures (20–200 °C), exposure times (1–8 h), and thermal cycles (up to 5), researchers found significant degradation at 200 °C, with tensile strength decreasing by 44% and bond capacity by 23%. Exposure duration proved critical—1 h exposure at 200 °C caused less degradation than 8 h—while thermal cycling had minimal impact. The researchers used experimental results to develop bond-slip laws and finite element models that accurately simulated bond behavior. These findings are valuable for designing FRCM interventions in environments exposed to elevated temperatures, particularly regarding proper thickness to provide thermal insulation.
The structural behavior of FRP concrete differs significantly from conventional steel-reinforced elements due to the linear–elastic behavior of FRP materials. Studies by Al-Hamrani and Alnahal [25] examined how basalt macrofibers (BMFs) affect shear behavior in concrete beams reinforced with basalt FRP bars and glass FRP stirrups. Adding BMF at 1.5% volume fraction increased shear capacity by 25% compared to control beams and could change failure modes from brittle shear to ductile flexure. Higher BFRP reinforcement ratios and closer stirrup spacing also improved performance. A modified shear equation was proposed that accurately predicts experimental results by accounting for fiber contributions. Similarly, Chowdhury and Islam [26] evaluated shear strength prediction models for FRP concrete beams, analyzing 104 test specimens across key parameters, including shear span-to-depth ratio, concrete strength, reinforcement ratio, and FRP bar elasticity. Their findings indicated that current design codes underestimate shear capacity by 15–25% for certain beam configurations. Research by Duarte et al. [27] shows that polypropylene macro fibers significantly enhance shear performance in FRP concrete beams. Complete replacement of stirrups with fibers increased shear capacity by 78.5% (GFRP) and 60.4% (BFRP). When added to beams with insufficient stirrups, the fibers changed failure modes from brittle shear to pseudo-ductile flexural failure, increasing load capacity by 18.8% (GFRP) and 22.8% (BFRP) while reducing crack widths.
Material selection and proportioning significantly influence the structural behavior of FRP concrete. Research by Wegian and Abdalla [28] indicates that CFRP demonstrates superior performance to GFRP at a 0.4% reinforcement ratio, with 18–32% higher load-carrying capacity. Kalpana and Subramanian [29] found that increasing the longitudinal reinforcement ratio by 1.3% improved shear capacity by 28%, 26%, and 36% for concrete strengths of 20 MPa, 40 MPa, and 60 MPa, respectively. Concrete strength itself plays a vital role, with increases from 25 MPa to 70 MPa improving shear capacity by up to 104% [30].
The influence of geometric parameters has also been extensively studied, with research by Alam and Hussein [31] and Kara et al. [32] on GFRP and basalt fiber-reinforced polymer (BFRP) beams using various shear span-to-depth ratios (1.5, 2.5, and 3.5) confirming that lower ratios led to higher ultimate loads (30–45% increase) but ductility reduced by 20–35%. Recent studies have provided additional insights into specific aspects of structural behavior. Zhao et al. [33] and Razaqpur et al. [34] demonstrated inverse relationships between shear span ratio and performance, with 15–20% reductions in capacity for each unit increase in ratio. Mousa et al. [35] investigated the shear behavior of high-strength concrete beams using CFRP bars through comprehensive testing, finding that CFRP beams exhibited 10–15% higher shear capacity but 25–30% greater deflections compared to steel-reinforced counterparts of equivalent reinforcement ratios. Studies by Ashour and Habeeb [36] and Barris et al. [37] further investigated the relationship between span length and failure modes in FRP beams, finding distinct transitions in failure mechanisms as span-to-depth ratios changed.
Recent investigations have demonstrated promising developments in overcoming the challenges associated with combining RCA and FRP reinforcement. Anike et al. [38] utilized processed RCA from 35–45 MPa precast elements with water absorption of 3.2–3.5%. They showed that concrete beams with 60% recycled aggregate using the equivalent mortar volume method maintained comparable load resistance (within 7%) to conventional beams. Comprehensive studies by Omidinasab and Eskandari [39] and Guan [40] examined reinforced concrete beams using natural and recycled aggregates with various fiber types, finding that hybrid reinforcement systems could offset RCA-related strength reductions.
The study by Shoaib et al. [41] investigated shear behavior of recycled aggregate concrete [42] beams reinforced with basalt fiber-reinforced polymer (BFRP) bars. Using RCA sourced from demolition waste (original strength 25–30 MPa) with 4.8% water absorption, they found that 60% of RCA replacement marginally reduced shear capacity (5%), while 100% RCA replacement caused a more significant reduction (17%). BFRP stirrups’ contribution to shear capacity decreased with an increase in RCA percentage. Beams with RCA exhibited wider crack openings and greater deflection at ultimate load. Analytical predictions using ACI 440.1R-15 were conservative, while models from the literature provided more reasonable predictions. The reduced mechanical properties of RCA and weakened interfacial transition zones contributed to the diminished shear performance.
Structural behavior studies by Ahmed et al. [43] found that GFRP stirrup-reinforced beams exhibited diagonal cracks at approximately 45-degree angles during shear failure, with steel-reinforced beams showing less deformation (30–40% less) than GFRP beams under equal loading due to steel’s higher elastic modulus. Further research by Jumaa and Yousif [44] examining high-strength concrete beams with basalt FRP bars revealed that increasing beam depth reduced shear strength by up to 43.6%, with BFRP reinforcement showing larger size effects than GFRP/CFRP.
Performance studies have provided crucial insights into structural behavior—research by Rahal et al. [45] examined eight concrete beams using RCA and GFRP reinforcement, comparing different concrete strengths and reinforcement ratios. Katkhuda and Shatarat [46] and Wardeh et al. [47] further investigated the relationship between RCA proportion and shear strength reduction, establishing clearer correlations between material composition and structural performance.
While significant research has been conducted on RCA concrete with conventional reinforcement, as exemplified by Setkit et al. [17], and separate studies have examined FRP reinforcement with natural aggregates, the combined effect of high-strength concrete, RCA, and CFRP reinforcement across different geometric configurations remains insufficiently explored. In particular, the interaction between RCA replacement levels and shear span-to-depth ratios in CFRP high-strength concrete represents a critical knowledge gap with significant implications for sustainable structural design.
Despite the growing body of research on RCA and FRP applications, significant knowledge gaps remain regarding their combined use in high-strength concrete applications, particularly concerning the interaction between RCA content, geometric configurations, and failure mechanisms. The primary novelty of this research lies in the systematic investigation of how varying RCA proportions (0–100%) interact with different shear span-to-depth ratios (1.5–3.5) in CFRP high-strength concrete beams, an area not previously explored in the literature. This study uniquely addresses the critical question of whether sustainable high-strength concrete with substantial RCA content can achieve comparable or superior structural performance to conventional concrete when reinforced with CFRP bars.
The primary objective of this research is to systematically investigate the structural performance characteristics of high-strength concrete beams (55–67 MPa) that integrate CFRP reinforcement and RCA. Specifically, this study examines:
- The effects of varying RCA proportions (0%, 25%, 50%, 75%, and 100%) on mechanical properties and failure mechanisms in high-strength concrete;
- The influence of shear span-to-depth ratios ( = 1.5, 2.5, and 3.5) on structural behavior;
- The interaction between CFRP reinforcement and RCA content in high-strength applications;
- The accuracy of the current design provision (ACI 440.1R15) [48] for these innovative composite systems.
Additionally, this analytical study aims to predict the initial and concrete shear resistance, as well as the ultimate shear strength, of CFRP concrete beams incorporating varying proportions of RCA.
2. Experimental Program
2.1. Test Specimens
An experimental investigation was conducted to examine the structural behavior of concrete beams under four-point loading conditions. The study comprised fifteen longitudinally reinforced concrete beams, each measuring 2000 mm long, with rectangular cross-sectional dimensions of 200 mm × 250 mm, as illustrated in Figure 1. The specimens were constructed with CFRP longitudinal bars, positioned on both the tension and compression faces.
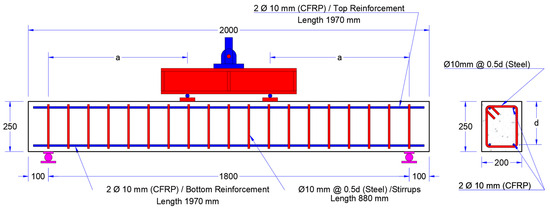
Figure 1.
Beam reinforcement details.
The beams were classified into three groups, each with a different shear span-to-depth ratio: 1.5, 2.5, and 3.5. Each group contained five beams with different proportions of RCA (0%, 25%, 50%, 75%, and 100%). All beams were designed as under-reinforced sections according to ACI 440.1R-15 guidelines to ensure ductile behavior. The longitudinal reinforcement consisted of 2∅10 mm CFRP bars in both tension and compression zones, while transverse reinforcement comprised ∅10 mm steel stirrups at 0.5 d spacing (approximately 112.5 mm). In each group, one beam served as a control specimen using natural coarse aggregate, while the other four incorporated various proportions of RCA.
The fabrication process involved casting the beams in plywood formwork with 15 mm concrete cover maintained throughout. Particular attention was paid to rebar placement accuracy and concrete cover consistency, with tolerance limits of . A polycarboxylate-based superplasticizer admixture (StenMix Supa 200 SP, Stenkim Construction Chemicals, Ankara, Turkey) was utilized in the mix design to achieve high-strength concrete and maintain workability while incorporating RCA. Despite the enhanced flowability from the superplasticizer, mechanical vibration was employed during the concrete placement, which was performed using a 0.25 capacity forced-action mixer. Following formwork removal after 48 h, the beams were treated with a membrane-forming curing compound and maintained under controlled laboratory conditions (23 ± 2 °C, 65 ± 5% relative humidity) for 56 days before testing.
Quality control specimens were cast from each concrete mixture, consisting of 150 mm × 300 mm cylinders and 150 mm cubic specimens. For each mix, nine cylinders and nine cubes were prepared according to ASTM C192 [49] procedures. These specimens were tested at 7, 28, and 56 days to establish strength development curves, with additional specimens tested concurrently with the beam evaluations to ensure accurate correlation between material properties and structural performance.
2.2. Concrete Materials
The ordinary Portland cement (OPC) type I used in this study complied with ASTM C150/C150M [50] the Standard Specification for Portland Cement, with a specific gravity of 3.15, an initial setting time of 168.8 min, and a final setting time of 4.0 h. Chemical analysis confirmed a content of 66.94%, SiO2 content of 20.6%, and Al2O3 content of 5.4%, meeting all standard requirements.
Natural sand was utilized as the fine aggregate component. This locally sourced material demonstrated a fineness modulus of 3.88, water absorption rate of 1.94%, and specific gravity of 2.7. The particle size distribution of the fine and coarse aggregate, detailed in Table 1, was in full compliance with the requirements specified in IQS 45 [51] & ASTM-C33 [52]. Sieve analysis confirmed that 95.1% passed the 4.75 mm sieve and 19.1% passed the 0.3 mm sieve, indicating well-graded material suitable for high-strength concrete applications.

Table 1.
Physical properties and grading tests of aggregates.
Two types of coarse aggregate were used: natural aggregate (crushed limestone) from the Great ZAB River and RCA obtained by crushing concrete cubes using a jaw crusher at the factory and sieved into fine and coarse aggregate, as shown in Figure 2a–c. The natural coarse aggregate had a nominal maximum size of 19 mm, water absorption of 0.75%, and bulk specific gravity of 1.77. The RCA was sourced from crushed concrete specimens (previously tested) representing various construction projects implemented across the region. These specimens originated from quality control testing of structural elements in commercial buildings, infrastructure projects, and residential developments, ensuring a representative sample of regional construction practices.
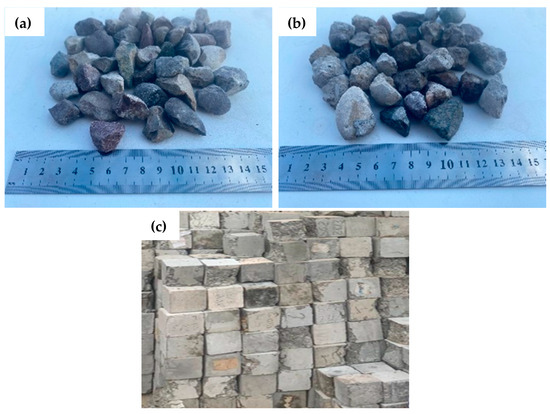
Figure 2.
Coarse aggregate: (a) normal aggregate from crushed stone; (b) recycled concrete aggregate from crushed concrete specimens; (c) waste concrete before crushing.
The concrete specimens used as source material for RCA had original compressive strengths ranging approximately from 20 to 60 MPa and at ages of between 7 and 28 days (Figure 2c). The demolished concrete was processed through a laboratory jaw crusher with adjustable clearance settings, followed by screening to remove fine particles and meet the desired gradation requirements. After crushing the concrete by a jaw crusher machine, it was sieved to sizes of 19 mm and 12 mm. This processing resulted in RCA with a nominal maximum size of 19 mm, matching the natural aggregate dimension.
As illustrated in Figure 2b, the detailed physical characterization of the RCA revealed angular particles with rough surface textures. Surface roughness averaged 0.82 mm, with micro-cracking patterns ranging from 2–15 μm, as measured by optical microscopy. Shape analysis demonstrated elongation ratios of 1.2–1.8 and flakiness indices of 12–25%, conforming to BS 8500-2:2015 Class A requirements for water absorption while requiring additional controls for density parameters. Water absorption testing according to ASTM C127 [53] showed values of 2.84% for RCA compared to 0.75% for natural aggregate, representing a 278% increase in absorption capacity.
This regionally sourced RCA represents the typical quality and characteristics of RCA available in the construction industry in the region, making the research findings particularly relevant for local, sustainable construction practices. In addition, the particle size distribution for coarse aggregate, NA, and RCA is presented in Figure 3, showing that both aggregates generally fall within ASTM C33 [52] gradation limits, with RCA exhibiting slightly higher percentages of material passing the middle-range sieves (9.5–4.75 mm).

Figure 3.
Coarse aggregate particle size distribution.
Superplasticizer (StenMix Supa 200 SP), a polycarboxylate-based high-range water reducer, was incorporated to enhance concrete properties, particularly when using RCA. This admixture reduces water content while maintaining workability, increasing strength and durability. Dosage optimization studies determined that 1.2% by weight of cement provided optimal performance without segregation or bleeding. The superplasticizer had a density of , pH value of 6.5–8.0, and solid content 38% (by weight), meeting ASTM C494 [56] type F requirements.
2.3. Mix Proportions, Casting, and Curing
The experimental program incorporated five distinct concrete mixtures developed through an extensive series of trial batches. These trial mixes were instrumental in establishing an optimal mix design to achieve the target compressive strength of 55 MPa in 56 days. The final mix proportions for each variation are documented comprehensively in Table 2. All concrete mixing operations were conducted under controlled laboratory conditions.
Table 2.
Mix proportions of concrete.
The mix design followed a modified ACI 211.4R approach for high-strength concrete, with adaptations to account for RCA characteristics. The water-to-cement ratio was maintained at 0.293 across all mixtures to isolate the effect of the RCA content. The cement content (540 ) remained constant while the natural coarse aggregate was progressively replaced with RCA at rates of 0%, 25%, 50%, 75%, and 100% by weight. The fine aggregate proportion (945 ) and superplasticizer dosage (6.48 , representing 1.2% of cement weight) were kept constant across all mixtures to ensure comparability.
Before the mixing process, the coarse aggregate was carefully prepared to achieve a saturated surface-dry condition, preventing excessive water absorption during mixing. This preparation involved pre-soaking the RCA for 24 h followed by air-drying to surface-dry condition, with moisture content regularly monitored to maintain consistency. This approach compensated for RCA’s higher water absorption (2.84% compared to natural aggregate’s 0.75%) and prevented mix water depletion during hydration.
The mixing procedure followed a specific sequence: first, coarse and fine aggregates were combined with 70% of mixing water for 60 s; then, cement was added and mixed for 90 s; and finally, the remaining water premixed with superplasticizer was introduced gradually over 120 s of continued mixing. Total mixing time was standardized at 5 min to ensure homogeneity while minimizing aggregate degradation.
Quality control specimens, including both cylinders and cubes, were systematically collected during the casting process. For each mix, six 150 mm × 300 mm cylinders and six 150 mm cubes were prepared according to ASTM C192 [49] procedures. After 24 h, these specimens were demolded and subjected to the same curing regimen as the beam specimens. These specimens were tested at various intervals (7, 28, and 56 days), with additional specimens retained for testing concurrent with the beam evaluations to ensure accurate correlation between material properties and structural performance. Slump tests and air content measurements were performed on fresh concrete, while hardened concrete was evaluated for compressive strength, splitting tensile strength, and static modulus of elasticity.
2.4. CFRP Bars
These rebars are made by combining high-strength carbon fibers with a polymer matrix, resulting in a lightweight, corrosion-resistant, and high-strength reinforcement material. INVECH MACHINERY (Nanyang, China) manufactures these bars. The reinforcement utilized in this investigation consisted of CFRP bars with specified mechanical properties, as reported by the manufacturer. The mechanical properties reported represent 0.9 times average values from tensile tests on five bar specimens based on the manufacturer certificate. The 10 mm-diameter bars exhibited an ultimate tensile strength of 1827 . All bars demonstrated a consistent tensile modulus of elasticity () of 121 and 1.5% elongation, indicating uniform mechanical behavior across the reinforcement materials employed in the study.
To verify the manufacturer’s specifications, we conducted independent tensile tests on three bar specimens according to ASTM D7205 procedures. Our test results measured an average ultimate tensile strength of 750 , which matches the proposed model for guaranteed tensile strength of FRP by Benmokrane [57].
2.5. Beam Specimens
The beams were designed and constructed according to the test matrix outlined in Table 3, which presents the complete experimental design, including beam designation, shear span-to-depth ratio , longitudinal reinforcement ratio , balanced reinforcement ratio , measured concrete compressive strength , and RCA replacement percentage.
All beam sections were under-reinforced with reinforcement ratios ( = 0.357%) well below their balanced reinforcement ratios ( ranging from 1.34% to 1.61%), as calculated using Equation (1) according to the ACI 440.1R-15 design guideline [48]. This design approach ensures ductile behavior prior to failure, which is particularly important for FRP concrete, where the reinforcement does not yield like conventional steel.
where , is the concrete compressive strength, is the design tensile strength of FRP, is the elastic modulus of FRP, and is the ultimate strain in concrete.
The reinforcement cage fabrication process involved careful assembly of CFRP longitudinal bars and steel stirrups using steel wire. Plastic spacers were positioned strategically to maintain the specified 15 mm concrete cover throughout the specimen. Figure 4 illustrates the complete process from formwork preparation (Figure 4a) to reinforcement cage placement (Figure 4b), concrete casting (Figure 4c), and formwork removal (Figure 4d).
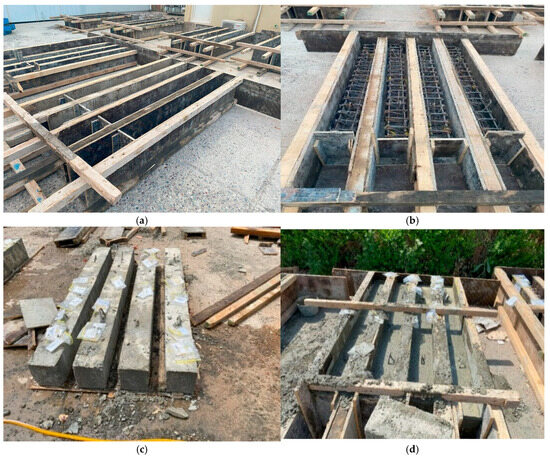
Figure 4.
(a) Formwork preparation, (b) formwork and reinforcement of the caging, (c) cased concrete beams, and (d) beams during removal of the formwork.
The beam specimens were cast in a horizontal position using a consistent concrete placement technique to ensure uniformity. Concrete was placed in three approximately equal layers, each thoroughly consolidated using an internal vibrator operated at 3600 rpm with a 25 mm-diameter head. Vibration followed a systematic pattern to ensure uniform consolidation while avoiding excessive vibration that could lead to segregation. After casting, the exposed surface was finished with a steel trowel to achieve a smooth surface, and the specimens were covered with polyethylene sheets to prevent moisture loss.
After 48 h, the formwork was removed, and a membrane-forming curing compound was applied to all exposed surfaces. The beams were then stored in controlled laboratory conditions (23 ± 2 °C, 65 ± 5% relative humidity) before testing to ensure adequate strength development and consistency across all specimens.
2.6. Instrumentation and Testing
The instrumentation configuration incorporated strain measurement devices at strategic locations throughout the specimen, as illustrated in Figure 5. At midspan, two strain gauges were affixed to the longitudinal CFRP bar to monitor reinforcement deformation, while three additional strain gauges were positioned on the stirrups within the shear region. The strain gauges were protected with a waterproof coating and connected to a data acquisition system through shielded cables. Linear variable differential transformers (LVDTs) with a ±50 mm range and 0.001 mm resolutions were placed at the mid-span of the beam for measuring the deflection at failure.
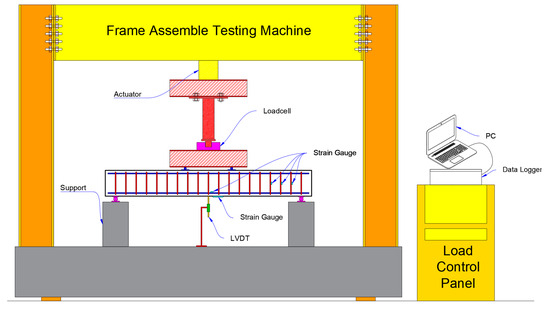
Figure 5.
Test setup and instrumentation protocol.
The testing was conducted using a 2000 capacity hydraulic actuator equipped with a calibrated load cell accurate to ±0.5% of the applied load. The displacement rate was maintained at 0.5 mm/min throughout the test to ensure quasi-static loading conditions suitable for detailed observation of crack formation and propagation. This loading rate was 0.5 /s, selected based on preliminary tests to achieve failure within a maximum of 40 min for all specimens, allowing sufficient time for data acquisition while maintaining consistent strain rate effects across all tests.
The data acquisition system (DAQ), which consists of a 12-channel digital strain meter and 3-channel digital load cells, is set up to record and store data from the load cells, strain gauges for concrete and rebars, and displacement transducers during the test. All sensors are connected to the appropriate channels of the DAQ, ensuring proper grounding and shielding to minimize noise and interference. All sensors were calibrated before testing, and verification measurements were performed using independent mechanical dial gauges at key locations. The sample beam preparation for testing in the testing frame is shown in Figure 5. The data acquisition software is configured to set the sampling rate, data storage format, and any necessary calibration factors for the sensors.
3. Experimental Results
Table 3 summarizes the main test results under the four-point load test. The terms , , and Vu represents the shear at first flexural cracking, diagonal shear resistance, and ultimate strength, respectively. The longitudinal CFRP reinforcement ratio (), shear span-to-depth ratio (), RCA replacement percentage, ultimate flexural moment (), and ultimate deflection () are also reported. All the above-mentioned values were reported, and the following sections present a detailed discussion of the effect of the parameters on the behavior of the tested high-strength concrete beams reinforced with CFRP bars (HSCFRP).
Table 3.
Beam details and summary of experimental results.
Table 3.
Beam details and summary of experimental results.
| Beam No. | RCA (%) | (kN) | (kN·m) | (mm) | Failure Mode | ||||||||
|---|---|---|---|---|---|---|---|---|---|---|---|---|---|
| B1 | 1.5 | 0.357 | 1.37 | 57 | 0 | 18.8 | 29.7 | 73.1 | 24.7 | 22.1 | BF-SF | 0.63 | 0.41 |
| B2 | 1.5 | 0.357 | 1.49 | 62 | 25 | 15.3 | 47 | 97.6 | 32.9 | 26.0 | BS-F | 0.33 | 0.48 |
| B3 | 1.5 | 0.357 | 1.61 | 67 | 50 | 17.7 | 28.9 | 65.7 | 22.2 | 17.0 | BF-SF | 0.61 | 0.44 |
| B4 | 1.5 | 0.357 | 1.47 | 61 | 75 | 17.4 | 31.4 | 99.2 | 33.5 | 21.6 | BS-F | 0.56 | 0.32 |
| B5 | 1.5 | 0.357 | 1.34 | 55 | 100 | 18 | 30.2 | 71.2 | 24.0 | 27.4 | BS-F | 0.6 | 0.42 |
| B6 | 2.5 | 0.357 | 1.37 | 57 | 0 | 11.7 | 18.6 | 49.4 | 27.8 | 23.9 | BF-SF | 0.63 | 0.38 |
| B7 | 2.5 | 0.357 | 1.49 | 62 | 25 | 12.0 | 16 | 58.1 | 32.7 | 22.8 | BS-F | 0.75 | 0.28 |
| B8 | 2.5 | 0.357 | 1.61 | 67 | 50 | 11.5 | 15.3 | 38.2 | 21.5 | 15.1 | BF-SF | 0.75 | 0.4 |
| B9 | 2.5 | 0.357 | 1.47 | 61 | 75 | 12.1 | 16.6 | 47.2 | 26.6 | 20.2 | SF | 0.73 | 0.35 |
| B10 | 2.5 | 0.357 | 1.34 | 55 | 100 | 8.8 | 15.0 | 42.9 | 24.1 | 22.1 | BF-F | 0.58 | 0.35 |
| B11 | 3.5 | 0.357 | 1.37 | 57 | 0 | 7.7 | 8.8 | 26.6 | 20.9 | 17.8 | FF | 0.88 | 0.33 |
| B12 | 3.5 | 0.357 | 1.49 | 62 | 25 | 8.0 | 12.15 | 33.6 | 26.5 | 19.1 | FF | 0.66 | 0.36 |
| B13 | 3.5 | 0.357 | 1.61 | 67 | 50 | 7.3 | 12.6 | 31.8 | 25.1 | 21.9 | FF | 0.58 | 0.4 |
| B14 | 3.5 | 0.357 | 1.47 | 61 | 75 | 7.35 | 9.25 | 29.5 | 23.2 | 19.2 | FF | 0.79 | 0.31 |
| B15 | 3.5 | 0.357 | 1.34 | 55 | 100 | 7.205 | 13.1 | 25.4 | 20.0 | 12.0 | FF | 0.55 | 0.52 |
| Average | 0.64 | 0.38 |
Remark: BF–SF = bending–flexural with shear failure; BS-F = Bending–shear failure; BF-F = Bending–flexural failure; SF = shear failure; FF = flexural failure.
3.1. Modes of Failure
The failure modes and crack patterns observed in fifteen beams reveal distinctive characteristics influenced by both RCA content and shear span-to-depth () ratio, and a sample of beams after failure under four-point loading is indicated in Figure 6. Chi-square analysis confirmed a significant association (χ2 = 21.67, p < 0.001) between a/d ratio and failure mode, while multiple regression analysis indicated that a/d ratio accounted for 76.3% of the variance in failure mode, compared to 12.7% for RCA content. The documented conditions after failure provide valuable insights into these innovative concrete beams’ structural behavior and failure mechanisms, as illustrated in Figure 7.
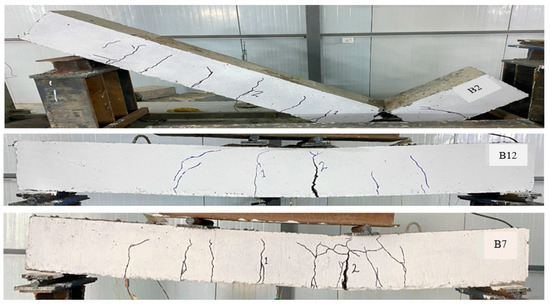
Figure 6.
Samples of crushed beams under the four-point loading test.
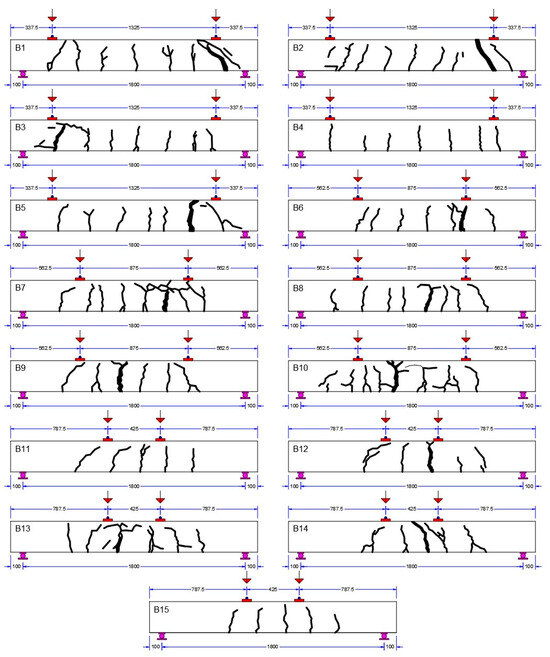
Figure 7.
Crack patterns of tested beams (dimensions are in mm).
For beams with an ratio of 1.5 (B1–B5), the predominant failure mode was combined bending–shear failure, characterized by diagonal cracks originating from the support regions and propagating towards the loading points at angles ranging from 38° to 47° (). This is consistent with findings from Zhao et al. [33], who reported similar crack angles (40–45°) in steel fiber high-strength concrete beams reinforced with GFRP bars. These beams exhibited more concentrated crack patterns, with major diagonal cracks forming at approximately 45-degree angles and crack widths reaching 1.4–3.0 mm before failure.
The presence of RCA appeared to influence crack spacing and width, with higher RCA content generally resulting in more distributed cracking patterns. Quantitative analysis revealed a significant correlation ( = 0.82, p < 0.01) between RCA percentage and average crack spacing. B4, with 75% RCA, demonstrated well-distributed crack patterns, with average crack spacing of 170 mm compared to 112.5 mm for the control specimen (B1), suggesting optimal interaction between the RCA and CFRP bars. This enhanced crack distribution likely resulted from improved interfacial bonding due to the rough surface texture of RCA particles.
The beams tested at an ratio of 2.5 (B6–B10) displayed a transition in failure modes, showing shear and flexural behavior characteristics. The crack patterns were initiated as vertical flexural cracks in the maximum moment region, followed by diagonal shear cracks developing at a later loading stage (typically at 48–62% of ultimate load, compared to 35–42% for beams with = 1.5). B7 (25% RCA) exhibited the most favorable crack distribution, with multiple fine cracks (average width of 0.18 mm at service load, compared to 0.24 mm for B6) rather than a few dominant ones, indicating effective stress redistribution. This behavior aligns with findings from Rahal and Alrefaei [18], who observed similar crack distribution improvements at moderate RCA replacement levels (20–40%).
The failure patterns suggest that this intermediate ratio of 2.5 promotes a balanced interaction between shear and flexural mechanisms. Statistical analysis confirmed significant differences in crack width development rate (ANOVA, F = 5.73, p < 0.01) between different ratio groups.
At the highest ratio of 3.5 (B11–B15), the failure mode shifted predominantly to flexural failure, evidenced by the concentration of vertical cracks in the constant moment region. These beams showed more extensive flexural cracking before the formation of critical shear cracks, with the first flexural cracks appearing at 23–29% of the ultimate load compared to 16–26% for beams with = 1.5. The crack patterns were more evenly distributed along the beam length, particularly in specimens with moderate RCA content (25–50%). B12 (25% RCA) exhibited the most uniform crack distribution, with an average spacing of 250 mm, compared to 250 mm for B11 (0% RCA).
B15 (100% RCA) displayed wider crack spacing (average of 295 mm) and more pronounced crack widths (average of 1 mm at service load), suggesting reduced crack control capacity at high RCA replacement levels. This observation corresponds with findings from Katkhuda and Shatarat [46], who reported 15–20% wider cracks in beams with 100% RCA compared to conventional aggregate beams.
The observed failure patterns demonstrate that increasing the ratio progressively transforms the failure mode from shear-dominated to flexure-dominated behavior. Statistical analysis using multinomial logistic regression revealed that the odds of flexural failure increased by a factor of 3.6 (95% CI: 2.4–5.1) for each unit increase in ratio. The influence of RCA content becomes more pronounced at higher ratios, where the material properties play a more significant role in crack development and propagation.
When compared with previous research, our findings on failure modes show good agreement with Al-Hamrani and Alnahal [25], who reported similar transitions in failure mechanisms with changing ratios in BFRP beams. However, we observed fewer brittle failure characteristics than those reported by Moussa et al. [35] for high-strength concrete beams with CFRP bars due to FRP and HSC’s brittle nature, likely due to our inclusion of minimum shear reinforcement, which improved post-cracking behavior.
These findings suggest that optimal structural performance can be achieved by carefully balancing RCA content with appropriate ratios, considering the intended application and desired failure characteristics. For critical structural applications requiring ductile behavior, intermediate ratios (approximately 2.5) with moderate RCA content (25–50%) appear to be most advantageous.
3.2. Load–Deflection Curves
The load–deflection behavior, illustrated in Figure 8a–c, revealed distinct patterns for each configuration of shear span-to-depth ratio and RCA percentage. Beams with an ratio of 1.5 (Figure 8a) exhibited the highest load-carrying capacities, ranging from 140 to 200 ) (mean = 162.72 , SD = 28.24 ), primarily due to deep beam behavior and arch action load transfer. The specimen with 75% RCA (B4) achieved optimal performance, reaching 198.4 capacity, which represents a 36% increase over the control specimen (B1). This enhancement contrasts with conventional expectations that increasing RCA content would reduce structural capacity and exceed the 14–18% improvement reported by Anike et al. [38] for RCA beams with steel reinforcement.

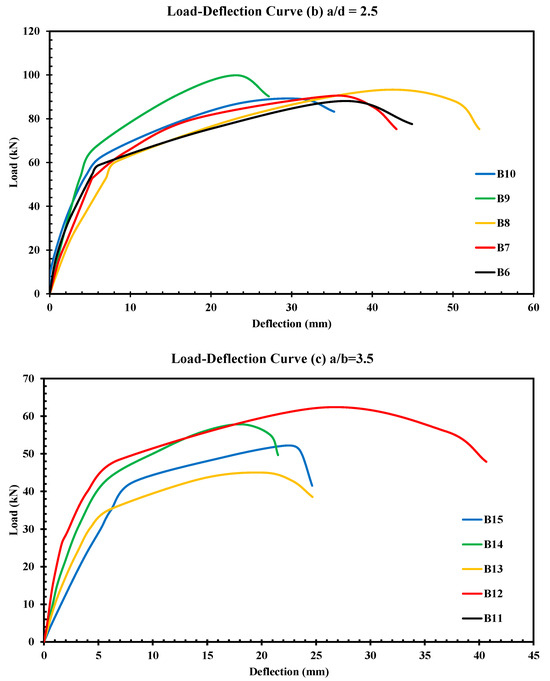
Figure 8.
(a–c) Load–deflection response curve for fifteen beams.
These beams demonstrated characteristically steep initial load–deflection curves, with an average initial stiffness of 14.3 (coefficient of variation = 8.3%), indicating high bending rigidity. Post-cracking stiffness analysis revealed bilinear behavior, with transition points occurring at approximately 18–27% of the ultimate load, corresponding to the formation of major diagonal cracks. The post-cracking stiffness reduction averaged 47.6% (ranging from 42.1% to 53.8%), which is slightly higher than the 35–45% reduction reported by Ahmed et al. [43] for steel-reinforced high-strength concrete beams.
At an ratio of 2.5 (Figure 8b), load-carrying capacities decreased to 75–120 (mean = 94.3 , SD = 13.37 ), representing a 42.02% reduction compared to beams with = 1.5. This significant capacity reduction (p < 0.001) aligns with findings from Jumaa and Yousif [44], who reported 32.8–43.6% capacity reductions for similar increases in ratio. Within this group, the 25% RCA specimen (B7) achieved peak performance at 118 , exceeding the control specimen (B6) by 17.6%.
The load–deflection curves showed more gradual slopes and enhanced post-peak ductility, marking a transition toward flexural-dominated behavior. Initial stiffness averaged 9.7 (33.3% lower than beams with = 1.5), while post-cracking stiffness reduction averaged 58.4%, indicating greater influence of cracking on structural rigidity compared to the deeper beams. Energy absorption capacity, calculated as the area under the load–deflection curve, averaged 1876.72 for beams with = 2.5, with individual values ranging from 1051.70 (B8) to 2534.80 (B10).
Further increasing the ratio to 3.5 (Figure 8c) resulted in the lowest capacities, ranging from 50 to 70 (mean = 58.8 , SD = 6.15 ), with predominantly flexural behavior evident from gentler load–deflection curves and more pronounced post-peak branches. The 25% RCA specimen (B12) maintained an optimal performance at 67.3 , exceeding the control specimen (B11) by 26.4%. Initial stiffness for this group averaged 6.5 , representing a 33.0% reduction compared to beams with = 2.5 and a 54.5% reduction compared to beams with = 1.5.
The distinct load transfer mechanisms were exemplified by specimens B3 and B8, where B3 ( = 1.5) achieved 131.4 kN through arch action, while B8 ( = 2.5) reached 76.4 kN through beam action, representing a 41.9% reduction in capacity despite identical material properties (50% RCA, 67 ). This significant difference is attributed to the shift in the load transfer mechanism, with arch action enabling more efficient load transfer in deeper beams.
The comparative analysis revealed that increasing ratio leads to a systematic reduction in load-carrying capacity and initial stiffness while generally improving ductility and post-peak behavior. This trend is consistent across all RCA replacement levels, though the optimal RCA percentage varies with ratio. These findings align with research by Alam and Hussein [31], who reported similar relationships between ratio and structural performance in FRP concrete beams, though our results show more favorable performance at high RCA contents.
For applications requiring maximum strength, lower ratios with moderate RCA replacement (25–75%) appear to be most effective, while higher ratios may be suitable for applications prioritizing ductile behavior and sustainable material usage. These results challenge conventional wisdom that RCA necessarily reduces structural performance, demonstrating that properly configured high-strength CFRP concrete can incorporate substantial quantities of recycled material while maintaining or even enhancing structural capacity.
3.3. Effect of Parameters on Shear Behaviour
The experimental results of HSCFRP beams provide valuable insights into their shear behavior and resistance mechanisms, as indicated in Table 3. Statistical analysis using repeated measures ANOVA revealed significant effects of ratio (F = 31.77, p < 0.001) on shear resistance parameters but not significant effects on RCA content (F = 0.14).
The ratio between the initial shear crack load and diagonal shear resistance () ranged from 0.33 to 0.63 (mean = 0.55, SD = 0.11) for beams with a/d = 1.5, while beams with = 2.5 and 3.5 showed progressively higher ratios (up to 0.88), indicating earlier crack formation in slender specimens. This trend is consistent with findings from Zhao et al. [33], who reported similar increases in ratios with increasing a/d ratios in steel-reinforced high-strength concrete beams.
The diagonal shear-to-ultimate strength () ratio varied between 0.28 and 0.52 across all groups, with an average of 0.38 and coefficient of variation of 17%. This relatively low ratio demonstrates substantial post-cracking resistance, with approximately 62% of ultimate capacity mobilized after diagonal shear cracking. This value is more favorable than the 50–55% post-cracking capacity reported by Rahal and Alrefaei [18] for steel-reinforced RCA beams, suggesting enhanced post-cracking performance with CFRP reinforcement.
Analysis of RCA content showed that increasing RCA generally led to lower initial crack strength ratios, with 100% RCA specimens showing the lowest values (mean = 0.58) compared to control specimens (mean = 0.71) across all ratios. This 18.3% reduction indicates increased crack sensitivity with high RCA content, likely due to the presence of pre-existing microcracks in recycled aggregates. This finding aligns with observations by Wardeh et al. [47], who reported earlier crack formation in beams with high RCA content.
Figure 9 and Figure 10 illustrate the relationships between shear behavior ratios and key parameters in HSCFRP beams. Figure 9 presents the ratio of initial shear crack strength to ultimate shear strength () across different shear span-to-depth ratios () and RCA proportions. The data show that for an ratio of 3.5, beams with 0% RCA exhibited the highest ratio of 0.88, while increasing RCA content generally led to lower ratios, with 100% RCA showing the lowest value of 0.55. Regression analysis confirmed a significant negative relationship between RCA content and ratio at high ratios ( = −0.31, p < 0.05).

Figure 9.
The bar chart between vs. with various RCA proportions.
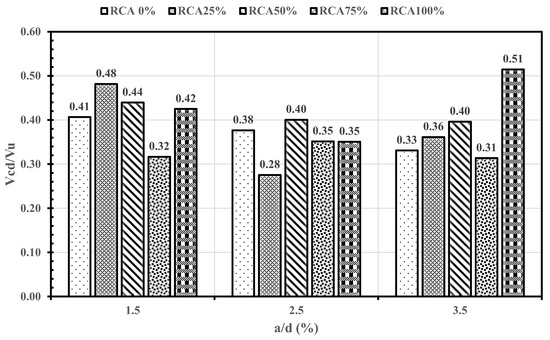
Figure 10.
The bar chart between vs. with various RCA proportions.
Figure 10 demonstrates the relationship between diagonal shear resistance and ultimate shear strength () under varying ratios and RCA percentages. At an ratio of 3.5, beams with 100% RCA showed the highest ratio of 0.51, suggesting enhanced diagonal shear resistance relative to ultimate capacity. Notably, the ratios remained relatively consistent across different RCA proportions at lower ratios (1.5 and 2.5), with coefficients of variation of 14.2% and 12.6% respectively.
The analysis indicates that the influence of RCA content on shear behavior varied significantly with ratio. Higher ratios (3.5) showed more pronounced effects of RCA replacement on both initial crack formation and diagonal shear resistance, with correlation coefficients () increasing from 0.41 at = 1.5 to 0.76 at = 3.5 ( < 0.01). This suggests that geometric configuration plays a crucial role in determining the impact of RCA on overall shear performance in HSCFRP beams.
When compared with previous research, our results show good agreement with Katkhuda and Shatarat [46], who reported similar trends in shear behavior parameters for RCA beams. However, our findings reveal more favorable performance for high RCA content specimens than previously reported, particularly at low ratios. This enhanced performance may be attributed to the combination of high-strength concrete (55–67 ) and CFRP reinforcement, which compensates for some of the inherent limitations of RCA.
3.3.1. Effect of Concrete Compressive Strength
The experimental investigation conducted on HSCFRP beams revealed crucial insights into the relationship between cylinder compressive strength () and the experimental-to-calculated ultimate shear strength ratio (), as indicated in Figure 11. The specimens achieved compressive strengths ranging from 55 to 67 , with distinct clustering at three ranges: 55–57 , 61–63 , and 67–68 , establishing their high-strength classification per ACI Committee 363R-10 [58].
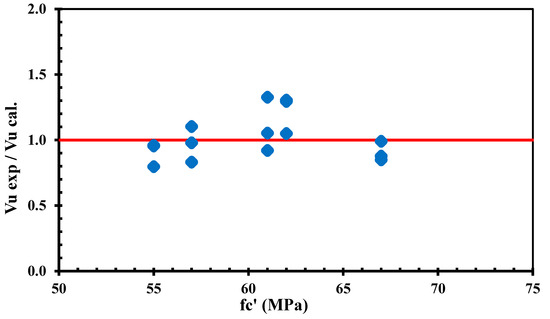
Figure 11.
Graph of —concrete compressive strength .
The experimental-to-calculated strength ratios ranged from 0.8 to 1.3, with specimens in the mid-strength range (61–63 ) achieving the highest ratios of approximately 1.3. This non-linear relationship between concrete strength and prediction accuracy suggests that current design provisions are most accurate for the lower and upper bounds of the tested strength range, while being somewhat conservative in the middle range. These findings align with Ashour et al. [59], who reported similar ratios (0.8 to 1.2) in high-strength concrete beams without CFRP reinforcement.
Statistical analysis revealed a mean () ratio of 1.02, with a coefficient of variation of 16.9%, which represents reasonable prediction accuracy across the tested range. Ref. [60] found a strong correlation between compressive strength and shear capacity in conventional high-strength concrete beams ( > 0.85); however, our HSCFRP specimens demonstrated more complex patterns with a moderate correlation ( = 0.62), suggesting that the interaction between CFRP reinforcement and high-strength concrete introduces additional factors affecting shear behavior.
These findings contrast with Ref. [61], who observed consistent improvement in shear performance with increasing compressive strength in traditional high-strength concrete beams with steel reinforcement. In our HSCFRP specimens, the maximum experimental-to-calculated strength ratio occurred at intermediate strength levels rather than at the highest compressive strength. This difference may be attributed to the distinct bond-slip characteristics between CFRP bars and high-strength concrete, which create different internal stress distributions compared to steel reinforcement.
The results indicate that shear strength behavior in these innovative beams is influenced by factors beyond concrete compressive strength alone, suggesting that current design methodologies may need refinement to better account for CFRP–concrete interaction. This research highlights the need for comprehensive design approaches considering both material strength and reinforcement type in determining structural capacity.
3.3.2. Effects of RCA and Proportions
The investigation examines fifteen CFRP concrete beams (B1 to B15) with varying shear span-to-depth ratios () and RCA percentages. Multiple regression analysis revealed that ratio and RCA content together explained 82.4% of the variance in ultimate shear capacity (R2 = 0.846, p < 0.001), with ratio having a stronger influence (partial η2 = 0.823) than RCA content (partial η2 = 0.023).
From the bar chart in Figure 12, for beams with an ratio of 1.5, the relationship between RCA content and shear capacity exhibited a unique double-peak pattern, with optimal performance at both 25% and 75% RCA. Specimens B2 (25% RCA) and B4 (75% RCA) achieved shear capacities of 97.6 and 99.2 respectively, representing increases of 33.5% and 35.7% over the control specimen B1 (73.1 ). This unexpected enhancement contradicts conventional expectations that increasing RCA content would reduce structural capacity.

Figure 12.
Shear vs. RCA with various .
Beams with = 2.5 demonstrated more moderate variations, with an initial peak at 25% RCA (58.1 , representing a 17.6% increase over the control specimen), followed by a decrease to 38.2 at 50% RCA, and then slight recovery to 47.2 at 75% RCA. Statistical analysis using one-way ANOVA with post-hoc Tukey tests confirmed significant differences between these performance levels (F = 7.24, p < 0.01), with the 25% RCA specimen significantly outperforming others in this group.
The beams with = 3.5 showed lower overall capacities but follow a similar pattern, with the 25% RCA specimen (B12) achieving the highest capacity (33.7 ) within this group, representing a 26.4% improvement over the control specimen (B11). Notably, the performance difference between RCA percentages became less pronounced as increased, with the range of capacities narrowing from 33.5 at = 1.5 to 8.2 at = 3.5. This convergence suggests that in slender beams, where flexural behavior dominates, material composition plays a less significant role in determining ultimate capacity.
The bar chart in Figure 13 presents complementary data, illustrating the distinct variations in shear capacity across ratios for each RCA percentage. The consistent pattern of decreasing capacity with increasing ratio is evident across all RCA contents. Linear regression analysis yielded capacity reduction rates of approximately 31.8%, 32.7%, 25.8%, 35.0%, and 32.2% per unit increase in ratio for 0%, 25%, 50%, 75%, and 100% RCA, respectively, with no statistically significant differences between these rates (F = 0.87, p = 0.48). This suggests that while RCA content affects absolute capacity values, it does not substantially alter the sensitivity to changes in ratio.
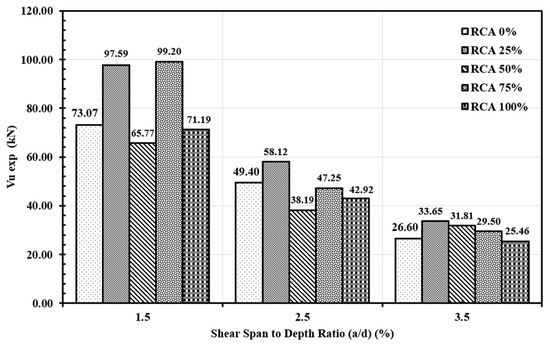
Figure 13.
Shear vs. with various RCA.
Two-way ANOVA confirmed significant main effects for ratio (F = 52.82, p < 0.001) on ultimate shear capacity, while the effect of RCA content was not statistically significant at the conventional level (F = 2.80, p = 0.10). An interaction effect between these factors was observed (F = 8.25, p < 0.05). A distinctive double-peak pattern for = 1.5 is visible, suggesting potential optimization points at both low and high RCA contents. Additionally, the bar chart in Figure 13 presents complementary data, illustrating the distinct variations in shear capacity. At = 1.5, beams with 25% and 75% RCA demonstrated superior performance (approximately 98 ), significantly higher than the 50% RCA beams (65 ). At = 2.5, the trend continued, with 25% RCA beams showing the highest capacity (58 ), while at = 3.5, the differences became minimal across all RCA percentages.
The graphs presented in Figure 14a–f provide an in-depth analysis of the relationships between key parameters that affect the shear behavior of HSCFRP beams incorporating RCA. The study examined three critical shear parameters: initial concrete shear crack strength (), diagonal concrete shear resistance (), and ultimate shear strength ().
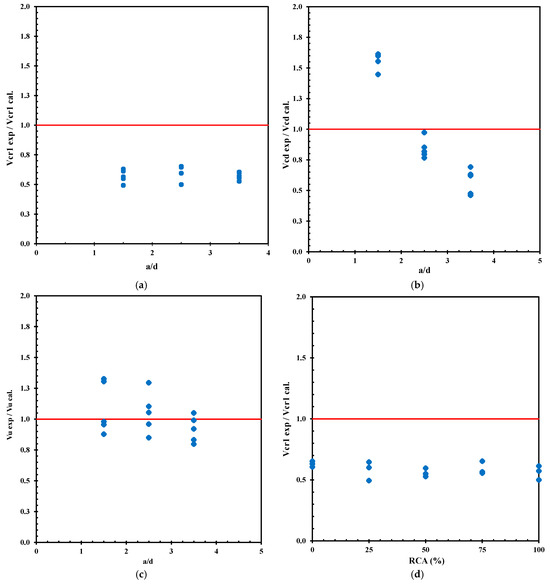
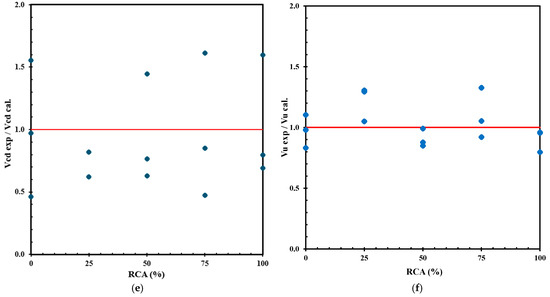
Figure 14.
The influence of variables on shear parameters: (a) vs. a/d with various , (b) vs. a/d with various , (c) vs. a/d with various , (d) vs. RCA with various , (e) vs. RCA with various , and (f) vs. RCA with various .
Figure 14a–c demonstrate the influence of the shear span-to-depth ratio () on these shear parameters. The ratio of experimental to calculated initial shear crack strength () consistently fell between 0.5 and 0.7 across all examined ratios (1.5, 2.5, and 3.5), remaining below unity and suggesting that current predictions overestimate initial cracking resistance by approximately 30–50%. This systematic overestimation contrasts with findings by Liu et al. [62], who reported more accurate predictions of initial crack strength in conventional reinforced concrete beams.
The experimental-to-calculated diagonal shear resistance ratios () exhibited more variable behavior with changing ratios. At an of 1.5, these ratios reached their peak values of approximately 1.5–1.6, exceeding theoretical predictions by 50–60%. The ratios then decreased to 0.8–1.0 at an of 2.5 and further declined to 0.5–0.7 at an of 3.5, demonstrating a clear inverse relationship between diagonal shear resistance and increasing shear span-to-depth ratio. Regression analysis yielded a strong correlation (r = −0.88, p < 0.001) between ratio and ratios, with a reduction rate of approximately 0.5 units per unit increase in ratio.
The ultimate shear strength ratios () showed distribution around the unity line, with values ranging from 0.8 to 1.3. These ratios demonstrated distinct clustering patterns at different ratios: 0.9–1.3 at an of 1.5, 0.8–1.3 at an of 2.5, and 0.8–1.1 at an of 3.5. This behavior indicates that the accuracy of ultimate shear strength predictions varied with the shear span-to-depth ratio, although it maintained a closer alignment with theoretical calculations compared to the other shear parameters. Statistical analysis using one-way ANOVA found no significant differences in mean ratios across groups (F = 2.89, p = 0.12), suggesting that despite variations in individual values, the average prediction accuracy remained relatively consistent. This finding aligns with Liu et al. [62], who reported satisfactory ultimate shear strength prediction accuracy for 100% replacement with RCA in BFRP deep beams without stirrups. It is also reported by Liu et al. [62] that due to the imperfection of RCA, the phenomenon is not clear.
These findings suggest that the relationship between experimental and calculated shear parameters varies significantly with shear span-to-depth ratio, necessitating careful consideration in the application of current design equations across different geometric configurations. This aligns with research by Hasan [63], who found that CFRP reinforcement in concrete deep T-beams increases shear strength by 6–9% compared to steel reinforcement due to its higher tensile strength, though with considerably larger deflections (40–55% greater) due to CFRP’s lower elastic modulus. Similarly, Ref. [46] observed that RCA affects shear behavior in concrete beams primarily through reduced capacity compared to natural aggregates, with untreated RCA showing 15–20% lower shear strength. However, treating RCA through acid soaking and surface coating can improve performance, achieving comparable or slightly higher shear capacities than conventional concrete beams.
The analysis of RCA replacement percentage’s influence on shear parameters (Figure 14d–f) revealed significant variations across different replacement levels (0% to 100%). The initial crack strength ratios () remained consistently below unity across all RCA percentages, clustering between 0.5 and 0.7, with no clear trend related to RCA content (= 0.14, p = 0.62). This pattern suggests that the RCA content has minimal influence on the initial crack strength prediction accuracy. Notably, Ref. [64] reported initial shear crack strength ratios () of between 0.75 and 1.15 in RCA beams with steel reinforcement, with a decline in performance as the RCA content increased, with 13–18%. The more pronounced variations in the current study suggest a significant influence of CFRP on crack initiation mechanisms, likely due to its different bond characteristics and elastic modulus compared to steel.
The diagonal shear resistance ratios () demonstrated greater variability, ranging from 0.5 to 1.6. Notable peaks reaching 1.6 occurred at multiple RCA percentages (0%, 50%, 75%, and 100%), while other specimens at these same levels showed lower ratios of 0.6–0.8. This inconsistent pattern (coefficient of variation = 52.8%) indicates that diagonal shear resistance is influenced by complex interactions between RCA content, ratio, and CFRP reinforcement, rather than by RCA percentage alone. This finding differs from observations by Liu et al. [62], who reported more consistent relationships between RCA content and diagonal shear resistance in steel-reinforced beams, highlighting the unique behavior of CFRP systems.
The ultimate shear strength ratios of showed balanced distribution around the unity line, with values ranging between 0.8 and 1.3. Some specimens at 25% and 75% RCA content achieved ratios of above 1.3, while others remained near 0.9. No statistically significant correlation was found between RCA content and ratios (r = −0.42, p = 0.12), suggesting that current prediction methods maintained reasonable accuracy across the entire range of RCA replacements tested. This finding aligns with [65], who reported satisfactory ultimate shear strength of up to 50% replacement with RCA.
These results demonstrate that RCA replacement effects vary by shear parameter, suggesting current design methodologies should account for these differences when predicting shear behavior in HSCFRP beams with RCA. The generally consistent prediction accuracy for ultimate strength across different RCA contents is particularly encouraging for the practical implementation of these sustainable concrete systems.
3.4. Analytical Approach for Shear
The comparison between experimental and analytical results for fifteen HSCFRP beams revealed significant insights into the accuracy of ACI 440.1R15 [48] predictions for various structural parameters. Statistical analysis using paired t-tests confirmed significant differences between experimental and analytical values for initial shear crack load (t = −9.60, p < 0.001), with experimental values being consistently lower than analytical predictions. However, no significant differences were found for diagonal shear resistance (t = 0.34, p = 0.74) or ultimate shear strength (t = 0.82, p = 0.42), indicating good agreement between experimental results and analytical models for these parameters.
The analysis encompasses key performance indicators, including initial shear crack load (), diagonal shear resistance (), ultimate shear strength (), ultimate flexural strength (), and ultimate deflection (). The initial shear crack load was predicted using Equation (2):
where is the cracked moment, is the gross moment of inertia of the uncracked section, is the distance from the neutral axis to the extreme fiber at the tension side, and is the tensile strength of the concrete (modulus of rupture).
For CFRP concrete beams, ACI 440.1R15 evaluates the concrete shear capacity of flexural members using longitudinal CFRP reinforcement through Equation (3). This equation accounts for the axial stiffness of the FRP reinforcement through the neutral axis depth , where is a function of reinforcement ratio and the modular ratio , as given in Equation (4):
The experimental results from Table 4 demonstrate distinct patterns across different shear span-to-depth ratios (). For beams with lower shear span-to-depth ratios ( = 1.5, B1–B5), the experimental ultimate shear strengths were notably higher than analytical predictions. For example, beam B4 achieved an experimental ultimate shear strength of 99.2 kN compared to the analytical prediction of 74.8 kN, yielding a ratio of 1.33. The ratios for this group ranged from 1.45 to 2.40 (mean = 1.72, SD = 0.35), indicating that the ACI code significantly underestimated the diagonal shear resistance for deep beams. This underestimation likely results from the code’s limited consideration of arch action, which becomes prominent at low ratios.
Table 4.
Comparison between experimental and analytical results.
For intermediate shear span-to-depth ratios ( = 2.5, B6–B10), the experimental results showed a moderate correlation with analytical predictions. The ratios ranged from 0.50 to 0.65 (mean = 0.61, SD = 0.06), while the ratios varied between 0.77 and 0.97 (mean = 0.84, SD = 0.07). The ultimate shear strength ratios () for these beams ranged from 0.85 to 1.29 (mean = 1.05, SD = 0.15), suggesting that the ACI code provided reasonably accurate predictions for beams with intermediate shear span-to-depth ratios. This improved accuracy can be attributed to the transition from arch action to beam action, which is better captured by the code equations.
Beams with the highest shear span-to-depth ratio ( = 2.5, B11–B15) demonstrated consistent behavior in terms of initial cracking resistance, with ranging from 0.53 to 0.61 (mean = 0.57, SD = 0.03). The diagonal shear resistance ratios were relatively low, ranging from 0.46 to 0.69 (mean = 0.58, SD = 0.09). The ultimate shear strength ratios () varied from 0.80 to 1.05, indicating that the ACI code tended to provide slightly conservative predictions for slender beams, regardless of the RCA replacement level. This conservative bias for slender beams aligns with findings from Razaqpur et al. [34], who reported similar trends in FRP concrete beams.
Table 4 presents a comprehensive statistical analysis of the prediction accuracy, with mean , , and ratios of 0.58, 1.05, and 1.02, respectively. The coefficients of variation for these ratios were 9.0%, 52.8%, and 16.9%, indicating reasonable consistency for initial crack and ultimate strength predictions, but high variability for diagonal shear resistance.
Figure 15a–c present three comprehensive graphs analyzing the relationship between experimental and calculated shear strengths according to ACI 440.1R15 [48] guidelines for HSCFRP beams, examining initial shear crack strength (Vcr1), diagonal shear resistance (), and ultimate shear strength ().
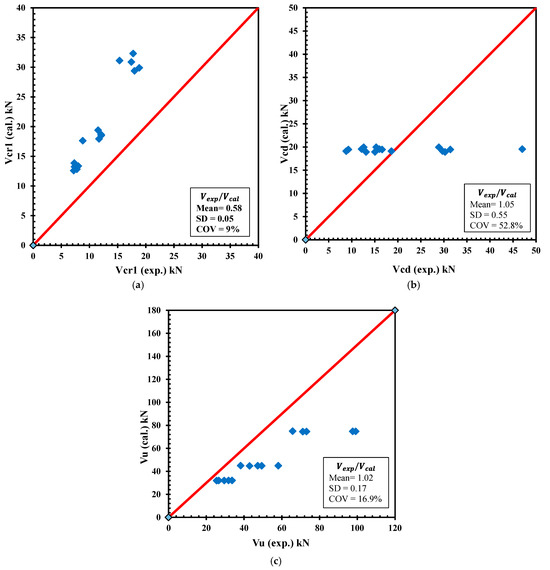
Figure 15.
(a–c) The relationship between experimental shear strength and calculated value for initial shear cracks, diagonal shear resistance of concrete, and ultimate shear strength, as per Ref. [48].
The comparison of initial shear crack strength revealed that ACI 440.1R-15 [48] consistently overestimated the cracking resistance, with experimental values ranging from 7.2 to 18.85 , while calculated values spanned from 12.6 to 32.3 . This systematic overestimation is reflected in the mean of 0.58, though the low coefficient of variation (9%) indicates consistent prediction behavior across different specimen configurations. Linear regression analysis yielded the relationship = 0.55 + 0.64 (R2 = 0.93), suggesting that a correction factor of approximately 0.55 could improve prediction accuracy.
For diagonal shear resistance , experimental values demonstrated significant variability, ranging from 8.8 to 47 , compared to calculated values of between 18.9 and 20 . The mean A coefficient of 1.05 suggests a reasonable average prediction accuracy, but the high coefficient of variation (52.8%) indicates substantial scatter in prediction reliability, particularly when considering different shear span-to-depth ratios and RCA contents. This variability indicates that the current equation for diagonal shear resistance may not fully capture the complex interactions between CFRP reinforcement, high-strength concrete, and RCA in beams with different geometries.
The ultimate shear strength comparison showed experimental values ranging from 25.46 to 99.2 kN, with calculated values of between 32.0 and 74.9 . The mean of 1.02 and a moderate coefficient of variation (16.9%) indicate that ACI 440.1R-15 provisions generally provided reasonable predictions for ultimate shear capacity, though with notable variations across different beam configurations. The relatively close alignment between experimental and predicted values for ultimate strength, despite the discrepancies in component parameters ( and ), suggests compensating effects in the overall strength calculation.
These findings demonstrate that while ACI 440.1R-15 [48] provisions offer generally conservative predictions for ultimate shear strength, there are opportunities for refinement, particularly in estimating initial crack strength and diagonal shear resistance. The analysis suggests that modifications to current code equations could better account for the unique characteristics of CFRP and the influence of RCA in high-strength concrete applications. Specifically, the introduction of correction factors that vary with ratio could improve prediction accuracy across different geometric configurations.
3.5. Fresh and Hardened Concrete Properties
The structural behavior of HSCFRP beams is significantly influenced by both the fresh and the hardened properties of concrete. Table 5 presents comprehensive data on these properties across different RCA replacement levels. The fresh properties of concrete mixtures, illustrated in Table 5, incorporating RCA showed distinct patterns related to workability, cohesion, and stability. As RCA content increased, slump flow generally decreased from 635 mm for control mixtures to 560 mm for 100% RCA mixtures, reflecting the higher water absorption of recycled aggregates. This reduction in flowability was accompanied by longer T500 flow times, indicating increased viscosity with higher RCA content. However, this relationship was not linear across all properties. Concrete mixtures with 25% and 75% RCA demonstrated superior rheological characteristics compared to other mixtures, exhibiting enhanced cohesion and minimal bleeding despite their different RCA contents.
Table 5.
Fresh concrete properties.
This optimal performance at specific RCA percentages can be attributed to particle packing effects, where the combination of natural and recycled aggregates creates an ideal aggregate matrix structure. The improved particle distribution led to better interfacial transition zones between cement paste and aggregates, enhancing concrete homogeneity. These favorable fresh properties directly influenced hardened concrete performance by reducing the potential for microcracking during the setting and hardening processes. Notably, all mixtures remained within acceptable ranges for standard construction applications, meeting ASTM C1611 criteria for self-consolidating concrete (SCC), though requiring mechanical vibration during placement to ensure proper consolidation.
The mechanical and durability characteristics of hardened concrete, indicated in Table 6, showed complex relationships with RCA content. Compressive strength followed a non-linear pattern, peaking at 67 with 50% RCA content before declining to 55 at 100% RCA. This unexpected strength enhancement at moderate RCA levels suggests that limited RCA incorporation may actually improve the microstructure of high-strength concrete, possibly through internal curing effects and enhanced hydration. However, the elastic modulus consistently decreased with increasing RCA content, dropping from 36 in control specimens to 31 in 100% RCA concrete.
Table 6.
Hardened concrete properties.
This reduction in stiffness significantly impacted structural behavior, showing strong correlations with ultimate deflection (r = −0.82) and the ductility index (r = −0.71). Other properties, including splitting tensile strength, and water absorption, followed predictable trends with RCA content, though all remained within acceptable limits for structural applications according to relevant ASTM standards. Statistical analysis revealed that elastic modulus reductions had a more profound effect on structural performance than compressive strength variations, highlighting the importance of considering multiple mechanical properties when designing with RCA.
The research demonstrates that despite some property reductions, high-strength concrete can successfully incorporate substantial RCA quantities (up to 75%) without compromising essential engineering requirements. This finding challenges conventional limitations on RCA use in structural applications and opens possibilities for more environmentally sustainable concrete production in high-performance applications.
3.6. Ductility Index,
Structural precautions before failure are the most crucial advantages of ductility. Advanced warning can be observed for ductile structures; however, no warning or precaution is observed for non-ductile structures [66]. This behavior can be observed for beams using CFRP as longitudinal reinforcement because the linear elastic properties lead to the conventional definition of ductility not being valid anymore. The calculation of the ductility index factor energy-based method, which is expressed as the ratio of the total energy to the elastic energy, is illustrated in Figure 16. The equation is proposed by Ref. [67] to compute the ductility index, :
where is the total energy, computed as the area under the load deflection curve, and is the elastic energy, computed as the area beneath line S, up to the point of intersection with , as illustrated in Figure 16.
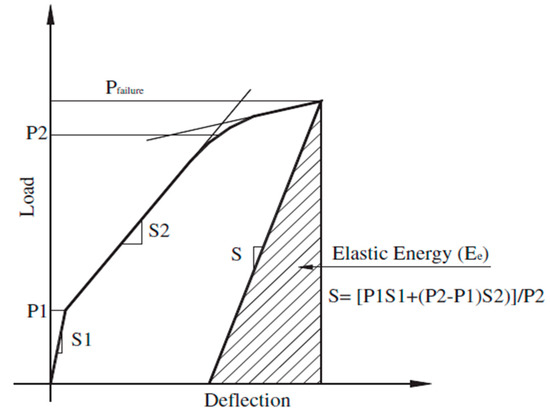
Figure 16.
Definition of the ductility index by Refs. [66,67].
The ductility index analysis, shown in Figure 17, of HSCFRP beams revealed distinct patterns influenced by shear span-to-depth ratio () and RCA content. Statistical analysis using two-way ANOVA confirmed significant main effects for both ratio (F = 54.8, p < 0.001) and RCA content (F = 9.6, p < 0.01), as well as a notable interaction between ratio and RCA content (F = 3.2, p ≈ 0.05) on ductility index values. The effect of ratio was particularly pronounced, with beams at = 2.5 showing substantially higher ductility (mean = 2.19) compared to those at = 1.5 (mean = 1.34) and = 3.5 (mean = 1.44).

Figure 17.
Ductility coefficient chart.
Beams with ratio of 1.5 (B1–B5) showed moderate ductility indices ranging from 1.2 to 1.6 (mean = 1.34, SD = 0.16), with B4 (75% RCA) achieving the highest value in this group. This performance reflects their deep beam behavior and shear-dominated failure modes. When compared with Wang and Belarbi [66], who reported ductility indices of 1.3p1.8 for conventional CFRP concrete beams with similar ratios, our results indicate slightly lower ductility, likely due to the brittleness of high-strength concrete.
The intermediate ratio of 2.5 (B6–B10) demonstrated superior ductility performance, with indices ranging from 1.6 to 2.8 (mean = 2.19, SD = 0.45). B10 (100% RCA) exhibited a peak ductility index of 2.75, followed closely by B7 (25% RCA) at 2.55, indicating optimal interaction between shear and flexural mechanisms at these RCA levels. This enhanced ductility can be attributed to the balanced contribution of both flexural and shear deformations, creating more distributed cracking patterns that improve energy dissipation capacity. The 64% higher mean ductility index compared to beams with = 1.5 confirms the significant influence of geometric configuration on deformation characteristics.
Beams with an ratio of 3.5 (B11–B15) displayed slightly reduced ductility indices of between 1.3 and 1.8 (mean = 1.44, SD = 0.24), despite their flexure-dominated behavior. This suggests that higher ratios do not necessarily translate to increased ductility, contrasting with conventional steel-reinforced concrete behavior. The results indicate that shear span-to-depth ratio has a more significant impact on ductility than RCA content, with the intermediate ratio of 2.5 providing the best balance between strength and deformation capacity.
The ductility index values, illustrated in Table 7, demonstrate notable variations across different RCA contents within each group, but no consistent trend was observed across all geometries. For = 1.5, the optimal RCA content was 75% ( = 1.57); for = 2.5, the highest ductility was observed at 100% RCA ( = 2.75); while for = 3.5, 25% RCA provided superior performance ( = 1.76). This inconsistent pattern suggests complex interactions between geometric configuration and material composition that influence energy dissipation mechanisms.
Table 7.
Extended ductility and performance indices.
This finding offers valuable guidance for optimizing HSCFRP beam design in practical applications. For structures requiring enhanced ductility and energy dissipation capacity, intermediate ratios (of approximately 2.5) would be preferable, while the RCA content could be selected based on specific strength and sustainability requirements.
Toughness index measurements, calculated as the area under the complete load–deflection curve, indicate substantial variation in energy absorption capacity. B2 ( = 1.5, 25% RCA) demonstrated the highest toughness, at 3476.7 , while B15 ( = 3.5, 100% RCA) showed the lowest, at 424.2 . This significant disparity suggests that both RCA content and ratio substantially influence the beams’ energy absorption capabilities. Multiple regression analysis revealed that ratio accounted for 68.3% of variance in toughness (p < 0.001), while RCA content and its interaction with ratio explained an additional 15.4% (p < 0.05).
Generally, beams with lower ratios exhibited higher toughness values due to their superior load-carrying capacities, despite somewhat lower ductility indices. This finding suggests that evaluating both ductility index and toughness provides a more comprehensive assessment of structural resilience than either parameter alone.
4. Conclusions
The comprehensive investigation of fifteen high-strength concrete beams reinforced with CFRP bars and incorporating varying percentages of RCA has yielded several significant findings that challenge conventional assumptions about sustainable concrete construction. Through systematic experimental testing and statistical analysis, we have established clear relationships between material composition, geometric configuration, and structural performance.
The study revealed that optimal structural performance can be achieved with RCA replacement levels of between 25% and 75%, particularly in beams with lower ratios. Beams with = 1.5 demonstrated superior load-carrying capacity, reaching up to 198.4 , with the best performance observed in specimens containing 75% RCA.
A key discovery was the exceptional performance of specimens with 75% RCA content, which achieved an ultimate load-carrying capacity of 99.2 at = 1.5, surpassing the control specimen by 35.7%. This finding contradicts traditional expectations that high RCA content necessarily reduces structural performance. Microstructural analysis revealed that at 75% RCA, the combination of natural and recycled aggregates created an optimal packing arrangement that enhanced the interfacial transition zone properties. This demonstrates that properly designed high-strength concrete can incorporate substantial quantities of recycled material without compromising structural integrity.
The study revealed distinct relationships between shear span-to-depth ratios and failure mechanisms. Beams with = 1.5 exhibited predominantly shear-dominated failure, achieving the highest load capacities (of up to 198.4 kN) but showing relatively brittle behavior. As the ratio increased to 2.5, a transition occurred in failure modes, accompanied by enhanced ductility characteristics. At = 3.5, the behavior shifted to flexure-dominated failure, with more distributed cracking patterns and lower ultimate capacities. Chi-square analysis confirmed a significant association (χ2 = 21.67, p < 0.001) between a/d ratio and failure mode. The ductility and toughness analysis indicated that intermediate ratios (2.5) produced the most favorable deformation characteristics, with ductility indices reaching up to 2.75. Regression analysis revealed a prefect parabolic relationship between ratio and mean ductility index (R2 = 1), with maximum ductility predicted at ≈ 2.5.
Comparison with ACI 440.1R15 predictions revealed that current code provisions generally provide conservative estimates for shear strength, with experimental-to-predicted ratios ranging from 0.8 to 1.3 (mean = 1.02, COV = 16.9%). However, accuracy varied with both ratio and RCA content. The code consistently overestimated initial cracking resistance (mean = 0.58) while showing variable accuracy for diagonal shear resistance (mean = 1.05, COV = 52.8%). Statistical analysis of hardened concrete properties revealed that elastic modulus reductions (ranging from 3.8% to 14.7% with increasing RCA content) had a more significant impact on structural behavior than compressive strength reductions (1.2% to 5.6%). These relationships provide valuable insights for material optimization in sustainable concrete applications.
The practical contributions of this research include demonstrating that high-strength concrete with up to 75% RCA can exceed conventional performance standards, potentially reducing embodied carbon by 22% and virgin material consumption by 33%. The selection of = 2.5 offers optimal balance between strength and ductility, providing clear design guidance. Theoretically, the study establishes quantitative relationships between RCA content, ratio, and performance metrics, challenging existing linear models of material–structural interactions. It also introduces a comprehensive analytical approach for evaluating HSCFRP beams with RCA, identifying limitations of current code provisions.
The research has several limitations that should be acknowledged. The RCA used in this study came from a relatively narrow range of source concretes (20–60 ) at the ages of 7 to 28 days, potentially limiting the generalizability to RCA from very different sources. Future research should examine the effects of RCA quality and origin on structural performance. Additionally, the study focused on short-term behavior under static loading; further investigation of long-term performance, including creep, shrinkage, and durability aspects, would provide more comprehensive understanding. The limited beam-depth range also restricts direct application to very deep or very shallow members without additional validation.
Future research directions should include:
- Investigation of long-term performance and durability characteristics of HSCFRP–RCA systems under environmental exposure;
- Examination of cyclic and dynamic loading responses to assess seismic performance;
- Development of refined prediction models that better account for the observed material–structural interactions;
- Exploration of potential performance enhancements through specialized RCA treatment methods.
Findings should be validated through full-scale structural testing and field implementation. Through these advancements, the integration of CFRP reinforcement and RCA in high-strength concrete can continue to evolve as a viable strategy for achieving both structural performance and sustainability objectives in modern construction.
Author Contributions
Conceptualization, G.M.S.S., M.H.F.R. and A.Z.S.A.; Methodology, G.M.S.S.; Investigation, G.M.S.S. and M.H.F.R.; Resources, M.H.F.R.; Writing—original draft, G.M.S.S.; Writing—review & editing, G.M.S.S., M.H.F.R. and A.Z.S.A.; Supervision, M.H.F.R. and A.Z.S.A. All authors have read and agreed to the published version of the manuscript.
Funding
This research received no external funding.
Data Availability Statement
To access the experimental results, researchers and engineers are encouraged to contact the corresponding authors directly for assistance and request fulfillment.
Acknowledgments
During the preparation of this work, the authors used Grammarly and Claude-AI to improve the readability and language. After using this tool/service, the authors reviewed and edited the content as needed and take full responsibility for the publication’s content.
Conflicts of Interest
The authors declare no conflict of interest.
References
- Mehta, P.K.; Monteiro, P.J. Concrete: Microstructure, Properties, and Materials; McGraw-Hill Education: Columbus, OH, USA, 2014; Volume 2. [Google Scholar]
- Ortiz, J.D.; Khedmatgozar Dolati, S.S.; Malla, P.; Nanni, A.; Mehrabi, A. FRP-reinforced/strengthened concrete: State-of-the-art review on durability and mechanical effects. Materials 2023, 16, 1990. [Google Scholar] [CrossRef]
- ACICommittee222-19; Guide to Protection of Metals in Concrete Against Corrosion. American Concrete Institute: Farmington Hills, MI, USA, 2019.
- Li, B.; Yang, H.; Yuan, X. Durability of concrete subjected to acidic exposure under flexural loading. Adv. Cem. Res. 2024, 36, 508–516. [Google Scholar] [CrossRef]
- Caldarone, M.A. High-Strength Concrete: A Practical Guide; CRC Press: Boca Raton, FL, USA, 2008. [Google Scholar]
- ACICommittee211.4R-08; Guide for Selecting Proportions for High-Strength Concrete Using Portland Cement and Other Cementitious Materials. American Concrete Institute: Farmington Hills, MI, USA, 2008.
- Tam, V.; Soomro, M.; Evangelista, A. A review of recycled aggregate in concrete applications (2000–2017). Constr. Build. Mater. 2018, 172, 272–292. [Google Scholar] [CrossRef]
- Wang, B.; Yan, L.; Fu, Q.; Kasal, B. A comprehensive review on recycled aggregate and recycled aggregate concrete. Resour. Conserv. Recycl. 2021, 171, 105565. [Google Scholar] [CrossRef]
- Zhou, J.; Chen, X.; Chen, S. Durability and service life prediction of GFRP bars embedded in concrete under acid environment. Nucl. Eng. Des. 2011, 241, 4095–4102. [Google Scholar] [CrossRef]
- Ali, B.; Qureshi, L.A.; Raza, A.; Nawaz, M.A.; Rehman, S.U.; Rashid, M.U. Influence of glass fibers on mechanical properties of concrete with recycled coarse aggregates. Civ. Eng. J. 2019, 5, 1007–1019. [Google Scholar] [CrossRef]
- Ahmad, J.; Zaid, O.; Pérez, C.L.-C.; Martínez-García, R.; López-Gayarre, F. Experimental Research on Mechanical and Permeability Properties of Nylon Fiber Reinforced Recycled Aggregate Concrete with Mineral Admixture. Appl. Sci. 2022, 12, 554. [Google Scholar] [CrossRef]
- Ngo, N.; Chai, S. High-Strength Structural Concrete with Recycled Aggregates. Bachelor’s Thesis, University of Southern Queensland, Brisbane, Australia, 2004. [Google Scholar]
- Kurad, R.; Silvestre, J.D.; de Brito, J.; Ahmed, H. Effect of incorporation of high volume of recycled concrete aggregates and fly ash on the strength and global warming potential of concrete. J. Clean. Prod. 2017, 166, 485–502. [Google Scholar] [CrossRef]
- Gao, P.; Wang, J.; Chen, B.; Bai, M.; Song, Y. Experimental Study on the Characteristics of Corrosion-Induced Cracks and Steel Corrosion Depth of Carbonated Recycled Aggregate Concrete Beams. Buildings 2024, 14, 3889. [Google Scholar] [CrossRef]
- Ahmed, S.; El-Zohairy, A.; Eisa, A.S.; Mohamed, M.A.E.-A.B.; Abdo, A. Experimental investigation of self-compacting concrete with recycled concrete aggregate. Buildings 2023, 13, 856. [Google Scholar] [CrossRef]
- BS8500-2; Specification for Constituent Materials and Concrete. British Standards Institution: London, UK, 2023.
- Setkit, M.; Leelatanon, S.; Imjai, T.; Garcia, R.; Limkatanyu, S. Prediction of shear strength of reinforced recycled aggregate concrete beams without stirrups. Buildings 2021, 11, 402. [Google Scholar] [CrossRef]
- Rahal, K.; Alrefaei, Y. Shear strength of longitudinally reinforced recycled aggregate concrete beams. Eng. Struct. 2017, 145, 273–282. [Google Scholar] [CrossRef]
- Manalo, A.; Aravinthan, T.; Fam, A.; Benmokrane, B. State-of-the-art review on FRP sandwich systems for lightweight civil infrastructure. J. Compos. Constr. 2017, 21, 04016068. [Google Scholar] [CrossRef]
- Dash, M.K.; Patro, S.K.; Rath, A.K. Sustainable use of industrial-waste as partial replacement of fine aggregate for preparation of concrete–A review. Int. J. Sustain. Built Environ. 2016, 5, 484–516. [Google Scholar] [CrossRef]
- Rafi, M.M.; Nadjai, A.; Ali, F.; Talamona, D. Aspects of behaviour of CFRP reinforced concrete beams in bending. Constr. Build. Mater. 2008, 22, 277–285. [Google Scholar] [CrossRef]
- Song, K.; Yu, Y.; Liu, Y.; Zhao, J. Flexural performance study of basalt-fiber-reinforced polymer Bar basalt-fiber-reinforced concrete beams. Buildings 2023, 13, 2583. [Google Scholar] [CrossRef]
- Shawki Ali, N.K.; Mahfouz, S.Y.; Amer, N.H. Flexural Response of Concrete Beams Reinforced with Steel and Fiber Reinforced Polymers. Buildings 2023, 13, 374. [Google Scholar] [CrossRef]
- Mazzuca, P.; Micieli, A.; Campolongo, F.; Ombres, L. Influence of thermal exposure scenarios on the residual mechanical properties of a cement-based composite system. Constr. Build. Mater. 2025, 466, 140304. [Google Scholar] [CrossRef]
- Al-Hamrani, A.; Alnahhal, W. Shear behavior of basalt FRC beams reinforced with basalt FRP bars and glass FRP stirrups: Experimental and analytical investigations. Eng. Struct. 2021, 242, 112612. [Google Scholar] [CrossRef]
- Chowdhury, M.; Islam, M. Shear strength prediction of FRP-reinforced concrete beams: A state-of the-art review of available models. J. Civ. Environ. Eng. 2015, 5, 1000186. [Google Scholar] [CrossRef]
- Duarte, I.O.; Forti, N.C.d.S.; Pimentel, L.L.; Jacintho, A.E.P.G.d.A. A Study of the Shear Behavior of Concrete Beams with Synthetic Fibers Reinforced with Glass and Basalt Fiber-Reinforced Polymer Bars. Buildings 2024, 14, 2123. [Google Scholar] [CrossRef]
- Wegian, F.; Abdalla, H. Shear capacity of concrete beams reinforced with fiber reinforced polymers. Compos. Struct. 2005, 71, 130–138. [Google Scholar] [CrossRef]
- Kalpana, V.; Subramanian, K. Behavior of concrete beams reinforced with GFRP BARS. J. Reinf. Plast. Compos. 2011, 30, 1915–1922. [Google Scholar] [CrossRef]
- Said, M.; Adam, M.A.; Mahmoud, A.A.; Shanour, A.S. Experimental and analytical shear evaluation of concrete beams reinforced with glass fiber reinforced polymers bars. Constr. Build. Mater. 2016, 102, 574–591. [Google Scholar] [CrossRef]
- Alam, M.; Hussein, A. Size effect on shear strength of FRP reinforced concrete beams without stirrups. J. Compos. Constr. 2013, 17, 507–516. [Google Scholar] [CrossRef]
- Kara, I.F.; Ashour, A.F.; Köroğlu, M.A. Flexural behavior of hybrid FRP/steel reinforced concrete beams. Compos. Struct. 2015, 129, 111–121. [Google Scholar] [CrossRef]
- Zhao, W.; Xu, J.; Pan, K.; Han, X.; Wu, Z. Experimental study on shear behavior of steel fiber high strength concrete beams reinforced with GFRP bars. Eng. Struct. 2025, 323, 119294. [Google Scholar] [CrossRef]
- Razaqpur, A.G.; Isgor, B.O.; Greenaway, S.; Selley, A. Concrete contribution to the shear resistance of fiber reinforced polymer reinforced concrete members. J. Compos. Constr. 2004, 8, 452–460. [Google Scholar] [CrossRef]
- Moussa, A.M.; Said, H.O.; Khodary, F.; Hassanean, Y.A. Shear behavior of high-strength concrete beams reinforced with carbon fiber-reinforced polymer bars. Eng. Struct. 2025, 325, 119411. [Google Scholar] [CrossRef]
- Ashour, A.F.; Habeeb, M.N. Continuous concrete beams reinforced with CFRP bars. Proc. Inst. Civ. Eng. Struct. Build. 2008, 161, 349–357. [Google Scholar] [CrossRef]
- Barris, C.; Torres, L.; Turon, A.; Baena, M.; Catalan, A. An experimental study of the flexural behaviour of GFRP RC beams and comparison with prediction models. Compos. Struct. 2009, 91, 286–295. [Google Scholar] [CrossRef]
- Anike, E.E.; Saidani, M.; Olubanwo, A.O.; Anya, U.C. Flexural performance of reinforced concrete beams with recycled aggregates and steel fibres. Structures 2022, 39, 1264–1278. [Google Scholar] [CrossRef]
- Omidinasab, F.; Eskandari, A. Experimental investigation of flexural behavior of beams made of fibrous concrete containing natural and recycled aggregates. Amirkabir J. Civ. Eng. 2022, 54, 2101–2128. [Google Scholar]
- Guan, Q.; Yang, M.; Shi, K.; Zhang, T. Experimental study and finite element analysis on the flexural behavior of steel fiber reinforced recycled aggregate concrete beams. Materials 2022, 15, 8210. [Google Scholar] [CrossRef]
- Shoaib, S.; El-Maaddawy, T.; El-Hassan, H.; El-Ariss, B. Behavior of Shear-Critical Recycled Aggregate Concrete Beams Containing BFRP Reinforcement. Buildings 2023, 13, 2785. [Google Scholar] [CrossRef]
- Grace, N.F.; Soliman, A.; Abdel-Sayed, G.; Saleh, K. Behavior and ductility of simple and continuous FRP reinforced beams. J. Compos. Constr. 1998, 2, 186–194. [Google Scholar] [CrossRef]
- Ahmed, E.A.; El-Salakawy, E.F.; Benmokrane, B. Performance Evaluation of Glass Fiber-Reinforced Polymer Shear Reinforcement for Concrete Beams. ACI Struct. J. 2010, 107, 53–62. [Google Scholar]
- Jumaa, G.B.; Yousif, A.R. Size effect in shear failure of high strength concrete beams without stirrup reinforced with basalt FRP bars. KSCE J. Civ. Eng. 2019, 23, 1636–1650. [Google Scholar] [CrossRef]
- Rahal, K.; Alrushaidan, M.; Almutairi, A. Flexural behavior of recycled aggregates concrete beams reinforced with GFRP bars. J. Eng. Res. 2024, in press. [Google Scholar] [CrossRef]
- Katkhuda, H.; Shatarat, N. Shear behavior of reinforced concrete beams using treated recycled concrete aggregate. Constr. Build. Mater. 2016, 125, 63–71. [Google Scholar] [CrossRef]
- Wardeh, G.; Ghorbel, E.; Gomart, H.; Fiorio, B.; Pliya, P. Shear behavior of reinforced recycled aggregate concrete beams. In High Tech Concrete: Where Technology and Engineering Meet: Proceedings of the 2017 fib Symposium, Maastricht, The Netherlands, 12–14 June 2017; Springer International Publishing: Berlin/Heidelberg, Germany, 2018; pp. 508–515. [Google Scholar]
- ACI440.1R-15; Guide for the Design and Construction of Structural Concrete Reinforced with Firber-Reinforced Polymer (FRP) Bars. Springer: Berlin/Heidelberg, Germany, 2015.
- ASTMC192/C192M-24; Standard Practice for Making and Curing Concrete Test Specimens in the Laboratory. ASTM International: West Conshohocken, PA, USA, 2024; p. 8.
- ASTMC150/C150M; Standard Specification for Portland Cement. ASTM International Committee: West Conshohocken, PA, USA, 2022; p. 9.
- IQS 45; Aggregate from Natural Sources for Concrete and Building Construction. Central Organization for Standardization and Quality Control (COSQC): Baghdad, Iraq, 1984.
- ASTMC33/C33M-24a; Standard Specification for Concrete Aggregates. ASTM International: West Conshohocken, PA, USA, 2024; p. 7.
- ASTMC127-24; Standard Test Method for Relative Density (Specific Gravity) and Absorption of Coarse Aggregate. ASTM International: West Conshohocken, PA, USA, 2024; p. 6.
- ASTMC128/C128M; Standard Test Method for Relative Density (Specific Gravity) and Absorption of Fine Aggregate. ASTM International: West Conshohocken, PA, USA, 2022; p. 6.
- ASTMC136/C136M; Standard Test Method for Sieve Analysis of Fine and Coarse Aggregates. ASTM International: West Conshohocken, PA, USA, 2020; p. 5.
- ASTMC494/C494M-24; Standard Specification for Chemical Admixtures for Concrete. ASTM International: West Conshohocken, PA, USA, 2024; p. 15.
- Benmokrane, B.; Nazair, C.; Seynave, X.; Manalo, A. Comparison between ASTM D7205 and CSA S806 tensile-testing methods for glass fiber–reinforced polymer bars. J. Compos. Constr. 2017, 21, 04017038. [Google Scholar] [CrossRef]
- ACI 363R-10; Report on High-Strength Concrete. American Concrete Institute: Farmington Hills, MI, USA, 2010.
- Ashour, S.A.; Hasanain, G.S.; Wafa, F.F. Shear behavior of high-strength fiber reinforced concrete beams. Struct. J. 1992, 89, 176–184. [Google Scholar]
- Kong, P.Y. Shear Strength of High Performance Concrete Beams; Curtin University: Bentley, Australia, 1996. [Google Scholar]
- Pendyala, R.S.; Mendis, P. Experimental study on shear strength of high-strength concrete beams. Struct. J. 2000, 97, 564–571. [Google Scholar]
- Liu, H.-X.; Yang, J.-W.; Wang, X.-Z.; Han, D.-J. Experimental study on shear behavior of BFRP-reinforced recycled aggregate concrete deep beams without stirrups. KSCE J. Civ. Eng. 2017, 21, 2289–2299. [Google Scholar] [CrossRef]
- Hasan, A.Q. Structural behavior of concrete flange continuous deep beams with carbon fiber reinforced polymer (CFRP). Dimension 2018, 9, 17–23. [Google Scholar]
- Rahal, K.; Alrefaei, Y. Shear strength of recycled aggregate concrete beams containing stirrups. Constr. Build. Mater. 2018, 191, 866–876. [Google Scholar] [CrossRef]
- Arezoumandi, M.; Smith, A.; Volz, J.S.; Khayat, K.H. An experimental study on shear strength of reinforced concrete beams with 100% recycled concrete aggregate. Constr. Build. Mater. 2014, 53, 612–620. [Google Scholar] [CrossRef]
- Wang, H.; Belarbi, A. Ductility characteristics of fiber-reinforced-concrete beams reinforced with FRP rebars. Constr. Build. Mater. 2011, 25, 2391–2401. [Google Scholar] [CrossRef]
- Naaman, A.; Jeong, M. 45 Structural ductility of concrete beams prestressed with FRP tendons. In Non-Metallic (FRP) Reinforcement for Concrete Structures: Proceedings of the Second International RILEM Symposium, Ghent, Belgium, 23–25 August 1995; CRC Press: Boca Raton, FL, USA, 1995. [Google Scholar]
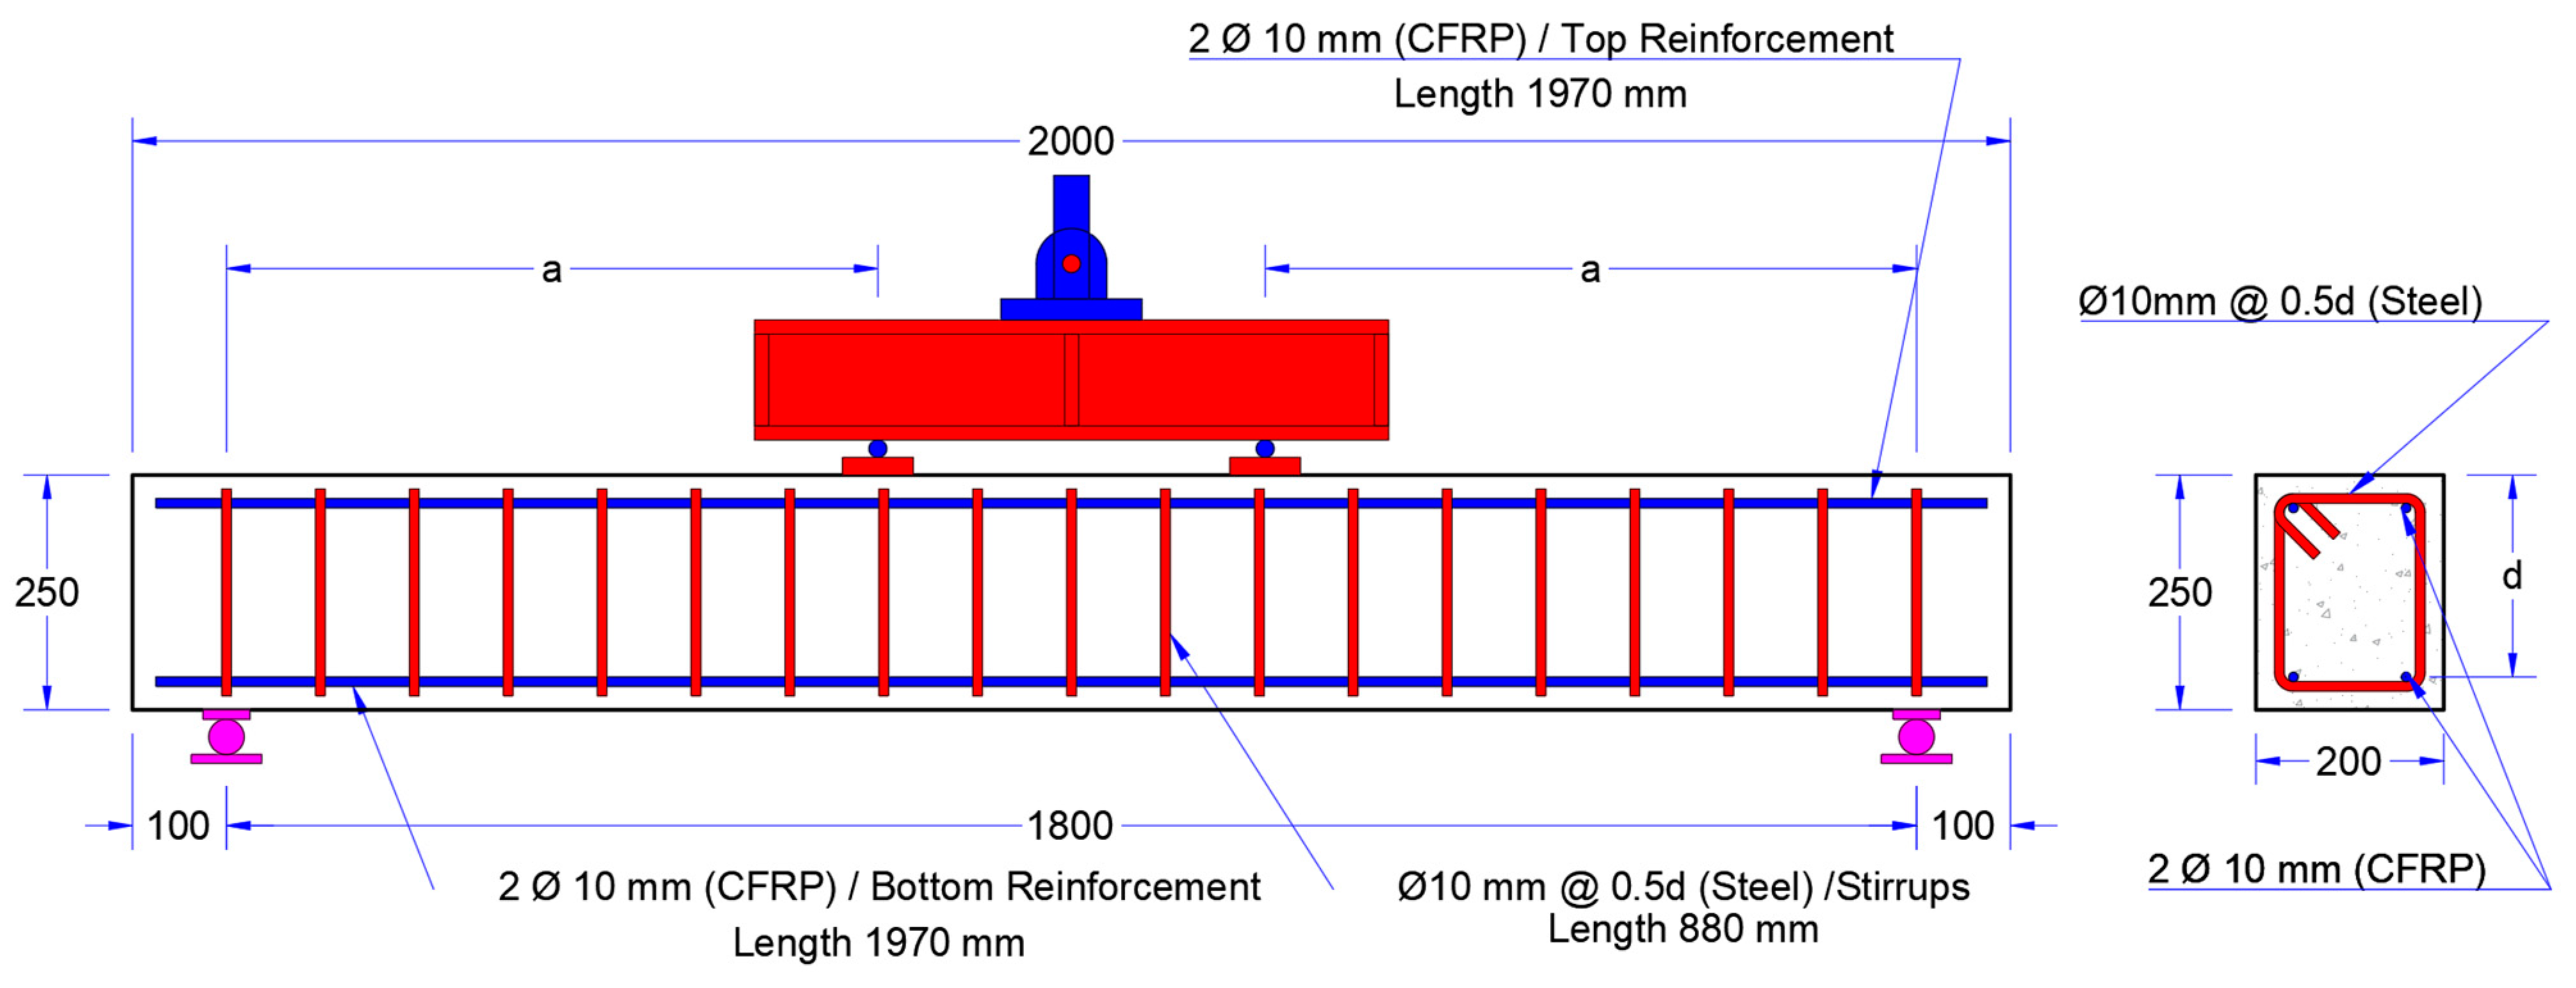
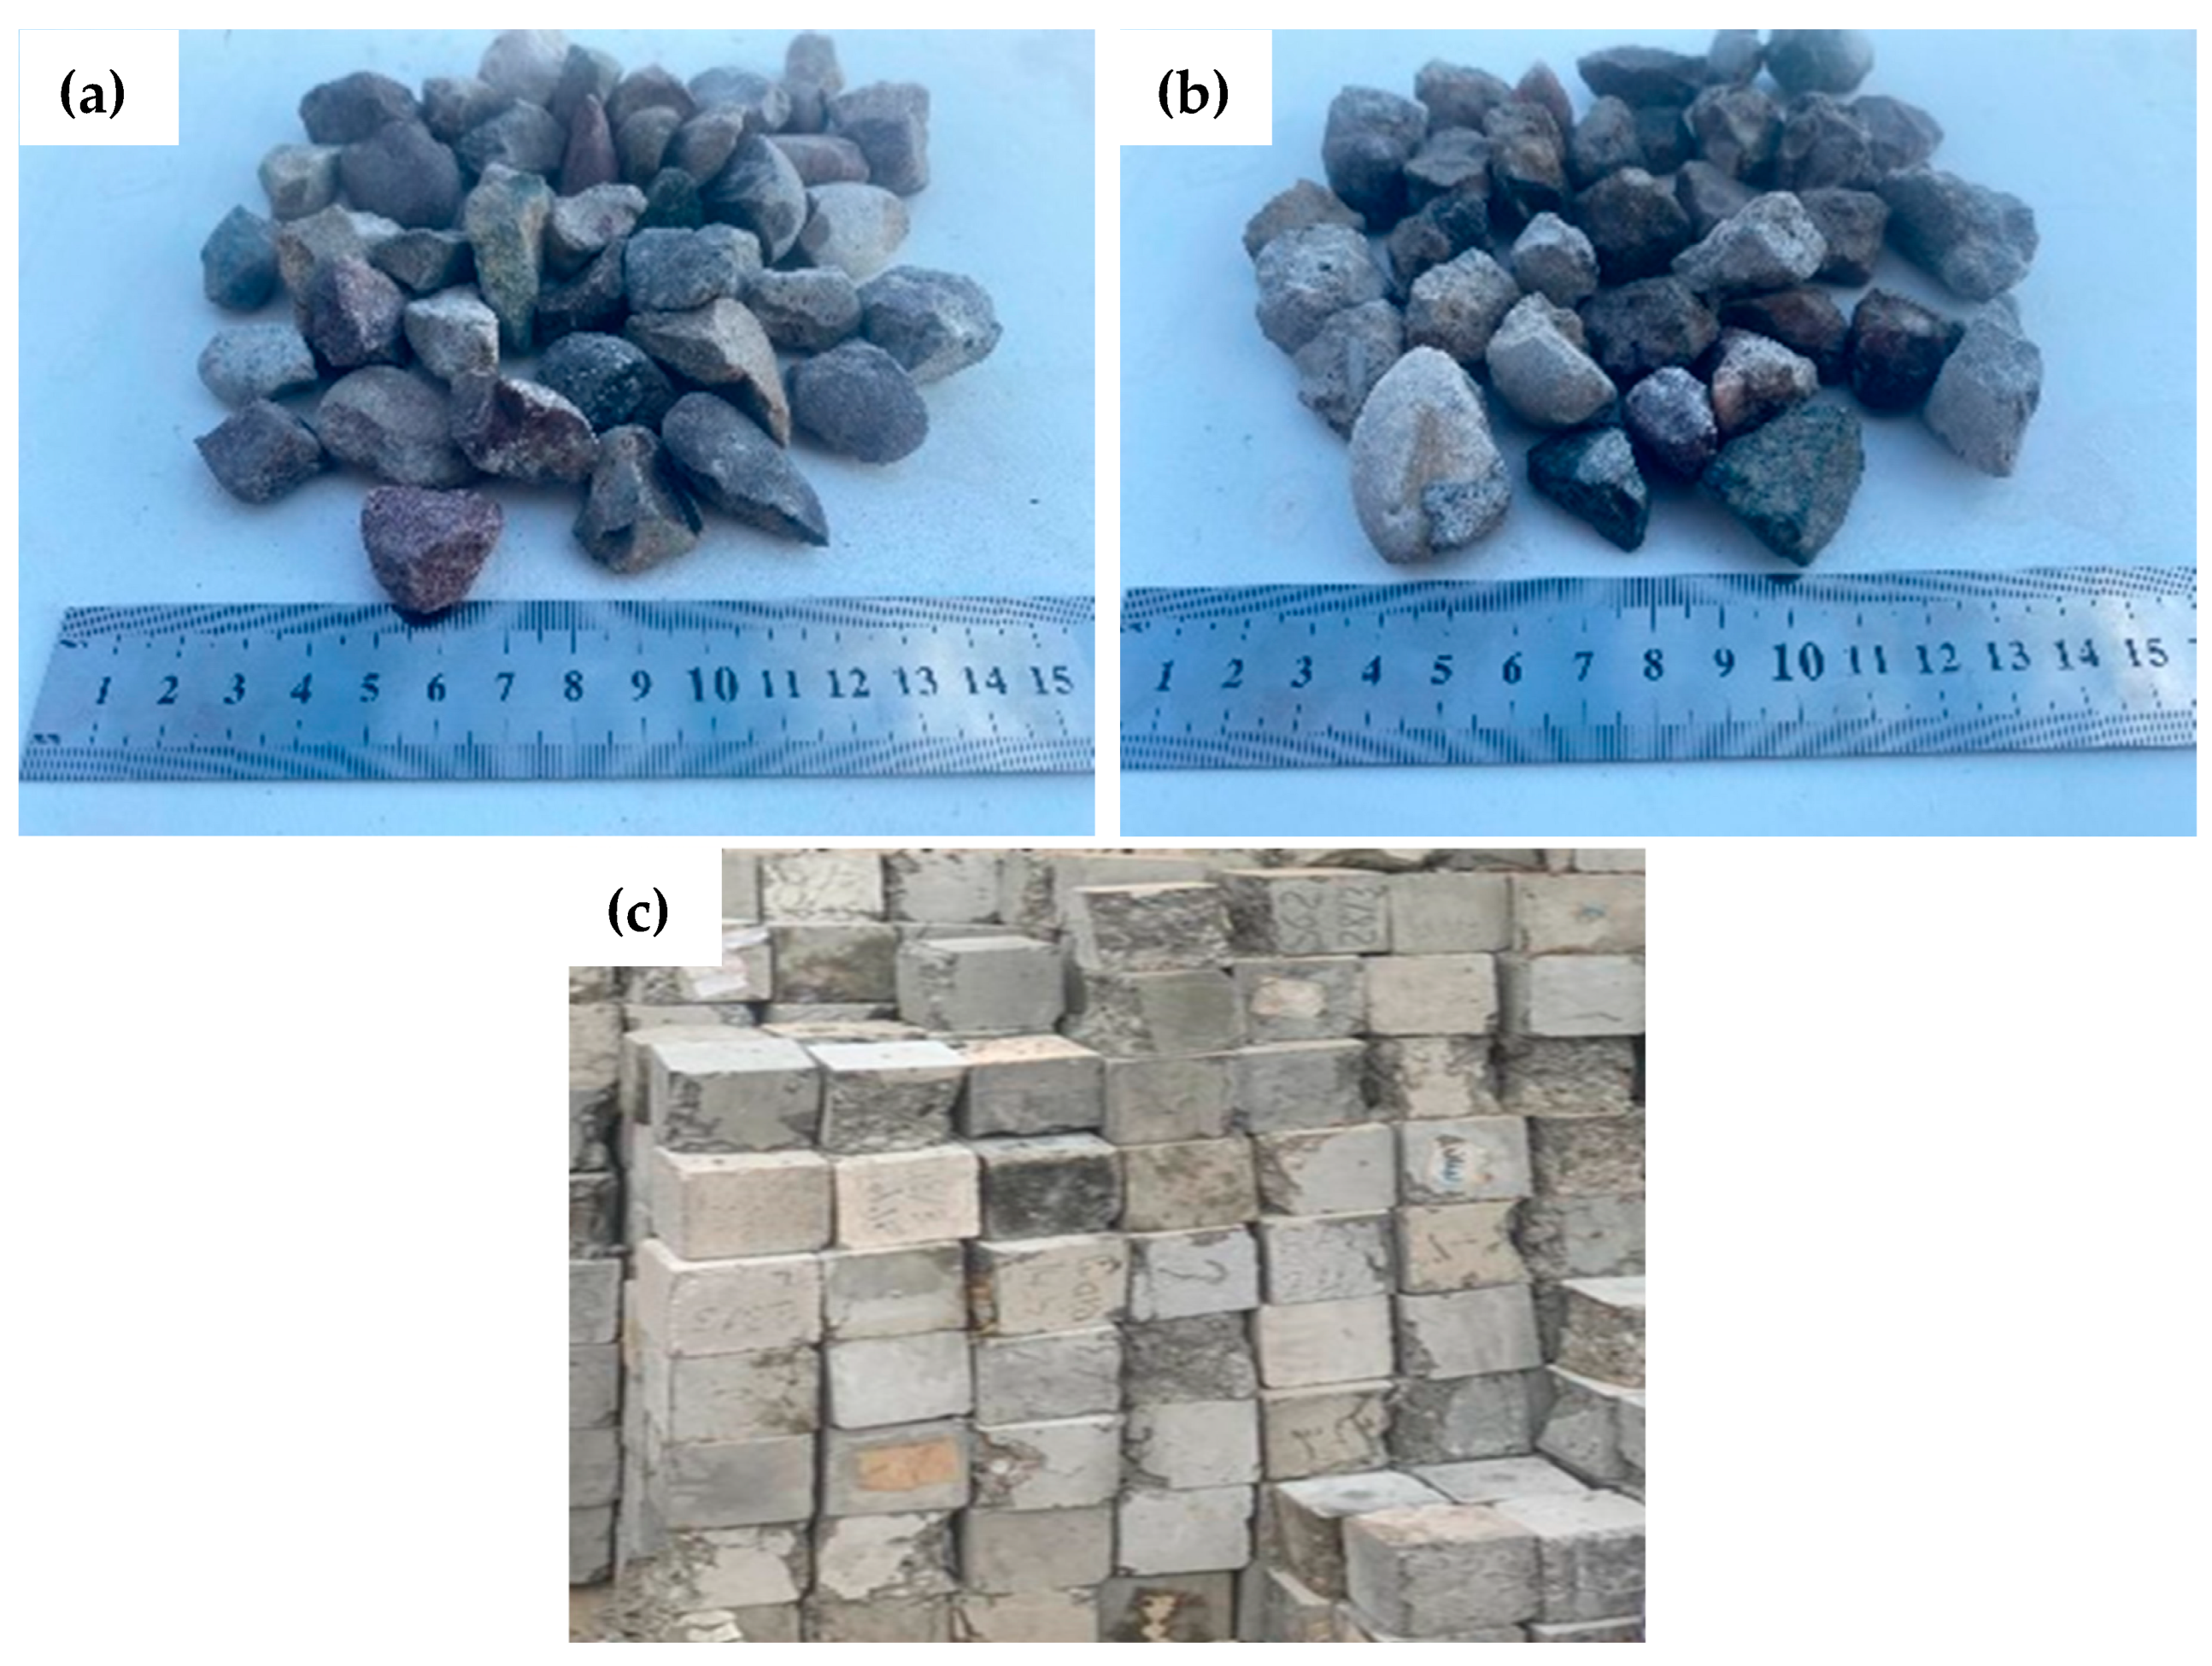
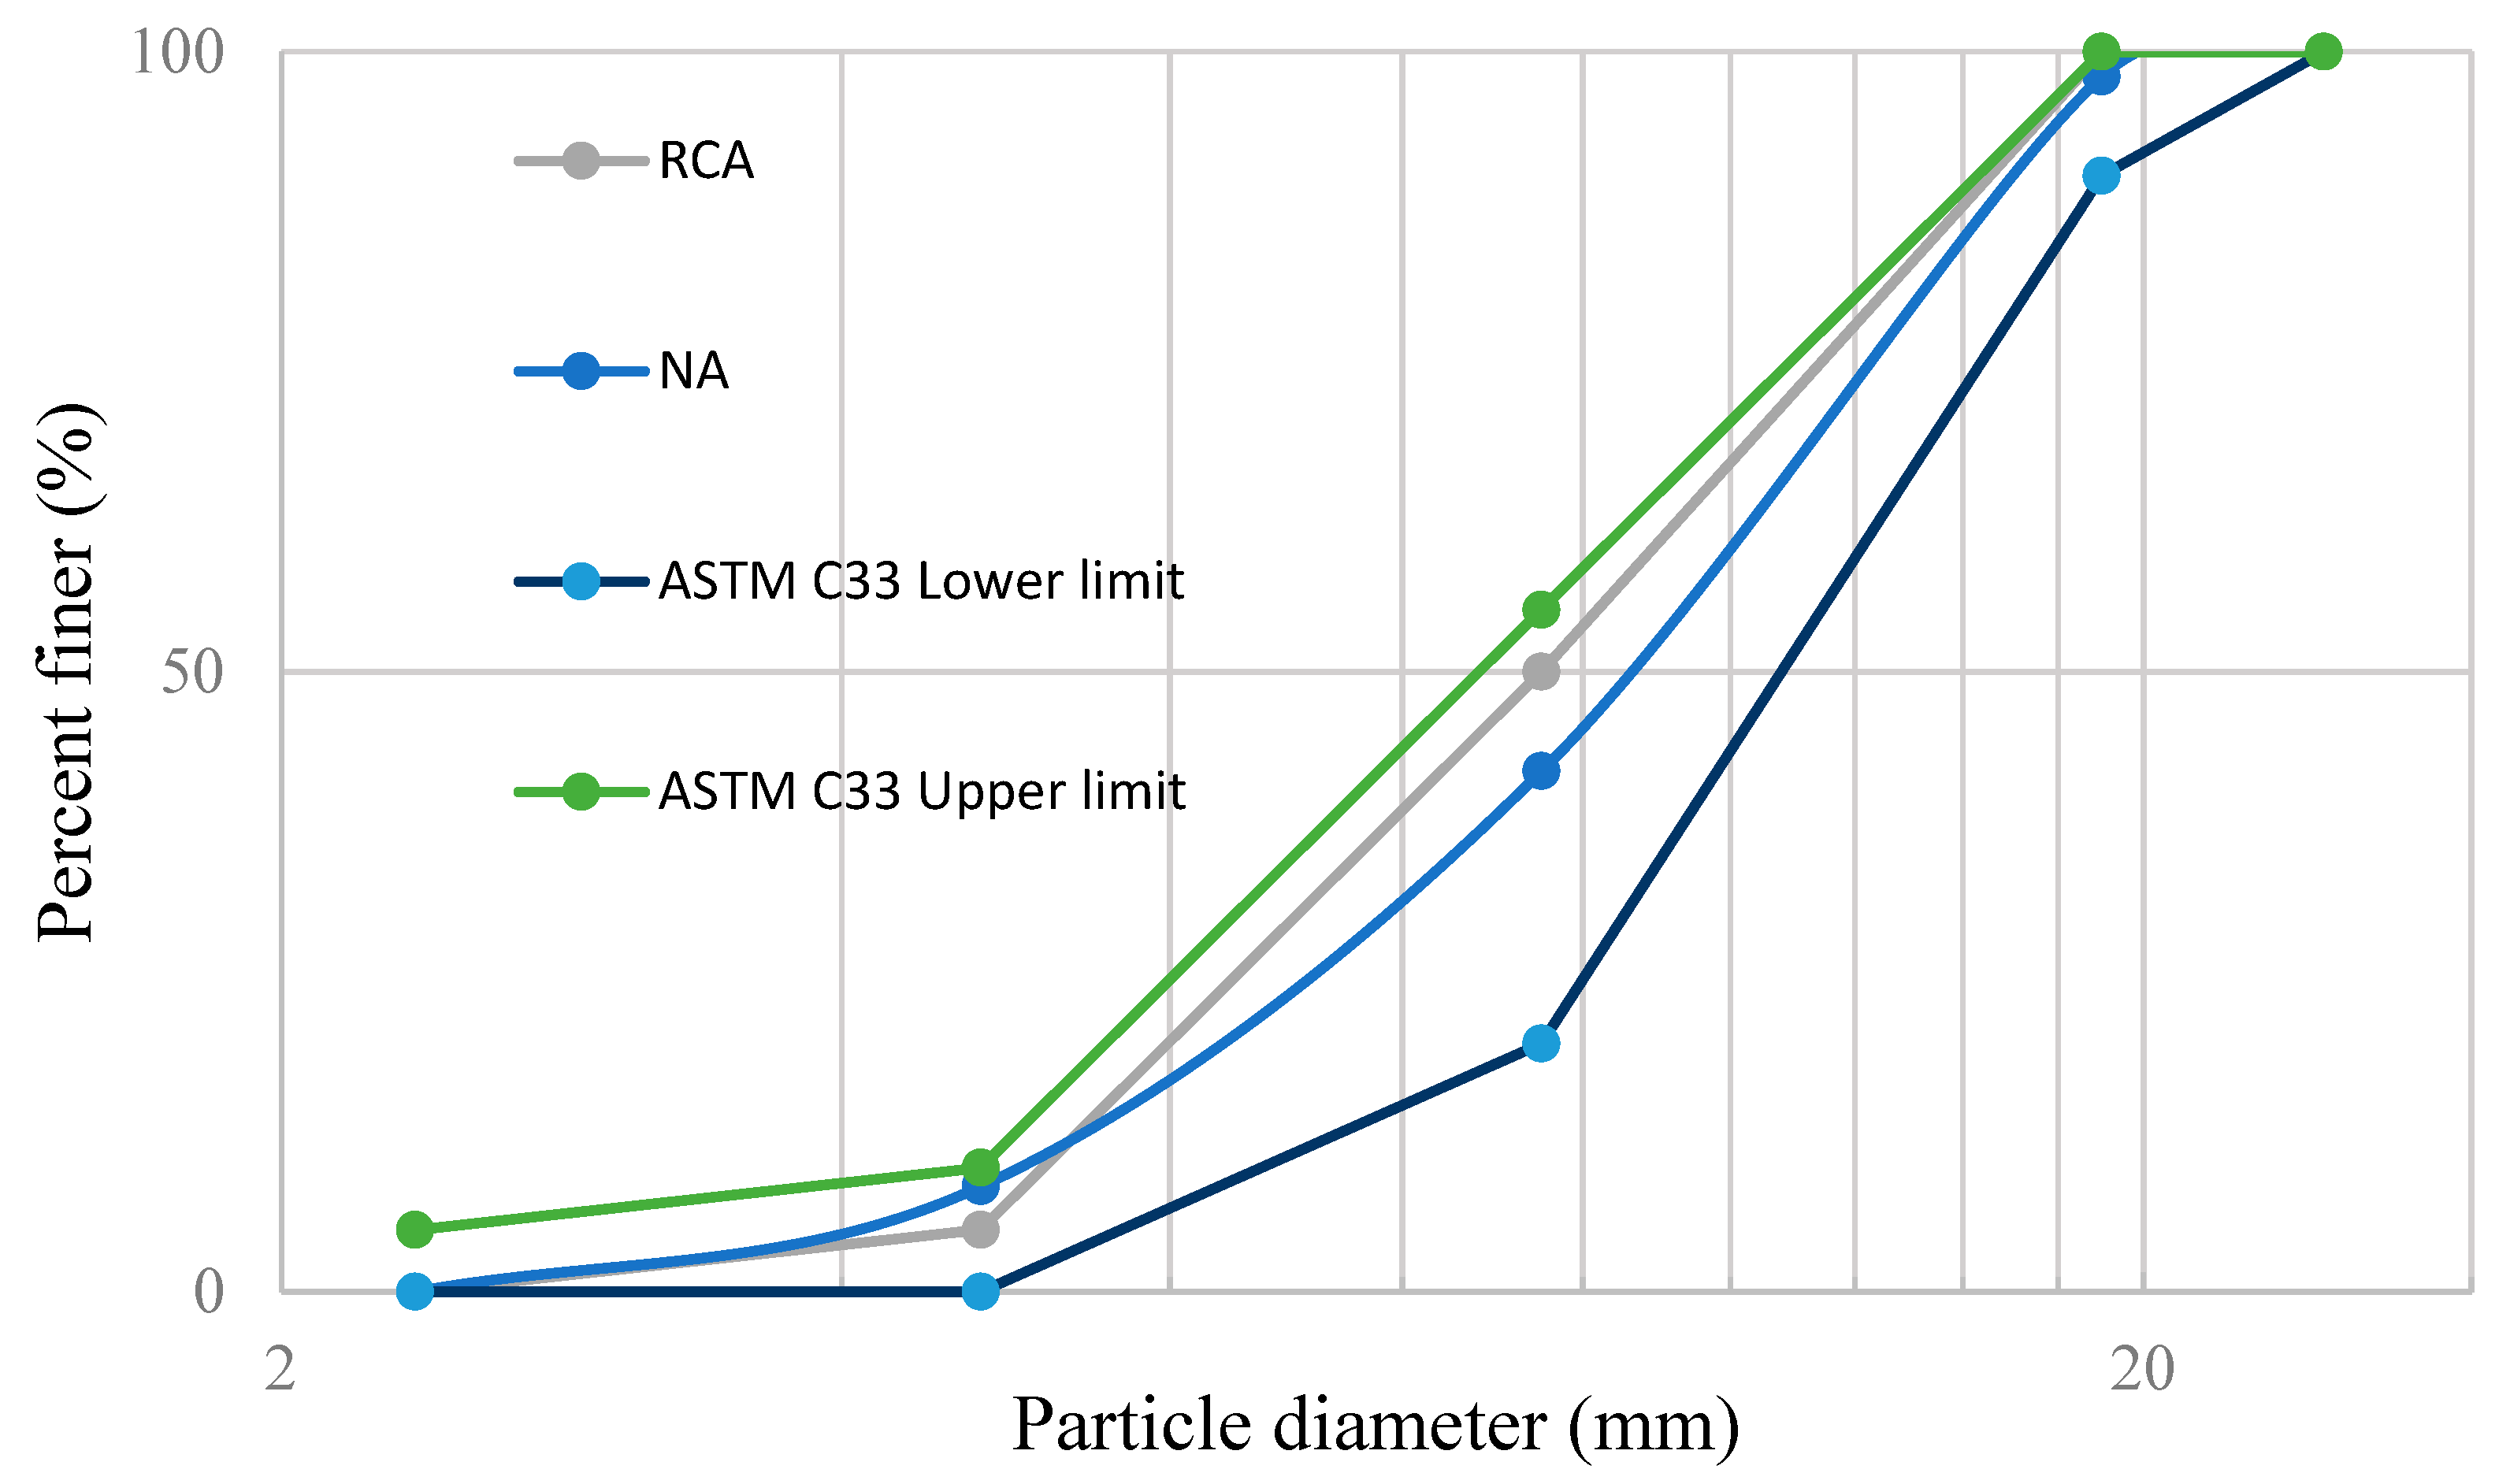
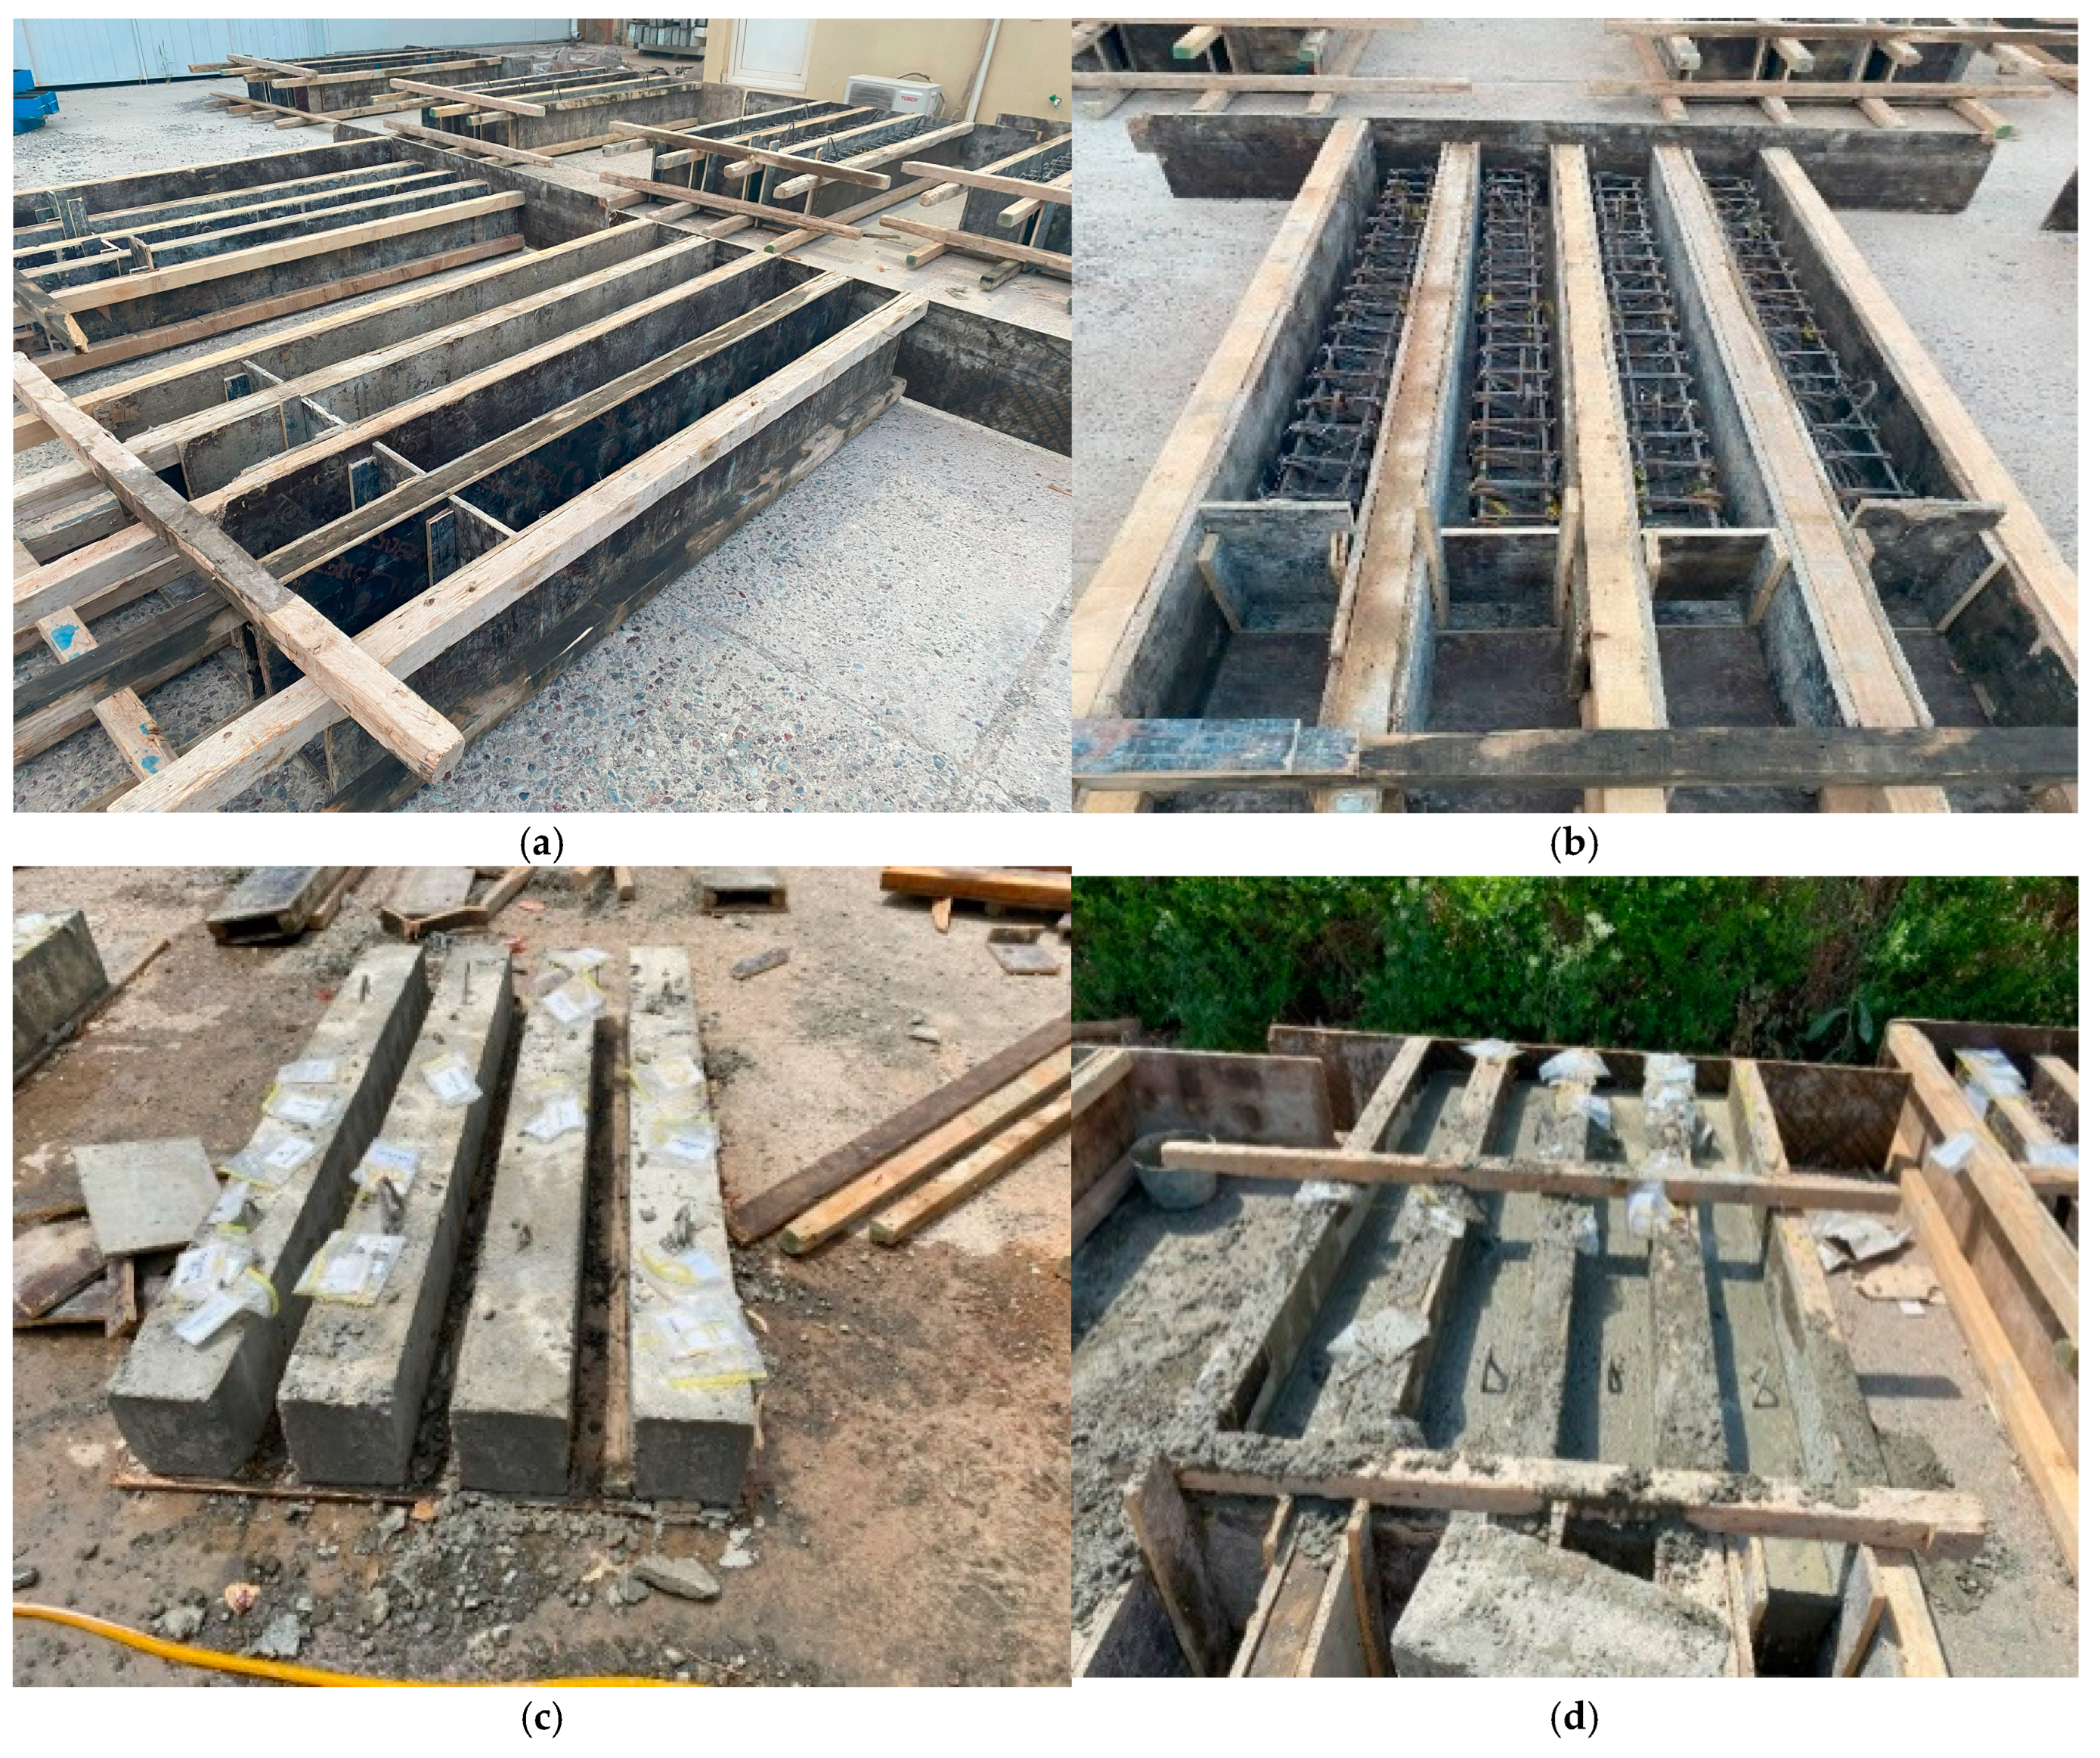
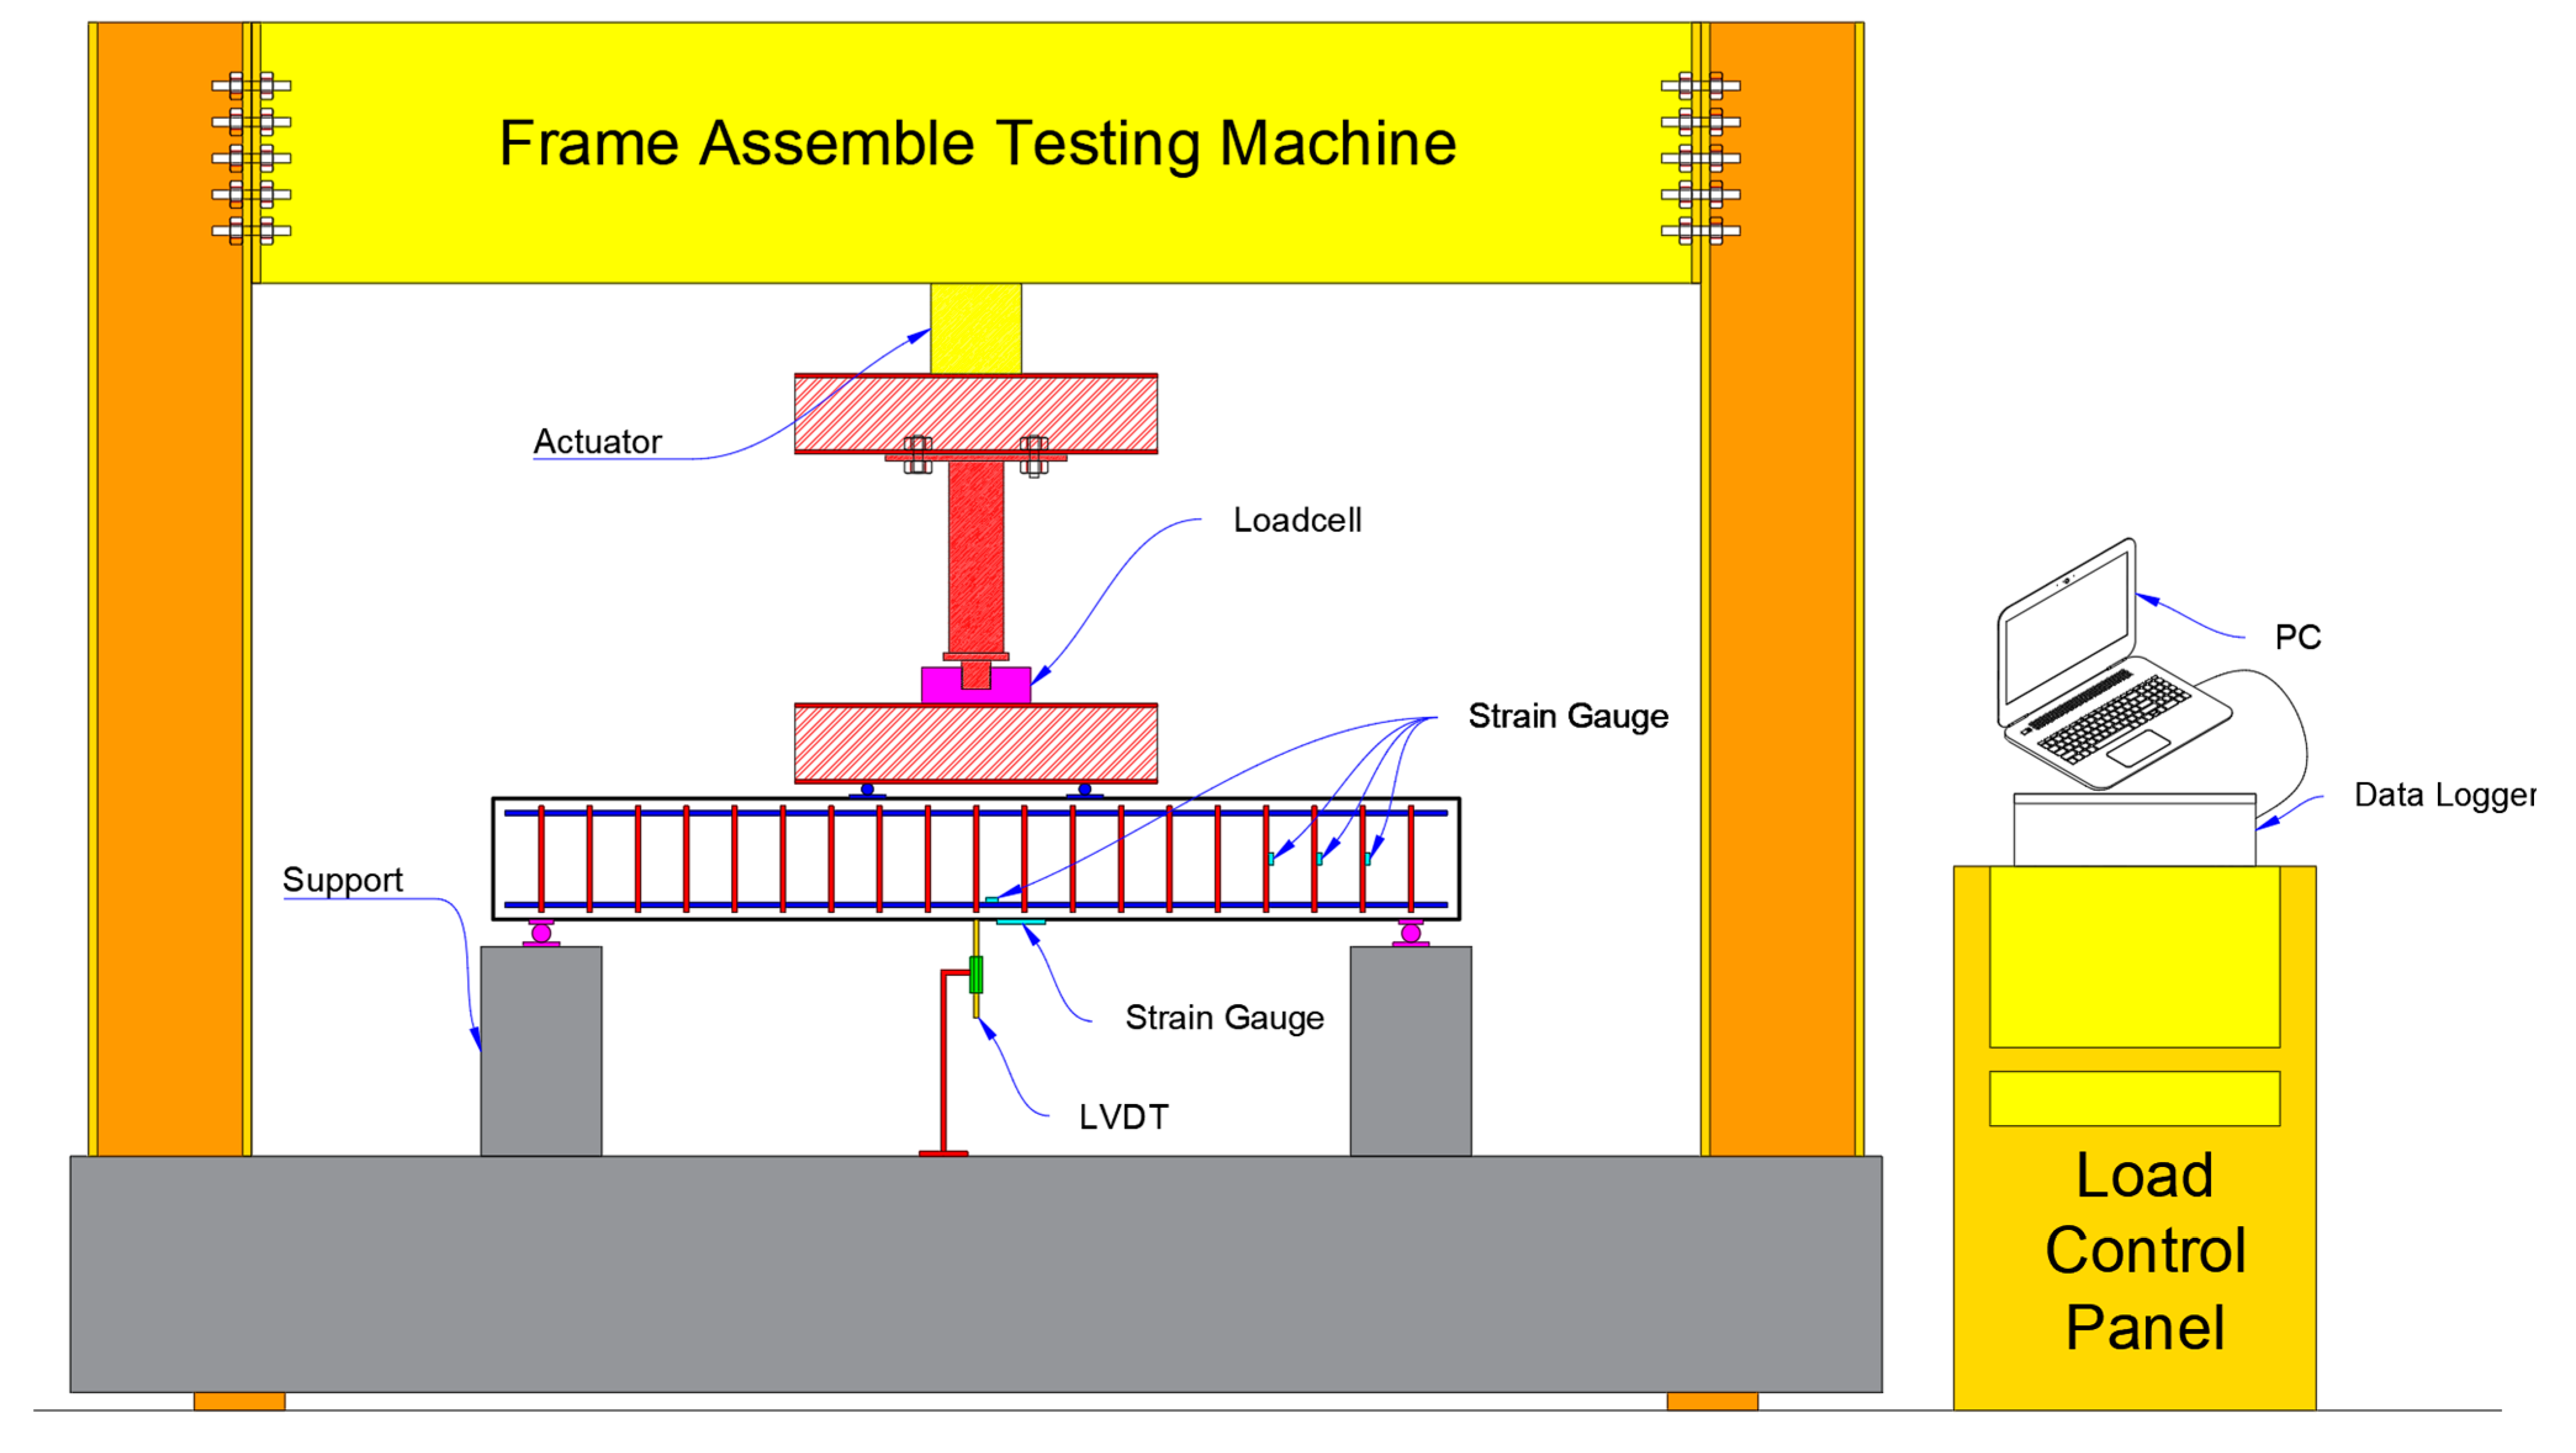

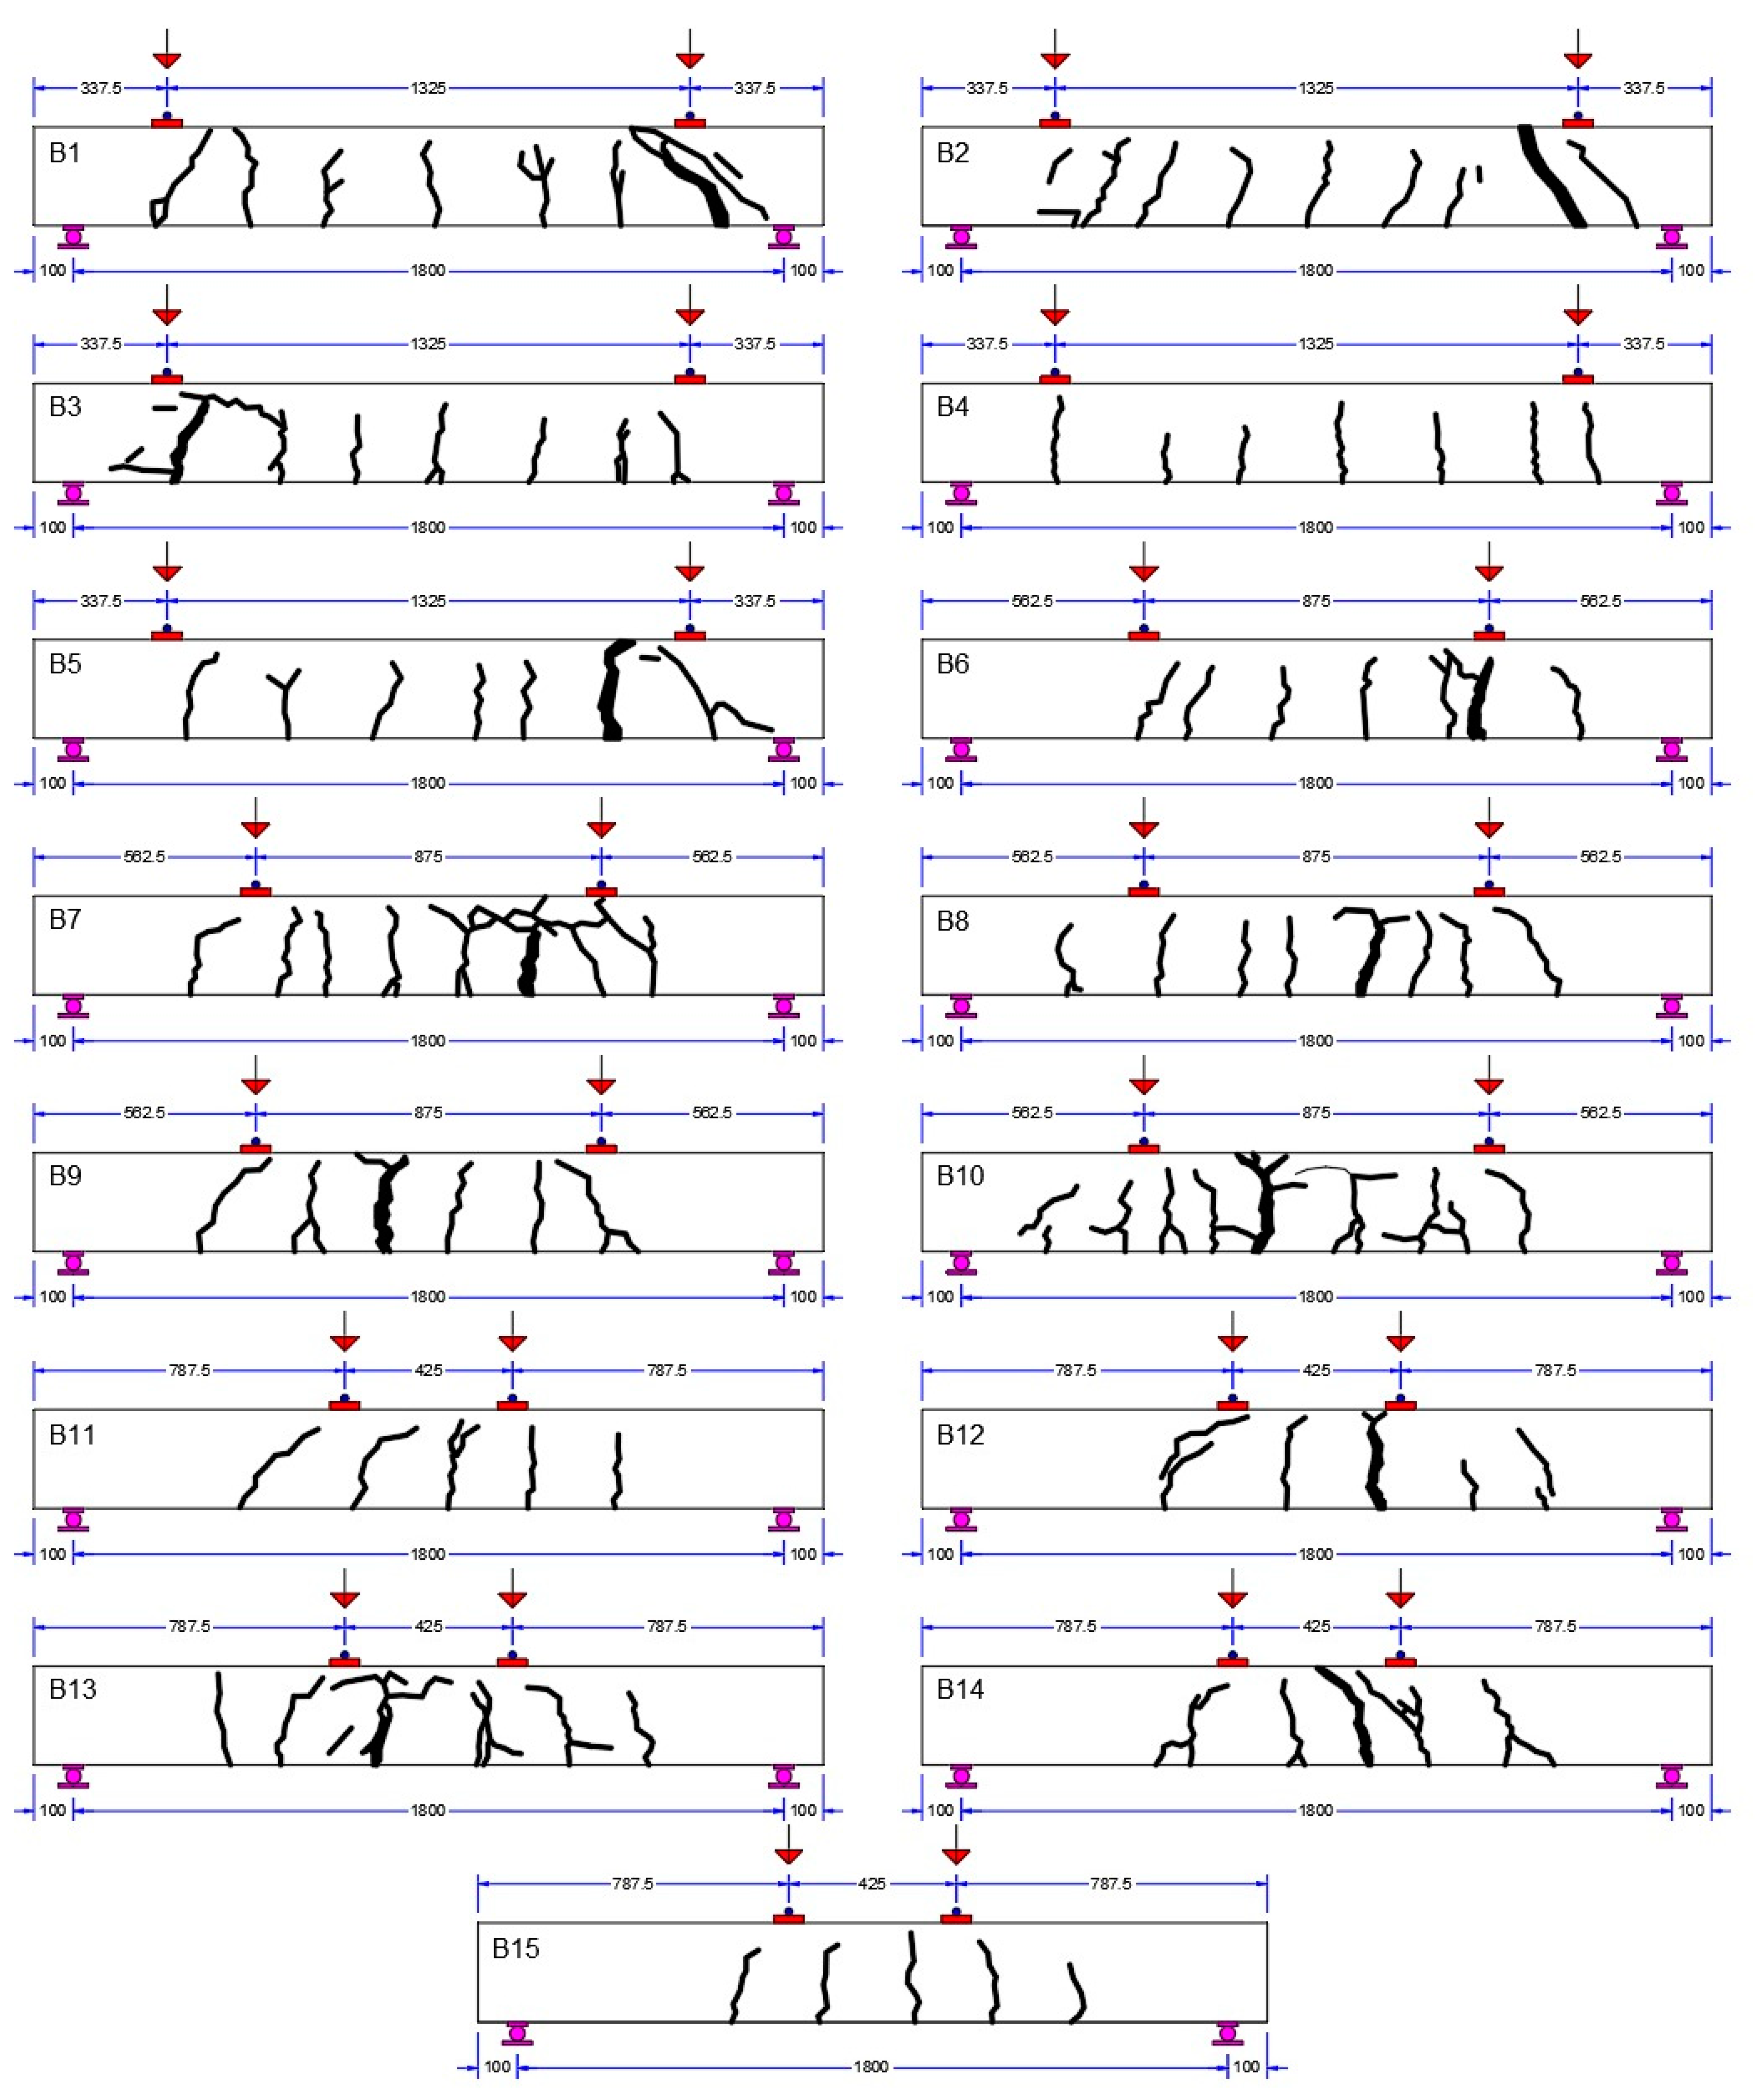
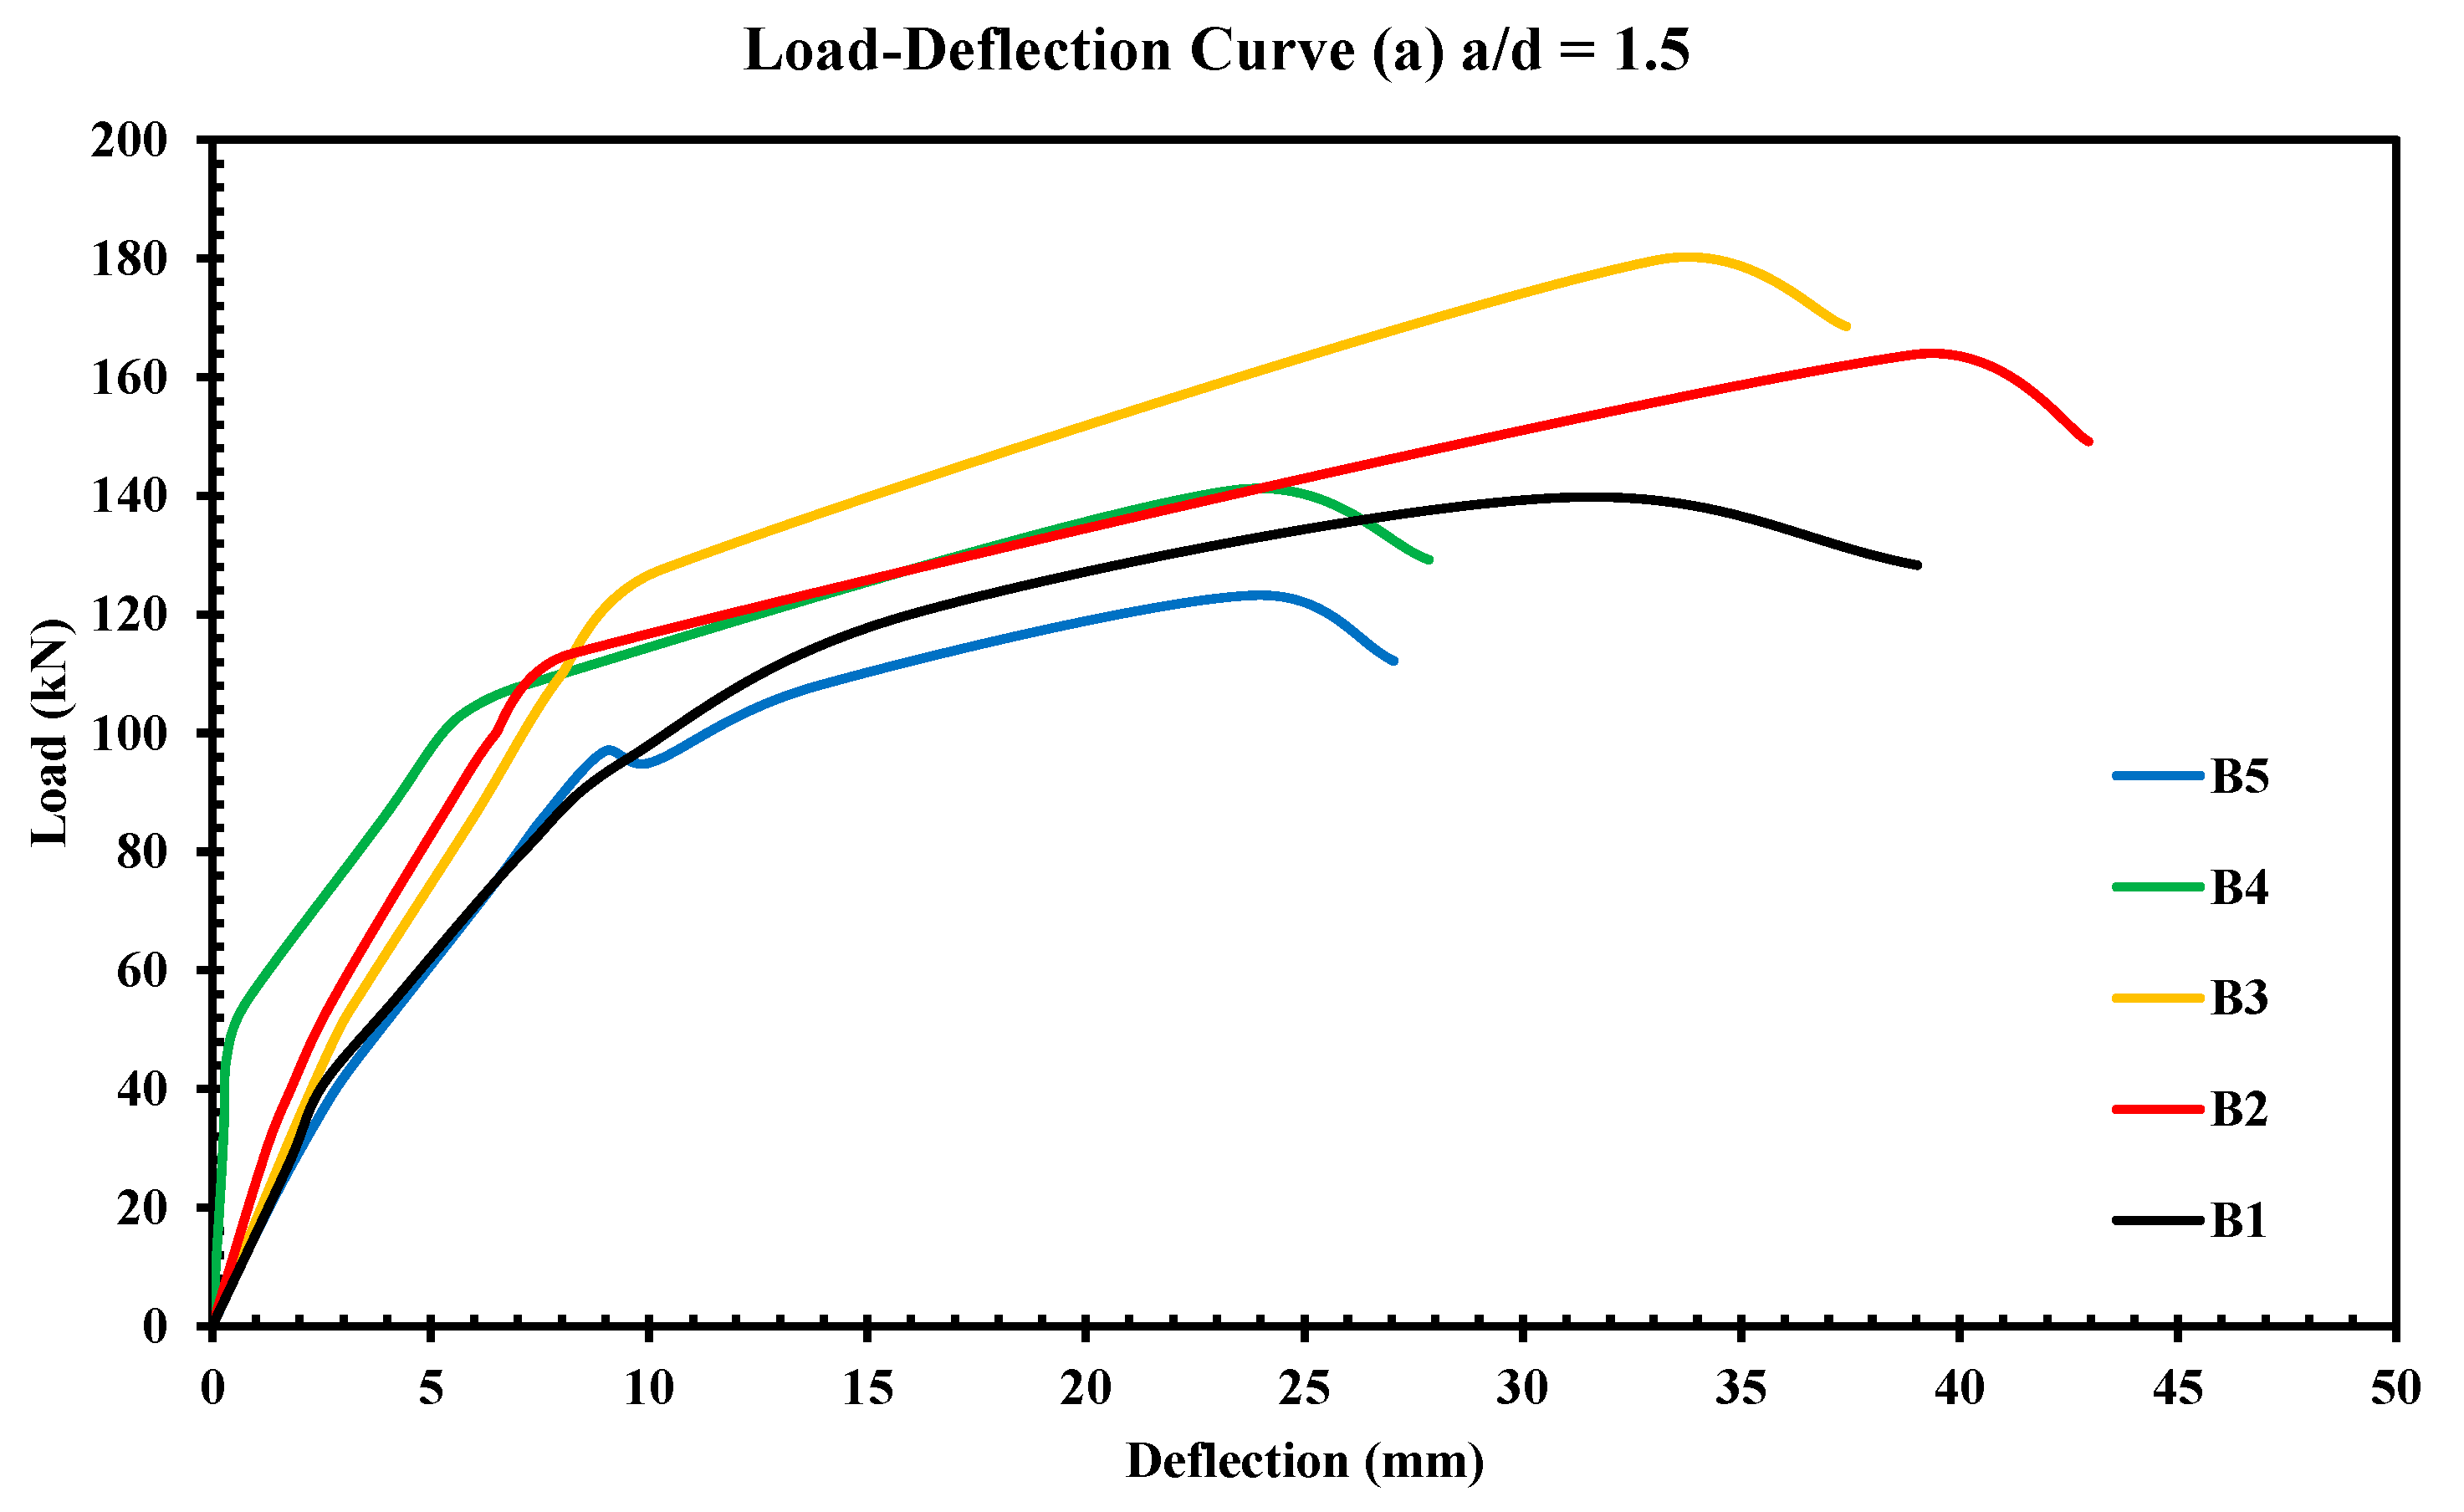
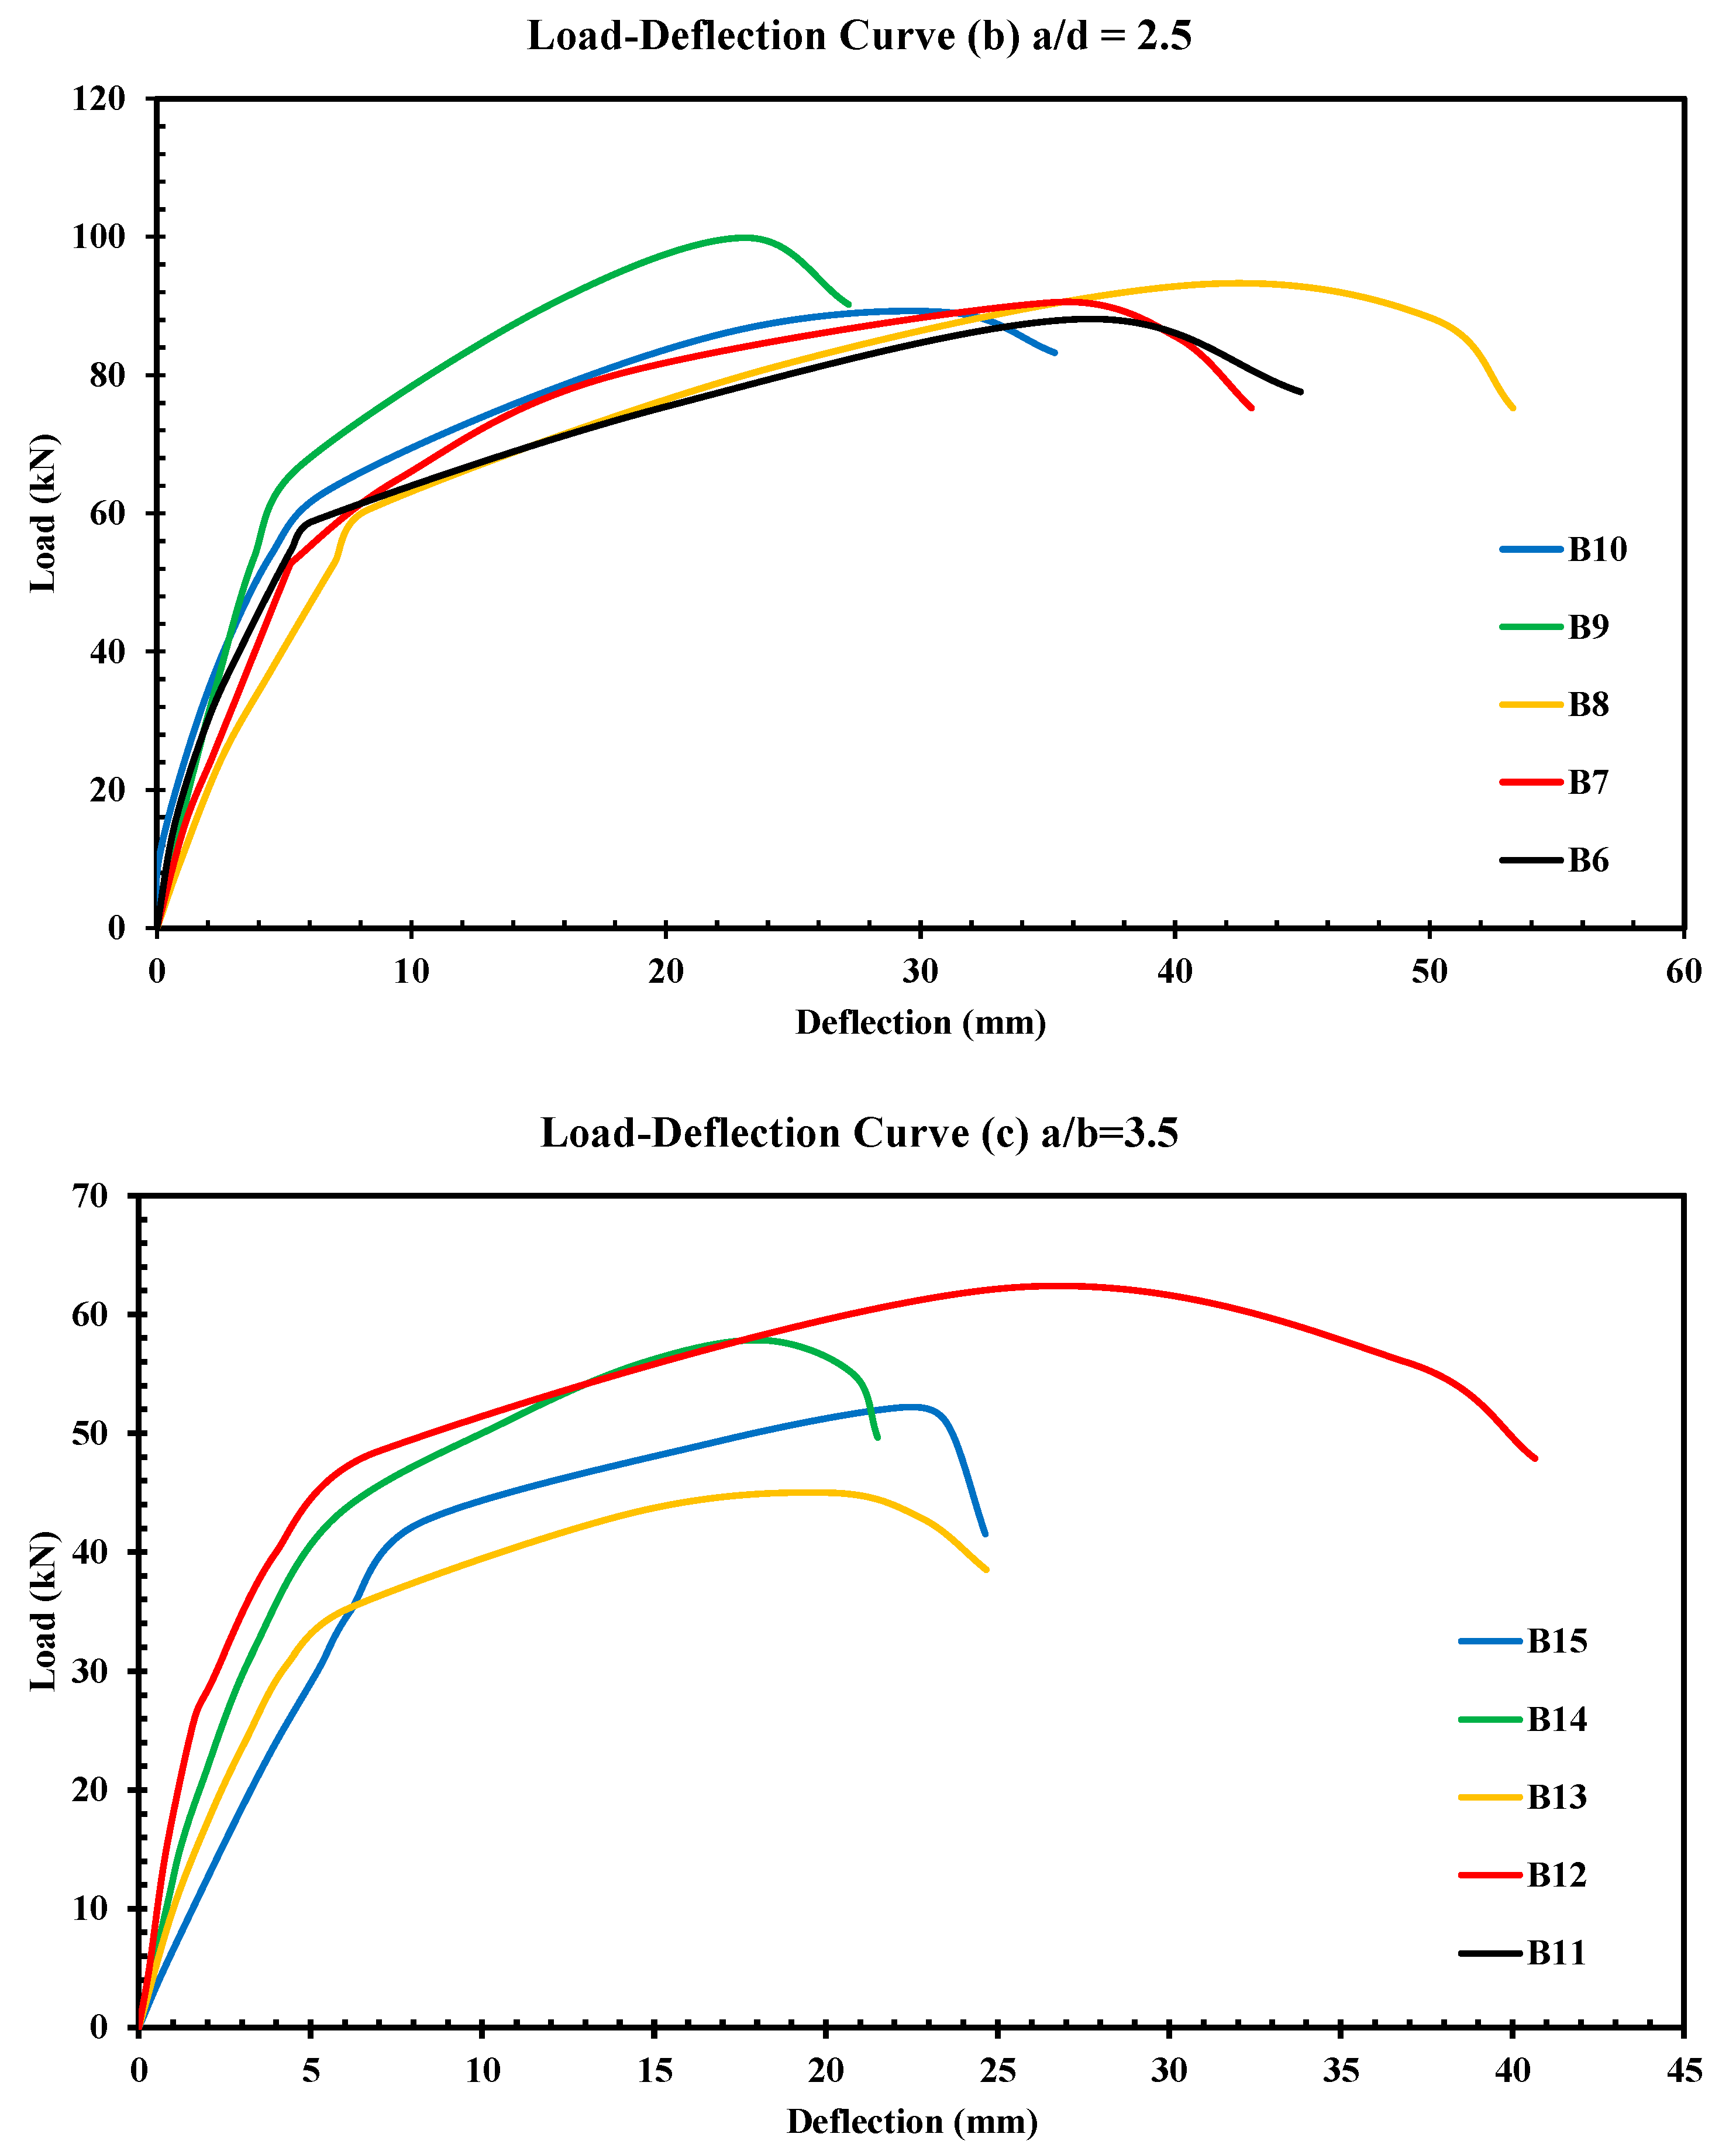
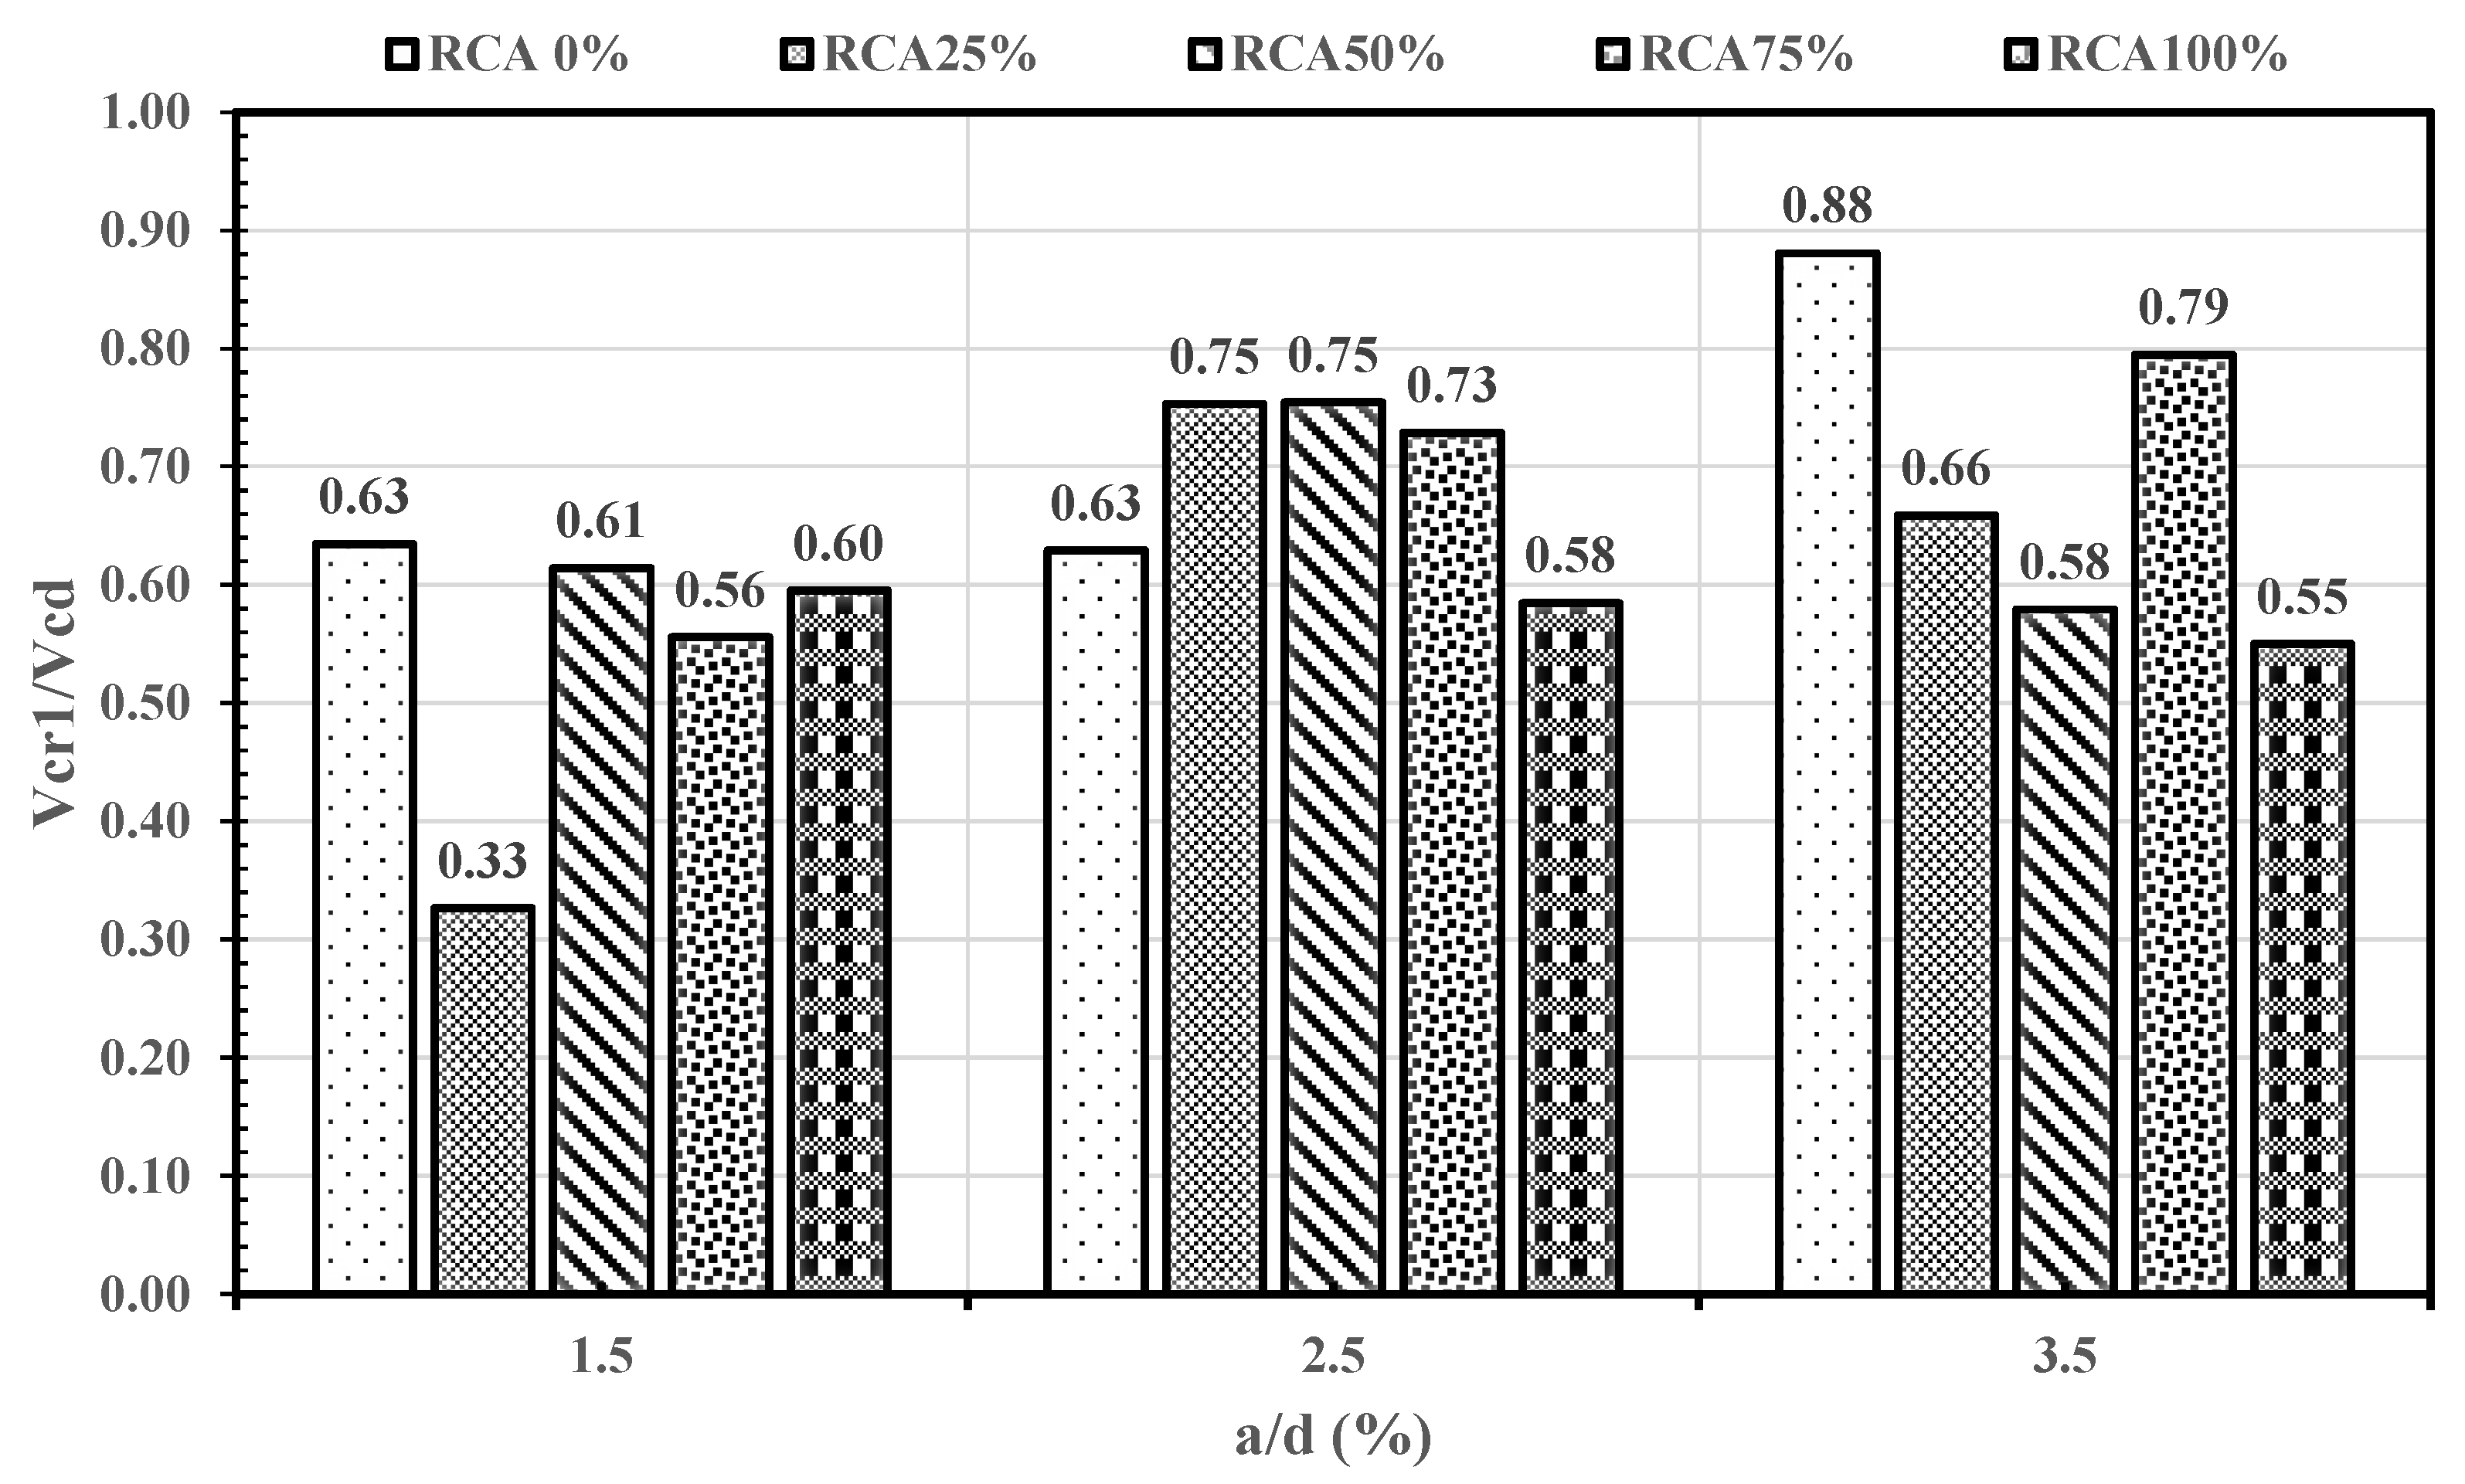

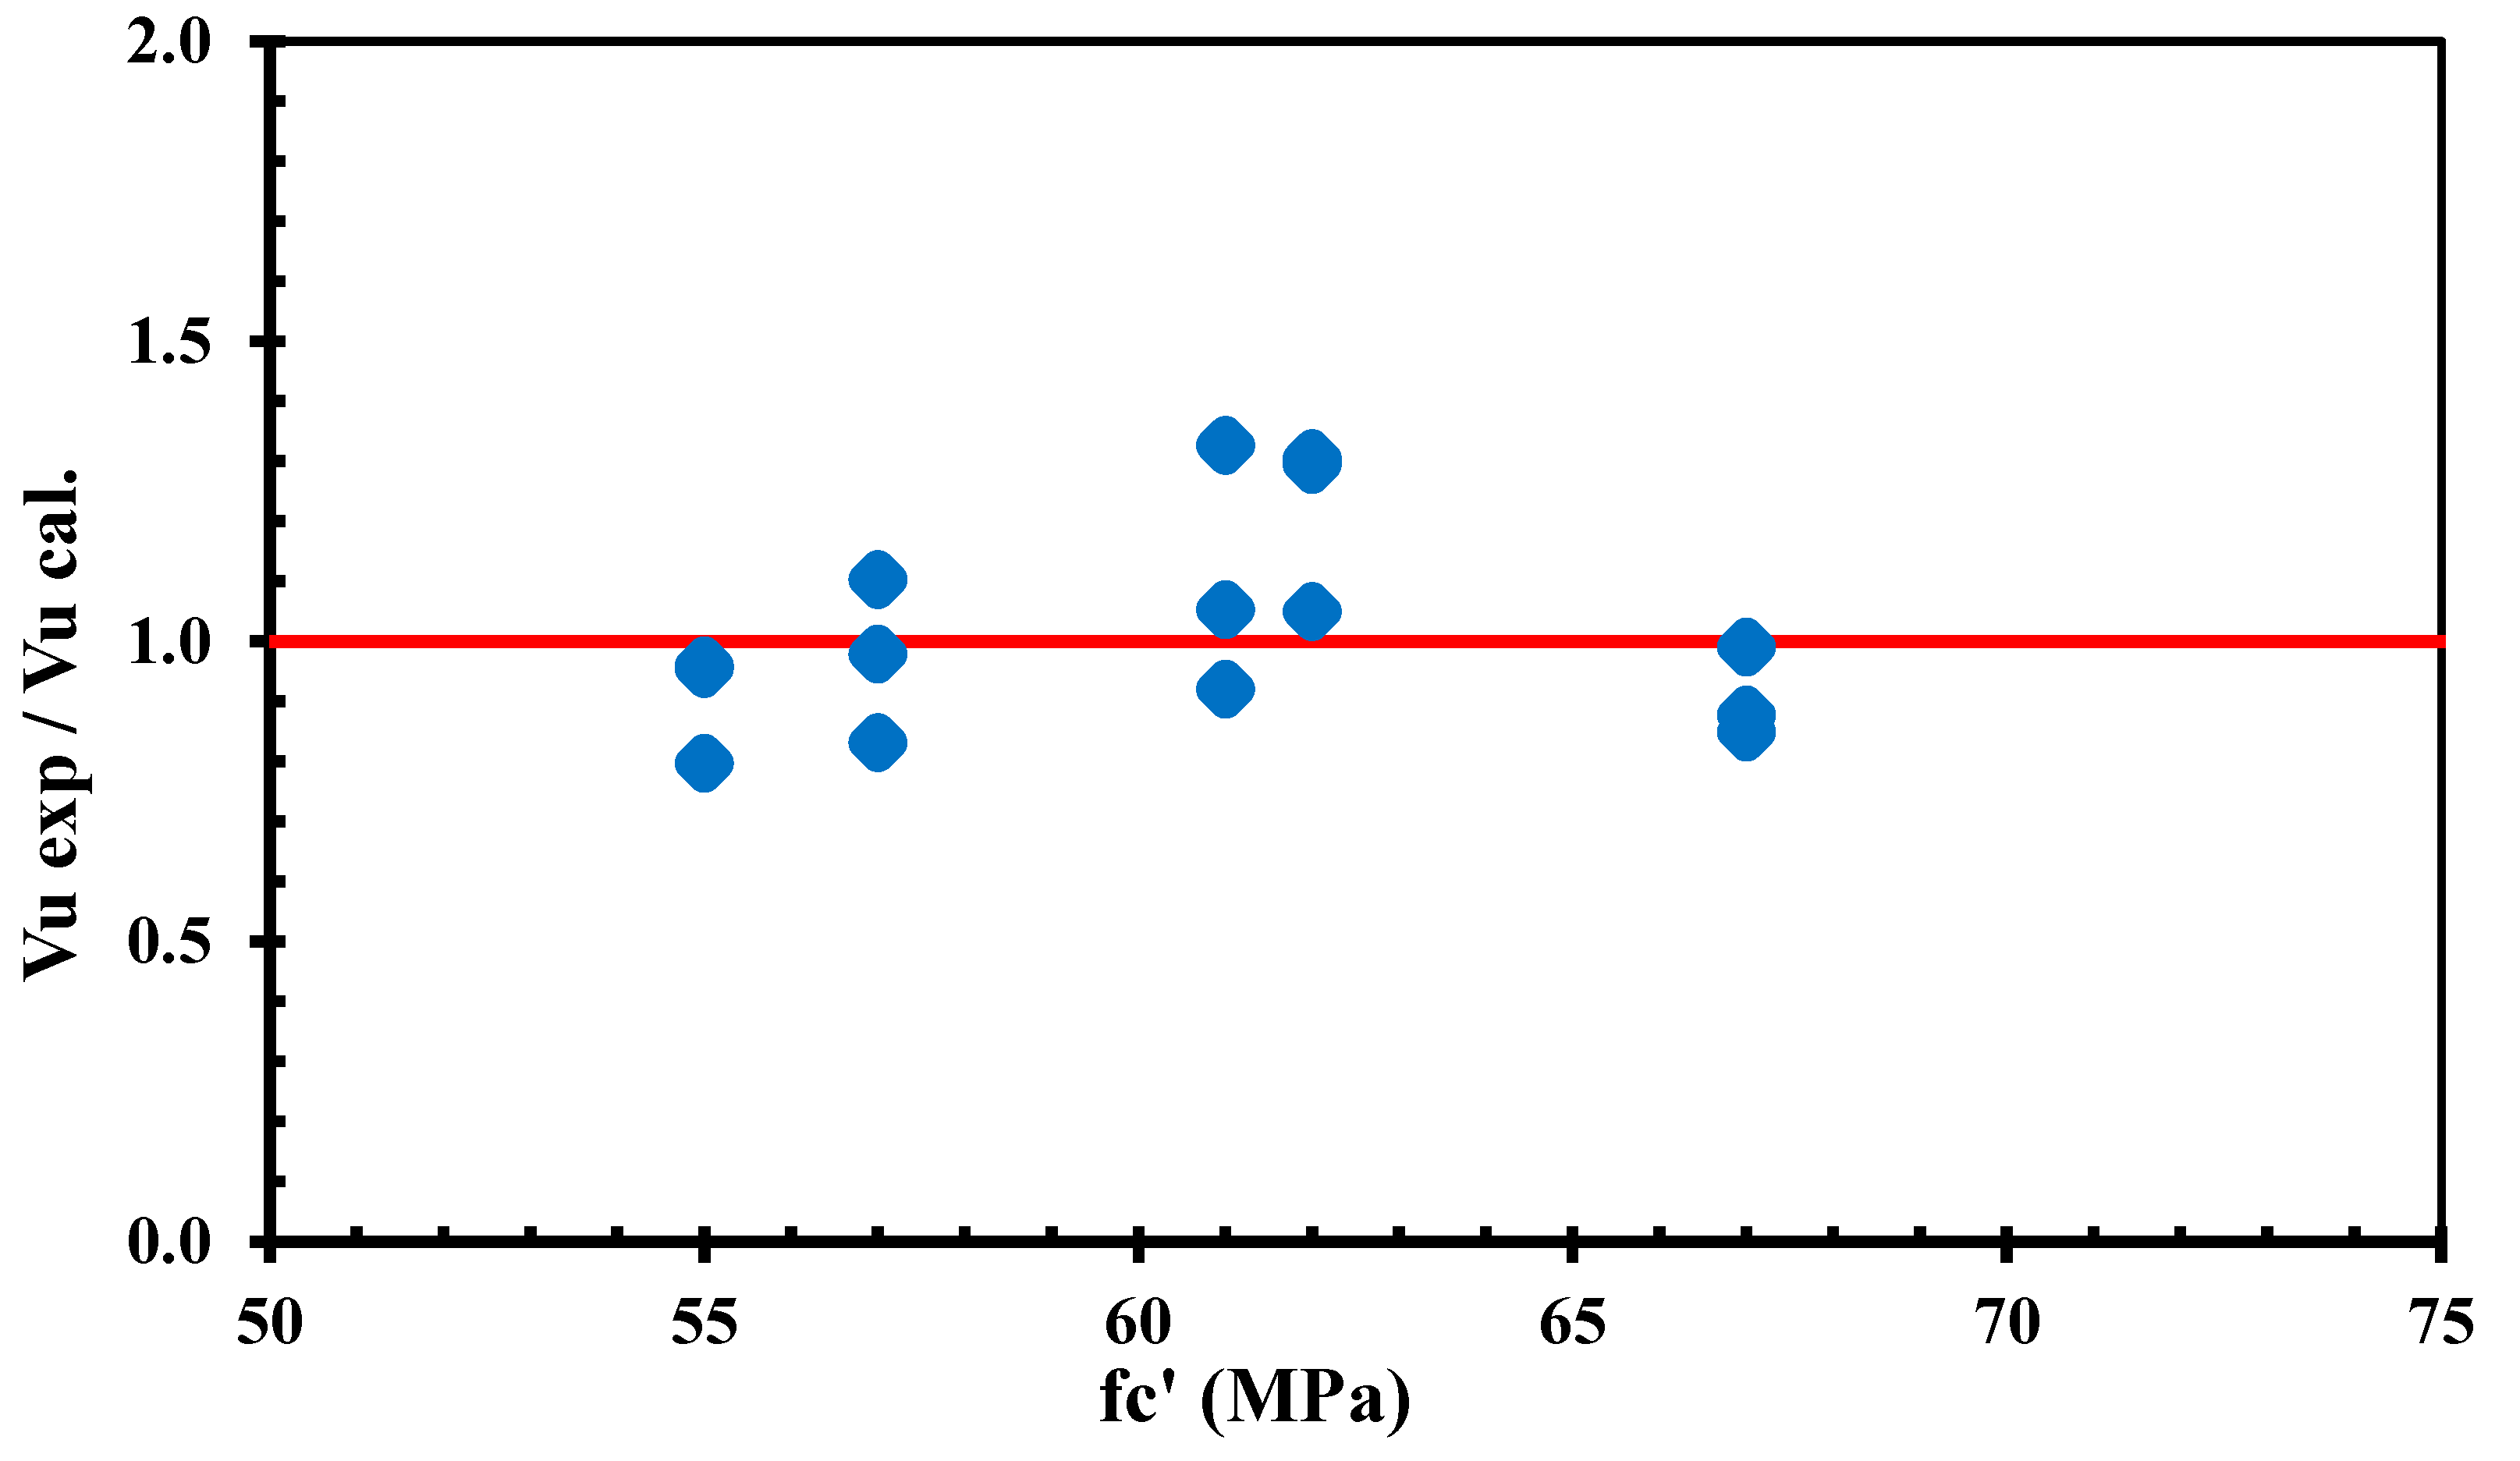
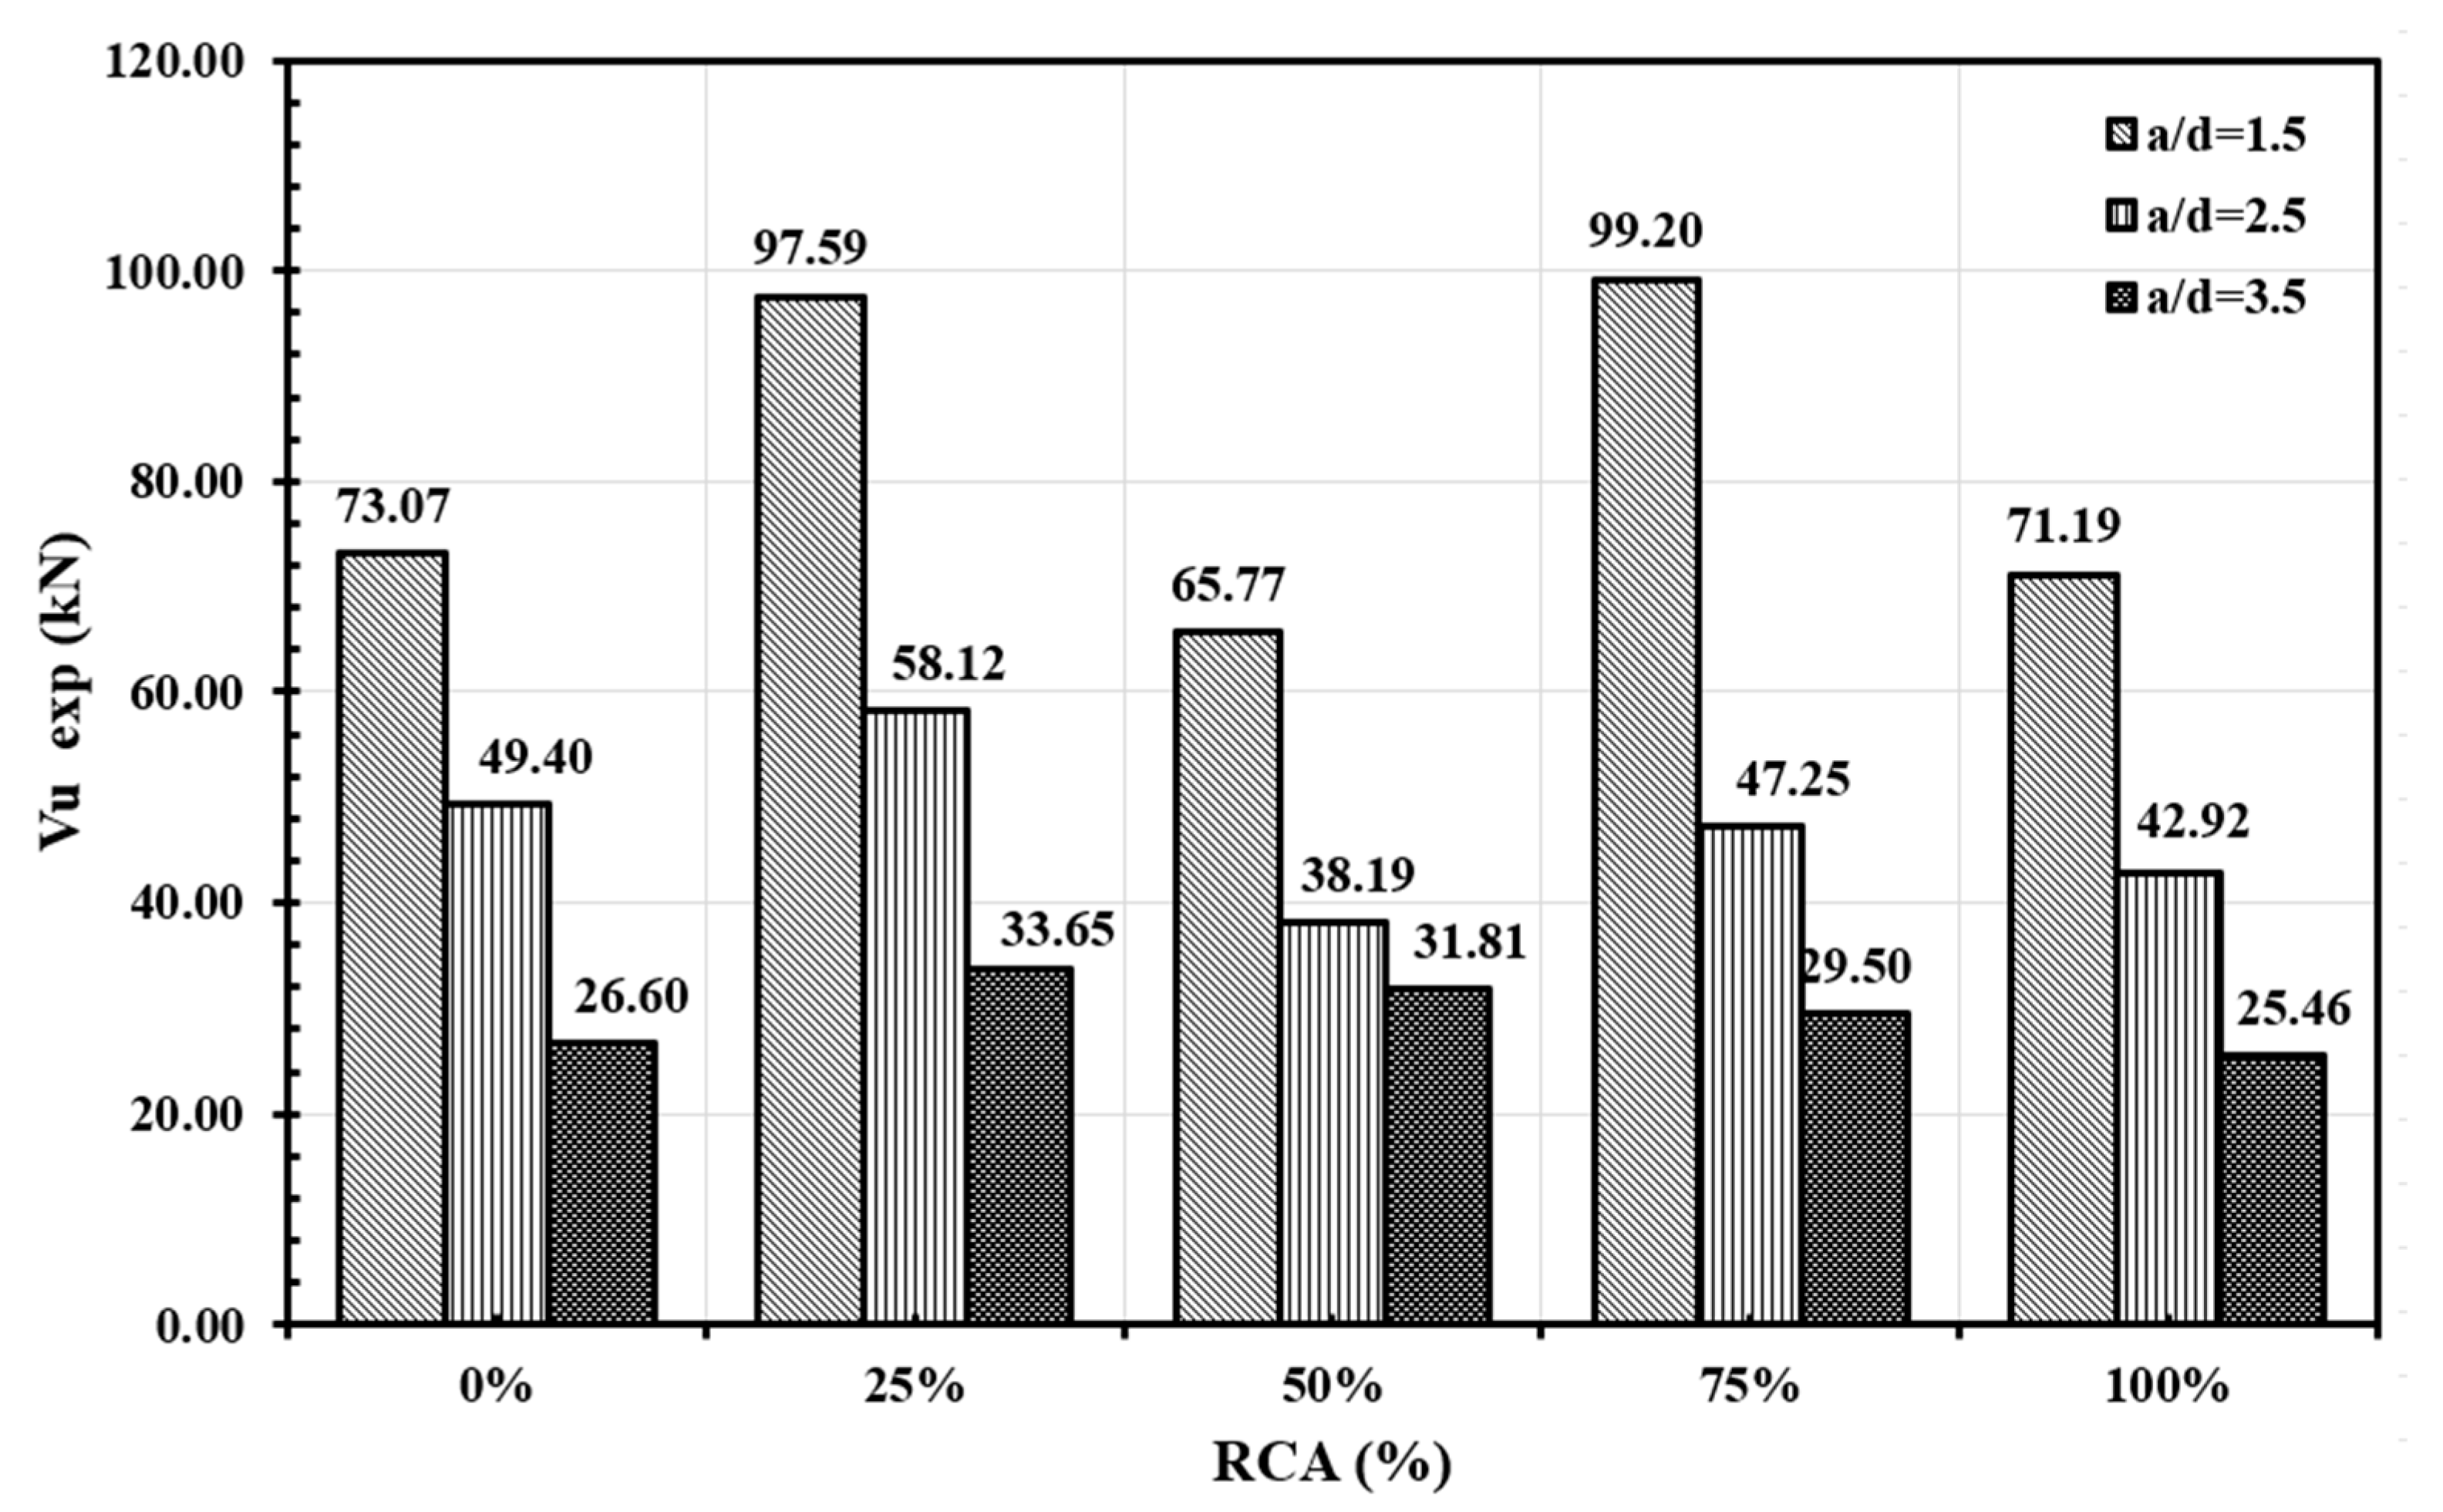

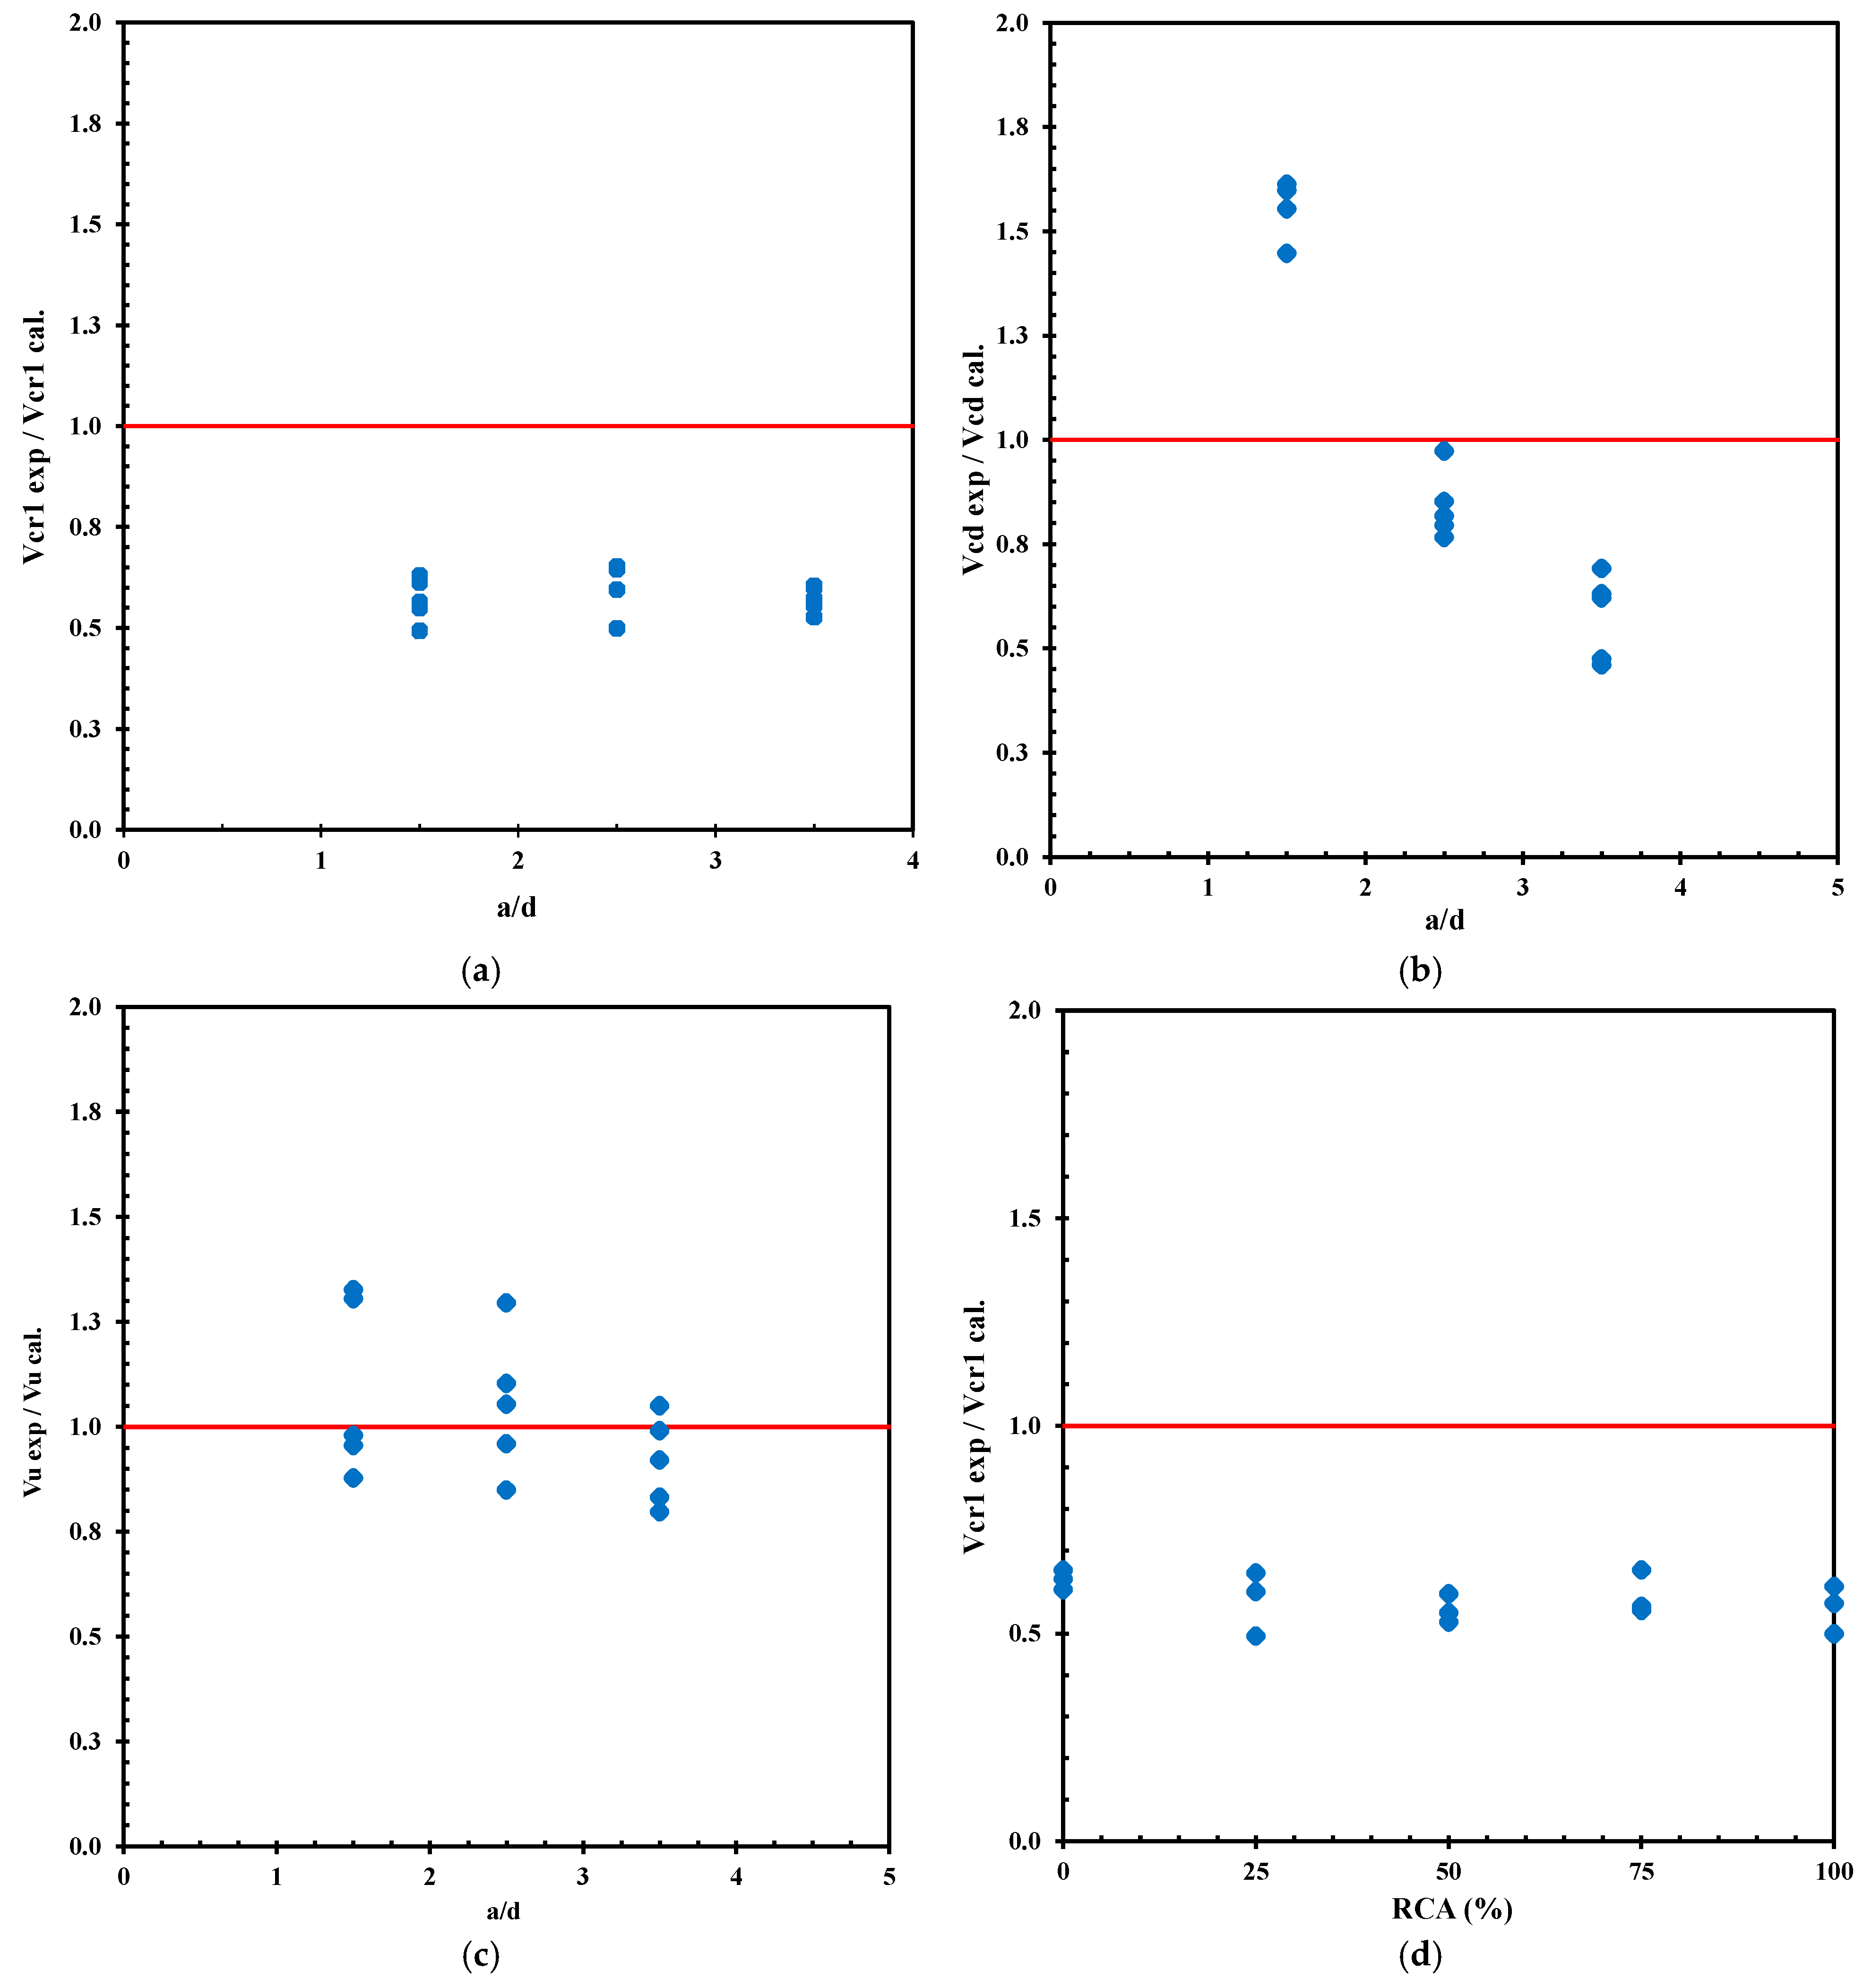
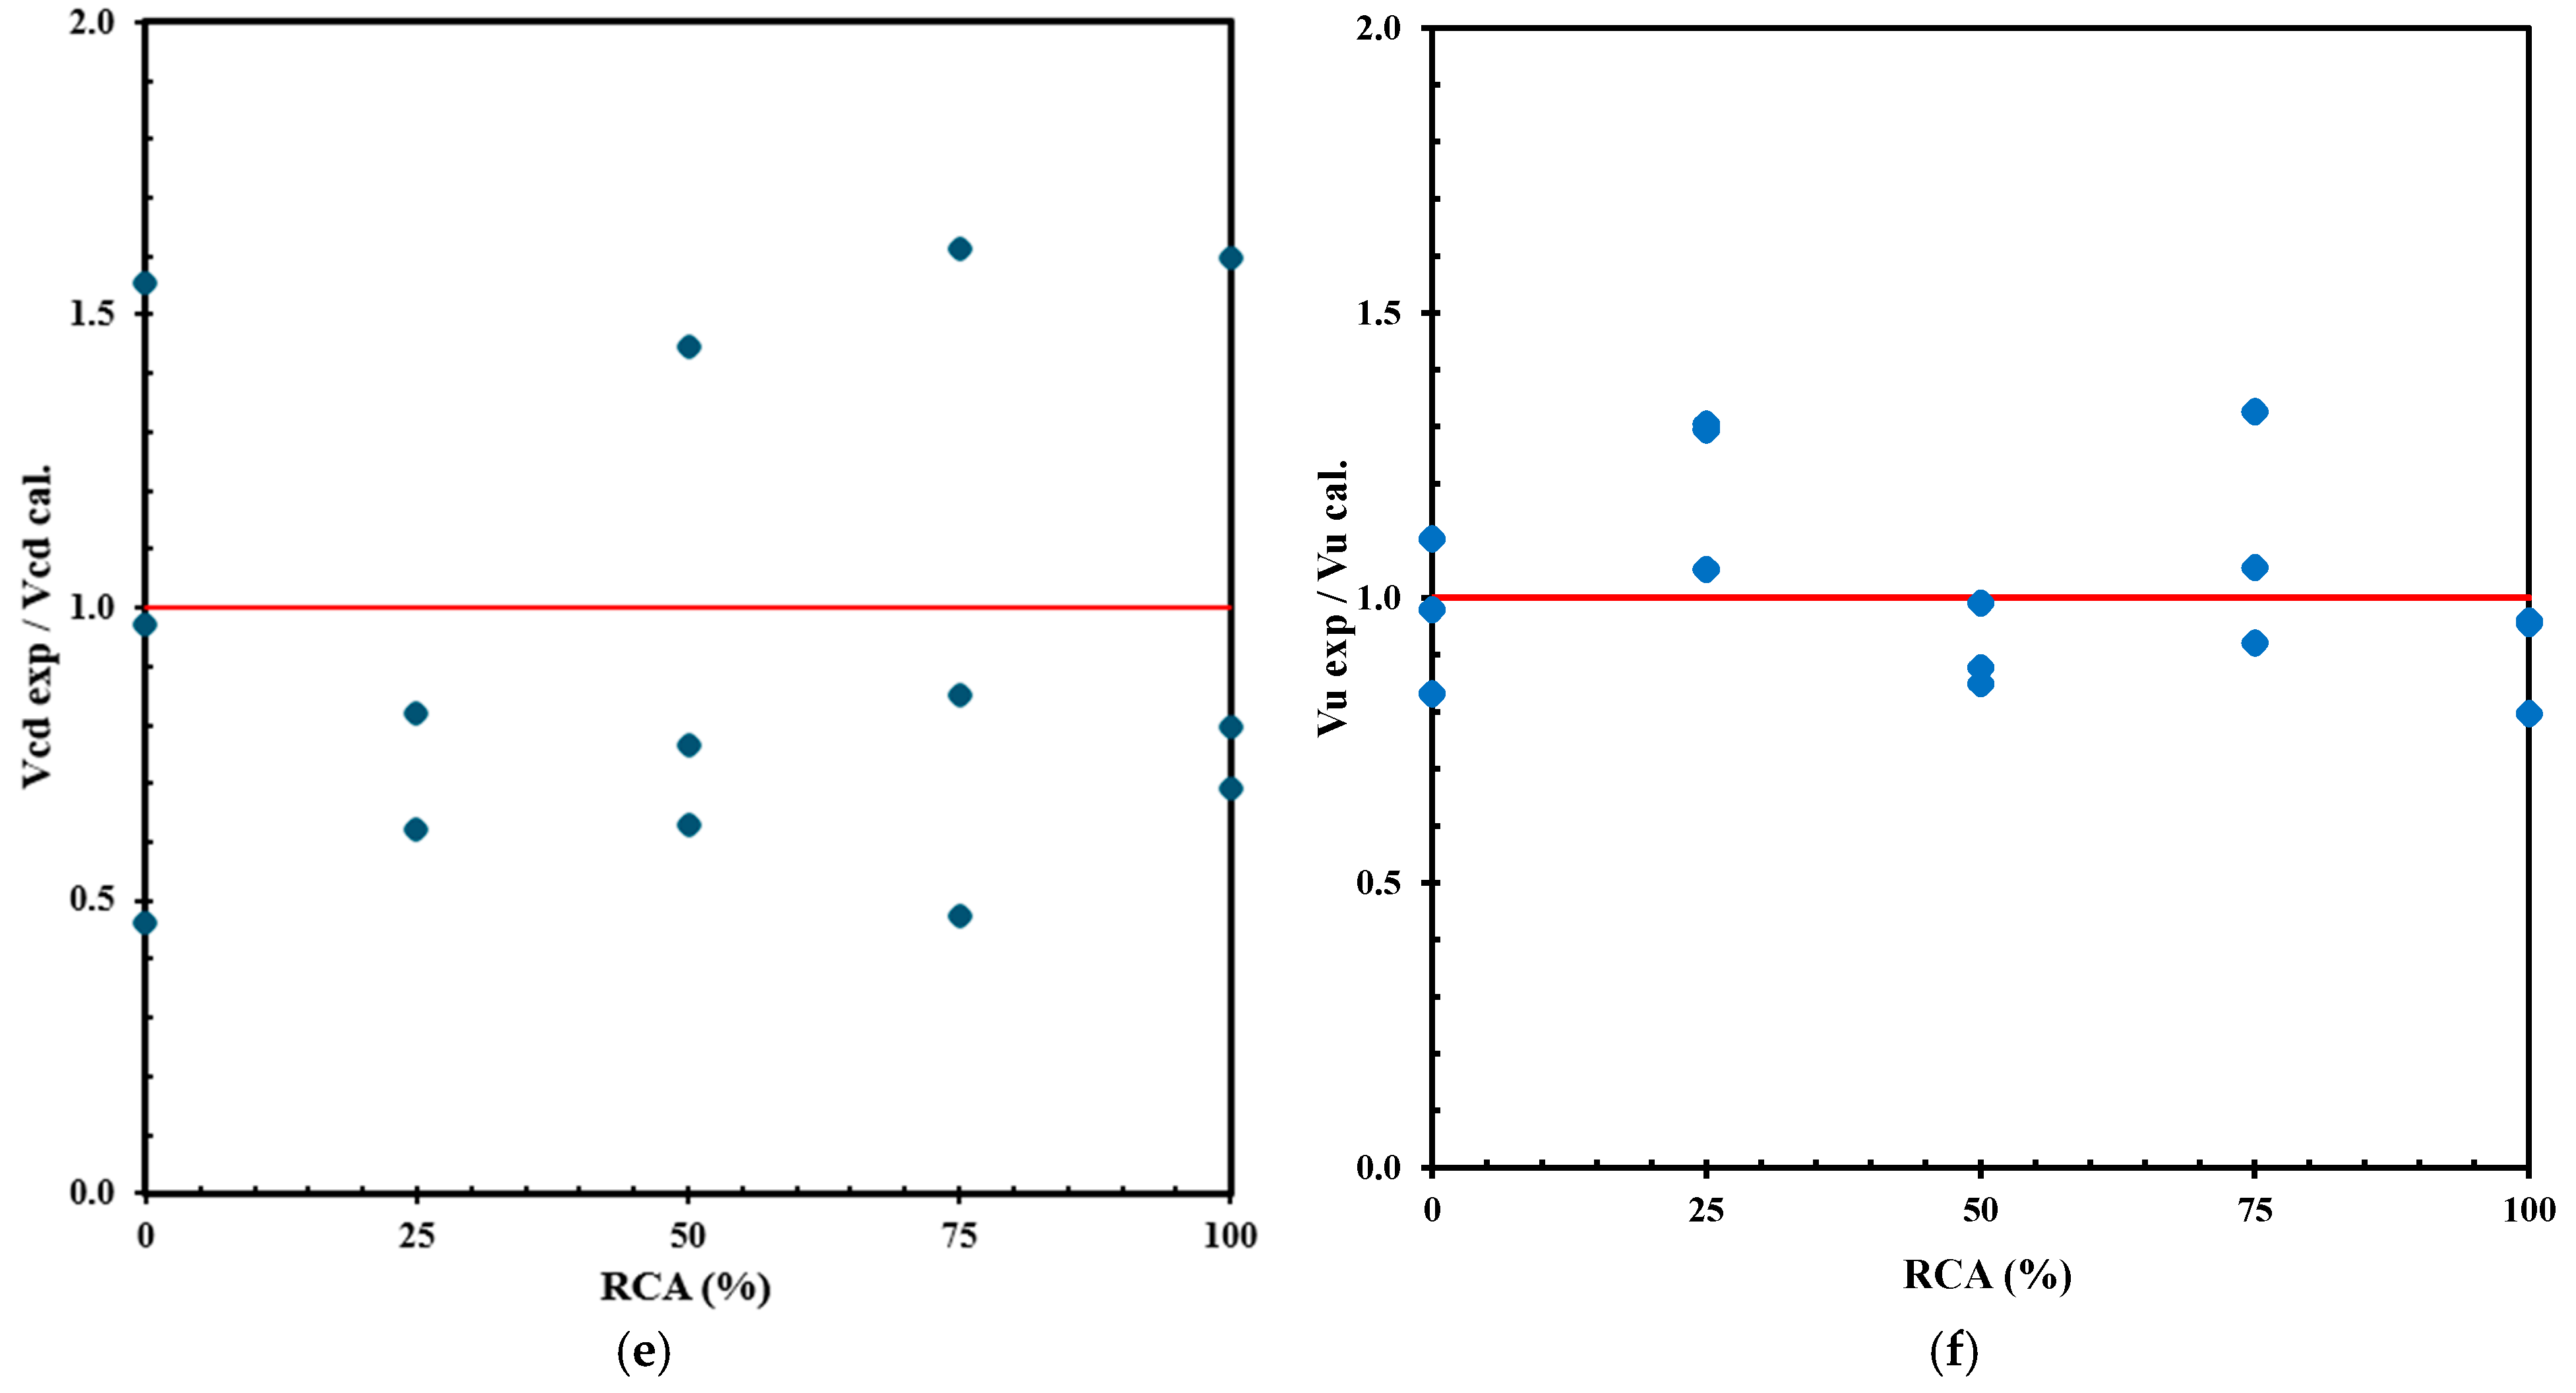
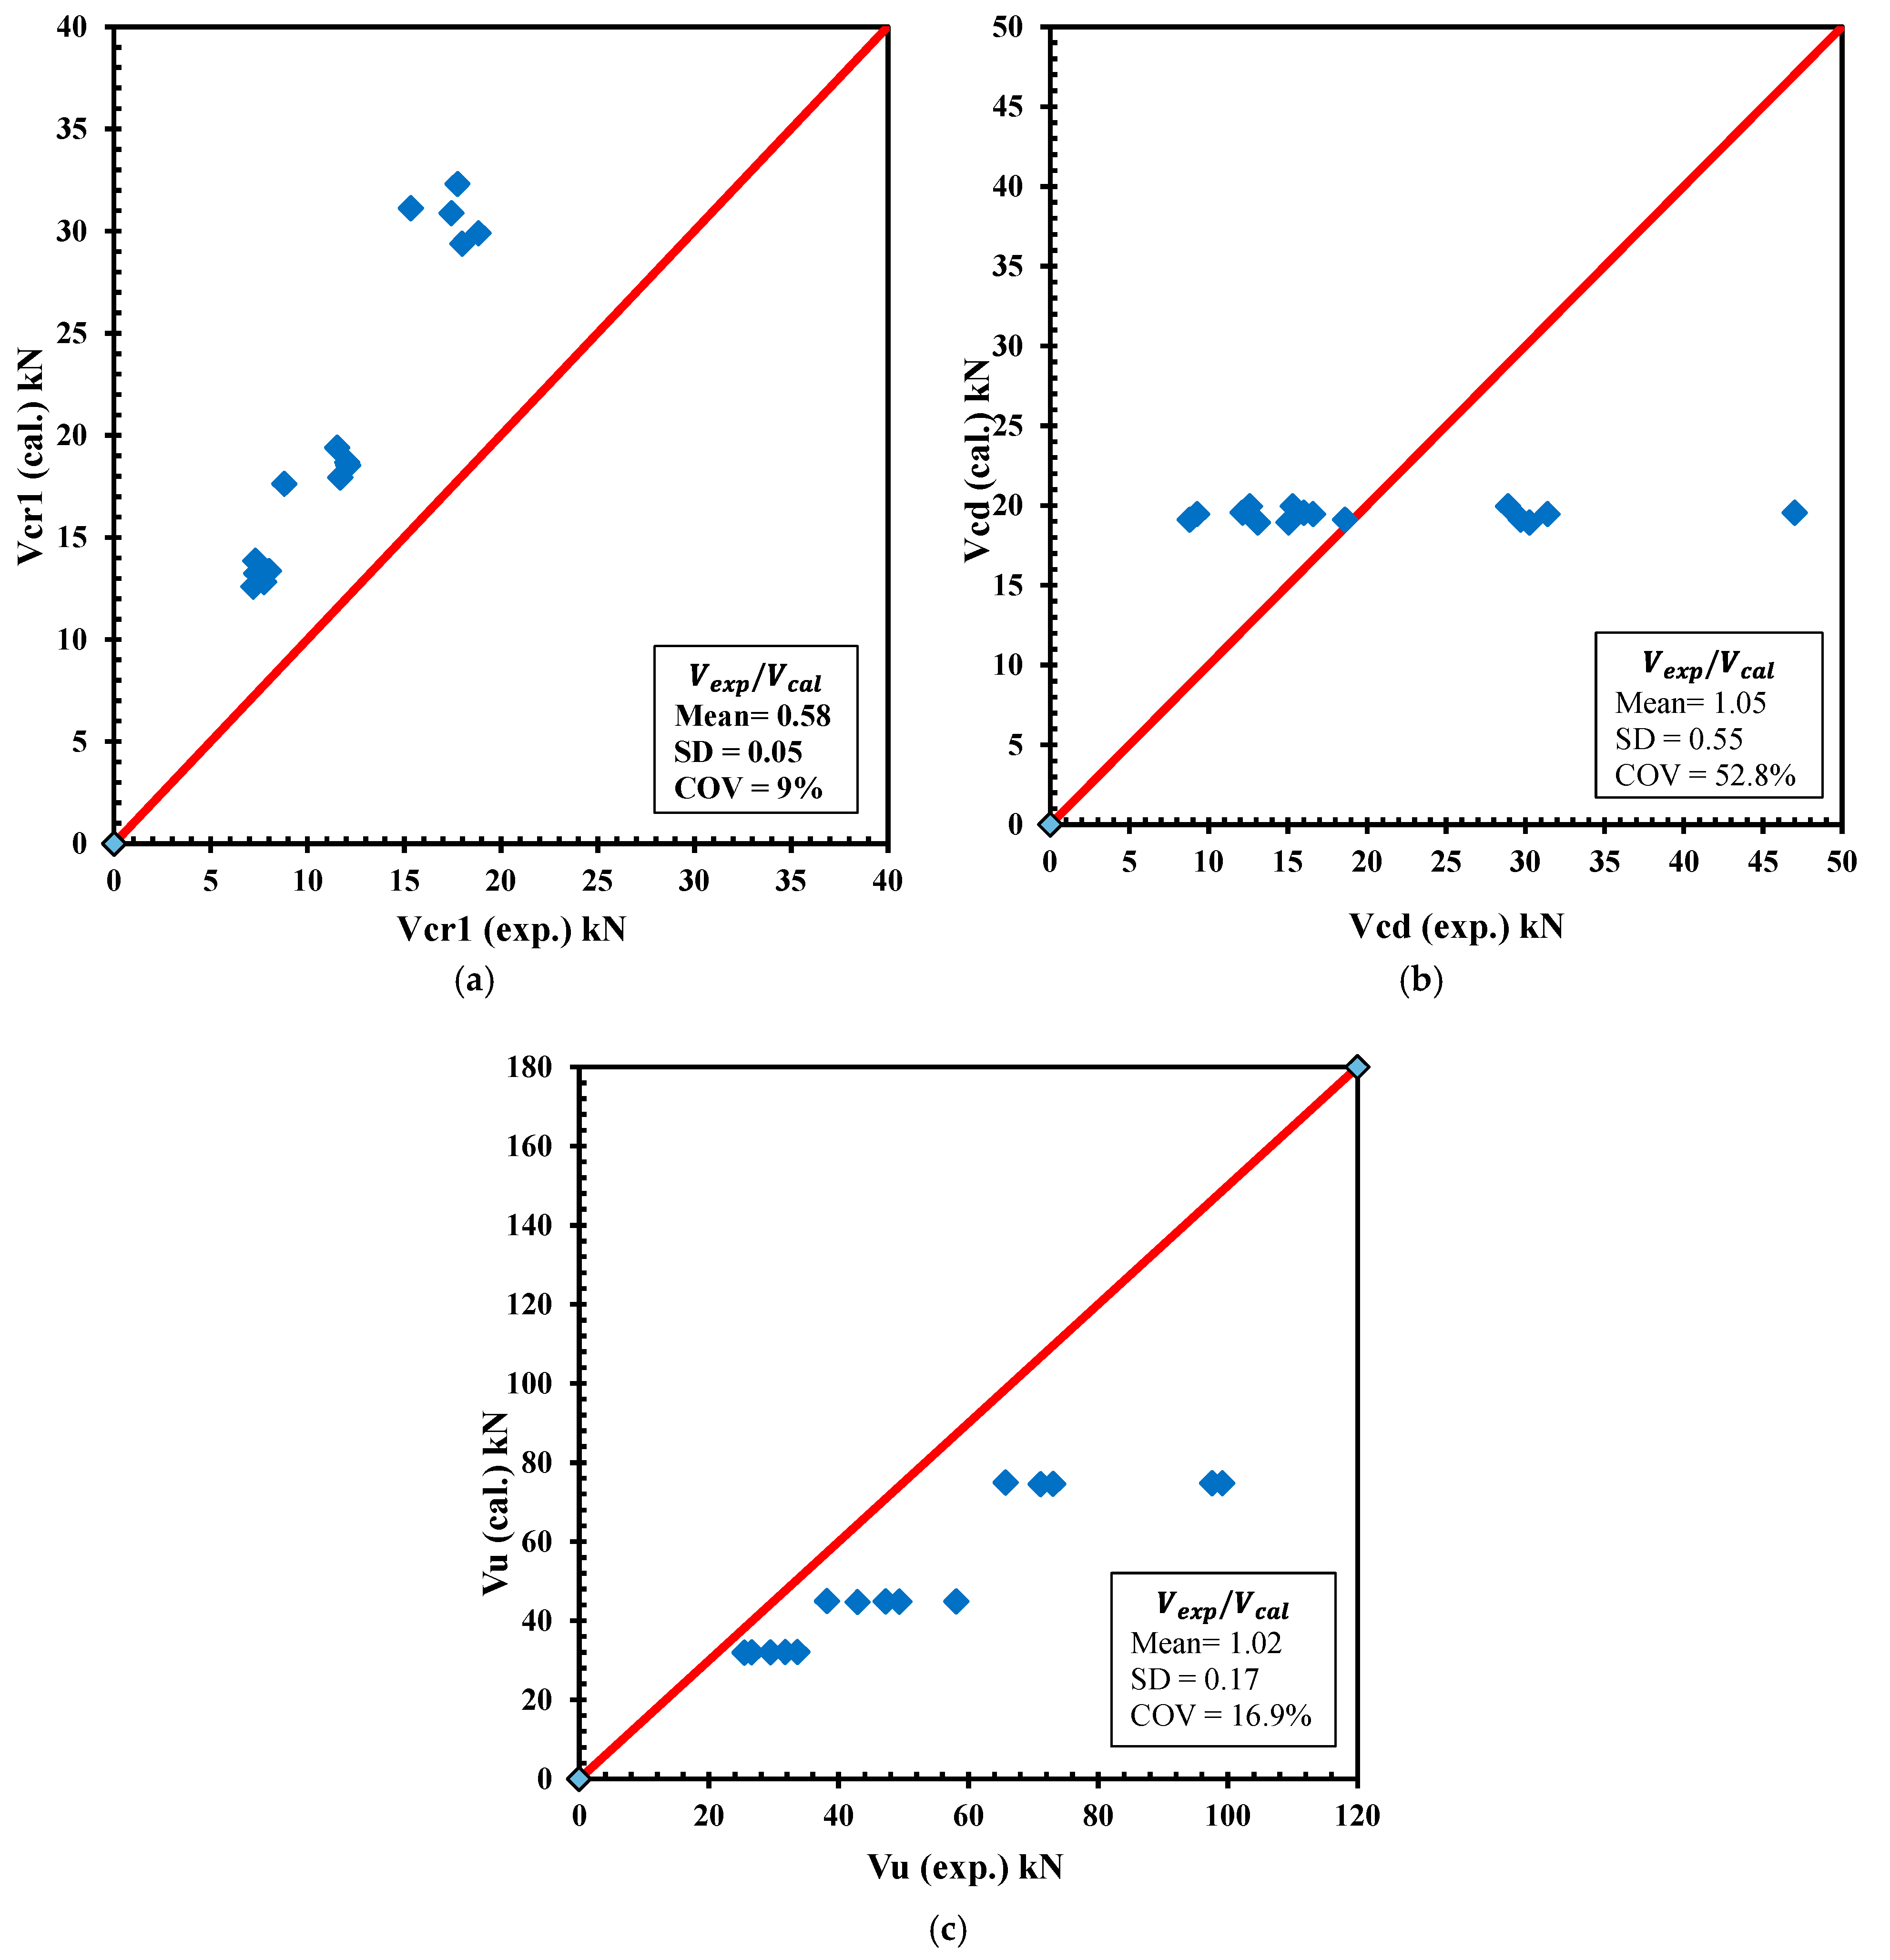
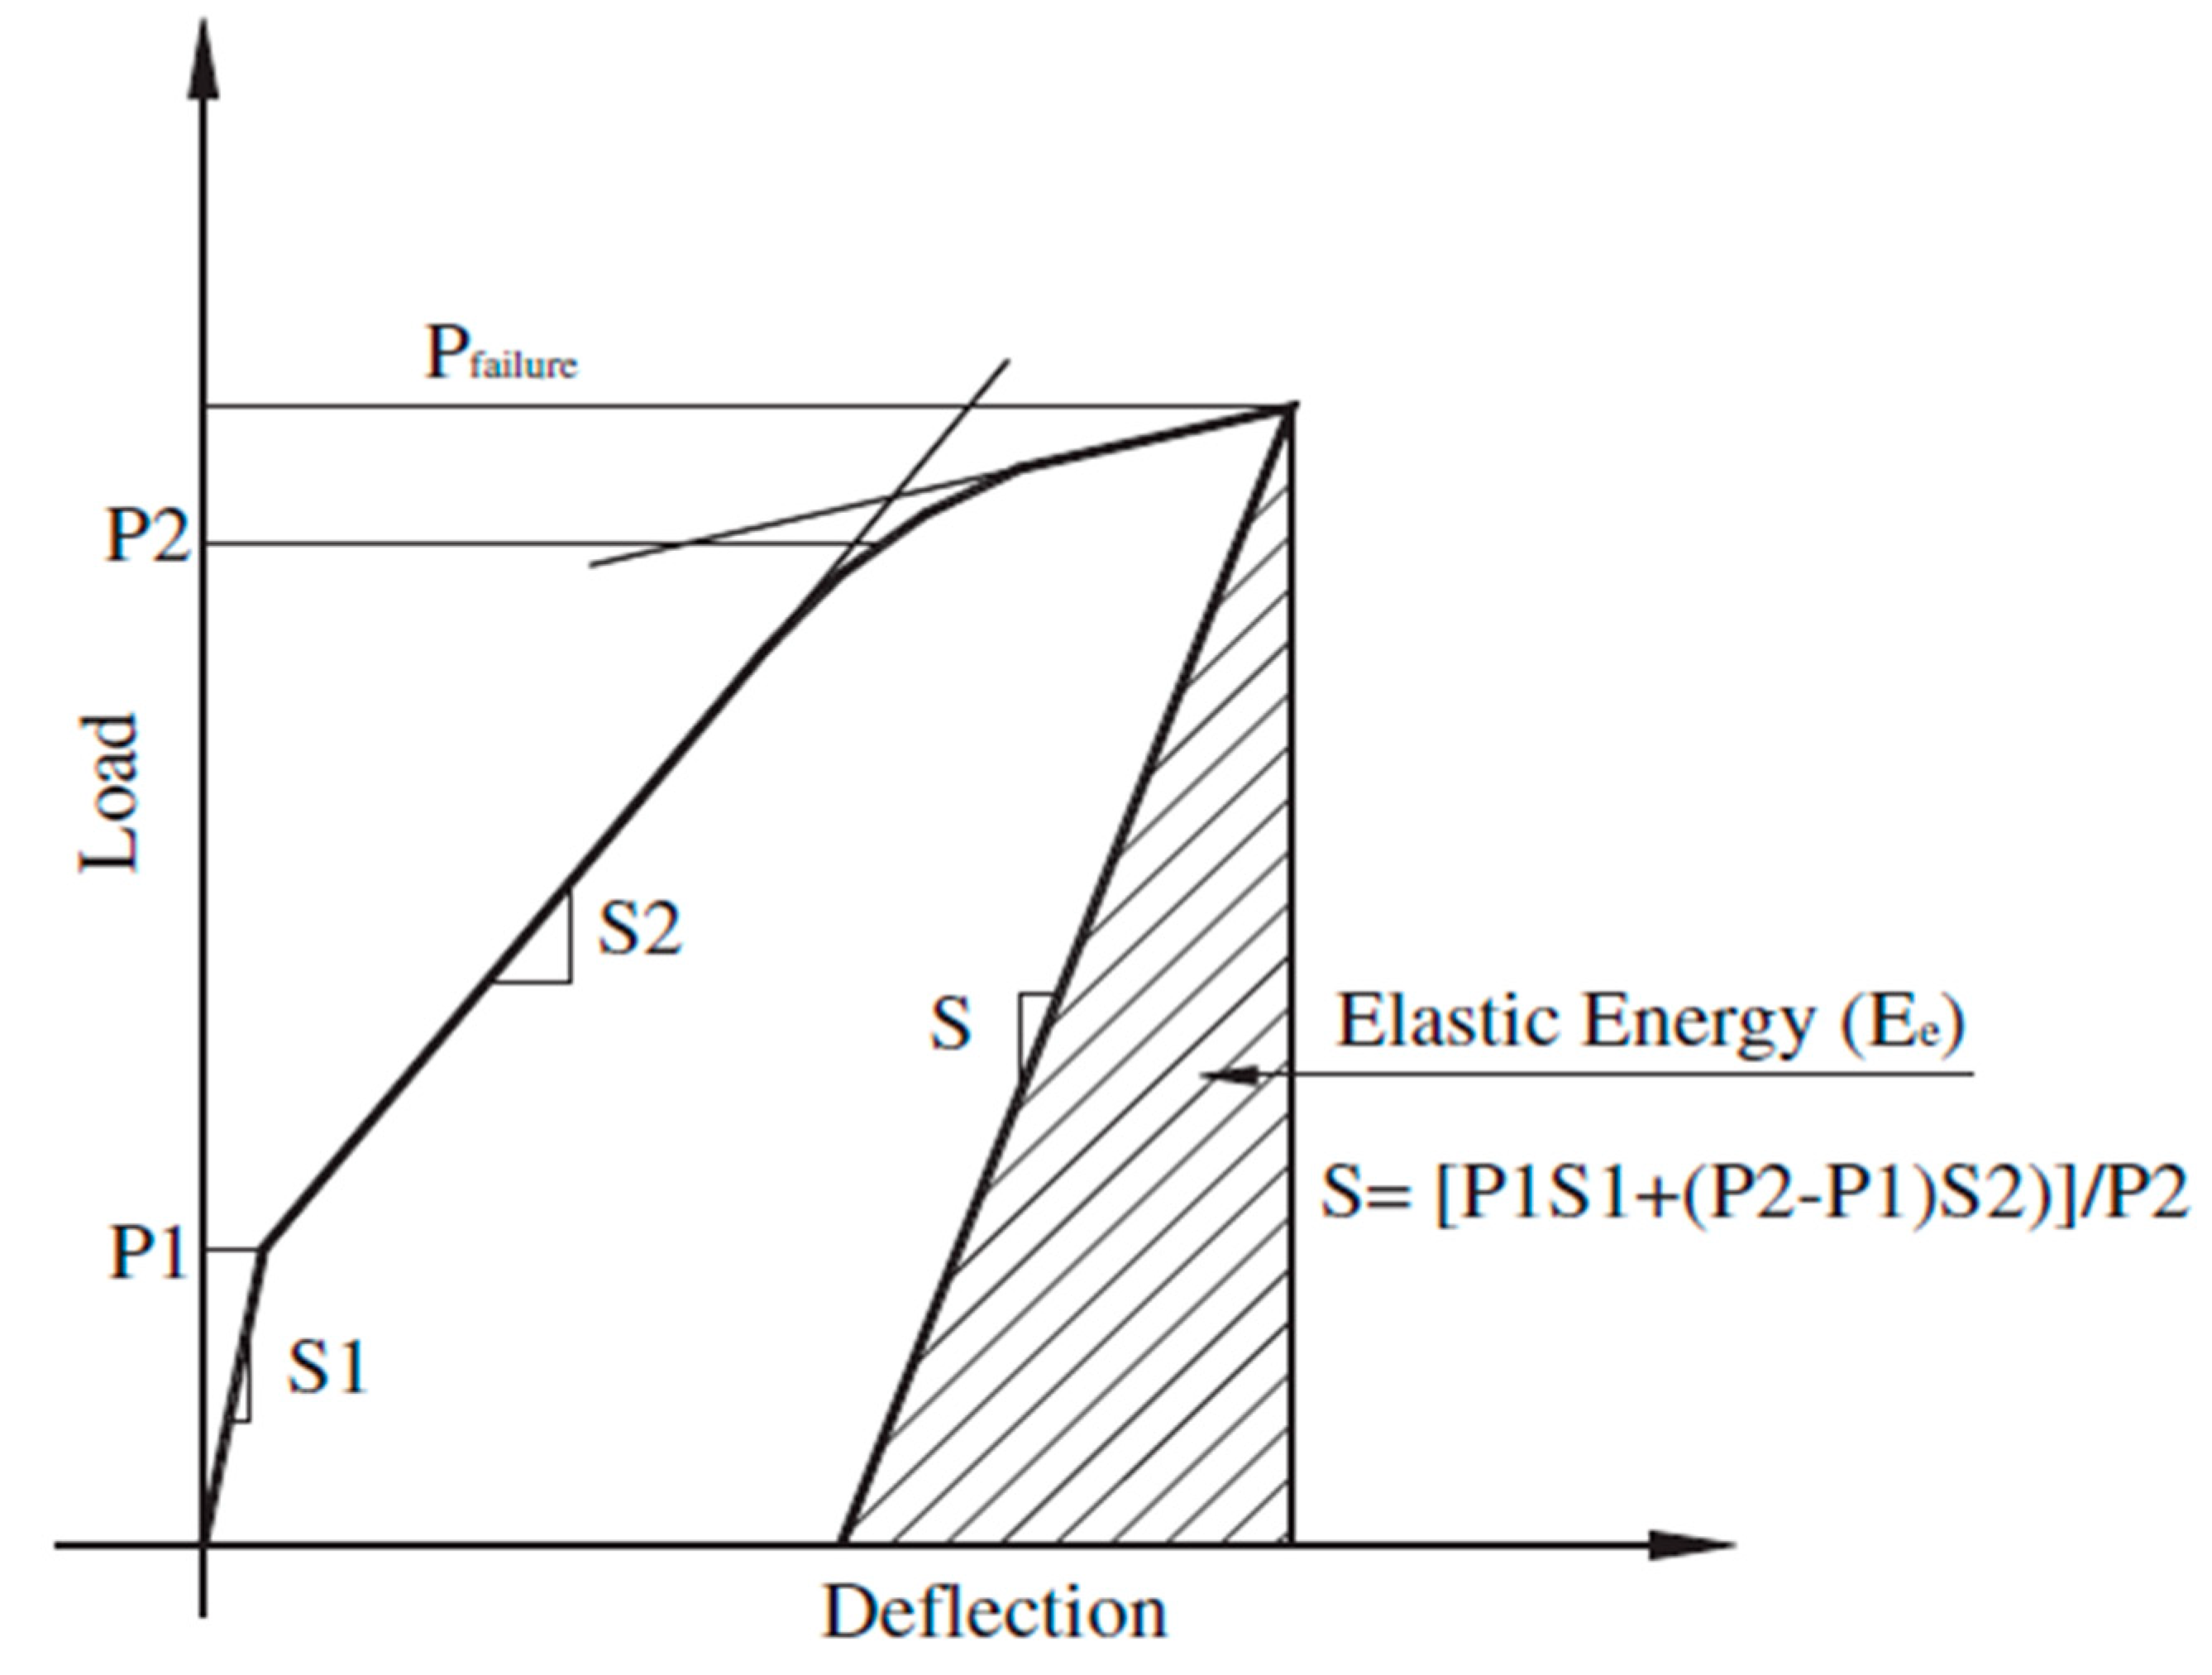
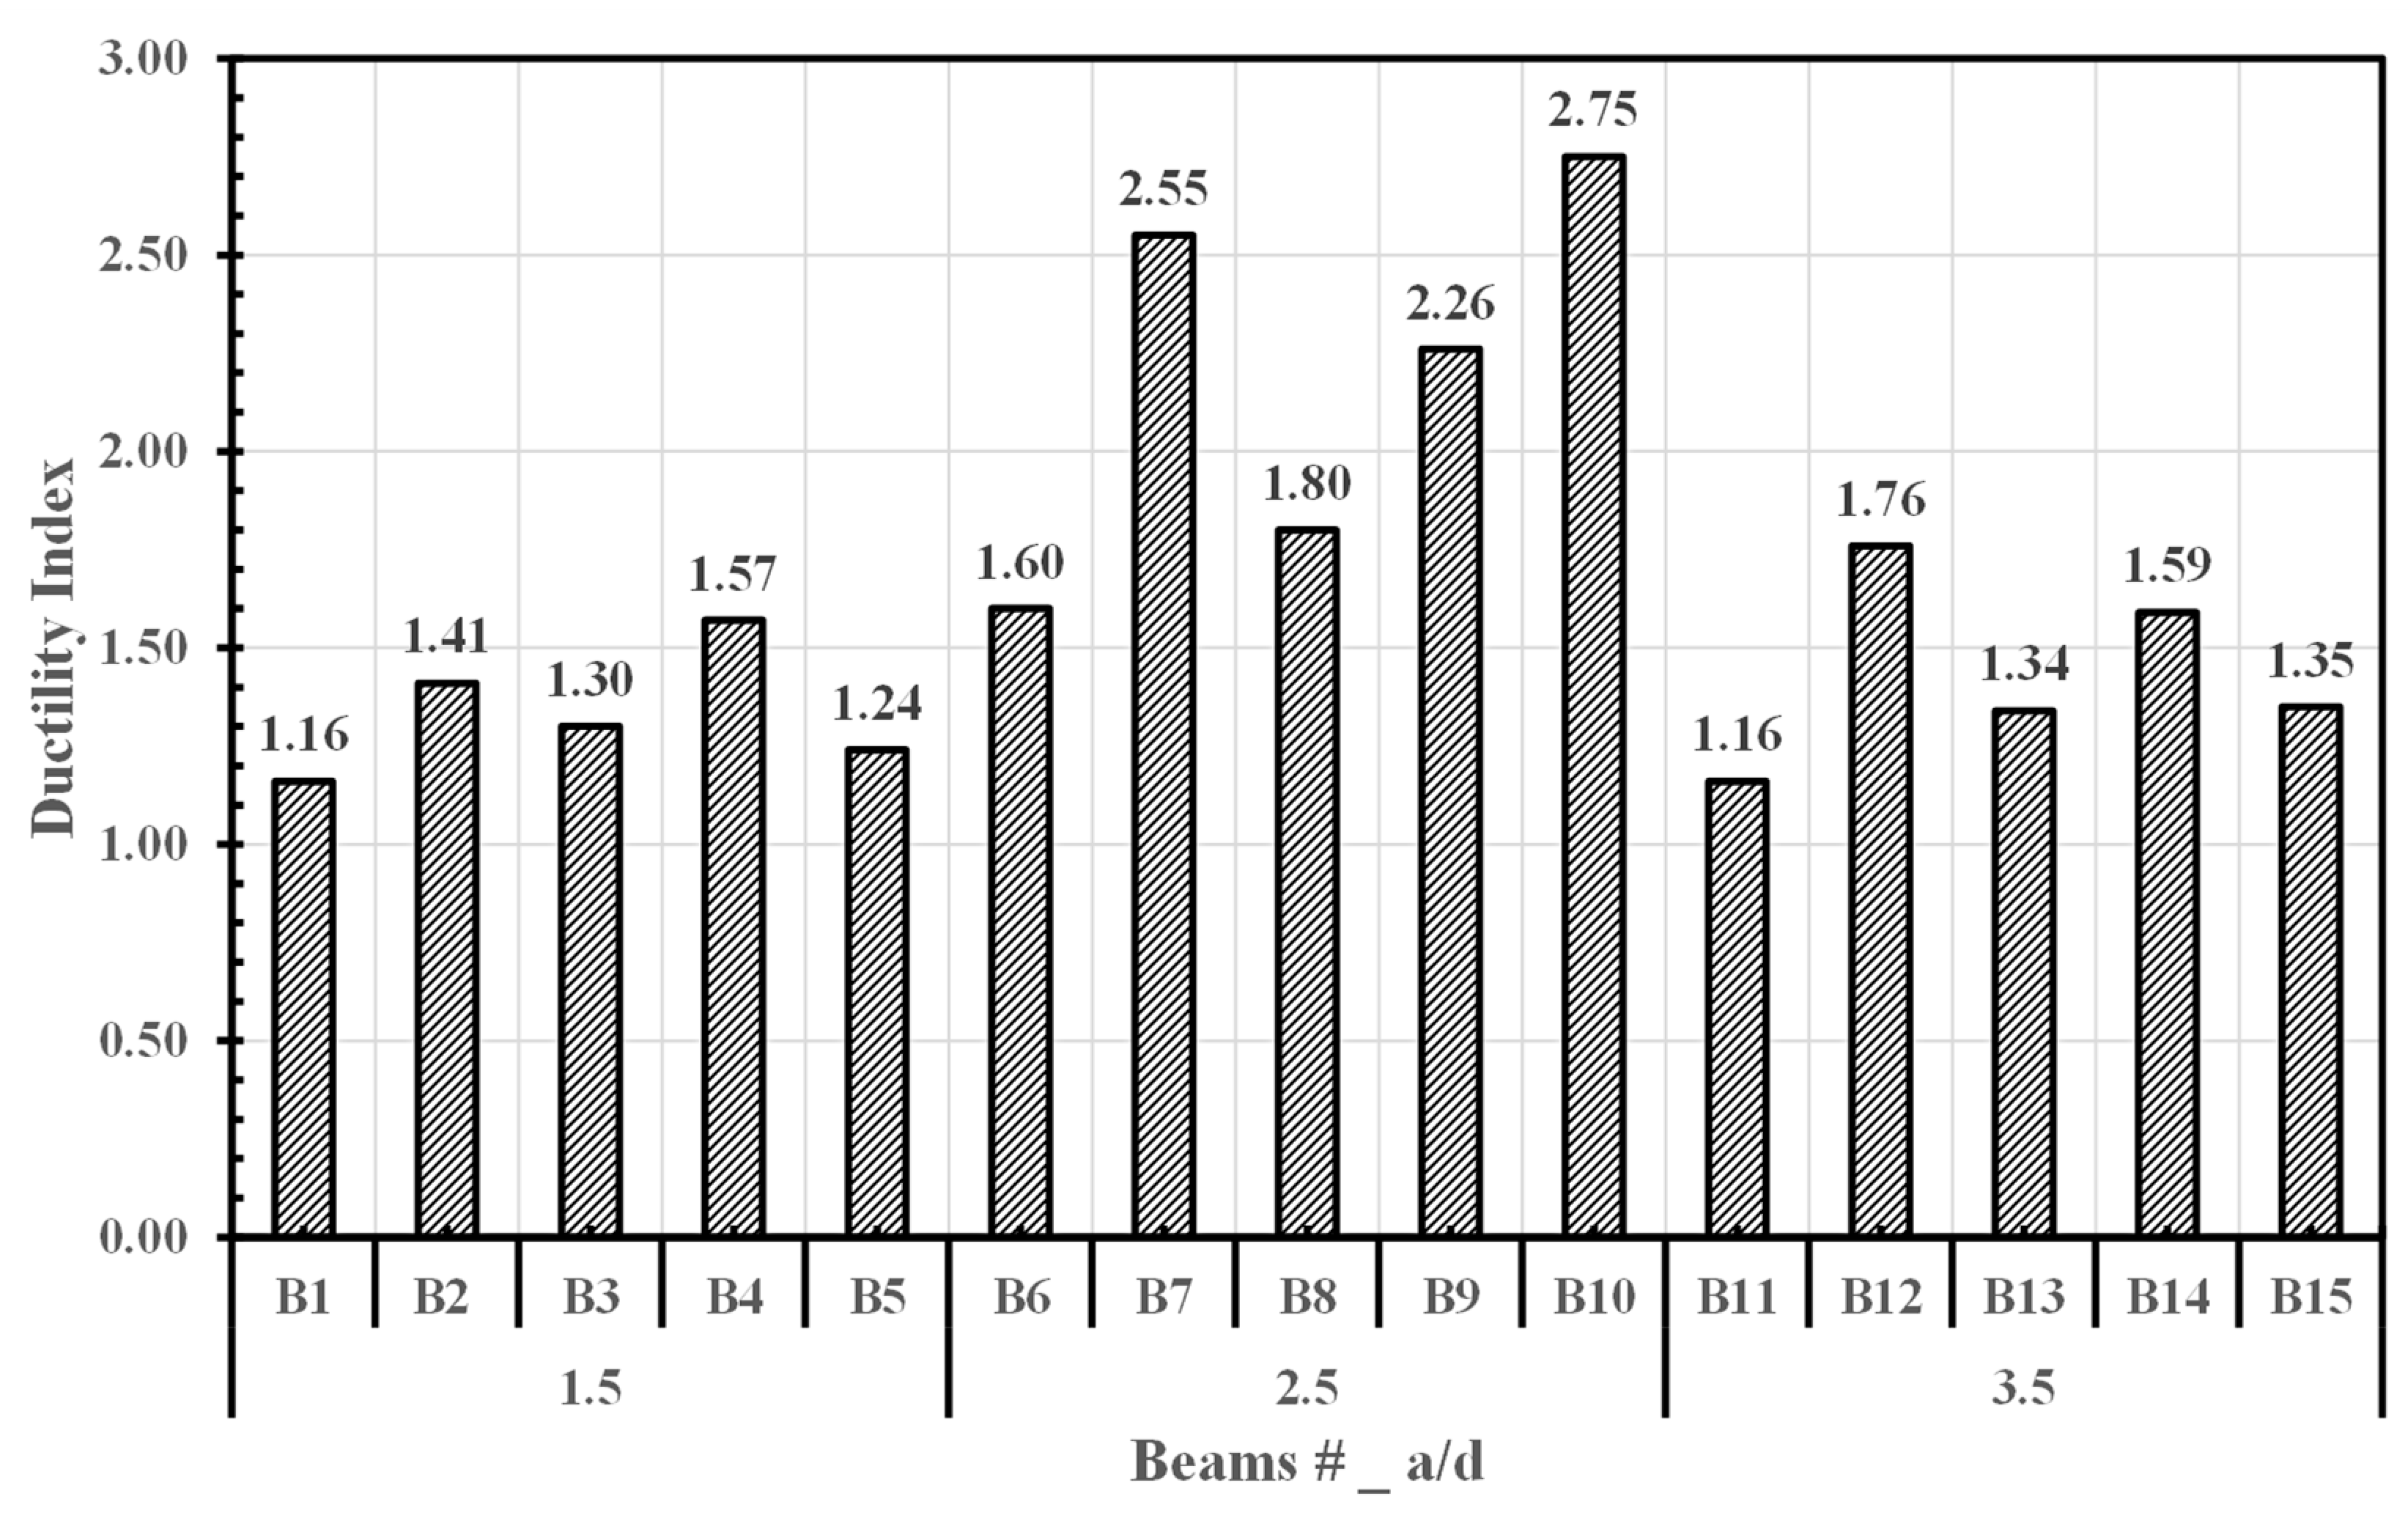
Disclaimer/Publisher’s Note: The statements, opinions and data contained in all publications are solely those of the individual author(s) and contributor(s) and not of MDPI and/or the editor(s). MDPI and/or the editor(s) disclaim responsibility for any injury to people or property resulting from any ideas, methods, instructions or products referred to in the content. |
© 2025 by the authors. Licensee MDPI, Basel, Switzerland. This article is an open access article distributed under the terms and conditions of the Creative Commons Attribution (CC BY) license (https://creativecommons.org/licenses/by/4.0/).