Abstract
As the civil industry, and especially the concrete industry, constantly advance and modernize, the usage of sustainable construction materials is becoming increasingly important. These materials represent one of the most significant components in the concept of the sustainable development of every company and industry. Underground mining, as a part of mining industry, largely applies sustainable materials to perform some of its technological operations. The optimal selection of sustainable construction materials is one of the key tasks for underground mining engineers. This paper proposes a novel integrated CRIFFT-SPHERA decision-making model for choosing the most suitable concrete mixture for supporting and backfilling activities in an underground mine. A total of ten concrete mixtures forms a set of alternatives which are evaluated with respect to four criteria. To validate the proposed MCDM model, an extensive numerical calculation procedure as well as comparative analysis are conducted through a hypothetical example. The obtained results confirm the extremely high degree of stability and reliability of the developed model. Also, the results are checked using sensitivity analysis based on changes in the values of the weight coefficients. In addition, the effectiveness of the developed model is verified through real-world problems where its application for solving these problems in various industries is accepted. This paper provides valuable insights for engineers dealing with problem of the construction of different concrete forms and structures, especially in underground areas, with fly ash as an element belonging to a group of sustainable construction materials.
1. Introduction
Building activities in underground spaces always present interesting challenges for creating new innovative engineering projects. One of these challenges is related to performing elementary technological operations in underground mines, such as supporting and backfilling. Both activities require the application of some type of material that provides high quality and effective performances. For preparing shotcrete to support underground spaces and for preparing paste for backfilling the mined-out stopes, industrial waste rock is used as one of the most important components in the concrete mixtures. Its main role is to minimize negative effects on the environment by eliminating the enormous amounts of waste rocks deposited on the surface near coal-fired power plants, as well as to reduce the high percentage of ordinary cement in the concrete mixture proportion.
The mining engineering sector has great potential for utilizing the industrial waste products. Huge amounts of waste materials are generated from thermal power plants during the coal combustion process. Fly ash, slug, gypsum and silica fume are some of the coal combustion wastes (CCWs) which are found and are widely applied in the construction industry, especially for concrete production. Various types of concrete composed of a certain percentage of fly ash can be successfully implemented as sustainable construction materials.
Every sustainable concrete is composed of materials that must meet the strict environmental requirements. The binder is a crucial component of every concrete mixture that affects its physical and mechanical properties. The most commonly used binder is cement. Replacing or significantly reducing cement in a concrete mixture is one of the most important challenges facing engineers to meet rigorous environmental recommendations. There are different supplementary cementitious materials, such as fly ash, slag, silica fume, natural pozzolans and others, that can improve the quality of concrete and at the same time provide high efficiency in terms of environmental sustainability.
In general, concrete is a construction material created with aggregates, binder, water and additives, if necessary. It is a well-known fact that capital infrastructure objects such as bridges, highways, railways, tunnels, airports, dams and others cannot be constructed without the presence of concrete. High compressive strength, ease of installation and design flexibility make this material the top building material in the world. Because of these facts, it is evident that concrete is applied not only in civil engineering but also in all other engineering areas, including the mining industry.
1.1. Contribution and Novelty
The main aim of this paper is to provide support to mining engineers who are dealing with problems of sustainable construction material selection for performing primary technological operations. For that purpose, an innovative decision-making methodology composed of two original methods, CRIFFT and SPHERA, is proposed. The CRIFFT method, as a new objective weighting method, is developed for calculating the weights of criteria. The novel SPHERA method is applied to rank the possible alternatives and find the most reliable solution in decision-making procedures.
The main contributions and the novelty of the paper can be summarized as follows:
- Two completely innovative MCDM methods. The CRIFFT method belongs to a group of objective weighting methods while the SPHERA method is a novel MCDM approach for ranking the alternatives.
- The integration of these two methods for creating a novel CRIFFT-SPHERA decision-making framework for sustainable material selection in the mining industry.
- An innovative fusion of physics and geometry into decision-making models. The CRIFFT method applies a free-fall analogy to determine the objective weights of criteria while the SPHERA method uses geometric sphericity as a metaphor for the ranking of the alternatives.
- Verification of the novel developed decision-making model through comparative and sensitivity analysis as well as through a real-world application problem, demonstrating the model’s effectiveness and robustness.
1.2. Paper Organization
The remainder of the paper is organized as follows: The introduction is described in Section 1 while the comprehensive literature review is elaborated upon in Section 2. A new objective weighting method for determining the weight coefficients named in the CRIFFT method is explained in Section 3. Section 4 refers to a detailed interpretation of the novel method for ranking the alternative, named the SPHERA method. An exhaustive numerical example with a brief clarification of each criterion is illustrated in Section 5. In Section 6, a comparative analysis of the newly developed methodologies with the most popular MCDM methods is shown, as well as their application to real-world problems. The sensitivity analysis is demonstrated in Section 7. At the end, the concluded considerations, limitations and further research are presented in Section 8.
2. Literature Review
2.1. Application of MCDM Methods for Sustainable Construction Materials Selection
Numerous authors have explored the possibility of reusing coal by-products to create construction materials for different construction applications. Some of these studies are related to analyzing fly ash as a supplementary cementitious material [1], gypsum–cement binder (GCB) composites [2], the effects of fly ash and silica fumes on self-compacting concrete [3], CCW for the production the ceramic materials [4], the application of fly ash and bottom ash for different manufacturing construction materials [5], geopolymer material production [6], fly ash cenospheres as new feedstock of rare earth elements [7], the bottom ash as microfiller [8] and many other methods of application.
Certainly, the presence of fly ash in the concrete mixture indicates that it belongs to a group of sustainable construction materials. Knowing the characteristics of fly ash, its main role is to reduce the content of Portland cement in a concrete mixture and to minimize the negative impact on the environment at the same time. There are many scientific papers that have investigated the content of fly ash and its impact on concrete mixtures as well as the optimization and selection of the most sustainable supplementary cementitious materials and concrete mixture selections. Some of them refer to the application of traditional MCDM methodologies for creating different decision support frameworks, such as OSM-AHP-TOPSIS [9], TOPSIS [10,11], fuzzy Entropy-TOPSIS [12] and other approaches for selecting the most sustainable supplementary concrete materials, as well as the EDAS, VIKOR and TOPSIS MCDM techniques [13,14]; the WASPAS, EDAS and TOPSIS methodologies [15]; and other tools for selecting the best concrete mixture. Also, there are studies that have optimized and analyzed the concrete mixtures composed of sustainable materials and studied their influence on mechanical properties, such as sustainability indicators [16], the Taguchi method [17], genetic algorithm [18], Artificial Neural Networks [19], the adaptive surrogate model [20] and a combination of these methods [21,22].
2.2. Application of Sustainable Construction Materials in Underground Mining Engineering
Exploring the literature sources related to the use of sustainable construction materials, especially concrete mixtures with fly ash, for supporting and backfilling in underground mining areas, it can be seen that several authors are dealing with this problem. Zhao et al. [23] analyzed various mix designs based on slag and fly ash as sustainable materials for creating the cemented paste backfill and analyzed their effect on mechanical performance in a copper–gold underground mine. Zou et al. [24] developed a multi-objective fuzzy optimal decision model to evaluate the optimal ratio of mixing parameters for the preparation of wet shotcrete containing fly ash. Dang et al. [25] investigated the optimal proportion of fly ash (FA) and coal bottom ash (CBA) in a concrete mixture for creating the concrete lagging in SVP steel arches. Behera et al. [26] examined the physical and mechanical characteristics of paste mixes containing fly ash for the purpose of backfilling mine stopes in an underground lead–zinc mine. Mishra and Karaman [27] presented several composite mixtures based on fly ash, lime and gypsum as an alternative material for backfilling mine voids. Chen et al. [28] proposed the utilization of coal gangue aggregates including fly ash and its different mix proportions for preparing shotcrete for supporting a critical zone in an underground coal mine.
2.3. Methods for Criteria Weight Determination
Estimating the weights of criteria in every multi-criteria decision-making problem presents an inevitable activity and a mandatory component in the decision-making process. Weight coefficient fluctuation has a very significant effect on the final ranking of alternatives. To make as realistic and reliable a decision as possible, it is necessary to exclude any subjective factors that can negatively influence decision-makers. Because of these reasons, objective weighting methods are developed to define the weights of criteria in an objective way, such as the Entropy method [29,30], CRITIC method [29,30], standard deviation method [30], MEREC method [31], LOPCOW method [32], mean weight method [33], coefficient of variation method [34], SPC method [35], MPSI method [36] and others. Besides objective weighting methods, there are also subjective weighting methods that have found application in various areas, and those are the SWARA method [37], FUCOM method [38], RANCOM method [39], DEMATEL method [40], AHP method [41], ANP method [42], BWM method [43] as well as combined (hybrid) weighting methods [44,45,46].
2.4. Methods for Ranking the Alternatives
After assessing the weights of criteria, the next phase in the decision-making procedure is related to the usage of some MCDM tools to select the best possible solution. These MCDM methods provide tremendous support to company management and engineers to overcome the uncertain and risky environment in which companies and enterprises do business. Investigating the various literature sources, it can be seen that authors have developed a huge number of MCDM models, and extensions, modifications and hybrids, such as the TOPSIS method [47,48,49], SAW method [47,48], VIKOR method [48], COPRAS [48], MOORA method [49], MABAC method [50], WASPAS [51], EDAS [49,52], MARCOS [49], RAMS [53], RATMI [53] and many others.
2.5. Research Gap
As can be seen from an extensive survey of the literature, no authors address the problem of implementing MCDM techniques for the selection of sustainable construction material in underground mines for performing underground mining operations such as supporting and backfilling. Researchers put an emphasis on investigating fly ash as a replacement cementitious material in different construction applications, its impact on concrete mixtures as well as its impact on paste and shotcrete mixtures. There are no studies trying to explore the relationship between the above technological operations in underground mining with the aim of selecting the suitable material that simultaneously covers both operations using the MCDM methods. The lack of such a model significantly impacts mining companies which are doing business in a risky environment, in terms of the easier and more reliable creation of a sustainable and profitable mine production plan.
3. Objective Weighting Method—CRIterion Free-Fall Time (CRIFFT) Method
This method is based on calculating the time needed for a criterion to fall from one point to another and is called the CRIterion Free-Fall Time (CRIFFT) method. The CRIFFT method belongs to a group of objective weighting methods. The normalized values of the initial decision-making matrix are treated as heights from which the criteria fall. Forming the vector composed of the maximum values of each criterion is a very important step in the procedure for calculating free-fall time. Based on the obtained values of heights and the conventional standard values of gravitational acceleration, the free-fall time for every criterion can be determined. The ratio of distances between each value of the vector composed of the maximum values of the criterion and the value of any criterion characterizes the final weights of the criteria.
The CRIFFT method represents a novel objective weighting method characterized by simple mathematical equations and an easy calculation process. Also, this method requires a very short time for computation and does not depend on criteria orientation due to its simple linear normalization technique (per sum). An important feature of this method is reflected in the fact that it has a high applicability and interaction with all MCDM methods for ranking the alternatives. Finally, the greatest contribution of this method is its application of the fundamental phenomenon from physics in defining the weights of criteria.
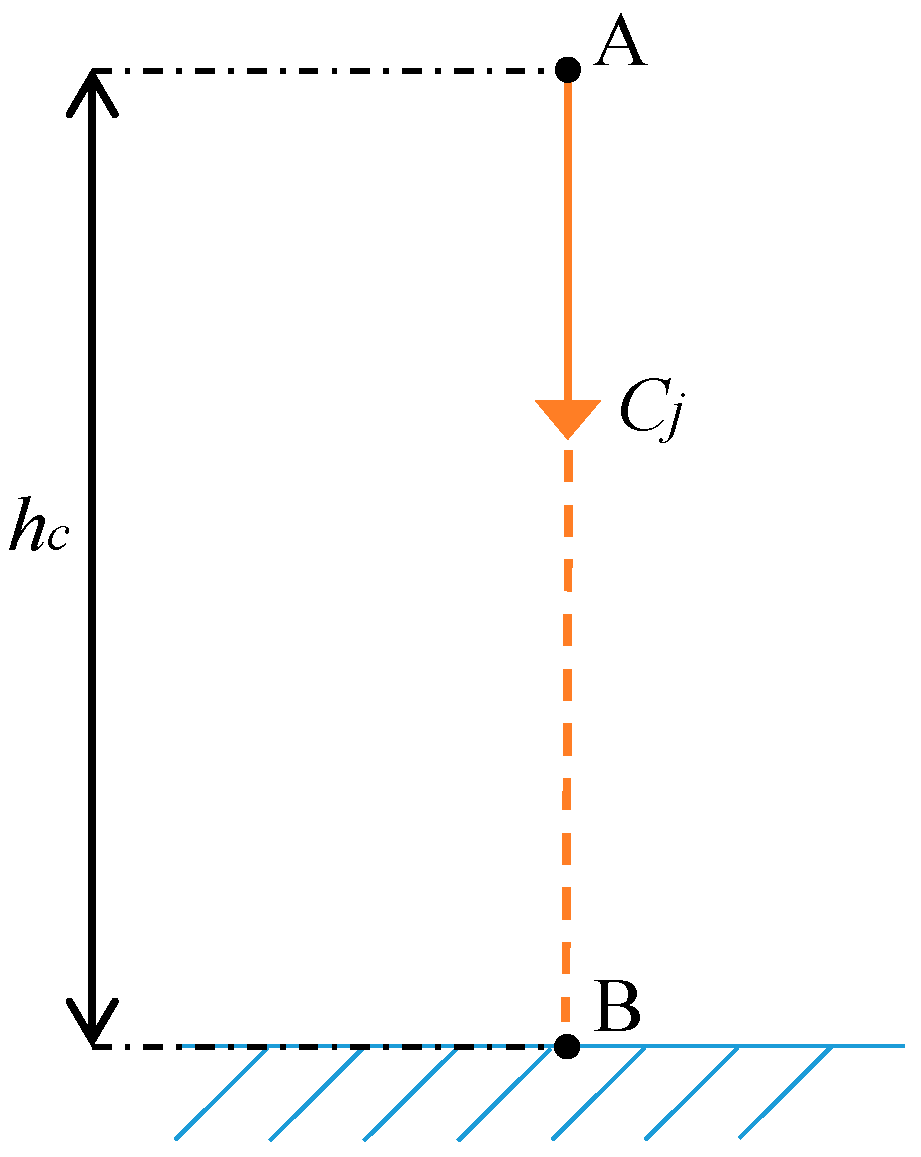
Suppose that criterion behaves like an object falling from point A to point B during a time t, as shown in Figure 1.
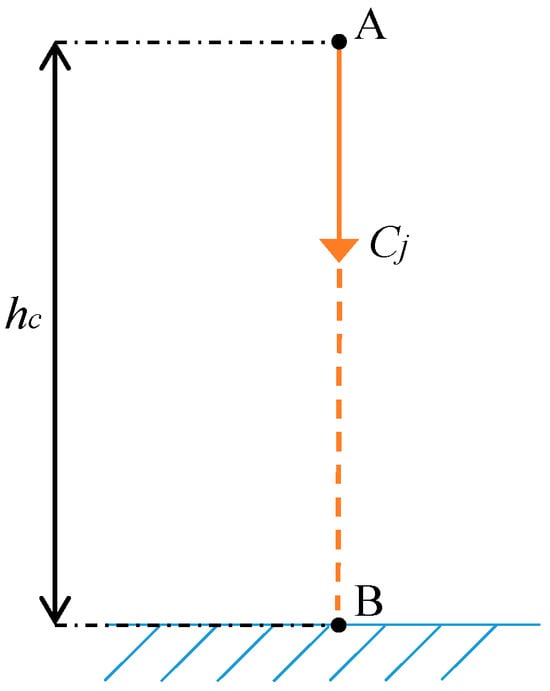
Figure 1.
Free-fall motion of criterion.
According to the well-known kinematic equation of motion for a free-falling object [54], the height of the criterion’s fall is directly related to the time of flight, as follows:
where
- is the initial velocity;
- is the gravitational acceleration ();
- is the criterion free-fall time.
If it assumed that initial velocity is zero (), the height of the criterion’s fall can be defined with following equation:
Our objective is to determine the time of fall of the criterion from point A to point B. From Equation (2), the criterion free-fall time can be expressed as follows:
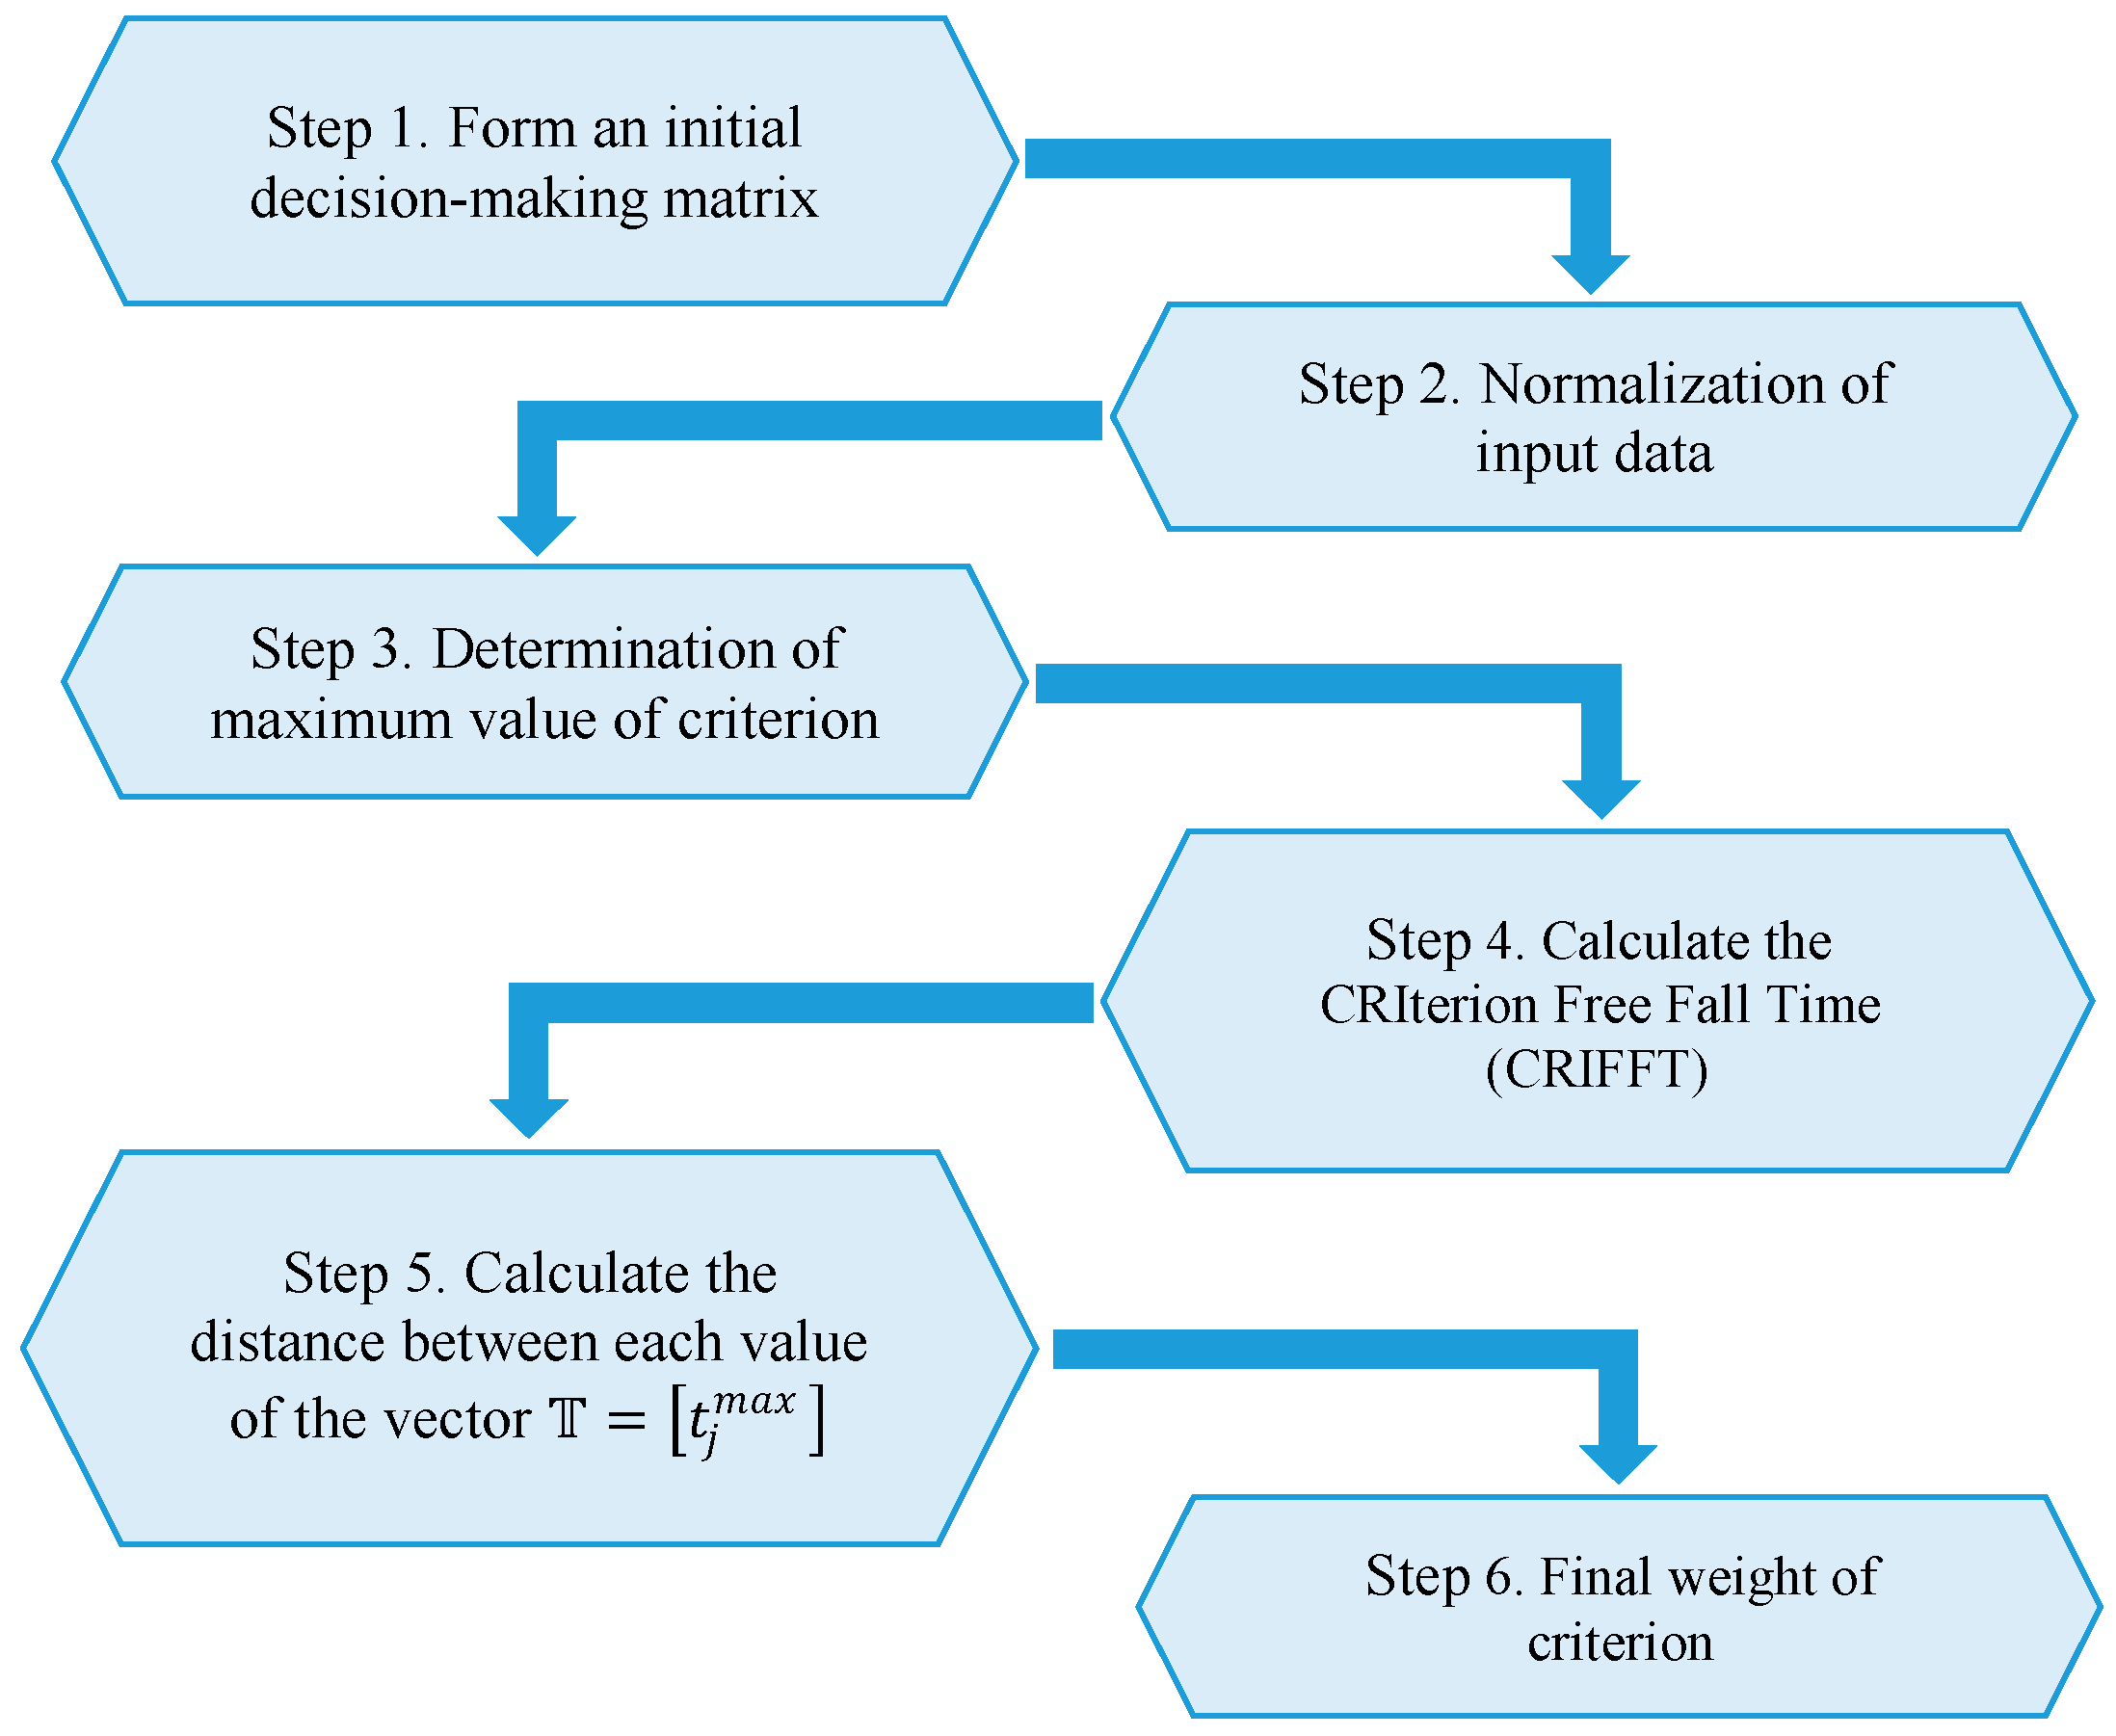
The CRIterion Free-Fall Time (CRIFFT) method is composed of the following steps:
Step 1. An initial decision-making matrix is formed with input data.
where
- denotes a set of possible alternatives;
- denotes a set of given criteria;
- denotes the assessed value of the alternative with respect to the corresponding criterion ;
- is the total number of alternatives;
- is the total number of criteria.
Step 2. Normalization process of the input data.
A simple linear normalization technique (per sum) is used to convert a different input data value into a compatible scale, i.e., a unity interval where the dependence of criterion aspiration (max or min) is not considered.
In the context of free-fall theory, we can say that the normalized value represents the height of the j-th criterion with respect to i-th alternative.
Step 3. Determination of the maximum value of the criterion.
The maximum value of the criterion can be determined as follows:
The vector composed of the maximum values is defined as follows:
Step 4. The CRIterion Free-Fall Time (CRIFFT) is calculated using Equation (3), as follows:
For the vector composed of the maximum values of the criterion:
For the j-th criterion with respect to the i-th alternative:
Step 5. The distance between each value of the vector and j-th criterion is calculated with respect to i-th alternative, as follows:
Step 6. The final weight of the criterion can be computed as follows:
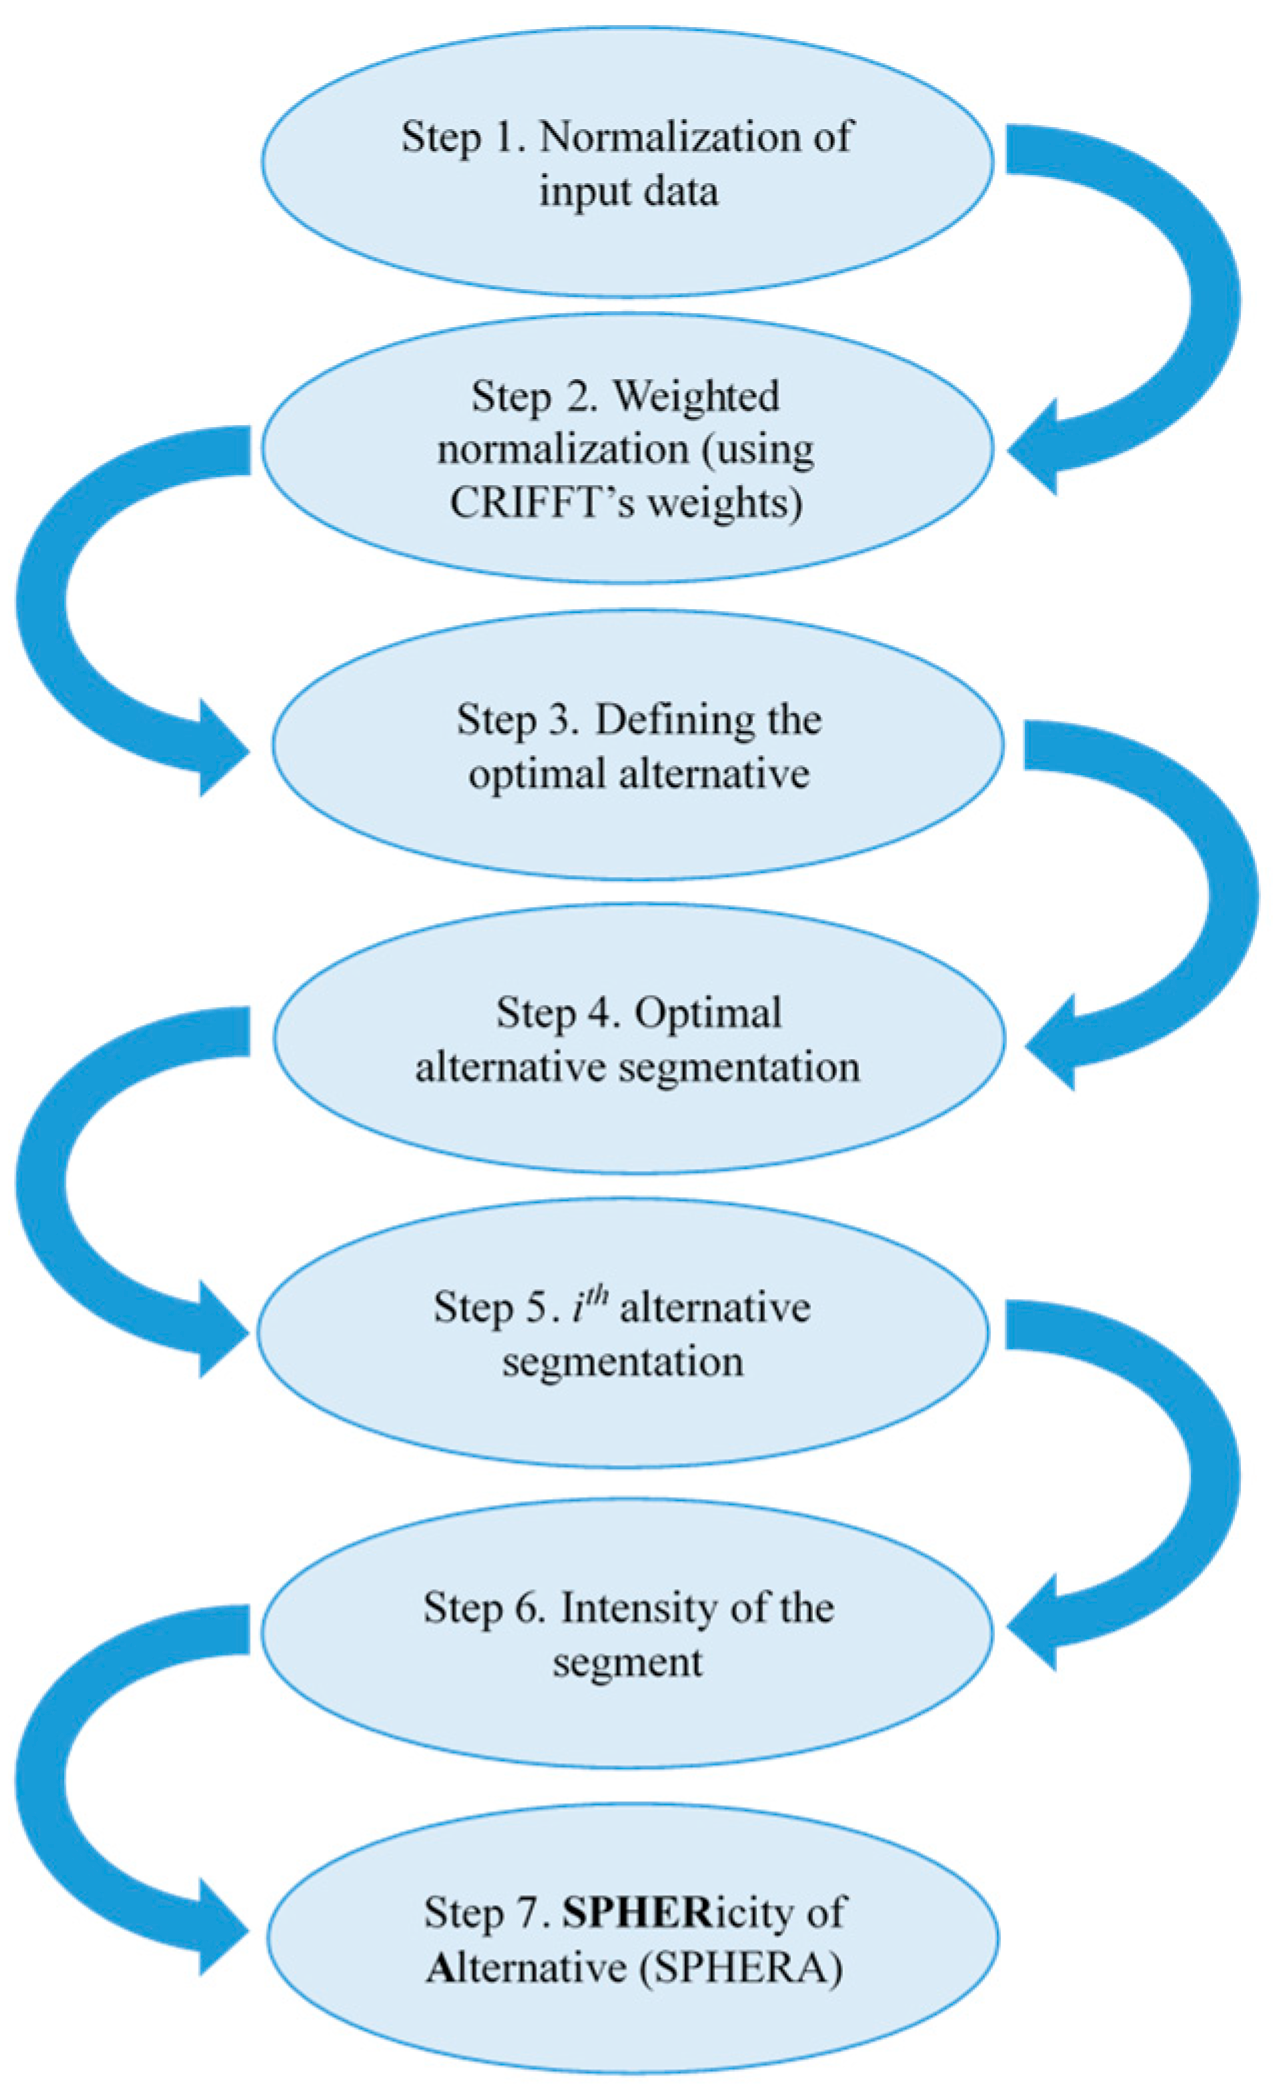
A flowchart of the CRIFFT method is presented in Figure 2.
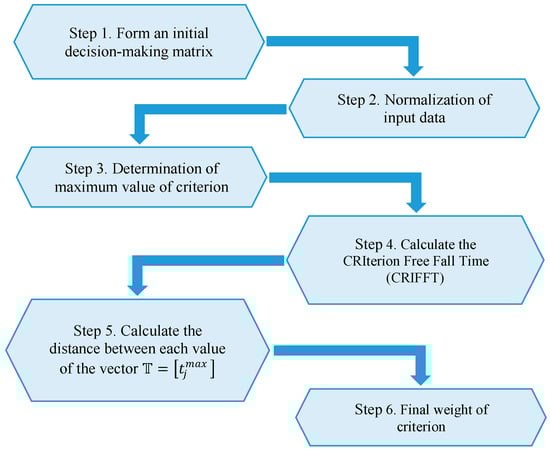
Figure 2.
CRIFFT objective weighting method.
4. SPHERicity of Alternative (SPHERA) Method
The SPHERA method presents a new multi-criteria decision-making (MCDM) method to find the best solution, i.e., to rank the alternatives. This method is based on quantifying the sphericity of an alternative and is called the SPHERA (SPHERicity of Alternative) method. Using the expression for the computation of the sphericity of an oblate spheroid, the sphericity of an alternative can be evaluated. Since the sphericity equation contains two main components, the combination of the optimal alternative and each alternative is utilized for calculating the sphericity of an alternative.
The SPHERA-MCDM framework represents a novel methodology for ranking alternatives. This method is characterized by simplicity and a relatively short time needed for the calculation process. Also, this method has a high flexibility of uncertain and fuzzy data involved, as well as a high degree of integration and cooperation with all weighting methods. This method demonstrates high stability and the potential for application in real-world situations. Finally, the greatest contribution of this method is the application of the fundamental phenomenon from geometry to the process of ranking the alternatives.
To form an initial decision-making matrix, the decision-maker must first create a set of alternatives with respect to defined set of criteria, as follows:
where
- —a given set of alternatives;
- —a given set of criteria;
- —the total number of alternatives;
- —the total number of criteria;
- —an assessment of alternative Ai with respect to a set of criteria.
The newly proposed SPHERA method consists of the following steps:
Step 1. Normalization of the input data.
The linear normalization technique is used to transform the input data from the initial decision-making matrix considering the criterion tendency (max or min).
For beneficial (maximization) criteria:
For non-beneficial (minimization) criteria:
Step 2. Weighted normalization.
Weighted normalization is based on the product of the criterion weight with the corresponding normalized value , using the following method:
The result of weighted normalization is the weighted normalized matrix, shown as:
Step 3. Defining the optimal alternative.
An optimal alternative consists of elements that are determined in the following way:
The final set of the optimal alternative is shown as follows:
Step 4. Optimal alternative segmentation.
Optimal alternative segmentation represents the division of the optimal alternative into two subsets or two portions. The set can be illustrated as the union of the two subsets:
If characterizes the total number of benefit criteria, then denotes the total number of cost criteria. Accordingly, the optimal alternative is determined as follows:
Step 5. i-th alternative segmentation.
As it described in Step 4, the i-th alternative segmentation is defined in a similar way:
Step 6. Intensity of the segment.
For the optimal alternative, the intensity of the segment can be calculated as follows:
where
- —the intensity for the optimal benefit alternative.
- —the intensity for the optimal cost alternative.
The intensity for i-th alternative is computed in the same way as for the optimal alternative:
where
- —the intensity for the i-th benefit alternative.
- —the intensity for the i-th cost alternative.
Step 7. SPHERicity of Alternative (SPHERA).
In general, sphericity is a measure of how closely an object’s shape resembles a perfect sphere. If the surface area and volume of the observed object are known, the sphericity can be easily quantified using the following equation [55,56,57]:
where
- is the volume of the observed object;
- is the surface area of the observed object.
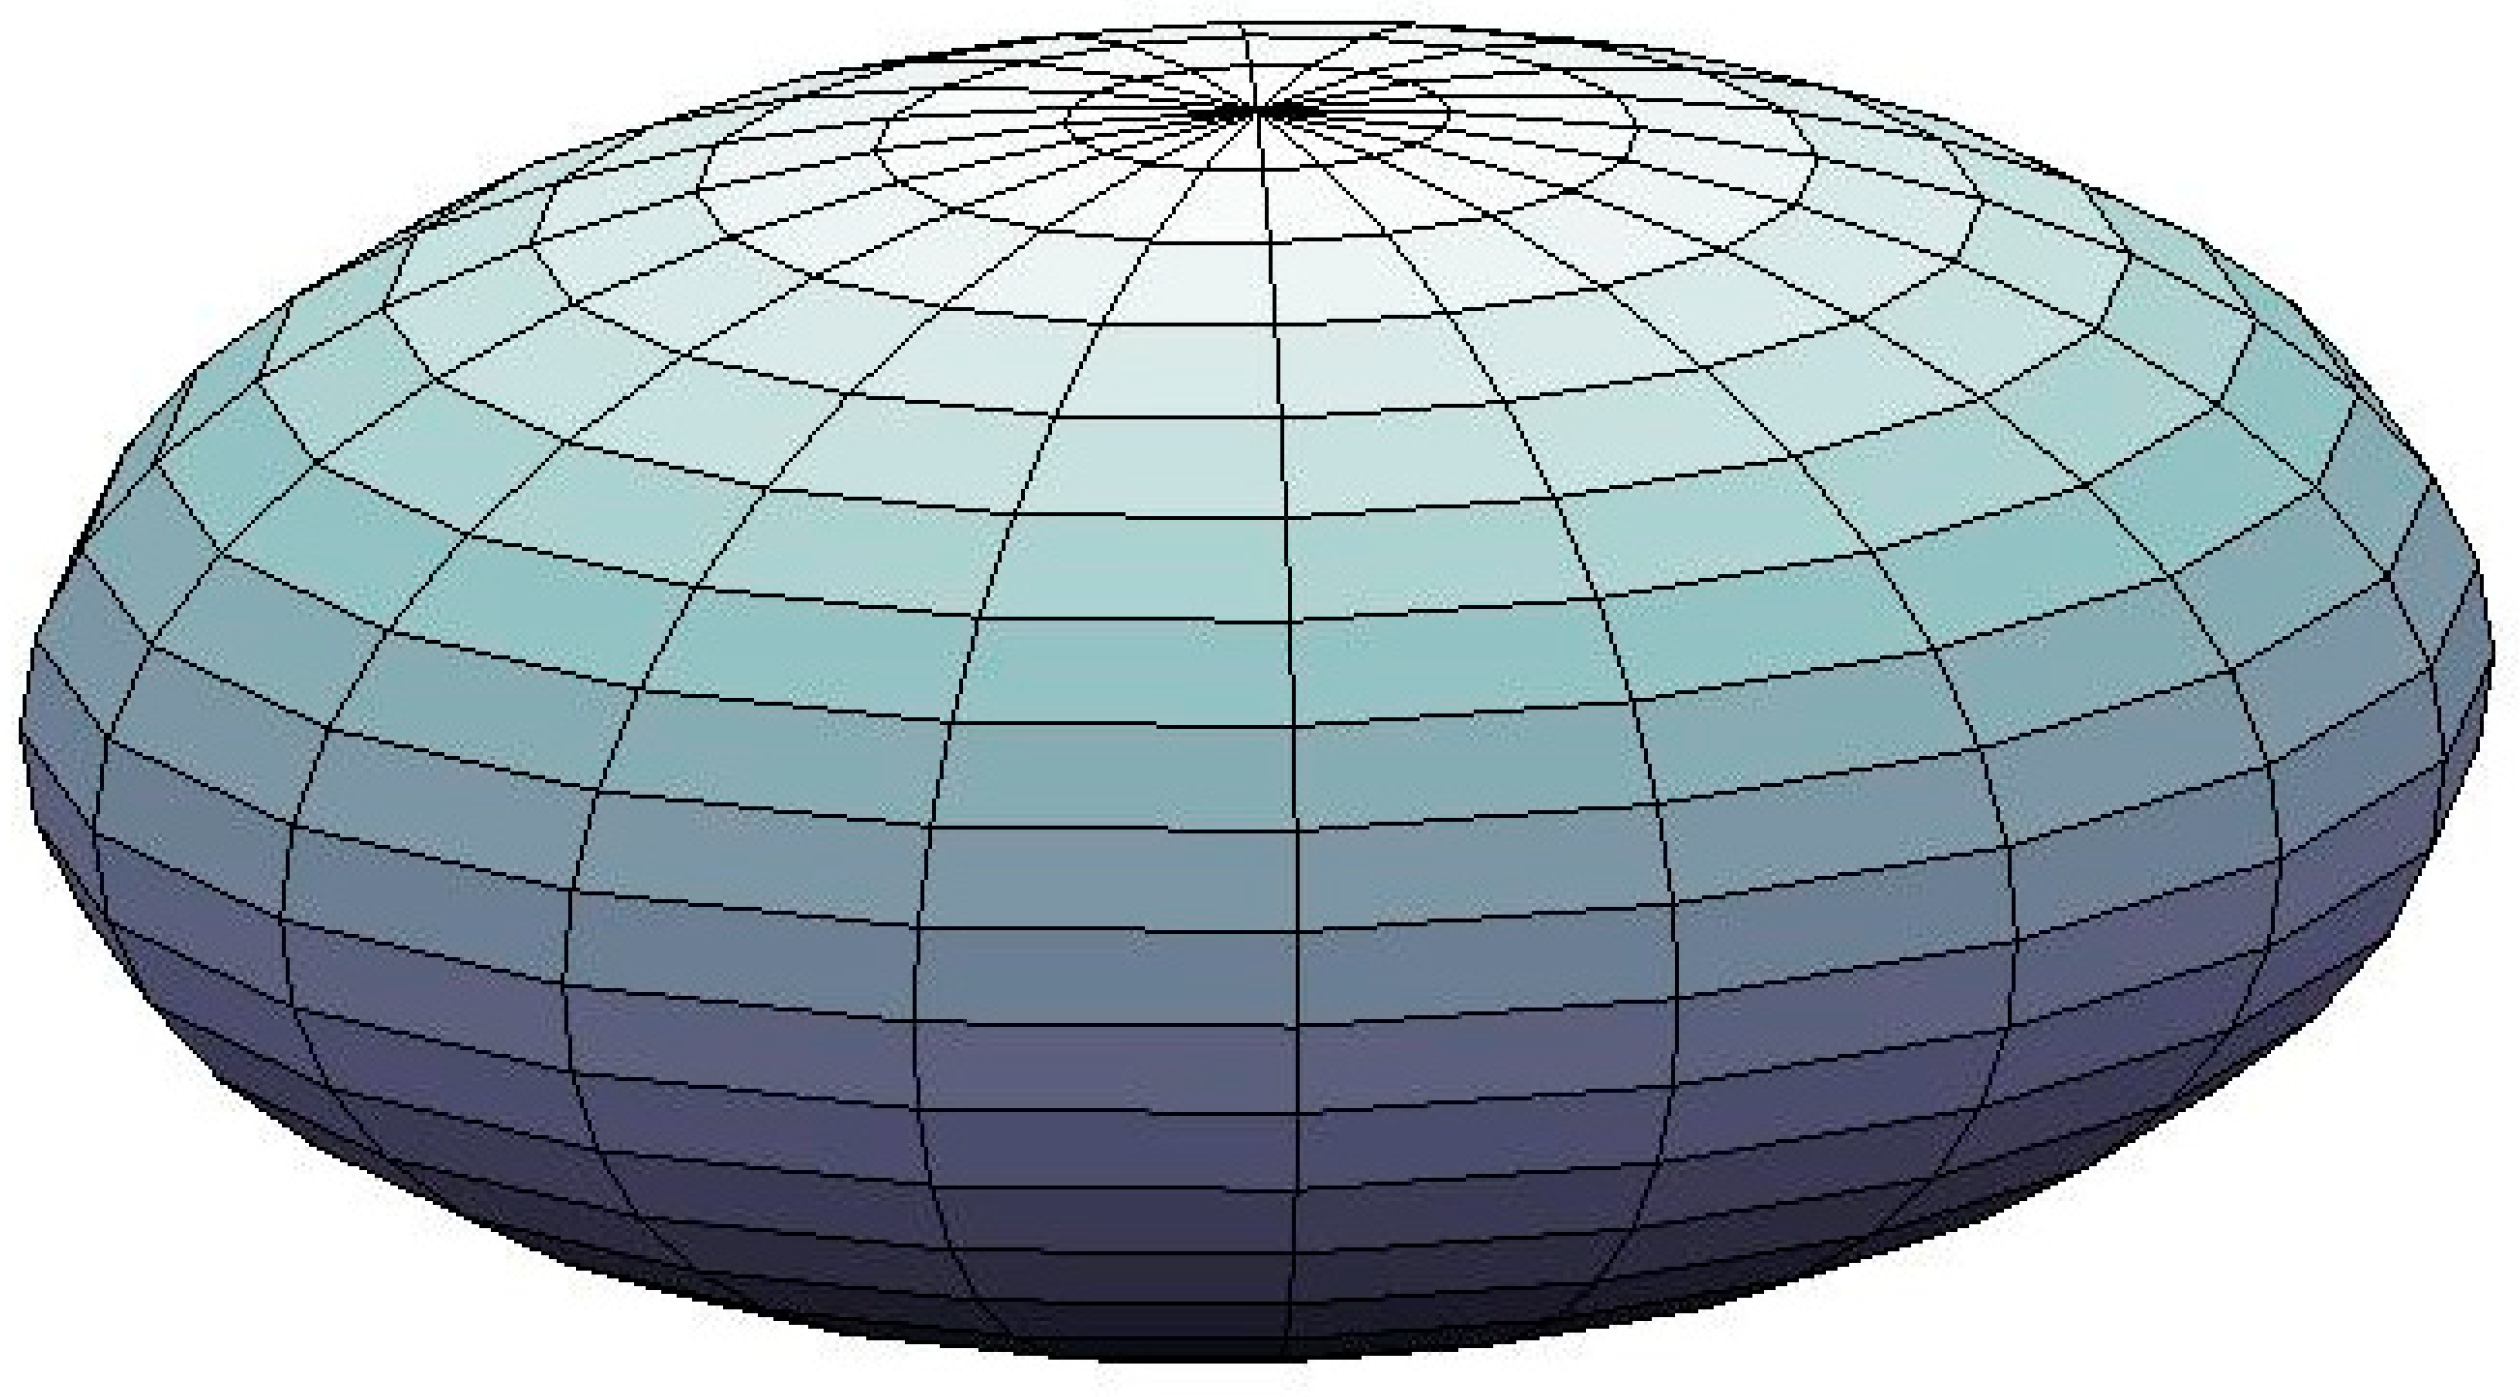
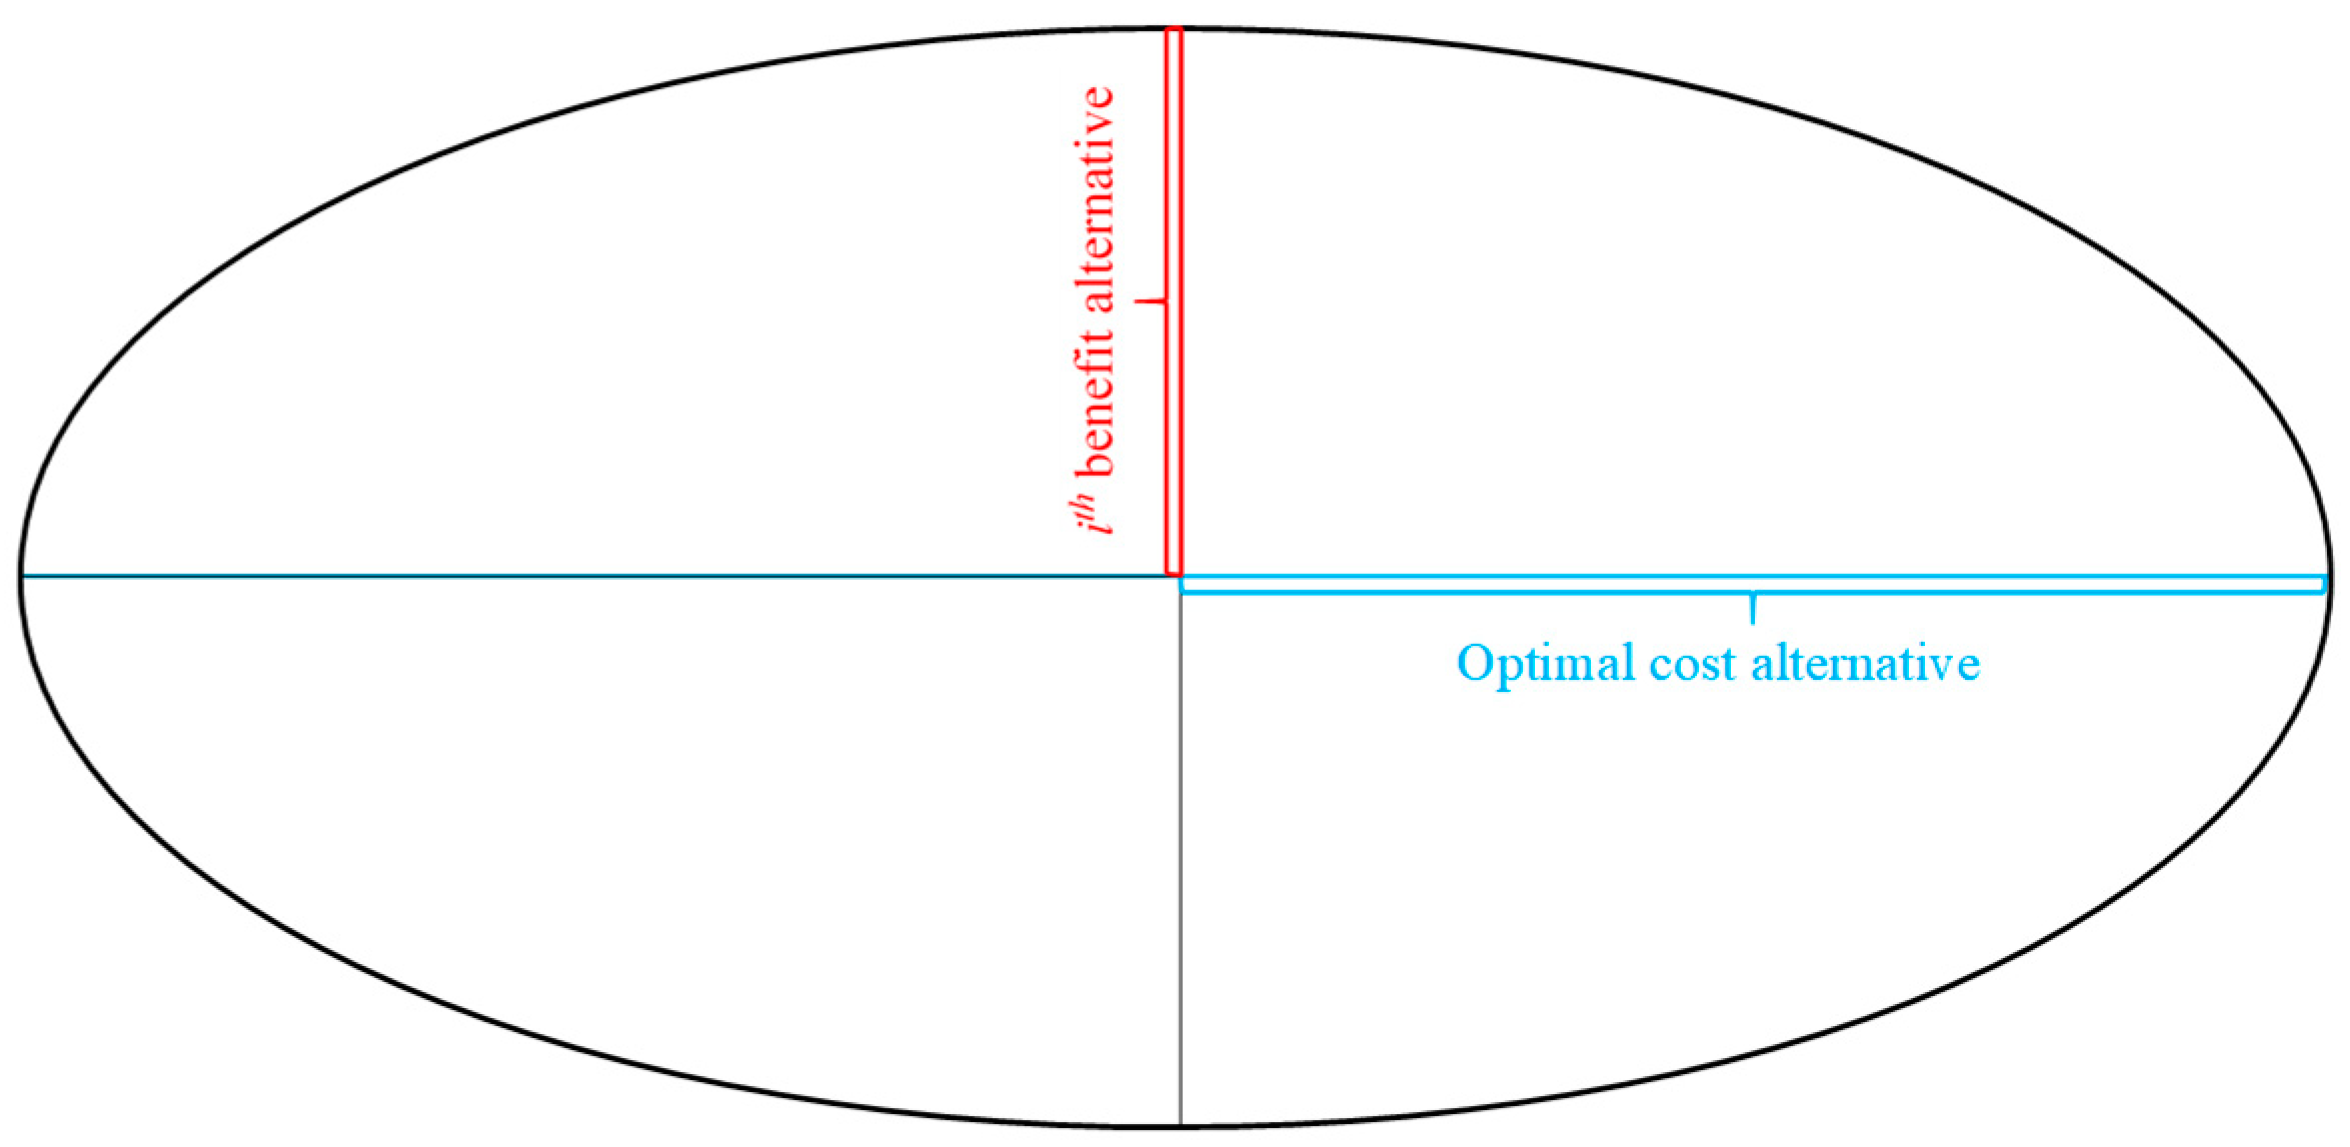
There are different shapes of objects and each of them has its own specific dimensions that are used for the numerical computation of sphericity. One of them is an oblate spheroid that has a similar shape to the planet Earth. In Figure 3, an oblate spheroid is graphically illustrated, while the cross section of an oblate spheroid with geometrical elements is represented in Figure 4.
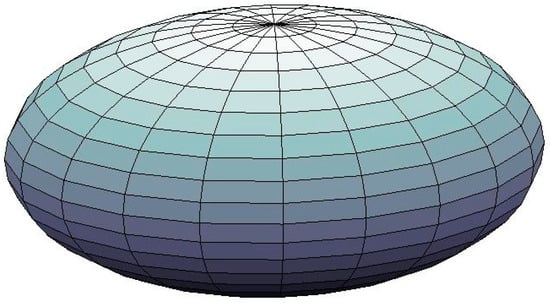
Figure 3.
Graphical illustration of an oblate spheroid.
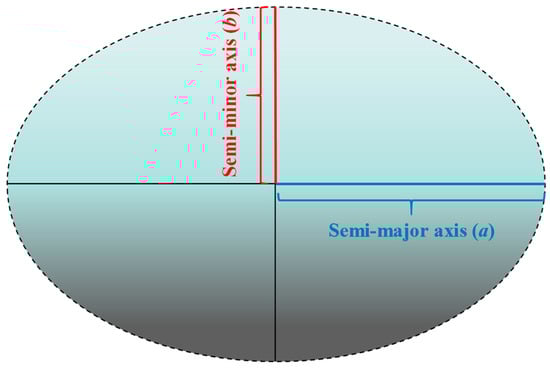
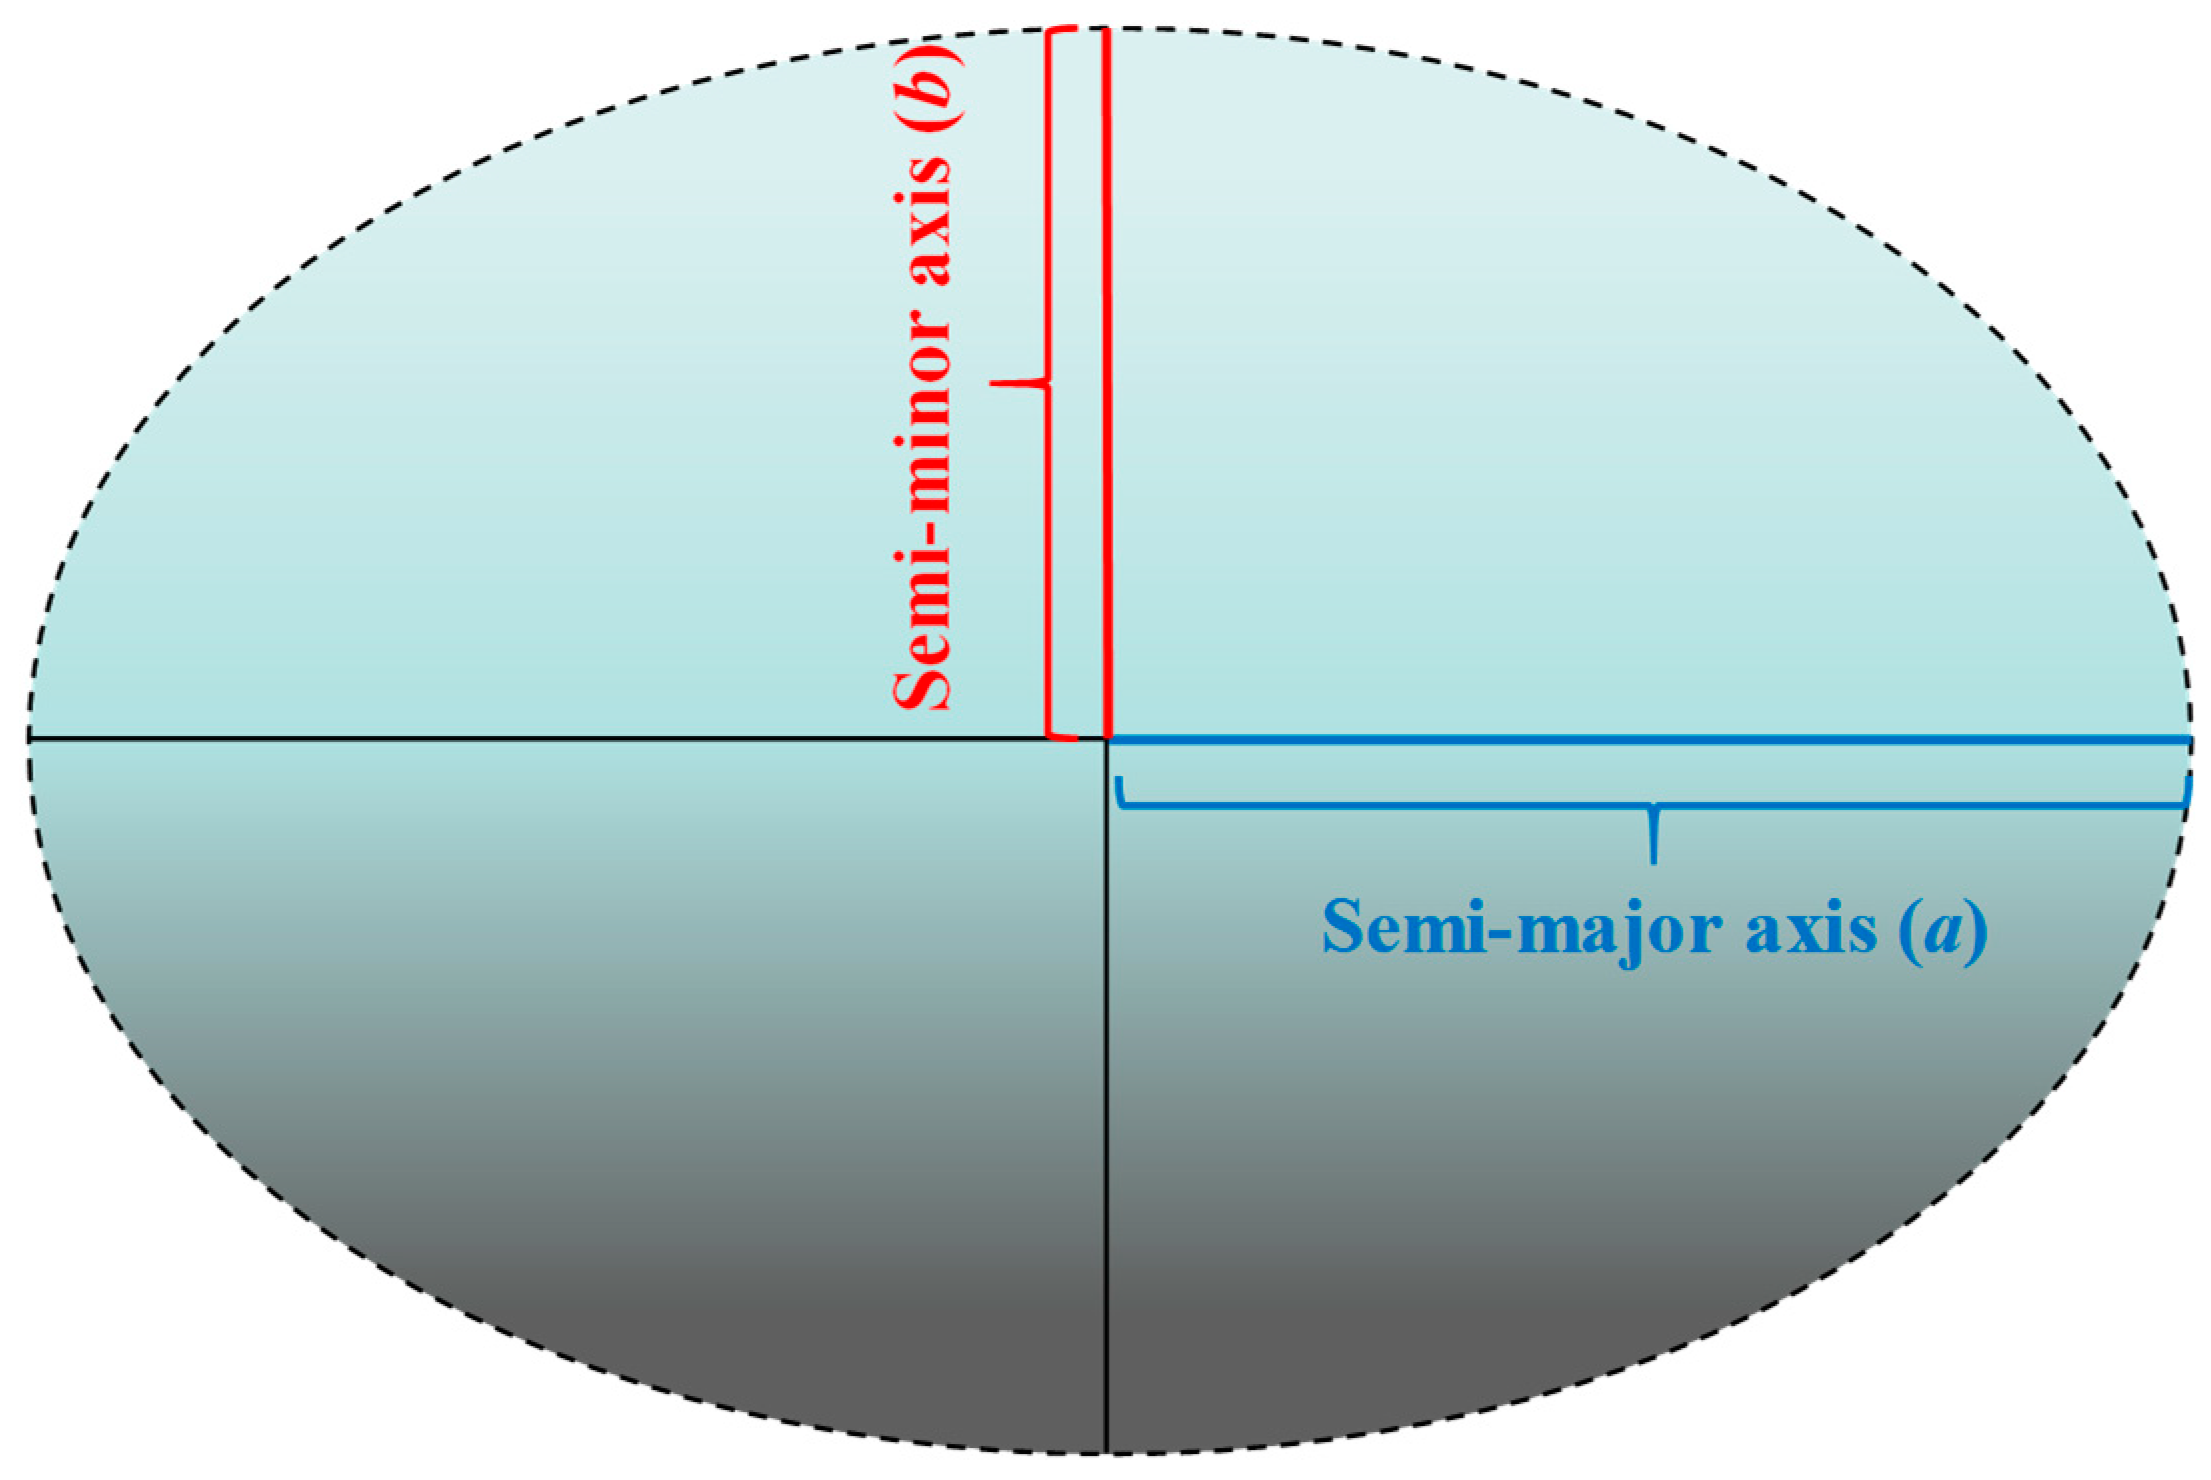
Figure 4.
Cross section of an oblate spheroid with geometrical elements.
As can be seen from Figure 3 and Figure 4, an oblate spheroid is defined by two main components that describe its shape, semi-major axis (a) and semi-minor axis (b). Based on this, the sphericity of an oblate spheroid can be calculated as follows:
where
- is the semi-major axis;
- is the semi-minor axis.
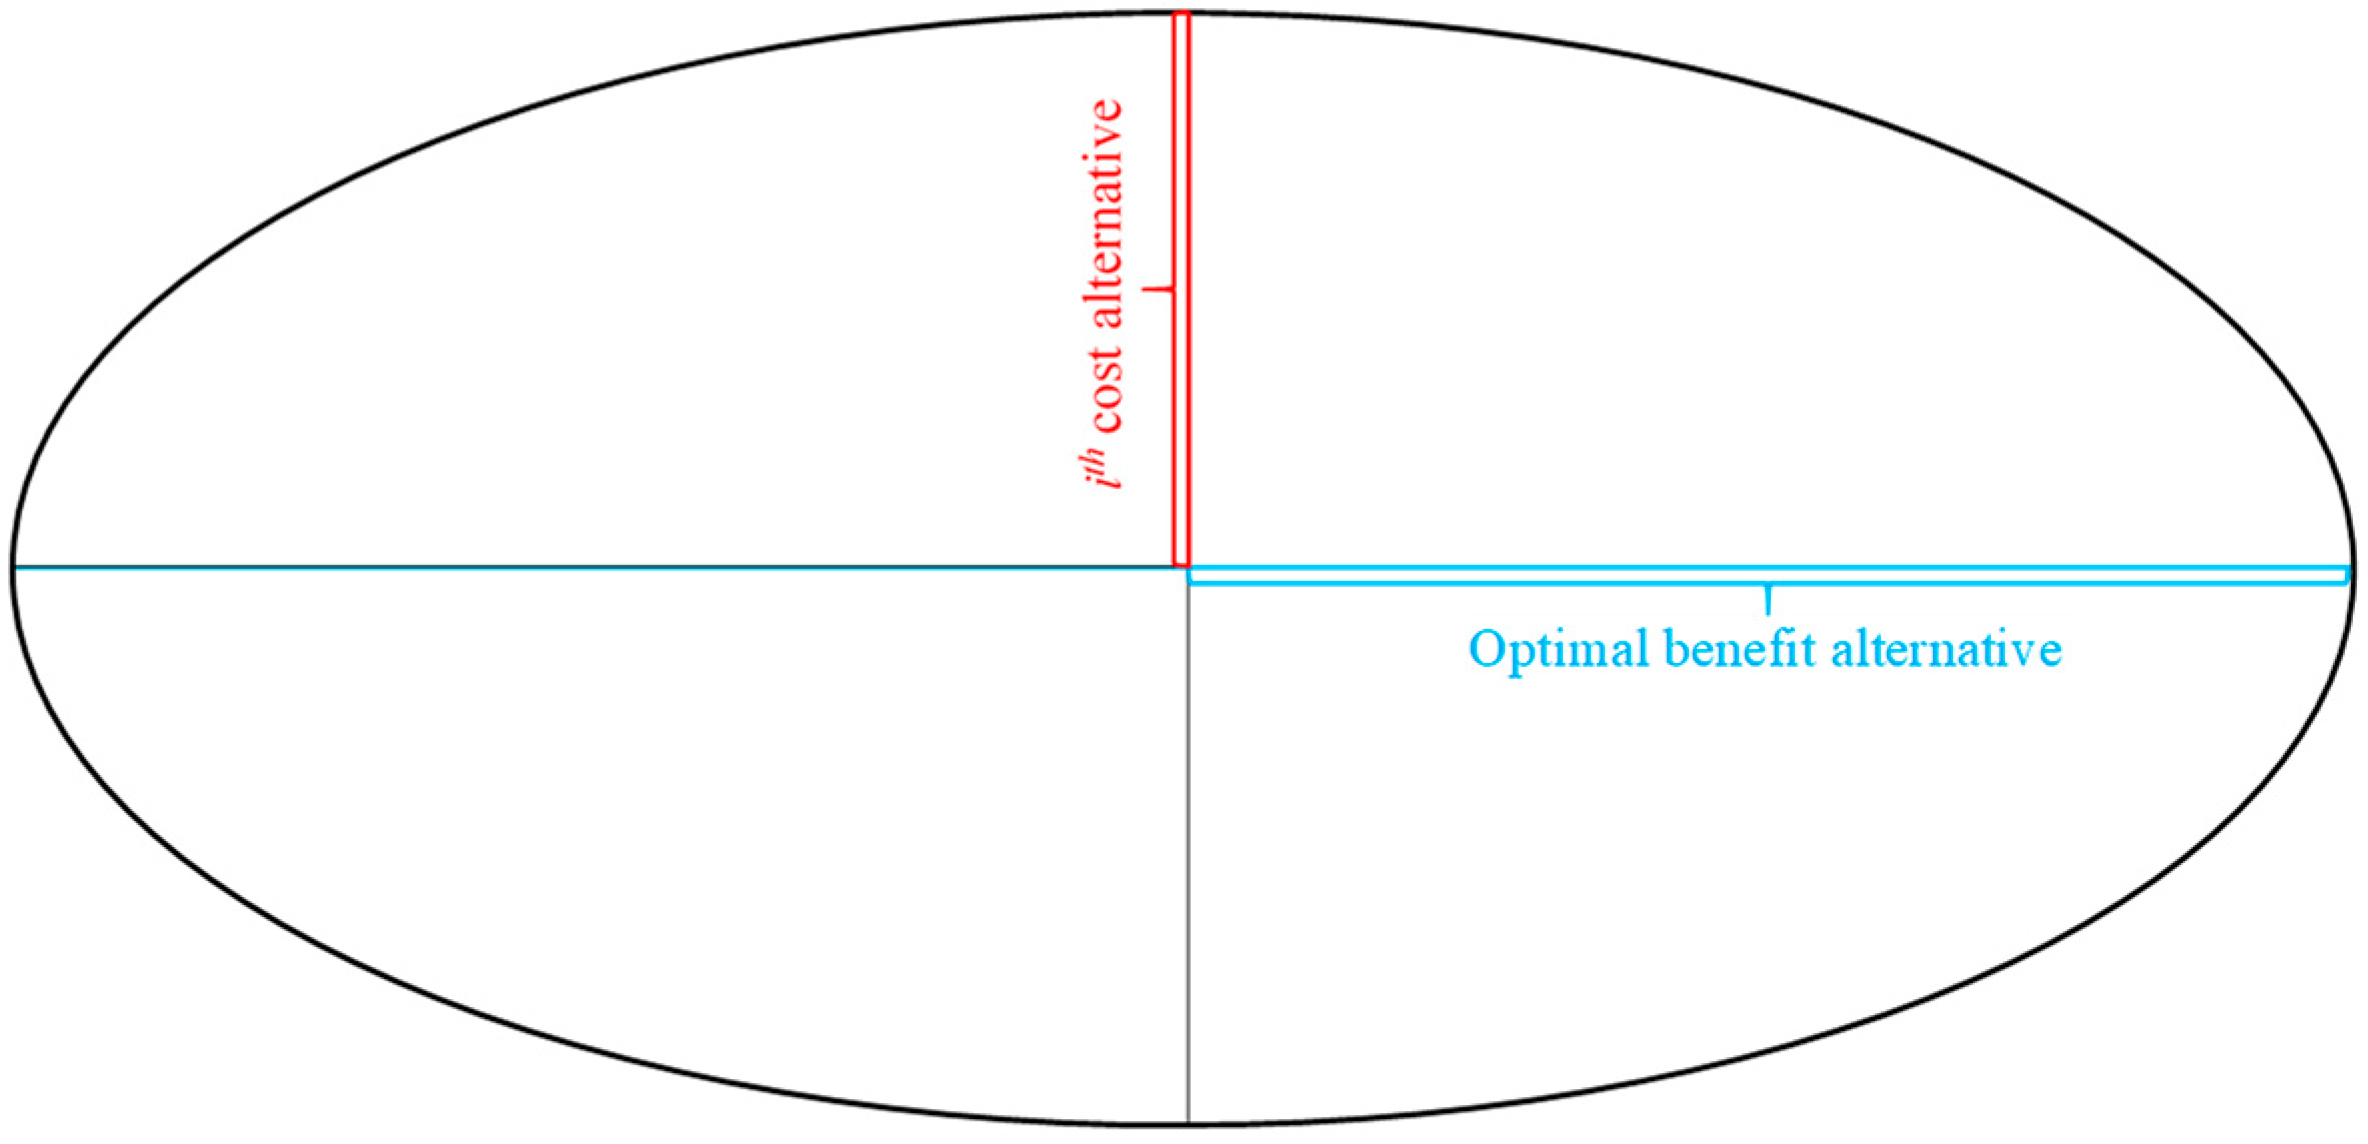
By exploring the relationship between the intensity of the optimal and each alternative from one side, and two main components (axles) of an oblate spheroid from the other side, an idea for calculating the sphericity of an alternative was developed. The sphericity of an alternative can be defined as a measure of the degree to which the alternative tends to take the shape of a sphere. Based on Figure 3 and Figure 4 as well as Equation (28), the sphericity of an alternative can be created and defined. The axis of an oblate spheroid can be treated as the optimal (benefit, cost) alternative and the i-th (benefit, cost) alternative components. Graphical illustrations of the sphericity of an alternative are presented in Figure 5 and Figure 6. In Figure 5, the semi-major axis a presents the optimal benefit alternative while the semi-minor axis b denotes i-th cost alternative. In Figure 6, the semi-major axis a presents the optimal cost alternative while the semi-minor axis b denotes the i-th benefit alternative.

Figure 5.
Optimal benefit alternative with i-th cost alternative.

Figure 6.
Optimal cost alternative with i-th benefit alternative.
Inspired by the sphericity of an oblate spheroid and Equation (28), the sphericity of the combination between the optimal benefit alternative and the i-th cost alternative can be calculated as follows:
Analogically, the sphericity of the combination between the optimal cost alternative and the i-th benefit alternative is:
Finally, the sphericity of an alternative is computed as follows:
Alternatives are ranked according to the descending order of .
A flowchart of the CRIFFT method is presented in Figure 7.

Figure 7.
SPHERA decision-making model.
5. Numerical Example
The management of an underground mining company is faced with several technological problems during the creation of a new project for the excavation of a new zones in an underground gold deposit. Since the room and pillar underground mining method with backfilling is selected as the most suitable method for ore extraction, two technological problems arise that depend on the application of a specific type of material. The first problem is related to material selection for the paste backfilling operation in order to re-fill mined-out stopes (rooms). After the hardening of the paste backfill, the parts considered to be quite worthy with a high-grade quality of ore are detected in unmined pillars that should be subsequently excavated. In this way, ore recovery from deposits is significantly increased, which has a positive influence on the economical part of the mining project. In addition to the backfilling challenge, another issue arises during the development of a new roadway or when extending the existing underground roadways. It is inevitable that some of the underground roadway sections will be unstable and prone to collapse. In those cases, it is necessary to support these critical sections to prevent the roof from falling down. Supporting implies the application of some type of material whose function is to ensure stability and to provide safe production processes. Accordingly, the second problem refers to selecting a material to support the unstable underground roadway sections.
Analyzing these two typical technological problems in underground mines, it is concluded that one type of material can be used to solve both problems, backfilling and supporting, simultaneously. For that purpose, concrete and its mixtures are selected as a material that would provide the most reliable and the most efficient results. Concrete is one of the most commonly used materials in underground mines to perform many activities during production processes and other technological operations. Accordingly, the core of this paper is to choose the optimal concrete mixture which would ensure stability and durability and at the same time would be high-quality and sustainable to solve all mentioned challenges.
Since this problem belongs to the decision-making area, it is necessary to create an initial decision-making matrix which is composed of a set of alternatives according to a set of criteria. There are a total of ten concrete mixtures that are treated as a set of alternatives. On the other hand, there are four important factors that have a significant impact on backfilling and supporting, and they constitute a set of criteria. Table 1 shows the proportions of the concrete mixtures designed, including the content of coarse and fine aggregates, cement, fly ash and water. The criteria of the concrete mixtures used for selecting the optimal concrete mixture are demonstrated in Table 2. These are costs, compressive strength, final setting time and environmental impact.

Table 1.
Concrete mixture design proportions.
Table 2.
Criteria of concrete mixtures used for selecting the optimal concrete mixture.
Considering all these aspects, the numerical example is divided into two subsections. The first subsection refers to a detailed description of a numerical calculation by the CRIFFT method. The second subsection is related to a comprehensive explanation of a numerical calculation by the SPHERA method.
It should be noted that this numerical example of hypothetical nature is used to verify the developed methodology.
Each concrete mixture (from Mix 1 to Mix 10) contains the basic components, such as coarse and fine aggregates, cement, fly ash and water, with different ratios. For ease of understanding, Mix 1 to Mix 10 are denoted as A1 to A10 in the decision-making process. Each component that participates in a concrete mixture design is expressed in kg/m3.
Aggregates are the most dominant and most common component in the concrete mixture. The content of coarse aggregates varies from 310 to 860 kg/m3 while the range of fine aggregates is from 250 to 820 kg/m3 (Table 1).
Cement (C) presents the primary binder in every concrete mixture. Since the cement is the active component, its main goal is to fuse different sizes and dimensions of aggregates into a compact mass. Although there are several types of cement, the most common type of cement used for concrete design is ordinary Portland cement (OPC). The content of cement in the mixtures (Table 1) oscillates from 130 kg/m3 to 460 kg/m3.
Fly ash (FA) is a waste material produced from a coal-fired power plant. Due to its physical and mechanical properties, FA is widely used as a cement replacement material. FA accounts for 75–80% of the total 600 million tons of ash produced worldwide annually [58]. Applying FA in concrete design has many positive sides, such as improving workability, pumpability, setting time, air content, etc., and reducing CO2 emissions from cement as well as minimizing water in the hydration process. Because of these practical effects on the environment, concrete constructed with FA can be defined as a ‘green’ or sustainable building material [59]. The content of fly ash varies from 30 kg/m3 to 250 kg/m3 in the concrete mixtures (Table 1).
Water represents an unnecessary but also active component of every concrete mixture. The binding and hardening processes of concrete are realized only by the presence of water. Ordinary drinking water is always an acceptable and useful solution for concrete design. The content of water changes from 60 kg/m3 to 220 kg/m3 in the concrete mixtures (Table 1).
Costs—C1
From the economic point of view, costs are one of the most significant factors for the evaluation and optimization concrete mixtures. The price of each component in mixture, transporting the fresh concrete to the installation site and the method for the installation of concrete are just some of components included in total cost calculations. Certainly, achieving as the highest quality concrete mixture with the lowest costs possible is one of the desired goals. Accordingly, this is the main reason why this criterion tends to be a minimum. The costs are expressed in USD/m3.
Compressive strength—C2
Besides costs, compressive strength is also one of the major factors for estimating the quality of concrete mixtures. Compressive strength is the most important mechanical characteristic indicating how strong and hard concrete is. In an underground mine, especially for backfilling and supporting operations, compressive strength indicates the degree of loading affected by the roof above the solidified concrete mass. The higher the compressive strength, the higher the load bearing capacity and vice versa. Because of that aspect, this criterion should be a maximum. The compressive strength is usually shown in MPa.
Final setting time—C3
Final setting time is another attribute which affects the mechanical properties of the hardened concrete mass. The final setting time should not be exiguous or slow, depending on the environmental conditions and cement composition. This characteristic has the greatest impact on compressive strength. This time is of great importance for engineers to plan and organize the next activities in the production process. Considering all of these points, this criterion should be a minimum and is expressed in hours.
Environmental impact—C4
During the optimization and analysis of concrete mixtures, environmental impact presents an inevitable and very important feature. Reducing the need for other building materials by using the coal combustion waste from disposal sites as well as reducing CO2 emissions are some of the environmental benefits of the concrete mixture designed by fly ash. Therefore, this criterion depends on the amount of fly ash in the cement mix (FA + C). The higher the percentage share of fly ash in the cement mix, the lower the environmental impact and vice versa. This criterion tends to be a minimum. The percentage share of fly ash in the cement mix is described by the linguistic scale in Table 3.
Table 3.
The percentage share of fly ash in the cement mix (FA + C).
In addition to the fly ash content in a cement mix, there are many different factors that can be used to determine the environmental impact. Certainly, CO2 emissions, embodied energy, lifecycle impact and transportation-related emissions are some of the very important characteristics that should be considered when optimizing sustainable concrete. Another way to enhance the developed methodology in further research is to refer to the incorporation of the mentioned attributes into the decision-making procedure.
5.1. A New CRIFFT Objective Weighting Method
To define the weight coefficients of criteria, a novel CRIFFT objective weighting method is formulated. A detailed numerical computation is interpreted in the Tables below.
Input data, i.e., the original values of each alternative with respect to the appropriate criterion, form an initial decision-making matrix as explained in Equation (4), in Step 1. In Table 4, an initial decision-making matrix is presented.
Table 4.
Initial decision-making matrix.
The next step (Step 2) refers to the transformation of initial values into normalized values. Using Equation (5), the normalized decision-making matrix is constructed and the obtained values are shown in Table 5.
Table 5.
The normalized decision-making matrix.
After input data normalization, it is necessary to determine the maximum value of each criterion by Equations (6) and (7), which is defined in Step 3. The calculated values are displayed in Table 6.
Table 6.
Maximum criterion values.
Equations (8) and (9), as described in Step 4, are employed to compute CRIterion Free-Fall Time (CRIFFT) for the j-th criterion with respect to the i-th alternative, as well as for the vector composed of the maximum values of criterion. The defined values are illustrated in Table 7 and Table 8.
Table 7.
CRIterion Free-Fall Time (CRIFFT) of j-th criterion with respect to i-th alternative.
Table 8.
CRIterion FreeFall Time (CRIFFT) of the vector
Step 5 relates to the calculation of the distance between each value of the vector and the j-th criterion with respect to the i-th alternative using Equation (10) (Table 9), while the final weights of the criteria are assessed by Equation (11) (Table 10), as is clarified in Step 6.
Table 9.
Value of distances
Table 10.
Final weights of criteria.
5.2. Novel SPHERA Method for Ranking the Alternatives
A comprehensive numerical example of the novel SPHERA method for ranking the alternatives is demonstrated in the following tables.
Analogously to Step 1 and Step 2 in the CRIFFT method, the initial decision-making matrix and normalization technique of the initial matrix are performed in the SPHERA method. Normalized values of the initial decision-making matrix, using Equations (13) and (14), are presented in Table 11.
Table 11.
Normalized values of the initial decision-making matrix.
Weight coefficients, computed by the CRIFFT method, are used to form the weighted normalized decision-making matrix by Equations (15) and (16). Obtained values are shown in Table 12.
Table 12.
The weighted normalized decision-making matrix.
After creating a weighted normalized decision-making matrix, the process of defining the optimal alternative is accessed. By utilizing Equations (17) and (18), the values are obtained and represented in Table 13.
Table 13.
Defining the optimal alternative.
The optimal and i-th alternative segmentation are realized by Equations (19)–(22). The values of optimal alternative segmentation are shown in Table 14 while the results of the i-th alternative segmentation are expressed in Table 15.
Table 14.
Optimal alternative segmentation.
Table 15.
i-th alternative segmentation.
Applying Equations (23)–(26), the intensity of the segment is determined. In Table 16, the intensity of the optimal alternative segmentation is pointed out. Analogously, Table 17 exhibits the values of the intensity of the i-th alternative segmentation.
Table 16.
The intensity of the optimal alternative segmentation.
Table 17.
The intensity of the i-th alternative segmentation.
Based on Equations (29)–(31), the sphericity of alternatives as well as the final ranking of alternatives are executed. The results are demonstrated in Table 18.
Table 18.
Sphericity of alternatives and final ranking.
6. Comparative Analysis
Analogously to the exhaustive numerical example, comparative analysis is also split into two parts. The first part clarifies the comparison analysis of the CRIFFT method with the objective weighting methods, while the second part analyses the SPHERA method compared to other MCDM methodologies.
6.1. Comparison of CRIFFT Method with Other Objective Weighting Methods
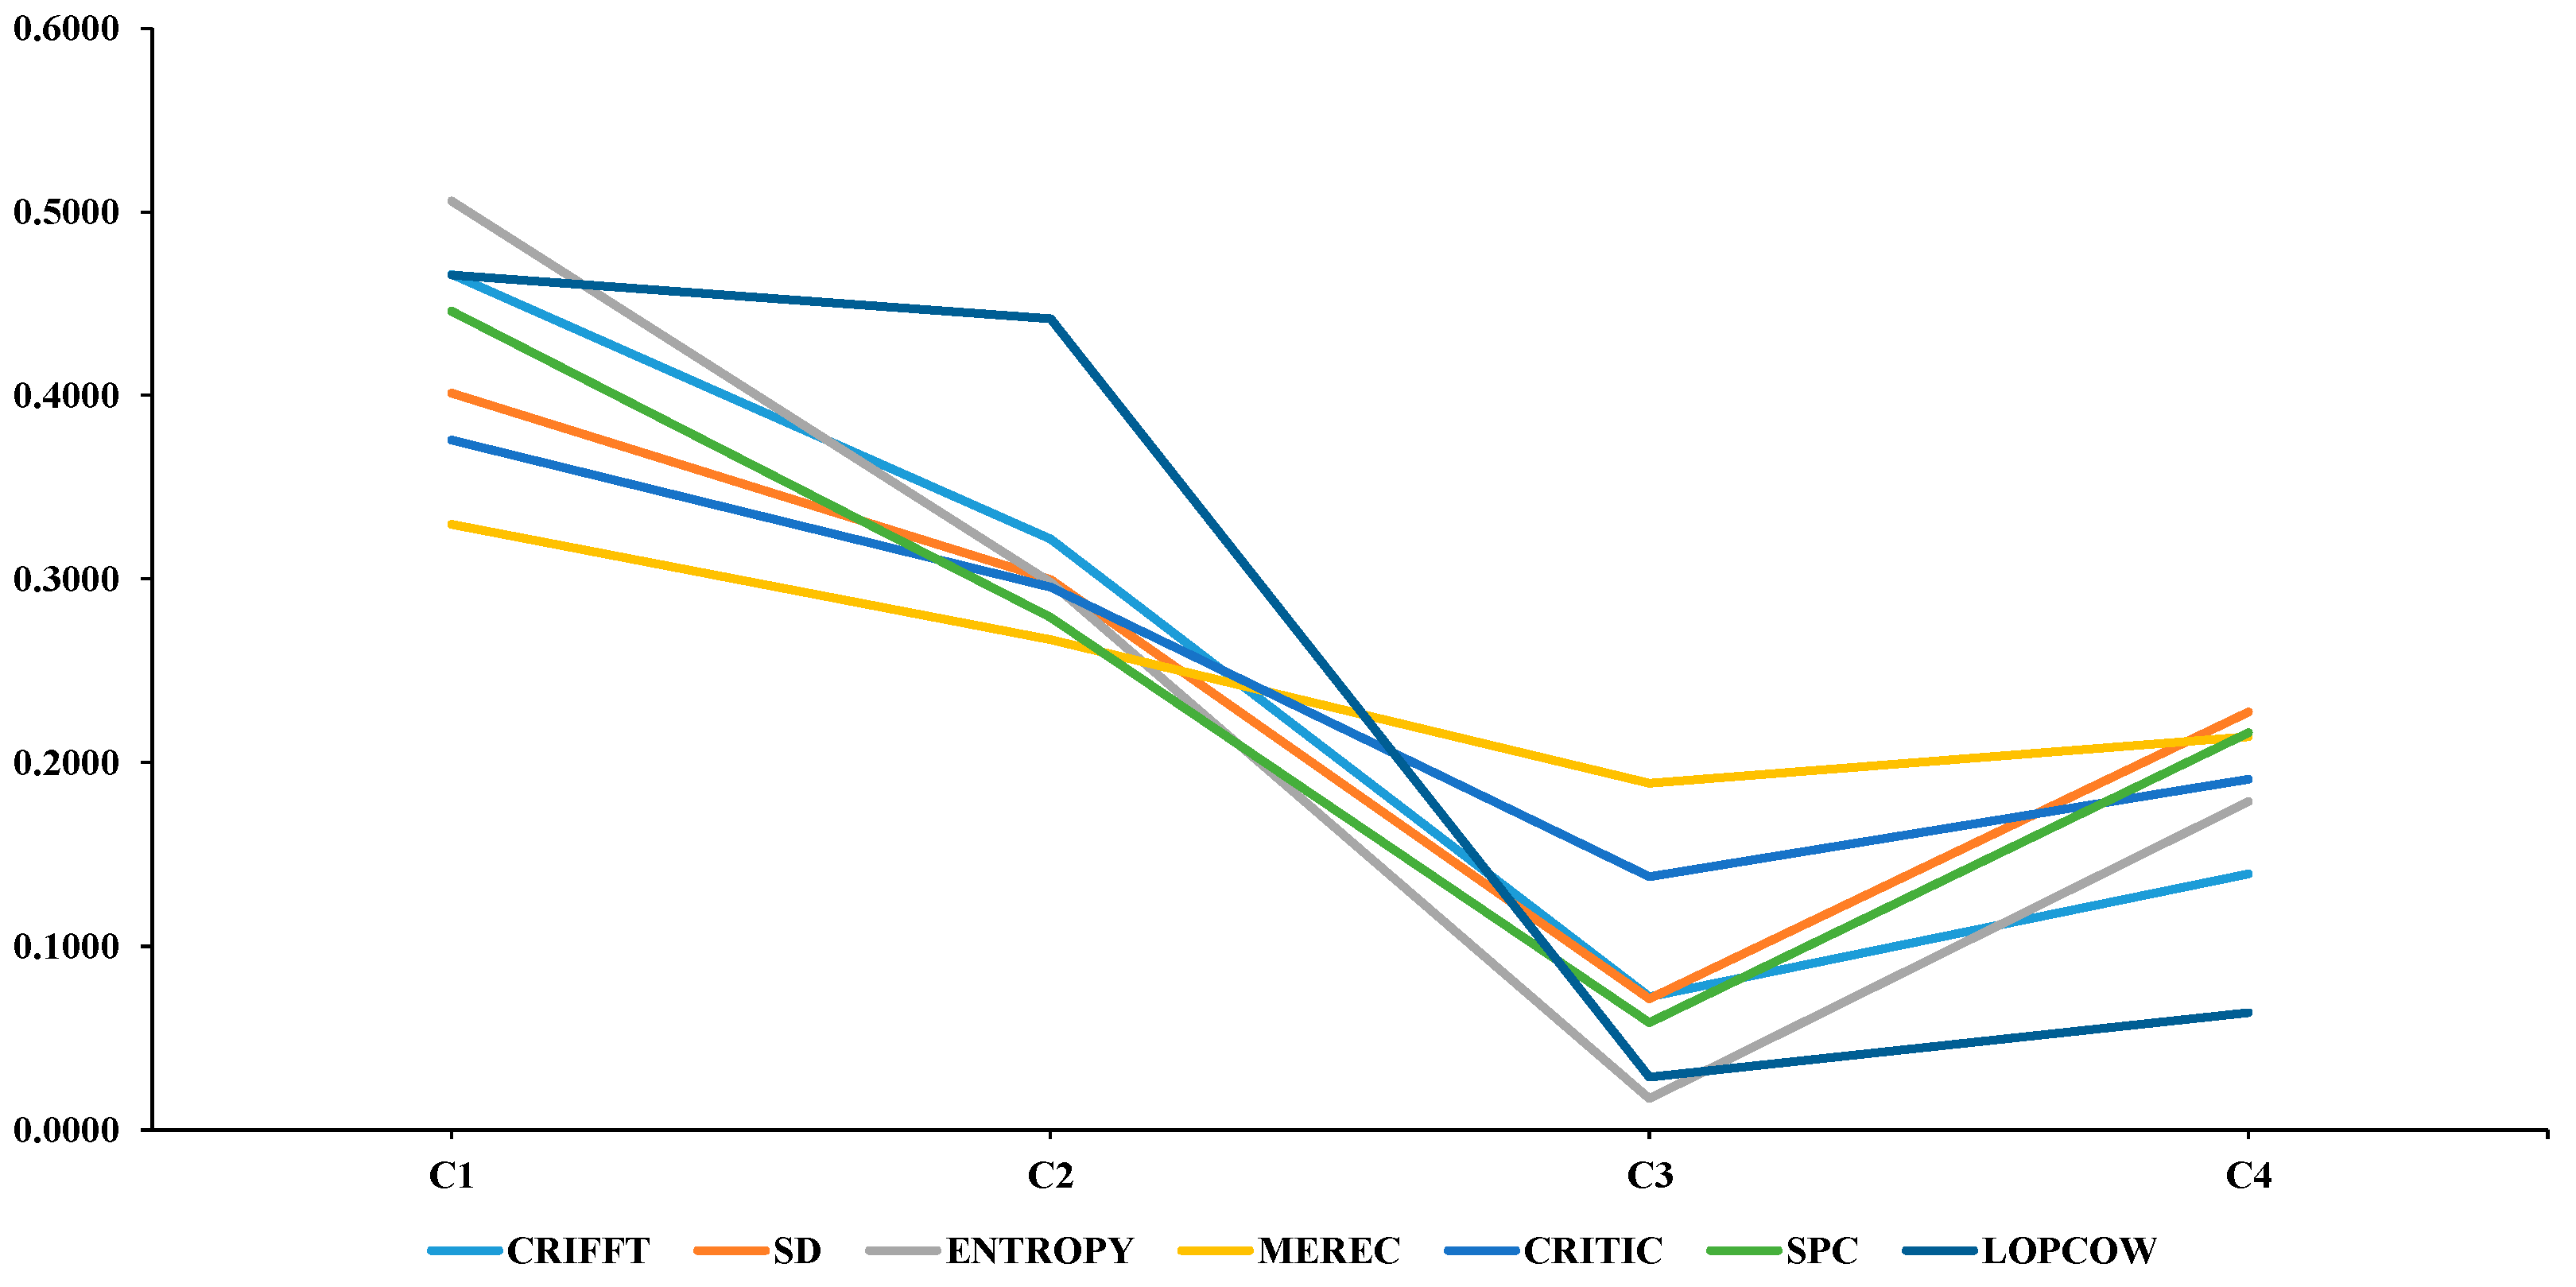
A new CRIFFT method is compared with traditional and relatively new objective weighting methods. Those are the SD (standard deviation), ENTROPY, MEREC, CRITIC, SPC and LOPCOW methods. Weight coefficients evaluated by all mentioned objective weighting methods are represented in Table 19 and are graphically illustrated in Figure 8.
Table 19.
Weights of criteria calculated by objective weighting methods.
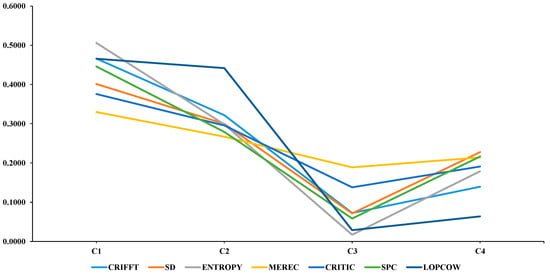
Figure 8.
Weight coefficients calculated by objective weighting methods.
The degrees of the association between objective weighting methods, i.e., the values of Spearman’s correlation coefficients, are shown in Table 20.
Table 20.
Spearman’s correlation coefficients between objective weighting methods.
From the obtained results and the visual explanation, it is clearly visible that the novel CRIFFT method is absolutely an acceptable and reliable method for defining the weights of criteria objectively. This is also supported by the calculated values of Spearman’s correlation coefficients, which are very high. The CRIFFT method stays shoulder to shoulder with the CRITIC method and MEREC method, with extremely high correlation coefficients of 0.9984 and 0.9960, respectively. The ENTROPY method follows the previous two methods with a correlation of 0.9794. A slightly lower but still very high correlation is achieved between the CRIFFT method and the SPC method, LOPCOW method and SD method with the following coefficients of 0.9571, 0.9519 and 0.9419.
6.2. Comparison of SPHERA Method with Other MCDM Methodologies
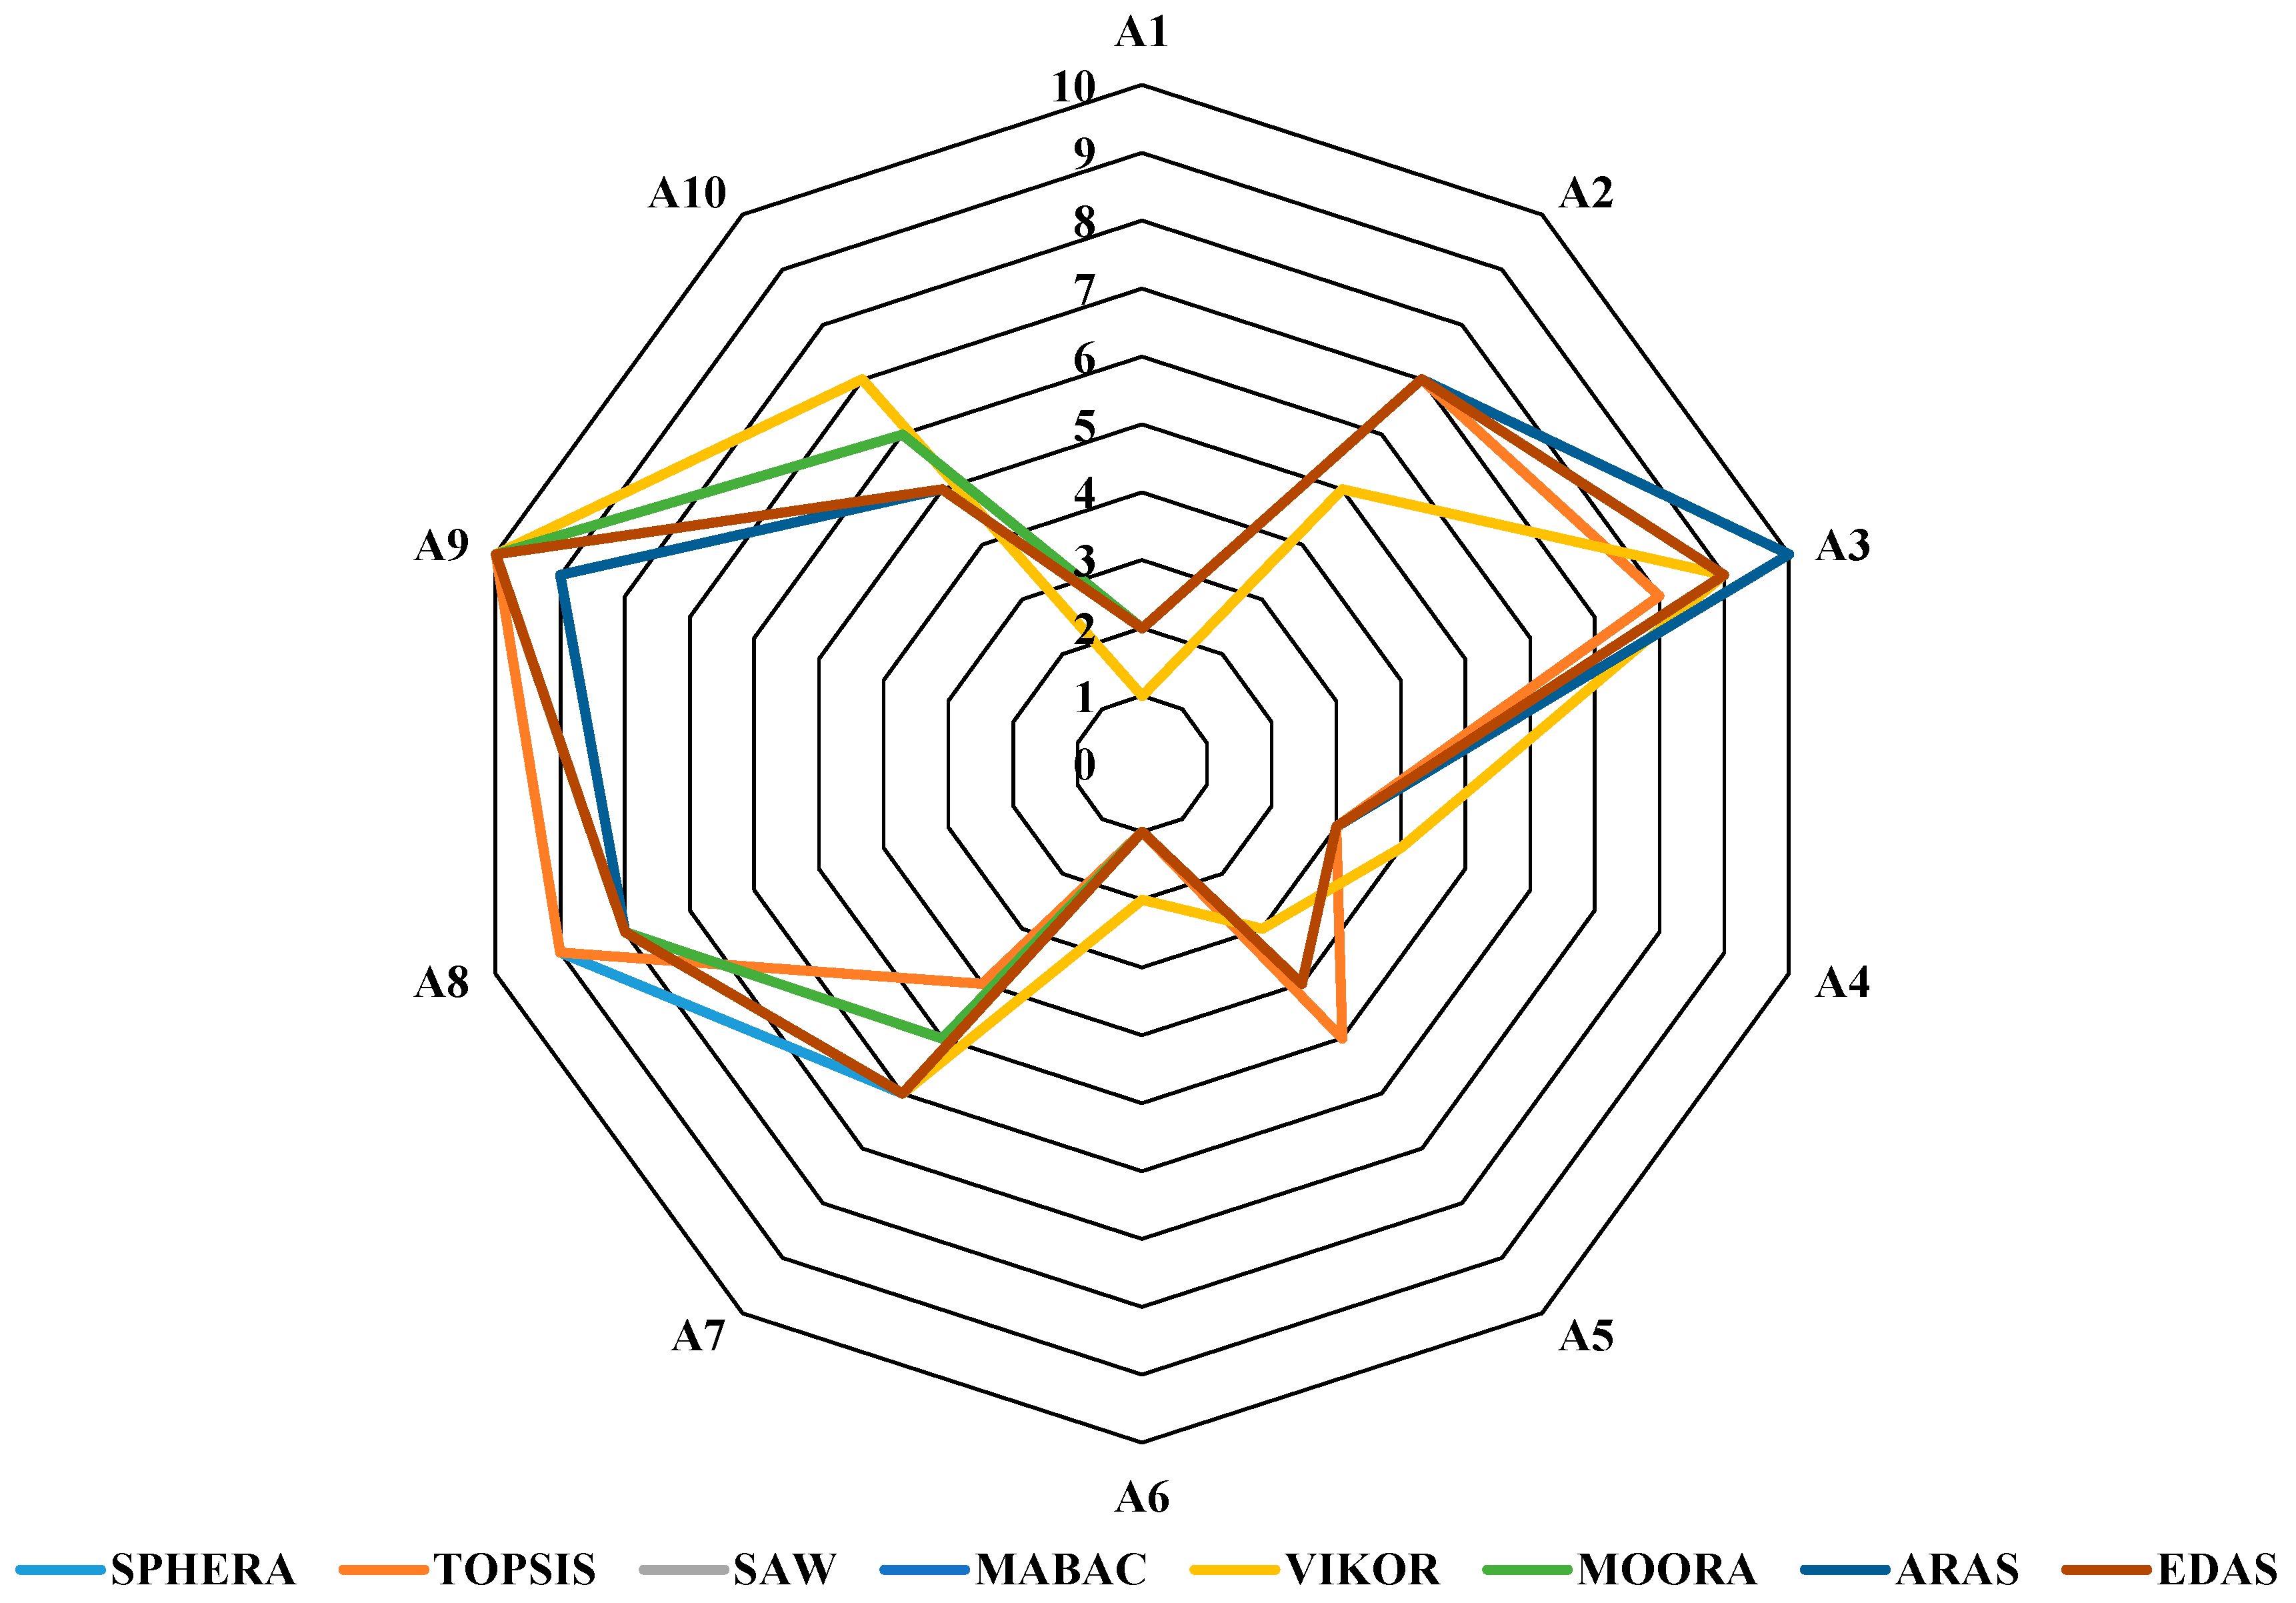
Traditional and well-known MCDM methodologies such as TOPSIS, SAW, MABAC, VIKOR, MOORA, ARAS and EDAS are used to make a comparison with the novel developed SPHERA method. The final rank of all MCDM methodologies is extensively described in Table 21 as well as graphically depicted in Figure 9. It should be noted that the weights obtained by the novel CRIFFT method are used to compute the final rank of alternatives.
Table 21.
Final rank of alternatives by compared MCDM methodologies.

Figure 9.
Final rank of alternatives by all applied MCDM methods.
The Spearman’s correlation coefficients of the final rank of alternatives obtained by all compared MCDM methodologies are represented in Table 22.
Table 22.
Spearman’s correlation coefficients of final rank of alternatives obtained by MCDM methods.
6.3. Verification of the SPHERA Method Through the Real-World Problem
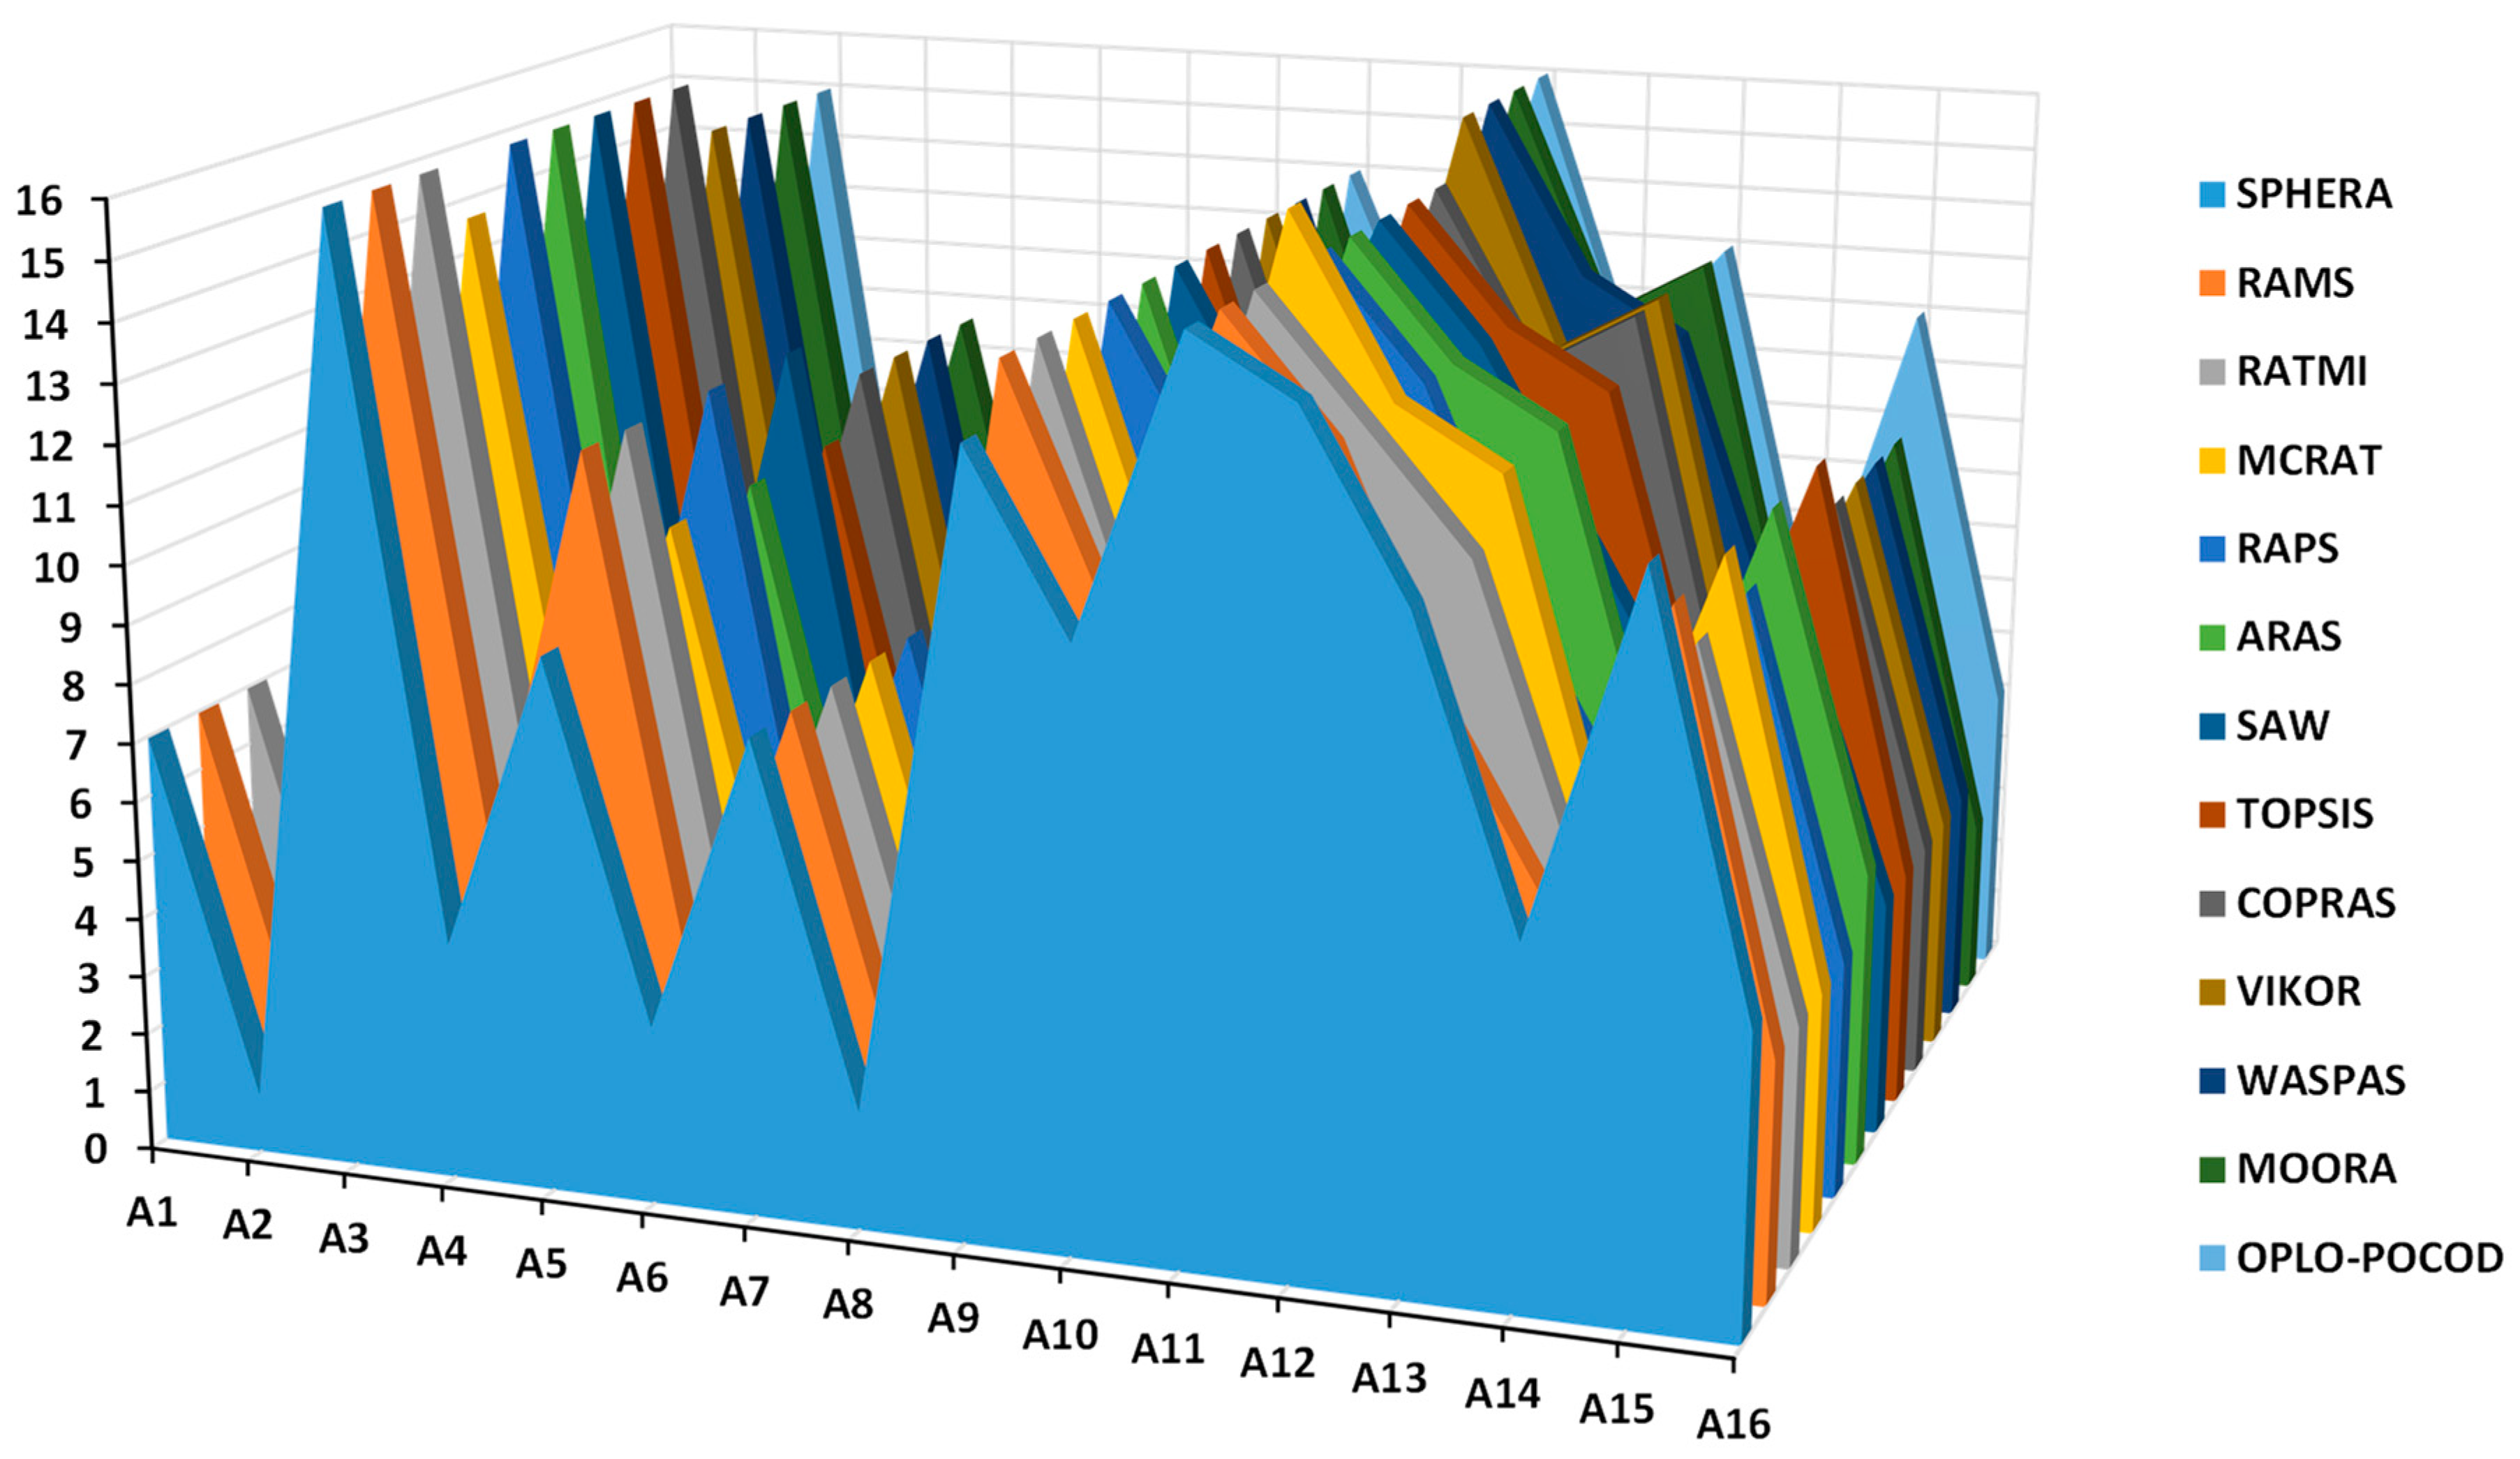
To verify the proposed SPHERA methodology, a real-world problem from the automotive industry is borrowed from [53,60,61], where different types of polymers are examined as a material for a brake booster valve body. Sixteen different materials (alternatives) are evaluated according to four criteria, such as tensile strength (C1), temperature (C2), density (C3) and cost (C4), to select the best possible solution. The initial decision-making matrix is presented in Table 23. Through the whole calculation process, the original values of the weight coefficients accessed in [53,60,61] are applied. Also, the problem is tested by a total of twelve MCDM methodologies. The final rank of alternatives obtained by SPHERA and other MCDM techniques is shown in Table 24 as well as in Figure 10. In Table 25, Spearman’s correlation coefficients between SPHERA and the compared methodologies are interpreted.
Table 23.
Initial decision-making matrix for the real-world problem.
Table 24.
Final rank of alternatives obtained by SPHERA and other MCDM methods.
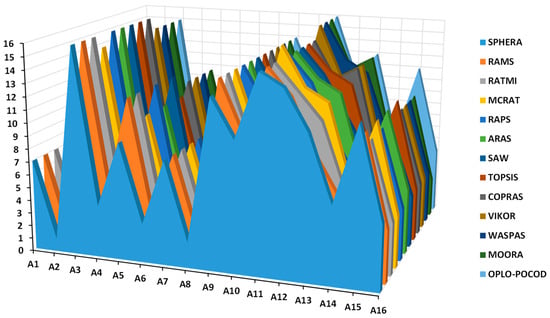
Figure 10.
Graphical illustration of final ranks by all MCDM techniques.
Table 25.
Spearman’s correlation coefficients between SPHERA and compared methodologies.
As can be seen from Table 24 and Table 25 as well as from Figure 10, it is evident that there is an extremely strong relationship between the SPHERA model and other MCDM methods. The total average correlation coefficient of 0.9740 is the clearest indicator of the full harmonization of the SPHERA method with all compared MCDM methodologies. In this way, the effectiveness of the proposed SPHERA methodology is verified and is absolutely acceptable for solving real-world problems in various industries.
7. Sensitivity Analysis
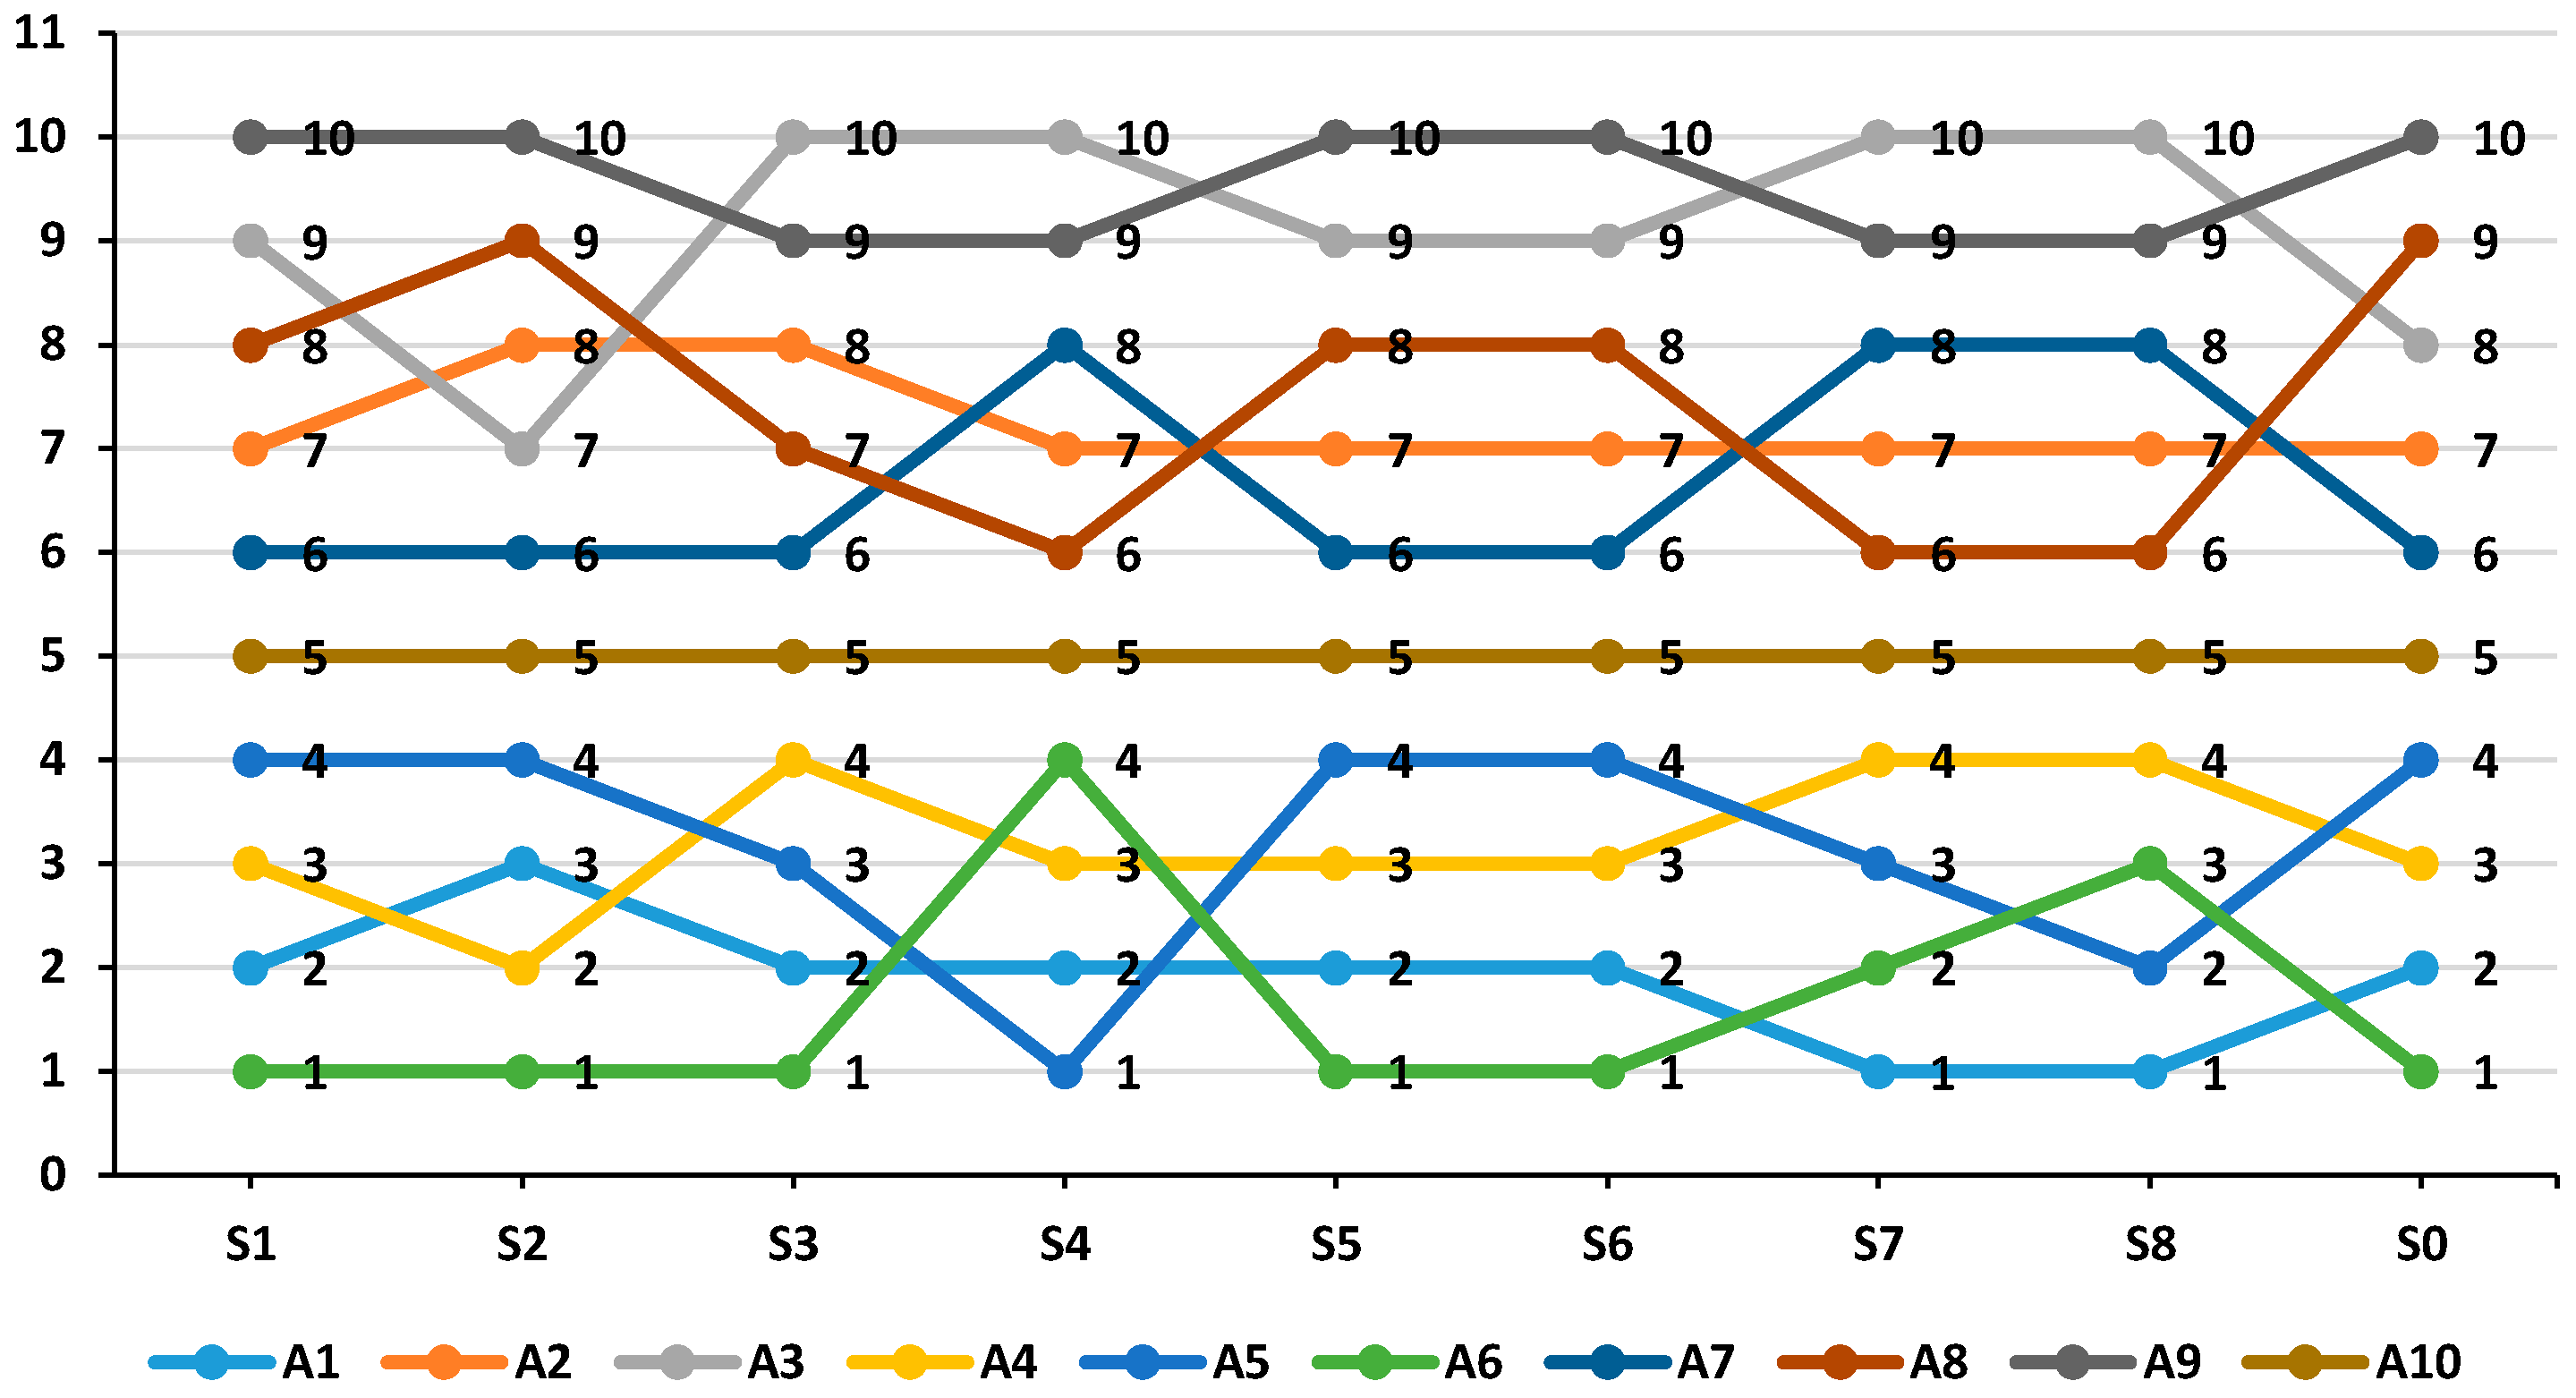
The sensitivity analysis of the developed CRIFFT-SPHERA decision-making methodology is performed based on changes in the values of the weight coefficients [62]. Variation in these values have a great significance for the rankings of the alternatives as well as for the robustness and stability of the developed model. For this purpose, the eight different scenarios are created by favouring some of the criteria. Each of them is compared with the original values of the weight coefficients obtained by the CRIFFT method and their influence on the final ranking of alternatives is monitored. The distribution of weight coefficients for each scenario is shown in Table 26, while the final ranking of alternatives by the scenarios is presented in Table 27 and Figure 11. Spearman’s correlation coefficients between the original and other scenarios are displayed in Table 28.
Table 26.
Weight coefficients for each scenario.
Table 27.
Final ranking of alternatives by scenarios.
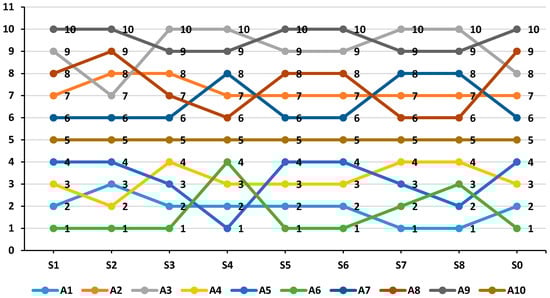
Figure 11.
Final ranking of alternatives.
Table 28.
Correlation coefficients between the original and other scenarios.
From Table 27 and Table 28 and Figure 11, it can be seen that the proposed model is sensitive to changes in the weights of criteria. Regardless of these changes, the original scenario S0 has an extremely high correlation with four scenarios (of 0.9879 with S1, S5 and S6) as well as of 0.9785 with S2, while it has a slightly lower but still very high correlation of 0.9273 with S3. A high correlation of 0.8667 is achieved between the original S0 and scenario S7 and a slightly lower correlation of 0.8303 with S8. The lowest correlation coefficient is accomplished between scenario S0 and scenario S4 with a value of 0.7818. The total average value of the correlation coefficient is 0.9182, which shows a high level of correlation of the original scenario with all other scenarios.
It should be noted that the alternative A10 shows the greatest stability, not changing its position in any scenario. Alternative A2 is ranked seventh in six out of eight scenarios, indicating its high resistance to weight changes. The most unstable alternatives are A8 and A3. A8 retains its ninth position in only one of the eight scenarios, while A3 does not retain its eighth position in any scenario, which confirms their high sensitivity to changes in the values of the criterion weights.
8. Conclusions, Limitations and Further Research Scope
Supporting and backfilling are key technological operations in every underground mining deposit. For their construction, certain types of materials are applied, with securing the stope stability as their main technological requirement. In this study, concrete and its mixtures are chosen as a material that can simultaneously realize both operations. The selection of an optimal concrete mixture for carrying out the above typical technological operations in underground mines presents one of the most important tasks with which mining engineers are faced. Since each concrete mixture contains a specific amount of fly ash, it can be stated that these mixtures represent a sustainable construction material.
An innovative CRIFFT-SPHERA decision-making approach is developed to select the sustainable construction material for performing technological operations in an underground mine. A new CRIFFT method belongs to a group of objective weighting methods for determining the weights of criteria. A novel SPHERA method presents the new MCDM technique and is applied for ranking the alternatives. By combining these two methods, Mix 6, i.e., alternative 6 (A6) is chosen as the optimal and most suitable concrete mixture. This obtained result is verified through the comparative analysis where the SPHERA method has a very high average correlation of 0.9550 with the other methods. This is clear proof that the proposed method is capable of solving different problems in decision-making theory.
The stability of the proposed methodology is also verified through the real-world problem. By comparing it with a total of twelve MCDM methodologies, the total average correlation coefficient of 0.9740 is established. In this way, the effectiveness of the proposed SPHERA methodology is verified and is found to be absolutely acceptable for solving real-world problems in various industries. In addition, a sensitivity analysis is performed to evaluate the impact of changing the values of criteria weights on the final ranking of alternatives. A total of eight scenarios are defined and each scenario has its own final ranking of alternatives. From the obtained results, it can be concluded that the model is sensitive to criteria weight changes. However, regardless of these changes, the model maintains a very high correlation between the original scenario and each scenario.
The management of a company that is faced with similar problems of concrete mixture selection can utilize our findings to create a strategic business plan in terms of sustainable development. Also, our findings would enable the engineers and designers to adopt an appropriate tool for selecting the optimal concrete mixture based on its economic aspects and mechanical characteristics. From the other side, researchers can employ our insights to make a more reliable and easier choice of MCDM method for solving the real-world problem analogous to this paper. Such valuable insights would not only provide significant support to decision-makers but would also contribute to improving the quality of future scientific inquiries related to sustainable construction material selection.
One of the limitations is related to the input data that are expressed as crisp values rather than as fuzzy or some other uncertain data sets. Future studies can include the palette of many types of fuzzy sets to describe the characteristics of the input data in an uncertain environment. Another limitation of the proposed model is that it refers to a case study that is of a hypothetical nature. Certainly, the future research scope can be expanded to the adaptation and implementation of the developed CRIFFT-SPHERA methodology into real-world mining projects. In addition, there are a relatively small number of criteria that are considered for the evaluation of the optimal concrete mixture. Including a larger number of criteria as well as a larger number of alternatives can be one of the directions of further research. In this way, large-scale decision-making problems would become much more complex and relevant.
Future research will be focused on upgrading the developed model in several directions. One of them can be related to the inclusion of the palette of many types of fuzzy sets to describe the characteristics of the input data in uncertain environments, as mentioned above. Another way to improve the existing model is to apply the stochastic differential equations or some simulation optimization procedure to interpret the behaviour of criteria through the defined period. In that way, a dynamic MCDM model can be developed. Also, there is great potential to incorporate traditional as well as novel MCDM methods in order to create various hybrid and improved MCDM models. Certainly, further research will be focused on implementing the developed methodology to solve a real-world problem in the mining industry in order to demonstrate its full potential and effectiveness.
Author Contributions
Conceptualization, M.G. and Z.G.; methodology, M.G. and Z.G.; validation, M.G. and Z.G.; formal analysis, S.L.; investigation, S.Š.-S.; data curation, S.L. and S.Š.-S.; writing—original draft preparation, M.G. and Z.G.; writing—review and editing, M.G. and Z.G.; visualization, S.L. and S.Š.-S.; supervision, Z.G. All authors have read and agreed to the published version of the manuscript.
Funding
This research received no external funding.
Data Availability Statement
The original contributions presented in this study are included in the article. Further inquiries can be directed to the corresponding author.
Acknowledgments
The authors would like to express their sincere gratitude for the support provided by the Ministry of Science, Technological Development, and Innovation of the Republic of Serbia, within the framework of support for scientific research at the University of Belgrade, Faculty of Mining and Geology in Belgrade, under contract number 451-03-136/2025-03/200126.
Conflicts of Interest
The authors declare no conflicts of interest.
References
- Fediuk, R.S.; Smoliakov, A.K.; Timokhin, R.A.; Batarshin, V.O.; Yevdokimova, Y.G. Using thermal power plants waste for building materials. IOP Conf. Ser. Earth Environ. Sci. 2018, 87, 092010. [Google Scholar] [CrossRef]
- Chernysheva, N.; Lesovik, V.; Fediuk, R.; Vatin, N. Improvement of Performances of the Gypsum-Cement Fiber Reinforced Composite (GCFRC). Materials 2020, 13, 3847. [Google Scholar] [CrossRef]
- Kumar, S.; Garg, N.; Bahuguna, A. Research on the Effects of Fly Ash and Silica Fume as Partial Replacements in Self-Compacting Concrete. Webology 2021, 18, 3402–3408. [Google Scholar]
- Kusiorowski, R.; Gerle, A.; Dudek, K.; Związek, K. Application of hard coal combustion residuals in the production of ceramic building materials. Constr. Build. Mater. 2021, 304, 124506. [Google Scholar] [CrossRef]
- Luna, Y.; Arenas, C.G.; Cornejo, A.; Leiva, C.; Vilches, L.F.; Fernández-Pereira, C. Recycling by-products from coal-fired power stations into different construction materials. Int. J. Energy Environ. Eng. 2014, 5, 387–397. [Google Scholar] [CrossRef]
- Yatsenko, E.A.; Goltsman, B.M.; Novikov, Y.V.; Trofimov, S.V.; Ryabova, A.V.; Smoliy, V.A.; Klimova, L.V. Recycling of Coal Combustion Waste through Production of Foamed Geopolymers with Improved Strength. Sustainability 2023, 15, 16296. [Google Scholar] [CrossRef]
- Jaworek, A.; Sobczyk, A.T.; Czech, T.; Marchewicz, A.; Krupa, A. Recovery of cenospheres from solid waste produced by coal-fired power plants. Clean. Waste Syst. 2023, 6, 100109. [Google Scholar] [CrossRef]
- Bajare, D.; Bumanis, G.; Upeniece, L. Coal combustion bottom ash as microfiller with pozzolanic properties for traditional concrete. Procedia Eng. 2013, 57, 149–158. [Google Scholar] [CrossRef]
- Ahmed, M.; Qureshi, M.N.; Mallick, J.; Ben Kahla, N. Selection of Sustainable Supplementary Concrete Materials Using OSM-AHP-TOPSIS Approach. Adv. Mater. Sci. Eng. 2019, 2019, 2850480. [Google Scholar] [CrossRef]
- Arukala, S.R.; Pancharathi, R.K.; Anand Raj, P. A qualitative and quantitative approach to prioritize sustainable concrete using TOPSIS. In Advances in Sustainable Construction Materials; Springer: Singapore, 2020; pp. 159–169. [Google Scholar]
- Reddy, L.S.; Reddy, A.S.; Reddy, S.S.P. A quantitative approach to prioritize sustainable concrete. Civ. Eng. J. 2019, 5, 2579–2586. [Google Scholar] [CrossRef]
- Reddy, A.S.; Kumar, P.R.; Raj, P.A. Entropy-based fuzzy TOPSIS framework for selection of a sustainable building material. Int. J. Constr. Manag. 2022, 22, 1194–1205. [Google Scholar] [CrossRef]
- Shmlls, M.; Abed, M.A.; Horvath, T.; Bozsaky, D. Sustainability framework of recycled aggregate concrete produced with supplementary cementitious materials. Ain Shams Eng. J. 2023, 14, 102036. [Google Scholar] [CrossRef]
- Shmlls, M.; Abed, M.; Fořt, J.; Horvath, T.; Bozsaky, D. Towards closed-loop concrete recycling: Life cycle assessment and multi-criteria analysis. J. Clean. Prod. 2023, 410, 137179. [Google Scholar] [CrossRef]
- Moro, C. Comparative Analysis of Multi-Criteria Decision Making and Life Cycle Assessment Methods for Sustainable Evaluation of Concrete Mixtures. Sustainability 2023, 15, 12746. [Google Scholar] [CrossRef]
- Konečný, P.; Ghosh, P.; Hrabová, K.; Lehner, P.; Teplý, B. Effective methodology of sustainability assessment of concrete mixtures. Mater. Struct. 2020, 53, 98. [Google Scholar] [CrossRef]
- Kate, G.K.; Nayak, C.B.; Thakare, S.B. Optimization of Sustainable High-Strength–High-Volume Fly Ash Concrete with and without Steel Fiber Using Taguchi Method and Multi-Regression Analysis. Innov. Infrastruct. Solut. 2021, 6, 102. [Google Scholar] [CrossRef]
- Wang, X.-Y. Optimal Design of the Cement, Fly Ash, and Slag Mixture in Ternary Blended Concrete Based on Gene Expression Programming and the Genetic Algorithm. Materials 2019, 12, 2448. [Google Scholar] [CrossRef]
- Hashmi, A.F.; Ayaz, M.; Bilal, A.; Haq, M.; Shariq, M. ANN modeling of mechanical properties in high-volume fly ash concrete: Multi-objective cost optimization using NSGA-II for sustainable construction. Asian J. Civ. Eng. 2024, 25, 2867–2882. [Google Scholar] [CrossRef]
- Cen, X.; Wang, Q.; Shi, X.; Su, Y.; Qiu, J. Optimization of Concrete Mixture Design Using Adaptive Surrogate Model. Sustainability 2019, 11, 1991. [Google Scholar] [CrossRef]
- Onyelowe, K.C.; Kontoni, D.-P.N.; Ebid, A.M.; Dabbaghi, F.; Soleymani, A.; Jahangir, H.; Nehdi, M.L. Multi-Objective Optimization of Sustainable Concrete Containing Fly Ash Based on Environmental and Mechanical Considerations. Buildings 2022, 12, 948. [Google Scholar] [CrossRef]
- Onyelowe, K.C.; Ebid, A.M.; Mahdi, H.A.; Onyelowe, F.K.; Shafieyoon, Y.; Onyia, M.E.; Onah, H.N. AI mix design of fly ash admixed concrete based on mechanical and environmental impact considerations. Civ. Eng. J. 2023, 9, 27–45. [Google Scholar] [CrossRef]
- Zhao, Y.; Soltani, A.; Taheri, A.; Karakus, M.; Deng, A. Application of Slag–Cement and Fly Ash for Strength Development in Cemented Paste Backfills. Minerals 2019, 9, 22. [Google Scholar] [CrossRef]
- Zou, X.; Zhang, Y.; Liu, B.; Xu, X.; Lu, Z.; Jiang, W. Study on Mechanical Properties and Ratio Parameter Optimization of Fly Ash Wet Shotcrete under the Influence of Multiple Factors. Case Stud. Constr. Mater. 2023, 19, e02679. [Google Scholar] [CrossRef]
- Van Dang, K.; Anh, N.; Tien, N.T.; Vo, T.H. Research on the use fly ash and bottom ash from coal-fired power plants for making concrete lagging at underground mines. J. Mater. Eng. Struct. 2024, 11, 49–62. [Google Scholar]
- Behera, S.; Ghosh, C.; Mishra, D.; Singh, P.; Mishra, K.; Buragohain, J.; Mandal, P.K. Strength development and microstructural investigation of lead-zinc mill tailings based paste backfill with fly ash as alternative binder. Cem. Concr. Compos. 2020, 109, 103553. [Google Scholar] [CrossRef]
- Mishra, M.K.; Karanam, U. Geotechnical characterization of fly ash composites for backfilling mine voids. Geotech. Geol. Eng. 2006, 24, 1749–1765. [Google Scholar] [CrossRef]
- Chen, P.Y.; Zhang, L.H.; Wang, Y.H.; Fang, Y.; Zhang, F.; Xu, Y. Environmentally friendly utilization of coal gangue as aggregates for shotcrete used in the construction of coal mine tunnel. Case Stud. Constr. Mater. 2021, 15, e00751. [Google Scholar] [CrossRef]
- Van Dua, T.; Van Duc, D.; Bao, N.C. Integration of objective weighting methods for criteria and MCDM methods: Application in material selection. EUREKA Phys. Eng. 2024, 2, 131–148. [Google Scholar]
- Mukhametzyanov, I. Specific character of objective methods for determining weights of criteria in MCDM problems: Entropy, CRITIC and SD. Decis. Mak. Appl. Manag. Eng. 2021, 4, 76–105. [Google Scholar] [CrossRef]
- Keshavarz-Ghorabaee, M.; Amiri, M.; Zavadskas, E.K.; Turskis, Z.; Antucheviciene, J. Determination of objective weights using a new method based on the removal effects of criteria (MEREC). Symmetry 2021, 13, 525. [Google Scholar] [CrossRef]
- Ecer, F.; Pamucar, D. A novel LOPCOW-DOBI multi-criteria sustainability performance assessment methodology: An application in developing country banking sector. Omega 2022, 112, 102690. [Google Scholar] [CrossRef]
- Odu, G.O. Weighting methods for multi-criteria decision making technique. J. Appl. Sci. Environ. Manag. 2019, 23, 1449–1457. [Google Scholar] [CrossRef]
- Yan, A.; Tan, X.; Gu, B.; Zhu, K. Flood risk assessment using the CV-TOPSIS method for the Belt and Road Initiative: An empirical study of Southeast Asia. Ecosyst. Health Sustain. 2020, 6, 1765703. [Google Scholar]
- Gligorić, Z.; Gligorić, M.; Miljanović, I.; Lutovac, S.; Milutinović, A. Assessing Criteria Weights by the Symmetry Point of Criterion (Novel SPC Method)–Application in the Efficiency Evaluation of the Mineral Deposit Multi-Criteria Partitioning Algorithm. CMES-Comput. Model. Eng. Sci. 2023, 136, 955–979. [Google Scholar] [CrossRef]
- Gligorić, M.; Gligorić, Z.; Lutovac, S.; Negovanović, M.; Langović, Z. Novel Hybrid MPSI–MARA Decision-Making Model for Support System Selection in an Underground Mine. Systems 2022, 10, 248. [Google Scholar] [CrossRef]
- Radović, D.; Stević, Ž. Evaluation and Selection of KPI in Transport Using SWARA Method. Transp. Logist. Int. J. 2018, 8, 60–68. [Google Scholar]
- Pamučar, D.; Stević, Ž.; Sremac, S. A New Model for Determining Weight Coefficients of Criteria in MCDM Models: Full Consistency Method (FUCOM). Symmetry 2018, 10, 393. [Google Scholar] [CrossRef]
- Więckowski, J.; Kizielewicz, B.; Shekhovtsov, A.; Sałabun, W. RANCOM: A novel approach to identifying criteria relevance based on inaccuracy expert judgments. Eng. Appl. Artif. Intell. 2023, 122, 106114. [Google Scholar] [CrossRef]
- Šmidovnik, T.; Grošelj, P. Solution for convergence problem in DEMATEL method: DEMATEL of finite sum of influences. Symmetry 2023, 15, 1357. [Google Scholar] [CrossRef]
- Wang, X.; Zhou, Z.; Sun, L.; Xie, G.; Lou, Q. Research on the evaluation index system of “new energy cloud” operation mode based on CRITIC weighting method and AHP method. IOP Conf. Ser. Earth Environ. Sci. 2021, 831, 012017. [Google Scholar] [CrossRef]
- Chen, C.H. A hybrid multi-criteria decision-making approach based on ANP-entropy TOPSIS for building materials supplier selection. Entropy 2021, 23, 1597. [Google Scholar] [CrossRef]
- Muravev, D.; Mijic, N. A novel integrated provider selection multicriteria model: The BWM-MABAC model. Decis. Mak. Appl. Manag. Eng. 2020, 3, 60–78. [Google Scholar] [CrossRef]
- Wu, L.; Hou, Z.; Luo, Z.; Fang, Y.; Mao, J.; Qin, N.; Guo, Y.; Zhang, T.; Cai, N. Site Selection for Underground Bio-Methanation of Hydrogen and Carbon Dioxide Using an Integrated Multi-Criteria Decision-Making (MCDM) Approach. Energy 2024, 306, 132437. [Google Scholar] [CrossRef]
- Jin, L.; Liu, P.; Yao, W.; Wei, J. A Comprehensive Evaluation of Resilience in Abandoned Open-Pit Mine Slopes Based on a Two-Dimensional Cloud Model with Combination Weighting. Mathematics 2024, 12, 1213. [Google Scholar] [CrossRef]
- Xue, L.; Li, L.; Xu, C.; Cui, Y.; Ding, H.; Huang, K.; Li, Z. A multi-objective optimization evaluation model for seismic performance of slopes reinforced by pile-anchor system. Sci. Rep. 2024, 14, 5044. [Google Scholar] [CrossRef]
- Meshram, S.G.; Alvandi, E.; Meshram, C.; Kahya, E.; Al-Quraishi, A.M.F. Application of SAW and TOPSIS in prioritizing watersheds. Water Resour. Manag. 2020, 34, 715–732. [Google Scholar] [CrossRef]
- Radulescu, C.Z.; Radulescu, M. A Hybrid Group Multi-Criteria Approach Based on SAW, TOPSIS, VIKOR, and COPRAS Methods for Complex IoT Selection Problems. Electronics 2024, 13, 789. [Google Scholar] [CrossRef]
- Trung, D. Application of EDAS, MARCOS, TOPSIS, MOORA and PIV Methods for Multi-Criteria Decision Making in Milling Process. Stroj. Časopis—J. Mech. Eng. 2021, 71, 69–84. [Google Scholar] [CrossRef]
- Wang, J.; Darwis, D.; Setiawansyah, S.; Rahmanto, Y. Implementation of MABAC Method and Entropy Weighting in Determining the Best E-Commerce Platform for Online Business. J. Ilm. Teknol. Harapan-JiTEKH 2024, 12, 58–68. [Google Scholar]
- Zavadskas, E.K.; Chakraborty, S.; Bhattacharyya, O.; Antucheviciene, J. Application of WASPAS method as an optimization tool in non-traditional machining processes. Inf. Technol. Control. 2015, 44, 77–88. [Google Scholar] [CrossRef]
- Brodny, J.; Tutak, M. Assessing the Energy and Climate Sustainability of European Union Member States: An MCDM-Based Approach. Smart Cities 2023, 6, 339–367. [Google Scholar] [CrossRef]
- Abdulaal, R.; Bafail, O.A. Two New Approaches (RAMS-RATMI) in Multi-criteria Decision-Making Tactics. J. Math. 2022, 2022, 6725318. [Google Scholar] [CrossRef]
- Priyadharsini, S.; Basheer, S.M.; Kaushalya, R.; Sneka, M. A study on Motion of a free falling body in Kinematic Equation. Int. J. Res. Appl. Sci. Eng. Technol. 2018, 6, 118–124. [Google Scholar] [CrossRef]
- Sphericity. Available online: https://en.wikipedia.org/wiki/Sphericity#:~:text=Sphericity%20is%20a%20measure%20of,it%20can%20turn%20without%20failing (accessed on 14 February 2025).
- Cruz-Matías, I.; Ayala, D.; Hiller, D.; Gutsch, S.; Zacharias, M.; Estradé, S.; Peiró, F. Sphericity and roundness computation for particles using the extreme vertices model. J. Comput. Sci. 2019, 30, 28–40. [Google Scholar] [CrossRef]
- Wadell, H. Volume, shape, and roundness of rock particles. J. Geol. 1932, 40, 443–451. [Google Scholar] [CrossRef]
- Singh, M.; Siddique, R. Effect of coal bottom ash as partial replacement of sand on properties of concrete. Resources, Conservation and Recycling 2013, 72, 20–32. [Google Scholar] [CrossRef]
- Bytyçi, L.; Kadiu, F.; Stavilevi, M. Impact of Fly Ash on Concrete Production Cost. In Proceedings of the 2014 UBT International Conference, Durres, Albania, 8 November 2014; Available online: https://knowledgecenter.ubt-uni.net/conference/2014/all-events/12 (accessed on 14 February 2025).
- Moradian, M.; Modanloo, V.; Aghaiee, S. Comparative analysis of multi criteria decision making techniques for material selection of brake booster valve body. J. Traffic Transp. Eng. 2019, 6, 526–534. [Google Scholar] [CrossRef]
- Sheikh, R.; Senfi, S. A Novel Opportunity Losses-Based Polar Coordinate Distance (OPLO-POCOD) Approach to Multiple Criteria Decision-Making. J. Math. 2024, 2024, 8845886. [Google Scholar] [CrossRef]
- Pamučar, S.; Božanić, D.; Ranđelović, A. Multi-criteria decision making: An example of sensitivity analysis. Serbian J. Manag. 2017, 12, 1–27. [Google Scholar] [CrossRef]
Disclaimer/Publisher’s Note: The statements, opinions and data contained in all publications are solely those of the individual author(s) and contributor(s) and not of MDPI and/or the editor(s). MDPI and/or the editor(s) disclaim responsibility for any injury to people or property resulting from any ideas, methods, instructions or products referred to in the content. |
© 2025 by the authors. Licensee MDPI, Basel, Switzerland. This article is an open access article distributed under the terms and conditions of the Creative Commons Attribution (CC BY) license (https://creativecommons.org/licenses/by/4.0/).