
Seismic Optimization of Fluid Viscous Dampers in Cable-Stayed Bridges: A Case Study Using Surrogate Models and NSGA-II

Abstract
1. Introduction
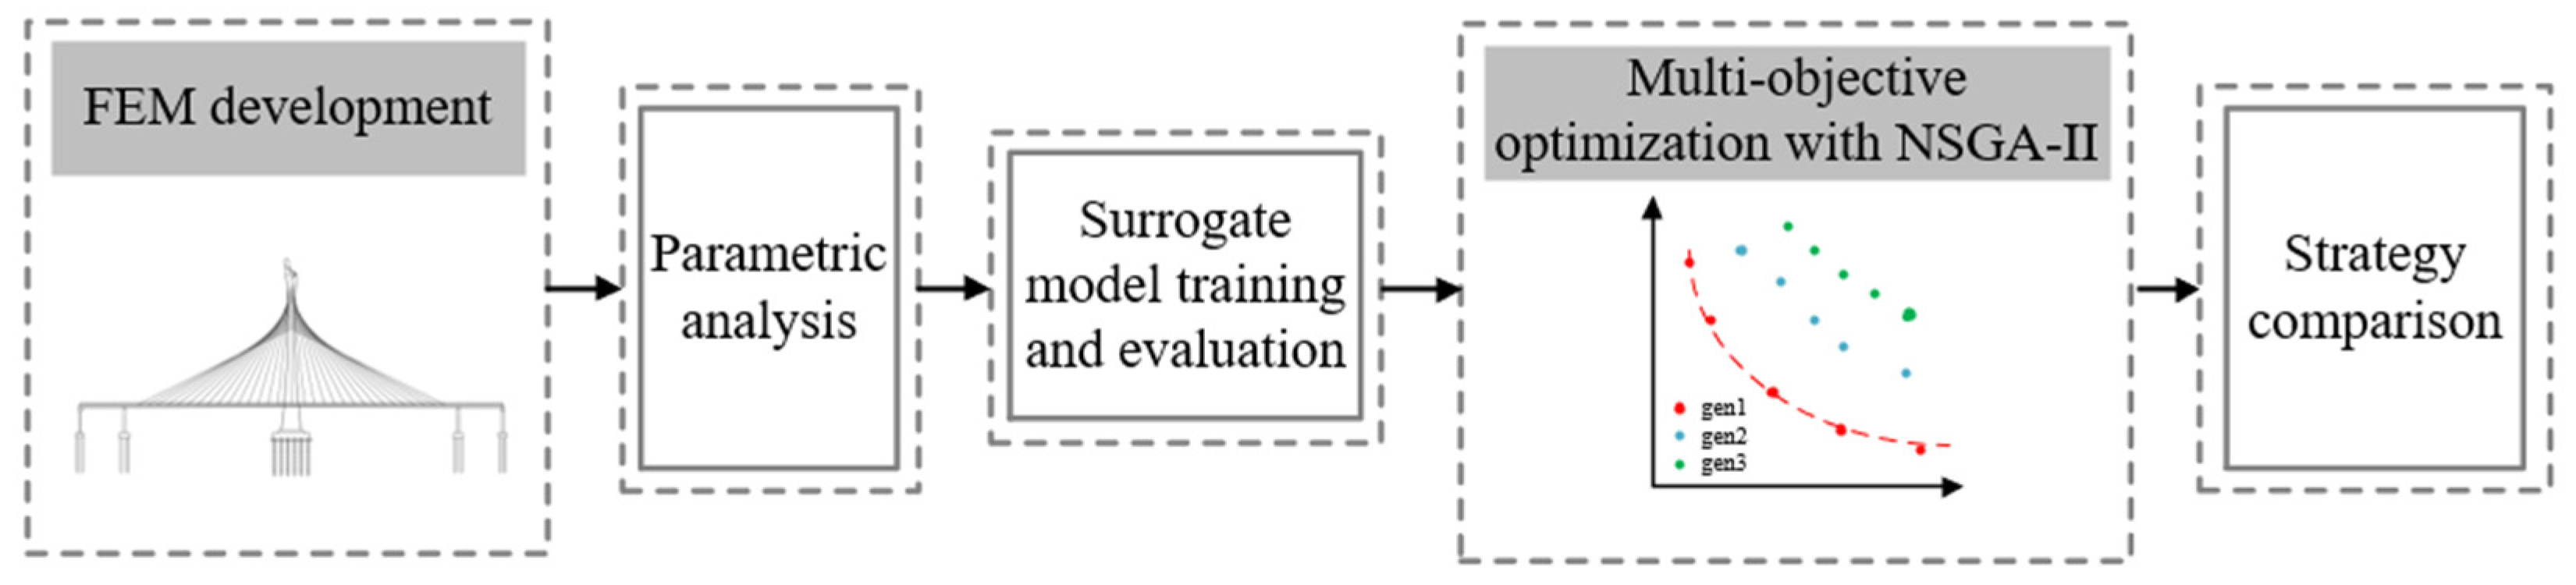
2. Methodology
- (1)
- Finite element (FE) model development:
- (2)
- Parametric analysis:
- (3)
- Surrogate model construction and evaluation:
- (4)
- Multi-objective FVD optimization with NSGA-II:
- (5)
- Comparison of optimization strategies:
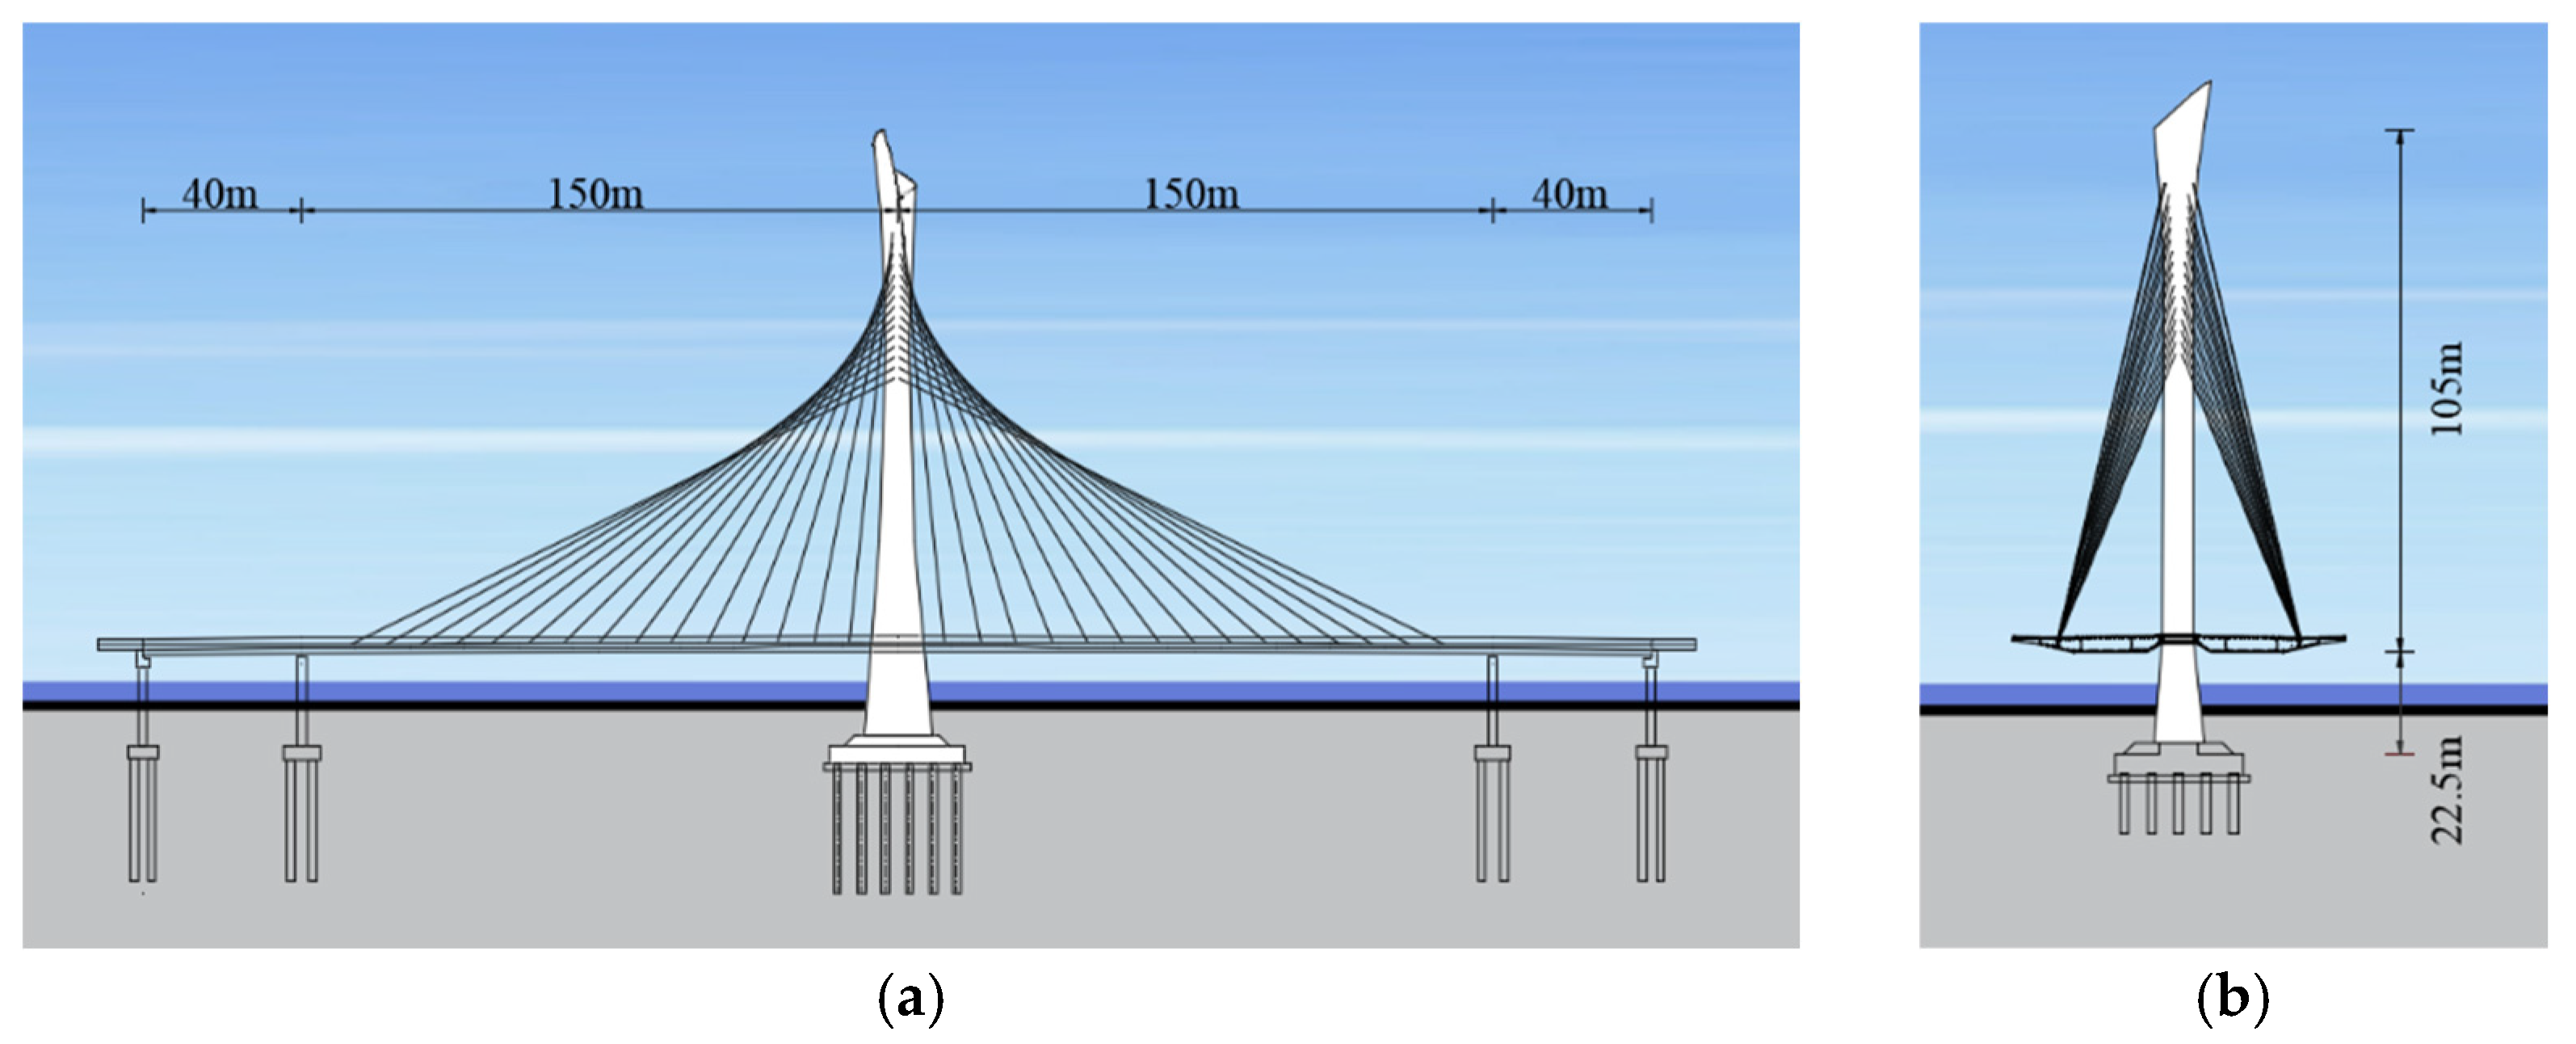
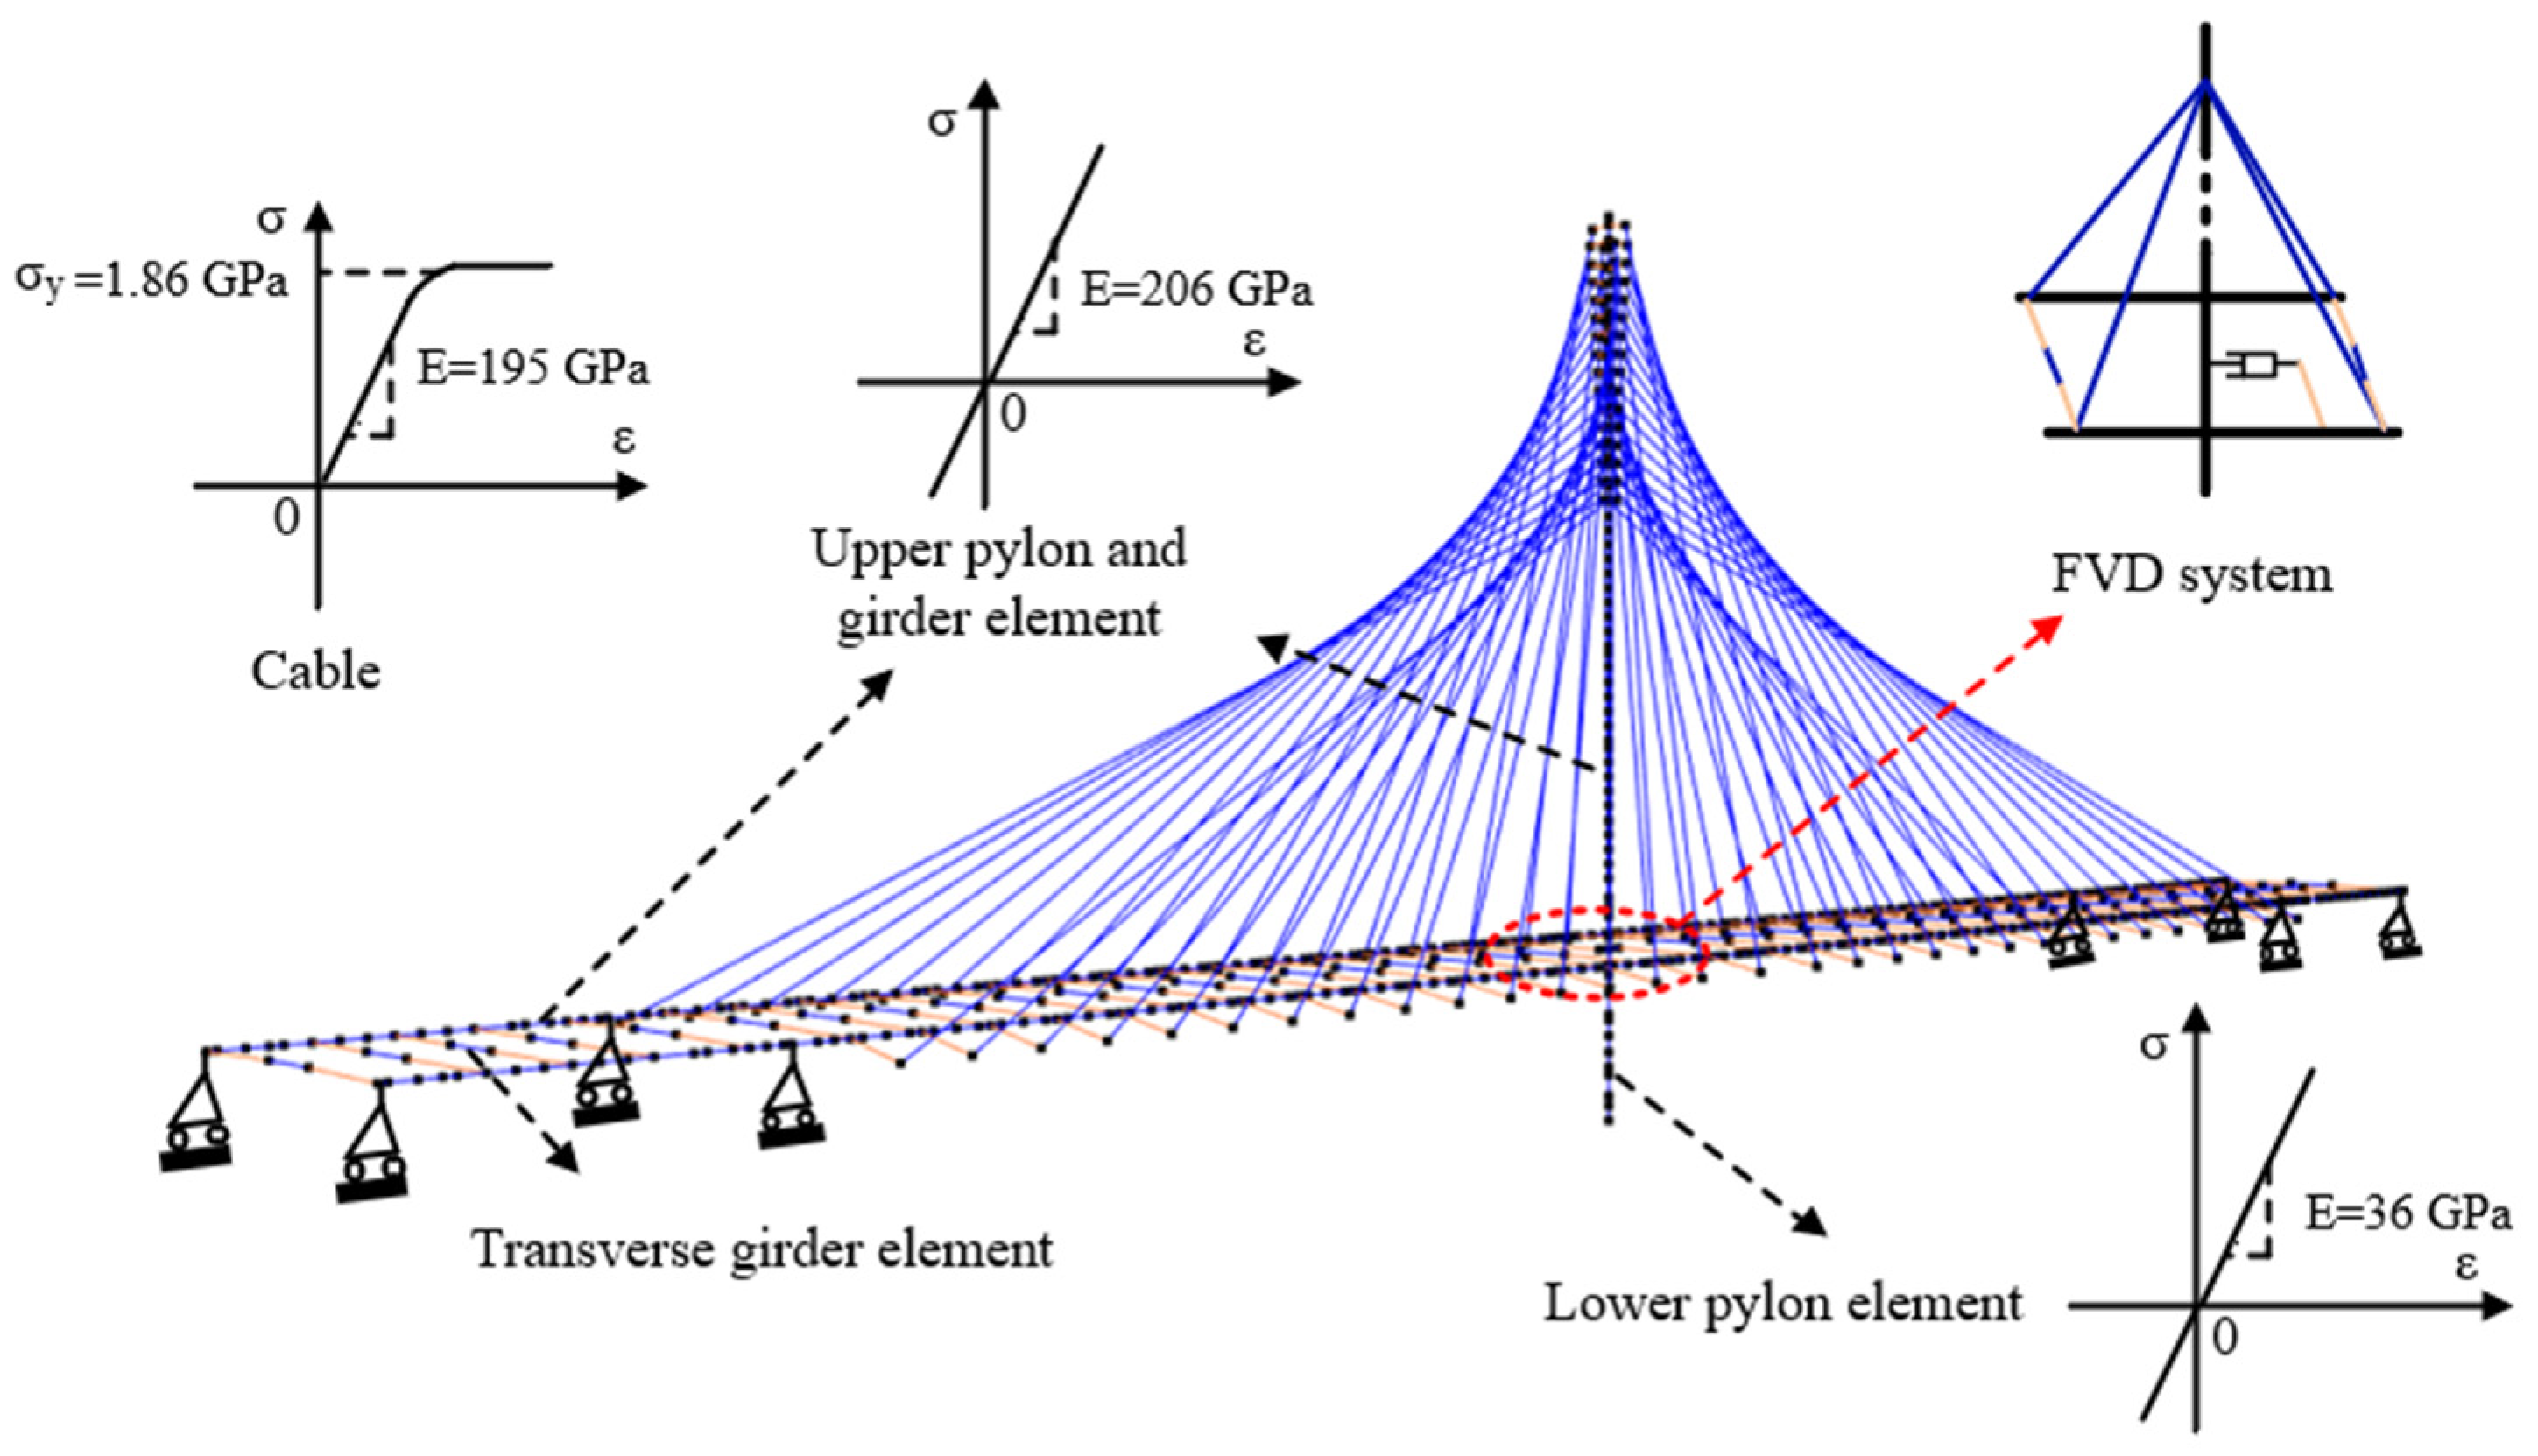
2.1. Finite Element Model of the Case Study Cable-Stayed Bridge
2.2. Construction of Surrogate Models
- (1)
- Seismic performance evaluation indicators
- (2)
- Dataset construction of seismic responses
- (3)
- Establishment and evaluation of surrogate models
2.3. Multi-Objective Optimization Using the NSGA-II Algorithm
2.4. Selection of Ground Motions
3. Results and Discussion
3.1. Optimization of FVD Based on Parametric Analysis
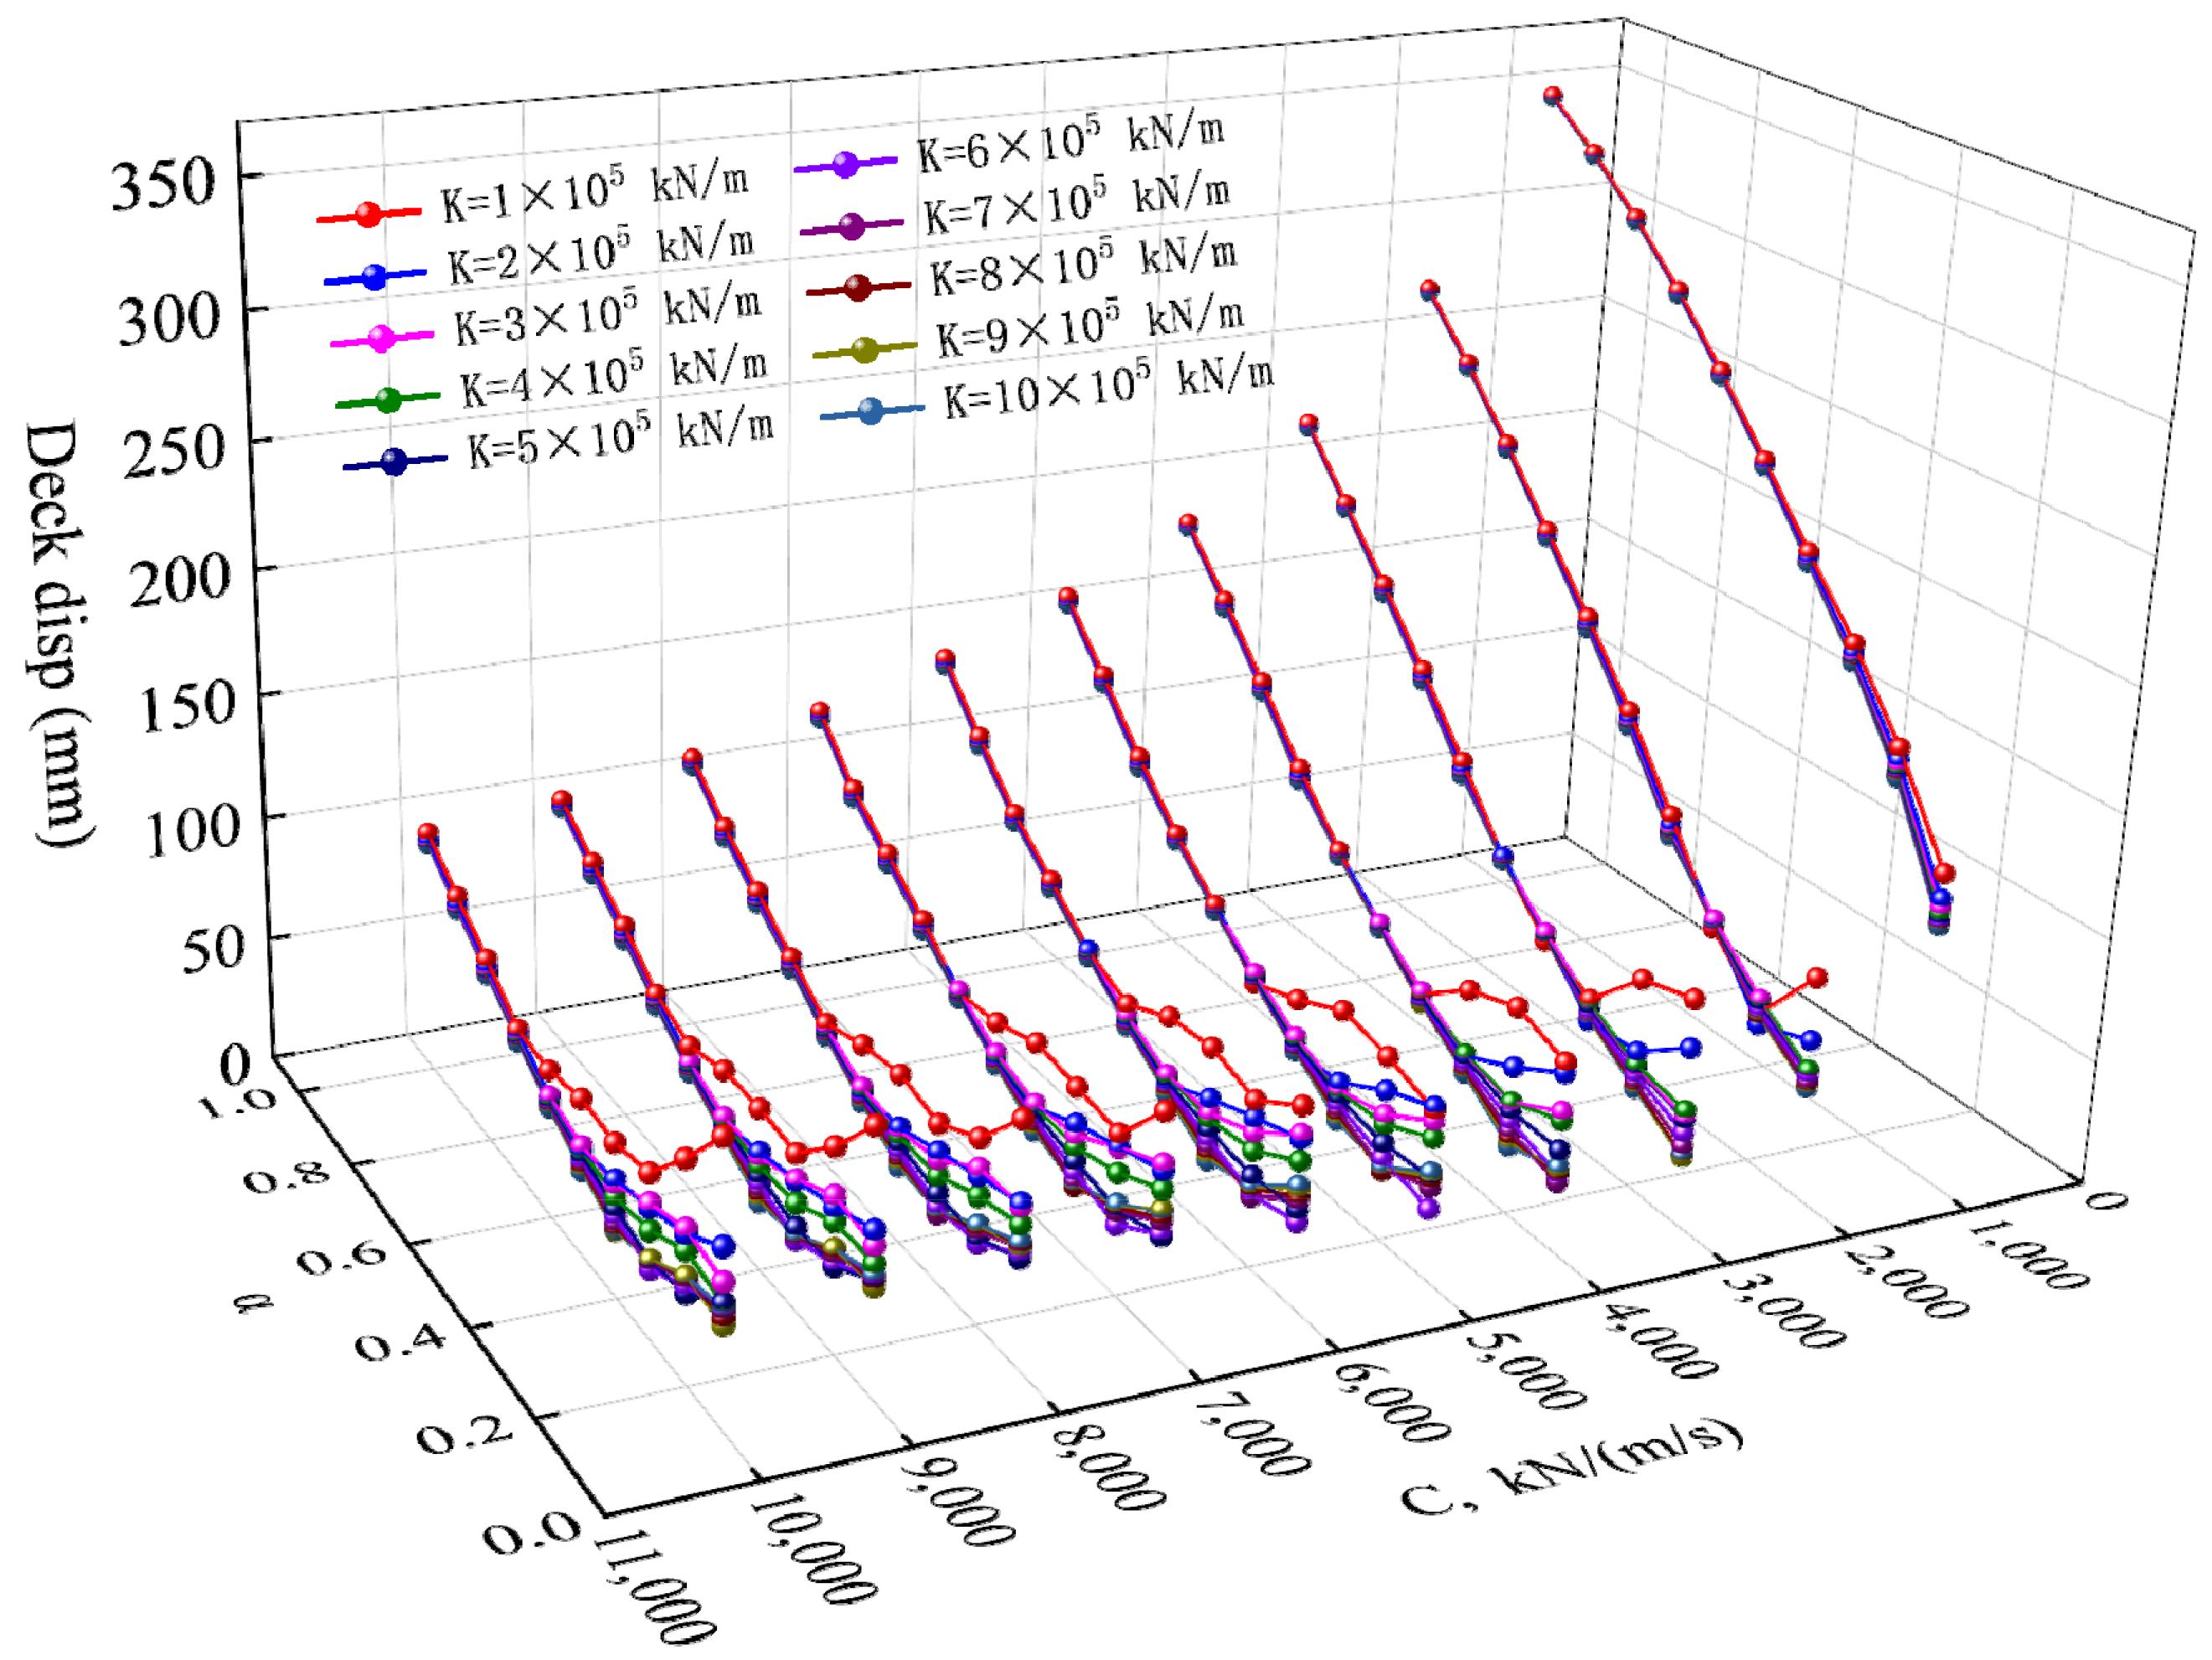
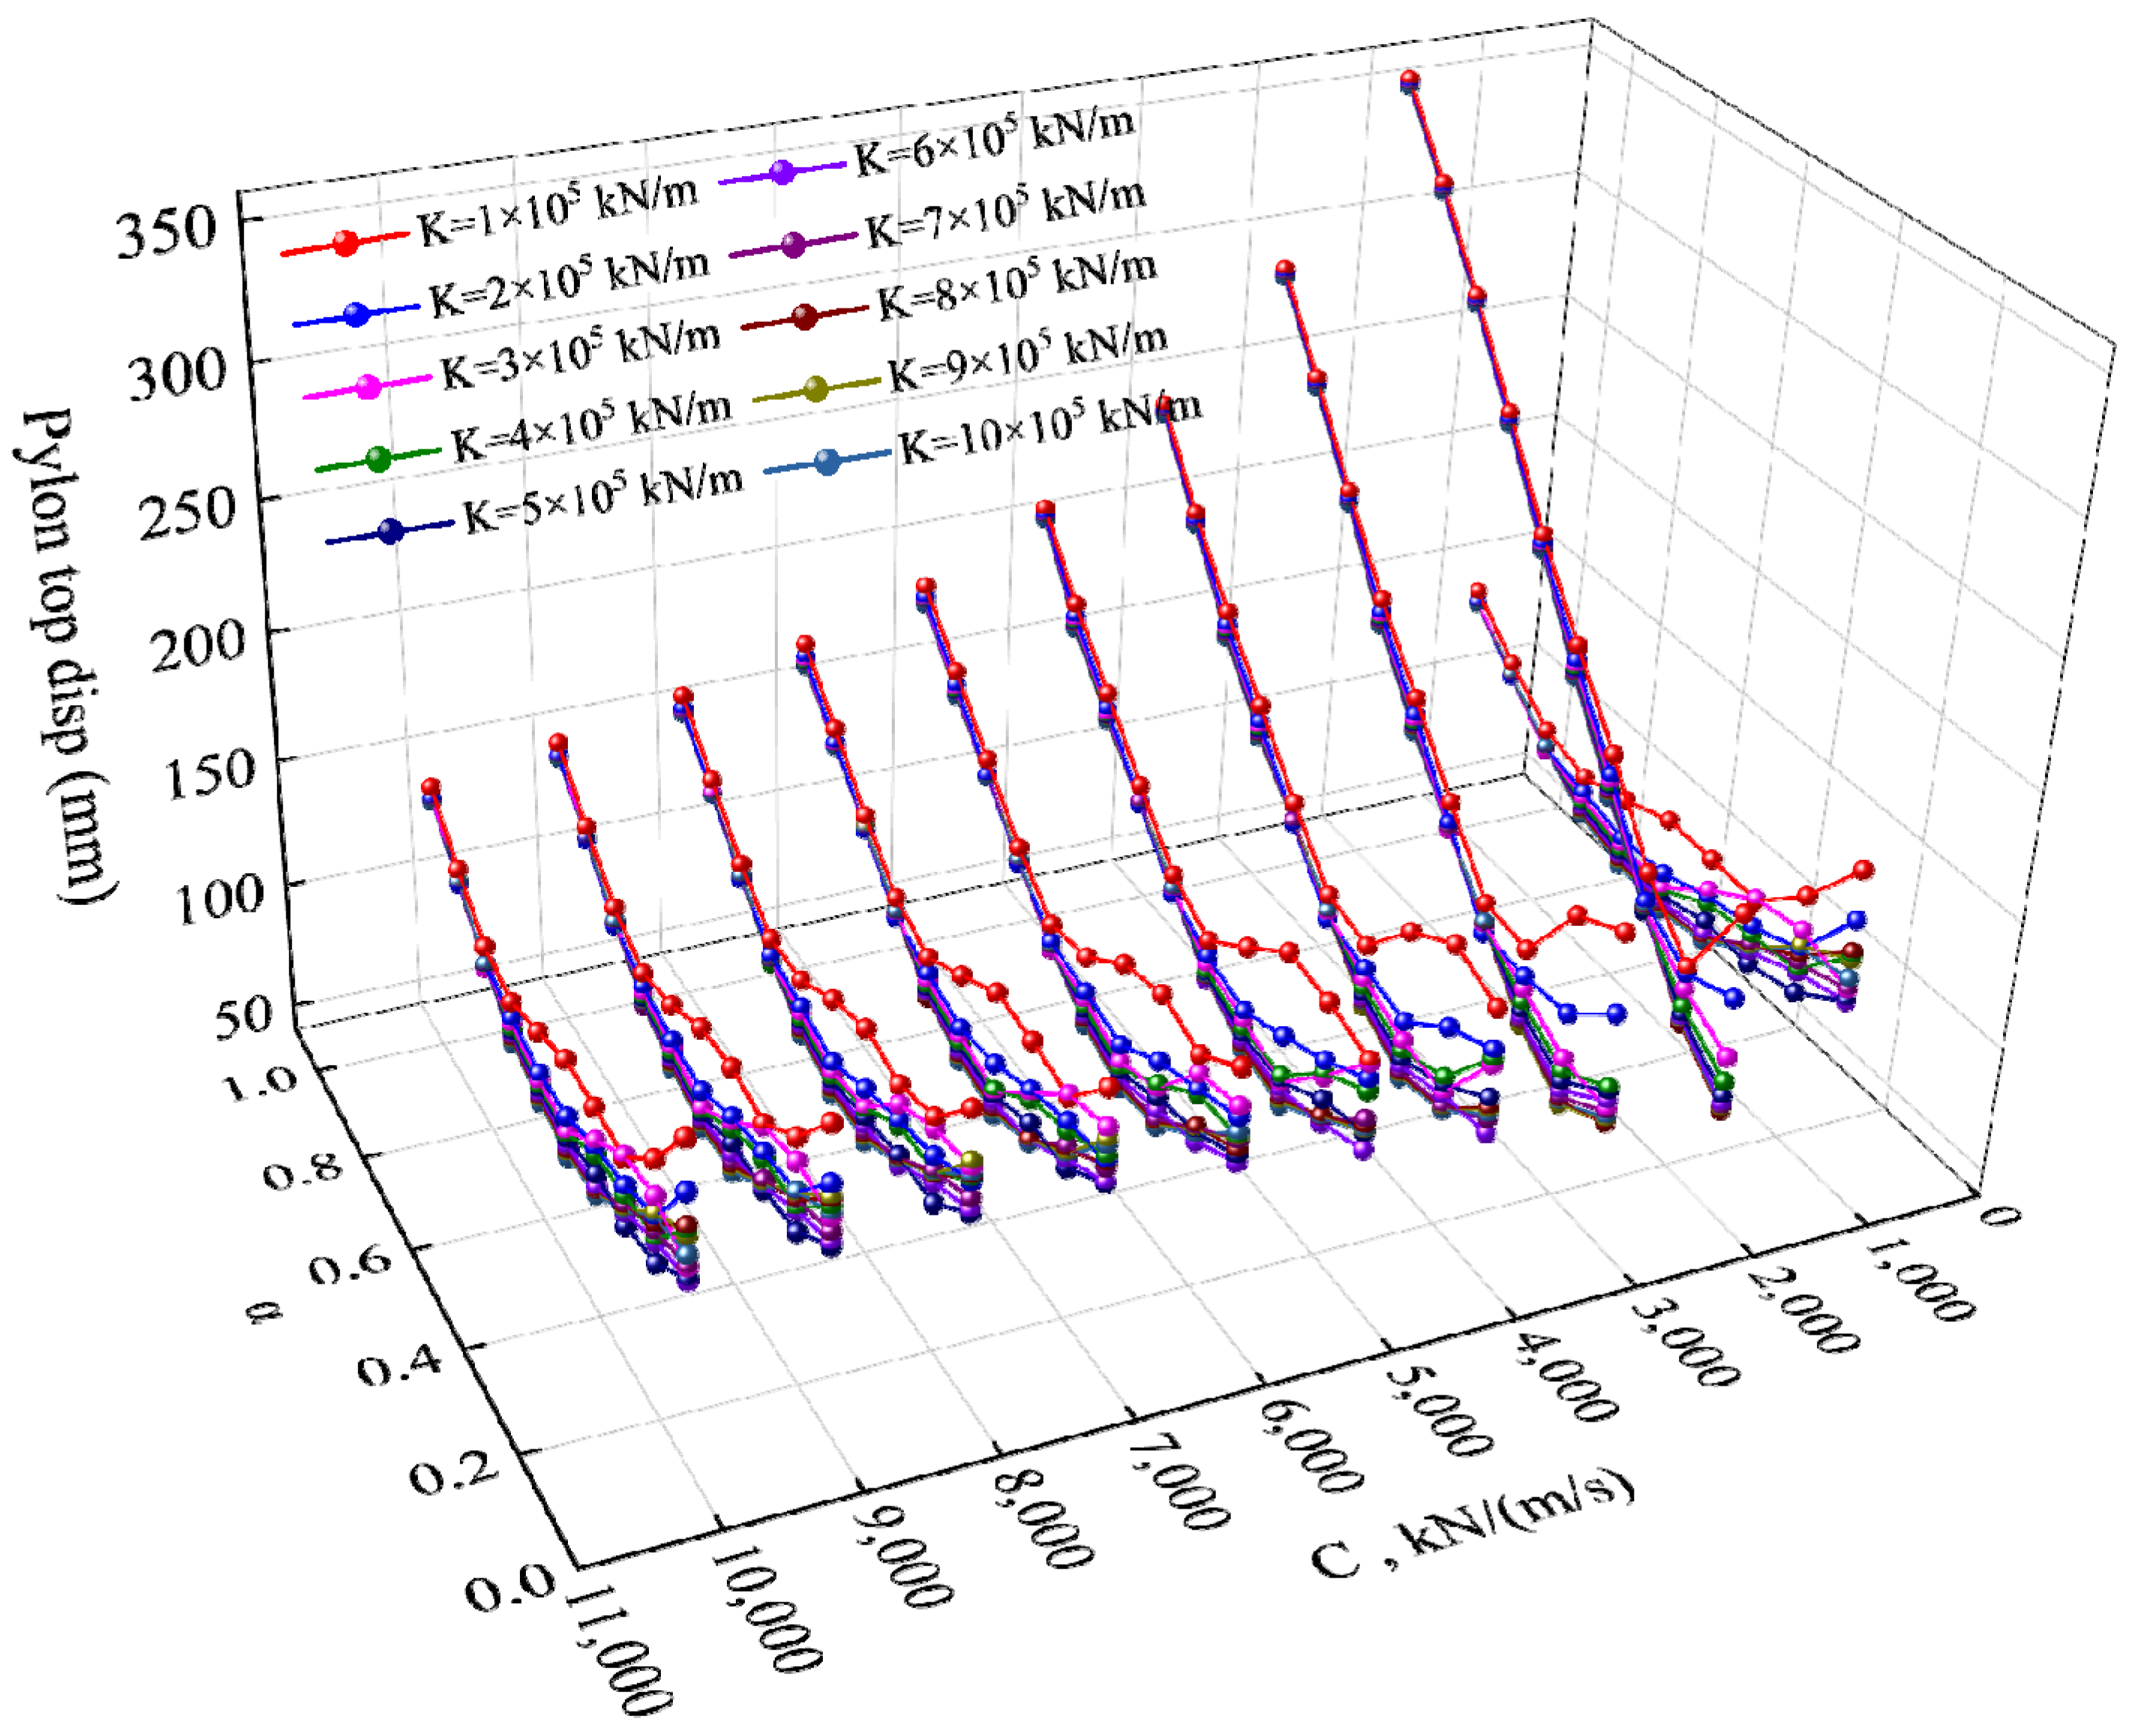
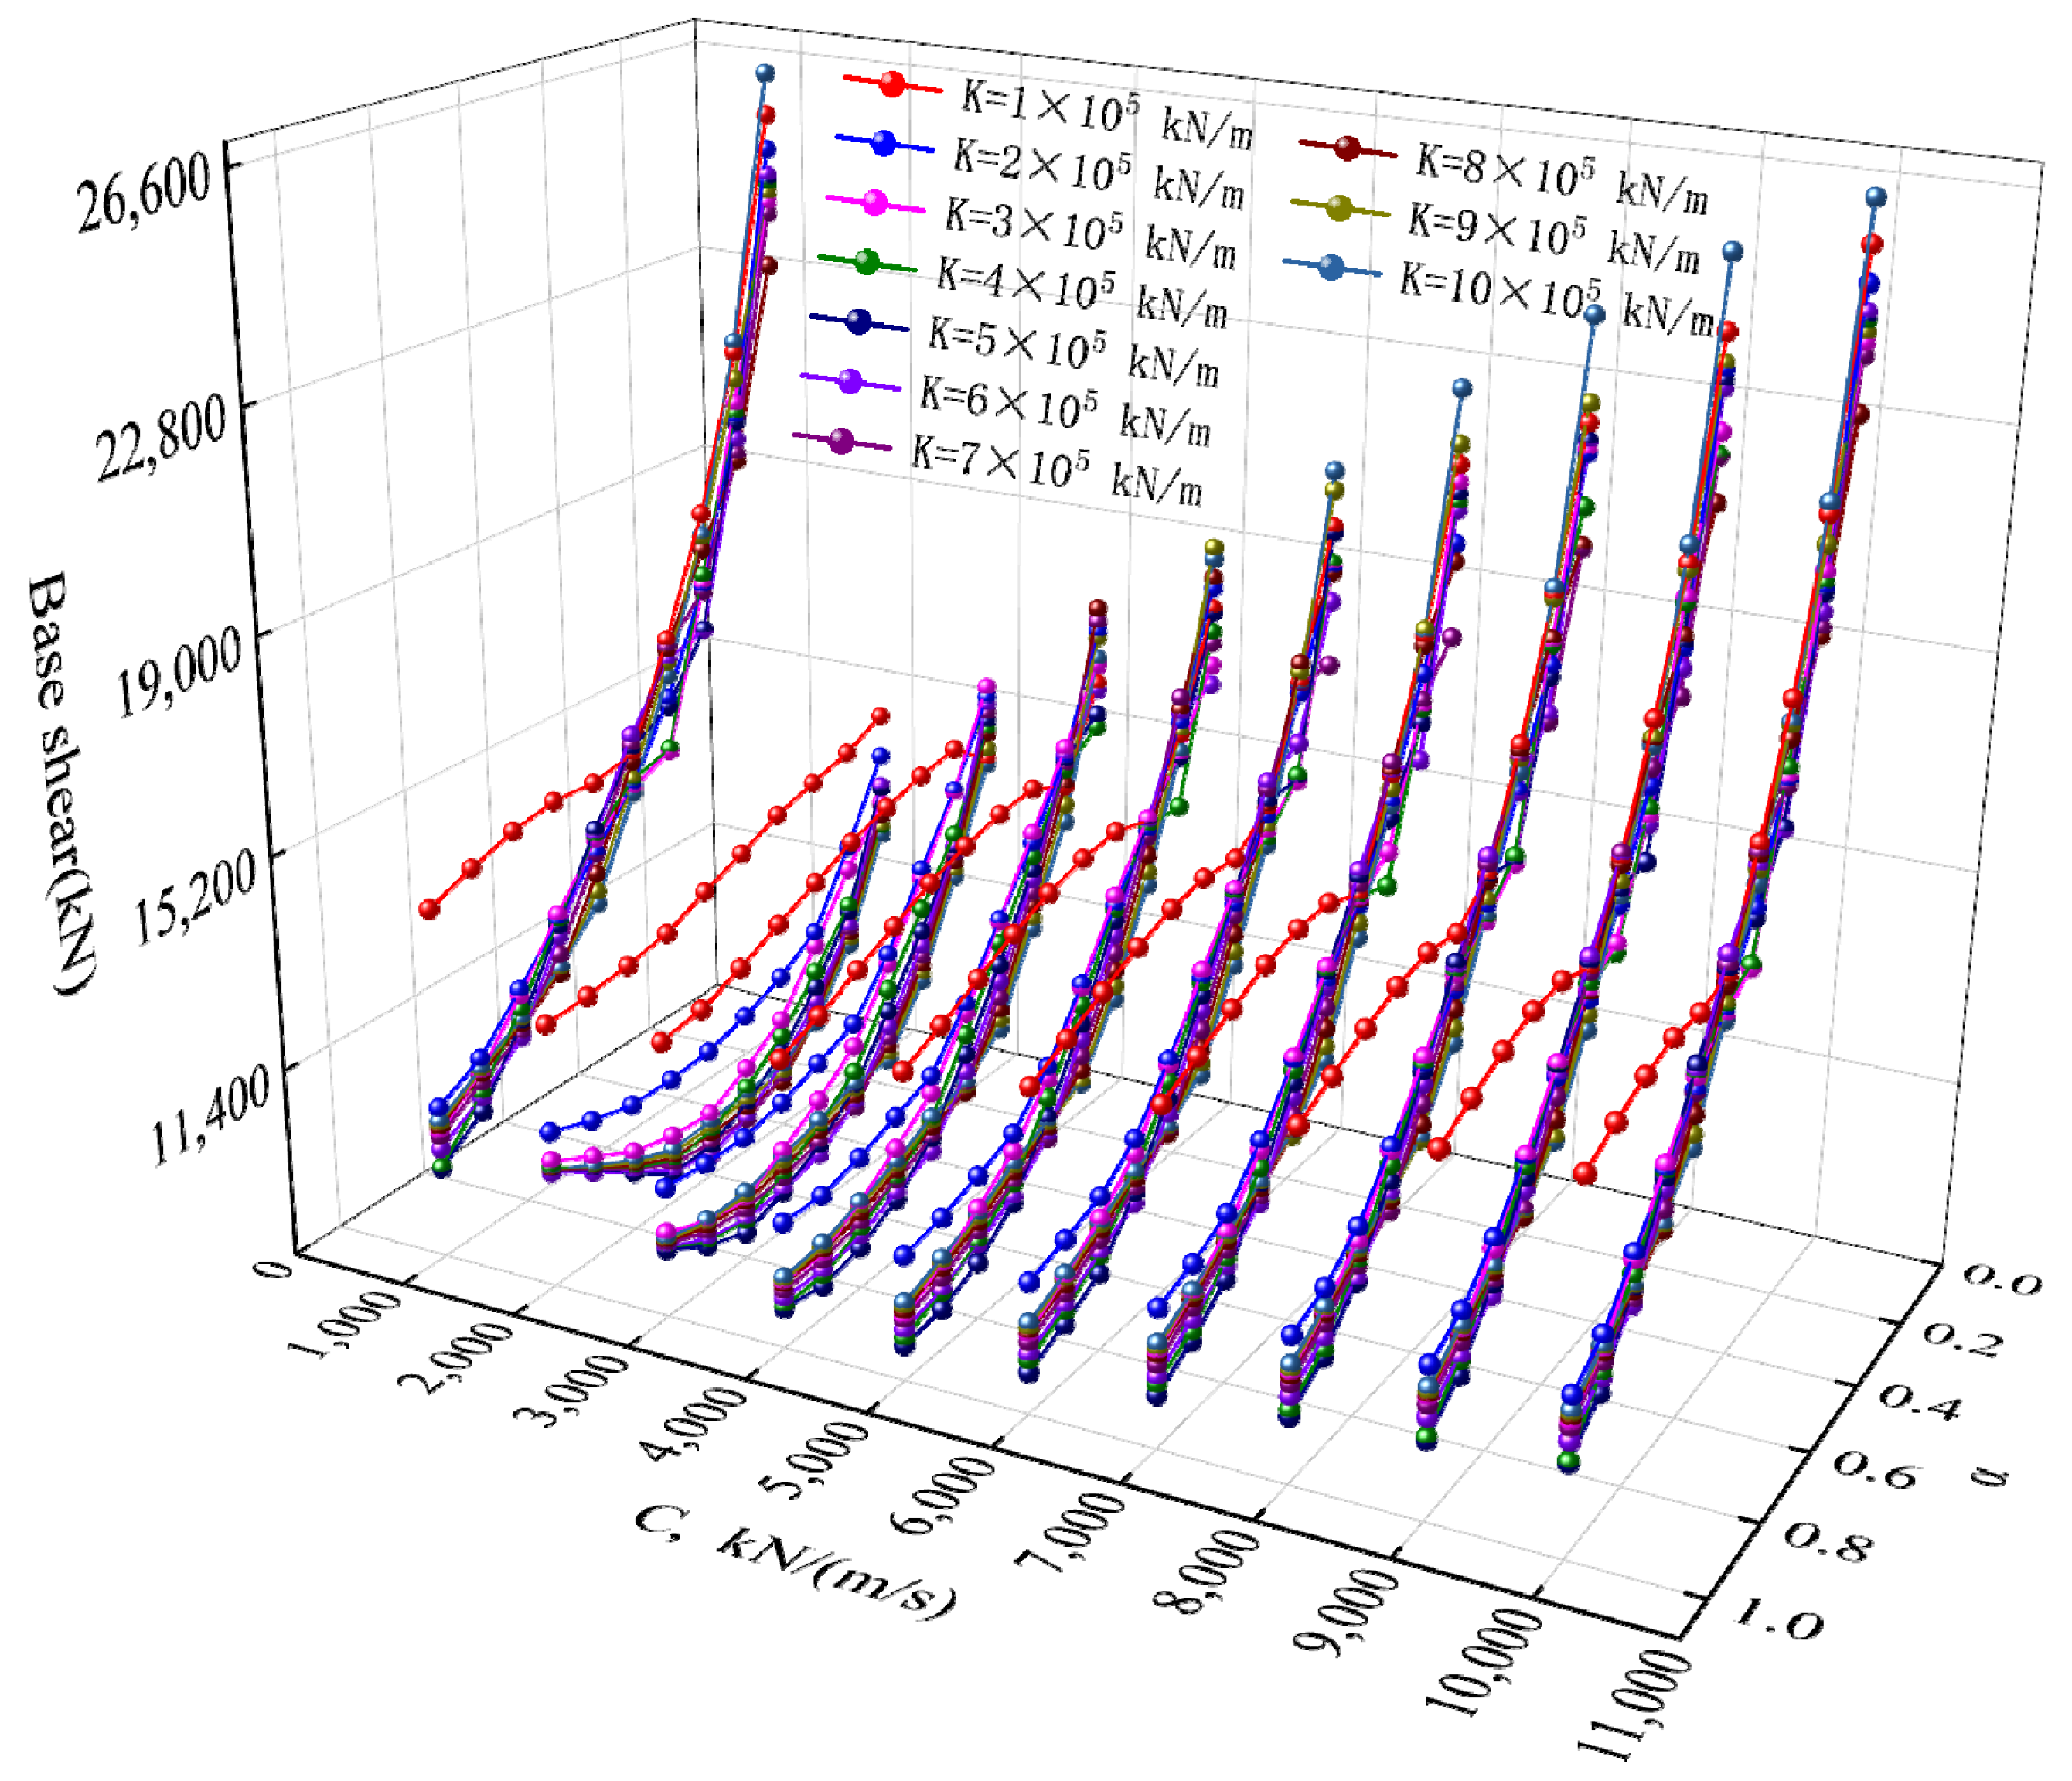
3.1.1. Parametric Analyses of FVDs
3.1.2. Optimal Design Spaces for Damper Parameters
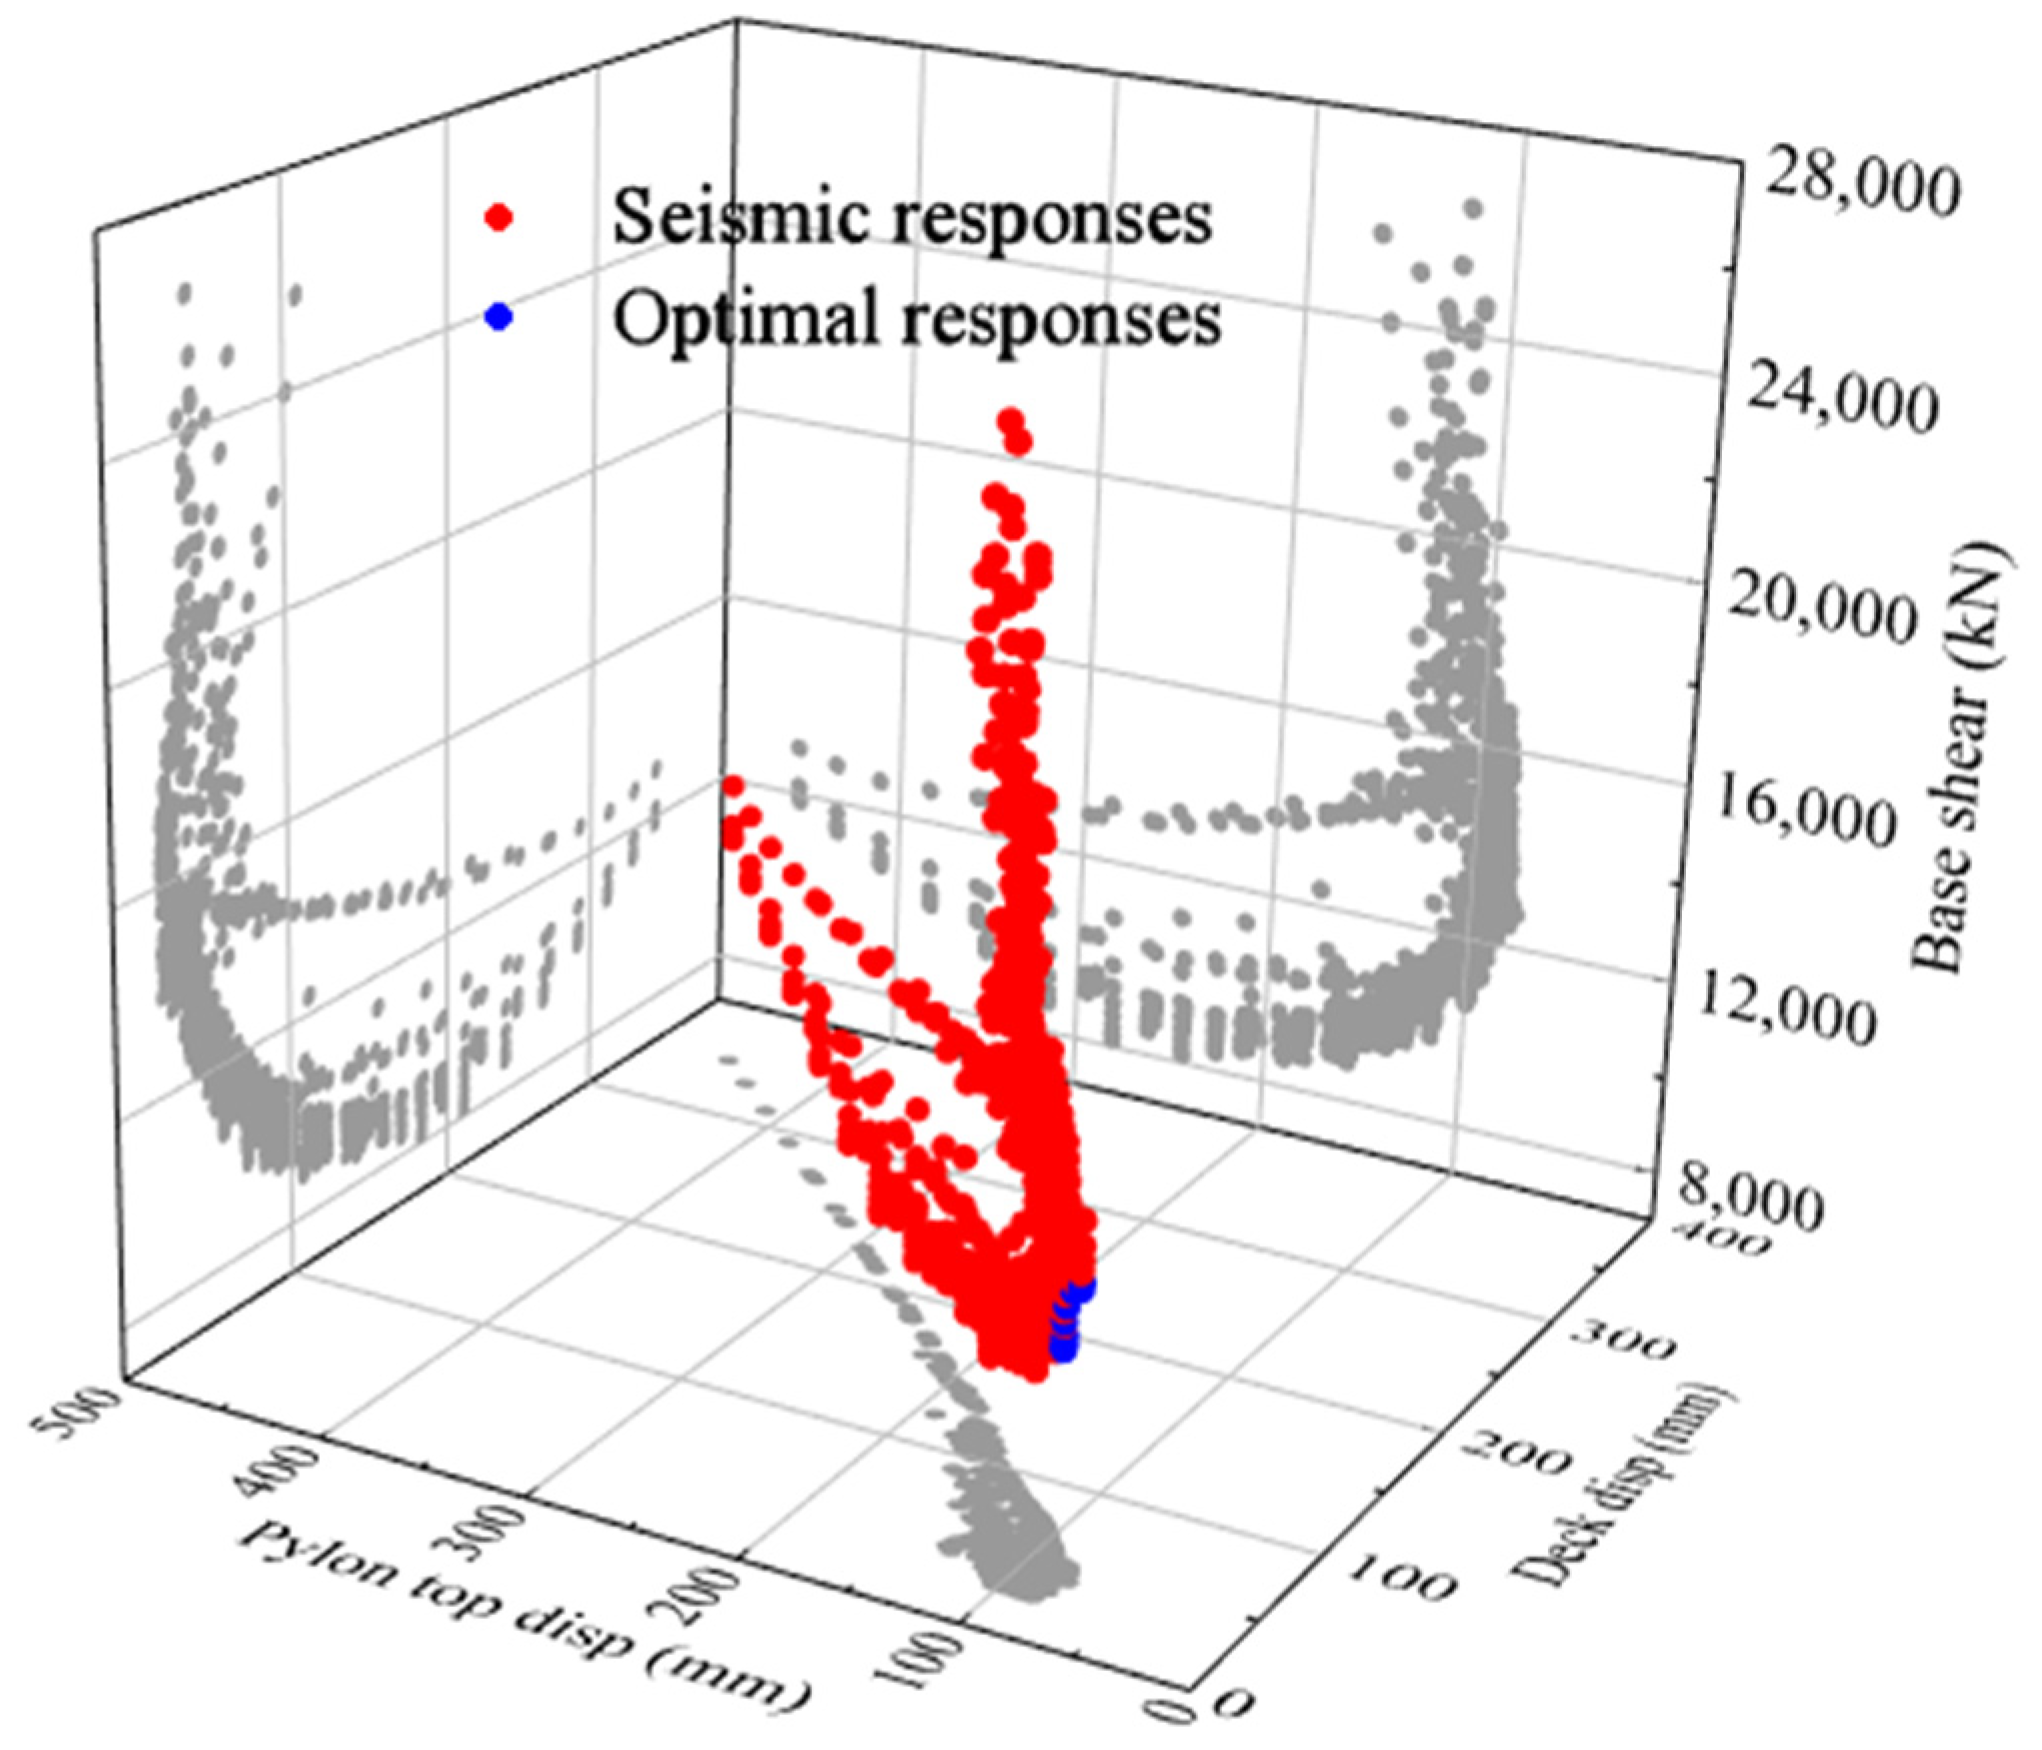
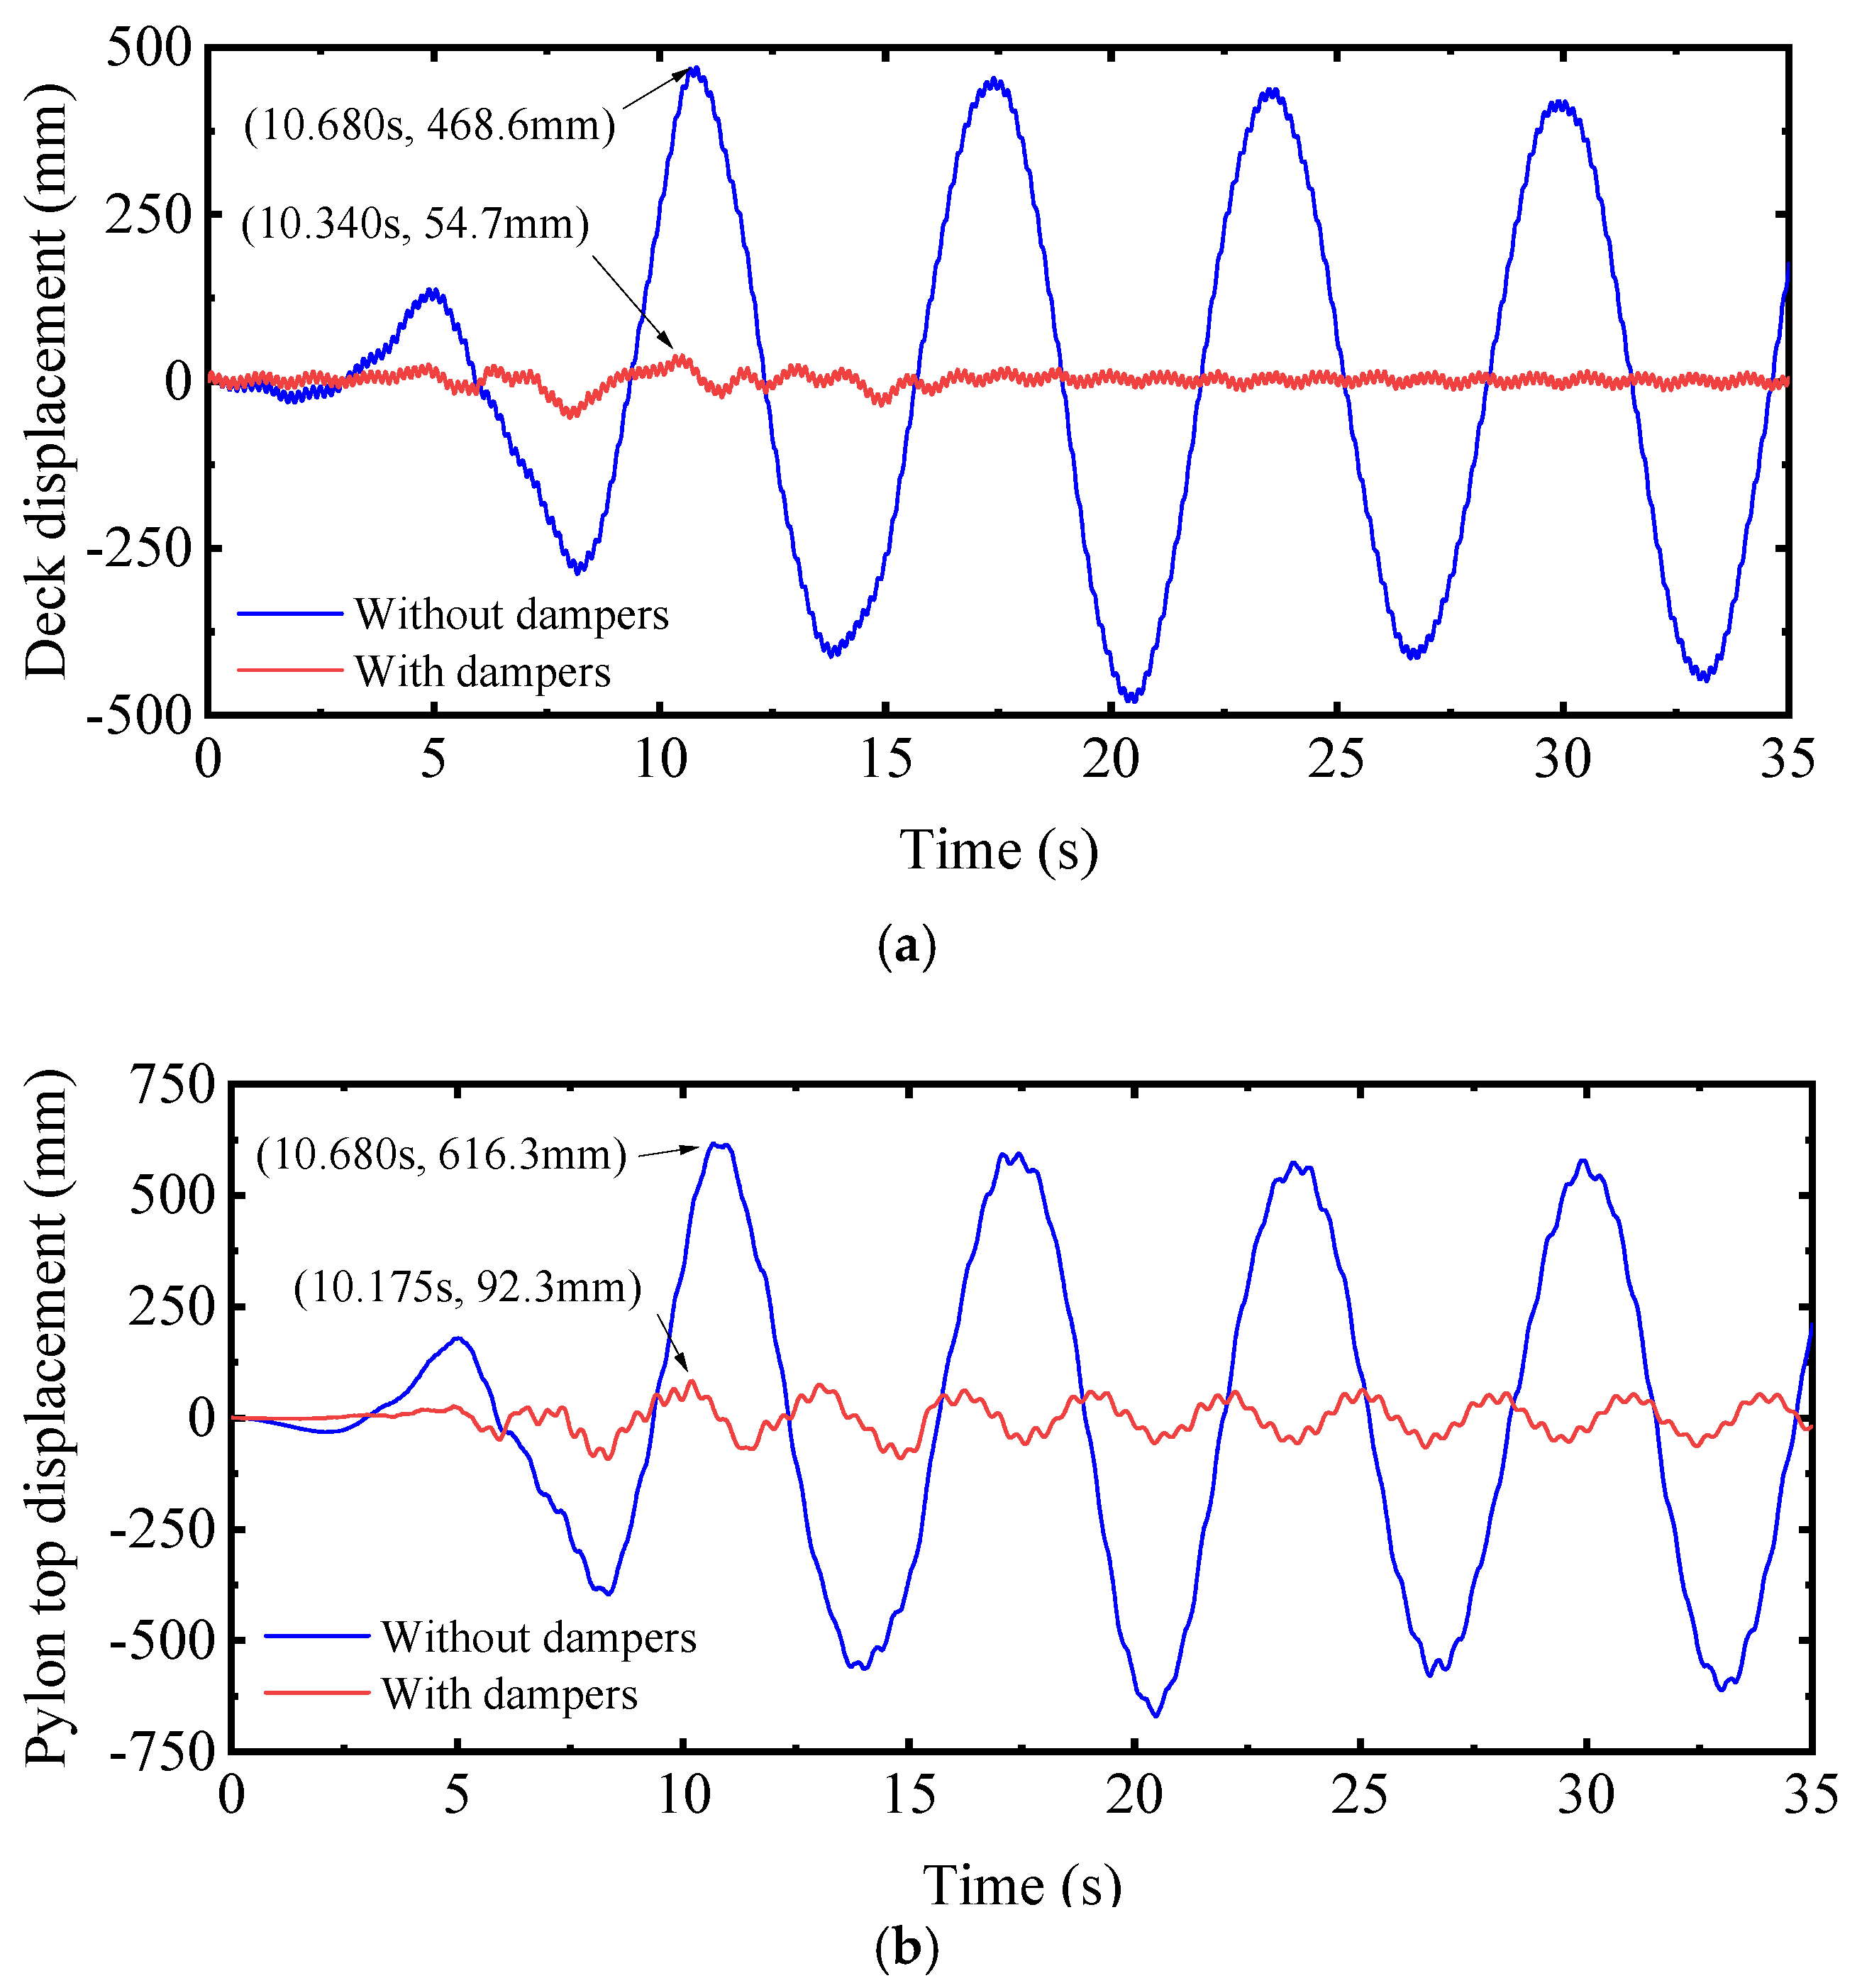
3.1.3. Seismic Mitigation of the Case Study Bridge
3.2. Surrogate Model-Based Parameter Optimization for FVDs
3.2.1. Dataset Generation
3.2.2. Training of Surrogate Models
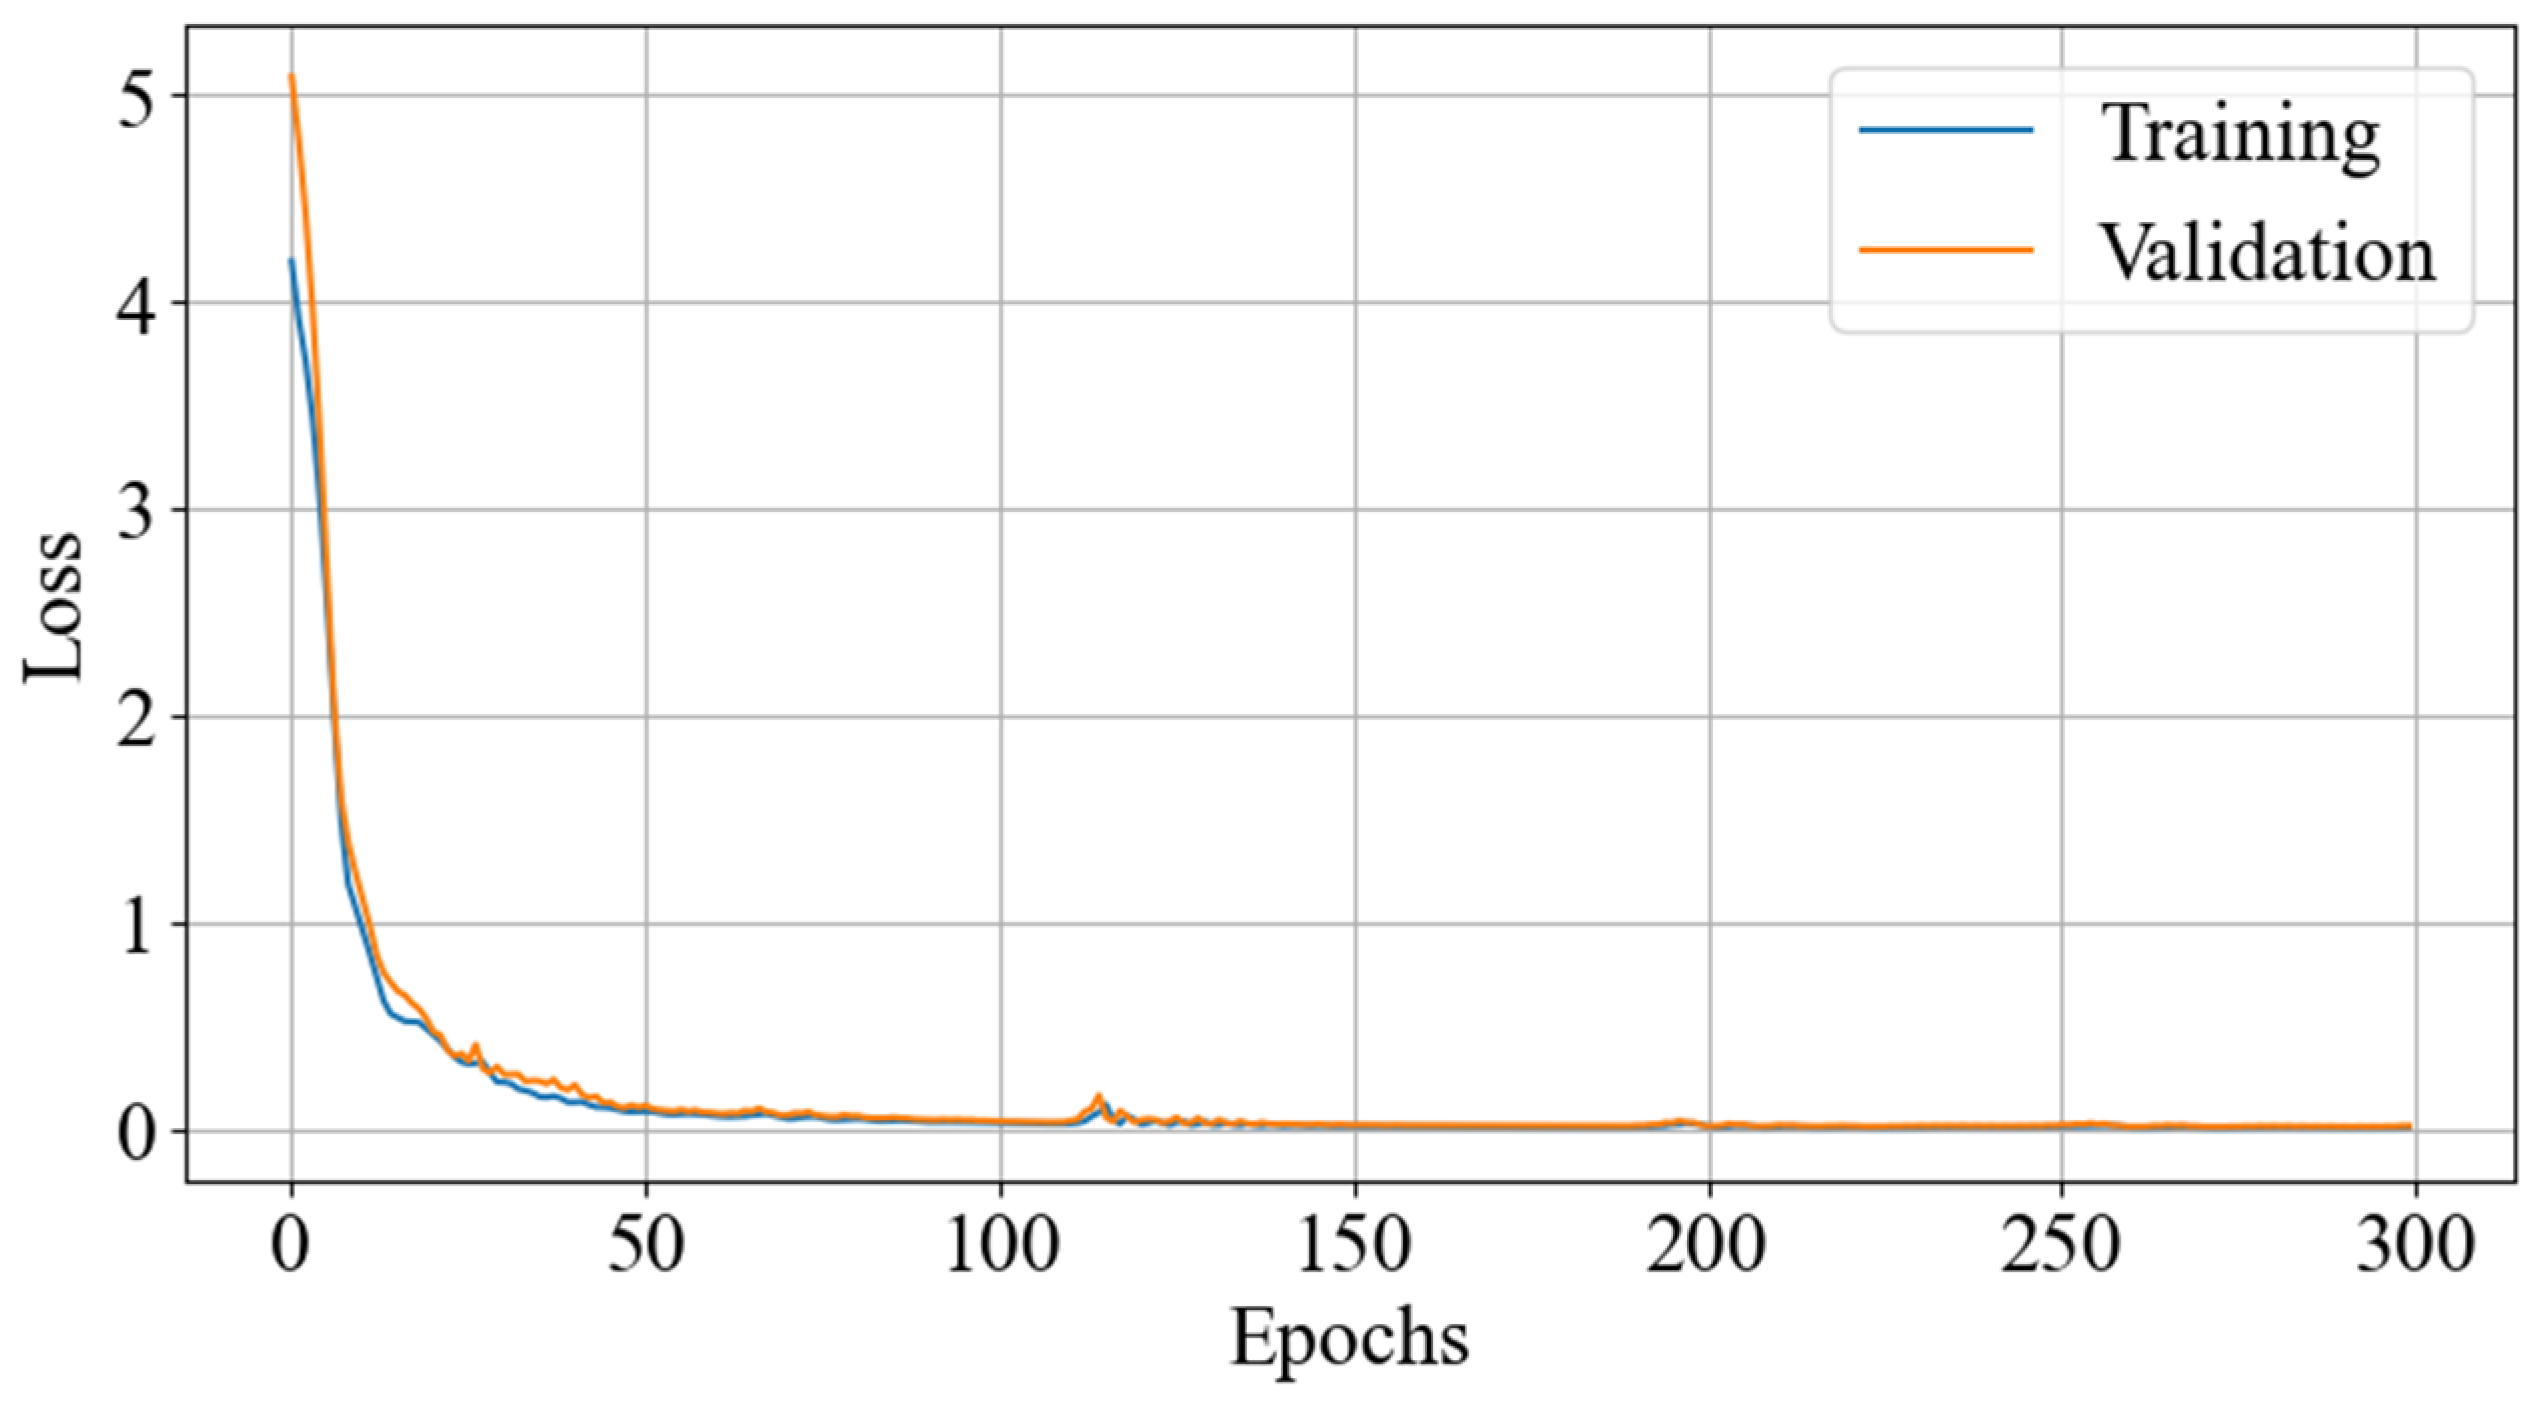
3.2.3. Loss Function
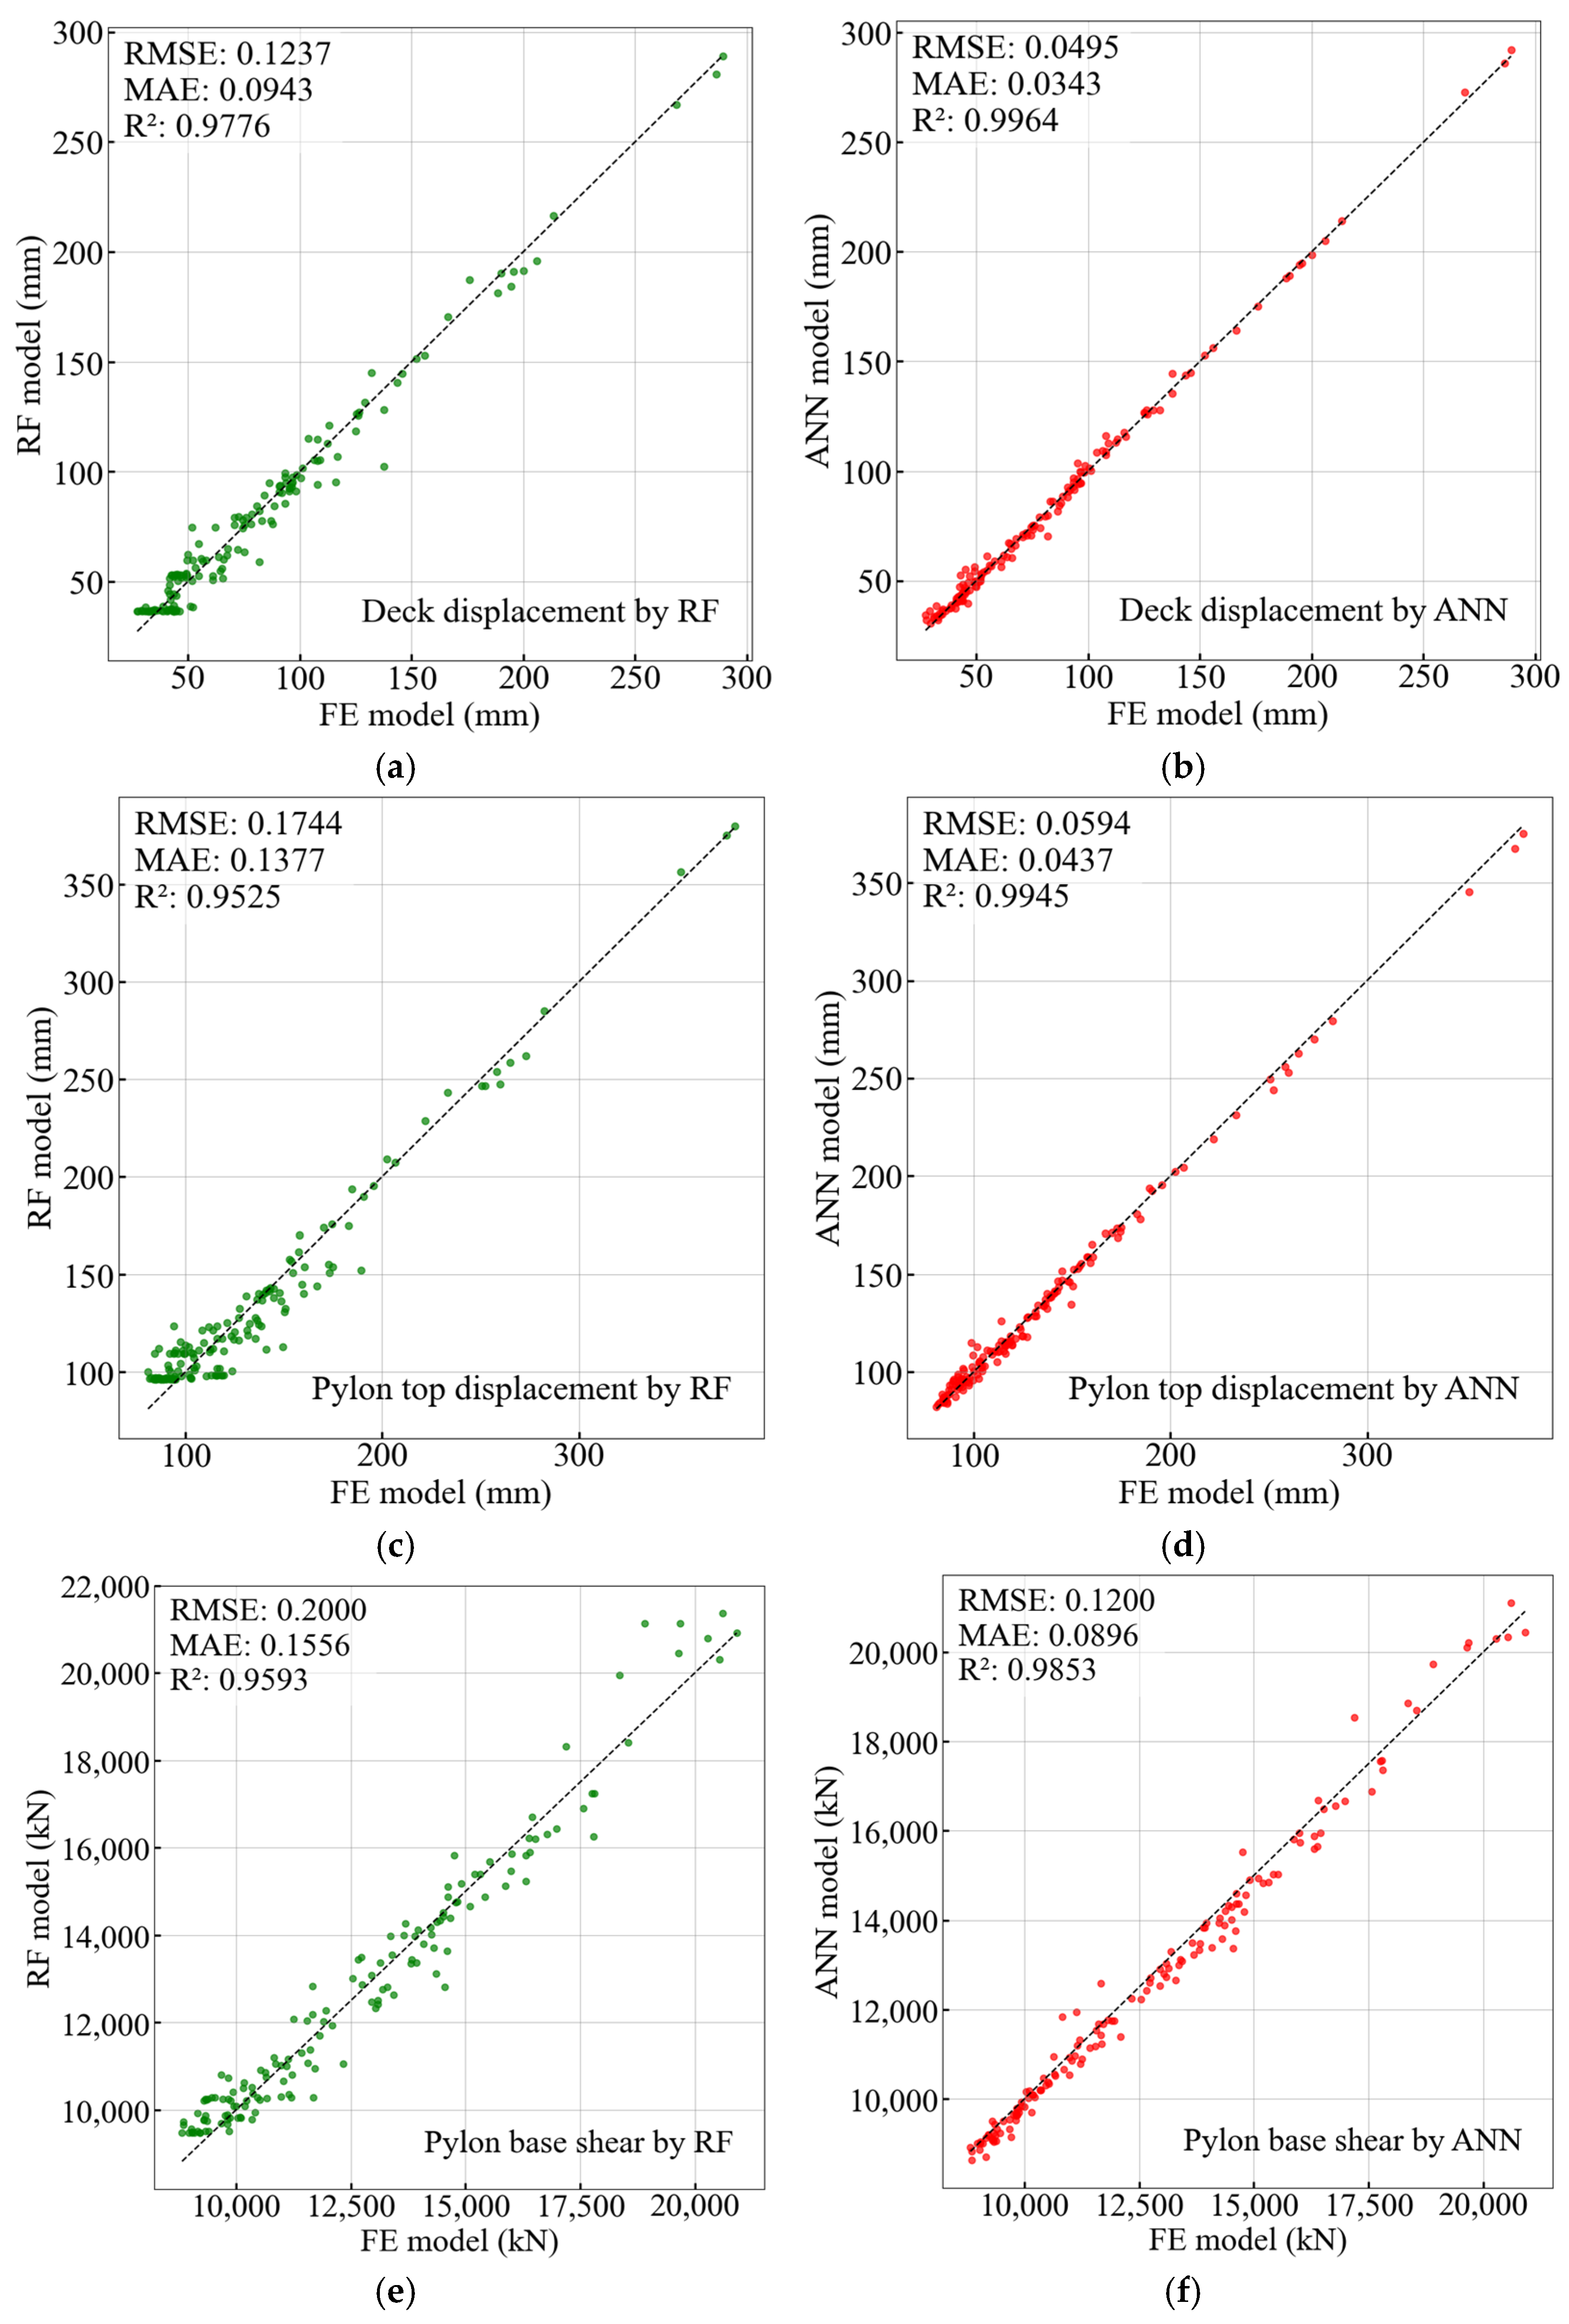
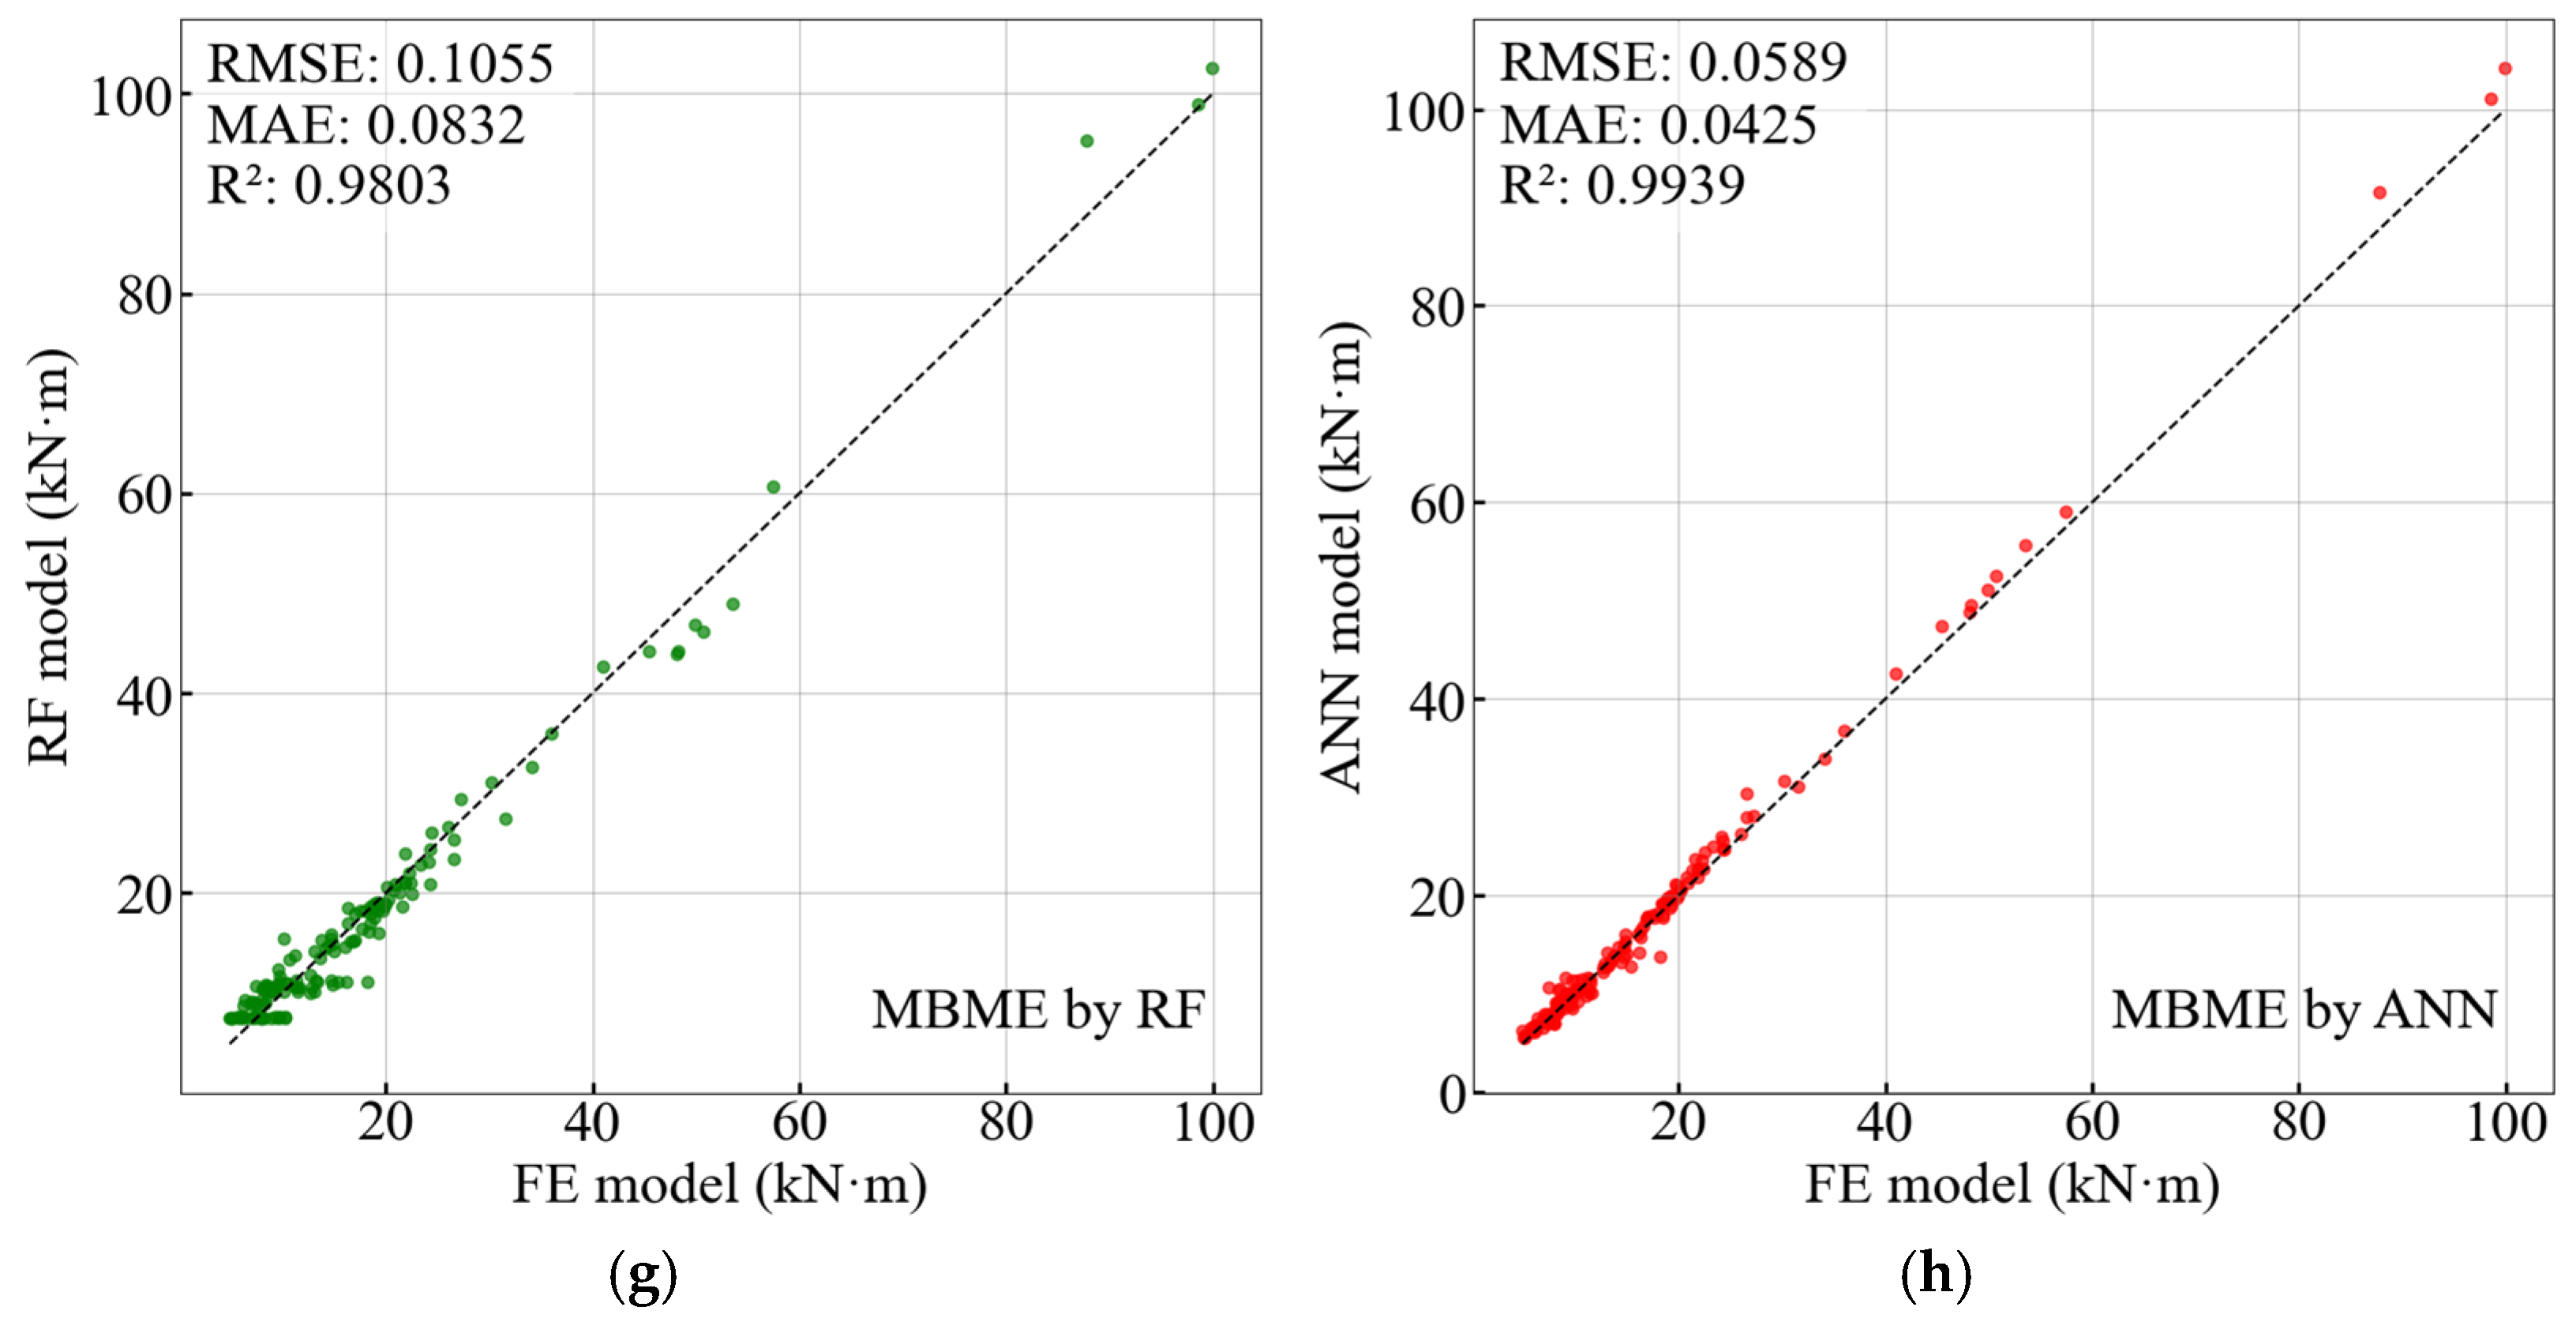
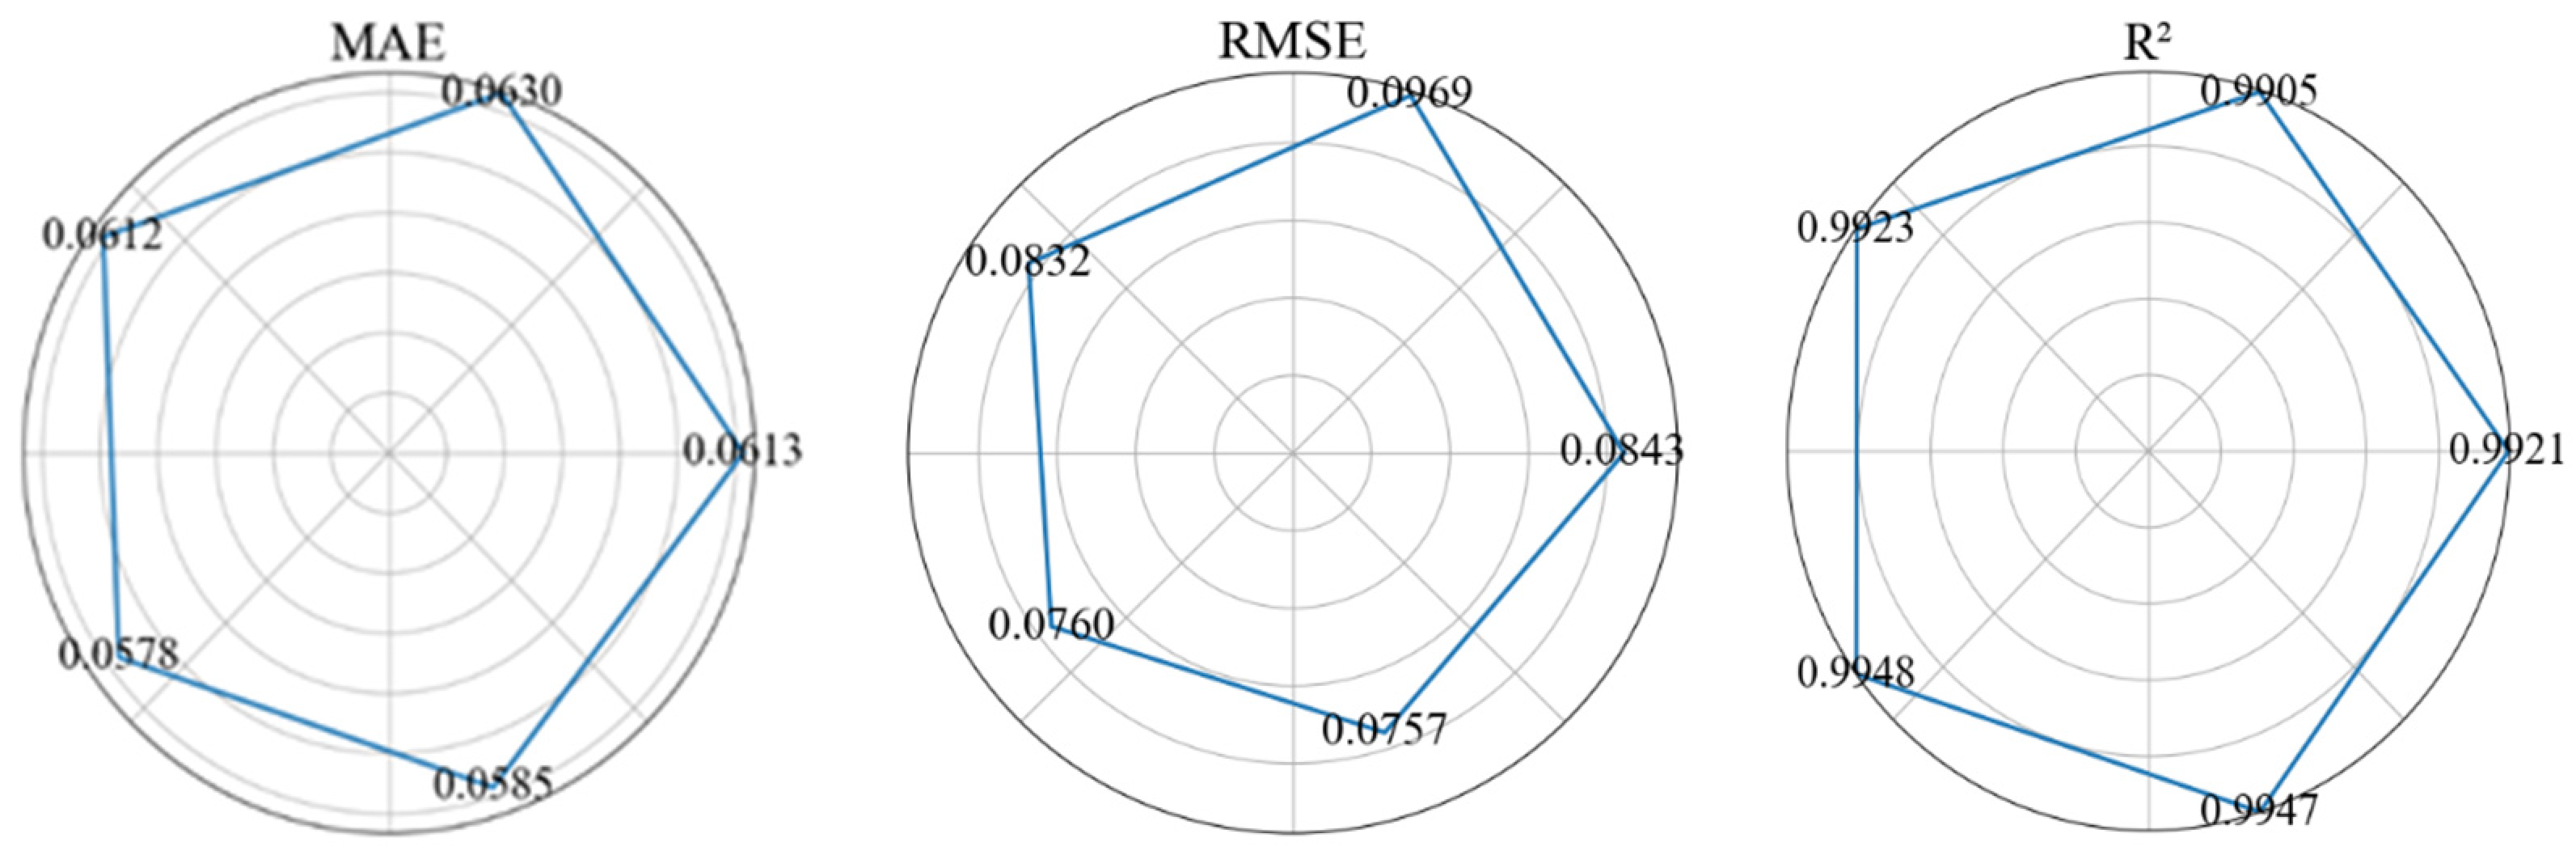
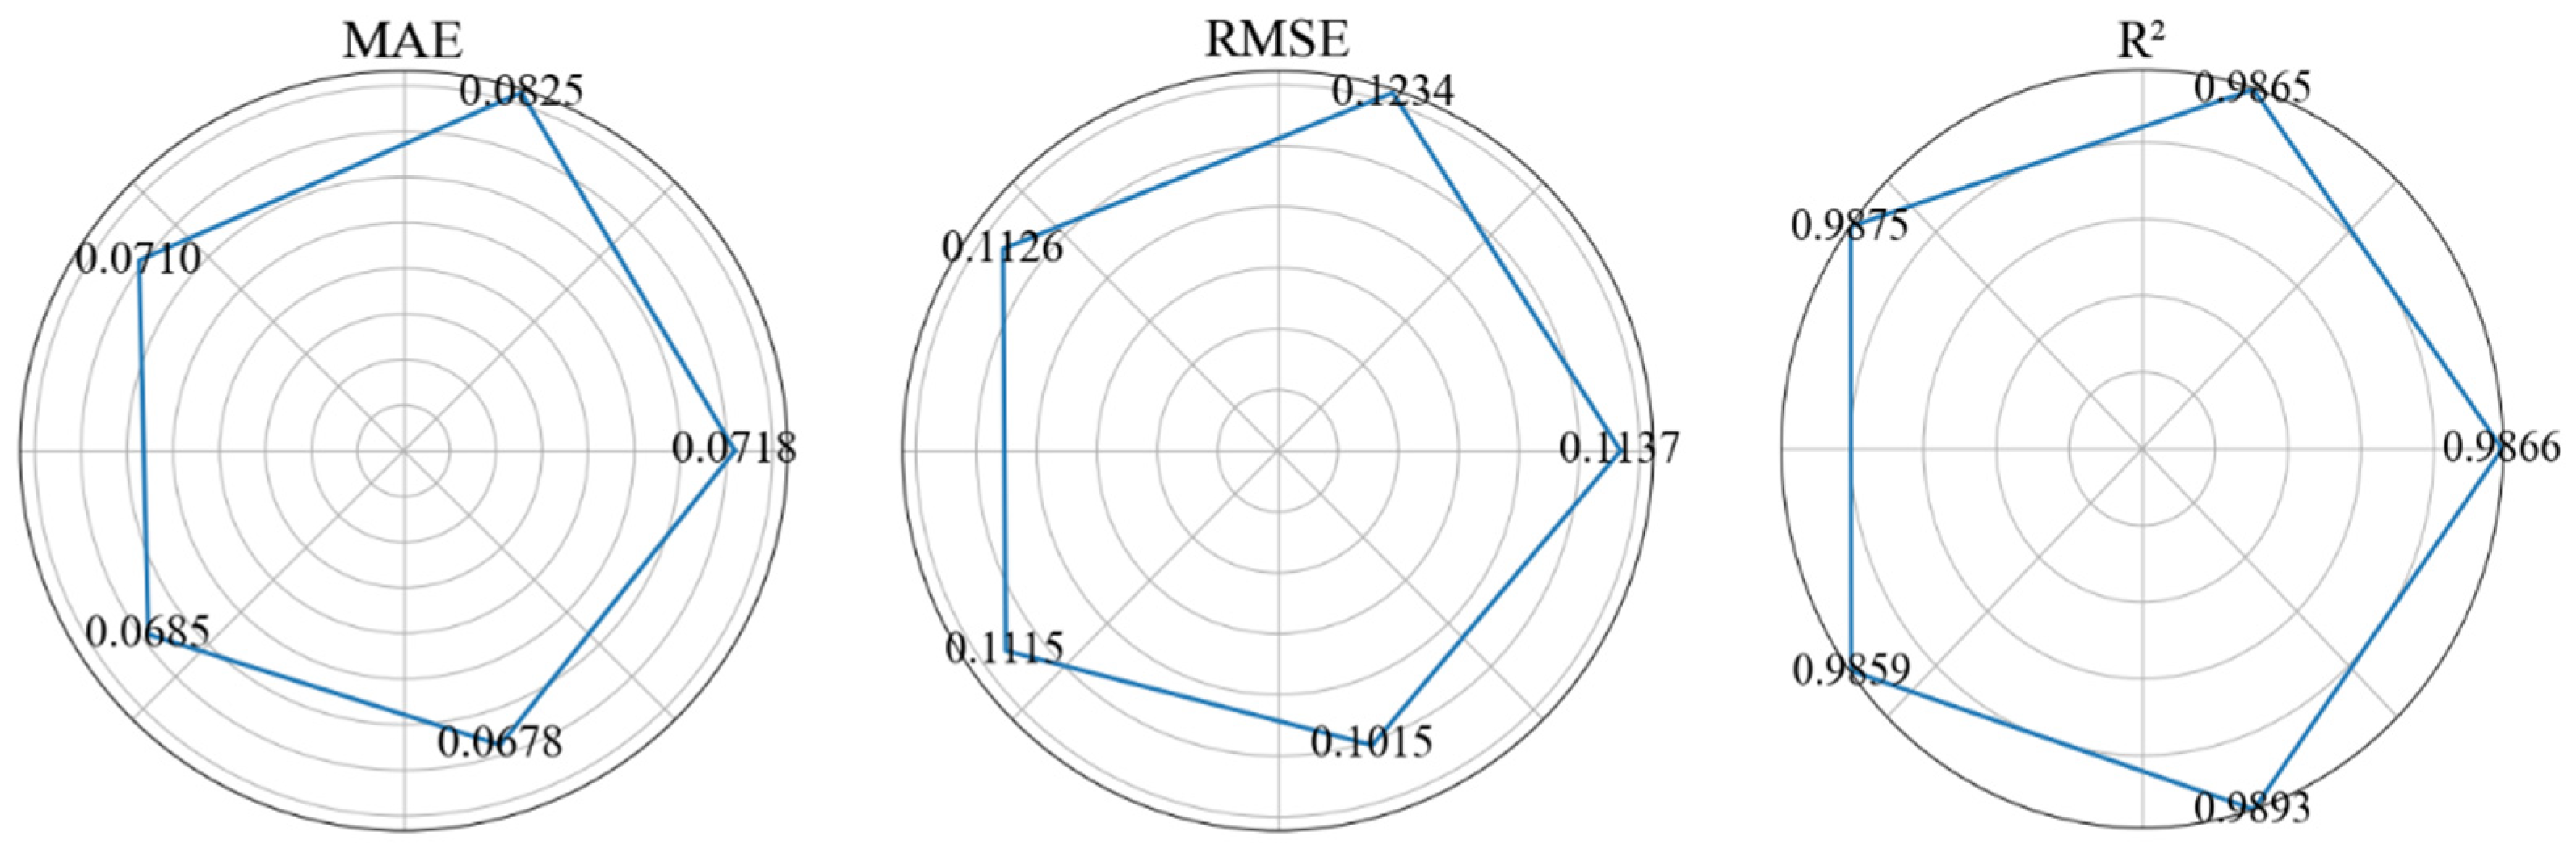
3.2.4. Evaluation of Surrogate Models
3.2.5. Optimization of Damping Parameters Based on the ANN Model
4. Conclusions
- The parametric analysis-driven optimization strategy provides preliminary guidance for selecting optimal FVD parameters. Although this strategy is straightforward and interpretable, it relies heavily on expertise, restricting its ability to explore large design space and its generalization to multi-objective optimization problems.
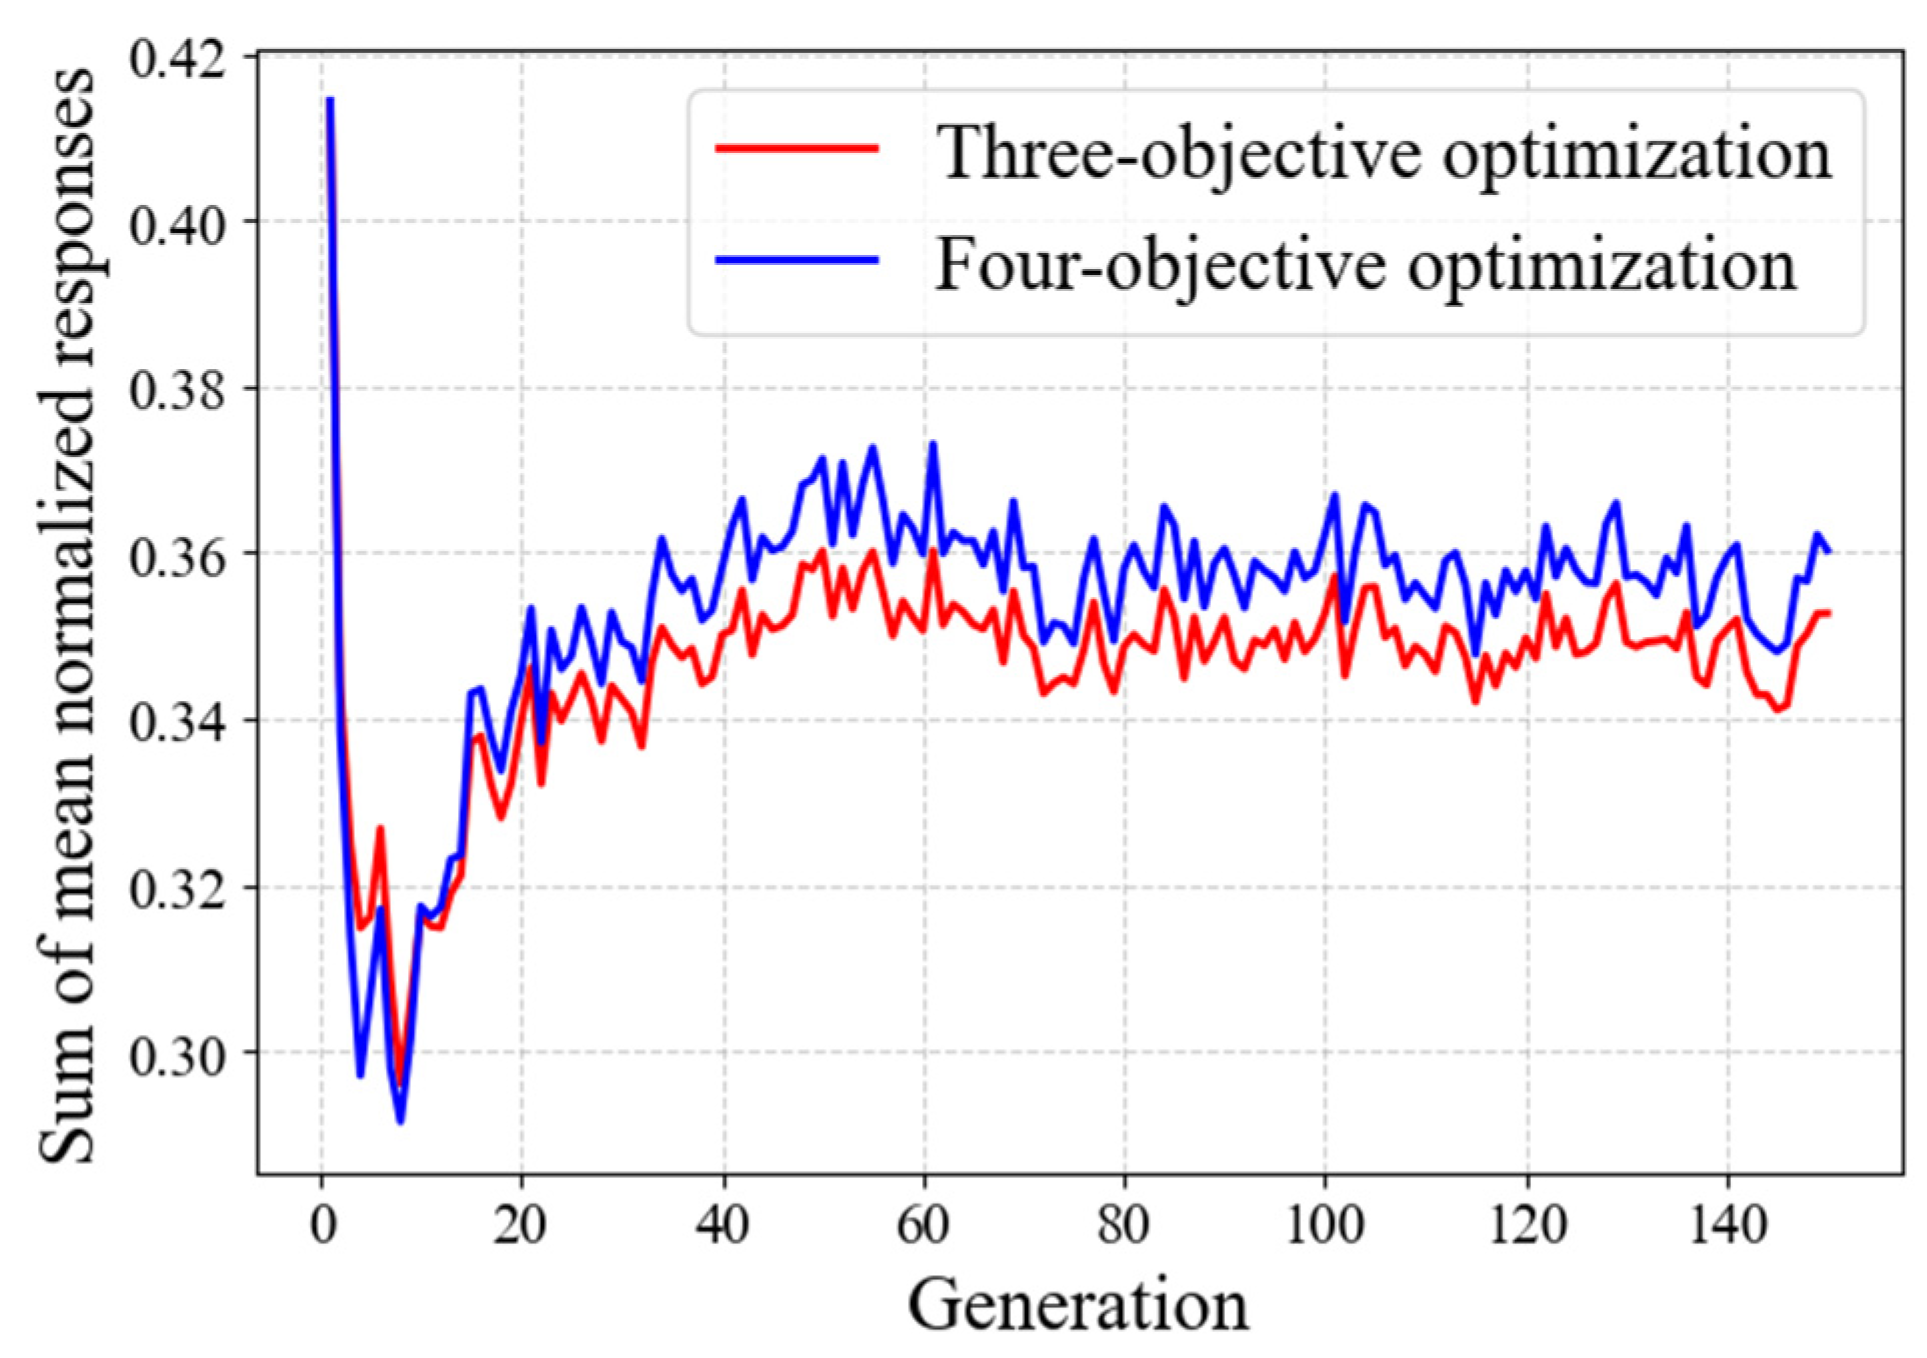
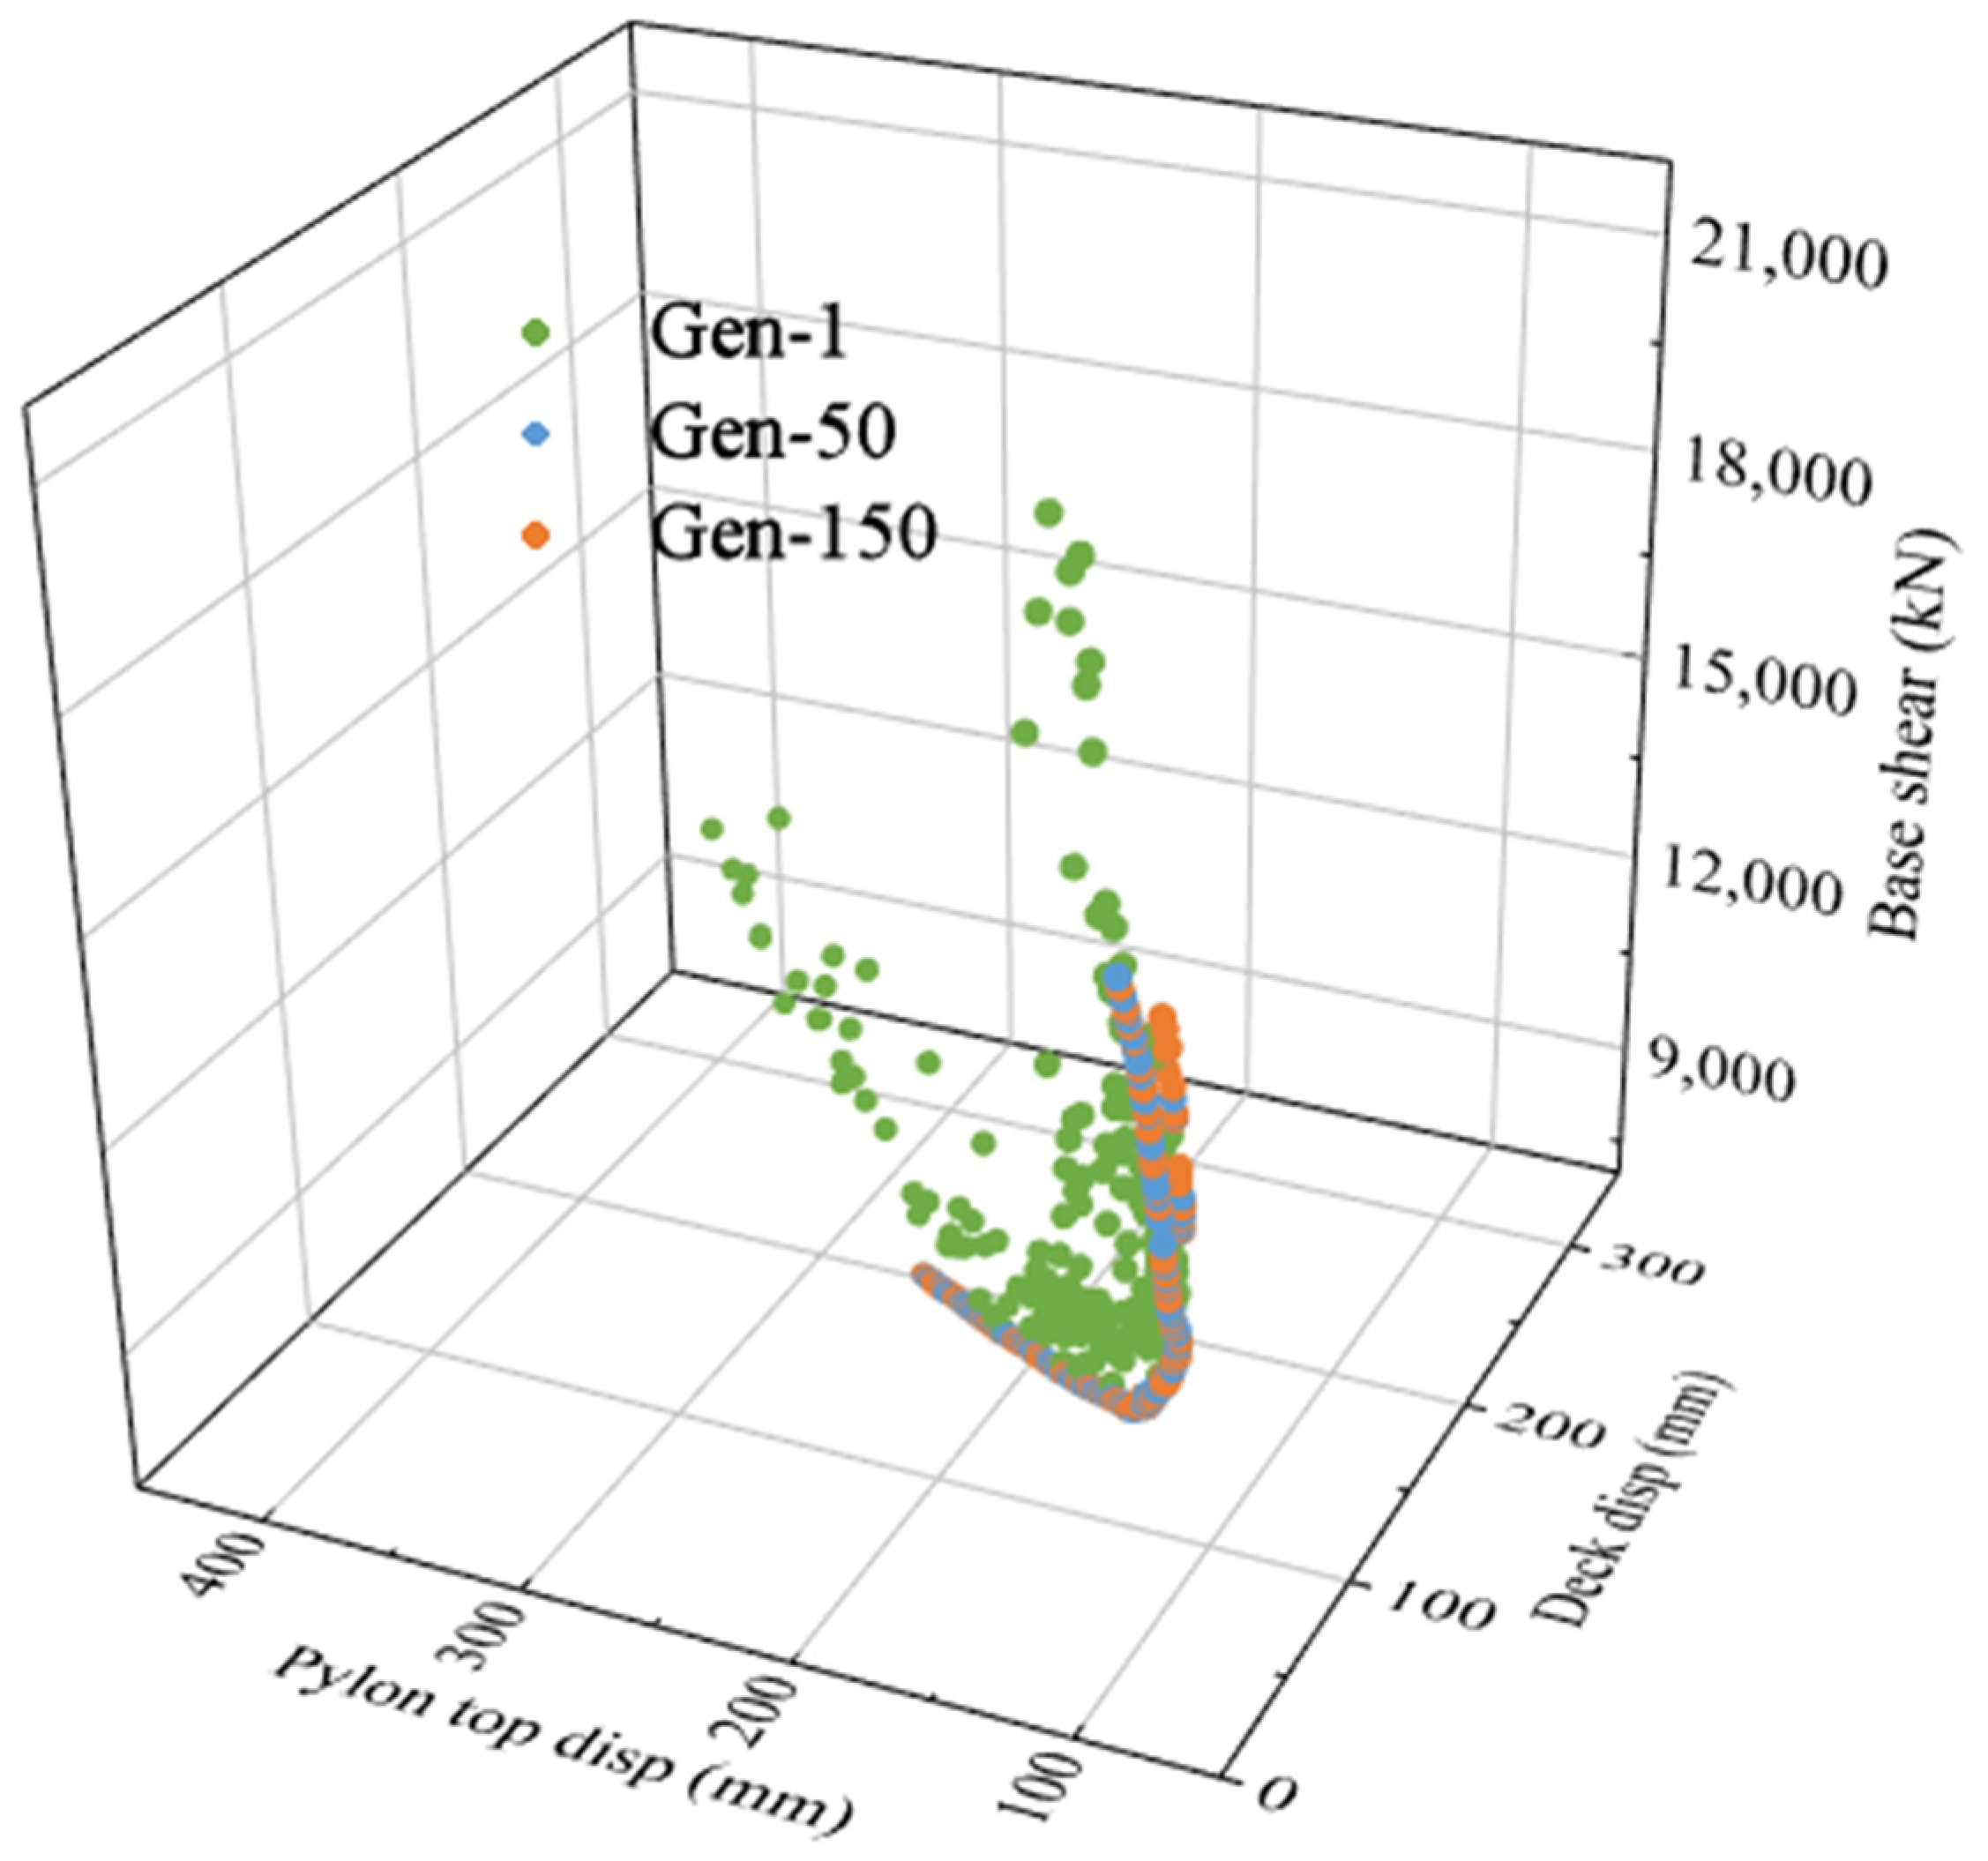
- The integration of an ANN surrogate model with the NSGA-II algorithm demonstrated that the ANN-based multi-objective optimization strategy can not only predict multiple seismic responses accurately, but also reduce computational cost during the multi-objective optimization process. This strategy enables efficient exploration of high-dimensional parameter spaces and yields more effective and generalizable solutions.
- The ANN-based optimization strategy outperformed the parametric analysis-driven strategy by incorporating the MBME loss during surrogate model training. This enhancement improved the fidelity and generalization of the ANN model, demonstrating its potential for addressing high-dimensional, multi-objective optimization challenges.
Author Contributions
Funding
Data Availability Statement
Conflicts of Interest
References
- Xu, L.; Zhang, H.; Gao, J.; Zhang, C. Longitudinal Seismic Responses of a Cable-Stayed Bridge Based on Shaking Table Tests of a Half-Bridge Scale Model. Adv. Struct. Eng. 2019, 22, 81–93. [Google Scholar] [CrossRef]
- Shen, Y.; Li, Y.; Xu, W.; Li, J. Evaluation of Seismic-Induced Impact Interaction between a Cable-Stayed Bridge and Its Approach Spans Using a Simplified Analysis Model. J. Earthq. Eng. 2022, 26, 3343–3363. [Google Scholar] [CrossRef]
- Xie, W.; Sun, L. Transverse Seismic Response and Failure Mode of Towers of a Cable-Stayed Bridge Full-Model: Tests and Simulations. Eng. Fail. Anal. 2021, 122, 105224. [Google Scholar] [CrossRef]
- Zhu, J.; Zhang, W.; Zheng, K.F.; Li, H.G. Seismic Design of a Long-Span Cable-Stayed Bridge with Fluid Viscous Dampers. Pract. Period. Struct. Des. Constr. 2016, 21, 04015006. [Google Scholar] [CrossRef]
- Ali, H.M.; Abdel-Ghaffar, A.M. Seismic Energy Dissipation for Cable-stayed Bridges Using Passive Devices. Earthq. Eng. Struct. Dyn. 1994, 23, 877–893. [Google Scholar] [CrossRef]
- Guo, W.; Zeng, C.; Xie, X.; Bu, D. Pseudodynamic Hybrid Simulation of High-Speed Railway Bridge-Track System with Rotational Friction Damper. Int. J. Struct. Stab. Dyn. 2020, 20, 2040014. [Google Scholar] [CrossRef]
- Leblouba, M. Selection of Seismic Isolation System Parameters for the Near-Optimal Design of Structures. Sci. Rep. 2022, 12, 14734. [Google Scholar] [CrossRef]
- De Domenico, D.; Ricciardi, G.; Takewaki, I. Design Strategies of Viscous Dampers for Seismic Protection of Building Structures: A Review. Soil Dyn. Earthq. Eng. 2019, 118, 144–165. [Google Scholar] [CrossRef]
- Soneji, B.B.; Jangid, R.S. Passive Hybrid Systems for Earthquake Protection of Cable-Stayed Bridge. Eng. Struct. 2007, 29, 57–70. [Google Scholar] [CrossRef]
- Calvi, G.M.; Sullivan, T.J.; Villani, A. Conceptual Seismic Design of Cable-Stayed Bridges. J. Earthq. Eng. 2010, 14, 1139–1171. [Google Scholar] [CrossRef]
- Camara, A.; Astiz, M.A. Analysis and Control of Cable-Stayed Bridges Subject to Seismic Action. Struct. Eng. Int. 2014, 24, 27–36. [Google Scholar] [CrossRef]
- Martínez-Rodrigo, M.D.; Filiatrault, A. A Case Study on the Application of Passive Control and Seismic Isolation Techniques to Cable-Stayed Bridges: A Comparative Investigation through Non-Linear Dynamic Analyses. Eng. Struct. 2015, 99, 232–252. [Google Scholar] [CrossRef]
- Ruangrassamee, A.; Kawashima, K. Seismic Response Control of a Cable-Stayed Bridge by Variable Dampers. J. Earthq. Eng. 2006, 10, 153–165. [Google Scholar] [CrossRef]
- Vader, T.S.; McDaniel, C.C. Influence of Dampers on Seismic Response of Cable-Supported Bridge Towers. J. Bridge Eng. 2007, 12, 373–379. [Google Scholar] [CrossRef]
- Zhang, X.-J.; Zhao, C.-Y.; Guo, J. Investigation of Seismic Performance of Super Long-Span Cable-Stayed Bridges. Earthq. Struct. 2018, 14, 493–503. [Google Scholar]
- Chang, C.-M.; Loh, C.-H. Seismic Response Control of Cable-Stayed Bridge Using Different Control Strategies. J. Earthq. Eng. 2006, 10, 481–508. [Google Scholar] [CrossRef]
- Ali, H.E.M.; Abdel-Ghaffar, A.M. Seismic Passive Control of Cable-Stayed Bridges. Shock. Vib. 1995, 2, 259–272. [Google Scholar] [CrossRef]
- Zoccolini, L.; Bruschi, E.; Pettorruso, C.; Rossi, D.; Quaglini, V. Fluid Viscous Dampers for Seismic Protection of Bridges: A State of the Art. Procedia Struct. Integr. 2024, 62, 669–676. [Google Scholar] [CrossRef]
- He, X.; Yang, Y.; Xiao, X.; Deng, Y. Research on Fluid Viscous Damper Parameters of Cable-Stayed Bridge in Northwest China. Shock. Vib. 2017, 2017, 4532325. [Google Scholar] [CrossRef]
- Feng, D.; Wang, J. Seismic Control of a Self-Anchored Suspension Bridge Using Fluid Viscous Dampers. Int. J. Struct. Stab. Dyn. 2021, 21, 2150025. [Google Scholar] [CrossRef]
- Wu, C.; He, X.; He, L.; Zhao, X.; Wang, Y.; Li, C.; Yang, Y.; Zhang, X. Improving Cable-Stayed Bridge Longitudinal Aseismic Capability via Fluid Viscous Damper Parametric Optimization and Experimental Investigation. Structures 2023, 57, 105199. [Google Scholar] [CrossRef]
- Wen, J.; Han, Q.; Xie, Y.; Du, X.; Zhang, J. Performance-Based Seismic Design and Optimization of Damper Devices for Cable-Stayed Bridge. Eng. Struct. 2021, 237, 112043. [Google Scholar] [CrossRef]
- Xu, L.; Bi, K.; Gao, J.-F.; Xu, Y.; Zhang, C. Analysis on Parameter Optimization of Dampers of Long-Span Double-Tower Cable-Stayed Bridges. Struct. Infrastruct. Eng. 2020, 16, 1286–1301. [Google Scholar] [CrossRef]
- Liu, Q.; Geng, J.; Wang, Y.; Ge, Y.; Bao, Q. Multi-Parameter Damper Optimization of Cable-Stayed Bridge Considering Energy Dissipation. J. Phys. Conf. Ser. 2023, 2541, 012002. [Google Scholar] [CrossRef]
- Chen, X.; Spencer, B.F.; Li, J.; Guan, Z.; Pang, Y. Optimization of Distribution Patterns of Link Beams in a Double-column Tall Pier Bent Subjected to Earthquake Excitations. Earthq. Eng. Struct. Dyn. 2023, 52, 641–659. [Google Scholar] [CrossRef]
- Baei, M.; Terzic, V. Optimal Design of Dampers in Seismic Applications Utilizing the MOPSO Algorithm. Front. Built Environ. 2022, 8, 1040129. [Google Scholar] [CrossRef]
- Sun, C.; Wang, K.; Liu, Q.; Wang, P.; Pan, F. Machine-Learning-Based Comprehensive Properties Prediction and Mixture Design Optimization of Ultra-High-Performance Concrete. Sustainability 2023, 15, 15338. [Google Scholar] [CrossRef]
- Guo, W.; He, Y.; Zhu, Y.; Hu, Y. Performance Parameter Design of Seismic Isolation Bearings for High-Speed Railway Simply-Supported Bridges Using Neural Network. Soil Dyn. Earthq. Eng. 2024, 179, 108535. [Google Scholar] [CrossRef]
- Fang, C.; Ping, Y.; Gao, Y.; Zheng, Y.; Chen, Y. Machine Learning-Aided Multi-Objective Optimization of Structures with Hybrid Braces—Framework and Case Study. Eng. Struct. 2022, 269, 114808. [Google Scholar] [CrossRef]
- Jiang, M.; Rui, X.; Yang, F.; Zhu, W.; Zhang, Y. Multi-Objective Optimization Design for a Magnetorheological Damper. J. Intell. Mater. Syst. Struct. 2022, 33, 33–45. [Google Scholar] [CrossRef]
- Yang, G.; Zhang, T.; Mao, J.; Tian, L.; Du, Y. A NSGA-II-Based Approach for Optimizing Structural Component Pre-Reinforcement to Enhance Cable-Stayed Bridge Resilience. Adv. Struct. Eng. 2024, 28, 1075–1092. [Google Scholar] [CrossRef]
- Tian, Z.; Zhang, Z.; Ning, C.; Peng, T.; Guo, Y.; Cao, Z. Multi-Objective Optimization of Cable Force of Arch Bridge Constructed by Cable-Stayed Cantilever Cast-in-Situ Method Based on Improved NSGA-II. Structures 2024, 59, 105782. [Google Scholar] [CrossRef]
- Almutairi, A.; Lu, J.; Wang, N.; Elgamal, A. Analysis of Multi-Span Bridges Using OpenSees; National Academies: Washington, DC, USA, 2016. [Google Scholar]
- Rastgoo Moghadam, S.; Konstantinidis, D. Experimental and Analytical Studies on the Horizontal Behavior of Elastomeric Bearings under Support Rotation. J. Struct. Eng. 2021, 147, 04021024. [Google Scholar] [CrossRef]
- Kalfas, K.N.; Ghorbani Amirabad, N.; Forcellini, D. The Role of Shear Modulus on the Mechanical Behavior of Elastomeric Bearings When Subjected to Combined Axial and Shear Loads. Eng. Struct. 2021, 248, 113248. [Google Scholar] [CrossRef]
- Joyner, M.D.; Gardner, C.; Puentes, B.; Sasani, M. Resilience-Based Seismic Design of Buildings through Multiobjective Optimization. Eng. Struct. 2021, 246, 113024. [Google Scholar] [CrossRef]
- Deutsch, J.L.; Deutsch, C.V. Latin Hypercube Sampling with Multidimensional Uniformity. J. Stat. Plan. Inference 2012, 142, 763–772. [Google Scholar] [CrossRef]
- Akiba, T.; Sano, S.; Yanase, T.; Ohta, T.; Koyama, M. Optuna: A Next-Generation Hyperparameter Optimization Framework 2019. In Proceedings of the 25th ACM SIGKDD International Conference, Anchorage, AK, USA, 4–8 August 2019. [Google Scholar]
- Verma, S.; Pant, M.; Snasel, V. A Comprehensive Review on NSGA-II for Multi-Objective Combinatorial Optimization Problems. IEEE Access 2021, 9, 57757–57791. [Google Scholar] [CrossRef]
- Jia, H.; Liu, Z.; Xu, L.; Bai, H.; Bi, K.; Zhang, C.; Zheng, S. Dynamic Response Analyses of Long-Span Cable-Stayed Bridges Subjected to Pulse-Type Ground Motions. Soil Dyn. Earthq. Eng. 2023, 164, 107591. [Google Scholar] [CrossRef]
- JTG D20—2017; Specifications for Seismic Design of Highway Bridges. Standards Press of China: Bejing, China, 2020.
- Kamrava, A. Comparing Results of MATLAB and Seismosignal in Plotting Earthquake Graphs. Curr. World Environ. 2015, 10, 11–14. [Google Scholar] [CrossRef]
- Ras, A.; Boumechra, N. Seismic Energy Dissipation Study of Linear Fluid Viscous Dampers in Steel Structure Design. Alex. Eng. J. 2016, 55, 2821–2832. [Google Scholar] [CrossRef]
- Liu, Q.; Zhu, S.; Yu, W.; Wu, X.; Song, F.; Ren, X. Ground Motion Frequency Insensitivity of Bearing-Supported Pedestrian Bridge with Viscous Dampers. KSCE J. Civ. Eng. 2021, 25, 2662–2673. [Google Scholar] [CrossRef]
- Panda, S.K.; Jana, P.K. Efficient Task Scheduling Algorithms for Heterogeneous Multi-Cloud Environment. J. Supercomput. 2015, 71, 1505–1533. [Google Scholar] [CrossRef]
- Marler, R.T.; Arora, J.S. The Weighted Sum Method for Multi-Objective Optimization: New Insights. Struct. Multidisc. Optim. 2010, 41, 853–862. [Google Scholar] [CrossRef]
- Yu, C.; Xiang, H.; Li, Y.; Pan, M. Optimization of Longitudinal Viscous Dampers for a Freight Railway Cable-Stayed Bridge under Braking Forces. Smart Struct. Syst. 2018, 21, 669–675. [Google Scholar]
- Ozdagli, A.; Volgyesi, P.; Koutsoukos, X. Surrogate Modeling Using Physics-Guided Learning. In Proceedings of the Cyber-Physical Systems and Internet of Things Week 2023, San Antonio, TX, USA, 9 May 2023; ACM: New York, NY, USA, 2023; pp. 130–135. [Google Scholar]


| Literature | Year | Optimization Strategy | Application |
|---|---|---|---|
| Xu et al. [23] | 2019 | FE model, parametric analyses | Parameter optimization of FVDs in cable-stayed bridges |
| Chen et al. [26] | 2022 | FE model, response surface method | Two-objective seismic optimization of design parameters in double-column piers |
| Baei et al. [27] | 2022 | FE model, MOPSO algorithm | Multi-objective optimization of damper parameters for viscous dampers in moment frames |
| Guo et al. [29] | 2024 | ANN model, response evaluation | TFPB parameter design based on ANN inverse prediction model in simply-supported bridges |
| Fang et al. [30] | 2022 | Five ML models, NSGA-II | Multi-objective optimization of brace design parameters in structures with hybrid braces |
| Jiang et al. [31] | 2022 | Design equations, NSGA-II | Multi-objective optimization of design parameters for a magnetorheological damper |
| Yang et al. [32] | 2024 | FE model, NSGA-II | Multi-objective optimization of repair sequence in cable-stayed bridges |
| Tian et al. [33] | 2024 | FE model, NSGA-II | Multi-objective optimization of cable forces in arch bridges |
| No. | Event | Year | Station | Magnitude | Vs_30 (m/s) | PGA (g) | PGV (cm/s) |
|---|---|---|---|---|---|---|---|
| 1 | Imperial Valley-06 | 1979 | Chihuahua | 6.53 | 242.05 | 0.28 | 30.5 |
| 2 | Loma Prieta | 1989 | BRAN | 6.93 | 476.54 | 0.64 | 55.9 |
| 3 | Cape Mendocino | 1992 | Cape Mendocino | 7.0 | 514 | 1.43 | 119.5 |
| 4 | Northridge-01 | 1994 | LA—Sepulveda VA | 6.7 | 380 | 0.73 | 70.1 |
| 5 | Kocaeli, Turkey | 1999 | Yarimca | 7.5 | 297 | 0.31 | 73 |
| 6 | Chi-Chi, Taiwan | 1999 | TCU084 | 7.6 | 553 | 1.16 | 115.1 |
| 7 | Denali, Alaska | 2002 | TAPS Pump Sta. #10 | 7.9 | 553 | 0.33 | 126.4 |
| Velocity Exponent | Damper Stiffness (kN/m) | Damping Coefficient kN/(m/s) | Deck Disp. (mm) | Pylon Top Disp. (mm) | Pylon Base Shear (kN) | g |
|---|---|---|---|---|---|---|
| 0.3 | 1 × 10⁶ | 3000 | 54.7 | 92.3 | 10,847.8 | 0.276 |
| 0.2 | 1 × 10⁶ | 3000 | 40.0 | 77.1 | 12,431.5 | 0.278 |
| 0.3 | 9 × 10⁵ | 3000 | 54.4 | 91.6 | 10,971.7 | 0.280 |
| 0.2 | 9 × 10⁵ | 3000 | 40.4 | 76.9 | 12,536.9 | 0.281 |
| 0.4 | 1 × 10⁶ | 4000 | 55.9 | 93.6 | 10,858.8 | 0.283 |
| 0.3 | 1 × 10⁶ | 4000 | 41.6 | 81.2 | 12,310.3 | 0.284 |
| 0.3 | 8 × 10⁵ | 3000 | 54.5 | 91.8 | 11,125.0 | 0.286 |
| 0.4 | 1 × 10⁶ | 5000 | 45.8 | 86.3 | 11,901.9 | 0.288 |
| 0.4 | 9 × 10⁵ | 4000 | 55.9 | 93.1 | 11,011.6 | 0.288 |
| 0.5 | 1 × 10⁶ | 6000 | 51.2 | 90.4 | 11,463.3 | 0.291 |
| Hyperparameter | Optimal Value | Search Range |
|---|---|---|
| max_depth | 17 | 1–20 |
| min_samples_split | 5 | 1–10 |
| min_samples_leaf | 2 | 1–10 |
| Hyperparameter | Optimal Value | Search Range |
|---|---|---|
| n_estimators | 85 | 10–200 |
| n_layers | 6 | 3–10 |
| learning_rate | 0.1 | 0.01–0.1 |
| subsample | 0.9 | 0.6–1 |
| colsample_bytree | 0.9 | 0.6–1 |
| Hyperparameter | Optimal Value | Search Range |
|---|---|---|
| n_estimators | 34 | 10–100 |
| max_depth | 5 | 3–10 |
| min_samples_split | 3 | 1–10 |
| min_samples_leaf | 1 | 1–10 |
| bootstrap | True | — |
| Hyperparameter | Optimal Value | Search Range |
|---|---|---|
| hidden_layer_size | 16, 32, 64, 32 | 10–100 |
| n_layers | 4 | 2–5 |
| activation | ReLU | — |
| solver | Adam | — |
| α | 0.0001 | 0.1–0.00001 |
| learning_rate | 0.008 | — |
| λ1:λ2:λ3:λ4 | Inflection (Epochs) | Total Training Loss | Total Validation Loss |
|---|---|---|---|
| 1.3:1.3:1.3:0.1 | 100 | 0.020 | 0.031 |
| 1:1:1:1 | 50 | 0.012 | 0.015 |
| 2/3:2/3:2/3:1 | 100 | 0.015 | 0.019 |
| 1/3:1/3:1/3:3 | 100 | 0.020 | 0.025 |
| 0.1:0.1:0.1:3.7 | 100 | 0.015 | 0.020 |
| Model | Metrics | Deck Disp. | Pylon Top Disp. | Pylon Base Shear | MBME |
|---|---|---|---|---|---|
| RMSE | 0.140 | 0.161 | 0.234 | 0.105 | |
| DT | R2 | 0.971 | 0.960 | 0.944 | 0.981 |
| MAE | 0.094 | 0.106 | 0.174 | 0.067 | |
| RMSE | 0.187 | 0.233 | 0.228 | 0.211 | |
| XGBoost | R2 | 0.948 | 0.915 | 0.947 | 0.922 |
| MAE | 0.125 | 0.157 | 0.168 | 0.121 | |
| RMSE | 0.148 | 0.187 | 0.206 | 0.153 | |
| RF | R2 | 0.979 | 0.967 | 0.951 | 0.979 |
| MAE | 0.112 | 0.146 | 0.159 | 0.153 | |
| RMSE | 0.060 | 0.069 | 0.124 | 0.058 | |
| ANN | R2 | 0.995 | 0.993 | 0.984 | 0.994 |
| MAE | 0.044 | 0.047 | 0.080 | 0.039 |
| Performance Metric | ANN Model | FE Model | Error |
|---|---|---|---|
| Deck disp. (mm) | 41.8 | 45.2 | 7.5% |
| Pylon top disp. (mm) | 80.6 | 84.8 | 4.9% |
| Pylon base shear (kN) | 11,611.3 | 11,973.1 | 3.0% |
| Parameters/Responses | Without FVDs | Parametric Analysis-Driven Optimization | ANN-Based 3-Objective Optimization | ANN-Based 4-Objective Optimization |
|---|---|---|---|---|
| K (kN/m) | - | 1,000,000 | 928,000 | 895,000 |
| C (kN·s/m) | - | 3000 | 3938 | 3947 |
| α | - | 0.3 | 0.32 | 0.33 |
| Deck disp. (mm) | 486.6 | 54.7 | 45.2 | 47.4 |
| Pylon top disp. (mm) | 613.3 | 92.3 | 84.8 | 85.3 |
| Pylon base shear (kN) | 14,600.0 | 10,847.8 | 11,973.1 | 11,884.9 |
| MBME (kN·m) | 121.2 | 10.1 | 8.9 | 7.7 |
| Time consuming (min) | - | 1500.5 | 1500.5 + 9.0 + 0.8 | 1500.5 + 9.0 + 0.8 |
Disclaimer/Publisher’s Note: The statements, opinions and data contained in all publications are solely those of the individual author(s) and contributor(s) and not of MDPI and/or the editor(s). MDPI and/or the editor(s) disclaim responsibility for any injury to people or property resulting from any ideas, methods, instructions or products referred to in the content. |
© 2025 by the authors. Licensee MDPI, Basel, Switzerland. This article is an open access article distributed under the terms and conditions of the Creative Commons Attribution (CC BY) license (https://creativecommons.org/licenses/by/4.0/).
Share and Cite
Liu, Q.; Liu, Z.; Zhao, J.; Lei, Y.; Zhu, S.; Wu, X. Seismic Optimization of Fluid Viscous Dampers in Cable-Stayed Bridges: A Case Study Using Surrogate Models and NSGA-II. Buildings 2025, 15, 1446. https://doi.org/10.3390/buildings15091446
Liu Q, Liu Z, Zhao J, Lei Y, Zhu S, Wu X. Seismic Optimization of Fluid Viscous Dampers in Cable-Stayed Bridges: A Case Study Using Surrogate Models and NSGA-II. Buildings. 2025; 15(9):1446. https://doi.org/10.3390/buildings15091446
Chicago/Turabian StyleLiu, Qunfeng, Zhen Liu, Jun Zhao, Yuhang Lei, Shimin Zhu, and Xing Wu. 2025. "Seismic Optimization of Fluid Viscous Dampers in Cable-Stayed Bridges: A Case Study Using Surrogate Models and NSGA-II" Buildings 15, no. 9: 1446. https://doi.org/10.3390/buildings15091446
APA StyleLiu, Q., Liu, Z., Zhao, J., Lei, Y., Zhu, S., & Wu, X. (2025). Seismic Optimization of Fluid Viscous Dampers in Cable-Stayed Bridges: A Case Study Using Surrogate Models and NSGA-II. Buildings, 15(9), 1446. https://doi.org/10.3390/buildings15091446