Article

Effect of Diaphragm Above Concrete-Filled Part on Horizontal Load Capacity of Partially Concrete-Filled Circular Piers Subjected to Axial Forces

1
Department of Water Environment and Civil Engineering, Shinshu University, Wakasato 4-Chome, Nagano 380-8553, Japan
2
Shimizu Corporation, Kyobashi 2-16-1, Tokyo 104-8370, Japan
3
C.E. Management Integrated Laboratory Co., Ltd., Amenomiya 2347-3, Nagano 387-0001, Japan
*
Author to whom correspondence should be addressed.
Buildings 2025, 15(6), 863; https://doi.org/10.3390/buildings15060863
Submission received: 1 February 2025 / Revised: 26 February 2025 / Accepted: 5 March 2025 / Published: 10 March 2025
(This article belongs to the Special Issue Research on the Seismic Design of Steel Frames)

Abstract

:
Partially concrete-filled steel tubes (PCFSTs) are often used to reduce the dead weight of concrete-filled steel tubes (CFSTs). Most previous studies have focused on the presence or absence of diaphragms directly above the concrete filling of PCFSTs, and few have focused on diaphragm characteristics. Therefore, this study presents the parametric analysis of partially concrete-filled steel tubes with circular cross-sections to clarify the effect of the diaphragm’s parameters on the horizontal load capacity. The authors performed pushover analyses for a total of 84 cases, focusing on four axial force ratios, three diaphragm thicknesses, and seven diaphragm opening ratios. Although the thickness of the diaphragm had little effect on the horizontal load capacity, the opening ratio affected the horizontal load capacity. It was found that an opening ratio of 40–80% provided a higher horizontal load capacity than the 20%, 90%, and 95% openings.

1. Introduction

A concrete-filled steel tube (CFST) is a structure in which the inside of the steel tube is filled with concrete. Inside the CFST, the steel tube restrains the expansion of the concrete filling inside, resulting in a triaxial compressive stress state and providing a large load capacity. In civil engineering structures, it is widely used for steel piers of road bridges and elevated railway bridges to improve their seismic resistance because it enables rapid construction and construction in narrow areas [1]. In addition to column structures, there are also examples of CFSTs being used for girders and arch ribs [2,3,4,5]. In addition, partially concrete-filled steel tubes (PCFSTs) are often used to reduce the dead weight of concrete. For PCFSTs, it is recommended that a diaphragm be installed directly above the concrete filling to confine the concrete to prevent horizontal cracking of the concrete filling at the base of the steel tube and to allow the concrete filling to bear the axial force [6].
Many previous studies of PCFSTs with circular cross-sections have focused on design parameters, such as the concrete filling ratio, slenderness ratio, and diameter–thickness ratio [7,8] and finite element (FE) analyses have been performed [9,10,11,12]. However, few studies have focused on the diaphragm directly above the concrete filling in the PCFST. For example, Ota et al. studied the effect of concrete-filling repair for steel piers in relation to PCFSTs, focusing on the concrete filling height and the presence or absence of diaphragms [13]. The results showed that the installation of the diaphragm resulted in a higher maximum horizontal load, resulting in a larger displacement being required to reach the maximum horizontal load. In addition, Shimaguchi and Suzuki conducted experiments on the effect of concrete fill repair for steel piers with the PCFST, focusing on the filling ratio, radius thickness ratio, and the presence or absence of diaphragms [14]. This study reported that, when the piers have base strain values of up to 2% and a radius thickness ratio parameter of 0.065 to 0.080, restoration by simply filling with concrete is sufficient to restore load capacity. However, to mitigate damage when the base strain reaches approximately 5%, methods such as diaphragm installation are needed. Zenzai et al. also studied the effect of the diaphragm opening ratio on the seismic behavior of PCFSTs by FE analysis [15]. Seismic response analysis revealed that buckling occurred at the base of the PCFST or just above the diaphragm, depending on whether a diaphragm was present, and that these differences had a significant effect on the post-buckling behavior. As described above, most of the previous studies have focused on the presence or absence of diaphragms directly above the concrete filling of PCFSTs, and few have focused on diaphragm characteristics. The literature focusing on the diaphragm opening ratio [15] is limited to a total of eight cases, and further knowledge is needed to evaluate the effect of the diaphragm.
Therefore, this study can be regarded as a fundamental study of PCFSTs with circular cross-sections, and the influence of the diaphragm just above the concrete filling on the horizontal load capacity and buckling deformation was clarified with pushover analysis. Specifically, parametric analysis was performed by varying the axial compressive force acting directly above the steel tube in the PCFST in addition to the diaphragm thickness and opening ratio.
Section 2 explains the numerical conditions, including design parameters, FE models, material properties, boundary conditions, and contact conditions. Then, Section 3 shows the numerical results, horizontal load and horizontal displacement curve, shape deformation, and Mises stress distribution, focusing on the primary cases. Based on these results, Section 4 discusses the effects of the thickness and opening ratio of the diaphragm on the local buckling and horizontal load capacity of the PCFST, assessing the location of local buckling, the horizontal load capacity, and the Mises stress distribution of the PCFSTs. Finally, concluding remarks are presented in Section 5.

2. Numerical Conditions

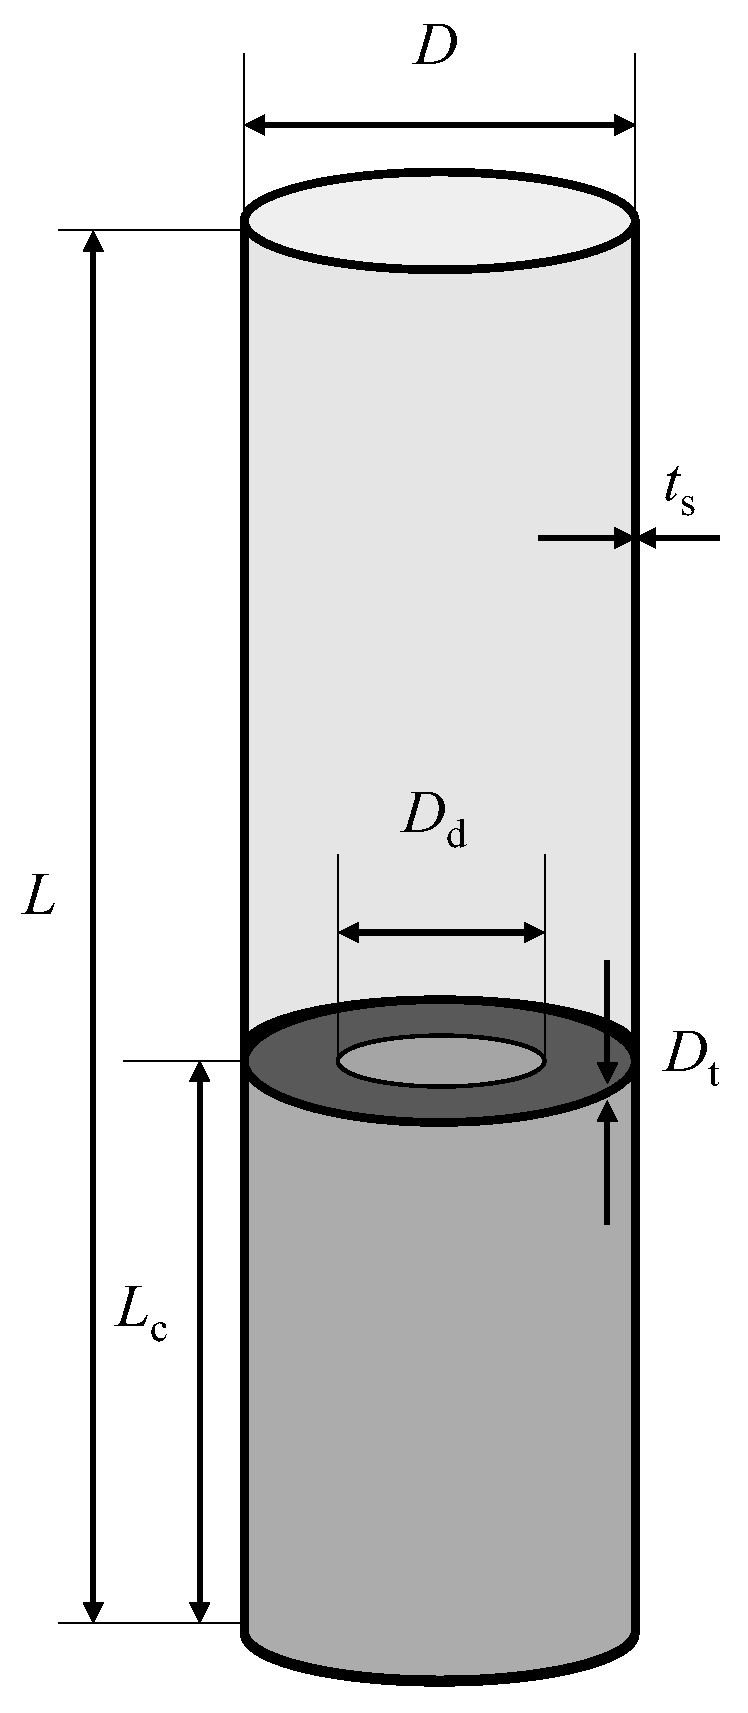
2.1. Outline of Numerical Model

A summary of the numerical model is shown in Figure 1 and Table 1. The basic specifications of the steel tube were determined by referring to previous numerical studies by other authors [12], and the diameter D , thickness t s , and height L were 900 mm, 9.3 mm, and 3850 mm, respectively. The dimensionless parameters related to the seismic performance of the steel tube, the radius thickness ratio parameter R t and the slenderness ratio parameter λ t , are expressed by the following equations [16] and set to 0.12 and 0.3, respectively:
R t = 3 ( 1 μ s 2 ) σ y E s D 2 t
λ t = K L r 1 π σ y E s
where μ s , σ y , E s , A s , t , and r are the Poisson’s ratio, yield stress, yielding stress of the steel, modulus of elasticity, cross-sectional area, thickness of the steel stube, and sectional secondary radius of the steel tube, respectively, and K is the effective buckling length coefficient of the steel tube ( K = 2.0). These parameter settings are within the limits of specifications for highway bridges in Japan.
In this study, a total of 84 cases were parametrically analyzed by varying the axial force ratio, diaphragm thickness, and opening ratio. Although the literature [16] stipulates that yielding should not be allowed in the unfilled portion of PCFSTs, the height of the concrete filling was set to 40% of the steel tube height L in all models, as it was positioned as a basic study of PCFSTs focusing on the diaphragm, as described in Section 1. The axial compressive force N acting on the top of the steel tube was set so that the axial force ratio n to the total cross-sectional yield axial force N y = σ y A s of the steel pipe cross-section, excluding the concrete filling, was 0%, 10%, 20%, and 30%, considering the actual design level. The diaphragms were welded directly on top of the concrete filling, and the opening ratio of the diaphragms was examined for 7 patterns ranging from 20% to 100% (without a diaphragm). The diaphragm opening ratio is the size of the diaphragm opening D d divided by the diameter of the steel tube D . The thicknesses of the diaphragms were set to 6 mm and 12 mm, referring to previous studies [13,14,18] in which the diaphragm thickness was ranged from 67% to 120% of the thickness of the steel tube. A thinner thickness of 4 mm was also used for comparison and verification.

2.2. Elemental Partition

MSC’s commercial FEM software (Marc2020) was used for the FE analysis. The mesh of the numerical model was discretized with three types of elements, as shown in Figure 2. Four-node shell elements were applied to the steel tube and diaphragms, and hexahedral solid elements were applied to the concrete filling. Above 90% of the column height, the number of elements was reduced by using two-node beam elements after confirming that the stresses do not exceed the elastic limit. The steel tube was divided into 90 sections in the circumferential direction of the steel tube. Elements were divided every 0.5% of the steel tube’s height in the height direction for up to 60% of the column, and there were 15 divisions from 60% to 90% of the height. The diaphragm was divided into 90 circumferential sections, as in the steel tube. For modeling, an initial gap of 0.5 mm between the steel tube and diaphragm elements and the concrete elements was given, as carried out in reference [9], to account for the drying shrinkage of the concrete filling inside the tubes.

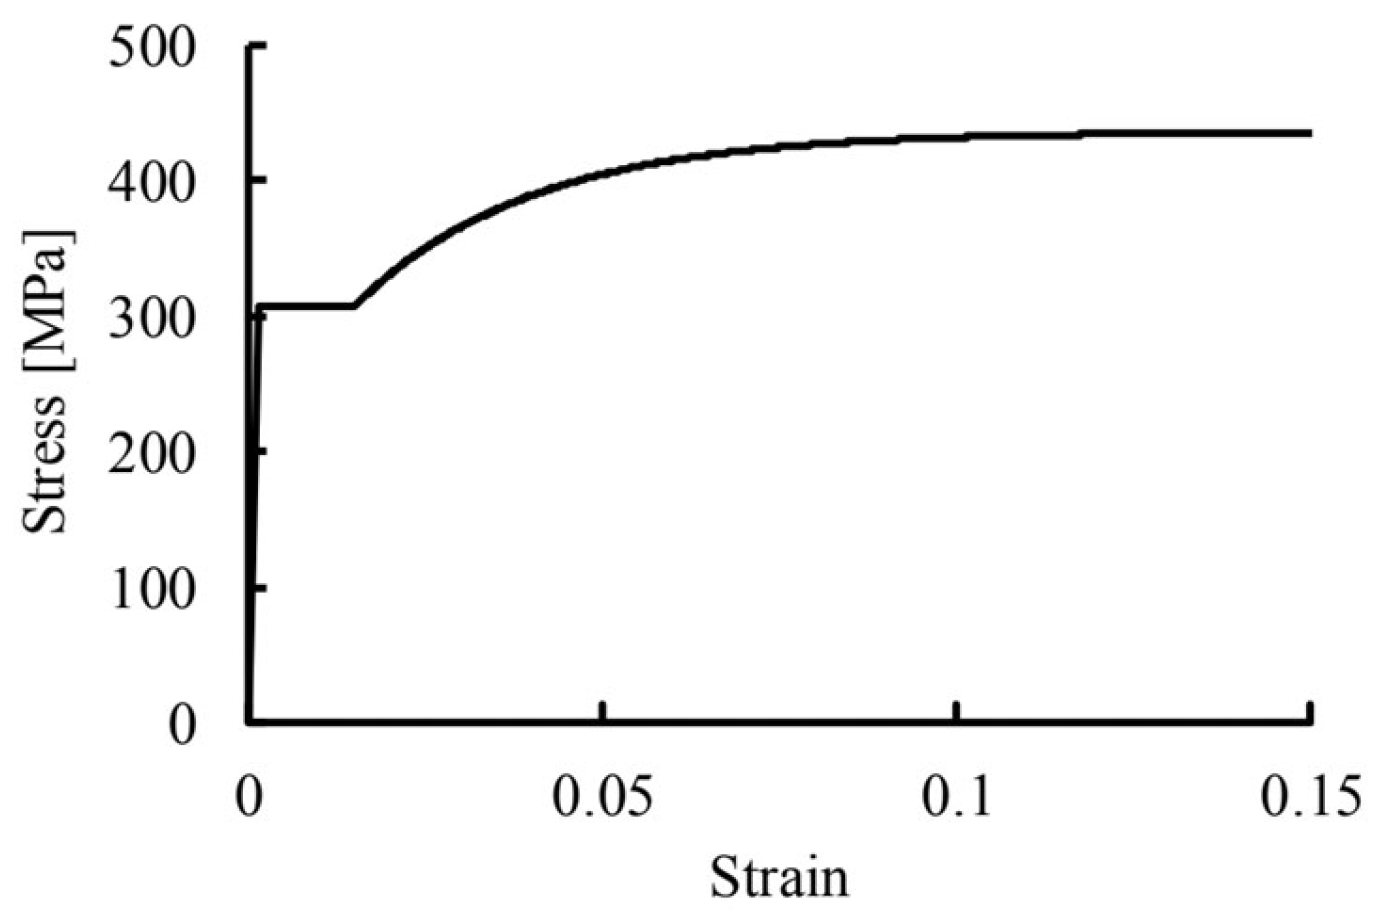
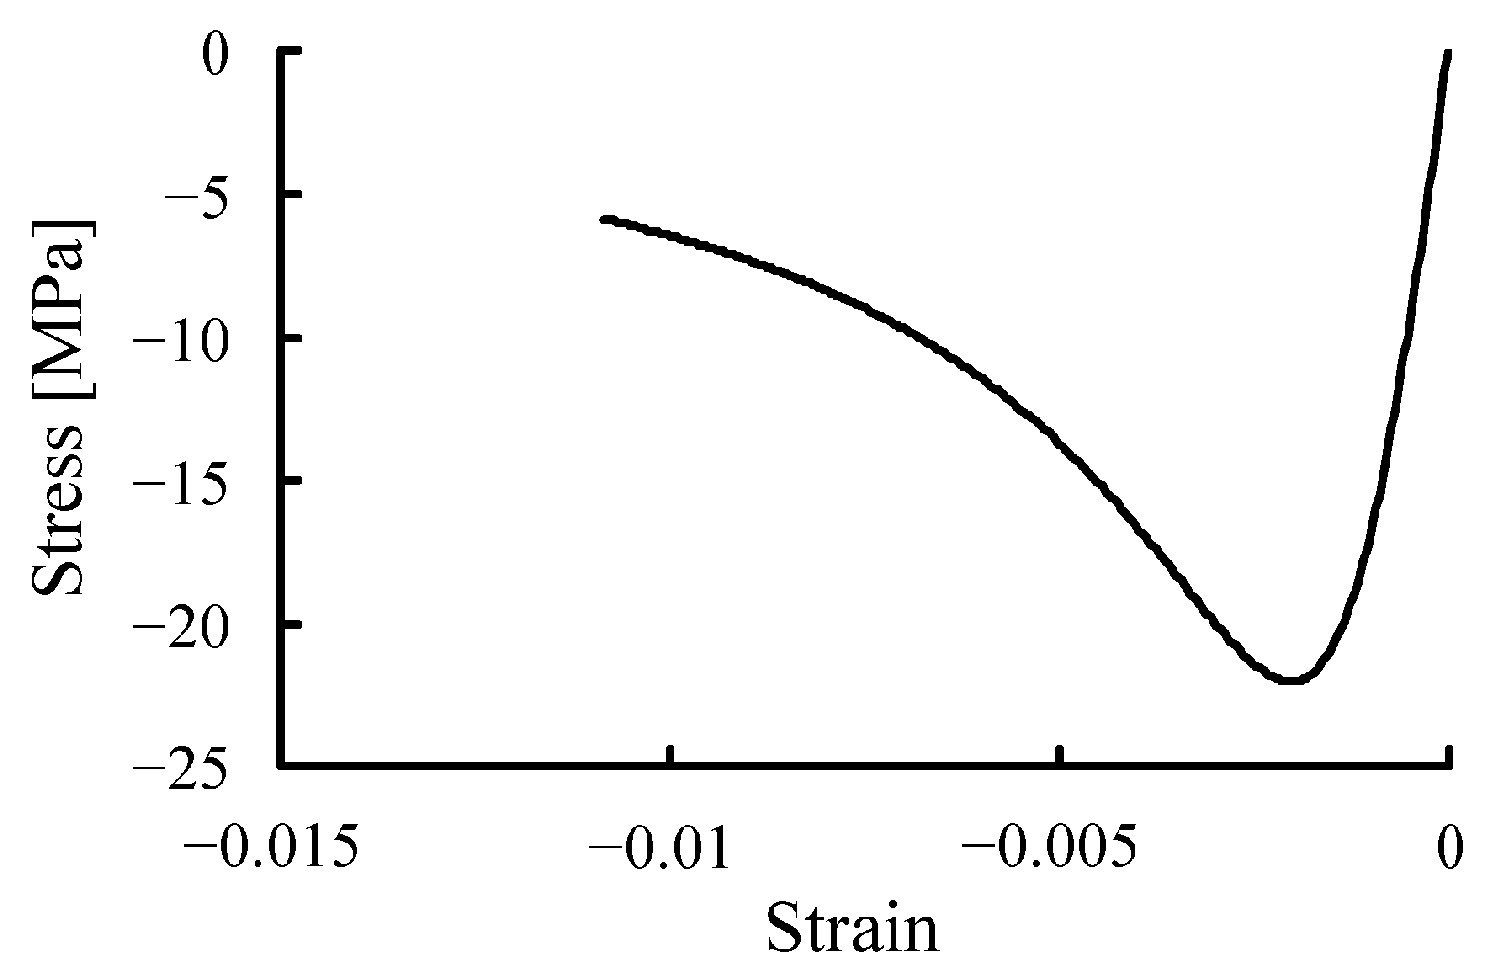
2.3. Material Properties

SS400 steel was used for the steel tubes and diaphragms, and the modulus of elasticity E s , Poisson’s ratio μ s , and yield stress σ y were assumed to be 206.0 GPa, 0.3, and 308.0 MPa, respectively. These properties were obtained from static cyclic loading tests on steel columns [17]. In addition, the stress–strain relationship shown in Figure 3 is of the curvilinear type with a yield shelf, as recommended in reference [6]. The yield condition of the steel tube was the von Mises yield condition, and the isotropic hardening law was applied. The concrete filling was assumed to be ordinary concrete with a uniaxial compressive strength of 22.0 MPa [19], and the modulus of elasticity and Poisson’s ratio of the concrete were determined based on ACI Committee 318 [20]: E c = 4730, f c = 210 GPa, and μ c = 0.2. In this study, the following Drucker–Prager rule was applied to define the modulus of elasticity of concrete:
f c = α I 1 + J 2
where I 1 is the first invariant of the stress tensor, J 2 is the second invariant of the deviatoric stress tensor, and α is the material constant on which the hydrostatic stress depends ( α = 0.2 based on Balmer’s experimental results [21]). The stress–strain relationship proposed by Popovics, shown in Figure 4, was used as the compressive stress–strain relationship [22]. Concrete cracking caused by tensile stress was treated as a contact problem between the concrete filling and the rigid surface of the base, assuming that the steel tube base, where the largest bending moment acts, is the location where concrete cracking occurs, as determined by Ngo et al. [23].

2.4. Boundary Conditions

The boundary conditions of the numerical model are shown in Figure 5. The base of the column was assumed to be completely fixed, and the head of the column was subjected to an axial compressive force N and horizontal displacement δ , representing the mass of the superstructure. In the FE analysis, the pushover analysis was conducted by loading the axial compressive force N firstly, and then applying the horizontal displacement δ . The horizontal yield displacement δ y applied to the column head is calculated by the yield load H y of the steel tube and is expressed as follows:
δ y = H y 3 E s I L 3
H y = σ y N A s I L y
where y is the distance from the center of the steel tube to the outside. In this study, as the axial force ratio changed to 0%, 10%, 20%, and 30%, the yield displacement δ y was 16.4 mm, 14.8 mm, 13.2 mm, and 11.5 mm, respectively.

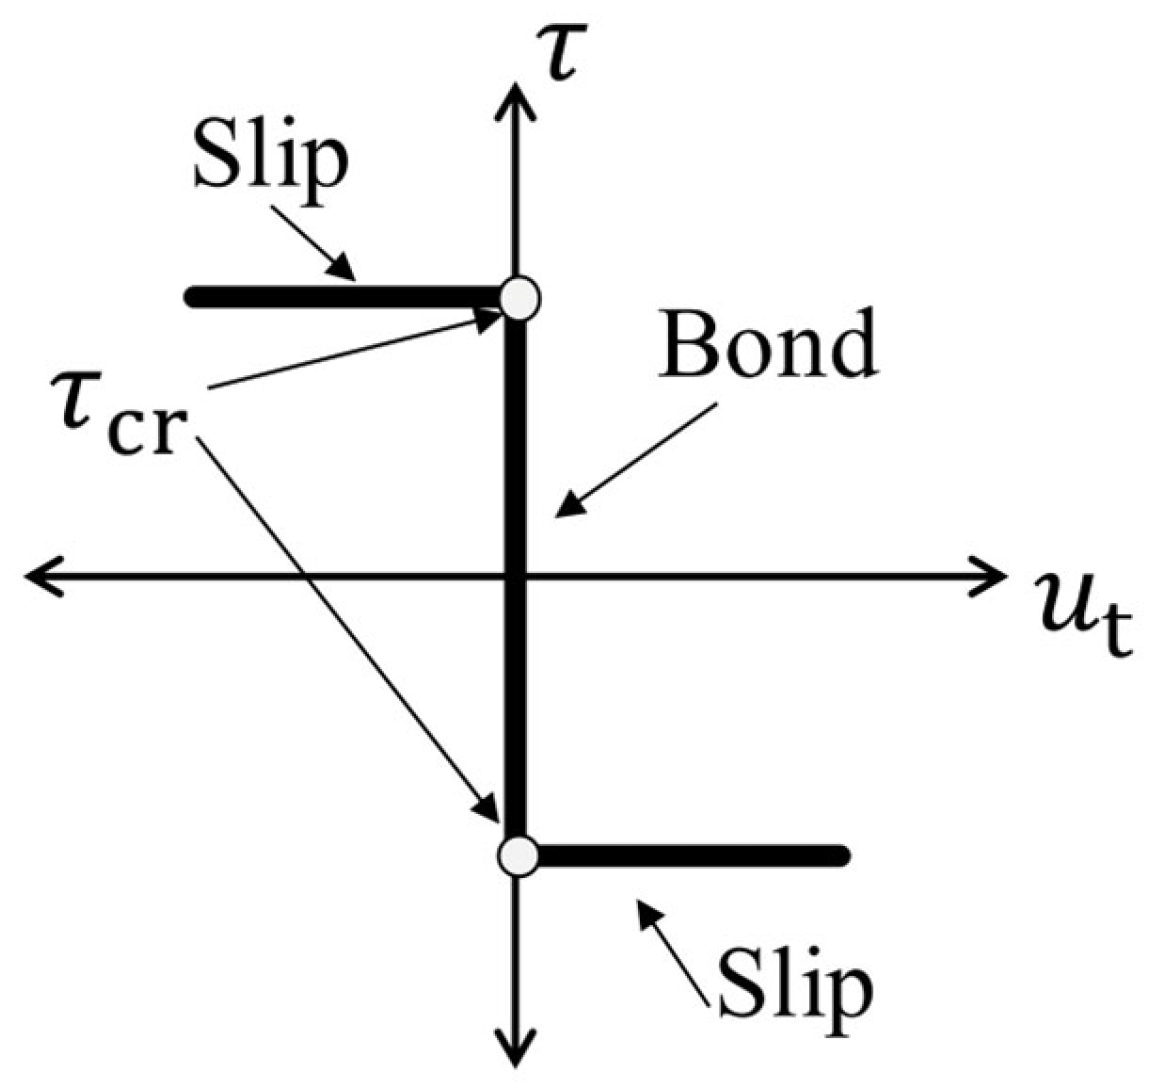
2.5. Contact Conditions

When concrete-filled steel tube columns are subjected to horizontal forces, contact, delamination, and friction occur between the steel tube and the concrete filling. In this study, the extended Lagrange multiplier method was used for these contact problems. The Coulomb friction model shown in Figure 6 was used for frictional behavior. The vertical axis in the figure indicates the shear stress τ and the horizontal axis u t indicates the relative displacement between the steel tube and concrete. In the Coulomb friction model, the shear stress is bonded to the interface until the maximum static frictional stress τ cr is reached, at which point the interface begins to slip. The maximum static friction force τ cr at is given by
τ cr = μ p
where μ is the coefficient of friction and p is the normal stress. A coefficient of friction of μ sc = 0.2 was used for the friction between the steel tube and concrete and between the diaphragm and concrete, based on the work of Johansson et al. [24], and a coefficient of friction of μ cc = 0.5 was used between the concrete filling and the base. The numerical method used in this study is based on the literature [15]. Here, the accuracy verification was performed up to a horizontal displacement of approximately 120 mm for the historical curves obtained in experiment [17] under cyclic loading.

3. Numerical Results

To show the typical behavior of a PCFST, we first focus on the numerical results for a diaphragm thickness of 6 mm and a 50% opening ratio.

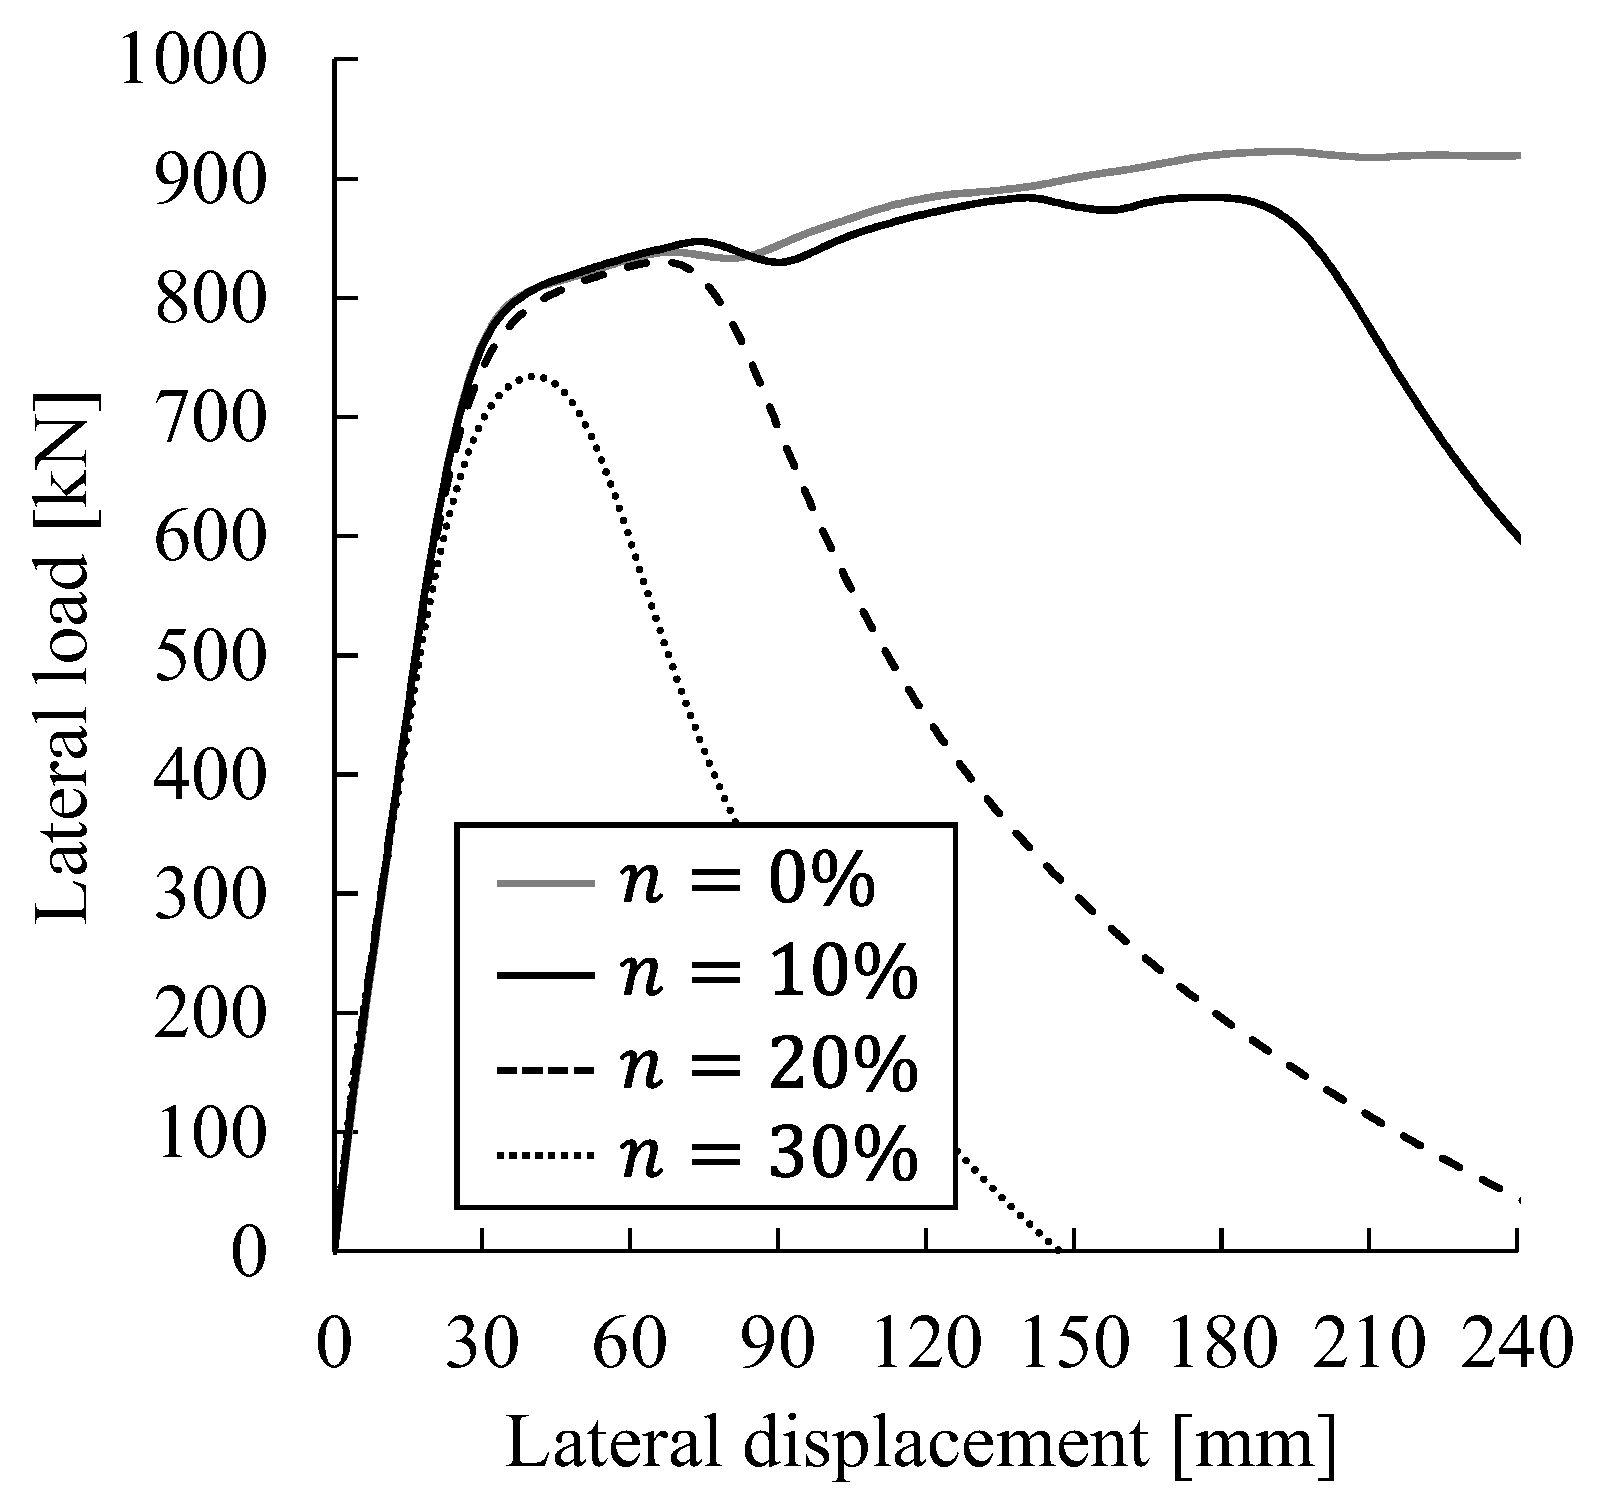
3.1. Relationship Between Horizontal Load and Horizontal Displacement

Figure 7 shows load–displacement curves for each axial force ratio n . The vertical and horizontal axes represent the horizontal load and horizontal displacement of the steel tube head, respectively. The model follows the same path regardless of the axial force ratio up to around 600 kN, but the model with an axial force ratio of 30% loses strength after showing a horizontal load capacity of approximately 744 kN. Local buckling occurs just above the concrete filling. As shown in Section 3.2, the models differ in terms of the location of out-of-plane deformation, but the loss of bearing capacity in the load–displacement curves indicates that out-of-plane deformation developed just above the concrete filling, leading to local buckling.
Figure 8 shows the horizontal displacements from 1 δ y to 10 δ y , focusing on the length from the base of the steel tube, which is on the compression side in the loading direction, up to a height of 2000 mm. The gray line in the figure indicates the location of the diaphragm in the steel tube. In Figure 8a, where the axial force ratio is 0%, the out-of-plane deformation at the base of the steel tube is larger than that directly above the concrete filling. As the axial force ratio increases to 10%, 20%, and 30%, the out-of-plane deformation at the base of the steel tube becomes smaller and that directly above the concrete filling becomes larger. In Figure 8c with an axial force ratio of 20%, the diaphragm oscillates from around 6 δ y , and in Figure 8d with an axial force ratio of 30%, the diaphragm oscillates from around 4 δ y . The horizontal displacement between the installation position of the diaphragm and the base of the steel tube, approximately 1700 mm from the base of the tube, is almost constant. Considering the results in Figure 7, this trend is likely due to local buckling.

3.2. Shape Deformation and Mises Stress Distribution State

Mises stress diagrams for steel tubes at 0%, 10%, 20%, and 30% axial force ratios at 6 δ y yield displacement are shown in Figure 9. The red arrows in the figure indicate the locations where out-of-plane deformation developed as a result of loading. The figure shows that out-of-plane deformation occurs at the base of the steel tube when the axial force ratio is 0%, directly above the base of the steel tube and concrete filling when the axial force ratio is 10% or 20%, and directly above the concrete filling when the axial force ratio is 30%, and that these developments affect the trend of the load–displacement curve.
Figure 10, Figure 11, Figure 12 and Figure 13 focus on Mises stresses at the diaphragm inside the PCFST and at the top of the concrete filling from the conditions shown in Figure 9. The black arrows in the figures indicate the loading direction, and the black solid and dashed lines indicate the position corresponding to the width of the diaphragm at 50% and 80% opening ratios, respectively. When the axial force ratio was 20%, high stresses also occurred in the center of the diaphragm, but in general the stresses were greater at the periphery than at the 80% opening ratio indicated by the dashed line. The same was true for the concrete filling, which tended to exhibit less stress in the center and greater stress closer to the periphery.

4. Discussion Focusing on the Diaphragm

Here, results presented in Section 3 are used to discuss the effects of the thickness and opening ratio of the diaphragm on the local buckling and horizontal load capacity of the PCFST.

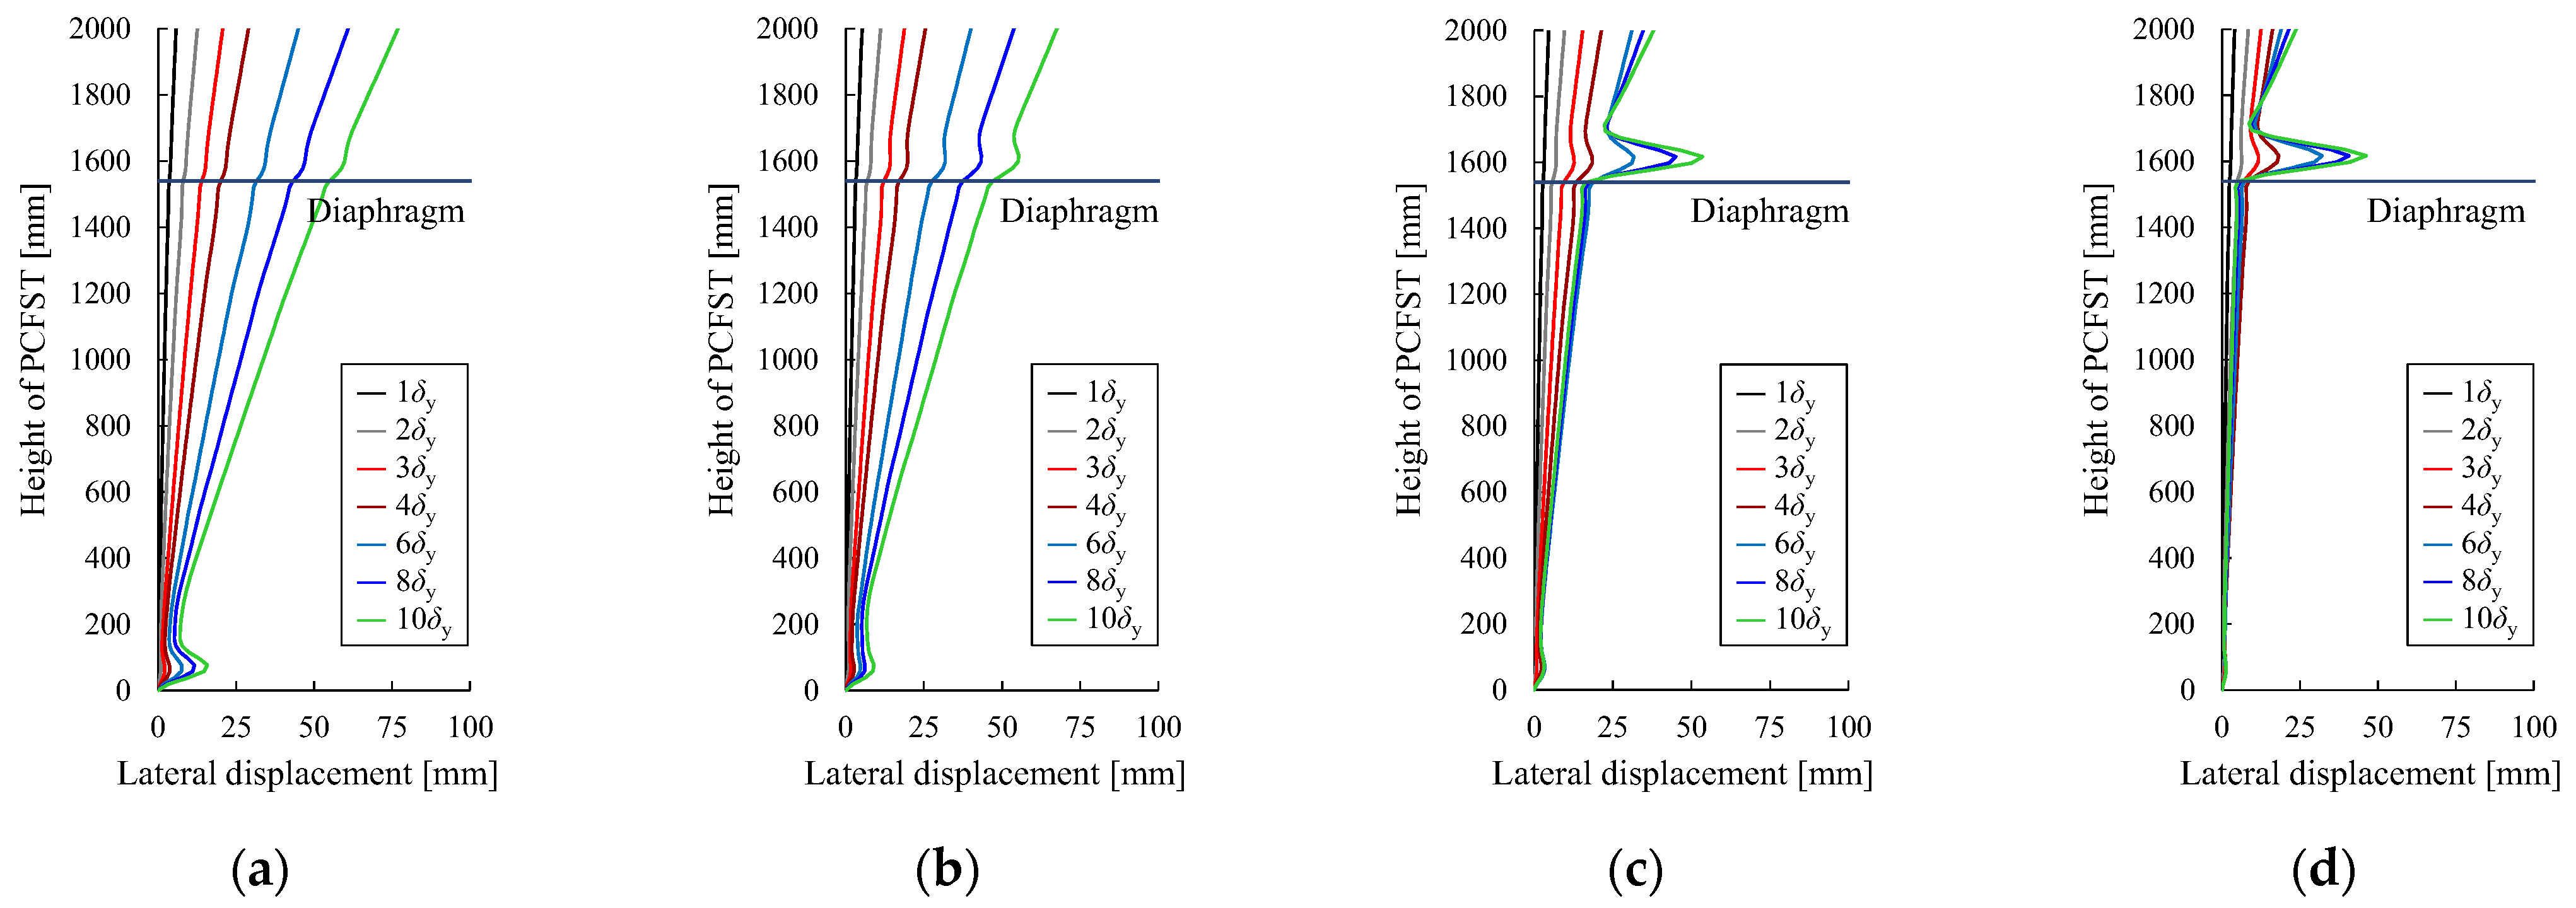
4.1. Location of Local Buckling

4.1.1. Primary Cases

Figure 14 shows the horizontal displacement on the compression side of a steel tube with a diaphragm thickness of 6 mm when subjected to an axial force ratio of 10%. The coordinate axes and legend in the figure are the same as in Figure 8.
In Figure 14a,d, the out-of-plane deformation at the base of the steel tube is greater than that directly above the concrete. In contrast, in Figure 14b, the out-of-plane deformation at the base of the steel tube and directly above the concrete is almost the same, while in Figure 14c, the out-of-plane deformation directly above the concrete is larger than that at the base of the steel tube, with different trends emerging depending on the opening ratio of the diaphragm. From this, it can be inferred that the location of local buckling may vary depending on the diaphragm opening ratio.

4.1.2. All Cases

Table 2 summarizes the buckling positions of the PCFSTs obtained from the parametric analysis. The buckling that occurred at the base of the steel tube is colored black, the buckling that occurred at two locations directly above the concrete filling is colored white, and the buckling that occurred at two locations, one at the base of the steel tube and the other directly above the concrete filling, is colored gray. Here, the timing at which the displacement of the out-of-plane deformation of the steel pipe increased rapidly was defined as the position of local buckling.
The table shows that local buckling occurred at the base of the steel tube in most models when the axial force ratio was 0%, but as the axial force increased, the location of local buckling changed from two locations, one at the base of the steel tube and the other directly above the concrete filling, to only directly above the concrete filling. At an axial force ratio of 30%, most models experienced local buckling just above the concrete filling. Based on the results presented in Section 3.1, it should be noted that if local buckling only occurs directly above the concrete filling, the load capacity may be rapidly lost. The results for different diaphragm opening ratios showed that more local buckling occurred at the base of the steel tube at 20% and 95% opening ratios than at other ratios, while at 80% and 90% opening ratios, local buckling only occurred directly above the concrete filling. In contrast, for the plate thickness, local buckling occurred at the base of the steel tube with a 95% opening ratio and a plate thickness of 4 mm. The local buckling occurred directly above the concrete filling in some cases when the plate was as thick as 12 mm.

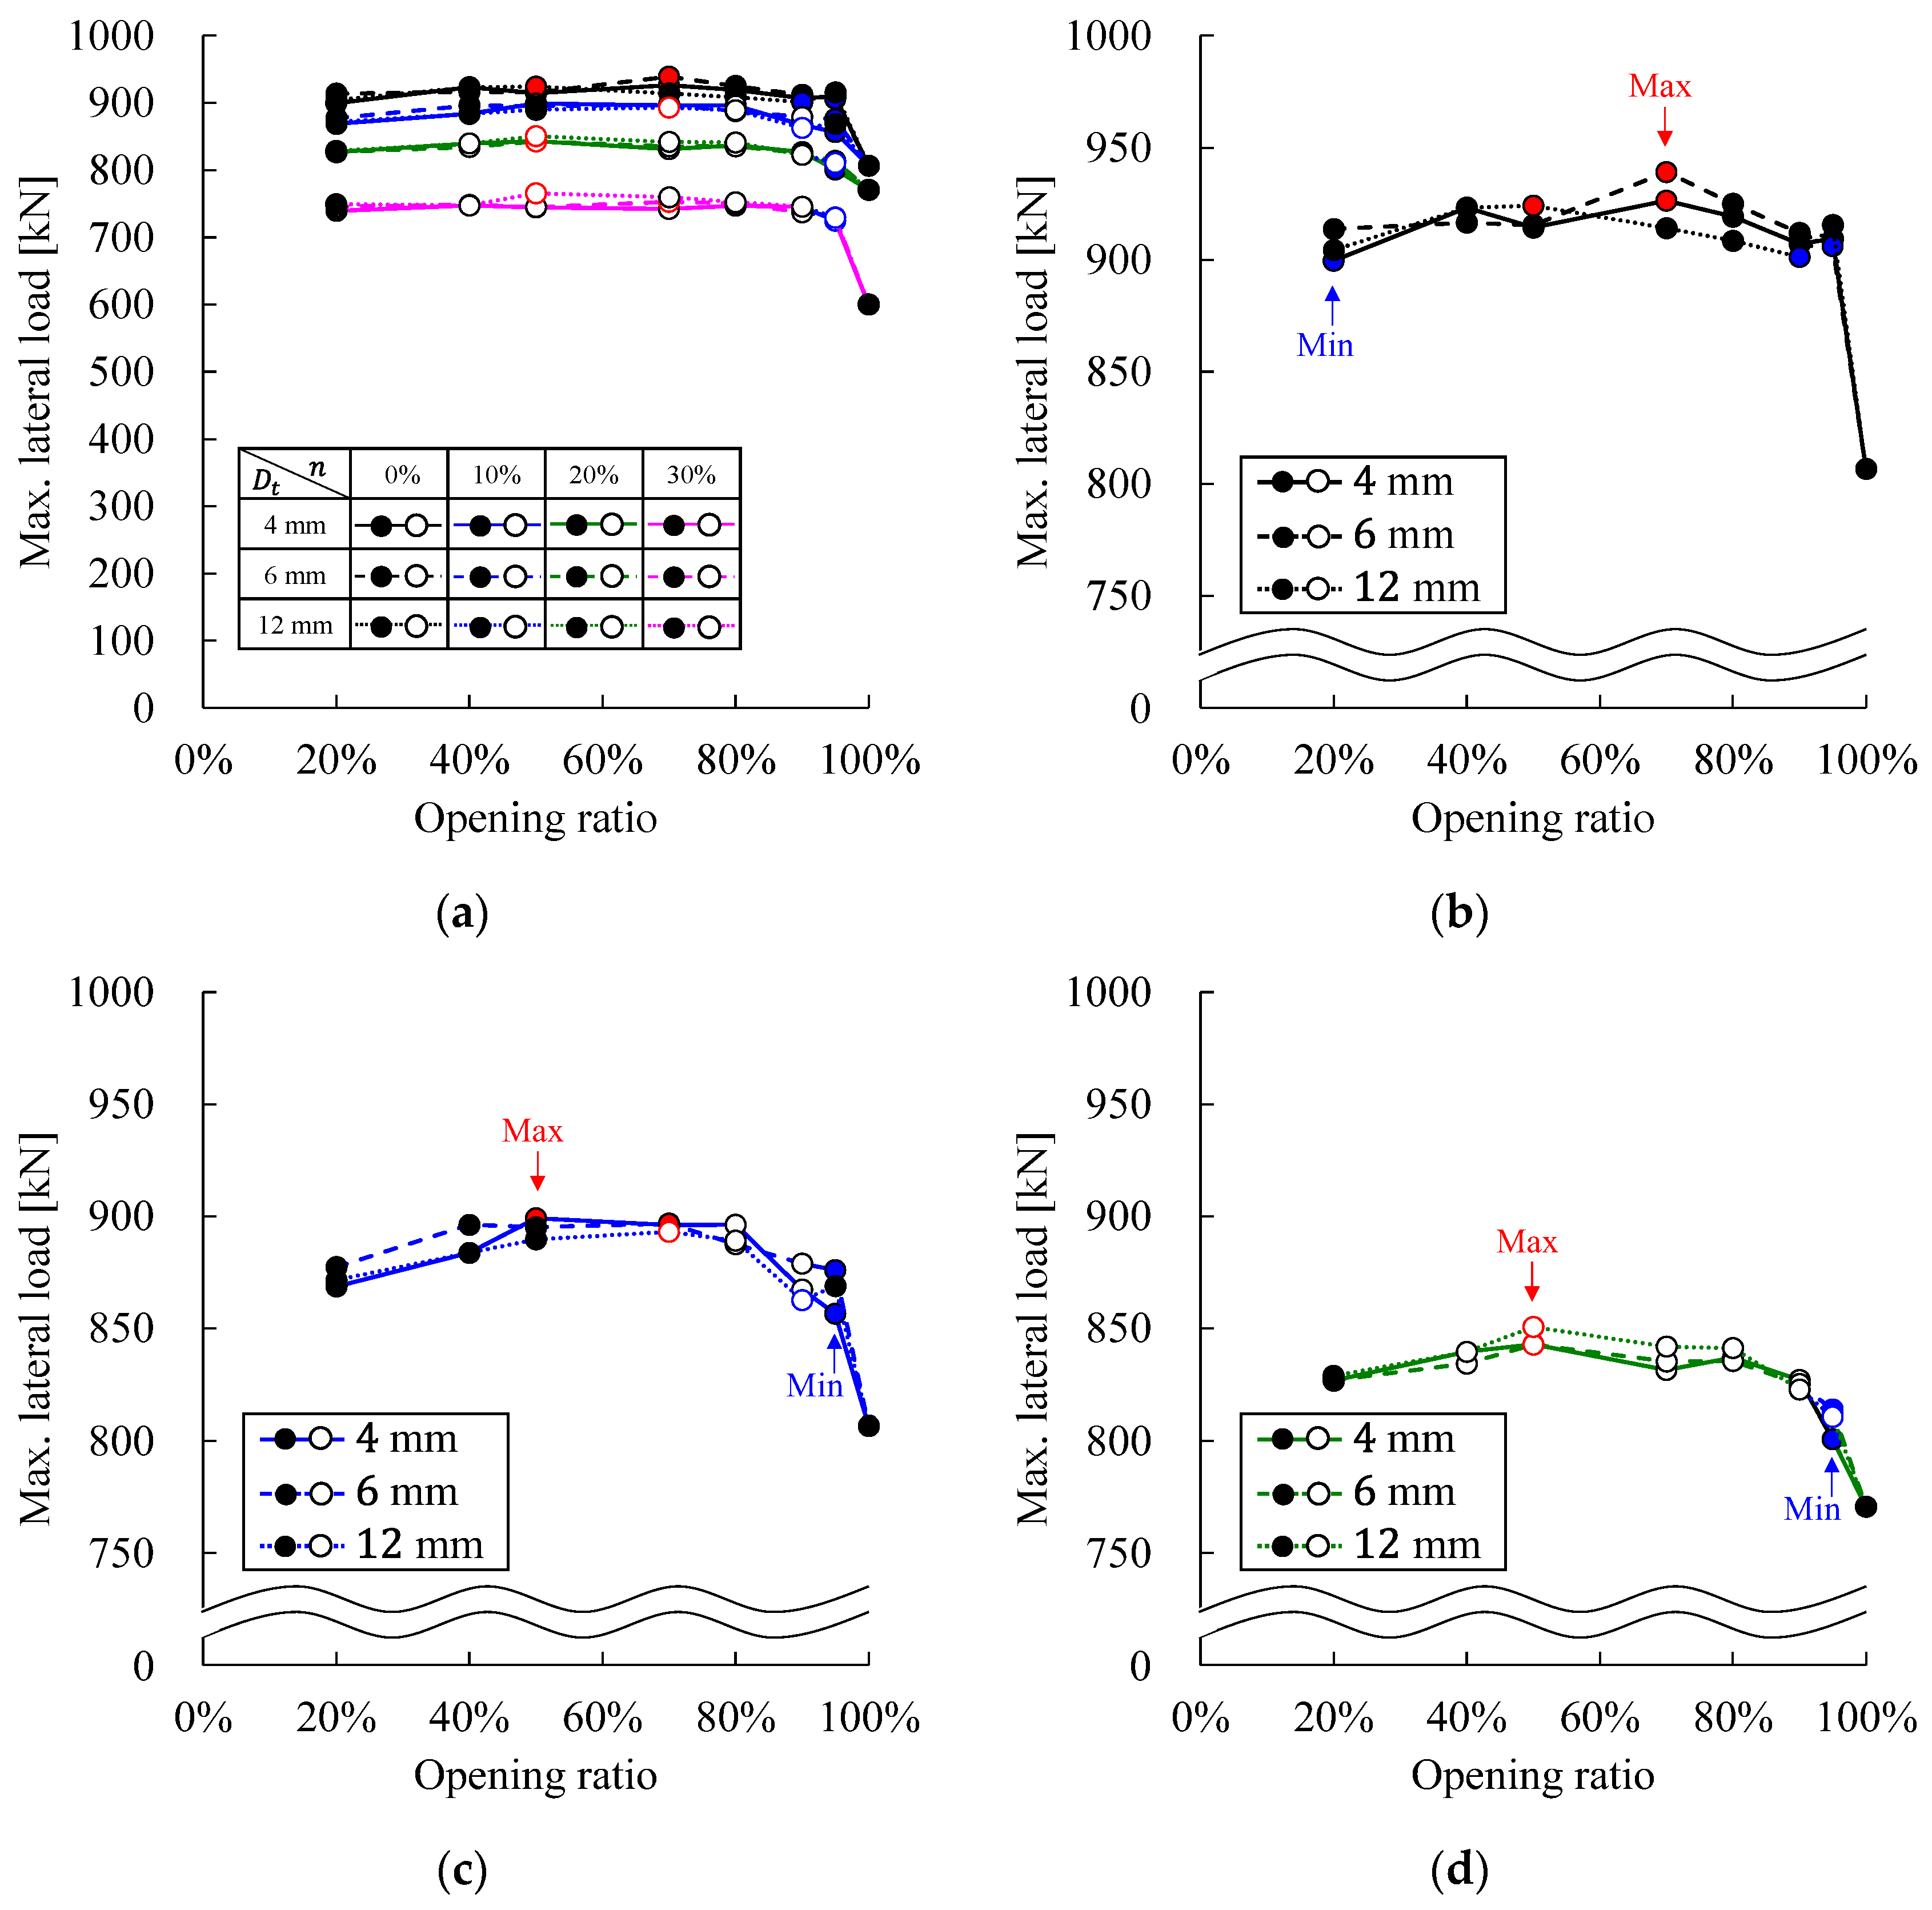
4.2. Horizontal Load Capacity

4.2.1. Primary Cases

Figure 15 shows load–displacement curves for each thickness of diaphragm. The vertical and horizontal axes represent the horizontal load and horizontal displacement of the steel tube head, respectively.
The model follows the same path regardless of the thickness of the diaphragm up to around 600 kN. There was no significant difference in the curve trend and horizontal load capacity for each thickness of diaphragm, even after the yield displacement, and only the timing of load drop due to local buckling that occurred directly above the concrete filling varied with the thickness of diaphragm. Such local buckling occurred more quickly in the model with the thicker diaphragm. These results suggest that there was little difference in the confinement effect of the concrete filling by the diaphragm, but the thicker diaphragm caused the concrete filling to act like the base, and thus local buckling was more likely to occur directly above the concrete filling.

4.2.2. All Cases

Figure 16 shows the relationship between the horizontal load capacity and opening ratio for different axial force ratios and diaphragm thicknesses. Figure 16a shows the overall view, and Figure 16b–d show detailed views of the axial force ratios of 0%, 10%, and 20%. The empty circle (○) indicates buckling that only occurred directly above the concrete filling, while the filled circle (●) indicates buckling at the steel tube base and at two locations (the steel tube base and directly above the concrete filling). Furthermore, the red circles () indicate the highest horizontal load capacity at each thickness of the diaphragm for each axial force ratio, and the red arrows () indicate the maximum value, circled in red. The blue circles () in the figure indicate the opening ratio of the diaphragm with the lowest horizontal load capacity at each diaphragm thickness for each axial force ratio (excluding the 100% opening ratio), and the blue arrows () indicate the minimum value, circled in blue.
Figure 16a shows that the horizontal load capacity of the PCFST decreases as the axial force ratio increases. In the case of CFST structures, it is known that the effective cross-sectional area of the concrete filling increases up to 20% of the axial force ratio, resulting in an increase in bending capacity and an increase in horizontal capacity. However, the PCFST structure may be less affected than the CFST structure because the out-of-plane deformation propagates more easily just above the diaphragm due to the lower concrete filling rate. Opening ratios that exhibited the maximum horizontal load capacity varied between 40% and 70% for each plate thicknesses, from 50% to 70% for a 0% axial force ratio, from 50% to 70% for a 10% axial force ratio, from 50% for a 20% axial force ratio, and from 40% to 70% for a 30% axial force ratio. The minimum horizontal load capacity occurred mostly for 90% to 95% opening ratios, except for the 100% opening ratio, where no diaphragm was installed. This is a trend similar to that described in Section 3.2, and it indicates that an extremely large opening ratio does not provide enough contact area to transmit the load sufficiently to the concrete filling. Figure 16b–d show that the maximum horizontal load capacity for each thickness of the diaphragm at each axial force ratio and the minimum value, excluding the opening ratio of 100% (no diaphragm), have errors of 2.5% to 3.5% with respect to the maximum value for an axial force ratio of 0%, 2.3% to 4.7% for an axial force ratio of 10%, and 3.4% to 5.0% for an axial force ratio of 20%. Therefore, the effect of the diaphragm opening ratio on the maximum horizontal load capacity was not as large as that of the plate thickness and was found to be limited to an error of a few percent.

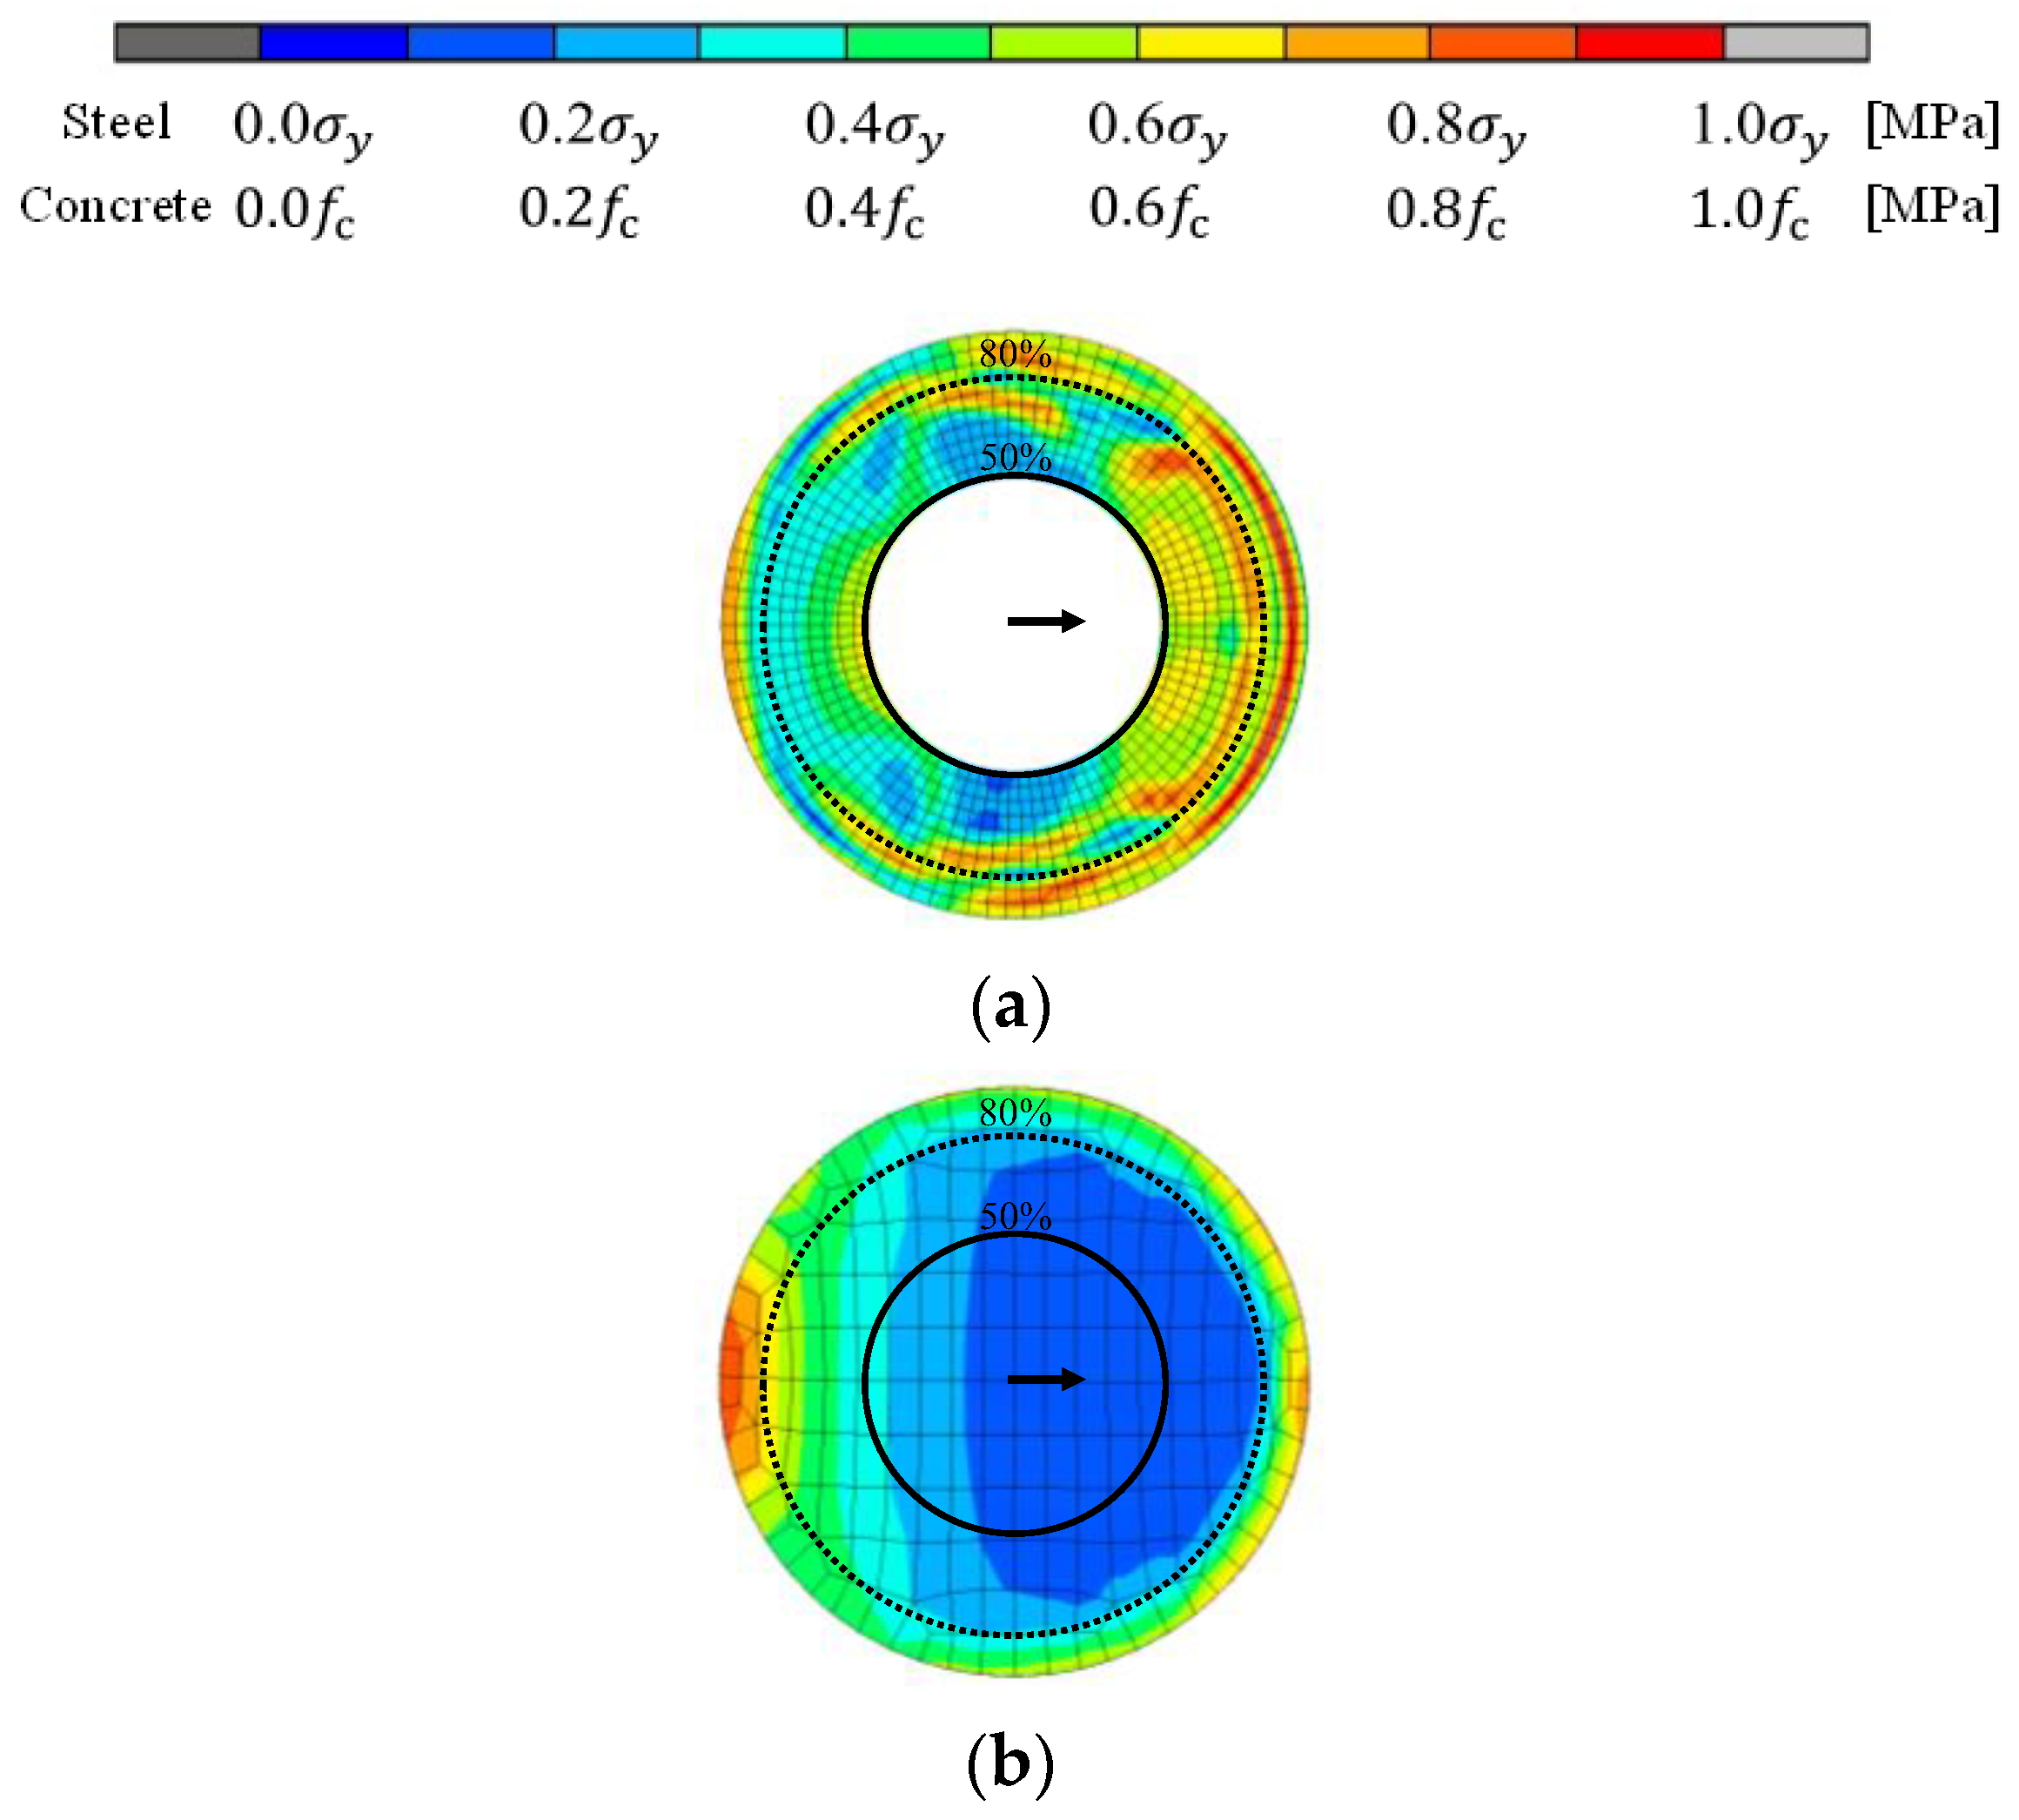
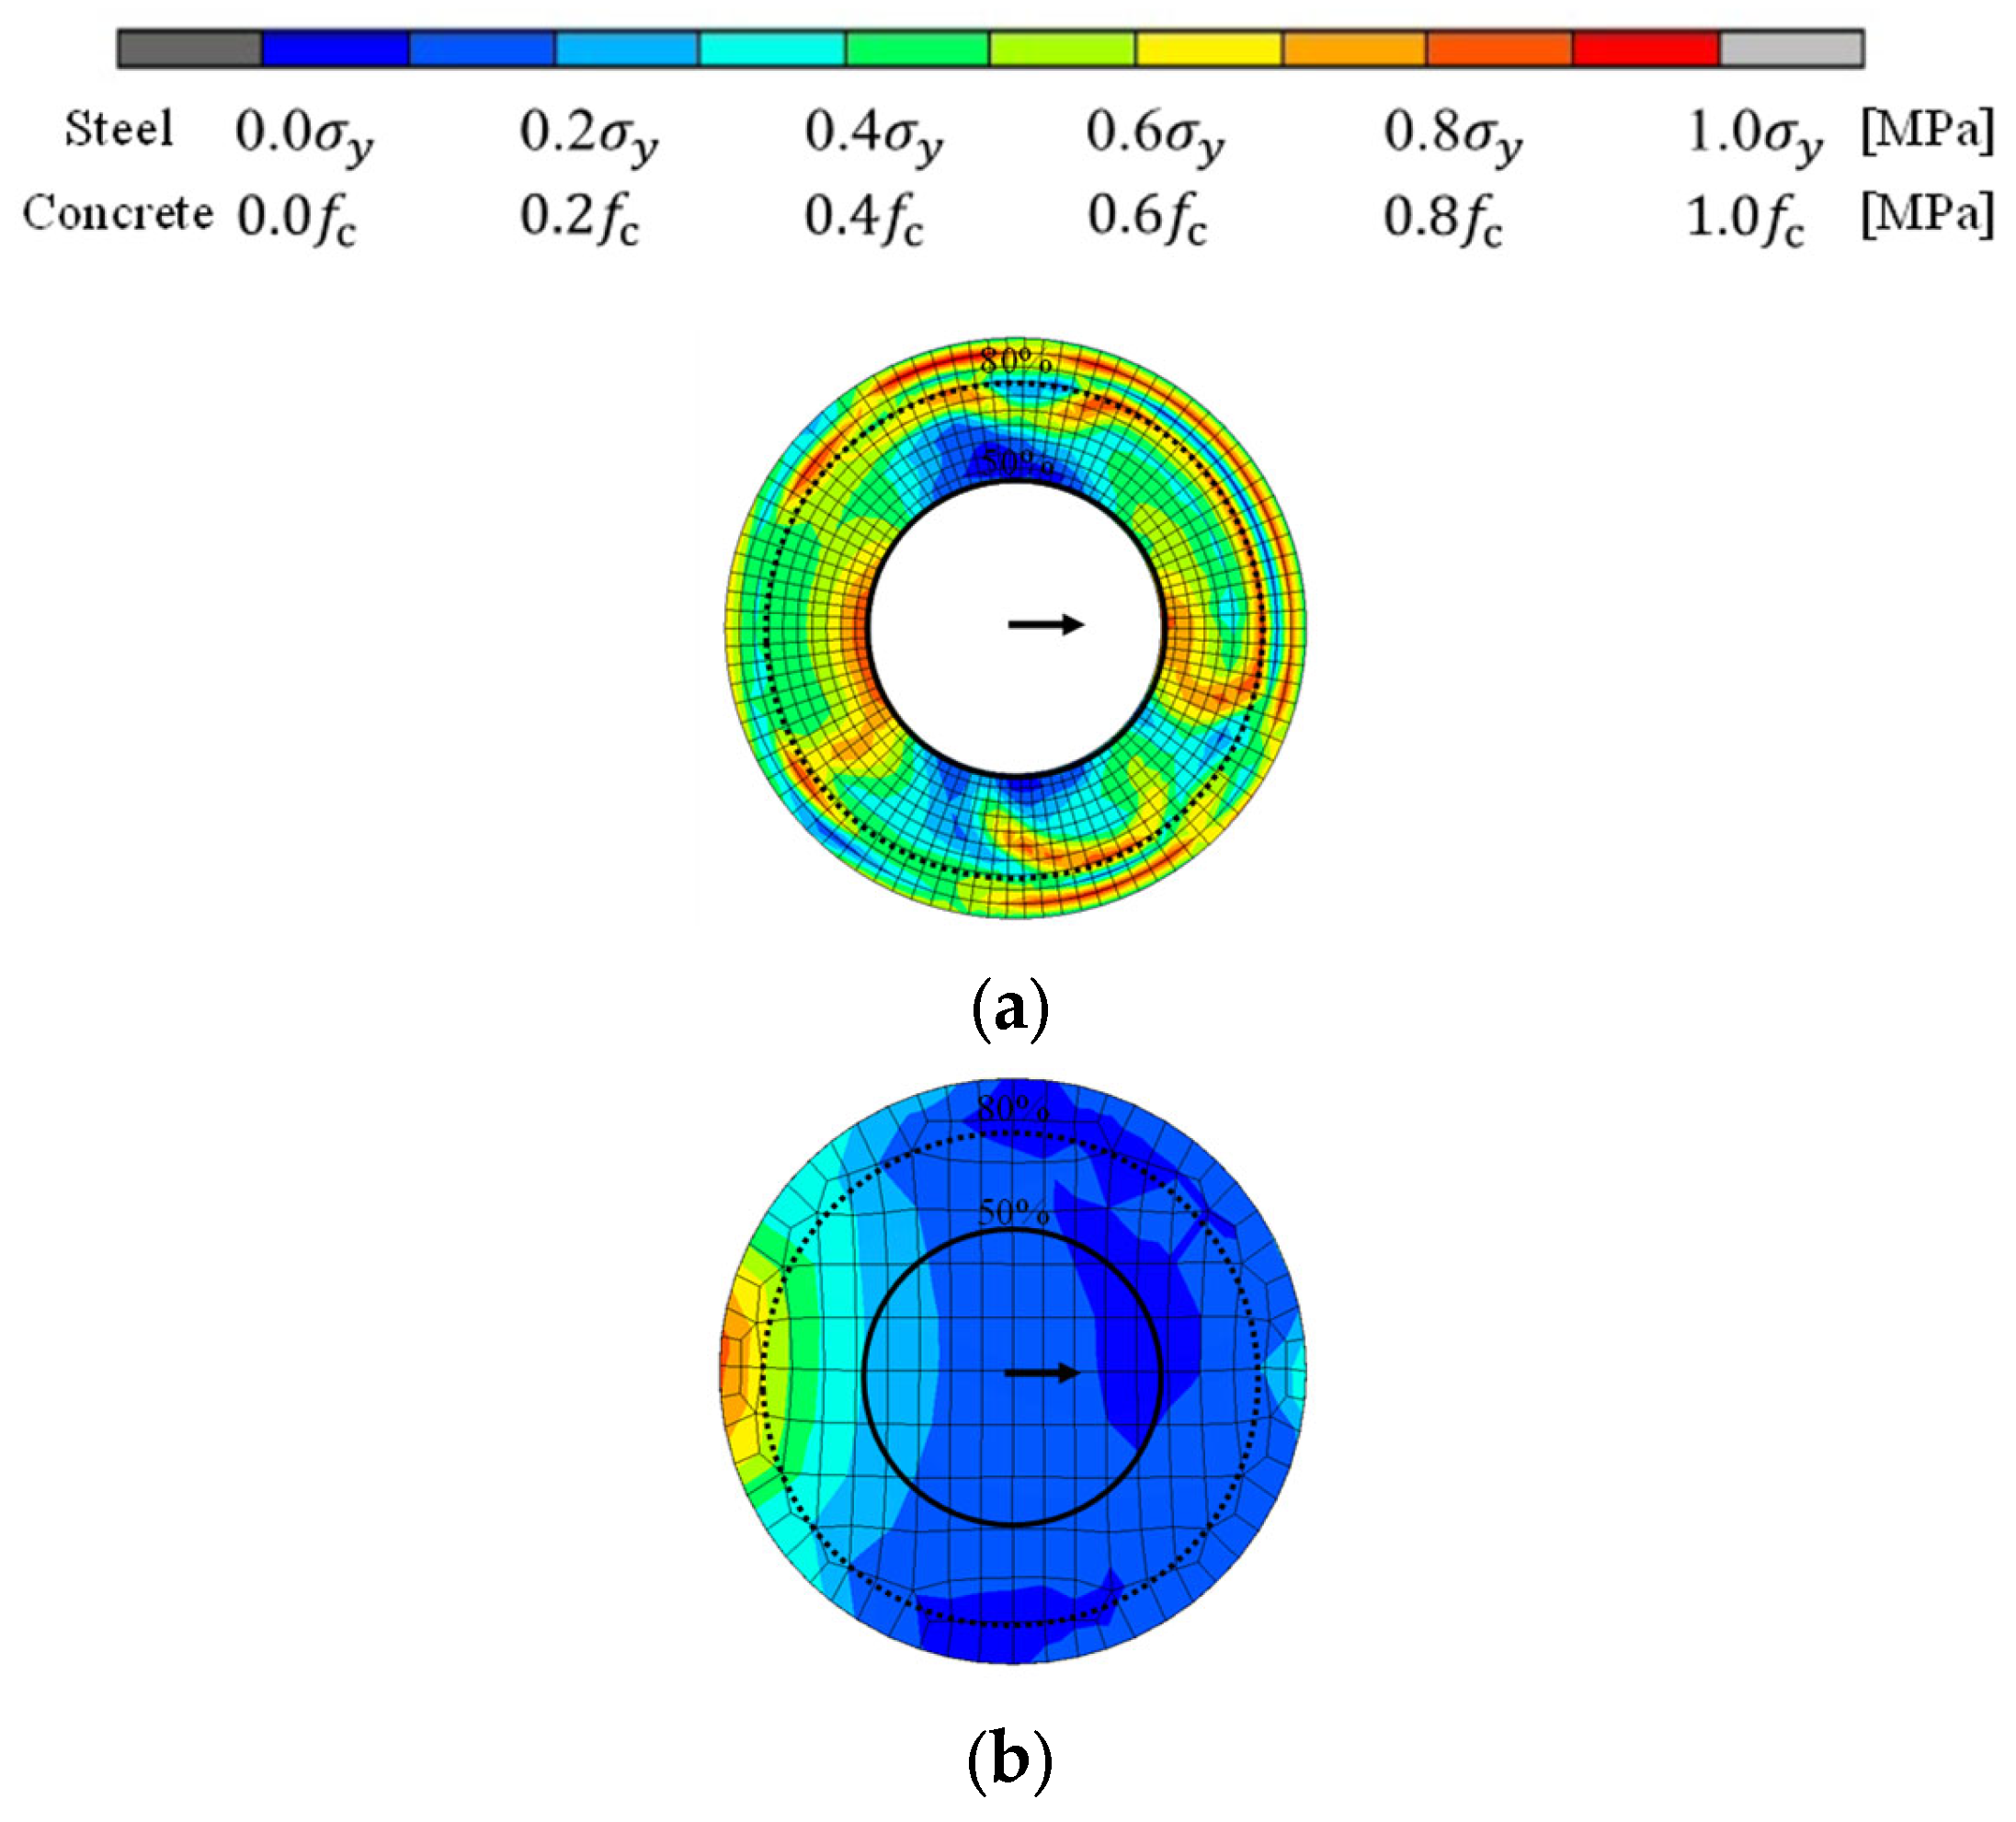
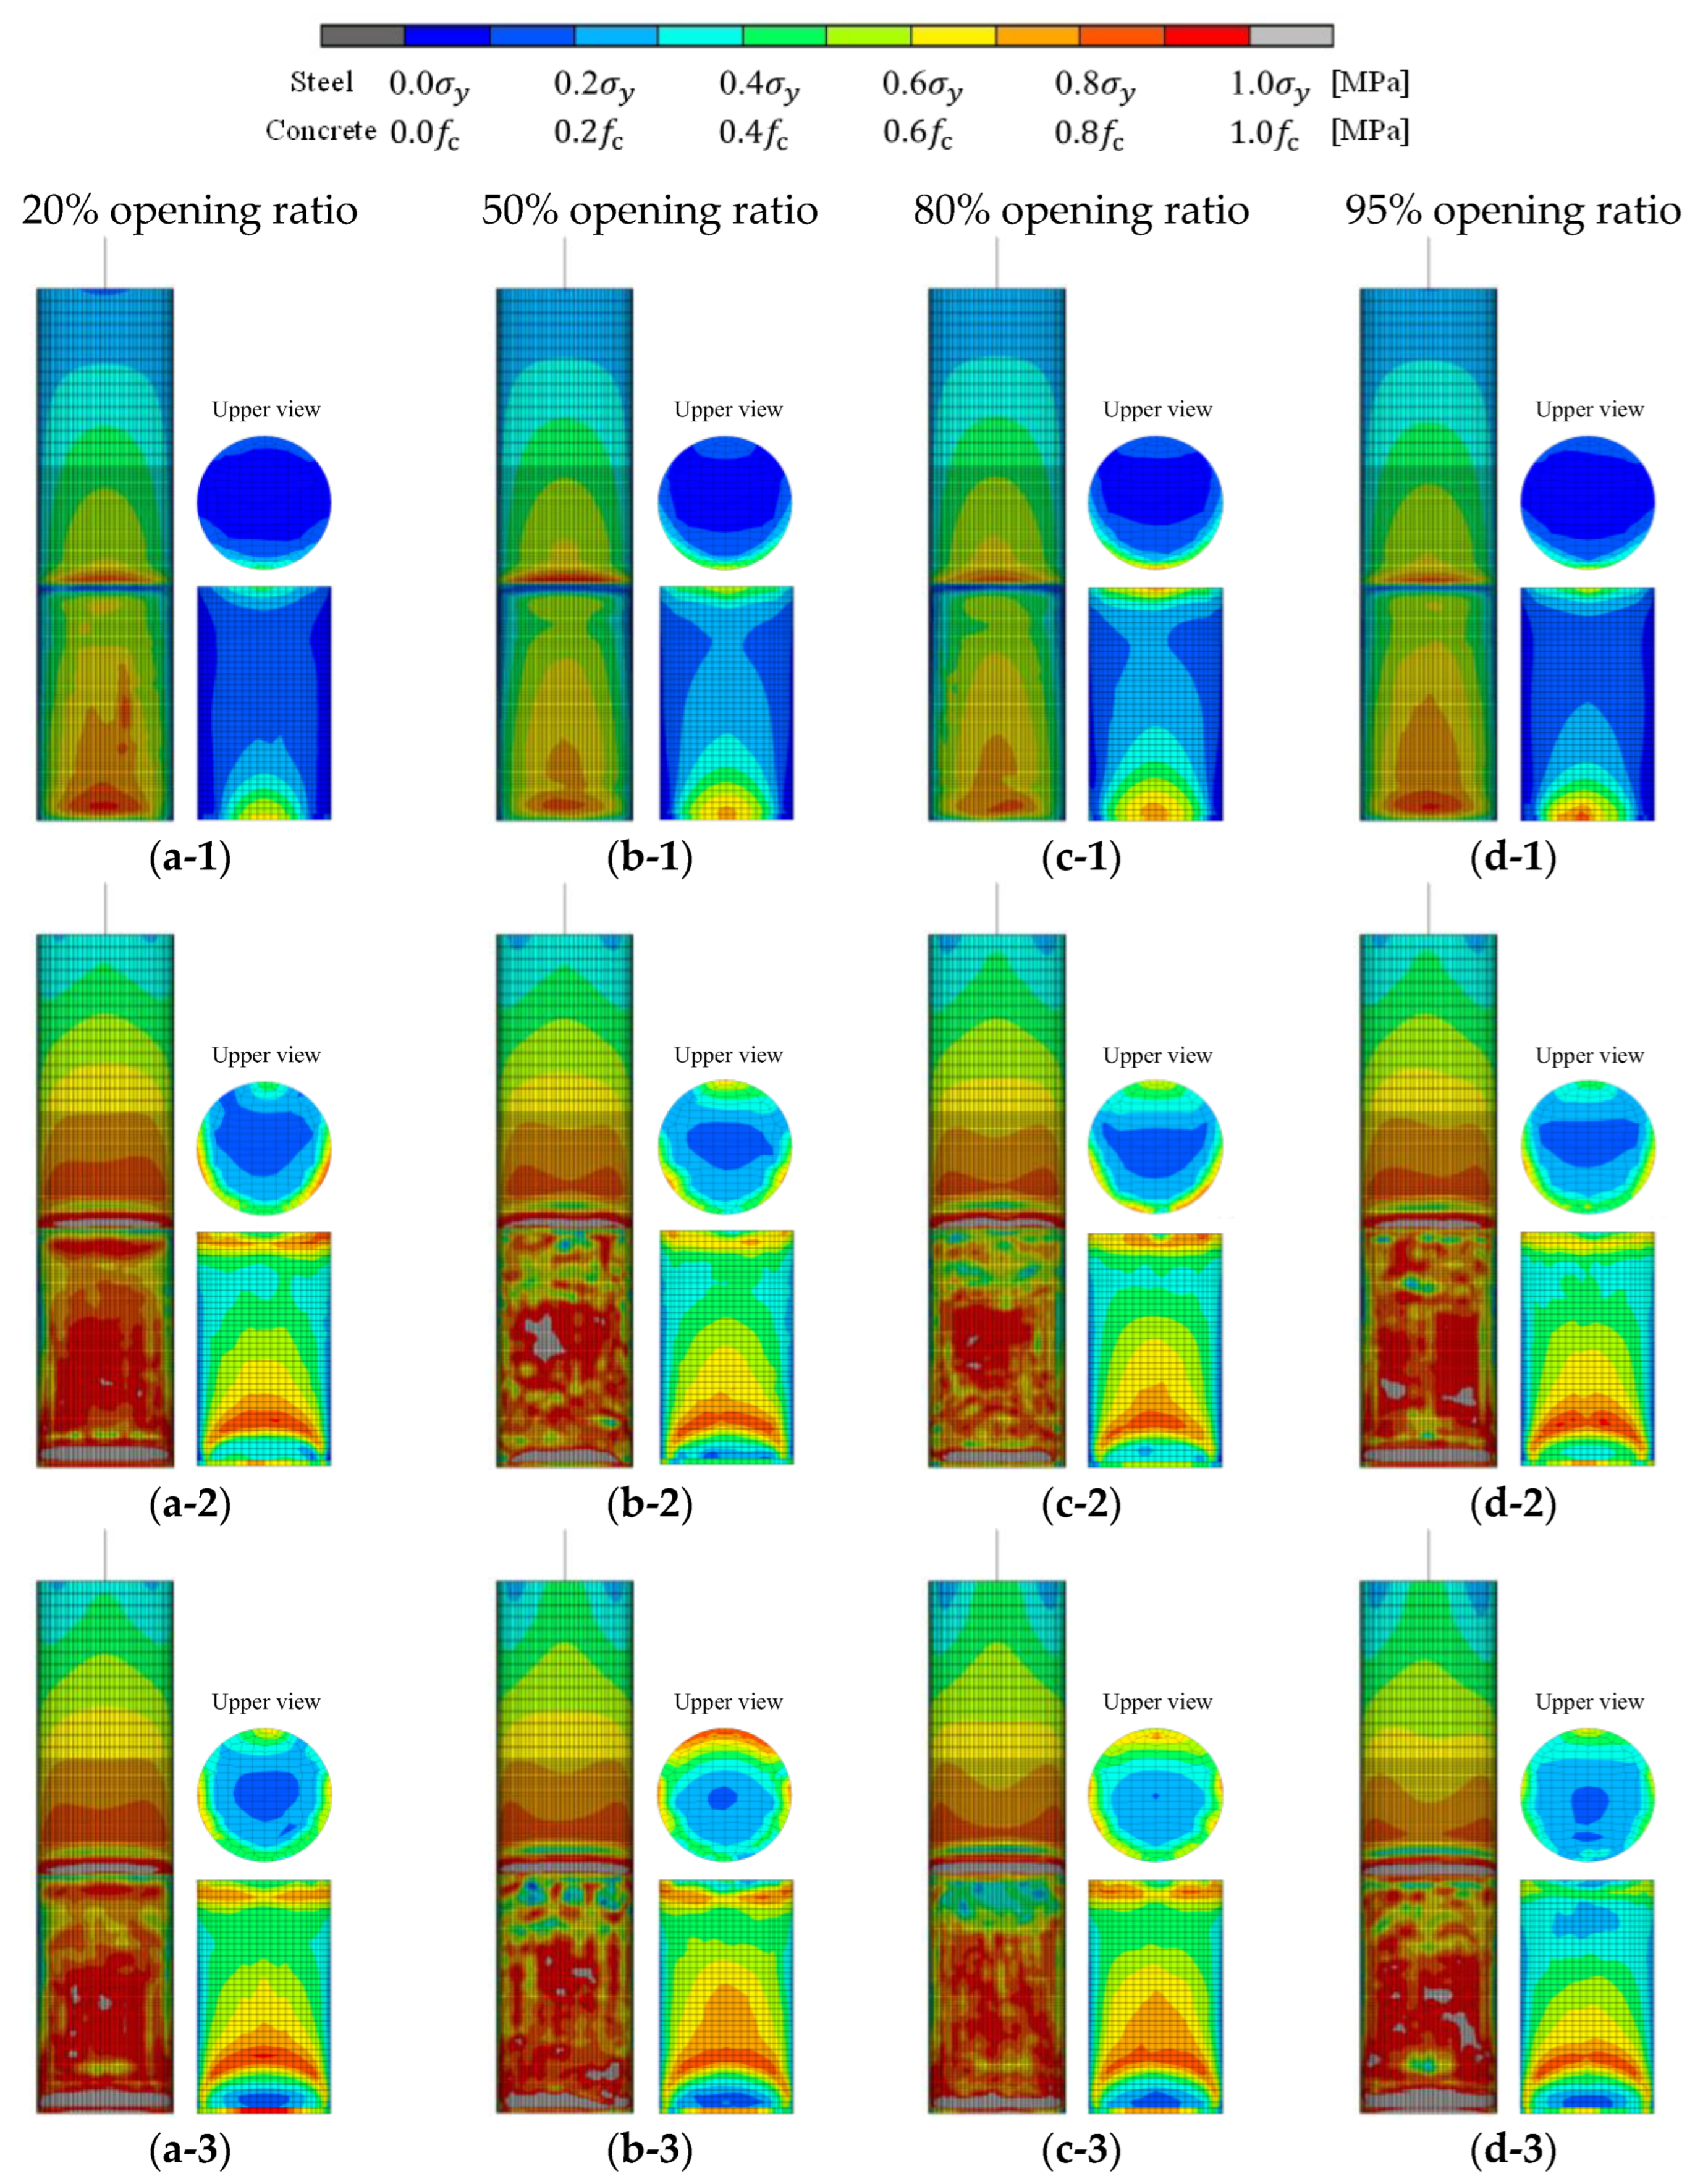
4.3. Mises Stress Distribution Diagram

To explore the effect of the opening ratio of the diaphragm, stress diagrams for PCFSTs with an axial force ratio of 10% and diaphragm thickness of 6 mm at horizontal displacements of 1 δ y , 6 δ y , and 10 δ y are shown in Figure 17. Here, δ y is the yield displacement of the steel tube. The PCFSTs are viewed from the compression side with respect to the loading direction. Top views of the concrete filling are also shown.
For a horizontal displacement of 1 δ y , the range of high Mises stresses at the base of the steel tube decreased and the range of high Mises stresses at the top of the concrete filling increased as the opening ratio increased from 20% to 50% to 80%. In contrast, when the opening ratio was 95%, the distribution of Mises stresses for both the steel tube and concrete filling was closer to that of the 20% opening ratio than to that of the 50% and 80% opening ratios. However, as the horizontal displacement increased to 6 δ y , the Mises stress diagram of the concrete filling showed a similar distribution regardless of the opening ratio. This suggests that the effect of the initial difference is small. In contrast, at a horizontal displacement of 10 δ y , the Mises stress just below the diaphragm with a 95% opening ratio was lower than that of the 20%, 50%, and 80% ratios, indicating a lower burden on the concrete filling. The Mises stress diagram of the diaphragm shown in Figure 18 indicates that the entire area of the diaphragm reached yield stress only when the opening ratio was 95%. As shown in Table 2, the tendency for local buckling to occur at the base of the steel tube when the opening ratio is 95% may be due to the diaphragm yielding. Local buckling at the base of the steel tube decreased as the thickness increased, even when the opening ratio was the same at 95%, probably because the thicker plate delayed the yielding of the diaphragm.
These results suggest that the risk of local buckling directly above the concrete filling can be reduced when the diaphragm thickness is thin and the opening ratio is small within the scope of this study. Even when the opening ratio is extremely small (95%), local buckling is likely to occur at the base of the steel tube due to the area of the diaphragm and its yielding. However, because the diaphragms in this study were examined under a limited filling ratio, radius thickness ratio, and slenderness ratio, the relevance of these parameters should be examined in future studies.

5. Conclusions

Most of the previous PCFSTs’s studies have focused on the presence or absence of diaphragms, and few have focused on the diaphragms’ characteristics. Therefore, this study can be regarded as a fundamental study of PCFSTs with circular cross-sections, and the influence of the diaphragm just above the concrete filling on the horizontal load capacity and buckling deformation was clarified with pushover analysis. The authors performed pushover analyses for a total of 84 cases, focusing on four axial force ratios, three diaphragm thicknesses, and seven diaphragm opening ratios.
The findings of this study are summarized below.
>
The thickness of the diaphragm had little effect on the horizontal load capacity, and the amount of variation in the horizontal load capacity with respect to changes in the axial force ratio was also small.
>
The maximum horizontal load capacity was distributed from 40% to 70% opening ratios, and minimum values occurred from 90% to 95%, except for the 100% opening ratio, where no diaphragm was installed.
>
When the opening ratio of the diaphragm was as small as 20%, local buckling was likely to occur at the base of the steel tube, and when the opening ratio was as large as 80% or 90%, local buckling was only likely to occur directly above the concrete filling.
>
When the opening ratio of the diaphragm was as large as 95%, local buckling was likely to occur at the base of the steel tube due to the smaller contact area between the diaphragm and the concrete filling and the yielding of the diaphragm.

Author Contributions

Conceptualization, Y.C.; methodology, Y.C.; software, N.T.H.H.; validation, S.Z.; formal analysis, N.T.H.H.; data curation, S.Z. and N.T.H.H.; writing—original draft preparation, Y.C. and N.T.H.H.; writing—review and editing, Y.C. and S.Z.; project administration, Y.C. All authors have read and agreed to the published version of the manuscript.

Funding

This research received no external funding.

Data Availability Statement

The datasets presented in this article are not readily available because the data are part of an ongoing study or due to technical limitations.

Conflicts of Interest

Author Nguyen Thi Hong Huong was employed by Shimizu Corporation. Author Seiya Zenzai was employed by C.E. Management Integrated Laboratory Co., Ltd. The remaining author declares that the research was conducted in the absence of any commercial or financial relationships that could be construed as a potential conflict of interest.

References

  1. Han, L.H.; Li, W.; Bjorhovde, R. Developments and advanced applications of concrete-filled steel tubular (CFST) structures: Members. J. Constr. Steel Res. 2014, 100, 211–228. [Google Scholar] [CrossRef]
  2. Zhang, D.Y.; Li, X.; Yan, W.M.; Xie, W.C.; Pandey, M.D. Stochastic seismic analysis of a concrete-filled steel tubular (CFST) arch bridge under tridirectional multiple excitations. Eng. Struct. 2013, 52, 355–371. [Google Scholar] [CrossRef]
  3. Cho, J.; Moon, J.; Ko, H.J.; Lee, H.E. Flexural strength evaluation of concrete-filled steel tube (CFST) composite girder. J. Constr. Steel Res. 2018, 151, 12–24. [Google Scholar] [CrossRef]
  4. Chen, B.W.; Han, L.H.; Qin, D.Y.; Li, W. Life-cycle based structural performance of long-span CFST hybrid arch bridge: A study on arch of Pingnan Third Bridge. J. Constr. Steel Res. 2023, 207, 107939. [Google Scholar] [CrossRef]
  5. Hu, W.; Liu, J.; Liu, Y.; Lyu, Y.; Li, H.; Xian, J.; Ma, Y. Construction alignment and closure control of CFST truss arch bridges based on temperature effect. Structures 2024, 63, 106471. [Google Scholar] [CrossRef]
  6. JSCE/Committee on Steel Structure. Guidelines for Stability Design of Steel Structures, 2nd ed.; Japan Society of Civil Engineers: Tokyo, Japan, 2005; pp. 428–429. (In Japanese) [Google Scholar]
  7. Iura, M.; Orino, A.; Ishizawa, T. Elasto-Plastic Behaviour of Concrete-Filled Steel Tubular Columns. J. JSCE 2002, 696, 285–298. (In Japanese) [Google Scholar] [CrossRef] [PubMed]
  8. Orino, A.; Iura, M. Tests on concrete-filled steel tubular columns subject to lateral load. In Proceedings of the 3rd Symposium on Nonlinear Numerical Analysis and Application to Seismic Design of Steel Structures, Nagoya, Japan, 7–8 January 2000; pp. 83–88. (In Japanese). [Google Scholar]
  9. Goto, Y.; Kumar, G.P.; Kawanishi, N. FEM analysis for hysteretic behavior of CFT bridge piers considering interaction between steel tube and infilled concrete. J. JSCE A 2009, 65, 487–504. (In Japanese) [Google Scholar] [CrossRef]
  10. Goto, Y.; Kumar, G.P.; Kawanishi, N. Nonlinear finite-element analysis for hysteretic behavior of thin-walled circular steel columns with in-filled concrete. J. Struct. Eng. 2010, 136, 1413–1422. [Google Scholar] [CrossRef]
  11. Goto, Y.; Mizuno, K.; Kumar, G.P. Nonlinear finite element analysis for cyclic behavior of thin-walled stiffened rectangular steel columns with in-filled concrete. J. Struct. Eng. 2012, 138, 571–584. [Google Scholar] [CrossRef]
  12. Zenzai, S.; Chikahiro, Y.; Shimizu, S. Estimation Equation for Horizontal Load Bearing Capacity of Circular PCFST with Diaphragm. Appl. Sci. 2022, 12, 8739. [Google Scholar] [CrossRef]
  13. Ota, T.; Suzuki, M.; Shimaguchi, Y. A Study on Seismic Performance of Circular Steel Bridge Piers which have Different Level of Damages and Concrete Filled Repair. J. JSCE A2 (Appl. Mech.) 2013, 69, 381–390. (In Japanese) [Google Scholar] [CrossRef] [PubMed]
  14. Shimaguchi, Y.; Suzuki, M. Seismic performance evaluation of circular steel bridge piers which have damage and concrete filled repair. J. Struct. Eng. 2015, 61A, 292–301. (In Japanese) [Google Scholar] [CrossRef]
  15. Zenzai, S.; Shimizu, S.; Chikahiro, Y.; Ohkami, T. Effect of Diaphragm on Seismic Behaviour of Partially Concrete-Filled Steel Tube. Steel Constr. Eng. 2019, 26, 25–36. (In Japanese) [Google Scholar] [CrossRef]
  16. Japan Road Association. Specification for Highway Bridges Part V: Seismic Design; Japan Road Association: Tokyo, Japan, 2012; pp. 251–274. [Google Scholar]
  17. Public Works Research Institute, Ministry of Construction. Cooperative Research on a Limit State Design of Piers of Highway Bridge Under Seismic Loading (Summarized Edition); Public Works Research Institute, Ministry of Construction: Tsukuba, Japan, 1999; p. 51. (In Japanese)
  18. Goto, Y.; Seki, K.; Ebisawa, T.; Lu, X. Improved seismic performance of CFT piers by a newly discovered mechanism to restrain progress of local buckling deformations. J. JSCE A1 (Struct. Eng. Earthq. Eng.) 2013, 69, 101–120. (In Japanese) [Google Scholar] [CrossRef]
  19. Yuan, H.; Dang, J.; Aoki, T. Behavior of partially concrete-filled steel tube under bidirectional seismic excitations. J. Constr. Steel Res. 2014, 93, 44–54. [Google Scholar] [CrossRef]
  20. ACI318-99; Building Code Requirement for Structural Concrete and Commentary. American Concrete Institute: Indianapolis, IN, USA, 1999; p. 83.
  21. Chen, W.F. Plasticity in Reinforced Concrete; J. Ross Publishing LLC: New York, NY, USA, 2007; pp. 19–48. [Google Scholar]
  22. Popovics, S. A Numerical Approach to the Complete Stress-Strain Curve of Concrete. Cem. Concr. Res. 1973, 3, 583–599. [Google Scholar] [CrossRef]
  23. Ngo, D.; Scordelis, A.C. Finite Element Analysis of Reinforced Concrete Beams. J. Proc. 1967, 64, 152–163. [Google Scholar] [CrossRef]
  24. Johansson, M.; Gylltoft, K. Structural behavior of slender circular steel-concrete composite columns under various means of load application. Steel Compos. Struct. 2001, 1, 393–410. [Google Scholar] [CrossRef]
Figure 1. Numerical PCFST model.
Buildings 15 00863 g001
Figure 2. The sectioning of elements in the numerical model [12].
Buildings 15 00863 g002
Figure 3. Steel tube stress–strain curve [12].
Buildings 15 00863 g003
Figure 4. Compressive stress–compressive strain curve for concrete filling [12].
Buildings 15 00863 g004
Figure 5. Numerical model boundary conditions.
Buildings 15 00863 g005
Figure 6. Coulomb’s friction law [12].
Buildings 15 00863 g006
Figure 7. Horizontal load–horizontal displacement curves of PCFSTs with diaphragm thickness of 6 mm and 50% opening ratio.
Buildings 15 00863 g007
Figure 8. Horizontal displacement on compression side of steel tube of PCFST with diaphragm thickness of 6 mm and 50% opening ratio: (a) n = 0 % ; (b) n = 10 % ; (c) n = 20 % ; (d) n = 30 % .
Buildings 15 00863 g008
Figure 9. Mises stress diagram of PCFST with horizontal displacement of 6 δ y and 50% opening ratio (deformation factor of 3 times): (a) n = 0 % ; (b) n = 10 % ; (c) n = 20 % ; (d) n = 30 % .
Buildings 15 00863 g009
Figure 10. Mises stress diagram at n = 0 % : (a) diaphragm; (b) top of concrete filling.
Buildings 15 00863 g010
Figure 11. Mises stress diagram at n = 10 % : (a) diaphragm; (b) top of concrete filling.
Buildings 15 00863 g011
Figure 12. Mises stress diagram at n = 20 % : (a) diaphragm; (b) top of concrete filling.
Buildings 15 00863 g012
Figure 13. Mises stress diagram at n = 30 % : (a) diaphragm; (b) top of concrete filling.
Buildings 15 00863 g013
Figure 14. Horizontal displacement on compression side of steel tube of PCFST at axial force ratio of 10% and diaphragm thickness of 6 mm: (a) 20% opening ratio: (b) 50% opening ratio; (c) 80% opening ratio; (d) 95% opening ratio.
Buildings 15 00863 g014
Figure 15. Horizontal load–horizontal displacement curves of PCFSTs with axial force ratio 10% and 50% opening ratio.
Buildings 15 00863 g015
Figure 16. Horizontal load capacity–opening ratio relationship: (a) overview; (b) detail of axial ratio of 0%; (c) detail of axial ratio of 10%; (d) detail of axial ratio of 20%.
Buildings 15 00863 g016
Figure 17. Mises stress diagram of steel tube and filled in concrete with axial force ratio 10% and diaphragm thickness 6 mm: (a-1) 1 δ y with 20% opening ratio; (a-2) 6 δ y with 20% opening ratio; (a-3) 10 δ y with 20% opening ratio; (b-1) 1 δ y with 50% opening ratio; (b-2) 6 δ y with 50% opening ratio; (b-3) 10 δ y with 50% opening ratio; (c-1) 1 δ y with 80% opening ratio; (c-2) 6 δ y with 80% opening ratio; (c-3) 10 δ y with 80% opening ratio; (d-1) 1 δ y with 95% opening ratio; (d-2) 6 δ y with 95% opening ratio; (d-3) 10 δ y with 95% opening ratio.
Buildings 15 00863 g017
Figure 18. Mises stress diagram of diaphragm at horizontal displacement of 10 δ y with axial force ratio of 10% and diaphragm thickness of 6 mm: (a) 20% opening ratio; (b) 50% opening ratio; (c) 80% opening ratio; (d) 95% opening ratio.
Buildings 15 00863 g018
Table 1. Numerical PCFST model specifications [12,17].
ParameterValue
Diameter of steel tube D [mm]900
Thickness of steel tube t s [mm]9.3
Height of steel tube L [mm]3850
Section of steel tube A [mm2]26,023.4
Secondary radius of the section of steel tube r [mm]314.9
Young’s modulus of steel tube E s [GPa]206.0
Poisson’s ratio of steel tube μ s 0.3
Yielding stress of steel tube σ y [MPa]308.0
Concrete filling ratio L c / L [%]40
Radius thickness ratio parameter R t 0.12
Slenderness ratio parameter λ t 0.3
Opening ratio of diaphragm D d / D [%]20, 40, 50, 70
80, 90, 95, 100
Thickness of diaphragm D t [mm]4, 6, 12
Axial force ratio n = N / N y [%]0, 10, 20, 30
Table 2. Classification of locations where local buckling occurred.
D t 4   mm 6   mm 12   mm
n 0%10%20%30%0%10%20%30%0%10%20%30%
D d / D 20%
40%
50%
70%
80%
90%
95%
100%
Disclaimer/Publisher’s Note: The statements, opinions and data contained in all publications are solely those of the individual author(s) and contributor(s) and not of MDPI and/or the editor(s). MDPI and/or the editor(s) disclaim responsibility for any injury to people or property resulting from any ideas, methods, instructions or products referred to in the content.

