Article

A Field-Based Measurement and Analysis of Wind-Generated Vibration Responses in a Super-Tall Building During Typhoon “Rumbia”

1
College of Civil Engineering, Nanjing Forestry University, Nanjing 210037, China
2
College of Automible and Traffic Engineering, Nanjing Forestry University, Nanjing 210037, China
3
School of Civil Engineering, Chongqing Jiaotong University, Chongqing 400074, China
4
Earthquake Disaster Prevention Center, Shanghai Earthquake Administration, Shanghai 200062, China
*
Authors to whom correspondence should be addressed.
Buildings 2025, 15(9), 1448; https://doi.org/10.3390/buildings15091448
Submission received: 14 March 2025 / Revised: 21 April 2025 / Accepted: 22 April 2025 / Published: 24 April 2025
(This article belongs to the Section Building Structures)

Abstract

:
The accuracy of identifying dynamic characteristics of super-tall buildings under typhoon conditions, as well as their correlation with the vibration amplitude, remains unclear, limiting the effective assessment of the structural performance and optimization of wind-resistant designs. To address this issue, the measured wind-generated vibration responses of Shanghai World Finance Center during the passage of Typhoon “Rumbia” were derived using data obtained from the health monitoring system of a super-tall building in Shanghai. The first and second inherent frequencies, as well as the damping ratio of the structure, were ascertained through the employment of the curve method and the standard deviation method. Based on this, a comparison and analysis were carried out regarding the variation patterns of the first and second inherent frequencies and the damping ratio with reference to the vibration amplitude. Vibration modes were identified using frequency domain analysis. The results of the natural frequency identification were compared to those from the Peak Picking method to see how well the curve method and the standard deviation method worked at finding modal parameters. Ultimately, an assessment of the super-tall building’s performance during the impact of the typhoon was conducted. The results demonstrate that the curve method and the standard deviation method can accurately identify the inherent frequency and damping ratio of the structure, with the curve method revealing a more pronounced regularity of the modal parameters. For the structure, in the horizontal and longitudinal directions, the first and second inherent frequencies exhibit a negative correlation with amplitude, while the damping ratio shows a positive correlation with amplitude. Moreover, as the floor level rises, the vibration modes in both directions of the structure steadily increase. During the impact of Typhoon “Rumbia”, the building’s performance complied with the requirements set by comfort standards. These analytical results not only provide valuable references for the wind-resistant design and vibration control of super-tall buildings but also offer critical support for condition assessment and damage identification within structural health monitoring systems.

1. Introduction

As the level of economic development continues to progress, people’s demands for built spaces and functional facilities have become more stringent [1]. The advent of novel materials, the evolution of construction techniques, and the innovation in design concepts have jointly spurred a remarkable growth in the number of skyscrapers. Skyscrapers, particularly those that are situated in coastal cities, tend to exhibit notable wind-induced dynamic responses. This is mainly because they have low inherent frequencies and relatively little structural damping. As a result, there is an urgent need to conduct research on the wind-induced vibration characteristics of these buildings. Such studies can offer fresh perspectives for the simulation of wind tunnel tests and the wind-resistant design of structures.
Research approaches regarding the wind-generated vibration response of super-high-rise buildings are generally classified into three types: wind tunnel experiments, numerical simulations, and on-site measurements. On-site measurements are of great significance, as they can supply dependable data about the impacts of wind on super-high-rise buildings. Additionally, they circumvent the inevitable modeling and scaling inaccuracies in numerical simulations and wind tunnel experiments. Consequently, on-site measurements have emerged as the most trustworthy method for investigating wind effects on structures.
In recent decades, numerous scholars have initiated a succession of field measurement investigations into the wind-generated vibration response of tall wind-sensitive structures. Ohkuma et al. [2] undertook a field measurement study on a building reaching a height of 68 m. Their findings indicated that the first two-order damping ratios of the structure were 0.950% and 0.740%, respectively. These field measurement outcomes were consistent with the codes of Canada and Japan, validating the efficacy of the wind-induced response calculations for high-rise buildings as specified in the codes. Balendra et al. [3] performed field measurements on the wind-induced responses of several representative high-rise buildings in Singapore. The aim was to deepen the understanding of the wind speed and acceleration responses of buildings. Wan et al. [4] made use of the structural health monitoring system and the Integrated Building Intelligent Sensing-Fast Sampling (IBIS-FS) system to conduct field measurements on a 600 m high super-high-rise building in Shenzhen. They delved into the structural response and dynamic characteristics of the building and successfully obtained the amplitude correlation, as well as the time-varying characteristics of the natural frequency and damping ratio. He et al. [5] executed on-site measurements on five super-high-rise buildings, each with a structural height exceeding 300 m. They employed the Stochastic Subspace Identification method and the Random Decrement Technique (RDT) to compare and analyze the amplitude-correlated characteristics of the structural modal parameters.
Despite the fact that the dynamic behavior of skyscrapers under wind loading has been extensively explored via field measurements, each super-high-rise building, functioning as an urban landmark, is distinct and positioned in diverse geographical settings. In addition, the identification of structural dynamic parameters holds practical value in structural health monitoring systems, providing important references for structural performance assessments and damage warnings. Therefore, there is a need to research the structural dynamic traits and wind-induced structural performance of these edifices when impacted by powerful typhoons. This will further augment the on-site measurement database for super-tall buildings under the influence of severe typhoons.
Currently, the approaches for identifying the modal parameters of skyscrapers can be classified into three types: frequency domain methods, time domain methods, and time–frequency domain methods. Traditional modal identification techniques have evolved from frequency domain methods. Examples include the Peak Picking method (PP) [6], the Frequency Domain Decomposition method (FDD) [7], and the Enhanced Frequency Domain Decomposition method (EFDD) [8]. Time domain methods can be grouped into those based on the Random Decrement Technique (RDT) [9], Natural Excitation Technique (NExT) [10], Stochastic Subspace Identification method (SSI) [11], Eigensystem Realization Algorithm (ERA) [12], and so on. The principal time–frequency domain methods consist of Wavelet Transform (WT) [13] and Hilbert–Huang Transform (HHT) [14].
Prior research has indicated that the dynamic characteristics of high-rise buildings, like inherent frequencies and damping ratios, change in accordance with the vibration amplitude [15]. Li et al. [16] employed methods such as the RDT and HHT to analyze the measured wind and acceleration data of over a dozen super-high-rise buildings in China. These buildings include the CITIC Plaza in Guangzhou [16], the Diwang Mansion in Shenzhen [17,18,19,20], the Jin Mao Tower in Shanghai [21], and the Shanghai World Financial Center [22]. These studies had diverse foci, such as the variation rules of inherent frequencies and damping ratios with amplitude, the comparison between measured results and wind tunnel test results, and the evaluation of finite element models. Relying on the data on normal wind and the monitoring data when Typhoon “Ampil” made landfall, Wu Jie et al. [23] carried out a comparative analysis of the variation rules of the first-order natural vibration frequency and damping ratio of the Shanghai Tower with amplitude under low- and high-amplitude conditions.
Even though the traditional Random Decrement Technique (T-RDT) is convenient and practical, it lacks a theoretical foundation for assessing the amplitude correlation of structural parameters. In contrast, the Envelope Random Decrement Technique (E-RDT) offers greater stability, lower variability, and clearer physical interpretation. However, the application of the E-RDT for identifying structural dynamic parameters remains limited. Thus, based on wind-induced vibration response data recorded during the passage of Typhoon “Rumbia” for a super-tall building in Shanghai, this study employs the E-RDT [24,25] to identify the structure’s natural frequencies and damping ratios. Furthermore, the amplitude dependence of these parameters is comparatively analyzed using both the curve method and the standard deviation method, revealing several noteworthy patterns and conclusions.

2. Field Measurements

2.1. Field Monitoring System

2.1.1. Typhoon “Rumbia”

Typhoon “Rumbia” was formed at 11:00 on 15 August 2018 and made landfall in the Pudong New Area of Shanghai at 04:05 on 17 August. At around 06:00, “Rumbia” reached Songjiang and then moved in a west-northwest direction at a speed of about 30 km per hour, with its intensity gradually weakening. At 02:00 on 21 August, the Central Meteorological Observatory stopped numbering it. Typhoon “Rumbia” was characterized by a strong landfall intensity and a wide influence range. Its route of movement is shown in Figure 1.

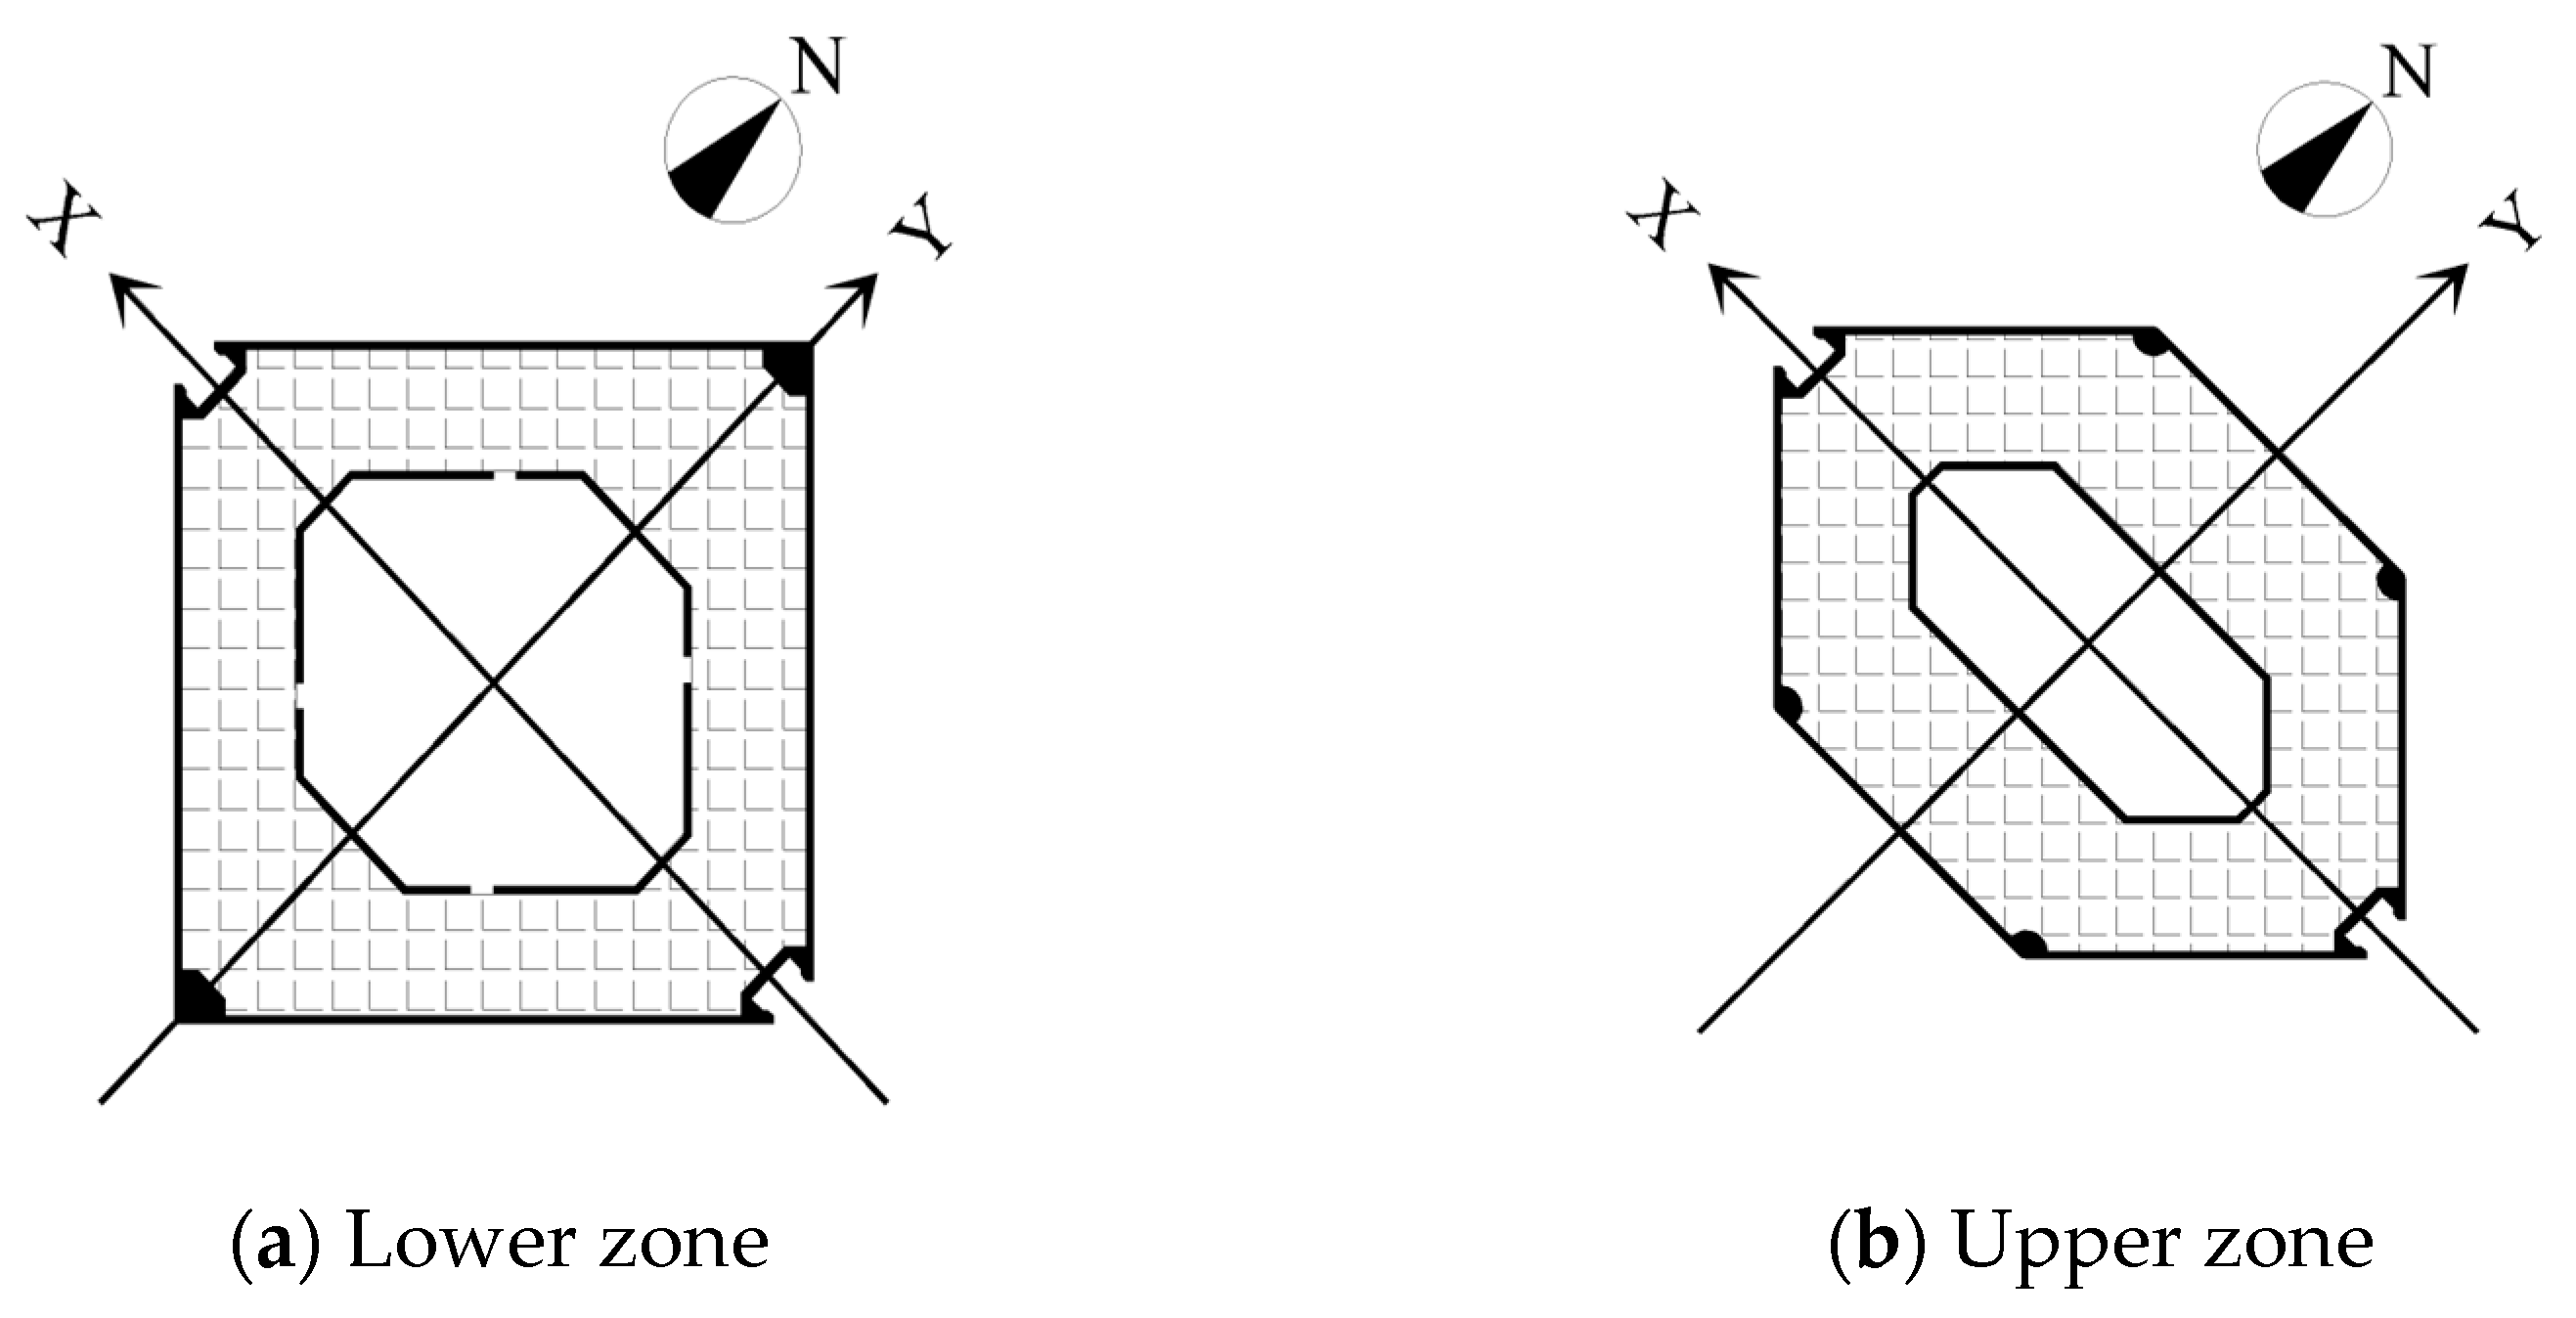
2.1.2. The Monitoring System of the Target Building

The super-tall building under surveillance is situated in the Pudong New Area of Shanghai and functions as a comprehensive structure. To safeguard the building’s structural integrity and safety in wind conditions, a health monitoring system has been established, as shown in Figure 2. This involves installing anemometers and acceleration sensors on the building’s roof, as well as both within and outside the core tube. In the figure, “A” denotes a three-component accelerometer, and “D” represents an anemometer.
The acceleration sensor employed is TDA-33 M. It samples at a frequency of 100 Hz, a measurement range spanning from −2 g to +2 g, and a sensitivity of 1.25 V/g. It is important to note that for this accelerometer, the building’s east–west orientation is designated as the X-axis, while the north–south orientation is defined as the Y-axis, as shown in Figure 3.
The anemometer employed is the 81,000 series manufactured by R.M. YOUNG in the United States. Its sampling frequency is 10 Hz, and it can measure wind speeds within the range of 0–40 m/s. The wind direction is set so that the due north direction is 0°, and when looking down, the counterclockwise direction is considered to be positive.

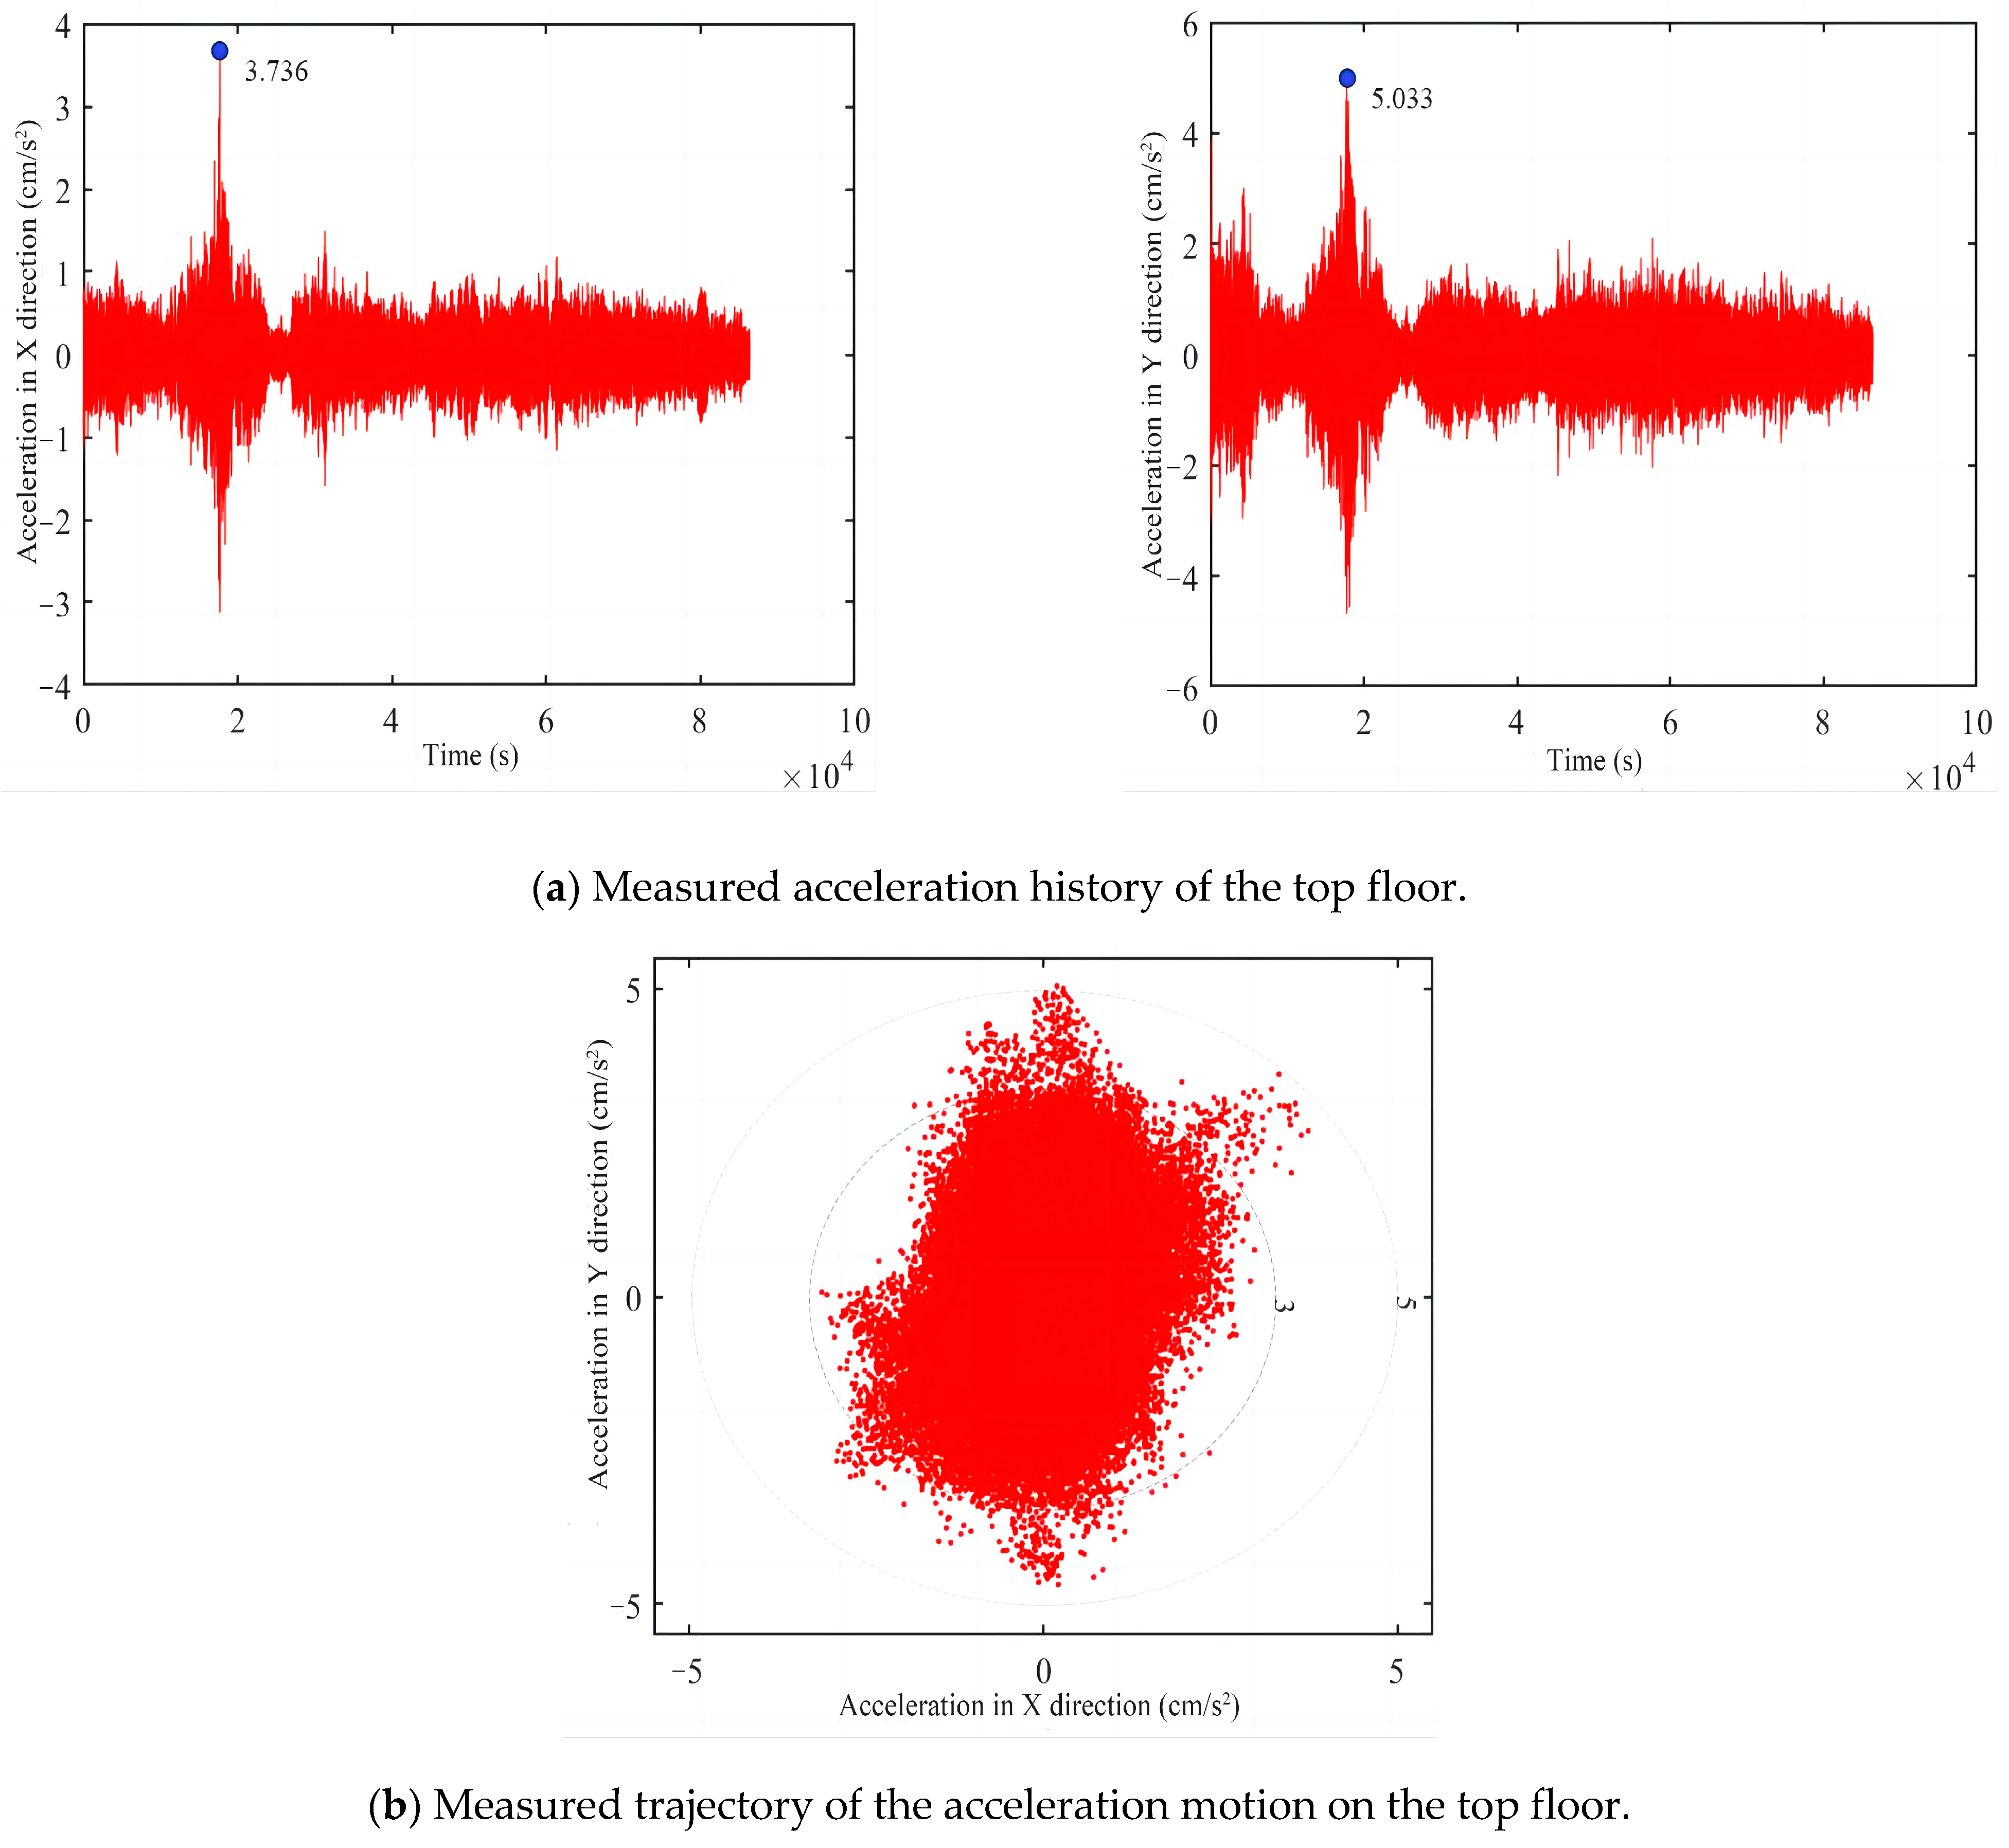
2.2. Structural Acceleration Measurement Under Typhoon Excitation

Accelerometers installed on 15 floors of the super-high-rise building were utilized to acquire the measured data on the structural acceleration response during the passage of Typhoon “Rumbia” from 0:00 on 16 August 2018 to 24:00 on 17 August 2018. Based on the measurement results of the accelerometer at the building’s top floor, Figure 4 presents the acceleration time histories in the X- and Y-directions and the structure’s motion trajectory from 0:00 to 24:00 on 17 August. As is evident from Figure 4a, within this time frame, the acceleration responses along the X- and Y-axes exhibit similar changing trends. The peak values of the acceleration responses are reached at approximately 5:00, after which they decline and approach stability. The peak acceleration response takes place along the Y-axis, with a response magnitude of 5.033 cm/s2; the peak acceleration response value along the X-axis is 3.736 cm/s2. The motion trajectory in Figure 4b shows that the structure mainly vibrates along the Y-axis.

3. Acceleration Data Processing
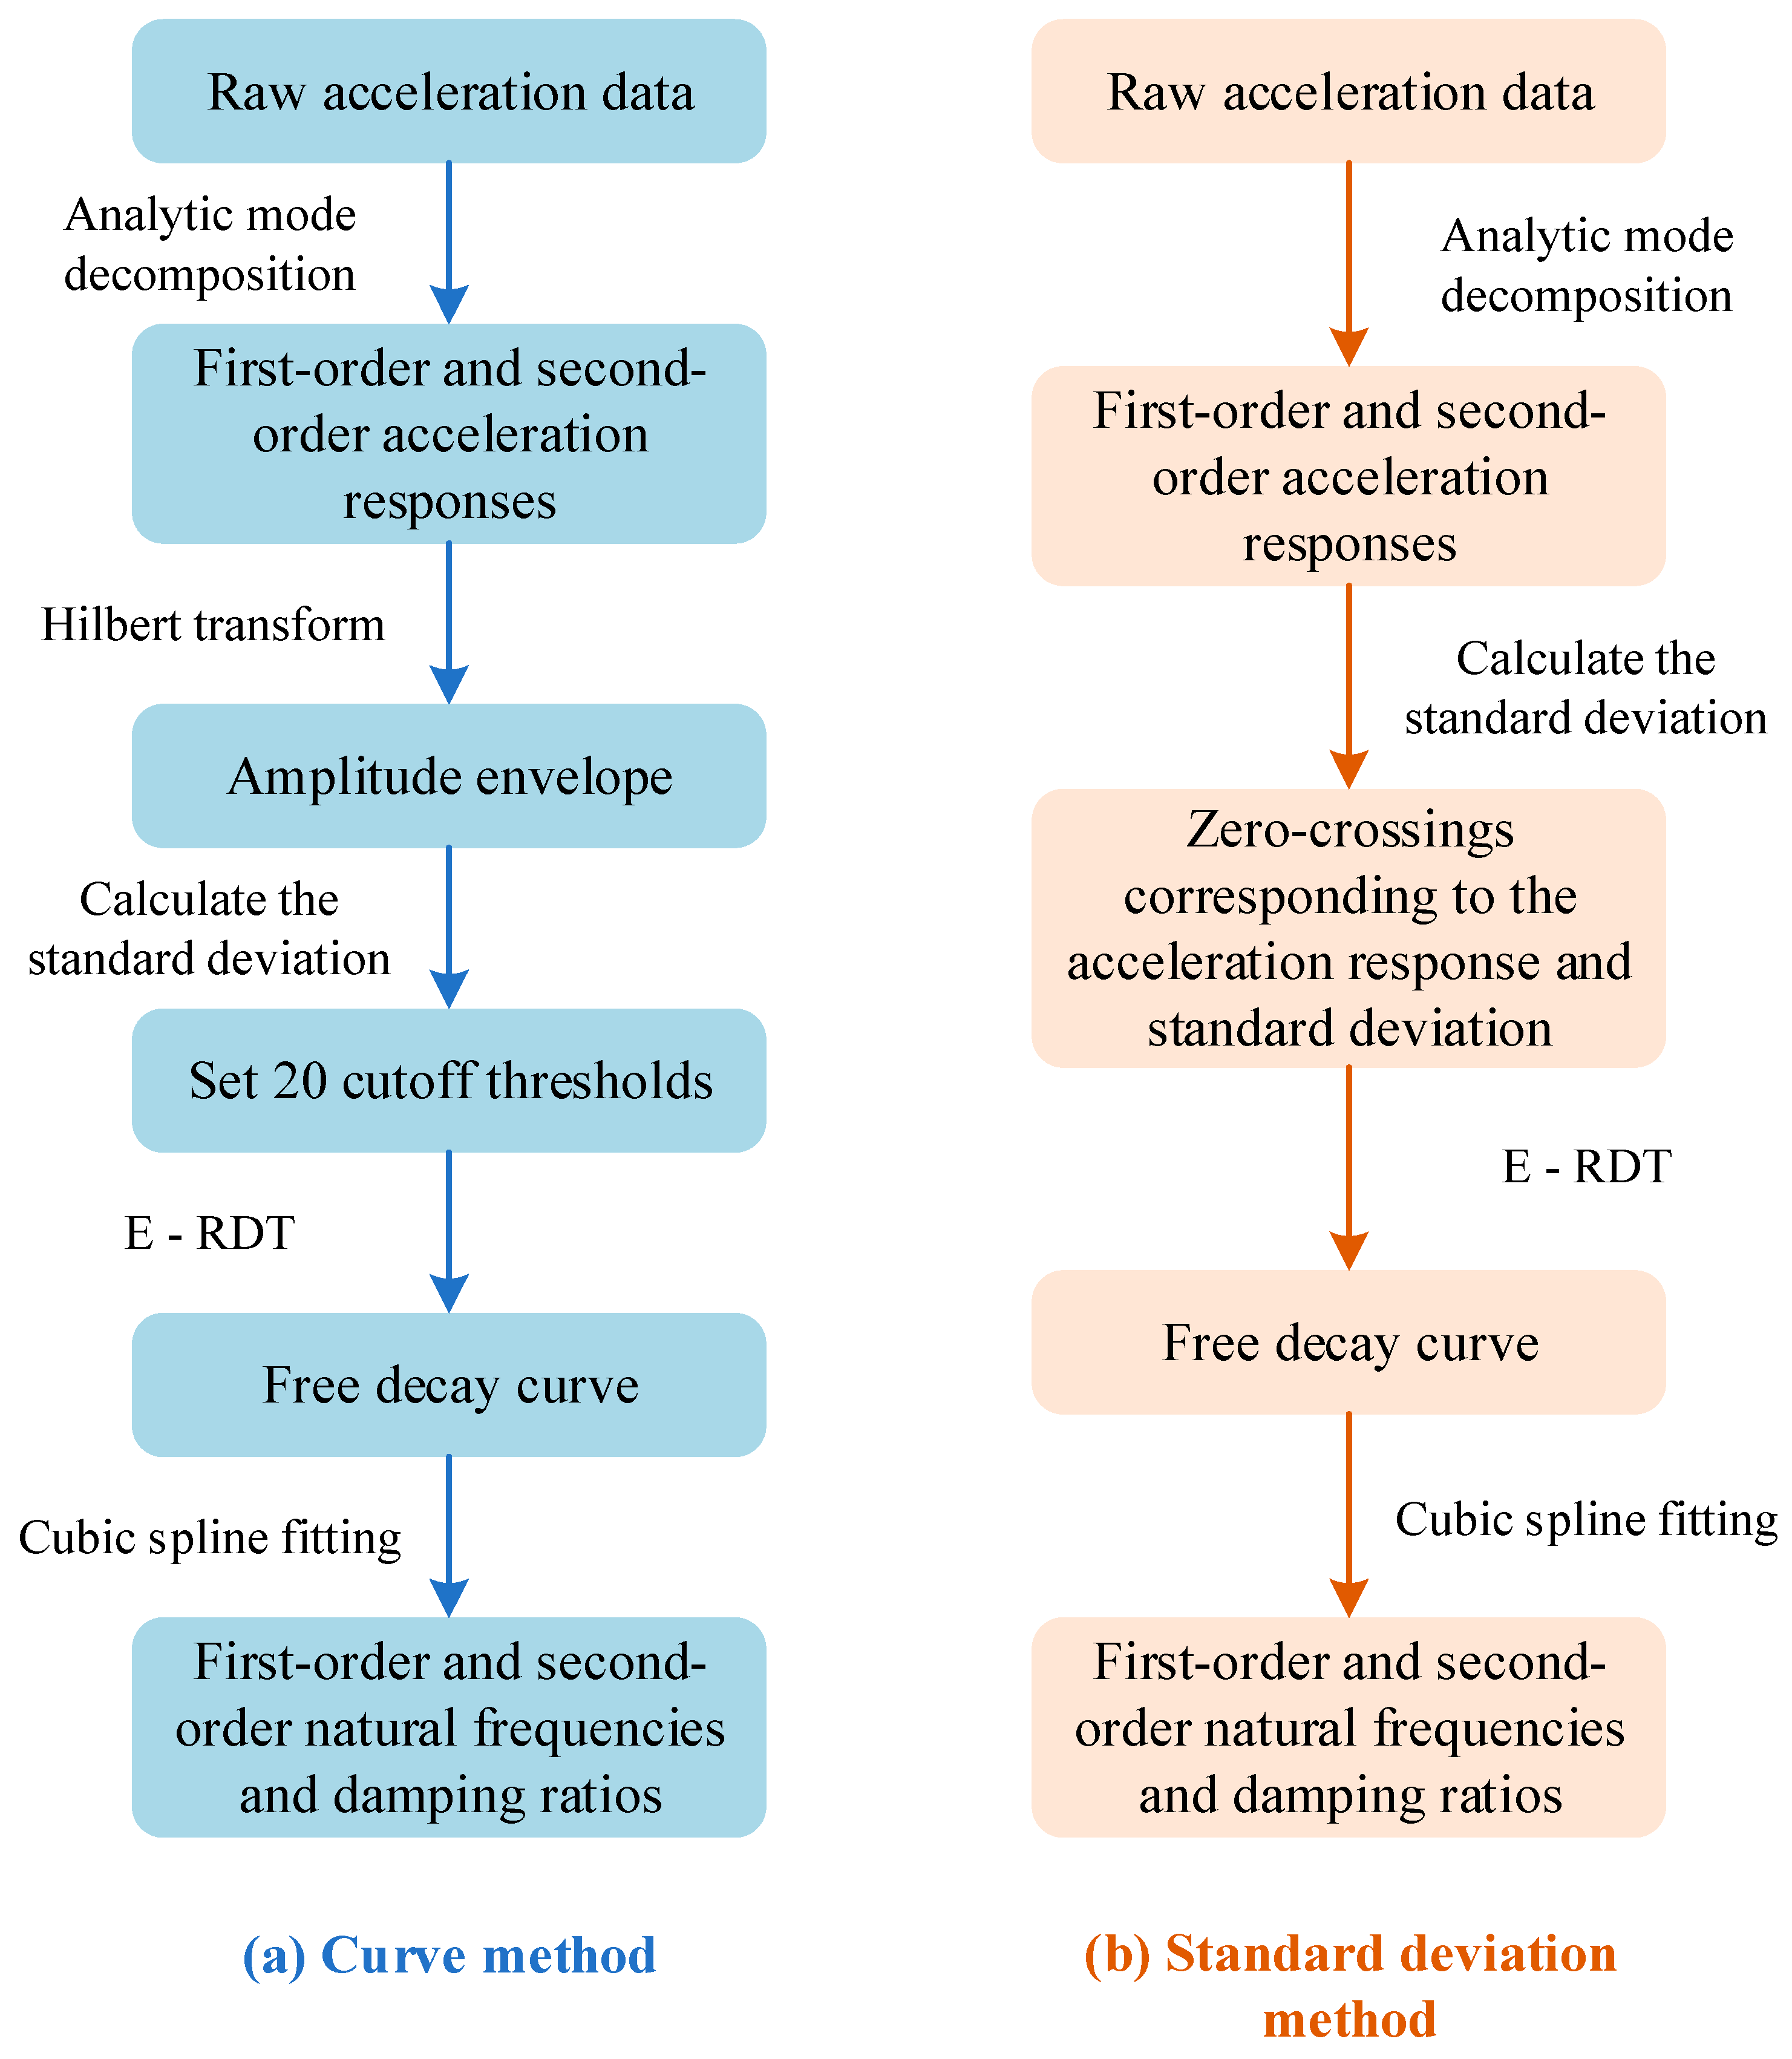
Using the acceleration response data in the X- and Y-directions on the top floor of the building when Typhoon “Rumbia” passed, the E-RDT [25] was applied to determine the natural vibration frequency and damping ratio of the structure. Additionally, a comparison and analysis were carried out on the identification results that we achieved through the curve method and the standard deviation method. The flowcharts of these two methods are shown in Figure 5, and the specific procedures are described below.

3.1. Curve Method

① Carry out an analytical modal decomposition [26] process on the initial acceleration data in order to extract the modal acceleration responses a 1 and a 2 corresponding to the first-order and second-order modes.
② Apply the Hilbert transform to a 1 and a 2 to compute the envelope A ( t ) and treat it as the amplitude envelope.
A ( t ) = y 2 ( t ) + 1 π + y ( τ ) t τ d τ 2
③ Determine the standard deviations of a 1 and a 2 and establish 20 truncation thresholds, which span from 0.5 times to 1.5 times the values of the standard deviations.
④ Use the E-RDT to calculate the curve of free decay.
⑤ Employ a cubic spline to perform a fit on the free decay curve and then compute the first-order and second-order natural vibration frequencies, as well as the damping ratios of the structure.

3.2. Standard Deviation Method

① Conduct an analytical modal decomposition [26] on the initial acceleration data, aiming to derive the modal acceleration responses a 1 and a 2 corresponding to the first-order and second-order modes.
② Determine the standard deviations of a 1 and a 2 , take the standard deviation as the truncation threshold, and identify the zero-crossing points of the acceleration response that corresponds to this standard deviation.
③ Use the E-RDT to calculate the free decline curve.
④ Apply a cubic spline to fit the free decay curve. Subsequently, calculate the first-order and second-order natural vibration frequencies, along with the damping ratios of the structure.

4. Structural Dynamic Characteristics

4.1. Modal Parameter Identification

The natural vibration frequency, damping ratio, and mode shape constitute the fundamental parameters of structural dynamic characteristics. In the context of structural design, accurately estimating these three parameters holds substantial significance [27]. The curve method and the standard deviation method are separately utilized to comprehensively analyze the acceleration response data in the X- and Y-directions on the top floor of the super-high-rise building during the influence of Typhoon “Rumbia”. Simultaneously, to validate the efficacy of both methods for modal parameter identification, the Peak Picking method is initially chosen to approximately determine the first-order and second-order natural vibration frequencies of the structure. Then, the results are compared and contrasted with those that were identified by the curve and the standard deviation methods.

4.1.1. Peak Picking Method

The acceleration power spectrum represents a frequency domain analysis approach that is employed for analyzing acceleration signals. In this study, for the time domain acceleration signals on the top floor, the average periodogram method is utilized to acquire the acceleration power spectral density. This approach involves splitting the response signal data into overlapping sections. Subsequently, the estimated value of the power spectral density for each segment of data is computed, and these values are then averaged [28]. The acceleration power spectral density curve is presented in Figure 6.
In accordance with the power spectral density analysis results, the Peak Picking method is applied to identify the natural vibration frequencies of the building. As can be observed from the figure, the acceleration power spectral density curves of the structure in the X- and Y-directions are highly alike. In the X-direction, the first-order and second-order natural vibration frequencies are 0.1525 and 0.5490 Hz, respectively. In the Y-direction, they are 0.1525 and 0.5185 Hz, respectively. The evident data fluctuations in the acceleration power spectral density curve in the figure might be attributed to the sensors and the data acquisition system itself. Additionally, the relevant mode shape information is provided in Section 4.1.3.

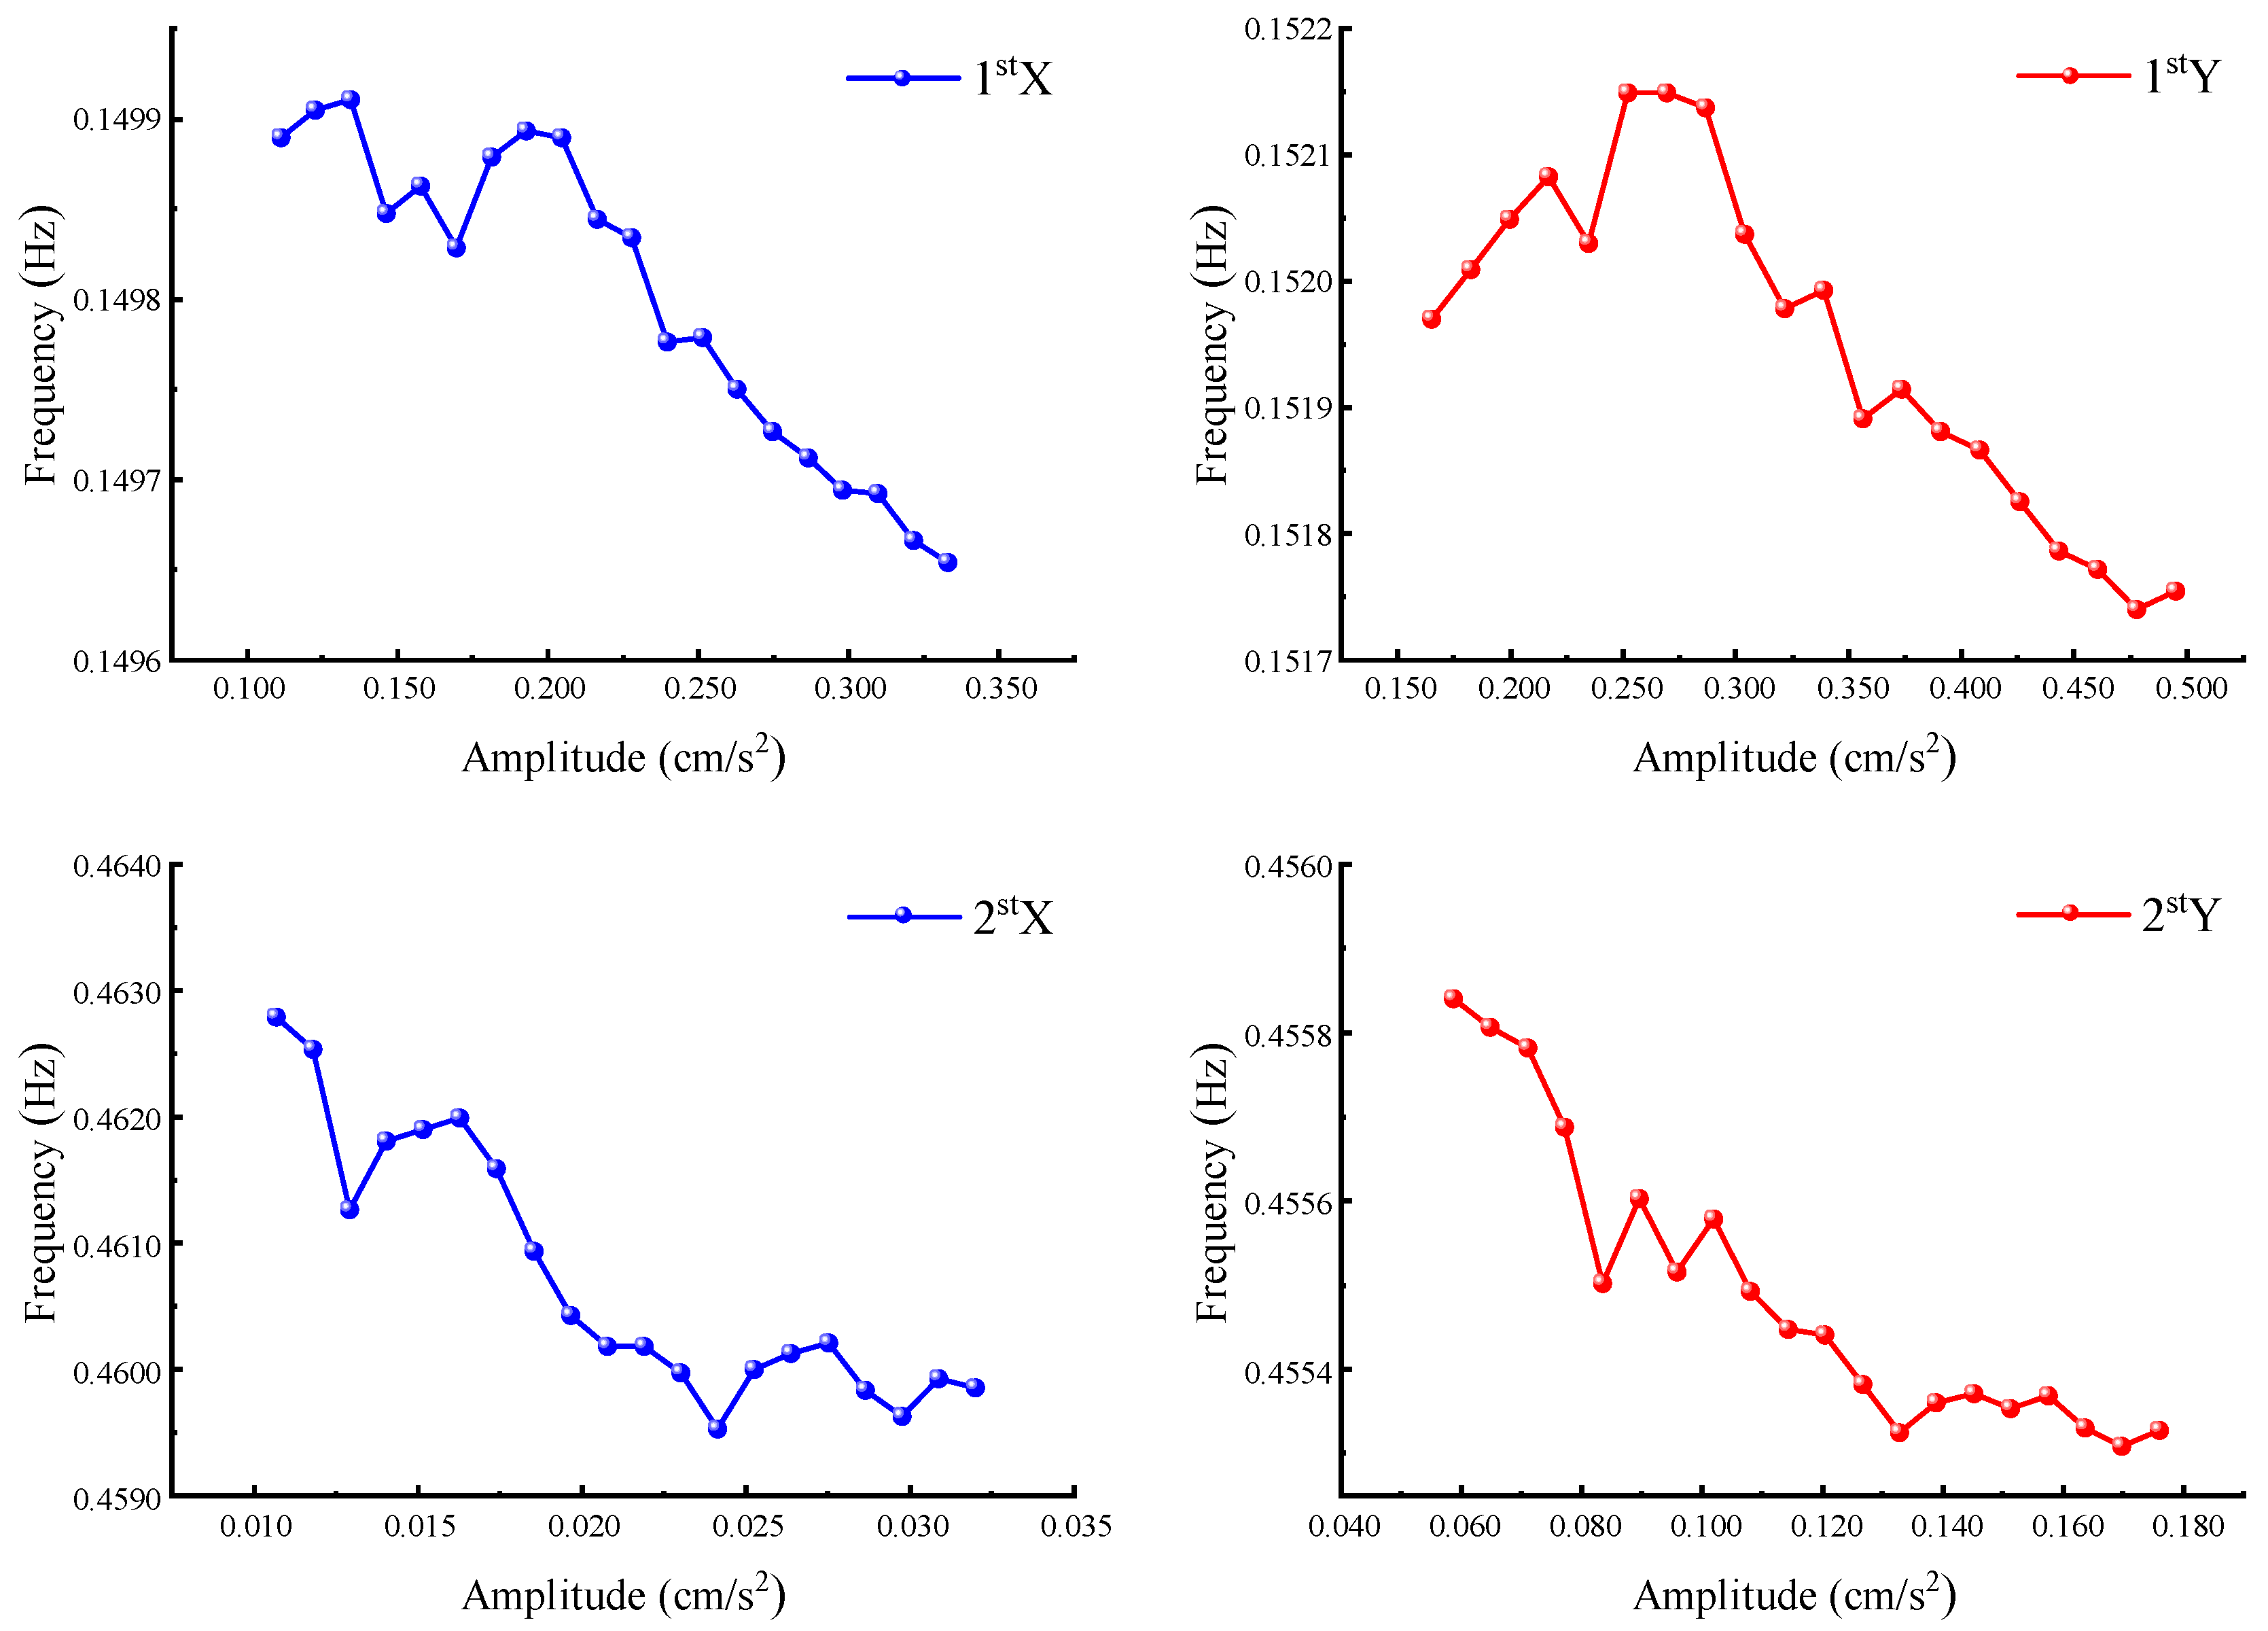
4.1.2. Variation in Inherent Frequencies and Damping Ratios with Amplitude

(1)
Curve Method
Acceleration responses spanning a total of 48 h, from 0:00 on 16 August 2018 to 24:00 on 17 August 2018, were selected. Twenty truncation thresholds, ranging from 0.5 times to 1.5 times the standard deviation, were set. Subsequently, the first- and second-order inherent vibration frequencies and damping ratios of the building’s top floor under the impact of Typhoon “Rumbia” were calculated. Figure 7 and Figure 8, respectively, display the correlation curves of the first-order and second-order natural vibration frequencies and damping ratios with amplitude, as obtained by the curve method.
As depicted in Figure 7, as the amplitude grows, the first- and second-order inherent vibration frequencies of the building along both axes gradually decline. The primary cause of this phenomenon lies in the fact that as the amplitude increases, the relative motion of the microstructure units is stimulated, which further evolves into micro-cracks within the structure. These micro-cracks reduce the stiffness of the structure, thereby resulting in a decrease in the structural frequency. In recent years, certain scholars have also posited that the specific effect might contribute to the amplitude dependence of the natural vibration frequency [29].
The second-order inherent vibration frequency exhibits significant fluctuations in the low-amplitude region. As the amplitude increases, its dependence gradually becomes more pronounced, while the first-order natural vibration frequency continues to show a decreasing trend. The overall change trends are as follows: When the amplitude in the X-direction rises from 0.111 to 0.333 cm/s2, the first-order natural vibration frequency drops by 2.60 × 10⁻⁴ Hz; when the amplitude in the X-direction increases from 0.011 to 0.032 cm/s2, the second-order natural vibration frequency decreases by 3.27 × 10⁻³ Hz; when the amplitude along the Y-axis increases from 0.165 to 0.495 cm/s2, the first-order inherent vibration frequency declines by 4.10 × 10⁻⁴ Hz; when the amplitude in the Y-direction increases from 0.059 to 0.176 cm/s2, the second-order inherent vibration frequency decreases by 5.30 × 10⁻⁴ Hz. The maximum reduction in the inherent vibration frequency is 0.71%, corresponding to the second-order inherent vibration frequency in the X-direction, and the minimum reduction is 0.12%, corresponding to the second-order inherent vibration frequency in the Y-direction.
Figure 8 reveals that as the amplitude rises, the first- and second-order damping ratios of the building along both axes gradually go up. The principal cause behind this is that as the amplitude increases, the micro-cracks in the structural materials propagate. This propagation leads to energy dissipation, causing the damping ratio to increase correspondingly [30]. The damping ratio in the X-direction, as determined by the curve method, experiences significant fluctuations in the low-amplitude region. As the amplitude grows, its dependence also strengthens, while the damping ratio in the Y-direction consistently shows an upward trend. The overall patterns of change are as follows: When the amplitude in the X-direction increases from 0.111 to 0.333 cm/s2, the first-order damping ratio surges by 0.309%. When the amplitude along the X-axis climbs from 0.011 to 0.032 cm/s2, the second-order damping ratio increases by 1.230%. When the amplitude along the Y-axis rises from 0.165 to 0.495 cm/s2, the first-order damping ratio increases by 0.217%. When the amplitude in the Y-direction goes from 0.059 to 0.176 cm/s2, the second-order damping ratio increases by 0.083%. The local data fluctuations in the correlation curve between the natural frequency and damping ratio are due to the activation of the damper that was installed on the 90th floor of the building during the actual typhoon passage, which limited the building’s vibration, resulting in the observed local fluctuations in the data. Additionally, the design damping ratio for the building under normal operation is 2.000%, which is higher than the measured value in this study, indicating that the damper was functioning properly during the typhoon event.
(2)
Standard Deviation Method
Acceleration responses covering a continuous 48 h period, commencing at 0:00 on 16 August 2018 and concluding at 24:00 on 17 August 2018, were chosen. With a time interval of 1 h and using the root-mean-square deviation of the acceleration response as the amplitude metric, the first-order and second-order natural vibration frequencies, as well as the damping ratios of the super-high-rise building’s top floor, under the influence of Typhoon “Rumbia” were calculated. Figure 9 and Figure 10 illustrate the trends of change in the first- and second-order inherent vibration frequencies and damping ratios with respect to the amplitude, which were derived via the standard deviation method. Equations (2) and (3) were employed for the fitting process:
f = α 0 + α 1 x
ξ = β 0 + β 1 x
where f is the natural vibration frequency; ξ is the damping ratio; α 0 and β 0 are the inherent vibration frequency and damping ratio at zero amplitude, respectively; α 1 and β 1 are the rates of change of the inherent vibration frequency and damping ratio with the amplitude A, respectively.
Figure 9 indicates that as the amplitude grows, the first-order and second-order inherent vibration frequencies of the building along both axes display a downward tendency. The fitting outcome for the first-order natural vibration frequency is relatively satisfactory. The natural vibration frequencies that were determined by the standard deviation method are more concentrated within the low-amplitude range. The reason for this lies in the fact that in the low-amplitude region, the vibration is feeble, and the signal-to-noise ratio is relatively low, thereby causing the results to be uncertain. As the amplitude increases, the amplitude dependence gradually weakens.
The overall patterns of change are as follows: When the amplitude along the X-axis rises from 0.039 to 0.582 cm/s2, the first-order inherent vibration frequency drops by 5.10 × 10⁻³ Hz. When the amplitude in the X-direction increases from 0.003 to 0.077 cm/s2, the second-order inherent vibration frequency decreases by 3.92 × 10⁻³ Hz. When the amplitude in the Y-direction goes up from 0.068 to 0.915 cm/s2, the first-order natural vibration frequency reduces by 4.74 × 10⁻³ Hz. When the amplitude along the Y-axis increases from 0.016 to 0.441 cm/s2, the second-order inherent vibration frequency falls by 3.01 × 10⁻³ Hz. The peak reduction in the natural vibration frequency is 3.38%, corresponding to the first-order natural vibration frequency in the X-direction, while the minimum reduction is 0.66%, which is the second-order natural vibration frequency in the Y-direction.
Figure 10 shows that as the amplitude rises, the first- and second-order damping ratios of the building in both directions exhibit an upward trend, and the fitting result for the first-order damping ratio is relatively favorable. The damping ratios are likewise more concentrated in the low-amplitude region. The specific reasons for this have been expounded upon previously and will not be restated here.
The overall patterns of change are as follows: When the amplitude in the X-direction increases from 0.039 to 0.582 cm/s2, the first-order damping ratio surges by 2.700%. When the amplitude in the X-direction goes up from 0.003 to 0.077 cm/s2, the second-order damping ratio increases by 1.141%. When the amplitude in the Y-direction climbs from 0.068 to 0.915 cm/s2, the first-order damping ratio grows by 2.369%. When the amplitude in the Y-direction increases from 0.016 to 0.441 cm/s2, the second-order damping ratio increases by 0.804%.
Table 1 and Table 2 present a comparison of the identification outcomes for the building’s inherent vibration frequencies and damping ratios. These results are obtained using the curve and the standard deviation methods during the influence of Typhoon “Rumbia”, along with the results that are reported by other scholars under different excitation conditions.
As shown in Table 1, the identification results from the Peak Picking method, the curve method, and the standard deviation method show a certain degree of consistency. However, the second-order inherent frequency identified by the Peak Picking method is considerably higher. This divergence occurs because Fourier transforms, which are affected by the frequency resolution, often bring uncertainties to the results. When contrasted with the calculation results of other scholars, both the curve method and the standard deviation method can accurately identify the first-order and second-order inherent frequencies of the structure. Significantly, the curve method displays less scatter and more distinct regularity in frequency identification.
As is clear from Table 2, the identification results are highly consistent. In comparison to the findings of other scholars, both methods can accurately determine the first-order and second-order damping ratios of the structure. Notably, the curve method demonstrates greater robustness, with less scatter and more prominent regularity in the damping ratio identification. Although the damping ratios for the X- and Y-axes deviate slightly from those in previous studies, they still fall within the range of the calculated values in this paper. Specifically, the results obtained by the curve method are more in line with the theoretical expectations.

4.1.3. Overall Structural Mode Shapes

During the passage of Typhoon “Rumbia”, the acceleration sensor on the 91st floor of the building failed. Consequently, the acceleration response signals from the remaining 14 floors were chosen. The frequency domain method (FDA) was employed to identify the overall mode shapes. In other words, the ratio of the cross-spectrum to the auto-spectrum of the acceleration response signals at the natural vibration frequencies was utilized to roughly determine the ratio of the mode shape amplitudes [34]. With the mode shape amplitude of the top floor as the reference, normalization was performed, and the first three-order mode shapes of the building in the X- and Y-directions were obtained, as illustrated in Figure 11.
As can be seen from the figure, the order of the first three-order mode shapes corresponds to the number of amplitude zero-points of the mode shapes of the corresponding order. The mode shapes of the structure in both directions gradually increase as the number of floors rises, and the growth tendency of the third-order mode shape is more noticeable. The vibration patterns of the structure in both directions are essentially identical for mode shapes of the same order. From this, it can be inferred that the stiffness of the building in the two directions does not vary significantly.

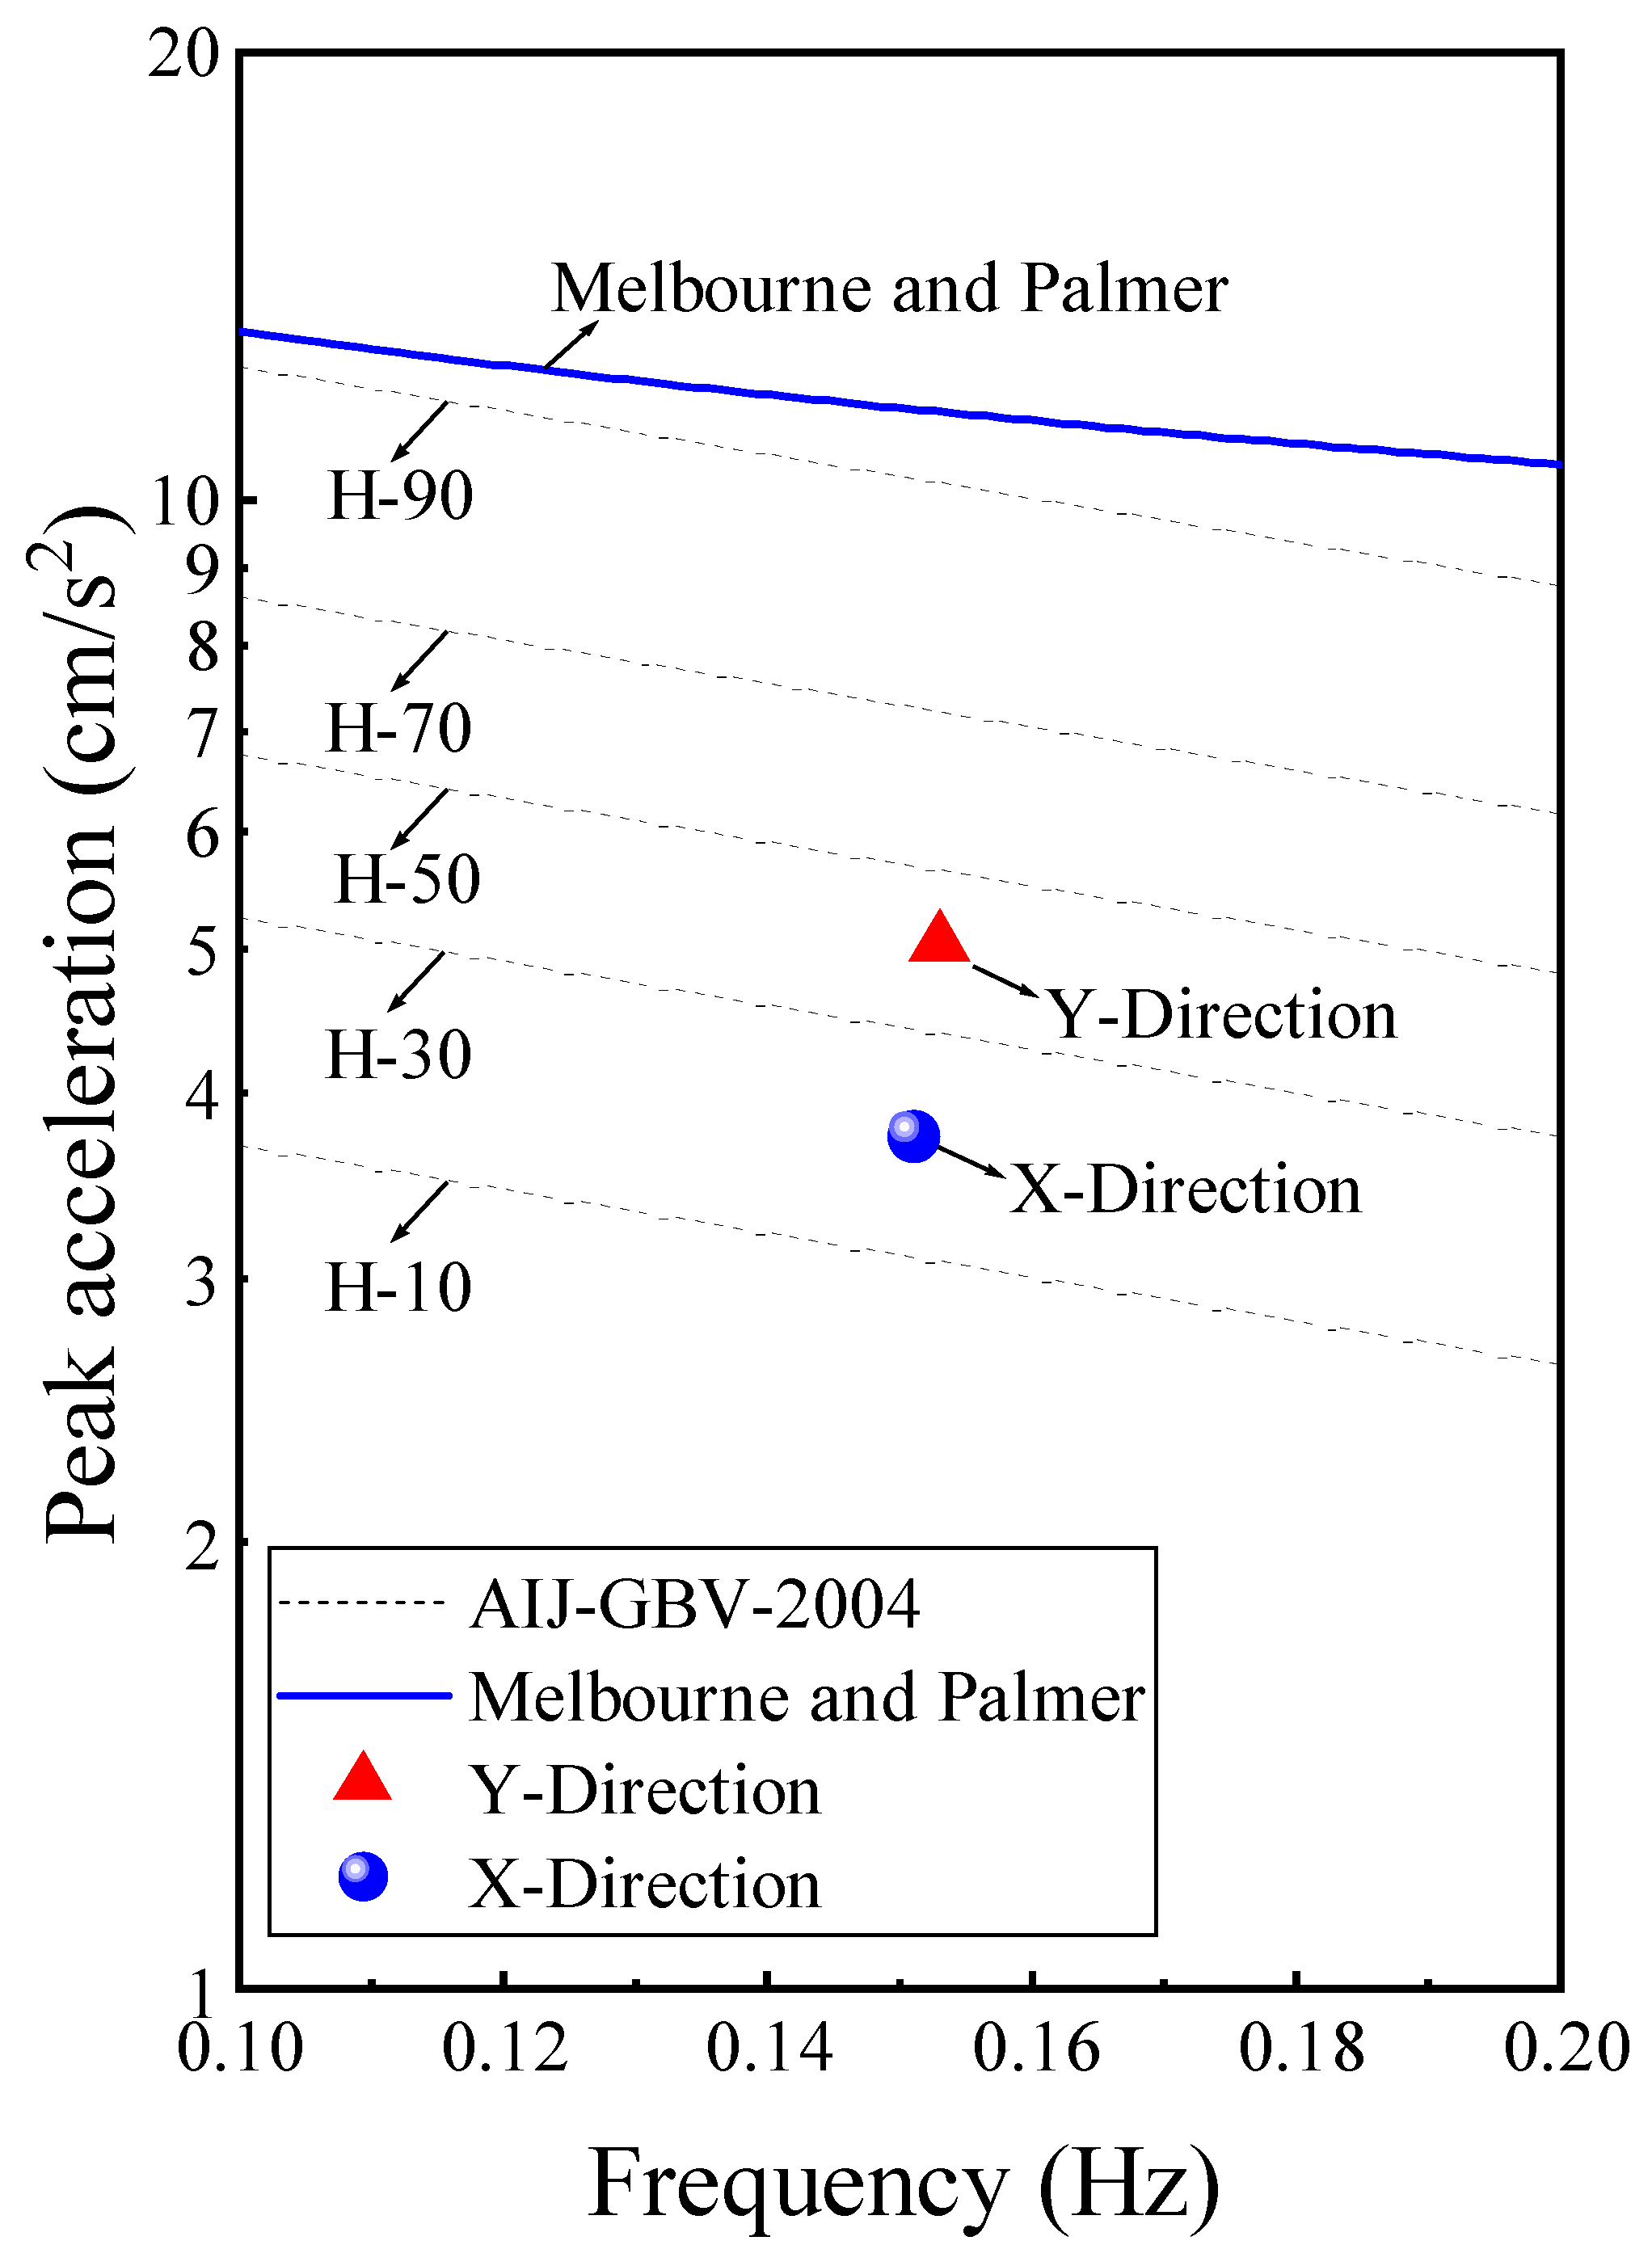
4.2. Serviceability Assessment of Super-High-Rise Buildings

Super-high-rise buildings are prone to undergoing intense vibrations when subjected to the action of strong winds. This can lead to excessive acceleration on the upper floors, which might cause discomfort to the people residing or working in the building. Hence, in the structural design of super-high-rise buildings, the aspects of serviceability and habitability hold great significance.
According to the “Technical Specification for Concrete Structures of High-rise Buildings” [35], under the condition of a return period of 10 years, the upper limit of the service comfort standard for office buildings is set at 25 cm/s2. It should be noted that China’s comfort standard does not take the structural frequency into account.
In light of this, to accurately assess the serviceability of the monitored super-high-rise building during Typhoon “Rumbia”, two commonly used comfort standards are employed. One is the comfort criterion of the upper limit of the acceleration response put forward by Melbourne and Palmer [36], and the other is the comfort standard for high-rise buildings, AIJ-GBV-2004, issued by the Architectural Institute of Japan (AIJ) in 2004 [37].
Melbourne and Palmer proposed the peak acceleration for residential comfort, and the formula is as follows:
A max = 2 ln ( f t ) ( 0.68 + ln R 5 ) exp ( 3.65 0.41 ln f )
where A max is the maximum value of the acceleration response, with the unit of cm/s2; f is the natural frequency of the building, with the unit of Hz; t is the observation duration, with the unit of seconds; and R is the return period, with the unit of years.
The AIJ-GBV-2004 standard takes the human perception threshold as the evaluation criterion and provides five perception curves, representing different perception probabilities of the occupants. Under the condition of a 1-year return period, the above two comfort standard curves were plotted, as shown in Figure 12. Figure 12 shows the maximum instantaneous accelerations corresponding to the inherent frequencies of the building along the X- and Y-axes during Typhoon “Rumbia”. The peak accelerations in both directions can be effectively confined within the upper limit range proposed by Melbourne and Palmer, meeting the requirements of the comfort standard. According to the AIJ-GBV-2004 standard, during the passage of the typhoon, about 30% of people can perceive the vibration, which is acceptable for an office building.

5. Conclusions

By analyzing the measured data on the structural wind-generated vibration response of a skyscraper in Shanghai during the occurrence of Typhoon “Rumbia”, an investigation was carried out on the amplitude correlation and variation rules of the structural dynamic characteristic parameters. The key conclusions are presented as follows:
(1)
The acceleration responses along the X- and Y-axes exhibit identical variation trends. The peak acceleration response is observed along the Y-axis, with a response magnitude of 5.033 cm/s2, while the peak acceleration response value along the X-axis is 3.736 cm/s2. Evidently, the structure predominantly vibrates along the Y-axis.
(2)
The outcomes of identifying the first two-order natural vibration frequencies of the structure using the Peak Picking method, the curve method, and the standard deviation method are largely consistent. This suggests that both the curve and the standard deviation methods are capable of precisely identifying the modal parameters of the structure. The specific identification results are as follows: The first-order natural vibration frequencies of the building in the X- and Y-directions are approximately 0.151 Hz and 0.153 Hz, respectively, and the second-order natural vibration frequency is around 0.456 Hz. In the absence of the influence of the two active mass-tuned dampers, the first-order and second-order damping ratios of the structure in both directions are less than 1.000%.
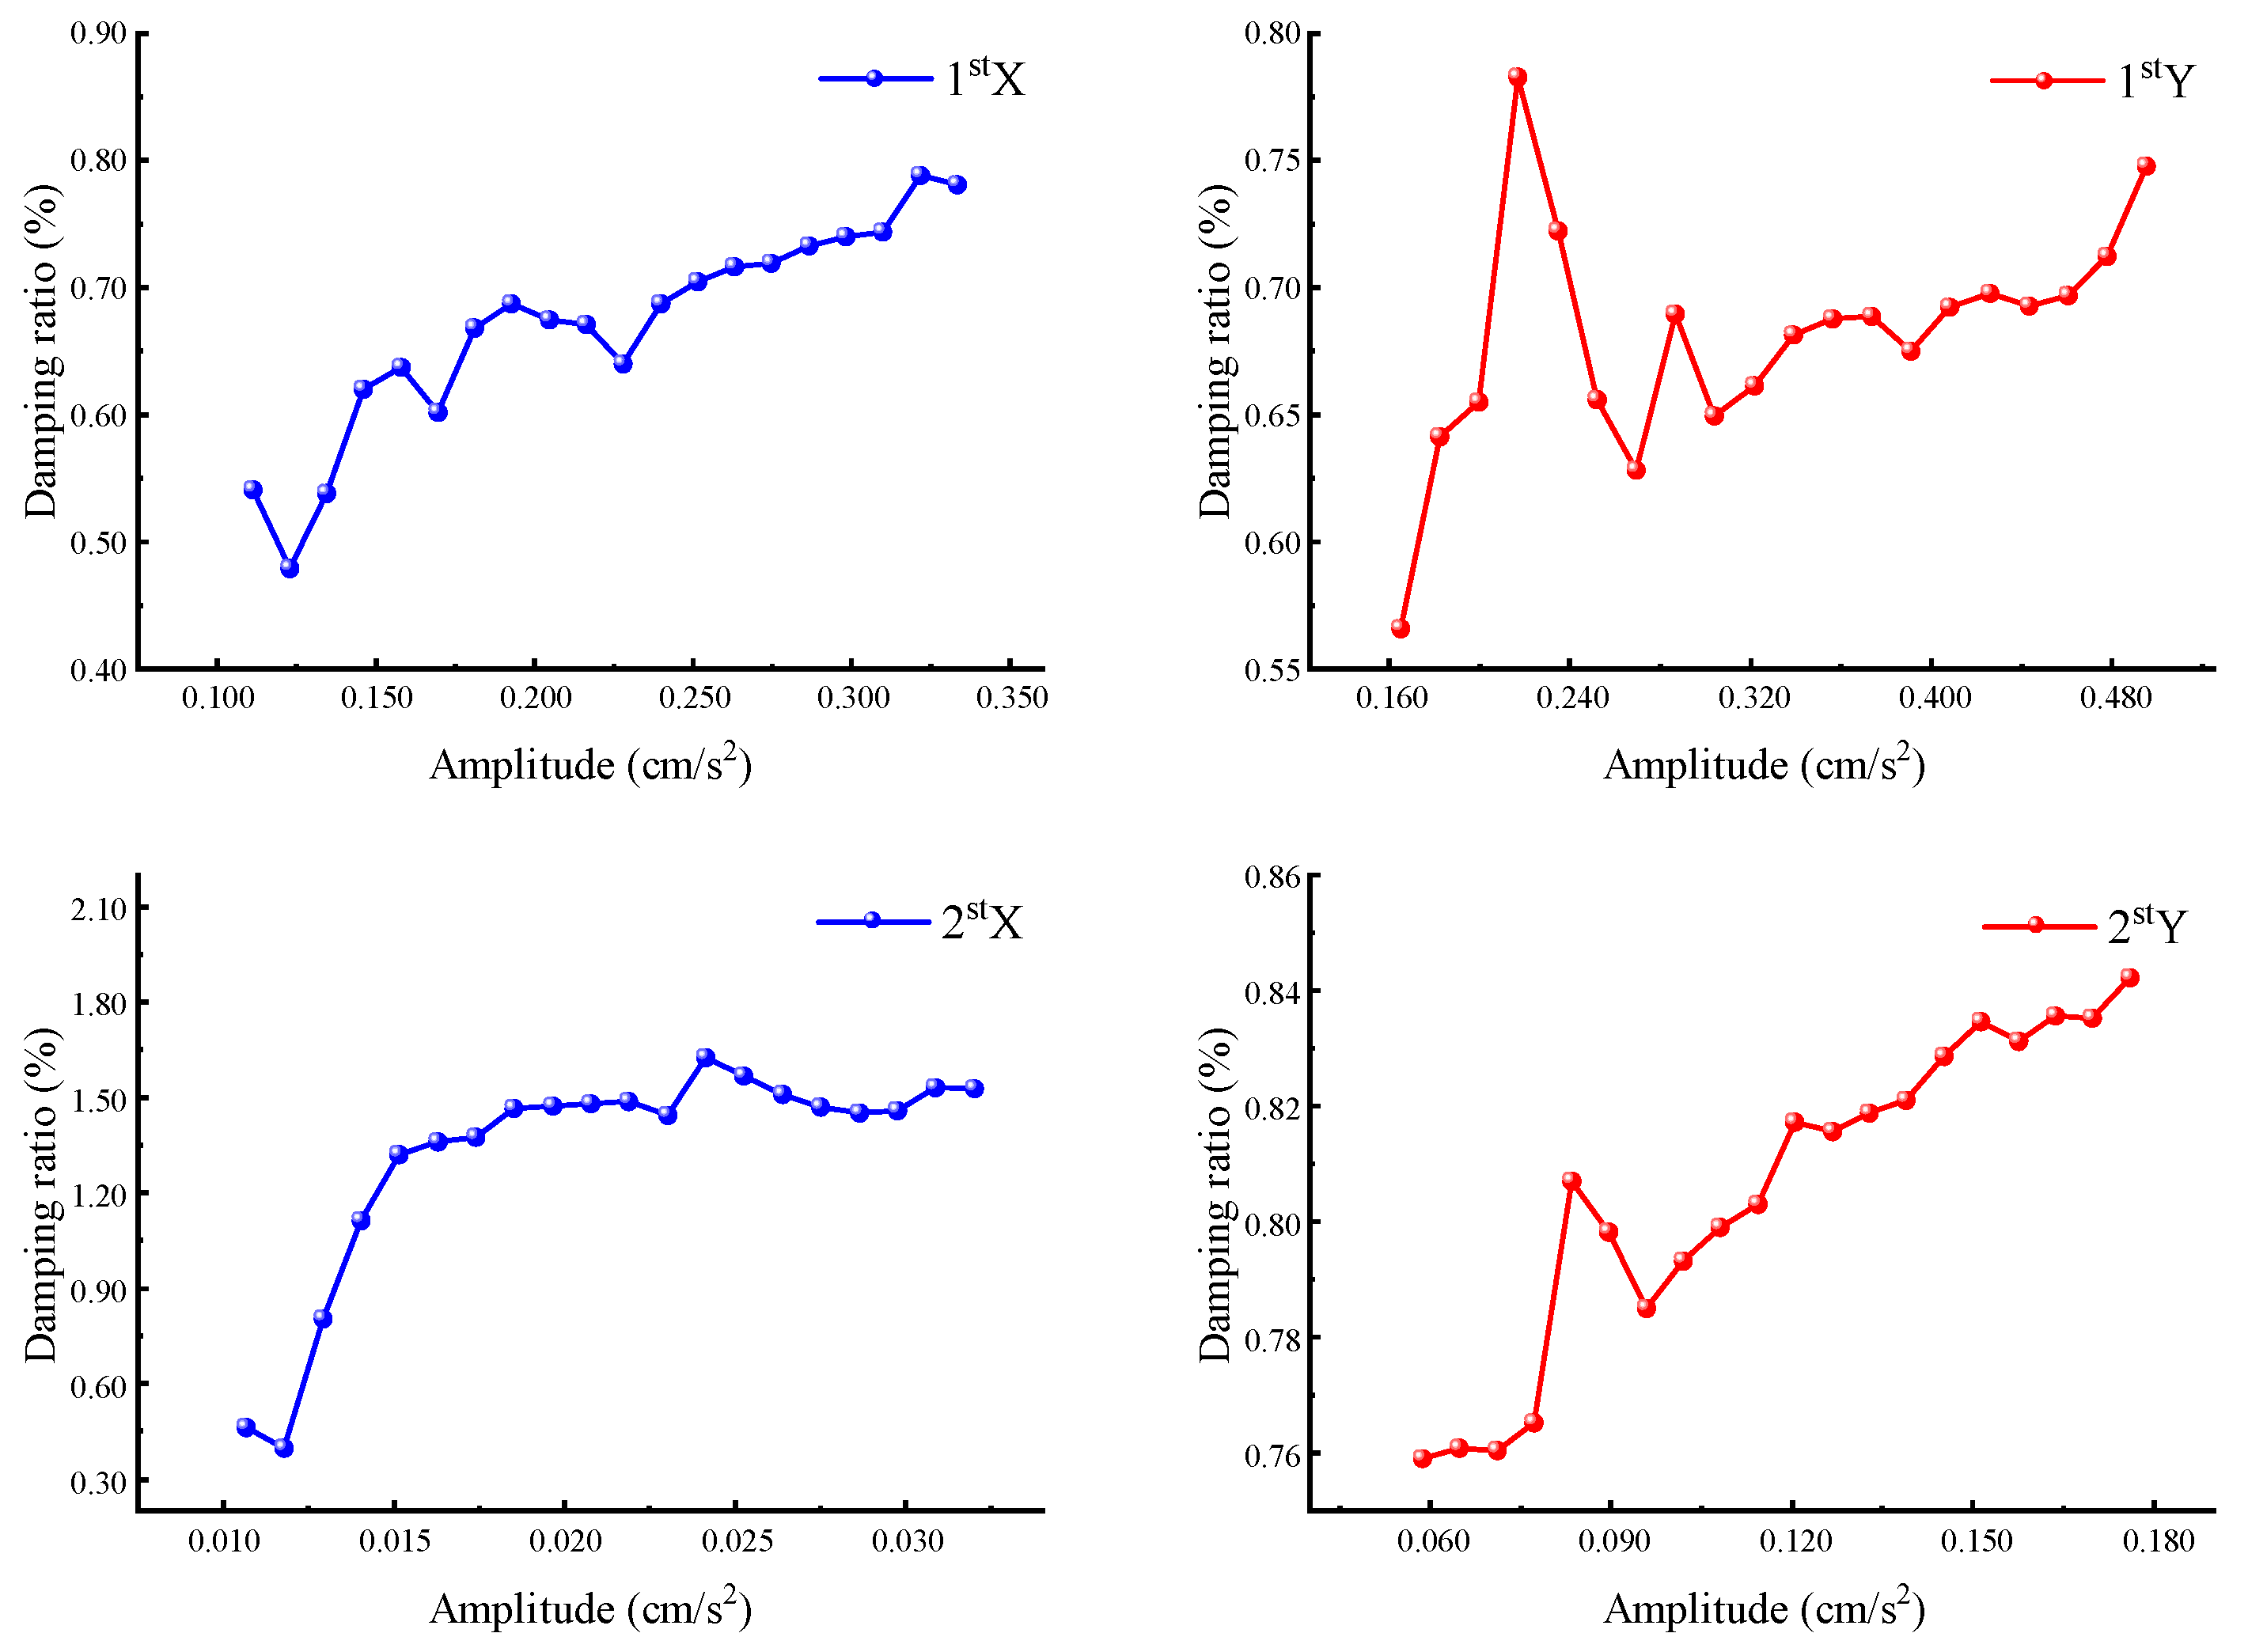
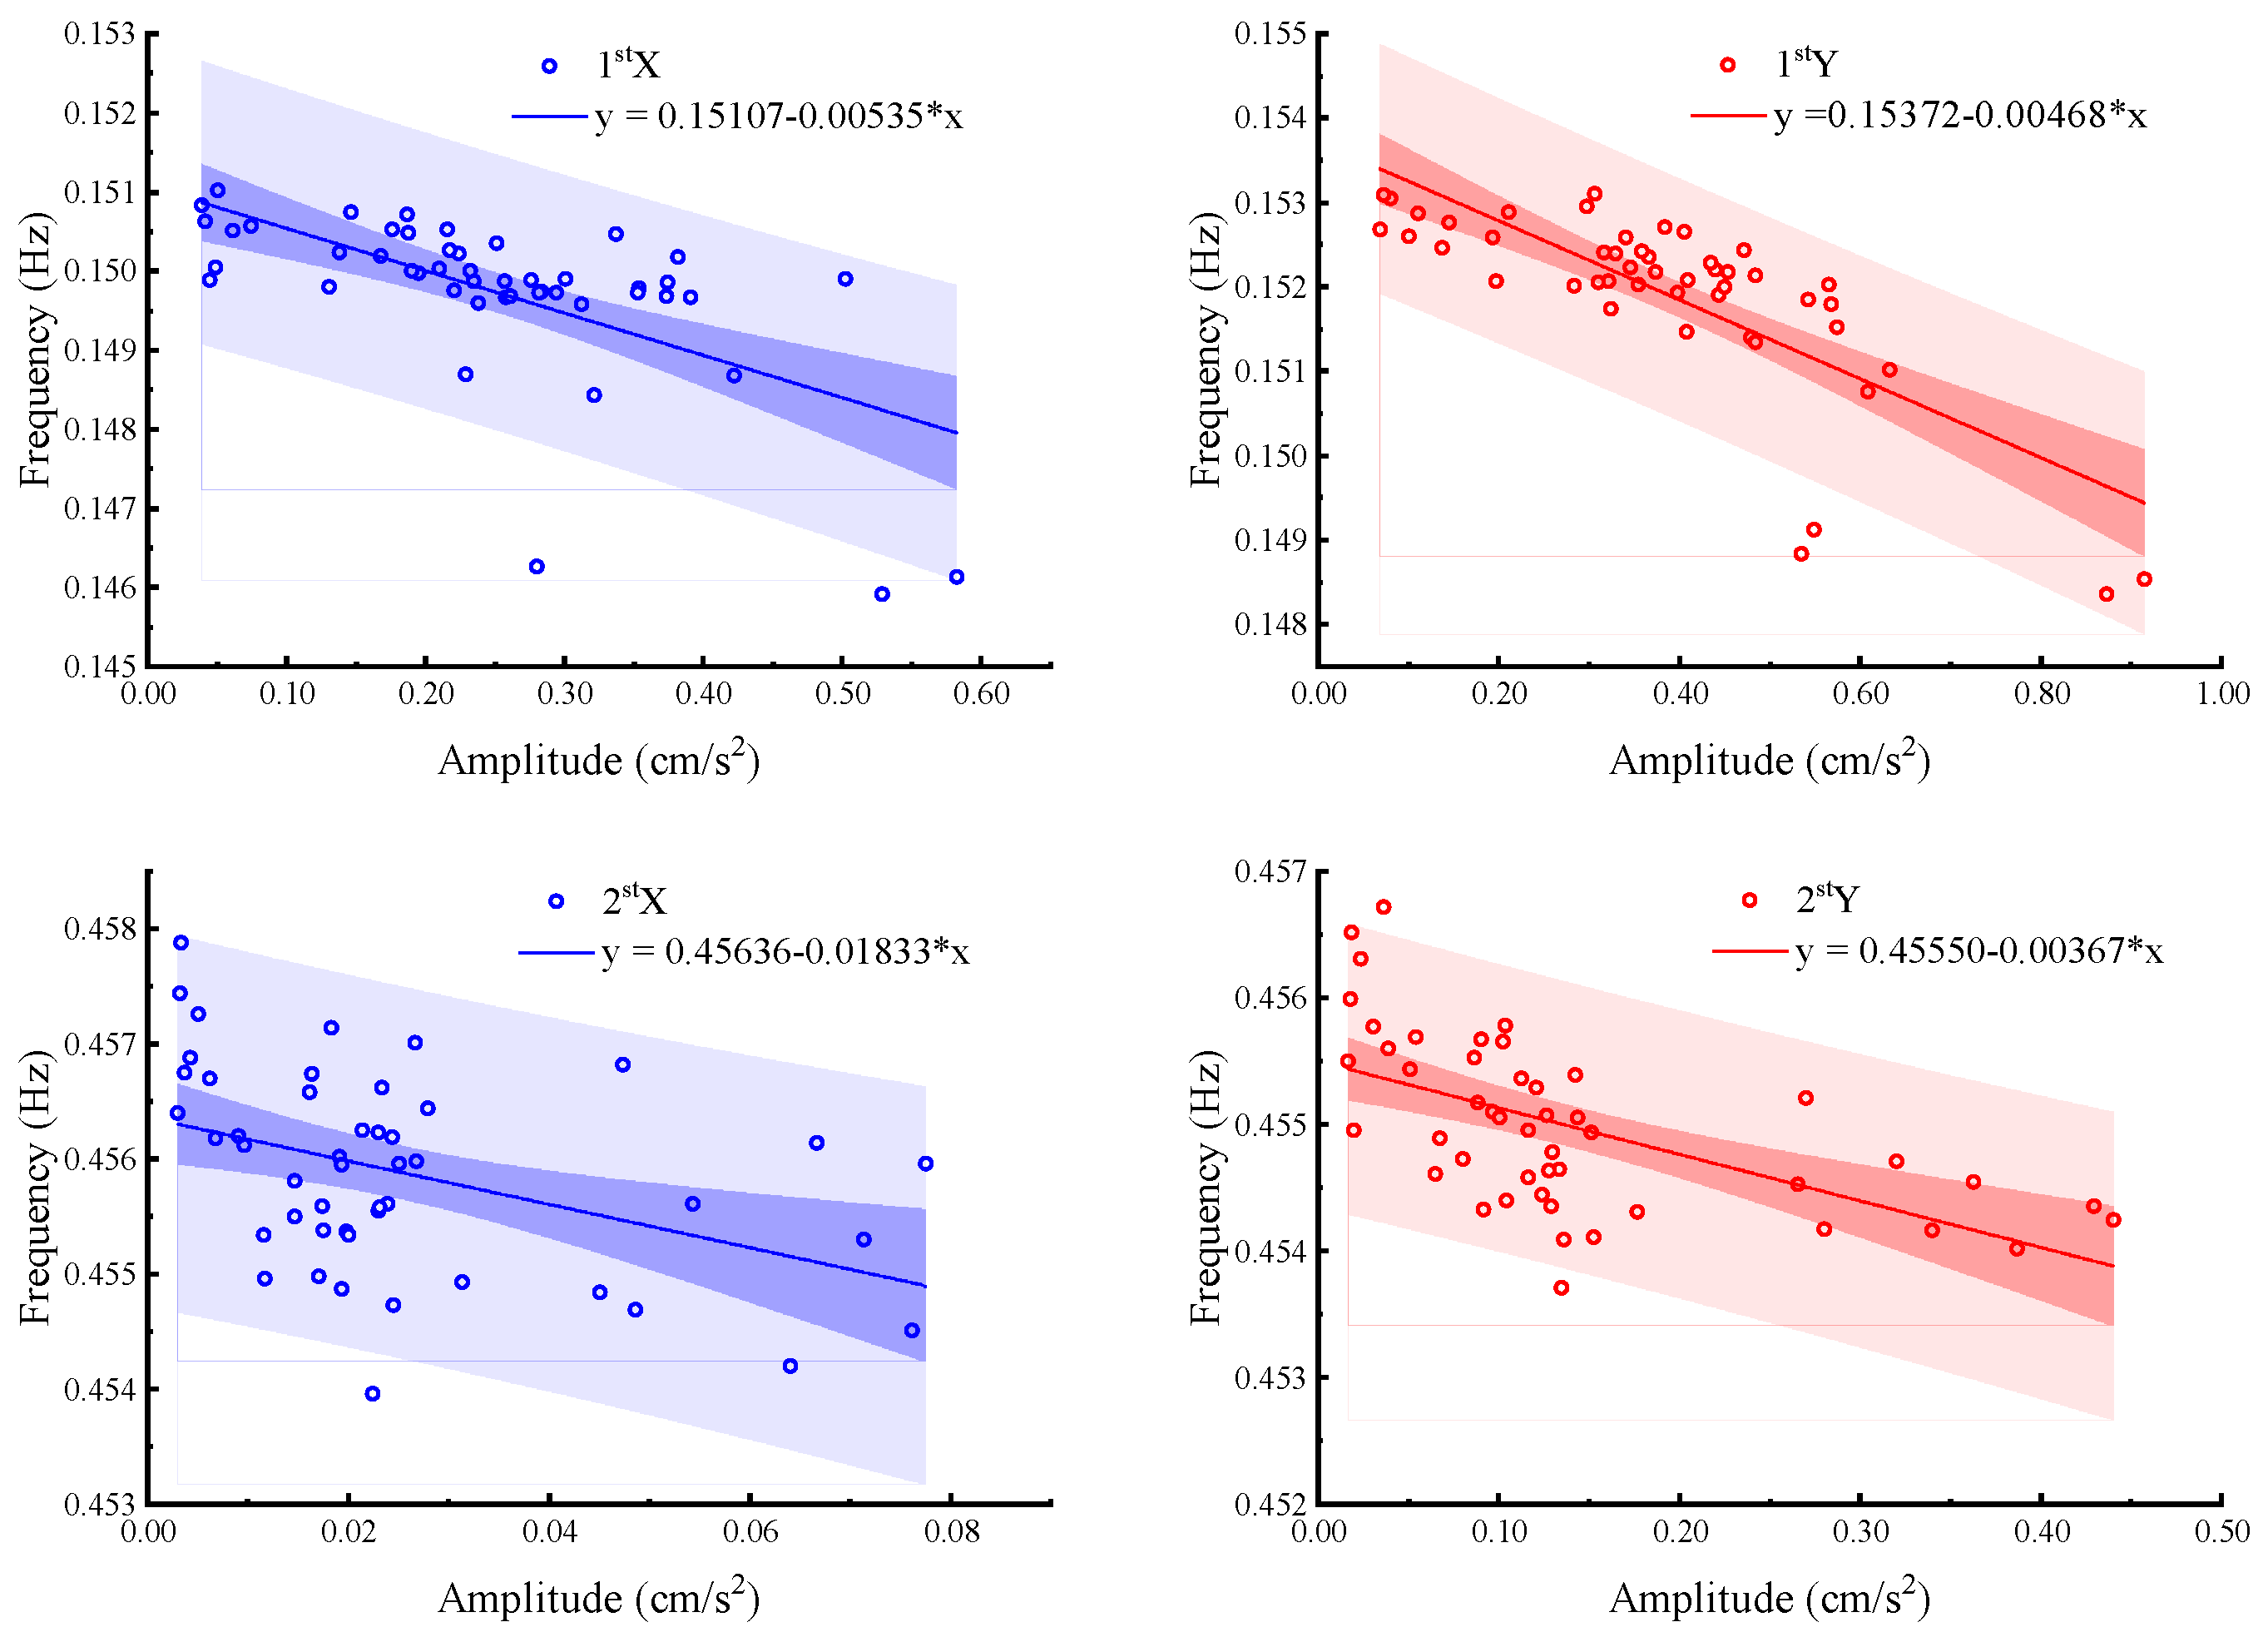
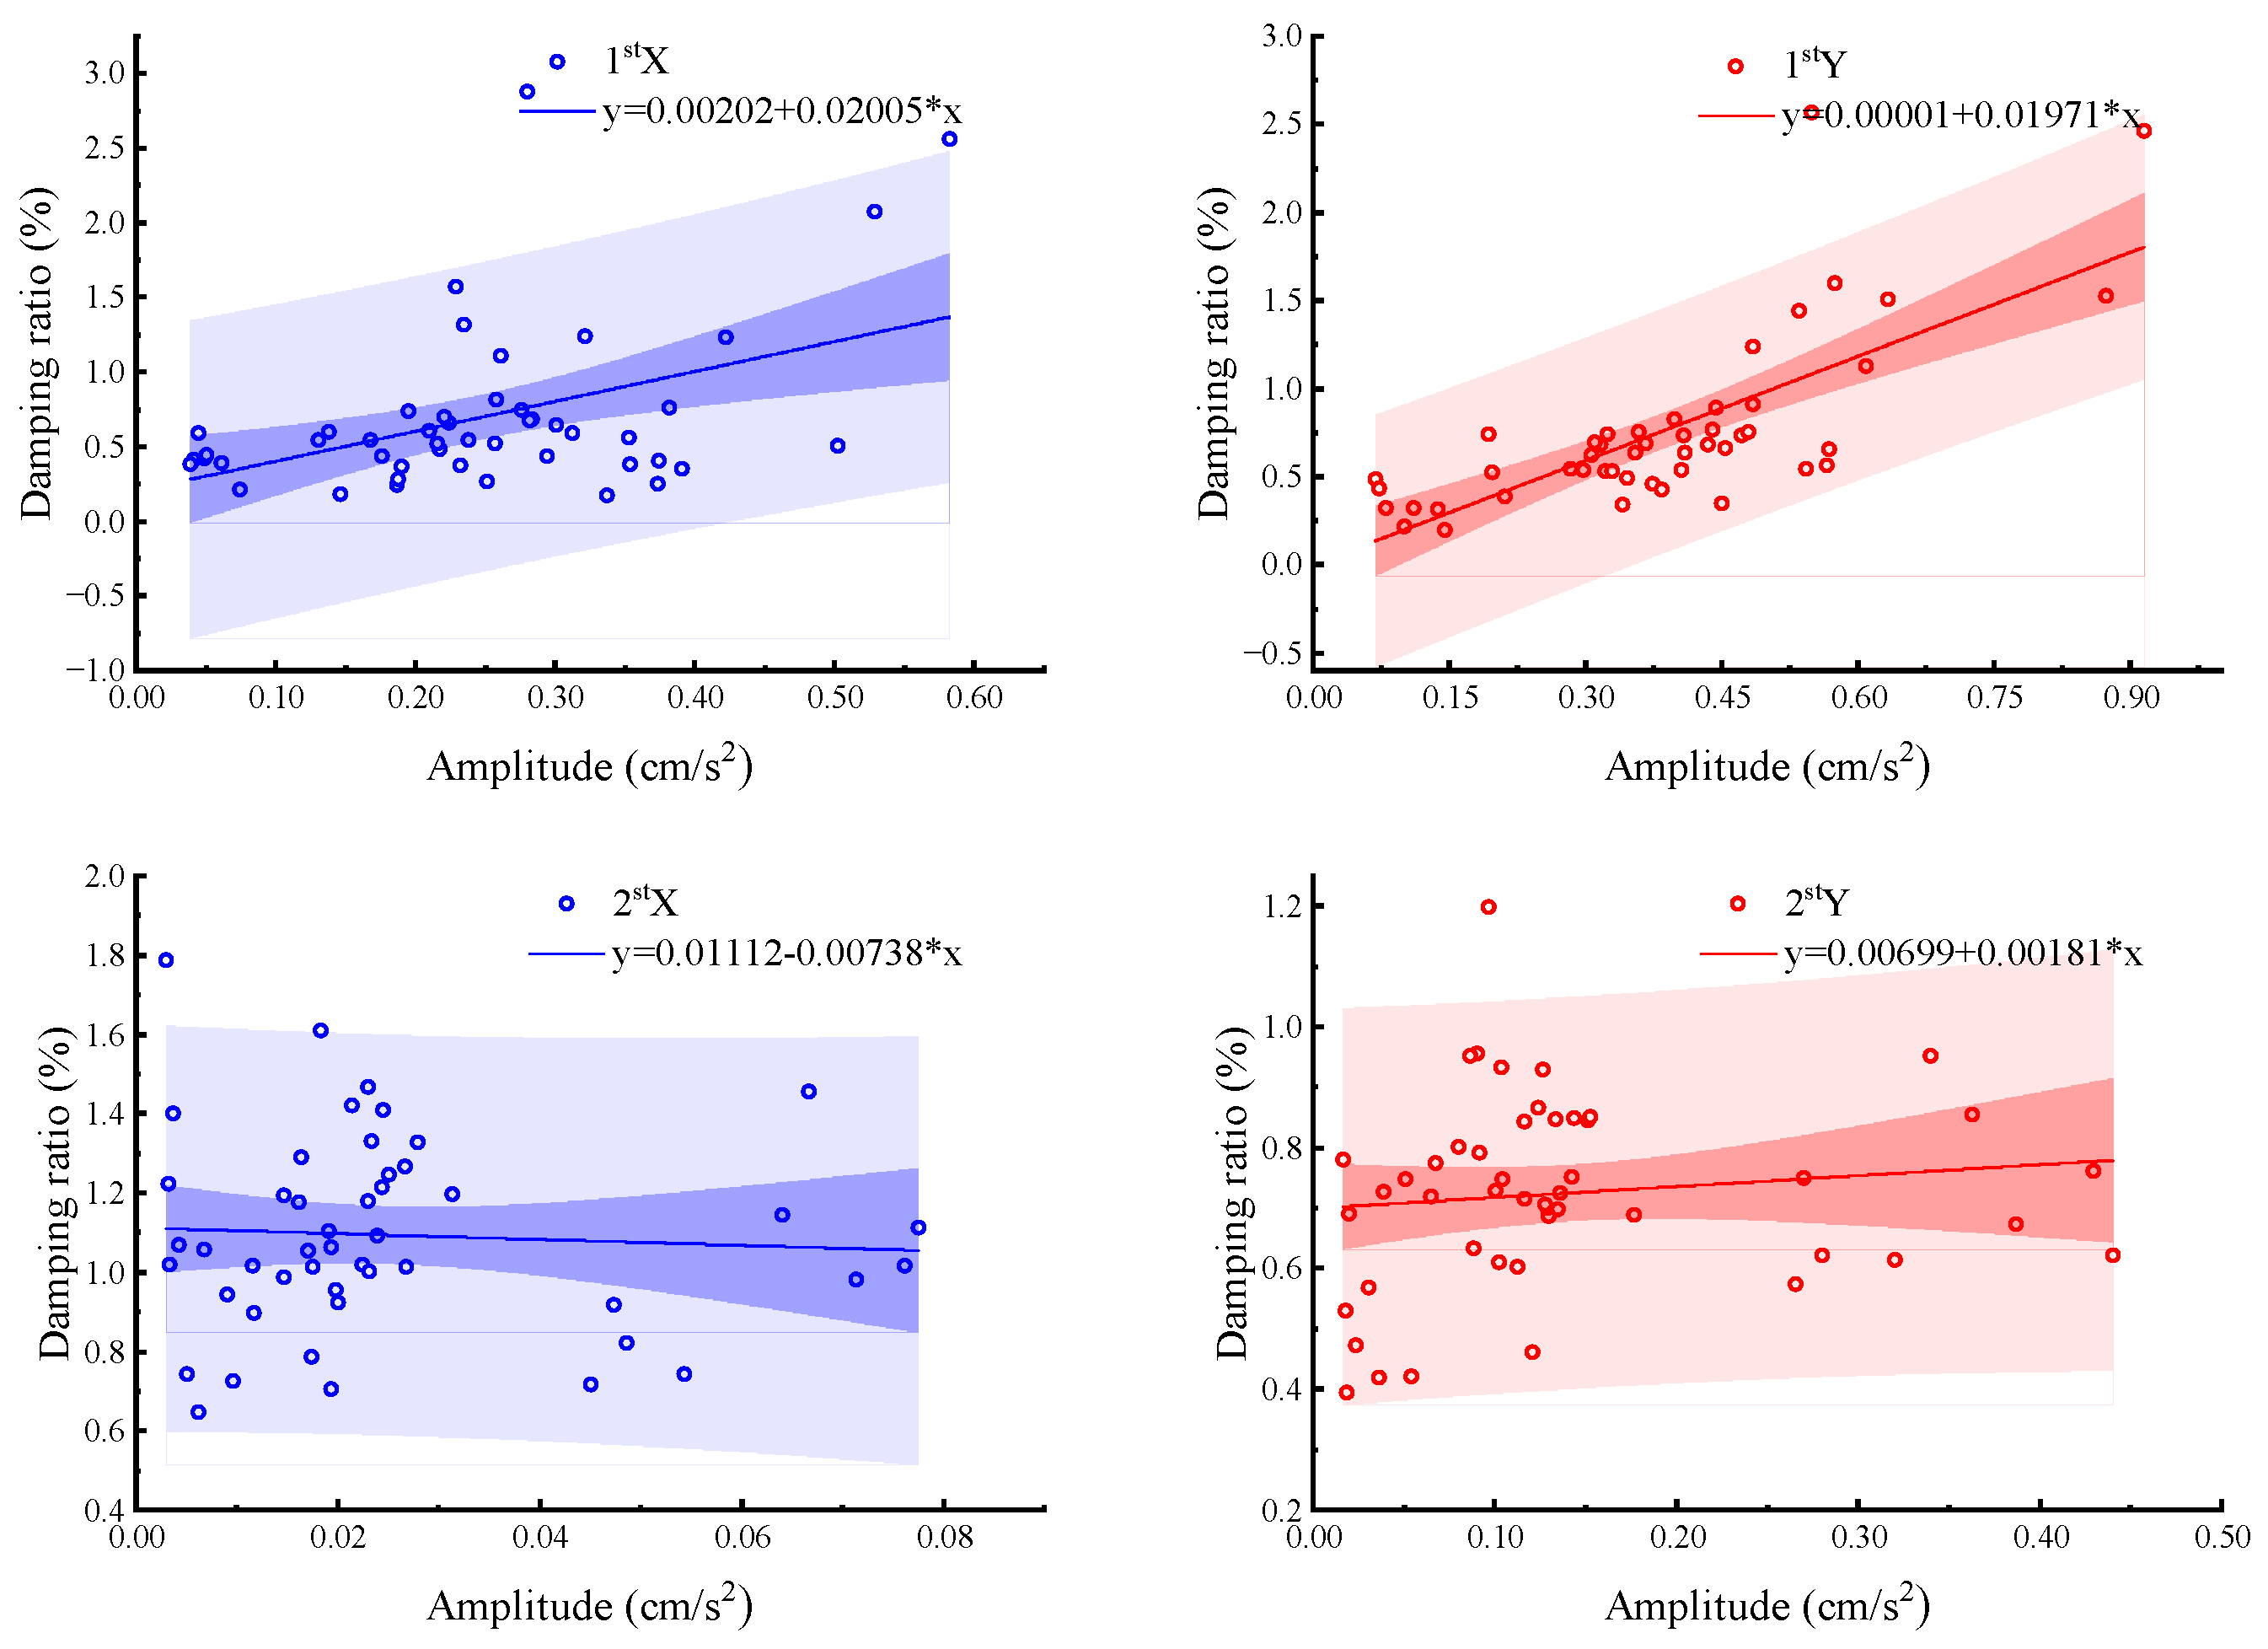
(3)
The results derived from the curve method and the standard deviation method demonstrate the amplitude dependence of the natural vibration frequencies and damping ratios of the building. The first two-order natural vibration frequencies in both directions of the structure decline as the amplitude increases, whereas the first two-order damping ratios rise with the growth of the amplitude.
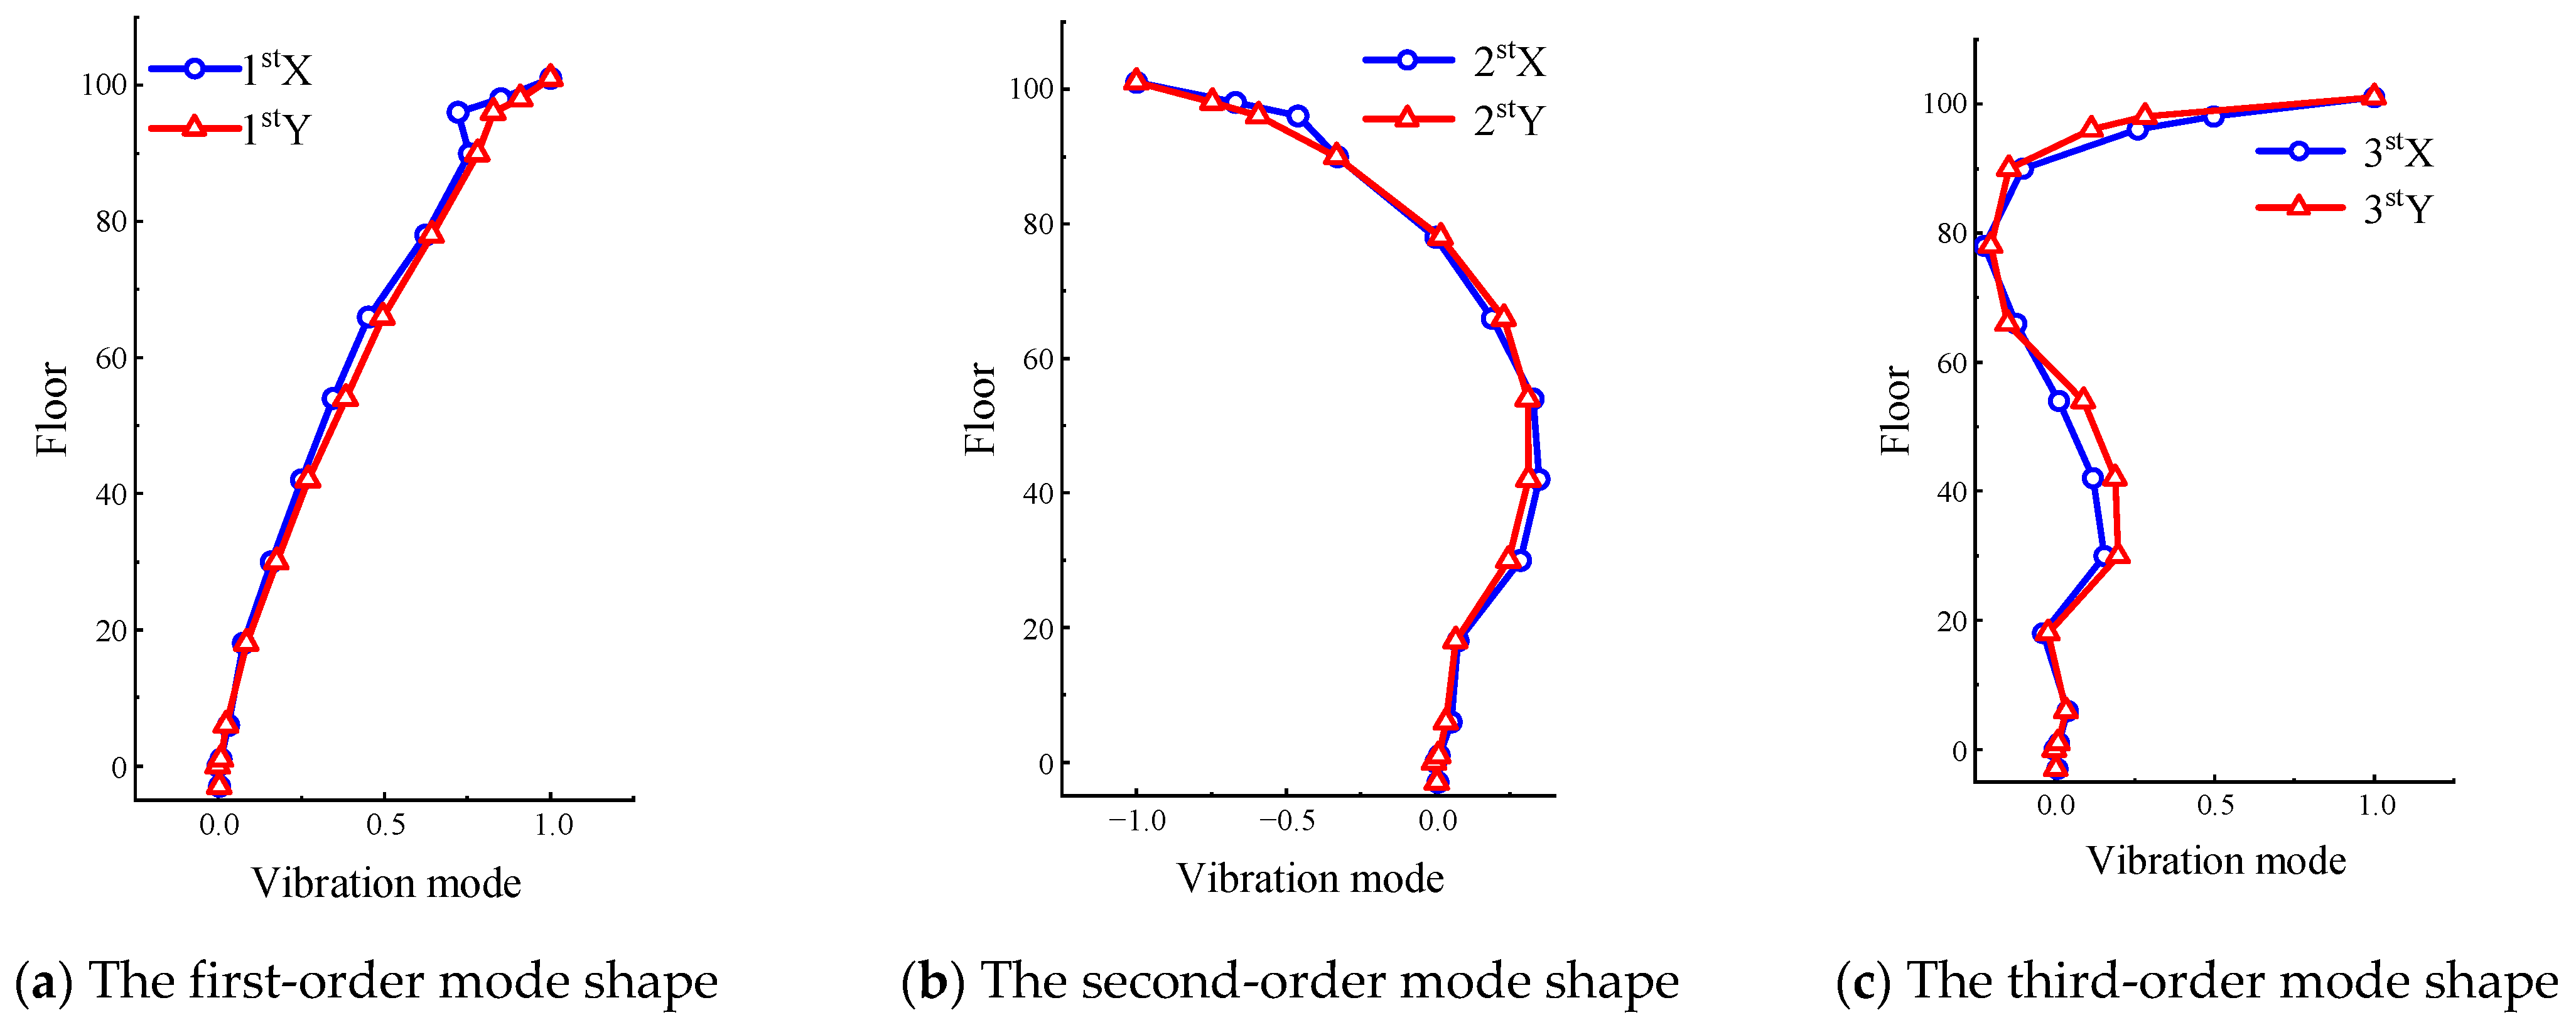
(4)
According to the identification results of the mode shapes of the super-high-rise building, it can be seen that the mode shapes of the structure in both directions gradually increase as the number of floors goes up, and the growth tendency of the third-order mode shape is more prominent.
(5)
Based on the on-site measured acceleration response and by applying two commonly used comfort standards, it can be concluded that under the effect of Typhoon “Rumbia”, the serviceability of the building complies with the requirements of the comfort standard.
It is worth noting that this study assumes external loads to be stationary Gaussian white noise in the identification of structural dynamic parameters. However, in real engineering scenarios, external excitations such as typhoons often exhibit non-stationary characteristics. Therefore, future research should focus on developing new parameter identification theories and methods under non-stationary external load conditions.

Author Contributions

Methodology, Y.D. and L.L.; Conceptualization, L.L.; Resources, G.X.; Investigation, Y.D. and X.W.; Writing—original draft, Y.D.; Supervision, X.W.; Validation, P.Z. All authors have read and agreed to the published version of the manuscript.

Funding

This research received no external funding.

Data Availability Statement

All data, models, and codes produced or utilized during the study are included in the submitted publication.

Conflicts of Interest

The authors declare no conflicts of interest.

References

  1. Su, J.; Xia, Y.; Weng, S. Review on field monitoring of high-rise structures. Struct. Control Health Monit. 2020, 27, e2629. [Google Scholar] [CrossRef]
  2. Ohkuma, T.; Marukawa, H.; Niihori, Y.; Kato, N. Full-scale measurement of wind pressures and response accelerations of a high-rise building. J. Wind Eng. Ind. Aerodyn. 1991, 38, 185–196. [Google Scholar] [CrossRef]
  3. Balendra, T.; Ma, Z.; Tan, C.L. Design of tall residential buildings in Singapore for wind effects. Wind Struct. 2003, 6, 221–248. [Google Scholar] [CrossRef]
  4. Wan, J.W.; Li, Q.S.; Han, X.L.; Xu, K. Investigation of structural responses and dynamic characteristics of a supertall building during Typhoon Kompasu. J. Wind Eng. Ind. Aerodyn. 2022, 230, 105209. [Google Scholar] [CrossRef]
  5. He, Y.; Liu, Y.; Wu, M.; Fu, J.; He, Y. Amplitude dependence of natural frequency and damping ratio for 5 supertall buildings with moderate-to-strong typhoon-induced vibrations. J. Build. Eng. 2023, 78, 107589. [Google Scholar] [CrossRef]
  6. Ibrahim, R.A. Engineering applications of correlation and spectral analysis-Julius S. Bendat and Allan G. Piersol. AIAA J. 1993, 31, 2190–2191. [Google Scholar] [CrossRef]
  7. Brinker, R.; Zhang, L.; Andersen, P. Modal identification from ambient responses using frequency domain decomposition. In Proceedings of the 18th International Modal Analysis Conference (IMAC), San Antonio, TX, USA, 7–10 February 2000; Volume 1, pp. 625–630. [Google Scholar]
  8. Brinker, R.; Ventura, C.E.; Andersen, P. Damping estimation by frequency domain decomposition. In Proceedings of the IMAC 19: A Conference on Structural Dynamics, Society for Experimental Mechanics, Kissimmee, FL, USA, 5–8 February 2001; pp. 698–703. [Google Scholar]
  9. Ha, J.R. Method and Apparatus for Measuring the Damping Characteristics of a Structure. U.S. Patent US3620069A, 16 November 1971. [Google Scholar]
  10. James, G.H., III; Carne, T.G.; Lauffer, J.P. The natural excitation technique (NExT) for modal parameter extraction from operating wind turbines. Int. J. Anal. Exp. Modal Anal. 1993. [Google Scholar] [CrossRef]
  11. Mostaeei, H.; Mostofinejad, D.; Ghamami, M.; Wu, C. Fully automated operational modal identification of regular and irregular buildings with ensemble learning. Structures 2023, 58, 105439. [Google Scholar] [CrossRef]
  12. Juang, J.N.; Pappa, R.S. An eigensystem realization algorithm for modal parameter identification and model reduction. J. Guid. Control Dyn. 1985, 8, 620–627. [Google Scholar] [CrossRef]
  13. Ruzzene, M.; Fasana, A.; Garibaldi, L.; Piombo, B. Natural frequencies and dampings identification using wavelet transform: Application to real data. Mech. Syst. Signal Process. 1997, 11, 207–218. [Google Scholar] [CrossRef]
  14. Huang, N.E. Introduction to the Hilbert–Huang transform and its related mathematical problems. In Hilbert-Huang Transform and Its Applications; Word Scientific: Singapore, 2005; pp. 1–26. [Google Scholar]
  15. Tamura, Y.; Suganuma, S. Evaluation of amplitude-dependent damping and natural frequency of buildings during strong winds. J. Wind Eng. Ind. Aerodyn. 1996, 59, 115–130. [Google Scholar] [CrossRef]
  16. Li, Q.S.; Wu, J.R.; Fu, J.Y.; Li, Z.N. Wind effects on the world’s tallest reinforced concrete building. Proc. Inst. Civ. Eng. Struct. Build. 2010, 163, 97–110. [Google Scholar] [CrossRef]
  17. Xu, Y.L.; Chen, S.W.; Zhang, R.C. Modal identification of Di Wang Building under typhoon York using the Hilbert–Huang transform method. Struct. Des. Tall Spec. Build. 2003, 12, 21–47. [Google Scholar] [CrossRef]
  18. Li, Q.S.; Xiao, Y.Q.; Wong, C.K.; Jeary, A.P. Field measurements of typhoon effects on a super tall building. Eng. Struct. 2004, 26, 233–244. [Google Scholar] [CrossRef]
  19. Li, Q.S.; Wu, J.R. Correlation of dynamic characteristics of a super-tall building from full-scale measurements and numerical analysis with various finite element models. Earthq. Eng. Struct. Dyn. 2004, 33, 1311–1336. [Google Scholar] [CrossRef]
  20. Li, Q.S.; Xiao, Y.Q.; Wong, C.K. Full-scale monitoring of typhoon effects on super tall buildings. J. Fluids Struct. 2005, 20, 697–717. [Google Scholar] [CrossRef]
  21. Li, Q.S.; Xiao, Y.Q.; Fu, J.Y.; Li, Z.N. Full-scale measurements of wind effects on the JinMao building. J. Wind Eng. Ind. Aerodyn. 2007, 95, 445–466. [Google Scholar] [CrossRef]
  22. He, Y.C.; Li, Q. Dynamic responses of a 492-m-high tall building with active tuned mass damping system during a typhoon. Struct. Control Health Monit. 2014, 21, 705–720. [Google Scholar] [CrossRef]
  23. Wu, J.; Xu, H.J.; Zhang, Q.L. Dynamic analysis of parameters of Shanghai tower in normal wind and Typhoon. J. Tongji Univ. (Nat. Sci.) 2019, 47, 1100–1105. (In Chinese) [Google Scholar]
  24. Huang, N.E.; Shen, Z.; Long, S.R.; Wu, M.C.; Shih, H.H.; Zheng, Q.; Yen, N.-C.; Tung, C.C.; Liu, H.H. The empirical mode decomposition and the Hilbert spectrum for nonlinear and nonstationary time series analysis. Proc. R. Soc. London Ser. A Math. Phys. Eng. Sci. 1998, 454, 903–995. [Google Scholar] [CrossRef]
  25. Huang, Z.; Gu, M. Envelope random decrement technique for identification of nonlinear damping of tall buildings. J. Struct. Eng. 2016, 142, 04016101. [Google Scholar] [CrossRef]
  26. Chen, G.; Wang, Z. A signal decomposition theorem with Hilbert transform and its application to narrowband time series with closely spaced frequency components. Mech. Syst. Signal Process. 2012, 28, 258–279. [Google Scholar] [CrossRef]
  27. Hu, J.; Li, Z.; Zhao, Z. Full-Scale Measurements of Translational and Torsional Dynamics Characteristics of a High-Rise Building during Typhoon Sarika. Materials 2022, 15, 493. [Google Scholar] [CrossRef] [PubMed]
  28. Li, Z.N.; Pan, Y.Y.; Sang, C.; Shi, W. Study on wind-generated vibration characteristics of coastal high-rise building in Xiamen. J. Build. Struct. 2013, 34, 22–29. (In Chinese) [Google Scholar]
  29. Li, X.; Yu, X.; Li, Q.S.; Allsop, A. Field measurement and validation of structural dynamic parameters of skyscrapers under super typhoon excitation. J. Civ. Struct. Health Monit. 2021, 11, 609–627. [Google Scholar] [CrossRef]
  30. Jeary, A.P. The description and measurement of nonlinear damping in structures. J. Wind Eng. Ind. Aerodyn. 1996, 59, 103–114. [Google Scholar] [CrossRef]
  31. Huang, Y.J.; Gu, M.; Huang, Z.F. Field measurement of wind and acceleration on Shanghai World Financial Center. J. Tongji Univ. (Nat. Sci.) 2017, 45, 821–826. (In Chinese) [Google Scholar]
  32. Quan, Y.; Wang, S.; Gu, M.; Kung, J. Field Measurement of Wind Speeds and Wind-generated Responses atop the Shanghai World Financial Center under Normal Climate Conditions. Math. Probl. Eng. 2013, 2013, 1–14. [Google Scholar] [CrossRef]
  33. Chen, Z.; Zhou, J.; Zhou, X.; Wang, X.; Zhao, P. Dynamic characteristics of a super high-rise building using a smart monitoring system. World Transp. Conv. 2018, 1–12. [Google Scholar]
  34. Chen, J.; Chen, Y.; Peng, Y.; Zhu, S.; Beer, M.; Comerford, L. Stochastic harmonic function based wind field simulation and wind-generated reliability of super high-rise buildings. Mech. Syst. Signal Process. 2019, 133, 106264. [Google Scholar] [CrossRef]
  35. JGJ 3-2010; Technical Specification for Concrete Structures of Tall Building. China Architecture & Building Press: Beijing, China, 2010. (In Chinese)
  36. Melbourne, W.H.; Palmer, T.R. Accelerations and comfort criteria for buildings undergoing complex motions. J. Wind Eng. Ind. Aerodyn. 1992, 41, 105–116. [Google Scholar] [CrossRef]
  37. Tamura, Y.; Kawai, H.; Uematsu, Y.; Okadad, H.; Ohkumae, T. Documents for Wind Resistant Design of Buildings in Japan. Workshop on Regional Harmonization of Wind Loading and Wind Environmental Specifications in Asia-Pacific Economies (APEC-WW). 2004, pp. 61–84. Available online: https://www.google.com/url?sa=t&source=web&rct=j&opi=89978449&url=http://www.apwenet.com/Report/2004/JAPANa.pdf&ved=2ahUKEwitz-uH9-yMAxWM4zQHHaK9Ku8QFnoECBkQAQ&usg=AOvVaw1iMQAVfCZbV_WLGZR0XLkB (accessed on 20 February 2025).
Figure 1. Typhoon path.
Buildings 15 01448 g001
Figure 2. Actual view of the super-tall building and the layout of its measurement points.
Buildings 15 01448 g002
Figure 3. Floor plan of the building.
Buildings 15 01448 g003
Figure 4. The acceleration histories and trajectories of the super-tall building on the top floor.
Buildings 15 01448 g004
Figure 5. Flowcharts of the curve method and the standard deviation method.
Buildings 15 01448 g005
Figure 6. Acceleration power spectral density curve.
Buildings 15 01448 g006
Figure 7. Natural frequency of the curve method.
Buildings 15 01448 g007
Figure 8. Damping ratio of the curve method.
Buildings 15 01448 g008
Figure 9. Natural frequency based on the standard deviation method.
Buildings 15 01448 g009
Figure 10. Damping ratio based on the standard deviation method.
Buildings 15 01448 g010
Figure 11. Comparison of the mode shapes of the building.
Buildings 15 01448 g011
Figure 12. Comfort curve and measured peak acceleration of buildings.
Buildings 15 01448 g012
Table 1. Comparison of self-oscillation frequencies under the excitation of Typhoon “Rumbia”.
/The First-Order Natural Vibration Frequency (Hz)The Second-Order Natural Vibration Frequency (Hz)
/X-DirectionY-DirectionX-DirectionY-Direction
Peak Picking Method0.15250.15250.54900.5185
Curve Method0.14990.15200.46300.4558
Standard Deviation Method0.15110.15370.45640.4555
YaJun Huang [31]0.15130.1535//
Yun Cheng He [22]0.15100.15300.46500.4660
Yong Quan [32]0.15300.1550//
ZengShun Chen [33]0.15110.1526//
Table 2. Comparison of damping ratios under the excitation of Typhoon “Rumbia”.
/The First-Order Natural Vibration Frequency (Hz) (%)The First-Order Natural Vibration Frequency (Hz) (%)
/X-DirectionY-DirectionX-DirectionY-Direction
Curve Method0.7880.7481.5270.842
Standard Deviation Method0.176~2.8760.197~2.5650.646~1.7880.395~1.198
YaJun Huang [31]0.3350.378//
Yun Cheng He [22]2.3102.0900.6750.753
Yong Quan [32]1.6002.400//
ZengShun Chen [33]0.6510.688//
Disclaimer/Publisher’s Note: The statements, opinions and data contained in all publications are solely those of the individual author(s) and contributor(s) and not of MDPI and/or the editor(s). MDPI and/or the editor(s) disclaim responsibility for any injury to people or property resulting from any ideas, methods, instructions or products referred to in the content.

