Abstract
As environmentally friendly pile foundations with small diameters and higher slenderness ratios, micropiles are widely used in fields such as transmission line engineering and building reinforcement. However, the available research has primarily focused on their bearing performance under compressive and horizontal loads, and there is insufficient research on predicting the uplift capacity of micropiles. This study investigated the load transfer mechanism and the behavior of the surrounding soil using model tests and finite element simulations. The ultimate uplift capacities and load distributions of micropiles with different slenderness ratios were analyzed. The results show that as the slenderness ratio increases, the ultimate uplift capacity of a pile gradually increases. However, this rate of increase diminishes gradually. Additionally, the restraining effect and range of the surrounding soil at the lower part of the pile are enhanced. The critical embedment depth of the micropiles shifts further away from the pile tip as the slenderness ratio increases. Finally, this study proposed a novel modification to Shanker’s model of incorporating variations in the critical embedment depth based on the slenderness ratios. Subsequently, a modified model for the ultimate uplift capacity of micropiles was proposed and validated using a model test. The proposed model effectively predicts the uplift bearing capacity of micropiles with high slenderness ratios, which is practical for engineering applications.
1. Introduction
Against the background of rapid urbanization, the construction and reinforcement of infrastructure have imposed higher demands on the quality and time costs of ground improvements. As a new type of environmentally friendly foundation, the diameter of a micropile is usually less than 300 mm, and its slenderness ratio is greater than 30 [1,2,3]. Micropiles not only have the advantages of small pile diameters, lightweight construction equipment, short construction periods, and low impacts on the surrounding environment but can also be adapted to inaccessible and unfavorable site conditions, such as those located in hilly or mountainous areas. Consequently, micropiles have been widely applied in various fields, including transmission line projects [4,5,6] and civil engineering [7].
Numerous scholars have conducted research on the bearing performance of micropiles. As a load transfer structure for foundations, micropiles often bear compressive, uplift, and lateral loads [2,8,9]. Borthakur et al. [10] established an empirical method for calculating the bearing capacity of micropile groups using experiments and data analyses, providing an important reference for engineering design. Li et al. [11] found that an uplift load created steep load–displacement curves, leading to risks of sudden damage, through field tests and numerical simulations of micropile groups in alpine mountains. Tsukada et al. [12] introduced a system effect index to quantitatively evaluate the enhancement effect of micropiles on foundations’ bearing capacities. Jiang et al. [13] developed a three-dimensional numerical model based on field tests and centrifuge tests for analyzing the bearing capacity characteristics of waveform micropiles. Their numerical analysis revealed the load transfer mechanism of the waveform micropiles, and they proposed a new equation for bearing capacity predictions. Elsawwaf et al. [14] investigated the behavior of inclined micropile raft foundations under combined vertical and lateral loads using finite element models calibrated through field tests. Their results showed that increasing the vertical load continuously reduces the lateral bearing capacity of micropile raft foundations. Lee et al. [15] explored the reinforcement effect of micropiles and the bearing characteristics of micropile raft foundations by varying the cohesion of the upper soil and the pile stiffness. Their results indicated that the reinforcement effect of micropiles increases with soil cohesion but is more significant under low-cohesion conditions. Compared to the research on predicting the bearing performance and ultimate capacity under compressive and lateral loads, research on the prediction of the ultimate capacity under uplift loads is more limited. Therefore, it is necessary to conduct further research into the prediction of the ultimate uplift capacity of micropiles.
Research on the prediction of the ultimate uplift capacity of micropiles primarily includes empirical methods [16], limit equilibrium methods [17,18,19,20], and limit equilibrium methods that consider arching effects [21,22,23]. Empirical methods, typically based on historical data or field tests, are simple to operate and can quickly yield prediction results. However, the accuracy of these methods heavily relies on engineering experience, and their predictive performance may be unsatisfactory under new engineering conditions. Limit equilibrium methods that consider arching effects are mainly applicable to cohesionless soils [24], resulting in a relatively narrow scope of application. Considering the simplicity and applicability of these methods, limit equilibrium methods are more suitable for predicting the uplift capacity of piles. Nevertheless, the research on the uplift capacity of piles has predominantly focused on piles with slenderness ratios of less than 30 [18,19,25,26]. When the slenderness ratio exceeds 30, the critical embedment depth is simplified to 75% of the pile’s length for calculation, ignoring the effect of the change in the critical embedment depth on the predicted results for cases with high slenderness ratios. Therefore, it is necessary to investigate the uplift bearing mechanism of micropiles further and evaluate the accuracy of the available prediction methods in assessing their ultimate uplift capacity.
Based on the aforementioned studies, the applicability of the existing prediction models for uplift capacity to micropiles with high slenderness ratios requires further evaluation. To address this, this paper investigates the load transfer mechanism of micropiles under uplift loads through model tests and finite element simulations and proposes a dynamically varying critical embedment depth dependent on the slenderness ratio. Subsequently, Shanker’s model is improved by incorporating the critical embedment depth, resulting in a modified calculation method for predicting the ultimate uplift capacity of micropiles. This work provides a theoretical foundation for the application of micropiles in uplift-resistant engineering fields, such as transmission tower foundations and building reinforcement.
2. The Model Tests
2.1. The Model Piles
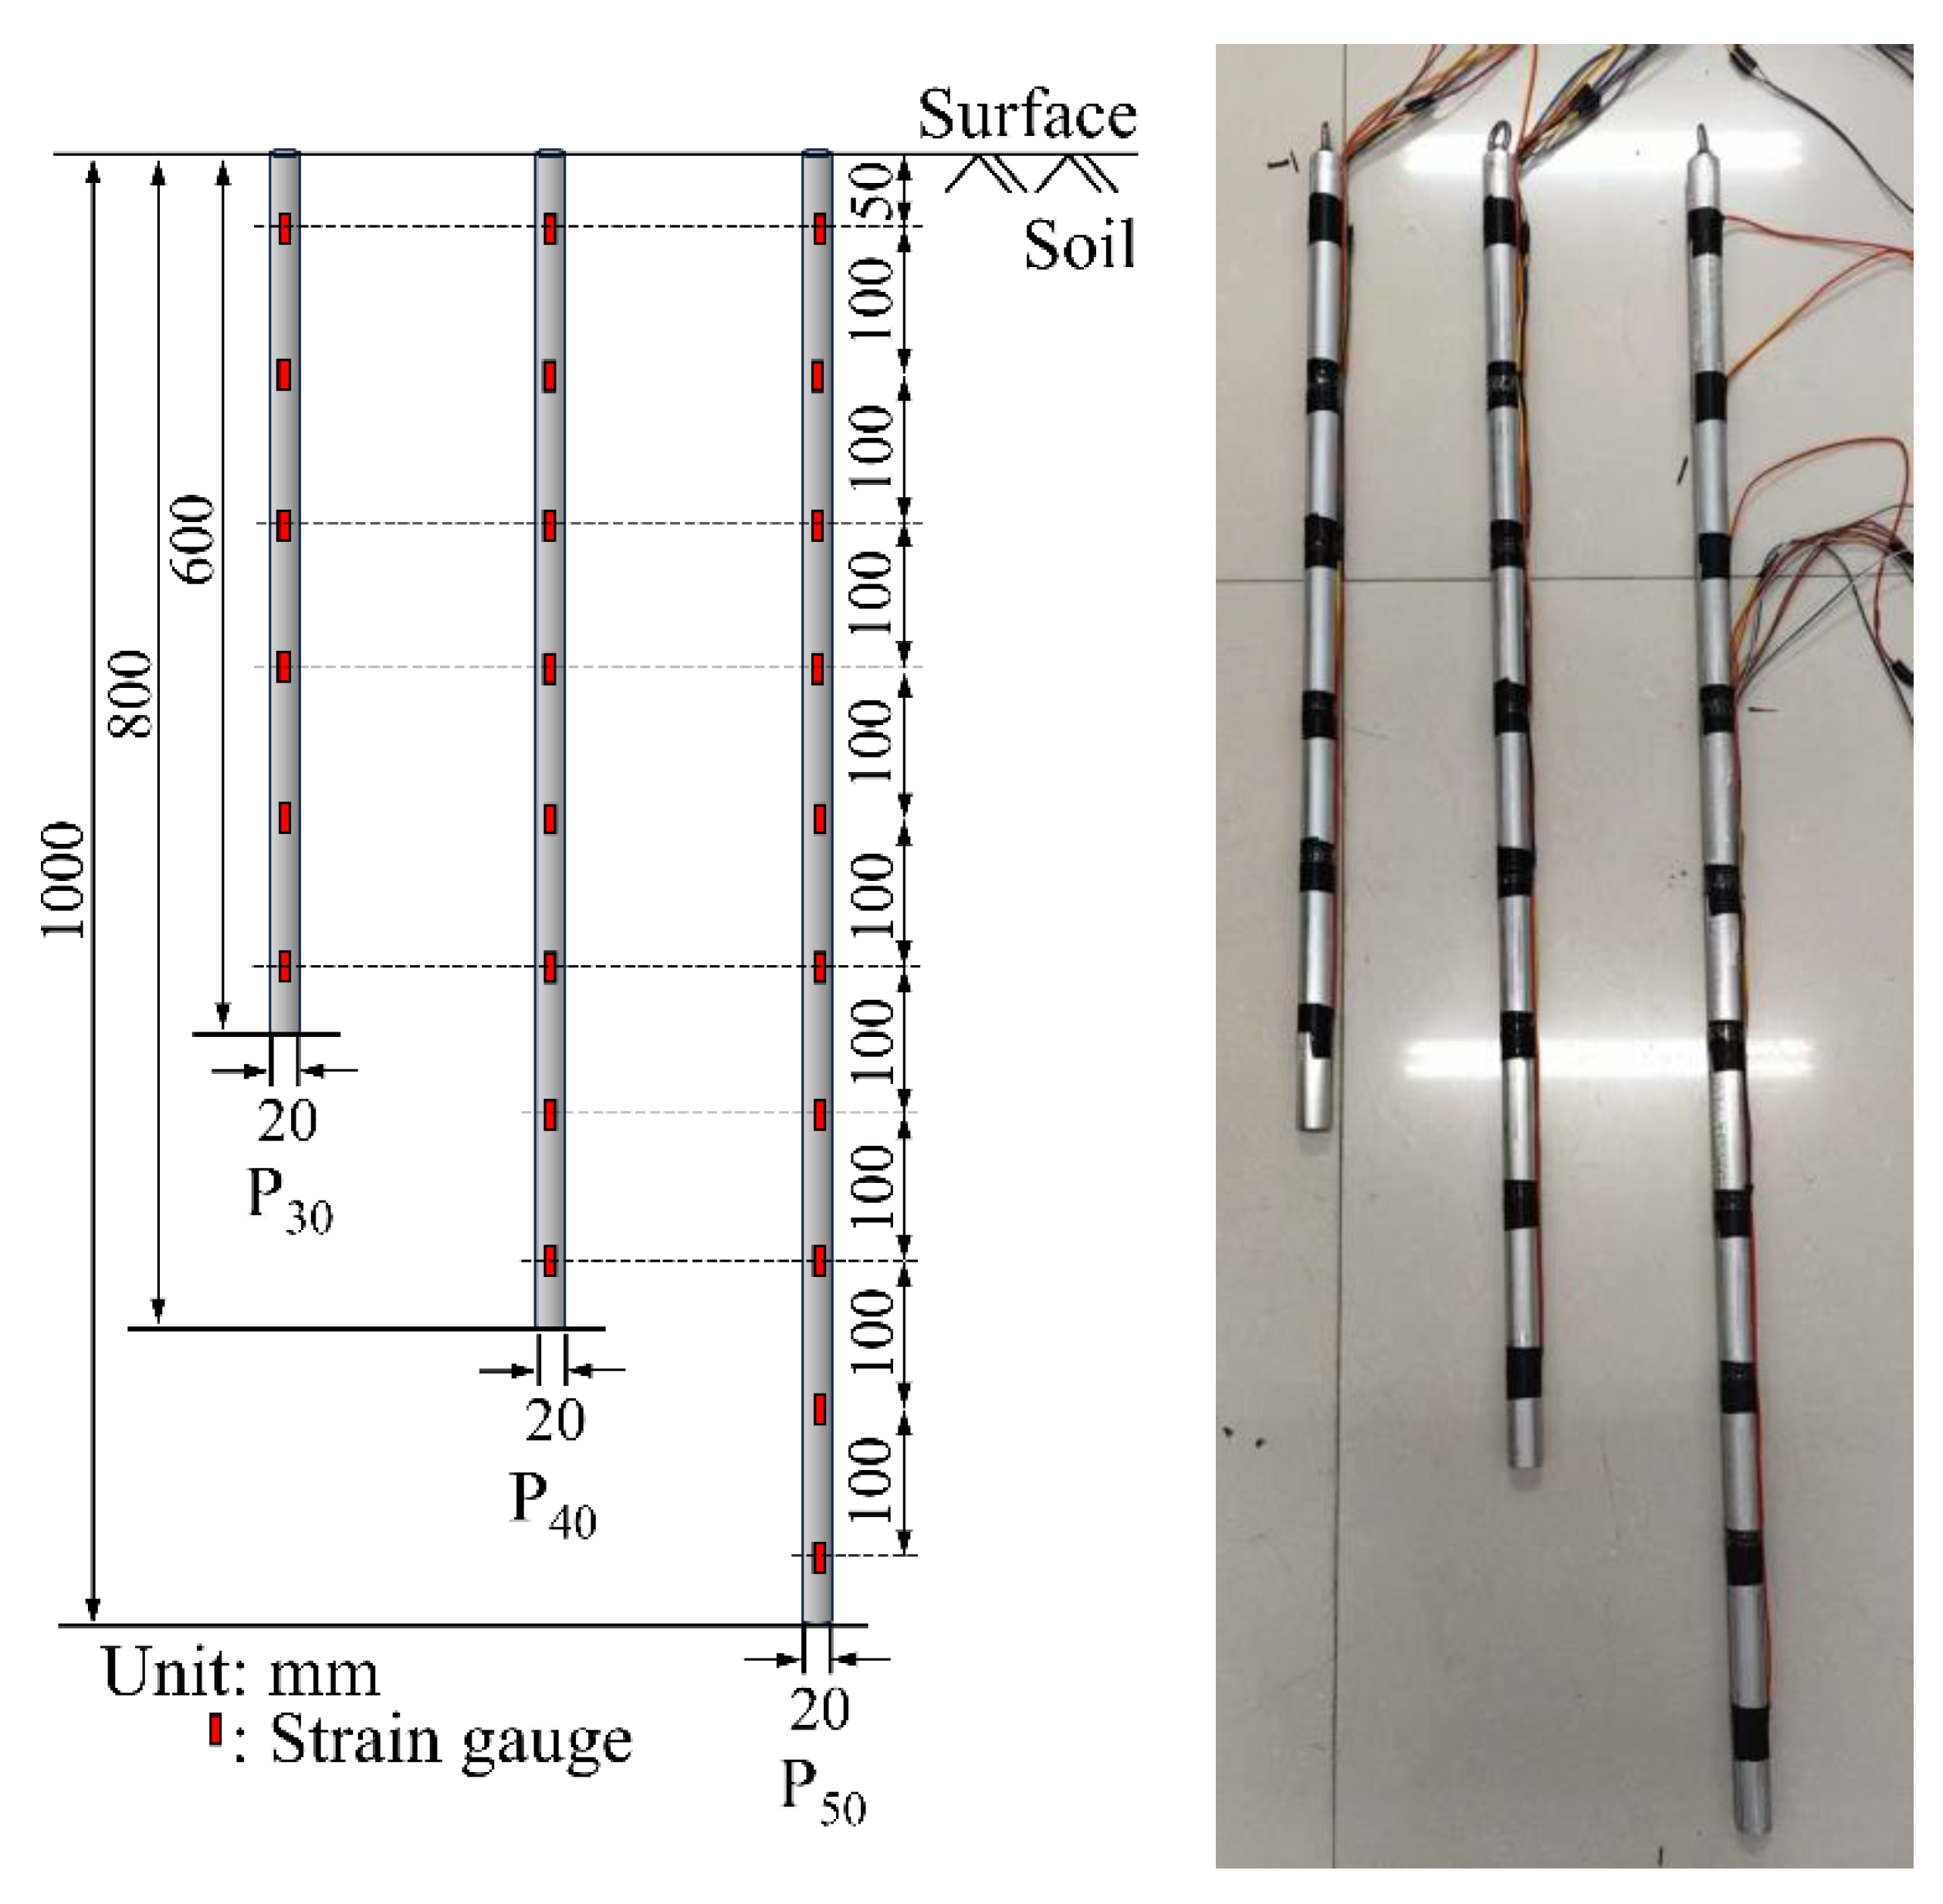
A large number of model tests under gravity can be carried out due to their low cost, which can ensure the reproducibility of the data and help us understand the significant characteristics of the uplift bearing capacity of miniature piles better [12]. For this reason, this study relies on engineering examples, and based on the similarity theory [27], the diameter of the model piles is designed to be 1/15 of that of the prototypes [28,29], with a diameter (d) of 20 mm and pile lengths (L) of 600 mm, 800 mm, and 1000 mm, respectively. Subsequently, for the model pile, the slenderness ratios () are 30, 40, and 50, respectively, and the corresponding model piles are described as P30, P40, and P50, respectively. The model piles were made of solid aluminum alloy. Aluminum alloy was selected due to its high strength-to-weight ratio and ease of machining. To simulate the friction between the pile and the soil, the entire surface of the piles was polished, resulting in a pile–soil friction angle () of 25.8°. Strain gauges were attached to one side of the model piles to monitor the changes in the axial force during the tests. The strain gauges used were the model 120-20 AA with a sensitivity of 2.0 mV/V, and they were evenly spaced at 100 mm intervals centered on the sensitive grid of the gauges. The dimensions of the model piles, the locations of the strain gauges, and the physical setup are shown in Figure 1.
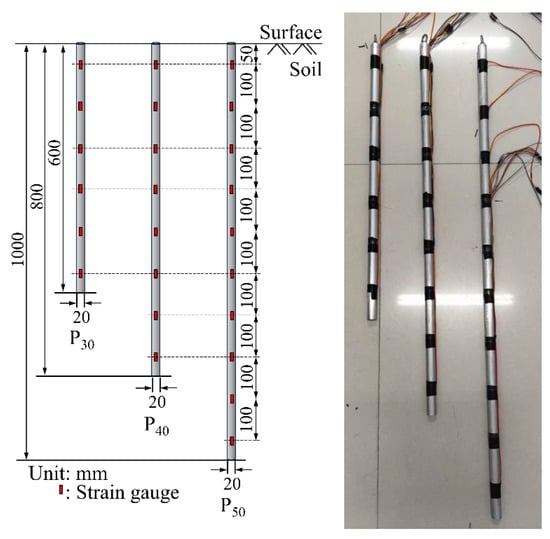
Figure 1.
The model pile size, positions where the strain gauges were placed, and a physical map.
2.2. The Soil Sample
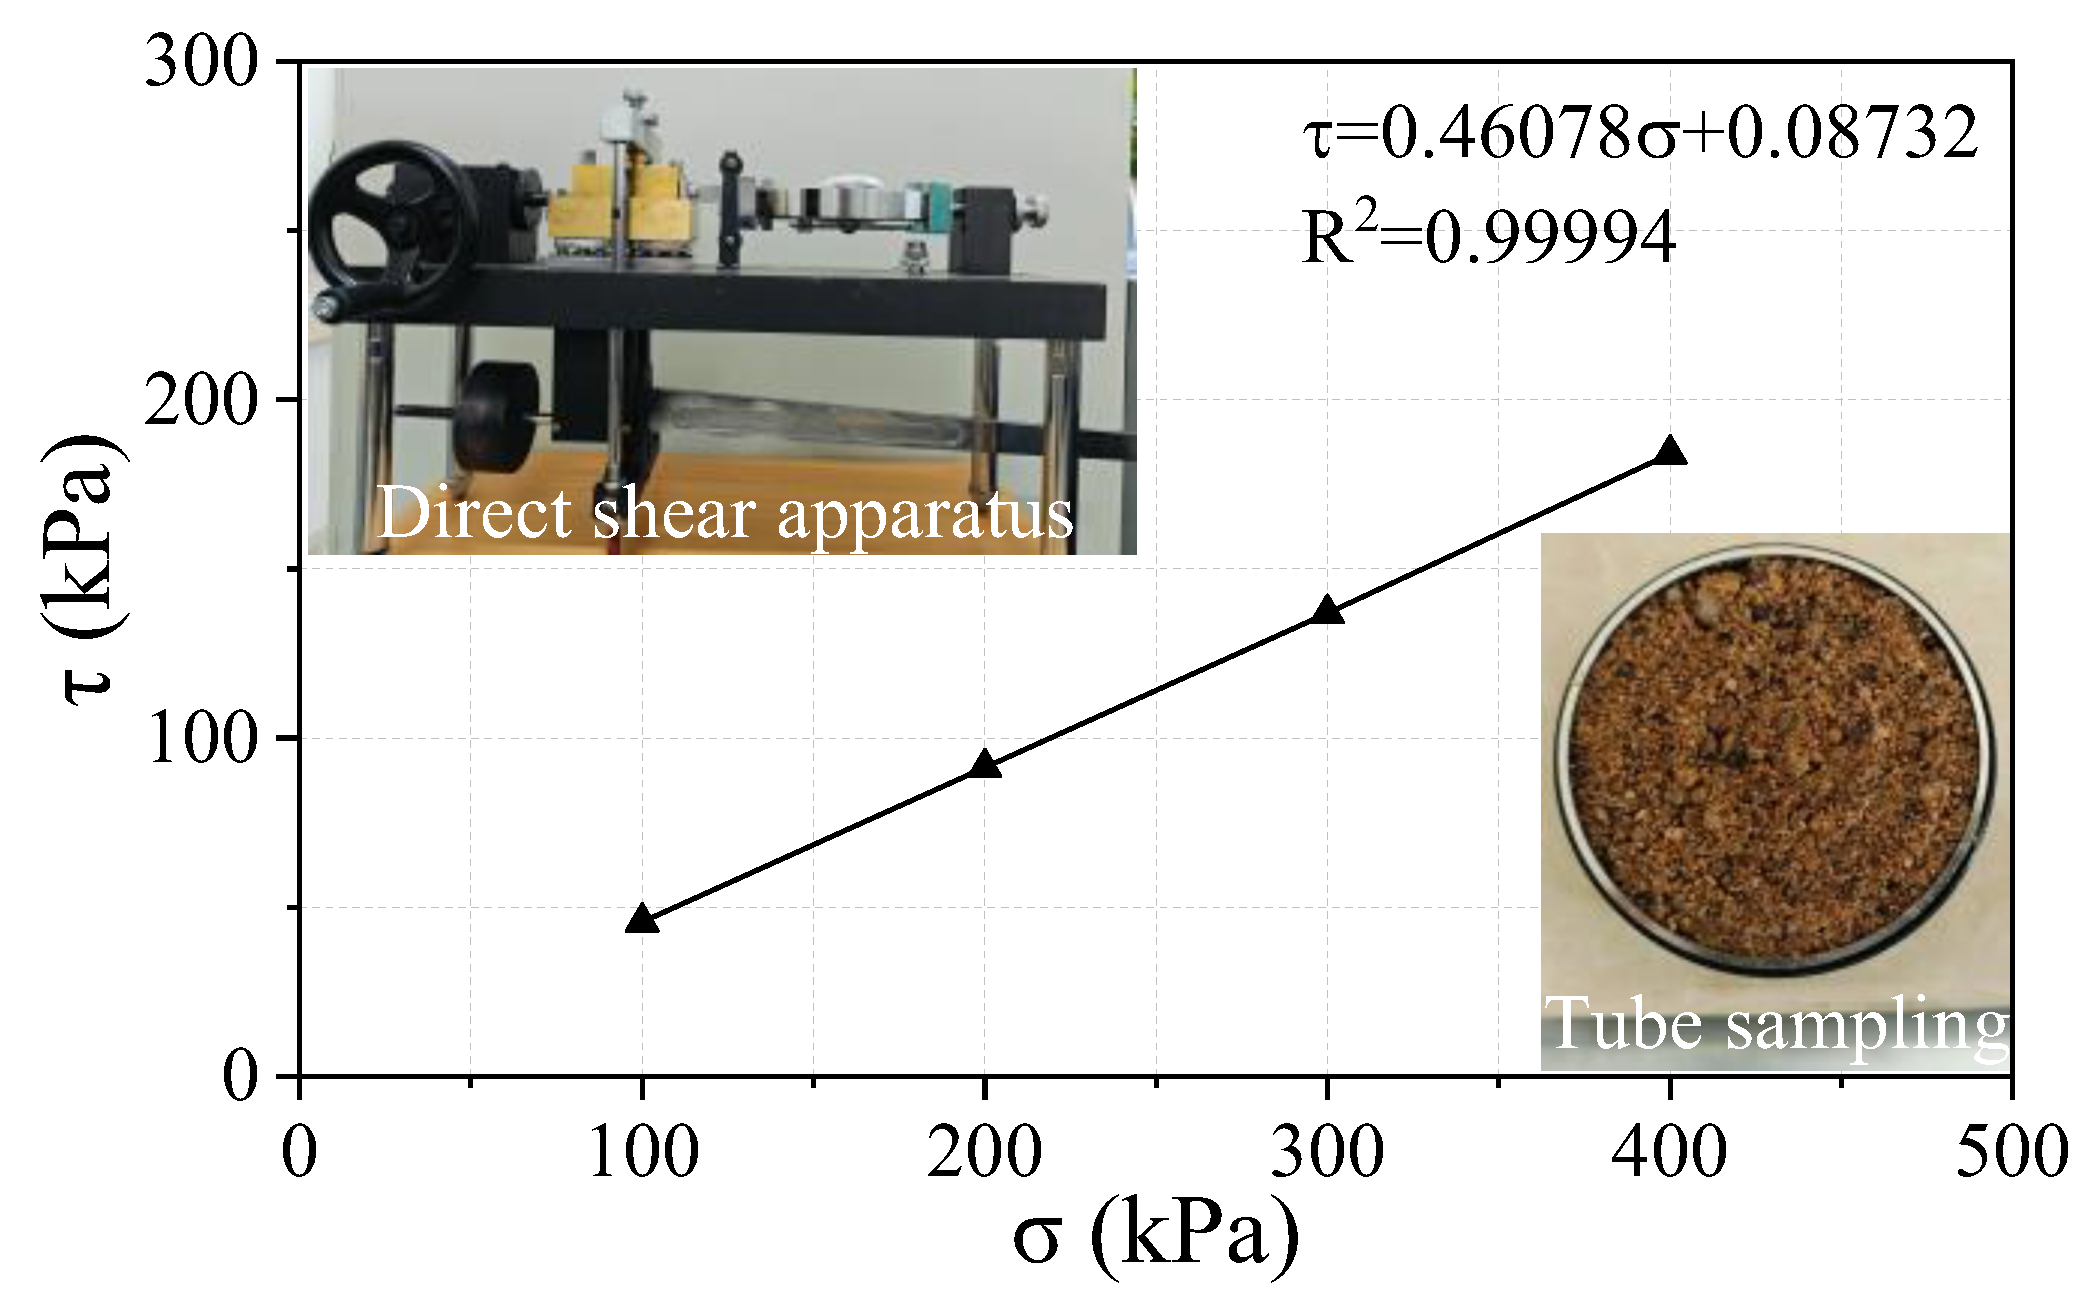
The soil sample consisted of a single sand layer with a density of 1.55 g/cm3 and a relative density Dr of 0.501. The soil sample preparation procedure was as follows. Each 5 cm thick layer was compacted horizontally, and then the surface of each layer was scarified before adding the next layer to prevent stratification within the prepared soil sample. To ensure the accuracy of the tests, the prepared soil sample was left to settle for 24 h. After 24 h, the internal friction angle () of the soil was determined to be 25° through direct shear tests (ASTM D3080-98 [30]). The results of the direct shear tests are shown in Figure 2.
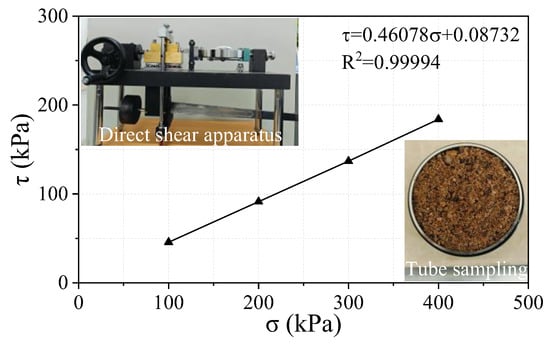
Figure 2.
Results from direct shear tests.
2.3. The Loading System
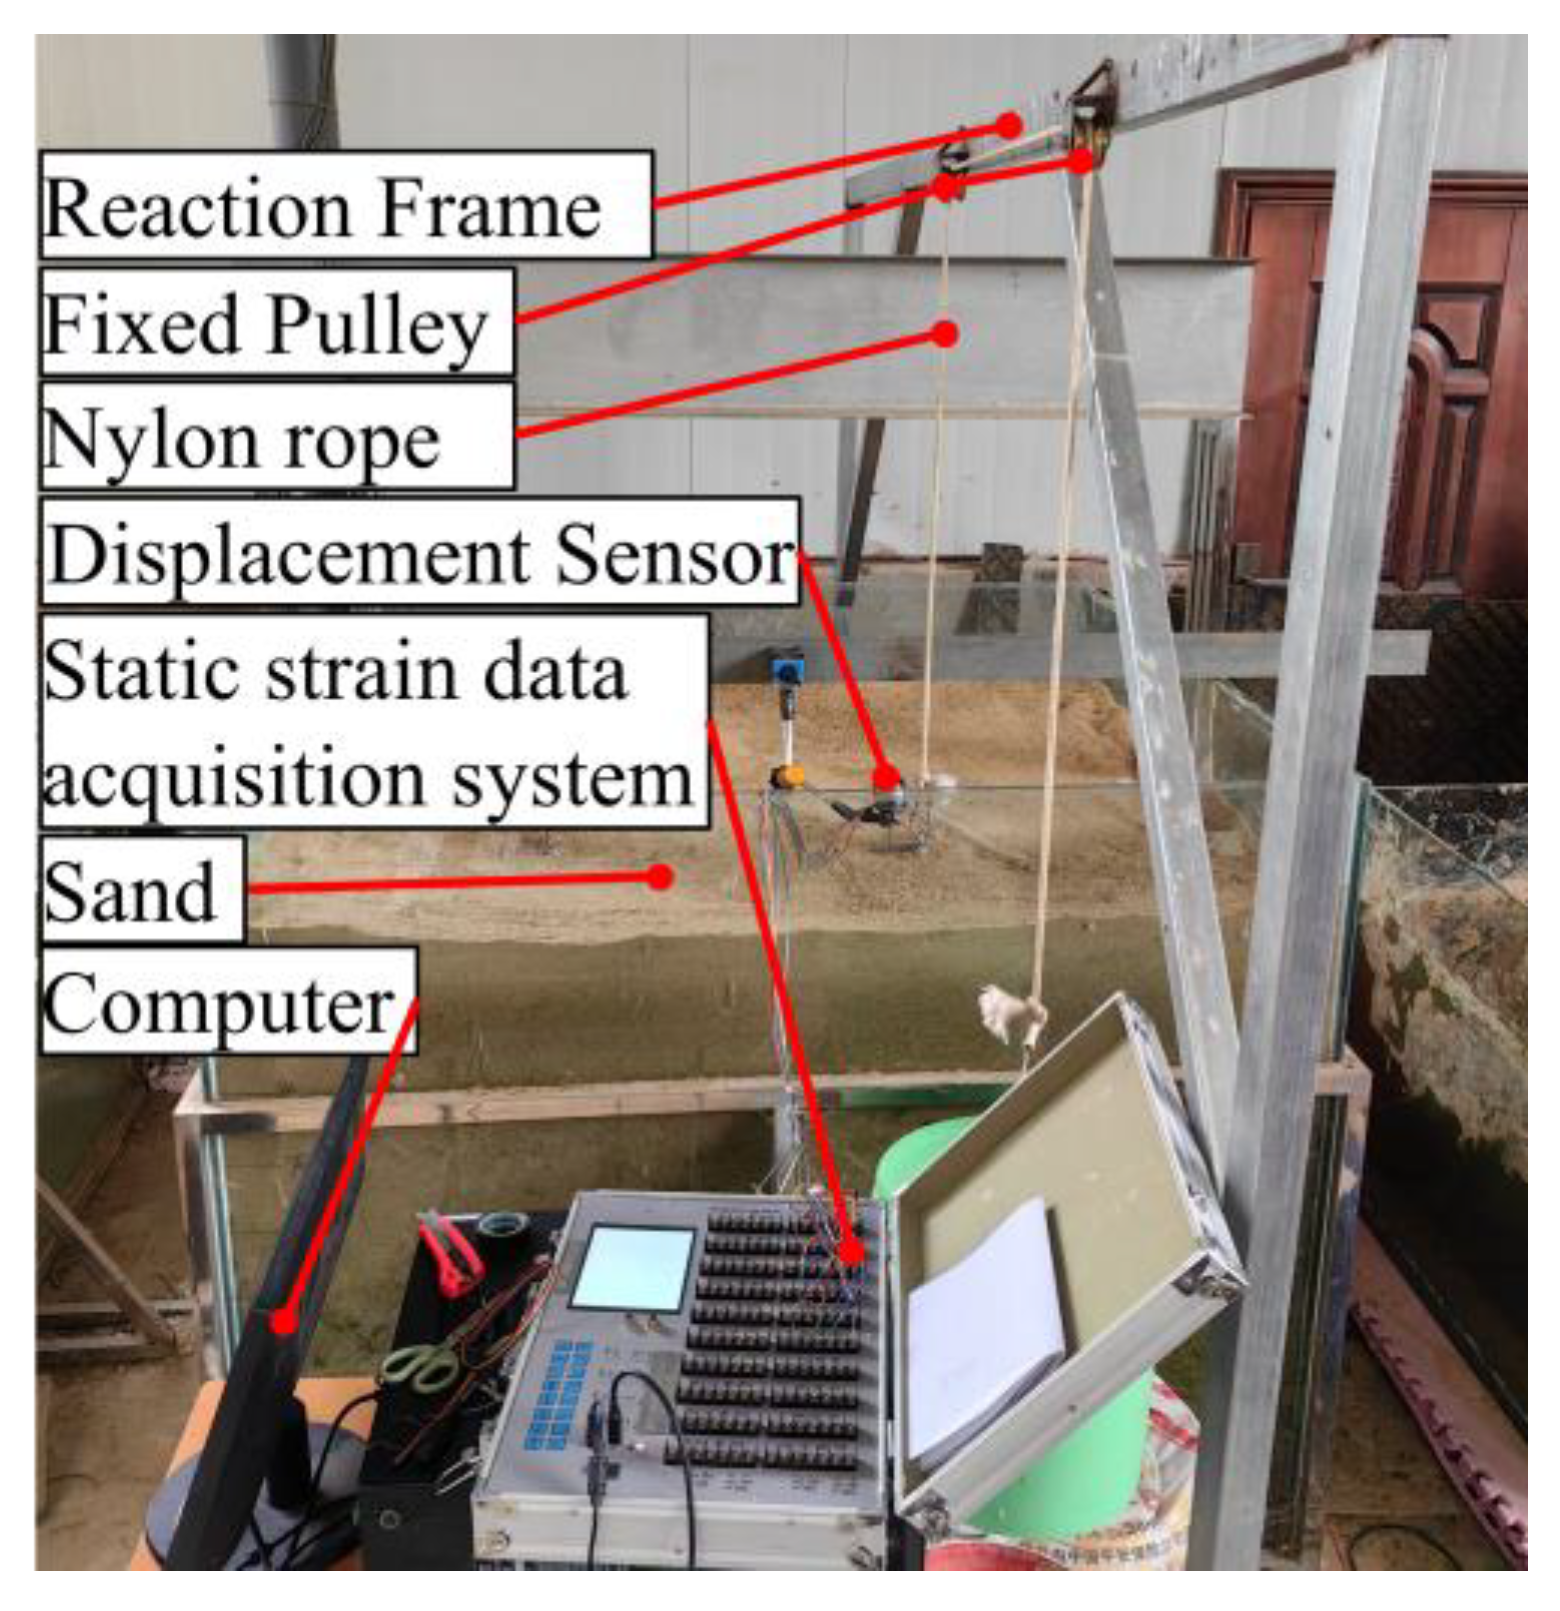
The loading test system is shown in Figure 3. The system consists of a model box, an uplift loading device, displacement sensors, and a static strain acquisition system. The model box is made of tempered glass. The length, width, and height of the model box are 150 cm, 150 cm, and 120 cm, respectively, and the thickness of its walls is 10 mm. The uplift loading device consists of fixed pulleys, nylon ropes, and a weight container. Through the lever action of the two fixed pulleys, the gravity of the weights is transferred via the nylon ropes to apply an uplift load to the pile. The reaction frame of the uplift loading device is constructed using square steel tubes, with the fixed pulleys welded to the steel tubes to ensure reliable connections. The displacement sensors have a range of 0–20 mm and an error of ±0.3%. The resolution and range of the static strain acquisition system (model JC-YBY-200) are 1 με and 0–±30,000 με, respectively. The sampling rate is set to 2 times per second.
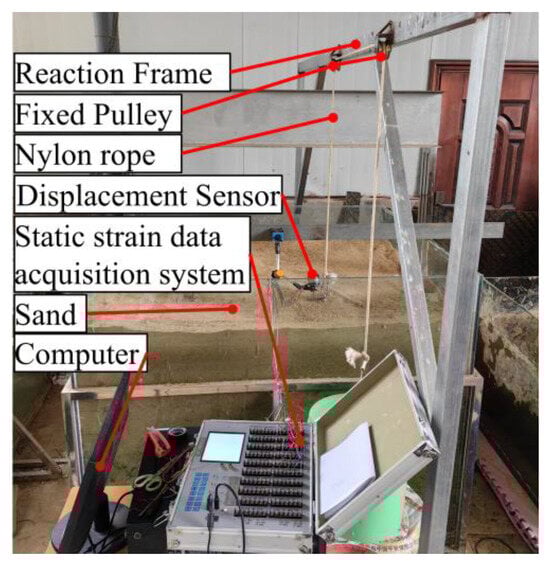
Figure 3.
The loading test system.
3. Results and Discussions
3.1. The Bearing Capacity
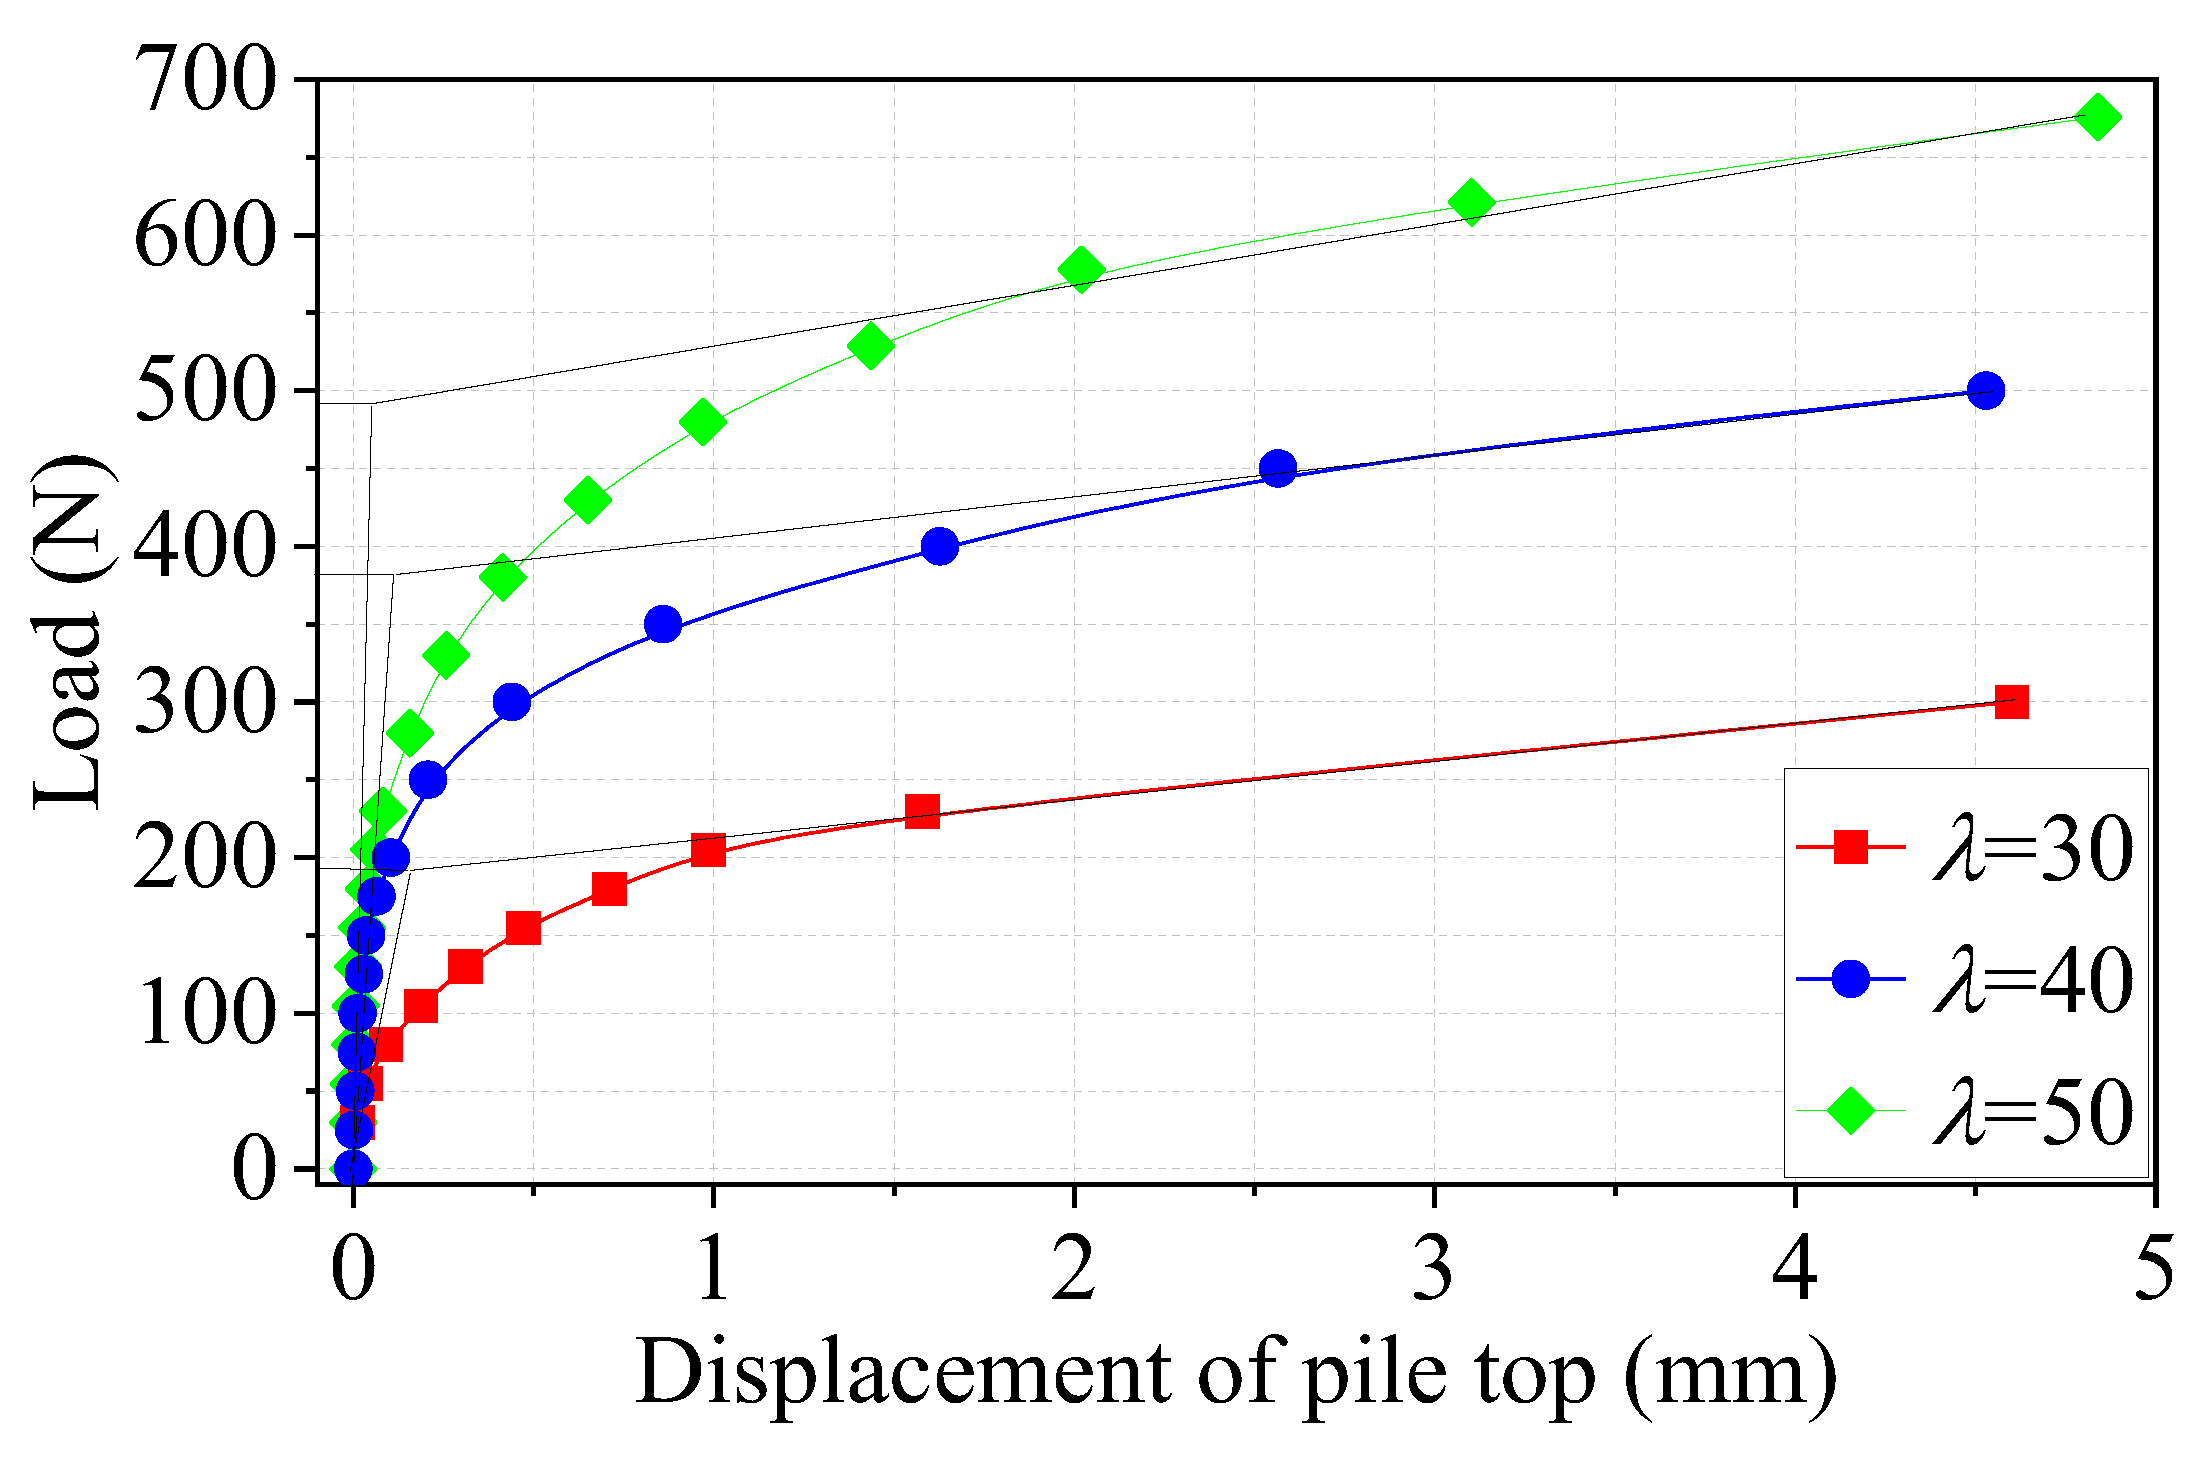
The load–displacement curves of the uplifted micropiles under different slenderness ratios are shown in Figure 4. It can be observed that the load–displacement curves of the uplifted micropiles under different slenderness ratios exhibit similar trends from Figure 4. In the initial loading stage, the load–displacement curves develop linearly. The larger the slenderness ratio is, the greater the tangent slope of the curve in the linear stage is. As the load increases, the tangent slope of the curve gradually decreases, and the uplift displacement at the top of the pile increases nonlinearly and exponentially. Using the double-tangent method [20], the ultimate uplift capacity (UPC) of the pile was obtained. The ultimate uplift capacities of P30, P40, and P50 are 191 N, 375 N, and 491 N, respectively. The corresponding uplift displacements are 0.14 mm, 0.168 mm, and 0.18 mm, respectively. Compared to those of P30, the UPC and its corresponding uplift displacement of P40 increased by 96% and 20%, respectively. Compared to those of P40, the UPC and its corresponding uplift displacement of P50 increased by 31% and 7%, respectively. This indicates that as the slenderness ratio increases, the rate of the increase in the UPC and its corresponding uplift displacement in uplifted micropiles gradually decreases. This indicates that for micropiles under uplift loads with the same pile diameter, the improvement in the bearing capacity due to an increase in the pile length is limited.
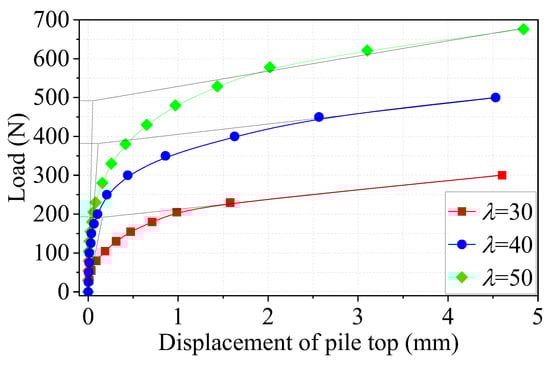
Figure 4.
Load–displacement curves of micropiles with different slenderness ratios.
3.2. The Axial Force of the Piles
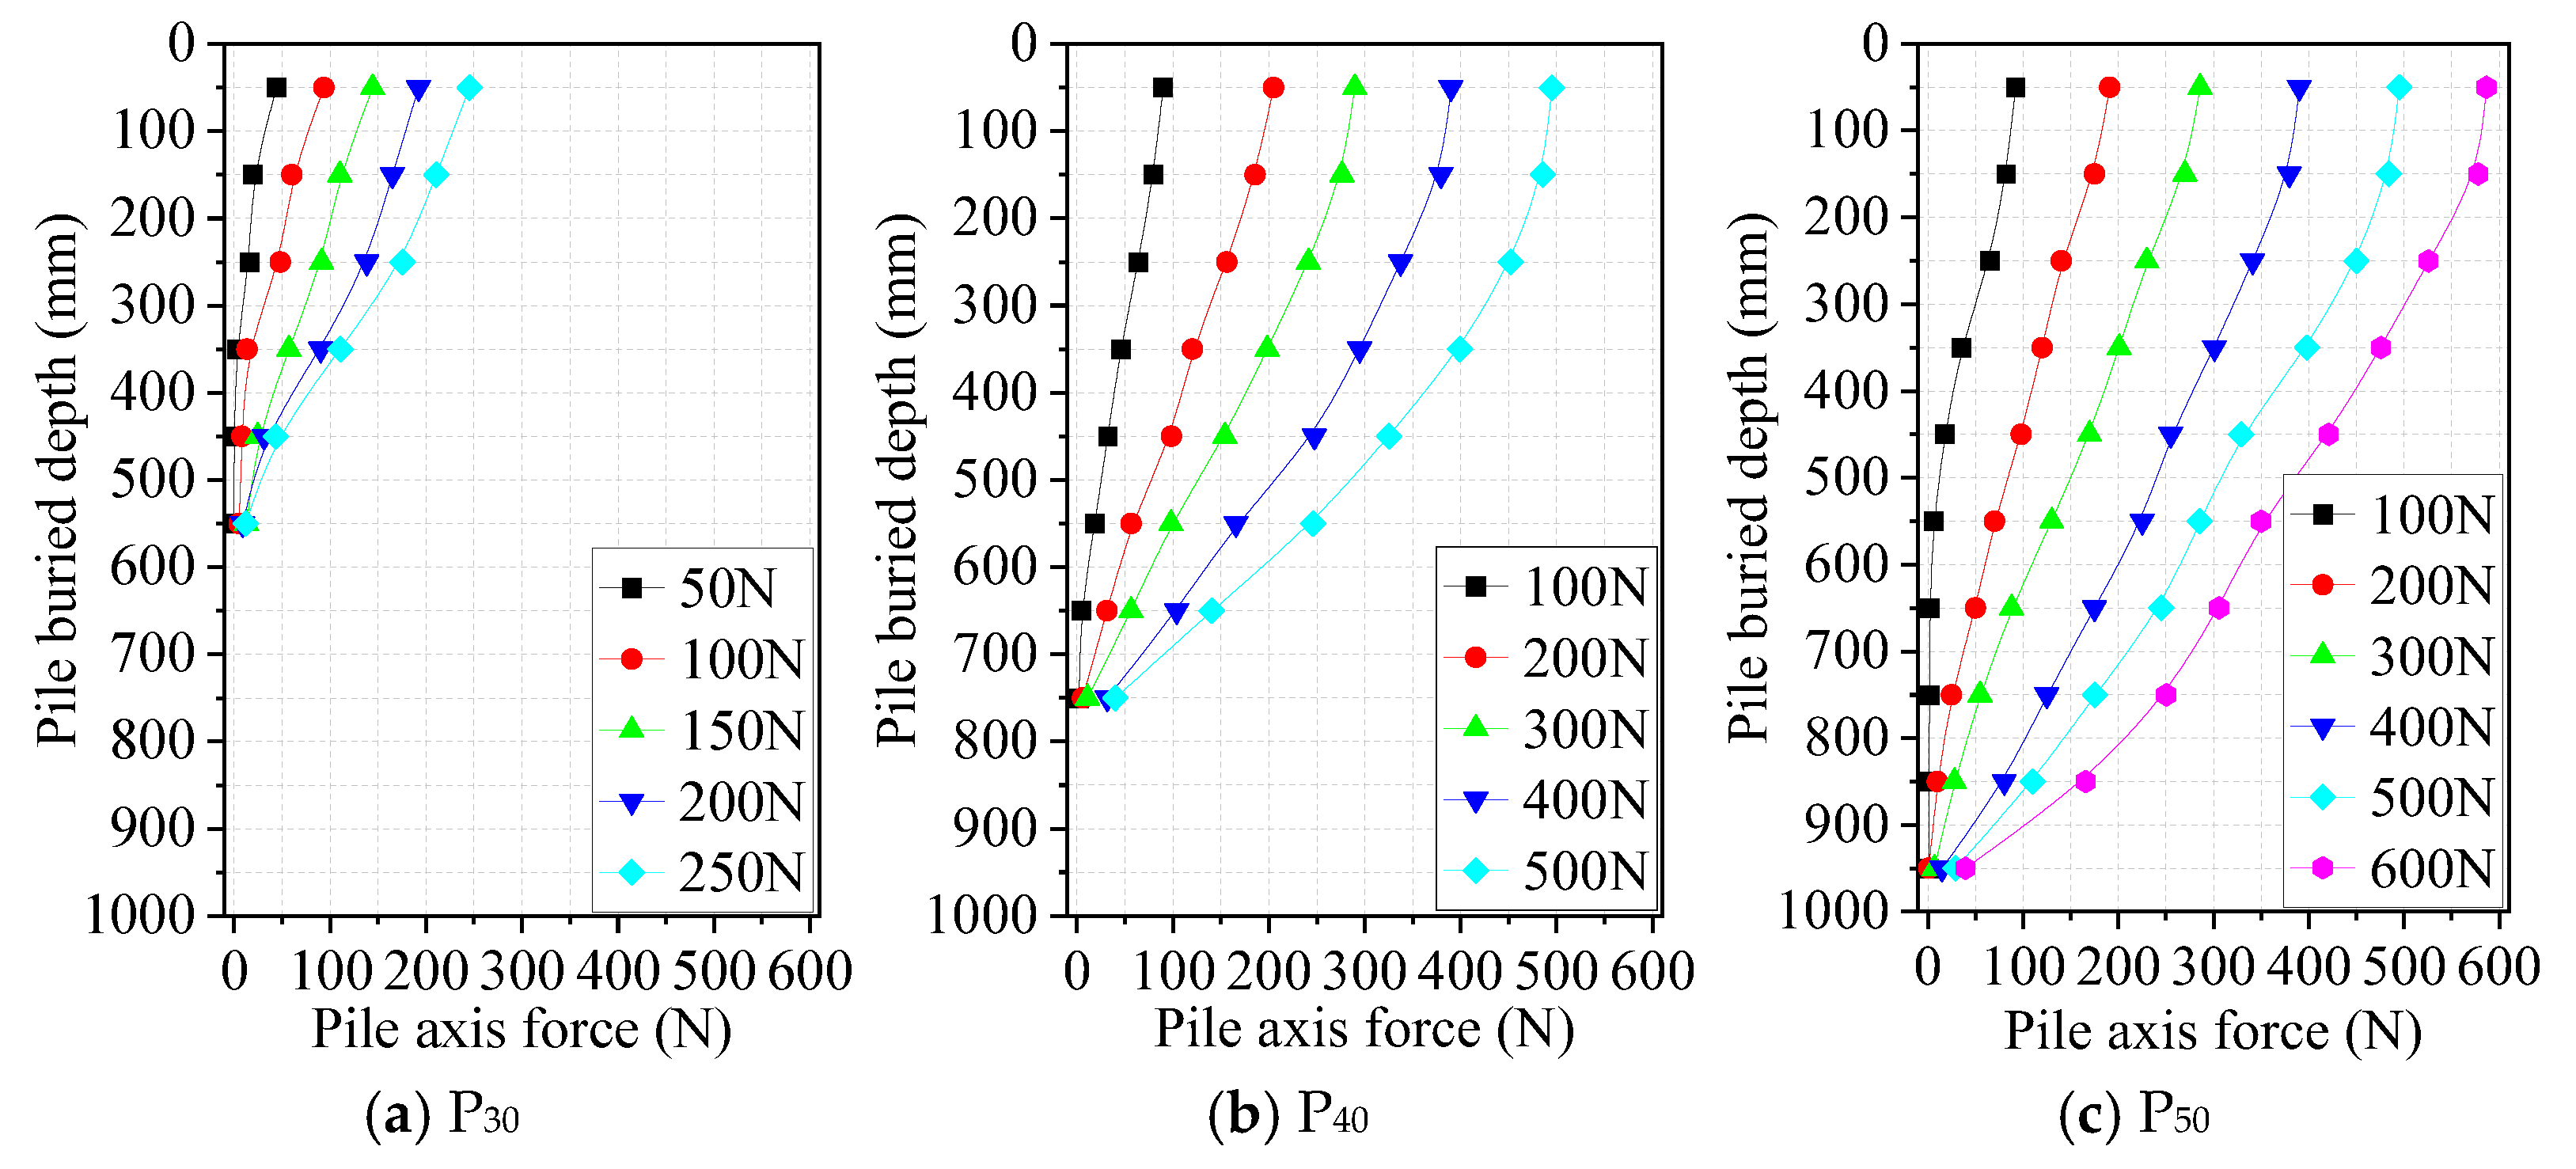
Equation (1) shows the formula for the axial forces along a pile shaft under different uplift loads [31], which can be used to obtain the axial forces of model piles under different loads, as shown in Figure 5. It can be observed that the axial forces along the pile shaft decrease gradually from the top to the bottom of the pile under different values from Figure 5. When is 30, the axial forces along the pile shaft exhibit an approximately linear distribution with the depth under all loads. As increases, the slope of the axial force curve gradually decreases under a large load. This indicates that for piles with large values, the transfer of the uplift load downward decreases as the buried depth increases. Therefore, the higher the slenderness ratio, the greater the extent of the embedment into the soil at the base of the micropile.
where Nij is the axial force of the pile at the i-th cross-section under the j-th load level; E is the elastic modulus of the pile; is the strain of the pile; and A is the cross-sectional area of the pile.
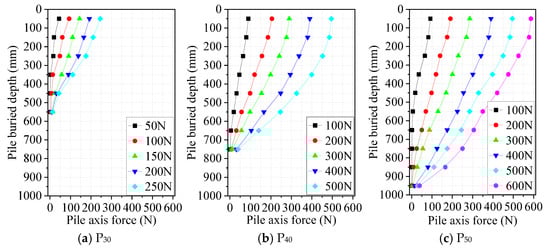
Figure 5.
Axial forces of model piles under different loads.
3.3. The Side Friction Resistance
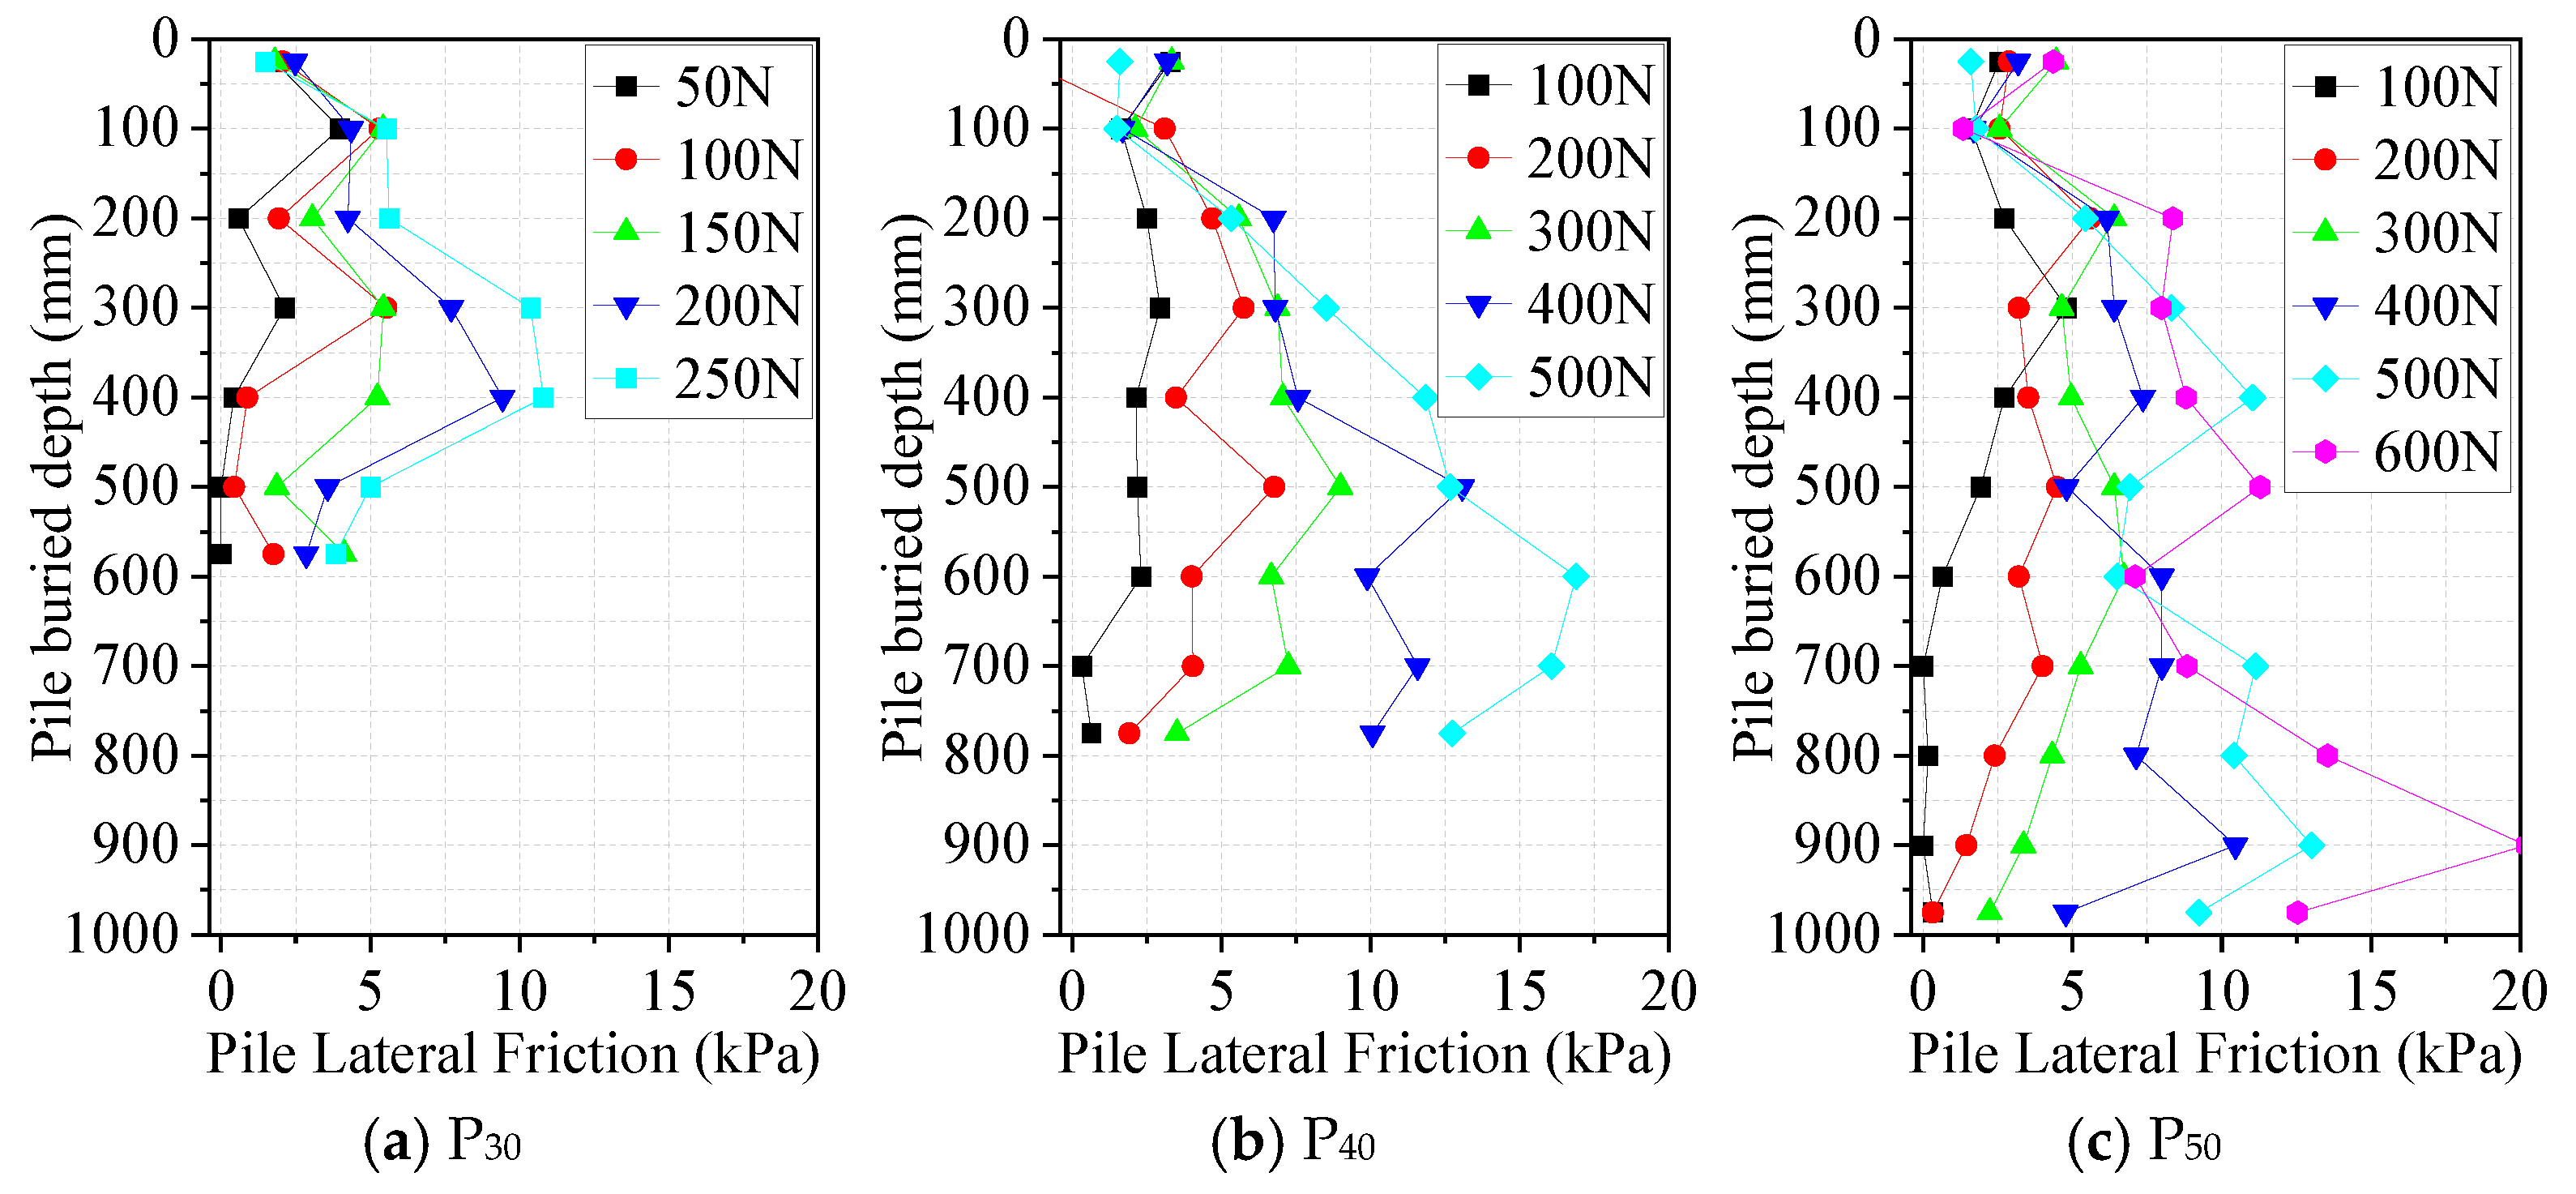
Figure 6 shows the average side resistance under different uplift loads calculated using Equation (2) [32]. It can be observed that the position of the maximum side friction resistance gradually shifts downward as the load increases. This indicates that in order to balance the uplift load, the pile’s lateral frictional resistance gradually acts into deeper soil layers as the length-to-slenderness ratio increases. However, the distribution of the maximum side friction resistance varies with . For P30, P40, and P50, the maximum side friction resistance occurs within buried depth ranges of 0.5–0.66 L, 0.625–0.875 L, and 0.7–0.9 L, respectively. This demonstrates that the larger is, the more significant the embedding effect of the soil around the lower part of the micropile. Therefore, it can be concluded that as the slenderness ratio increases, the point of the failure surface in the soil (that is, the critical embedding depth) moves further away from the bottom of the pile.
where qsi is the average side resistance of the pile segment between the i-th and (i + 1)-th cross-sections under the j-th load level; Ni+1, j is the axial force at the (i + 1)-th cross-section under the j-th load level; ui is the perimeter of the pile; and l is the length of the pile segment between the i-th and (i + 1)-th cross-sections.
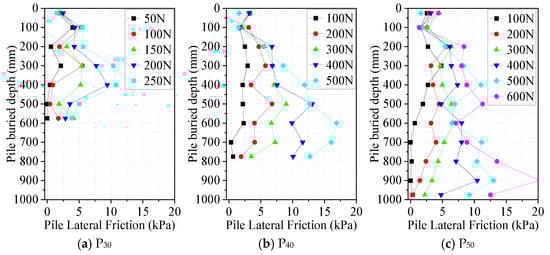
Figure 6.
The distribution of the side friction resistance along the micropiles under different loads.
4. Prediction of the Ultimate Uplift Capacity
4.1. The Available Prediction Models and Improvements
- (1)
- The standard model [33]
The standard model assumes that the failure surface occurs at the pile–soil interface, and the net ultimate uplift capacity of the pile can be estimated using Equation (3).
where Ks is the lateral earth pressure coefficient; d is the diameter of the pile; is the unit weight of the soil; and L is the length of the pile.
- (2)
- The truncated cone model
The truncated cone model assumes that the ultimate uplift capacity is equal to the self-weight within the failure surface, where the failure surface is a truncated inverted cone with the enveloping sides rising at /2 degrees from the vertical. This model is expressed using Equation (4).
- (3)
- Meyerhof’s model [17]
Meyerhof’s model neglects the weight of the pile and assumes that the soil failure mechanism under an uplift load follows a similar shape to that for a shallow anchor. The net ultimate uplift capacity of the pile can then be estimated using Equation (5).
where, Ku is the uplift coefficient and can vary with in wide limits and depend not only on the soil properties, but also on the type of pile and method of installation.
- (4)
- Das’s model [18]
Based on experimental results, Das’s model assumes that the friction resistance at the pile–soil interface increases linearly with depth until it reaches a critical embedment ratio. The critical embedment ratio depends on the relative density (Dr). The net ultimate uplift capacity of the pile can then be estimated using Equations (6) and (7).
where
where Lcr is the critical embedment depth, .
- (5)
- Chattopadhyay’s model [19]
Chattopadhyay’s model assumes that the failure surface of the soil is curved. The net ultimate uplift capacity of the pile can then be estimated using Equation (10).
where A1 is the net uplift capacity factor and depends on , , and .
- (6)
- Shanker’s model [20]
Shanker’s model considers the angle between the soil failure surface and the horizontal, proposing a simplified method for predicting the net ultimate uplift capacity, as shown in Equation (11). Based on aforementioned studies on sliding failure surfaces [19], for piles with , the failure surface is assumed to be tangent to the pile at a distance of L/4 from the pile tip. Therefore, Pu in this model is the sum of the values calculated using Equation (11) and the frictional resistance generated over the L/4 length.
where
where is the angle of the failure surface to the horizontal.
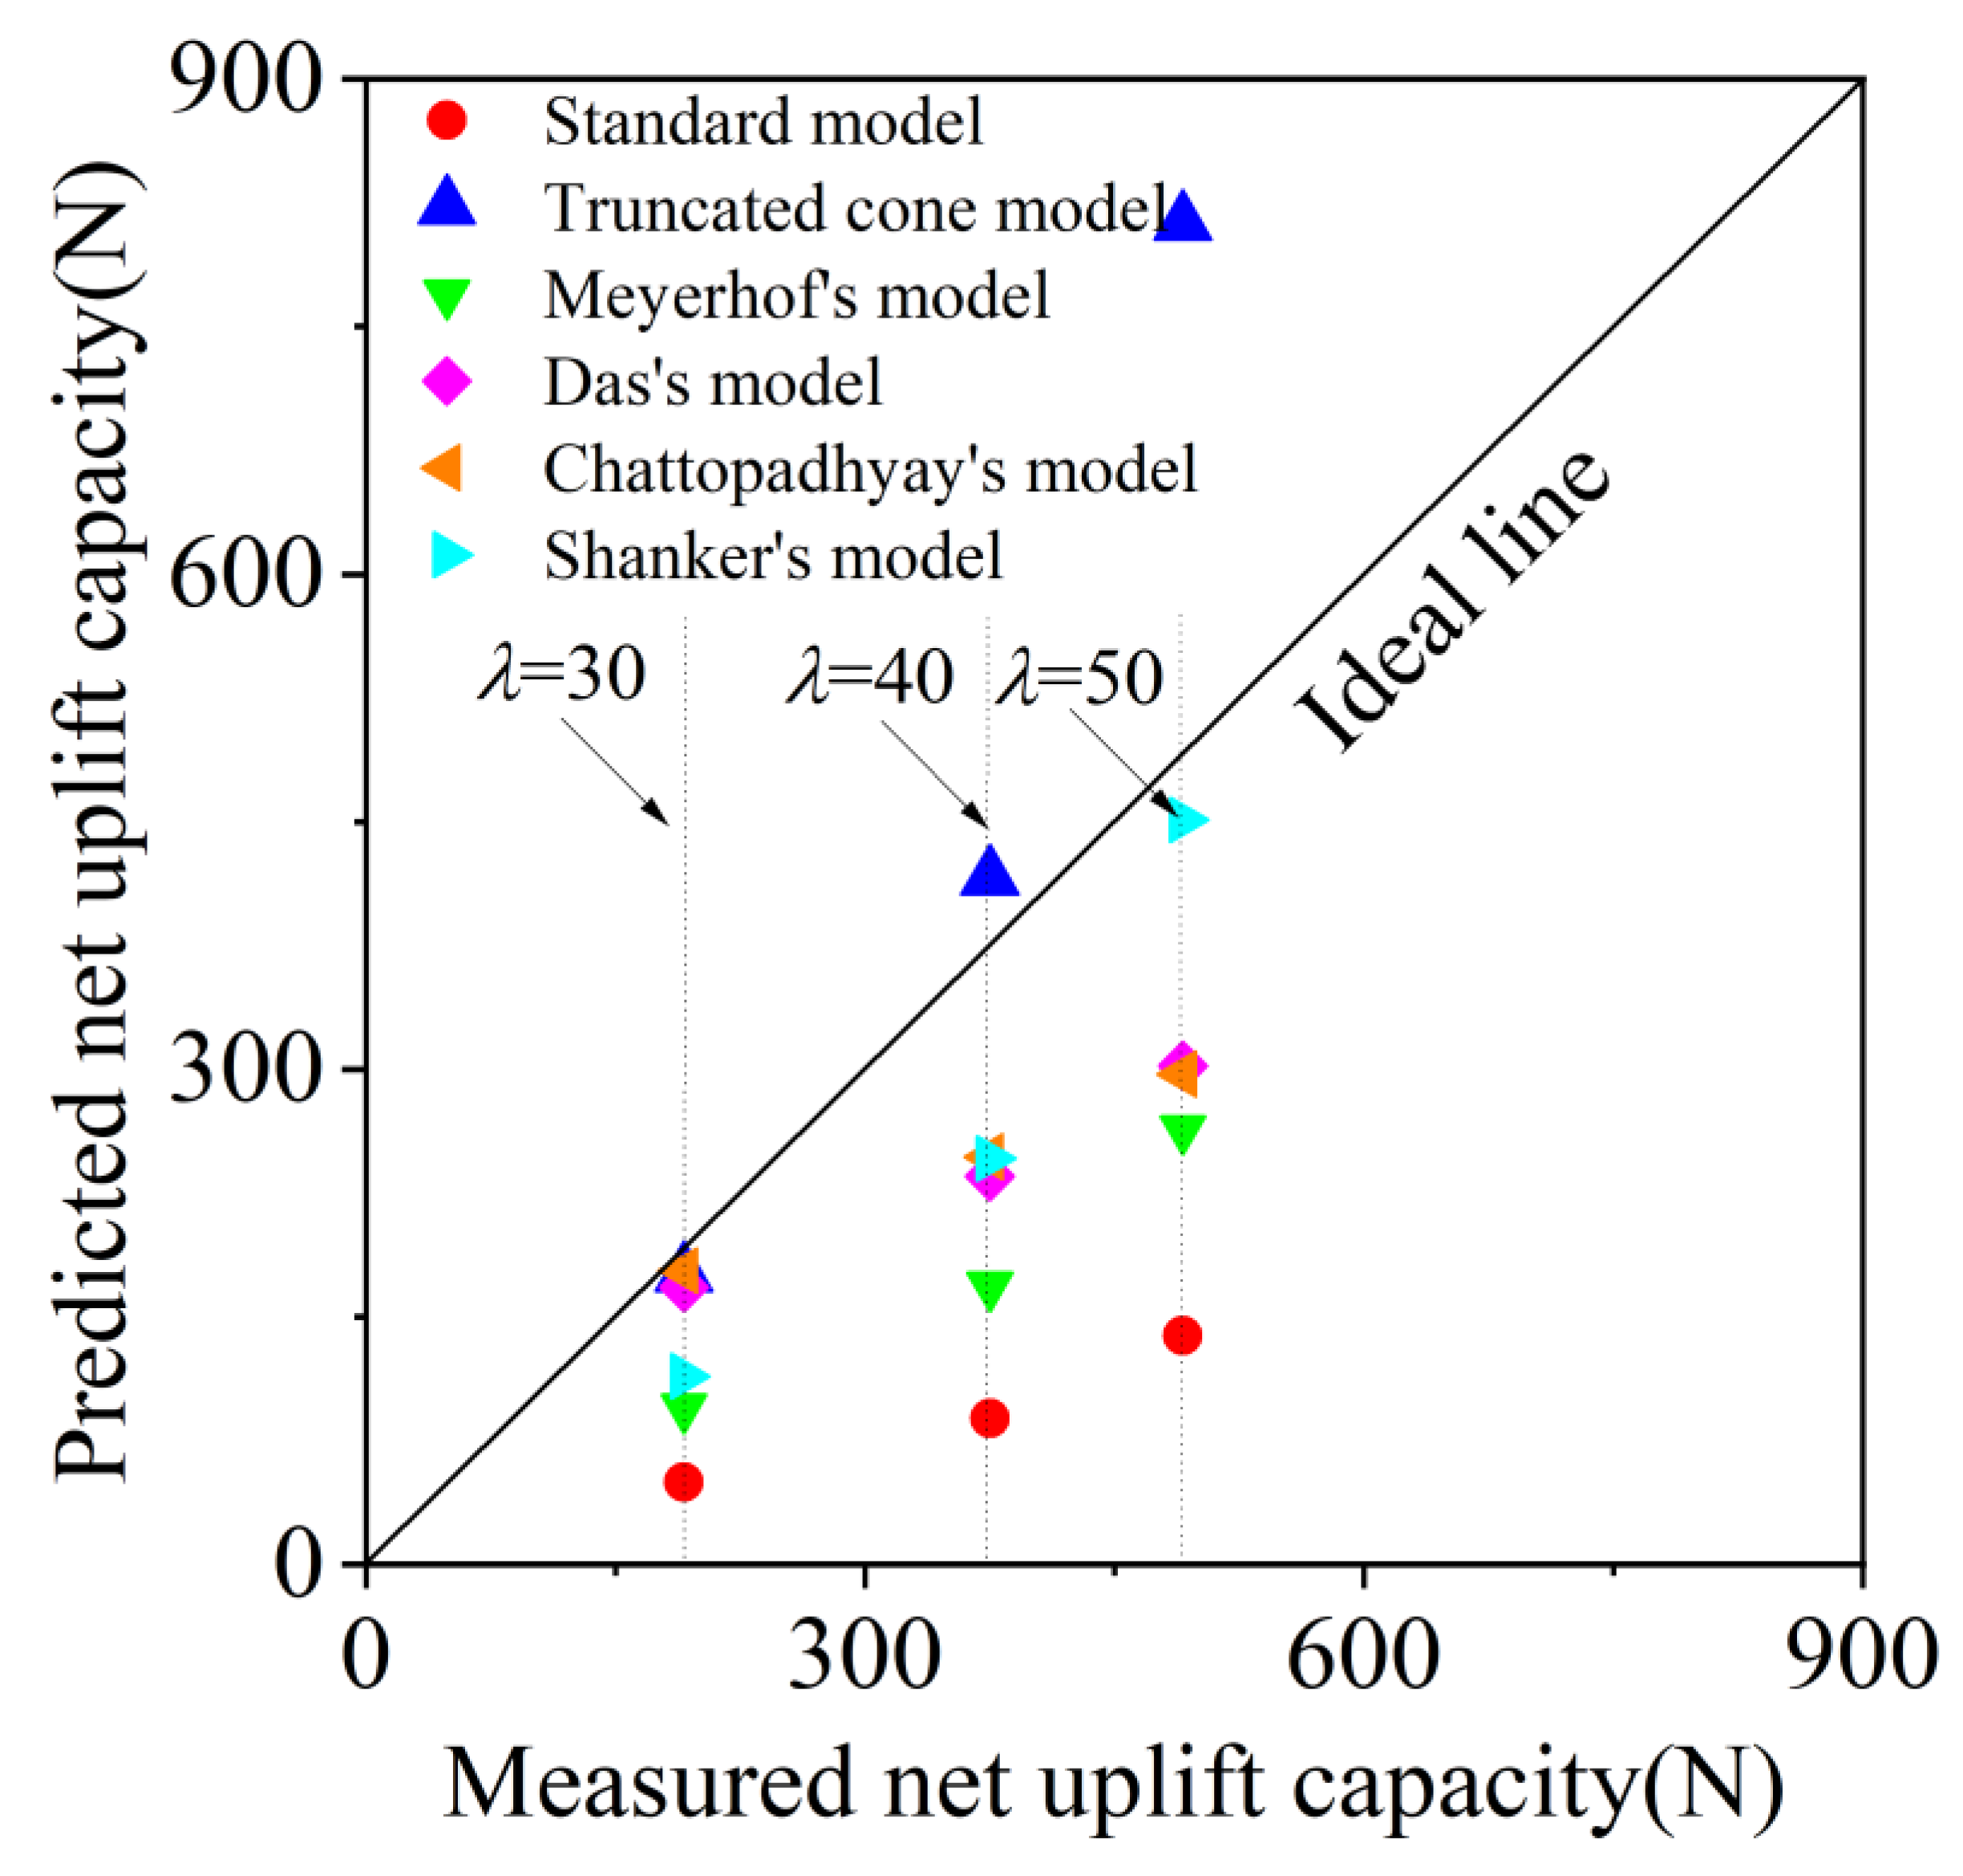
Figure 7 compares the values calculated using these different prediction models with the experimental values. From Figure 7, it can be observed that as the slenderness ratio increases, the values predicted by the standard model and Meyerhof’s model fall below the ideal line, with significant errors ranging from 71.8% to 73.8% and 50.3% to 54.9%, respectively. The truncated cone model provides predictions close to the ideal line for = 30 and 40, but the error reaches 65.5% for = 50. The values predicted by Das’s and Chattopadhyay’s models are relatively close, with the errors ranging from 12% to 39.5%. Shanker’s model shows errors ranging from 8% to 40%. In summary, of these six models, Shanker’s model demonstrates a better predictive capability for the ultimate uplift capacity of piles with high slenderness ratios. Additionally, Shanker’s model is simple, involving neither complex analyses nor graphical methods, making it advantageous for engineers assessing the uplift capacity of foundation piles. Therefore, the following analysis and improvements are based on this prediction model.
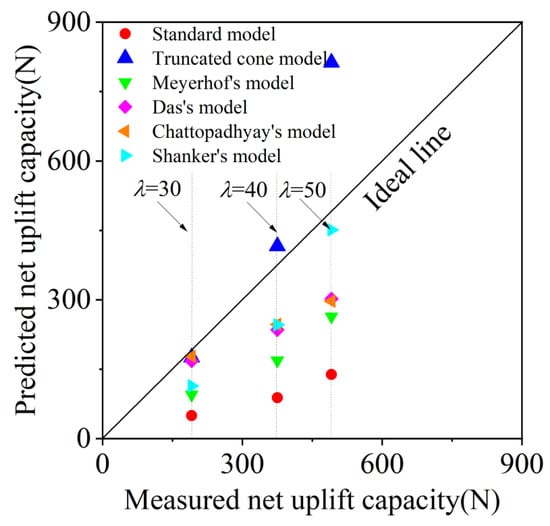
Figure 7.
Comparison of the results using different prediction models and experimental results [17,18,19,20,33].
4.2. The Determination of Lcr for Micropiles with Different Values
4.2.1. The Finite Element Model
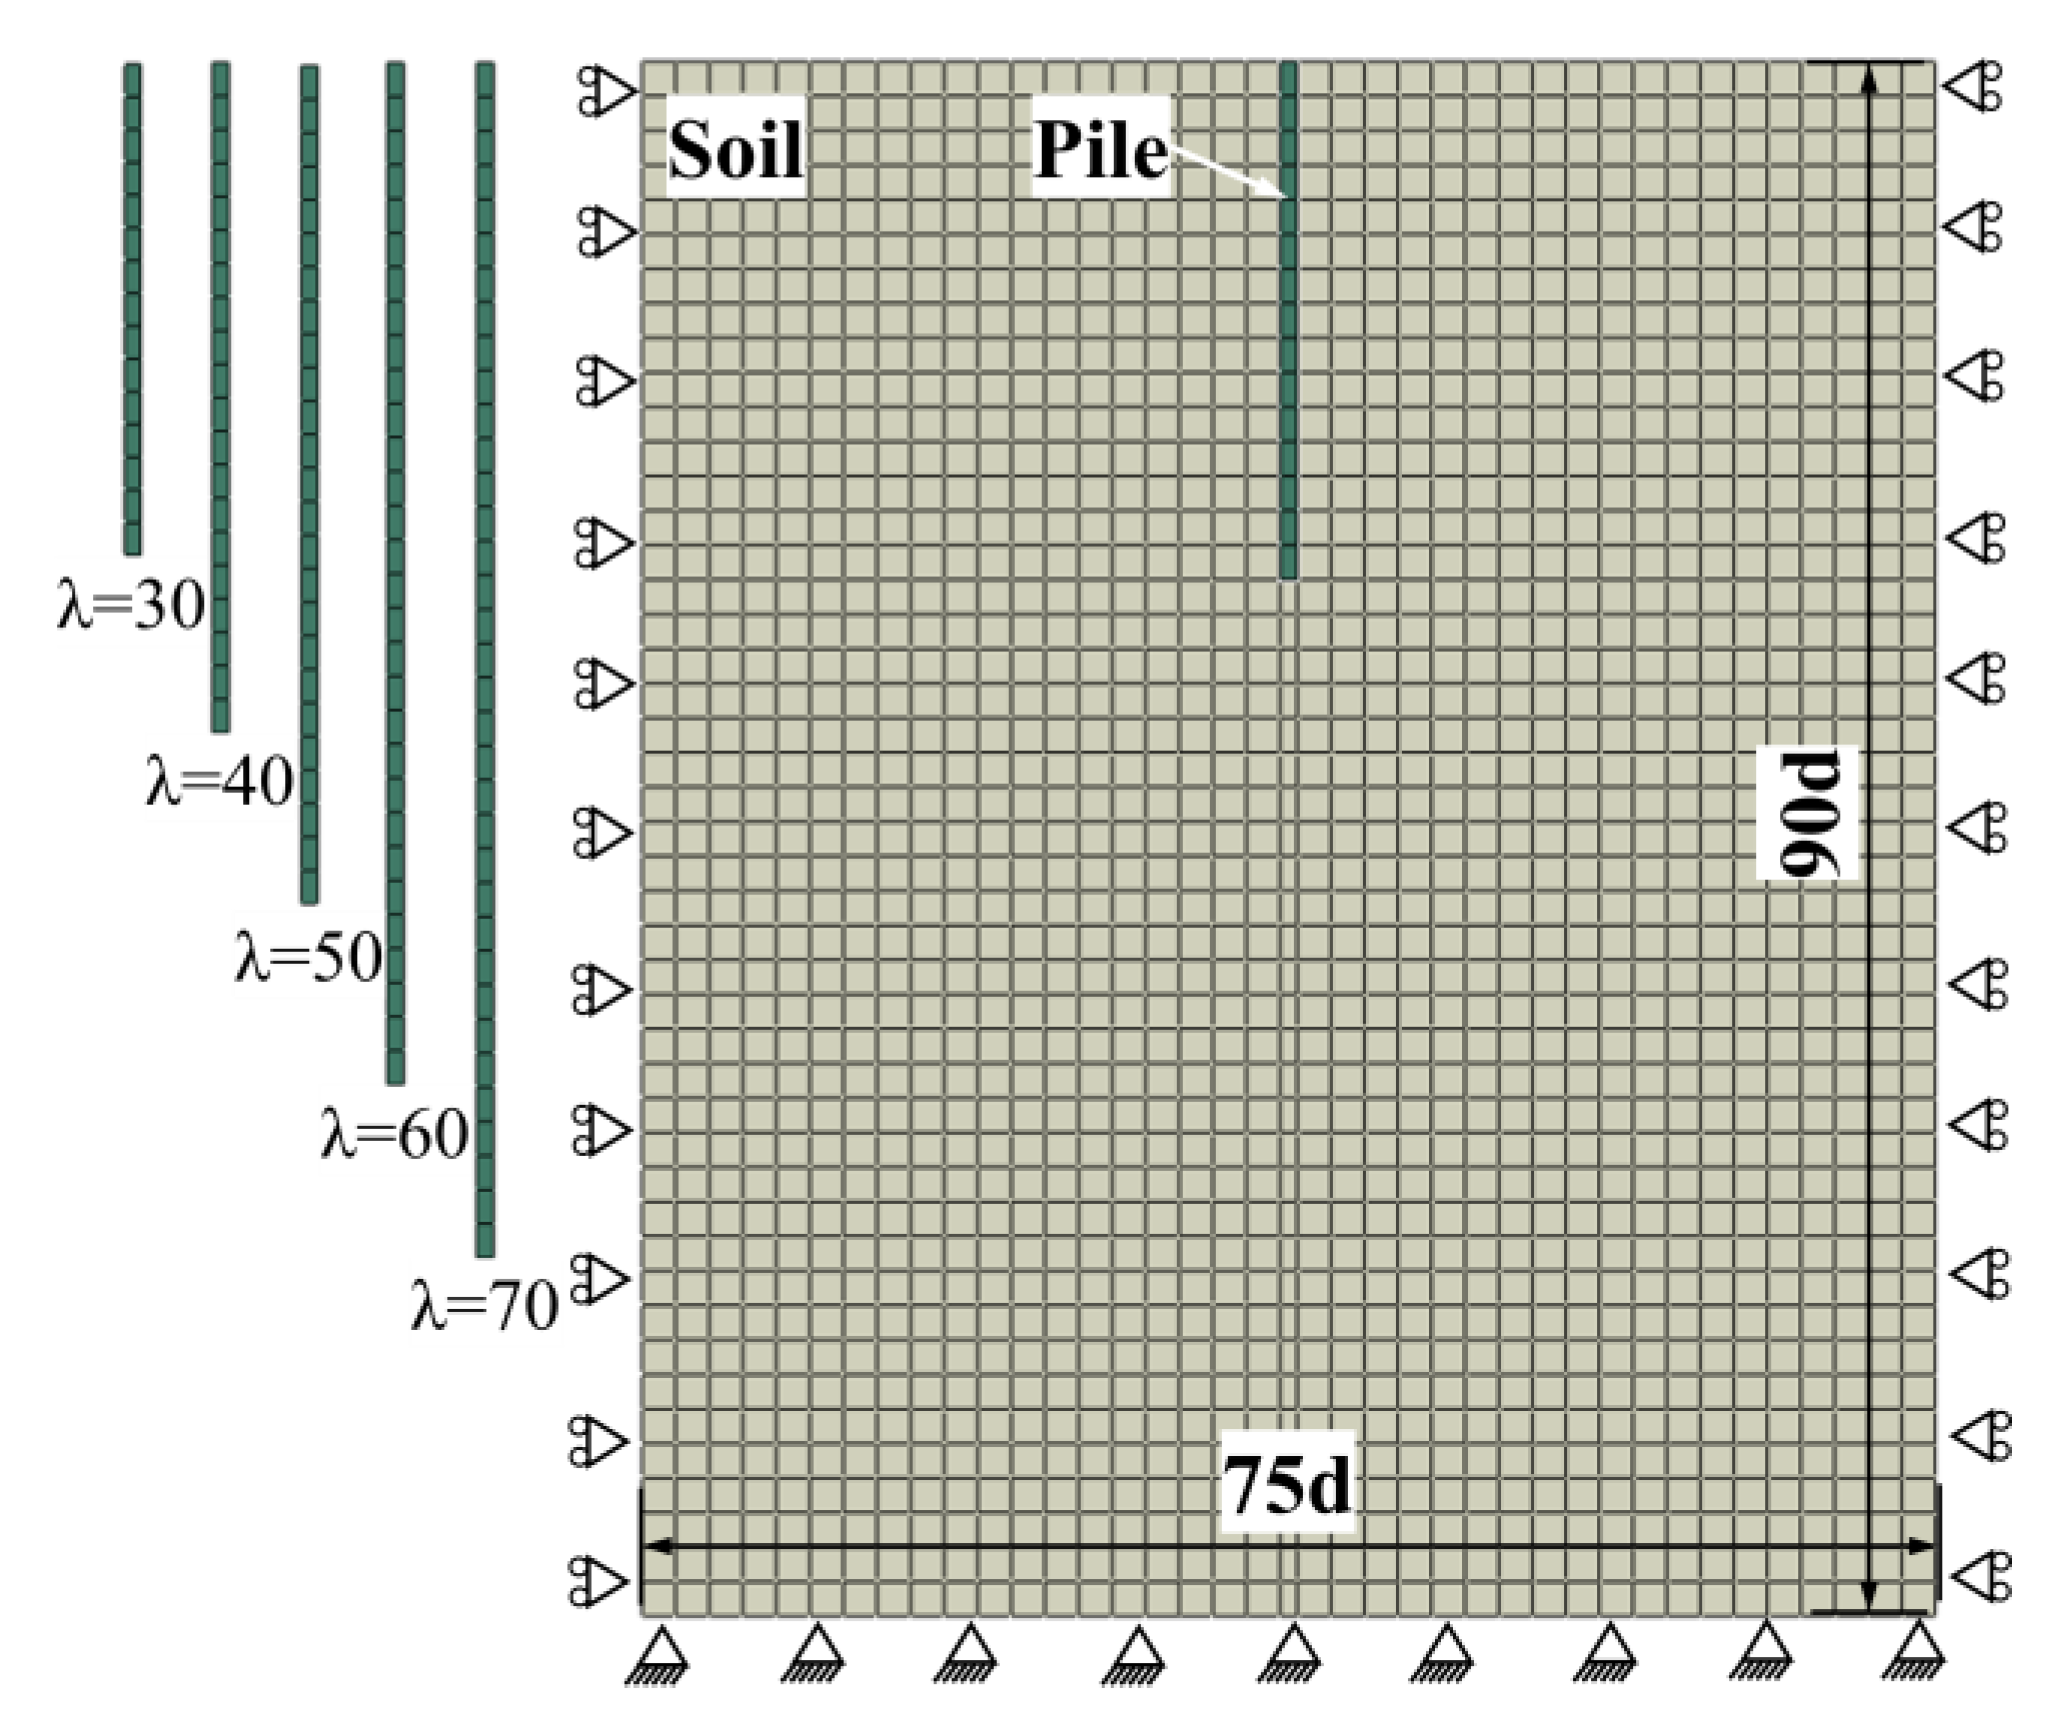
Based on the aforementioned experimental results, it is evident that the load distributions of different piles differ. Therefore, for micropiles with ≥ 30, the critical embedment depth may differ. To investigate the variation in Lcr with different values for , a finite element analysis model was established using Abaqus software (2023) to simulate the deformation of the soil surrounding a micropile under an uplift load. The critical embedment depth was determined by analyzing the plastic strain of the surrounding soil. Figure 8 shows the finite element analysis model, where the side and bottom boundaries are constrained by roller and pinned supports, respectively. The dimensions of the calculation region in the soil are 75 d (length) × 90 d (width). Displacement loading was applied at the top of the pile, with a displacement of 5 mm. The cell type of the soil is CPE4R, and the cell type of the pile is CPS4R. The type of contact between the pile and soil is general contact, and the contact algorithm is an augmented Lagrange algorithm. The shear behavior at the pile–soil interface was defined based on Coulomb’s friction law, where the tangential frictional stress is linearly proportional to the normal stress [34]. The pile–soil friction angle was set to 25.8°. The pile was modeled as a linear elastic material, while the soil was modeled using the Mohr–Coulomb model. The material parameters for the pile and soil are listed in Table 1. The pile diameter (d) is consistent with that in the model test. To enhance the generalizability of the results, additional cases with = 60 and = 70 were included.
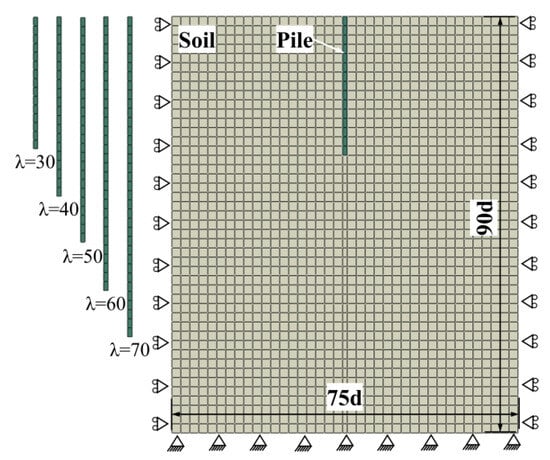
Figure 8.
The finite element analysis model.

Table 1.
Table of material parameters for pile and soil.
4.2.2. Validation of the Numerical Model
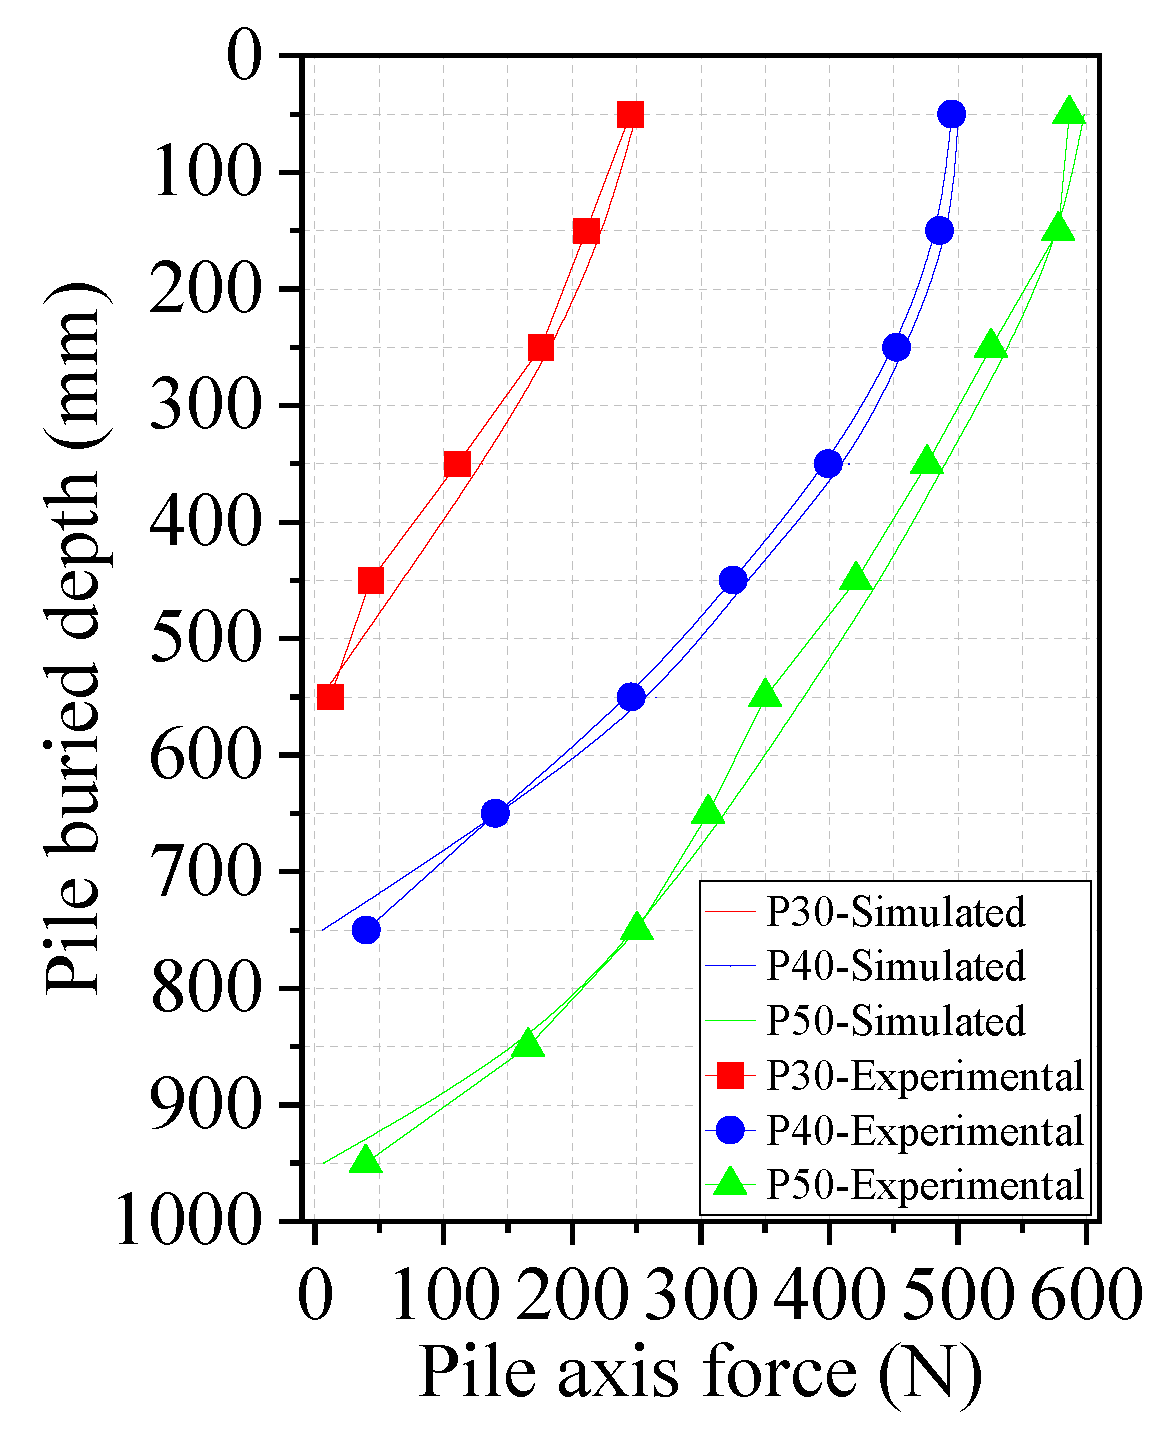
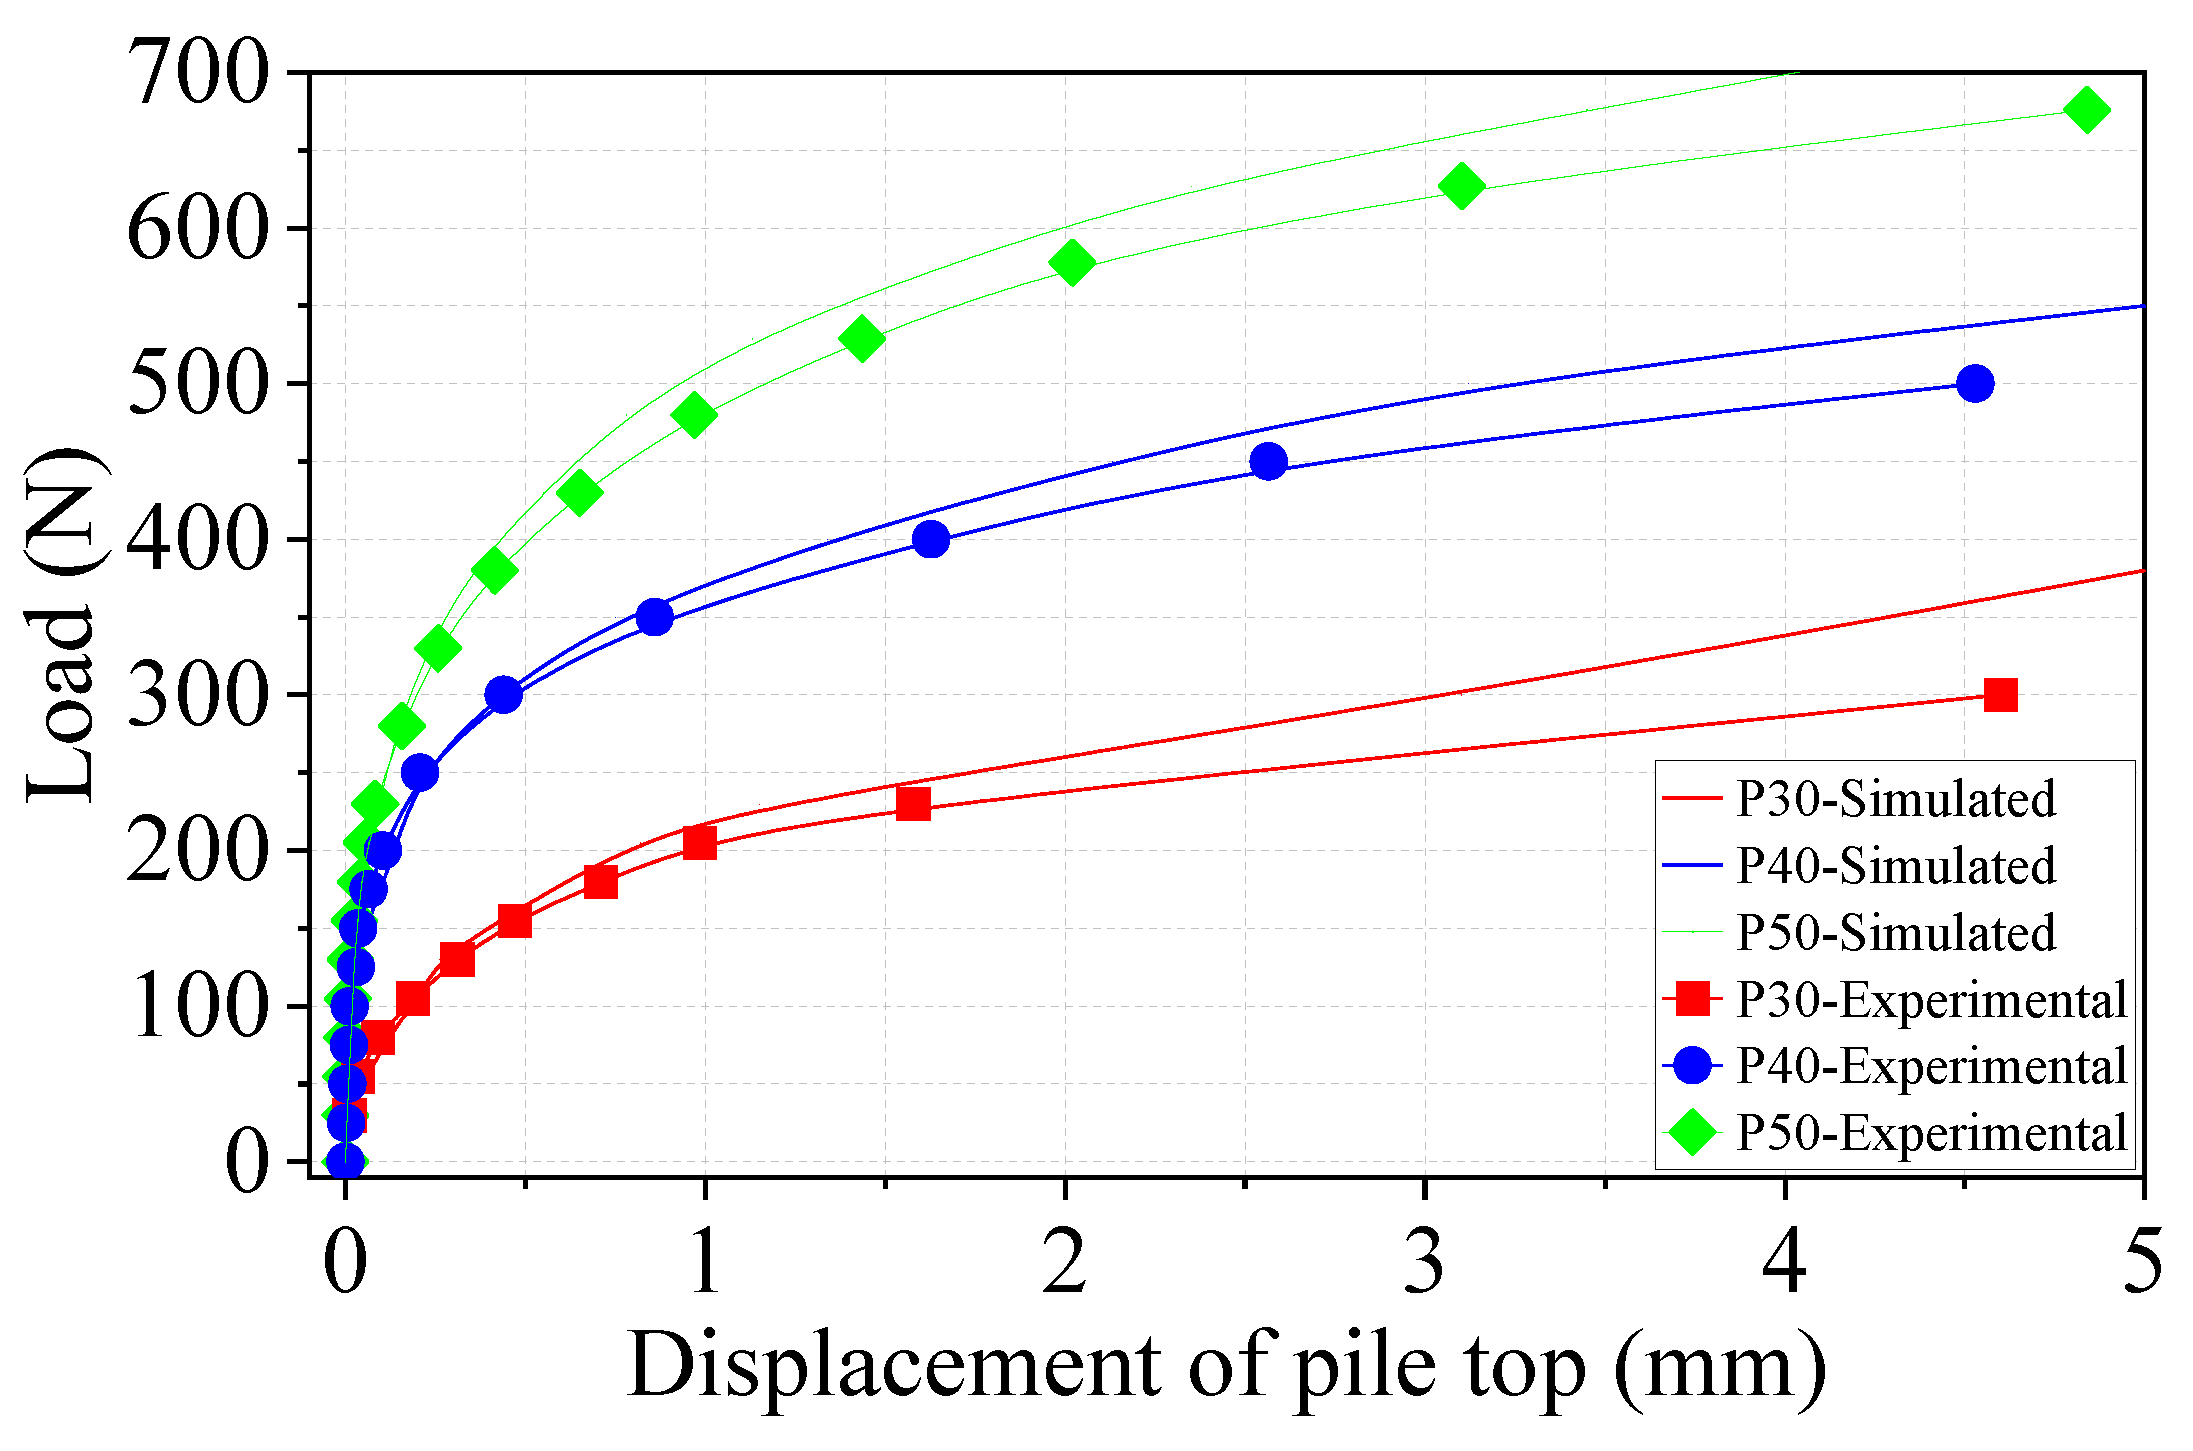
To validate the reliability of the numerical simulation model, the axial forces along the pile (at an uplift displacement of 5 mm at the top of the pile) and the load–displacement curves obtained from the model were compared with the experimental results. Figure 9 and Figure 10 show comparisons of the axial forces along the pile and the load–displacement curves, respectively. It can be observed that the axial forces and the load–displacement curves calculated using the numerical model are in excellent agreement with the experimental results from Figure 9 and Figure 10. The maximum error in the axial forces is 3.5%. The ultimate uplift capacities calculated using the numerical model are 199 N (P30), 390 N (P40), and 511 N (P50), with a maximum error of 4%. These results demonstrate that the established numerical model is highly reliable and can accurately predict the pile–soil interaction for micropiles under uplift loads. Based on the validated finite element model, the equivalent plastic strain contours of the surrounding soil for different micropiles at an uplift displacement of 5 mm were obtained, as shown in Figure 11.
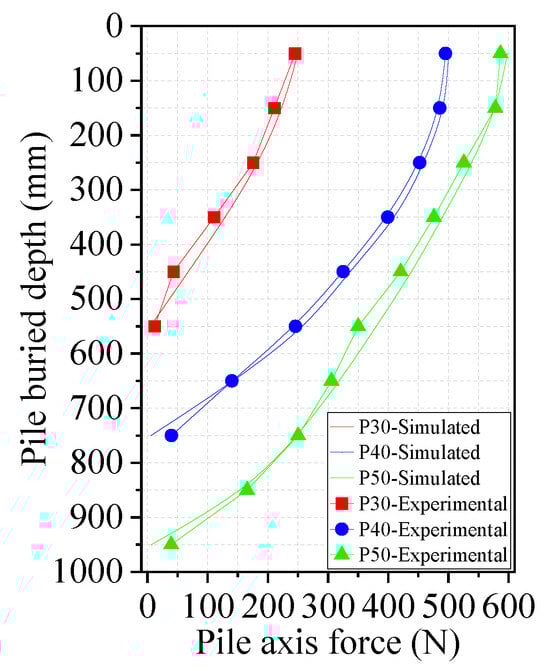
Figure 9.
A comparison of the experimental and simulated axial forces along the piles.
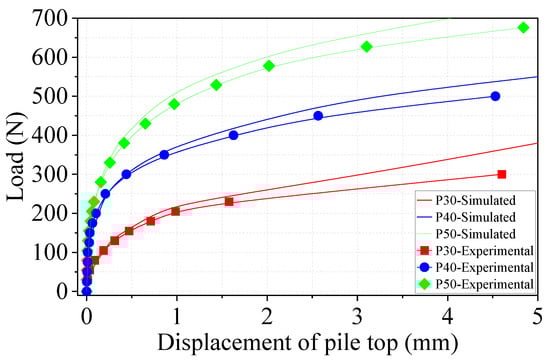
Figure 10.
Comparison of experimental and simulated load–displacement.
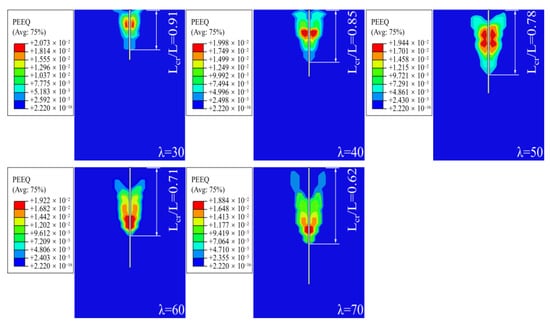
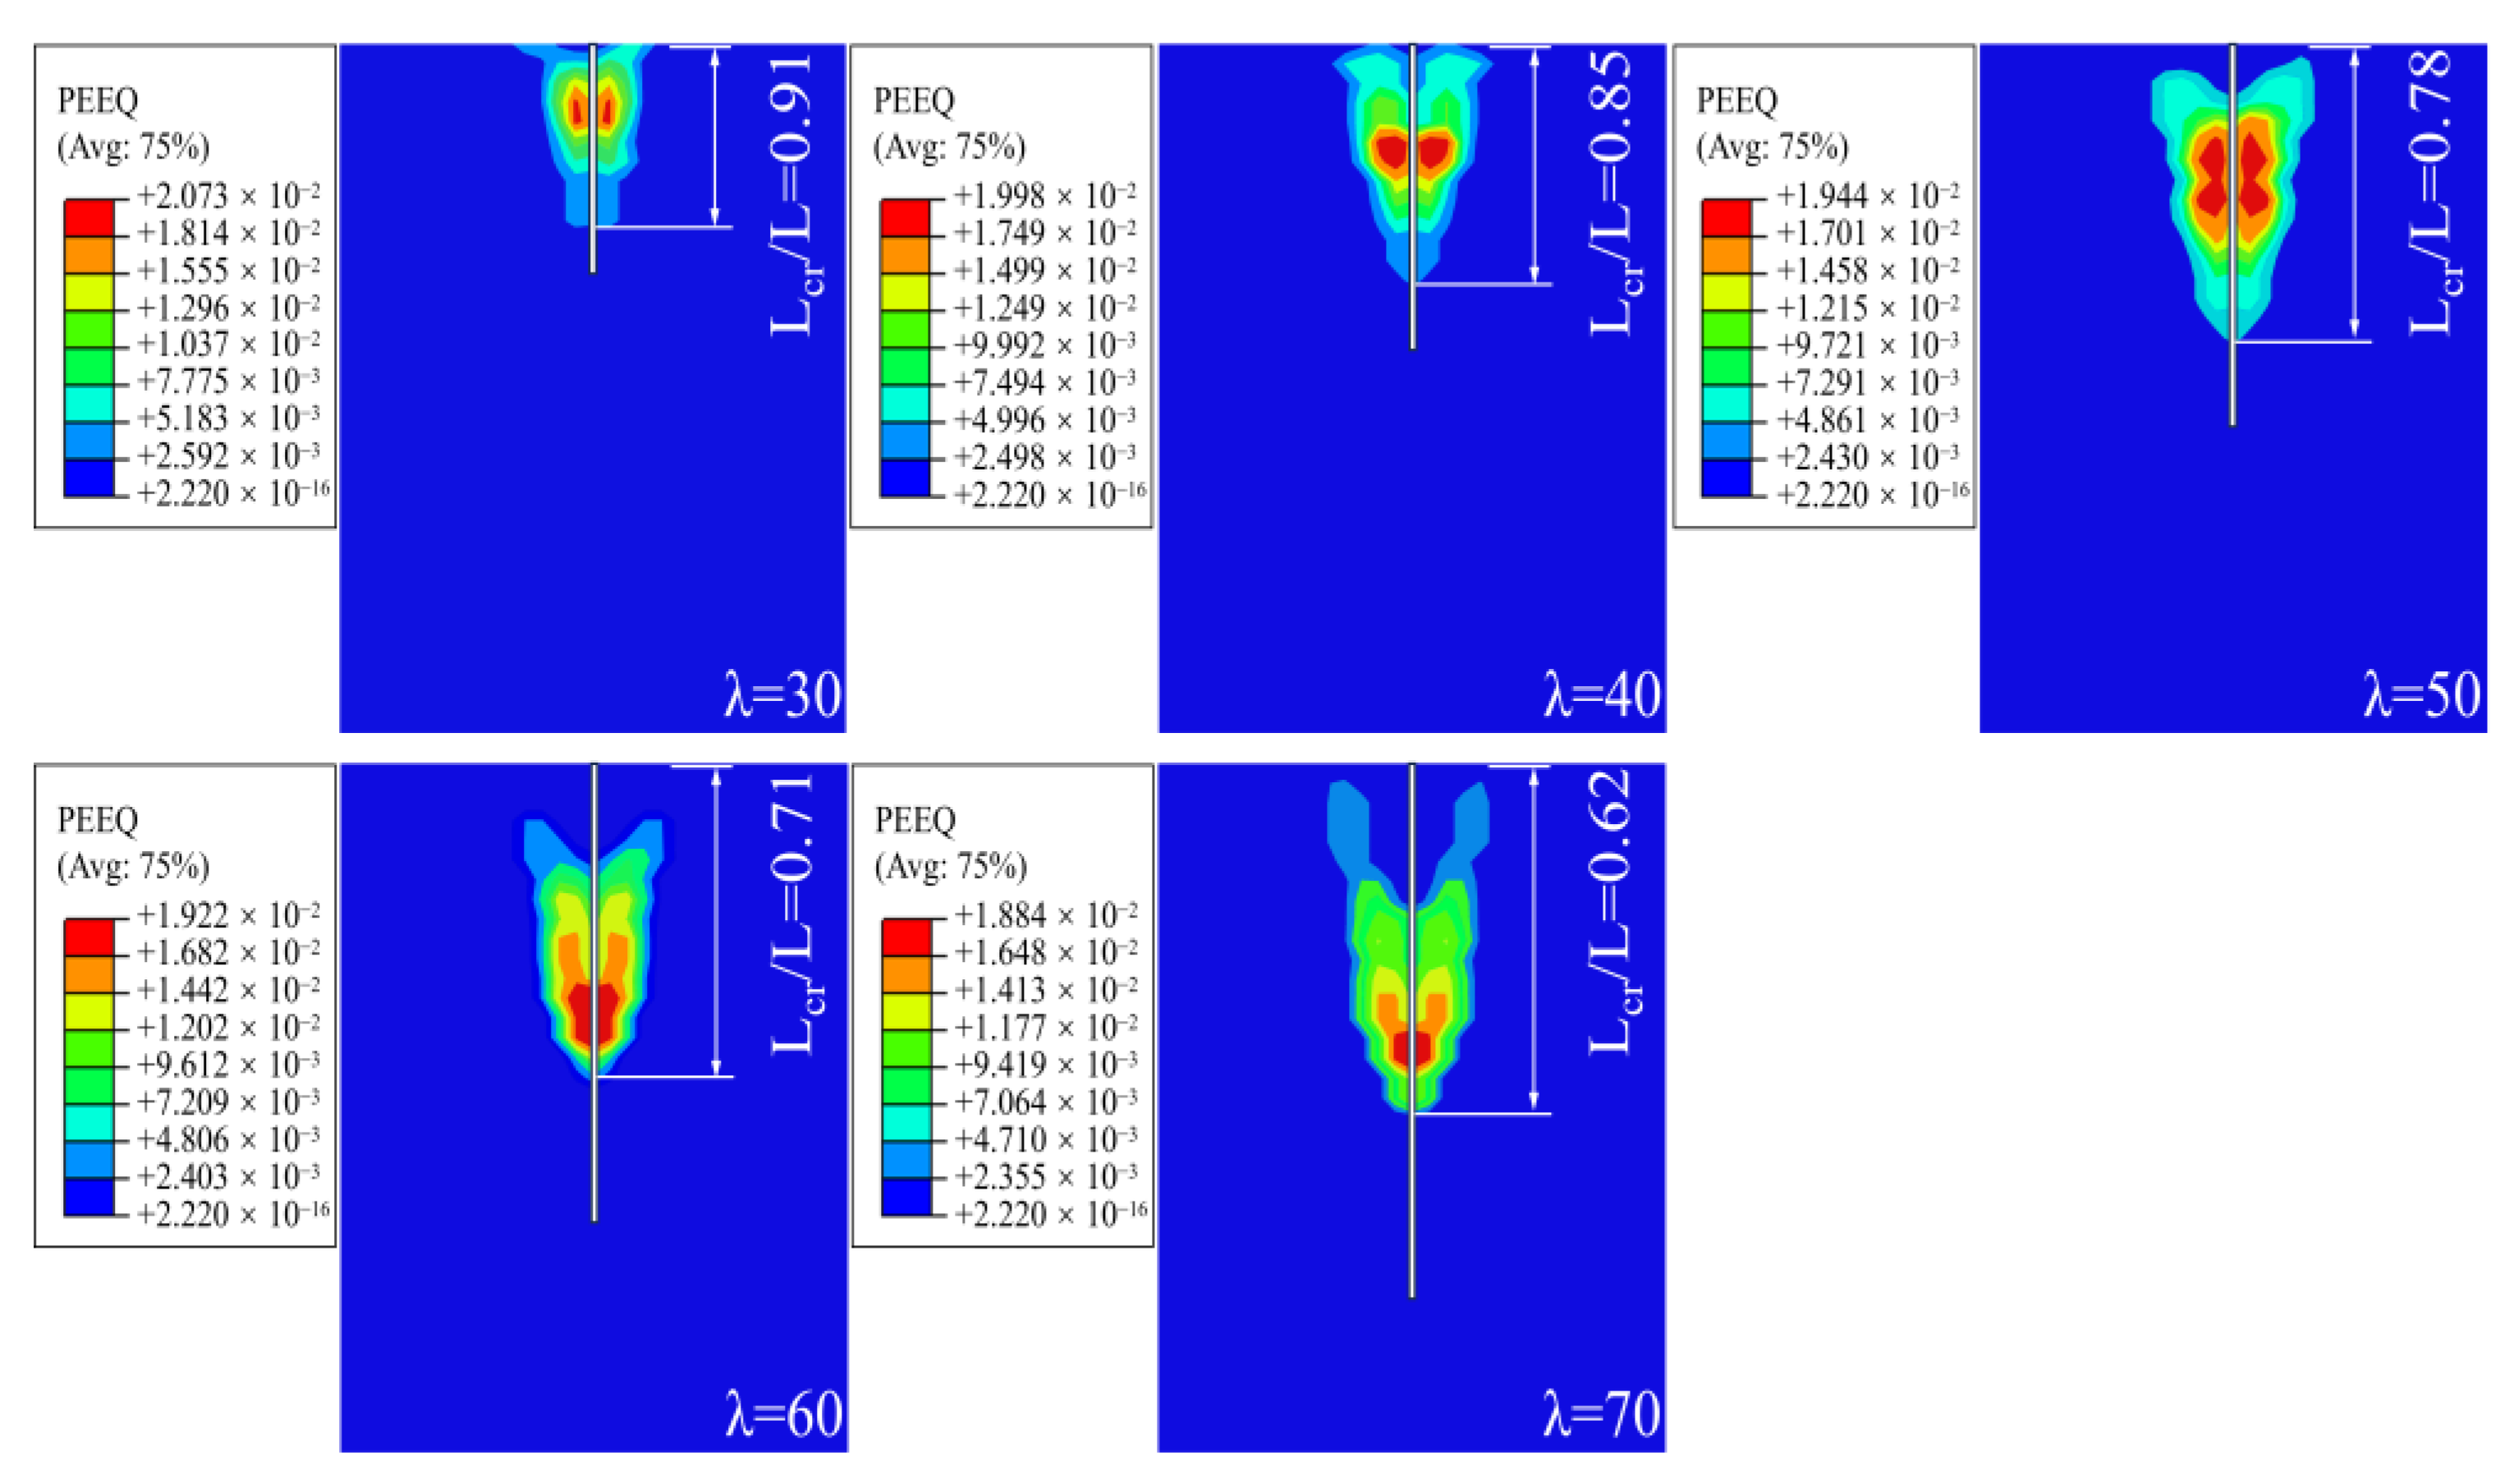
Figure 11.
The contours of the equivalent plastic strain in the surrounding soil at an uplift displacement of 5 mm.
From Figure 11, it can be observed that as increases, the extent of the failure surface in the surrounding soil expands, and the location of the failure surface, as well as the position of the maximum equivalent plastic strain, shifts deeper. The values of Lcr/L for the micropiles are 0.91, ( = 30), 0.85 ( = 40), 0.78 ( = 50), 0.71 ( = 60), and 0.62 ( = 70). By performing linear fitting on Lcr/L for different values of , the relationship between Lcr and (Equation (14)) was obtained, as shown in Figure 12. Substituting into Equation (11) yields Equation (15).
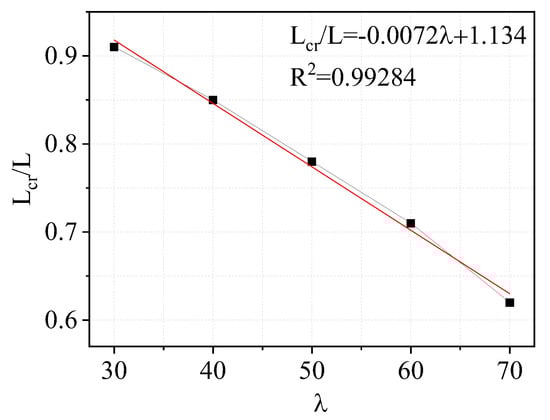
Figure 12.
Lcr for different values of .
4.3. Validation of the Improved Model
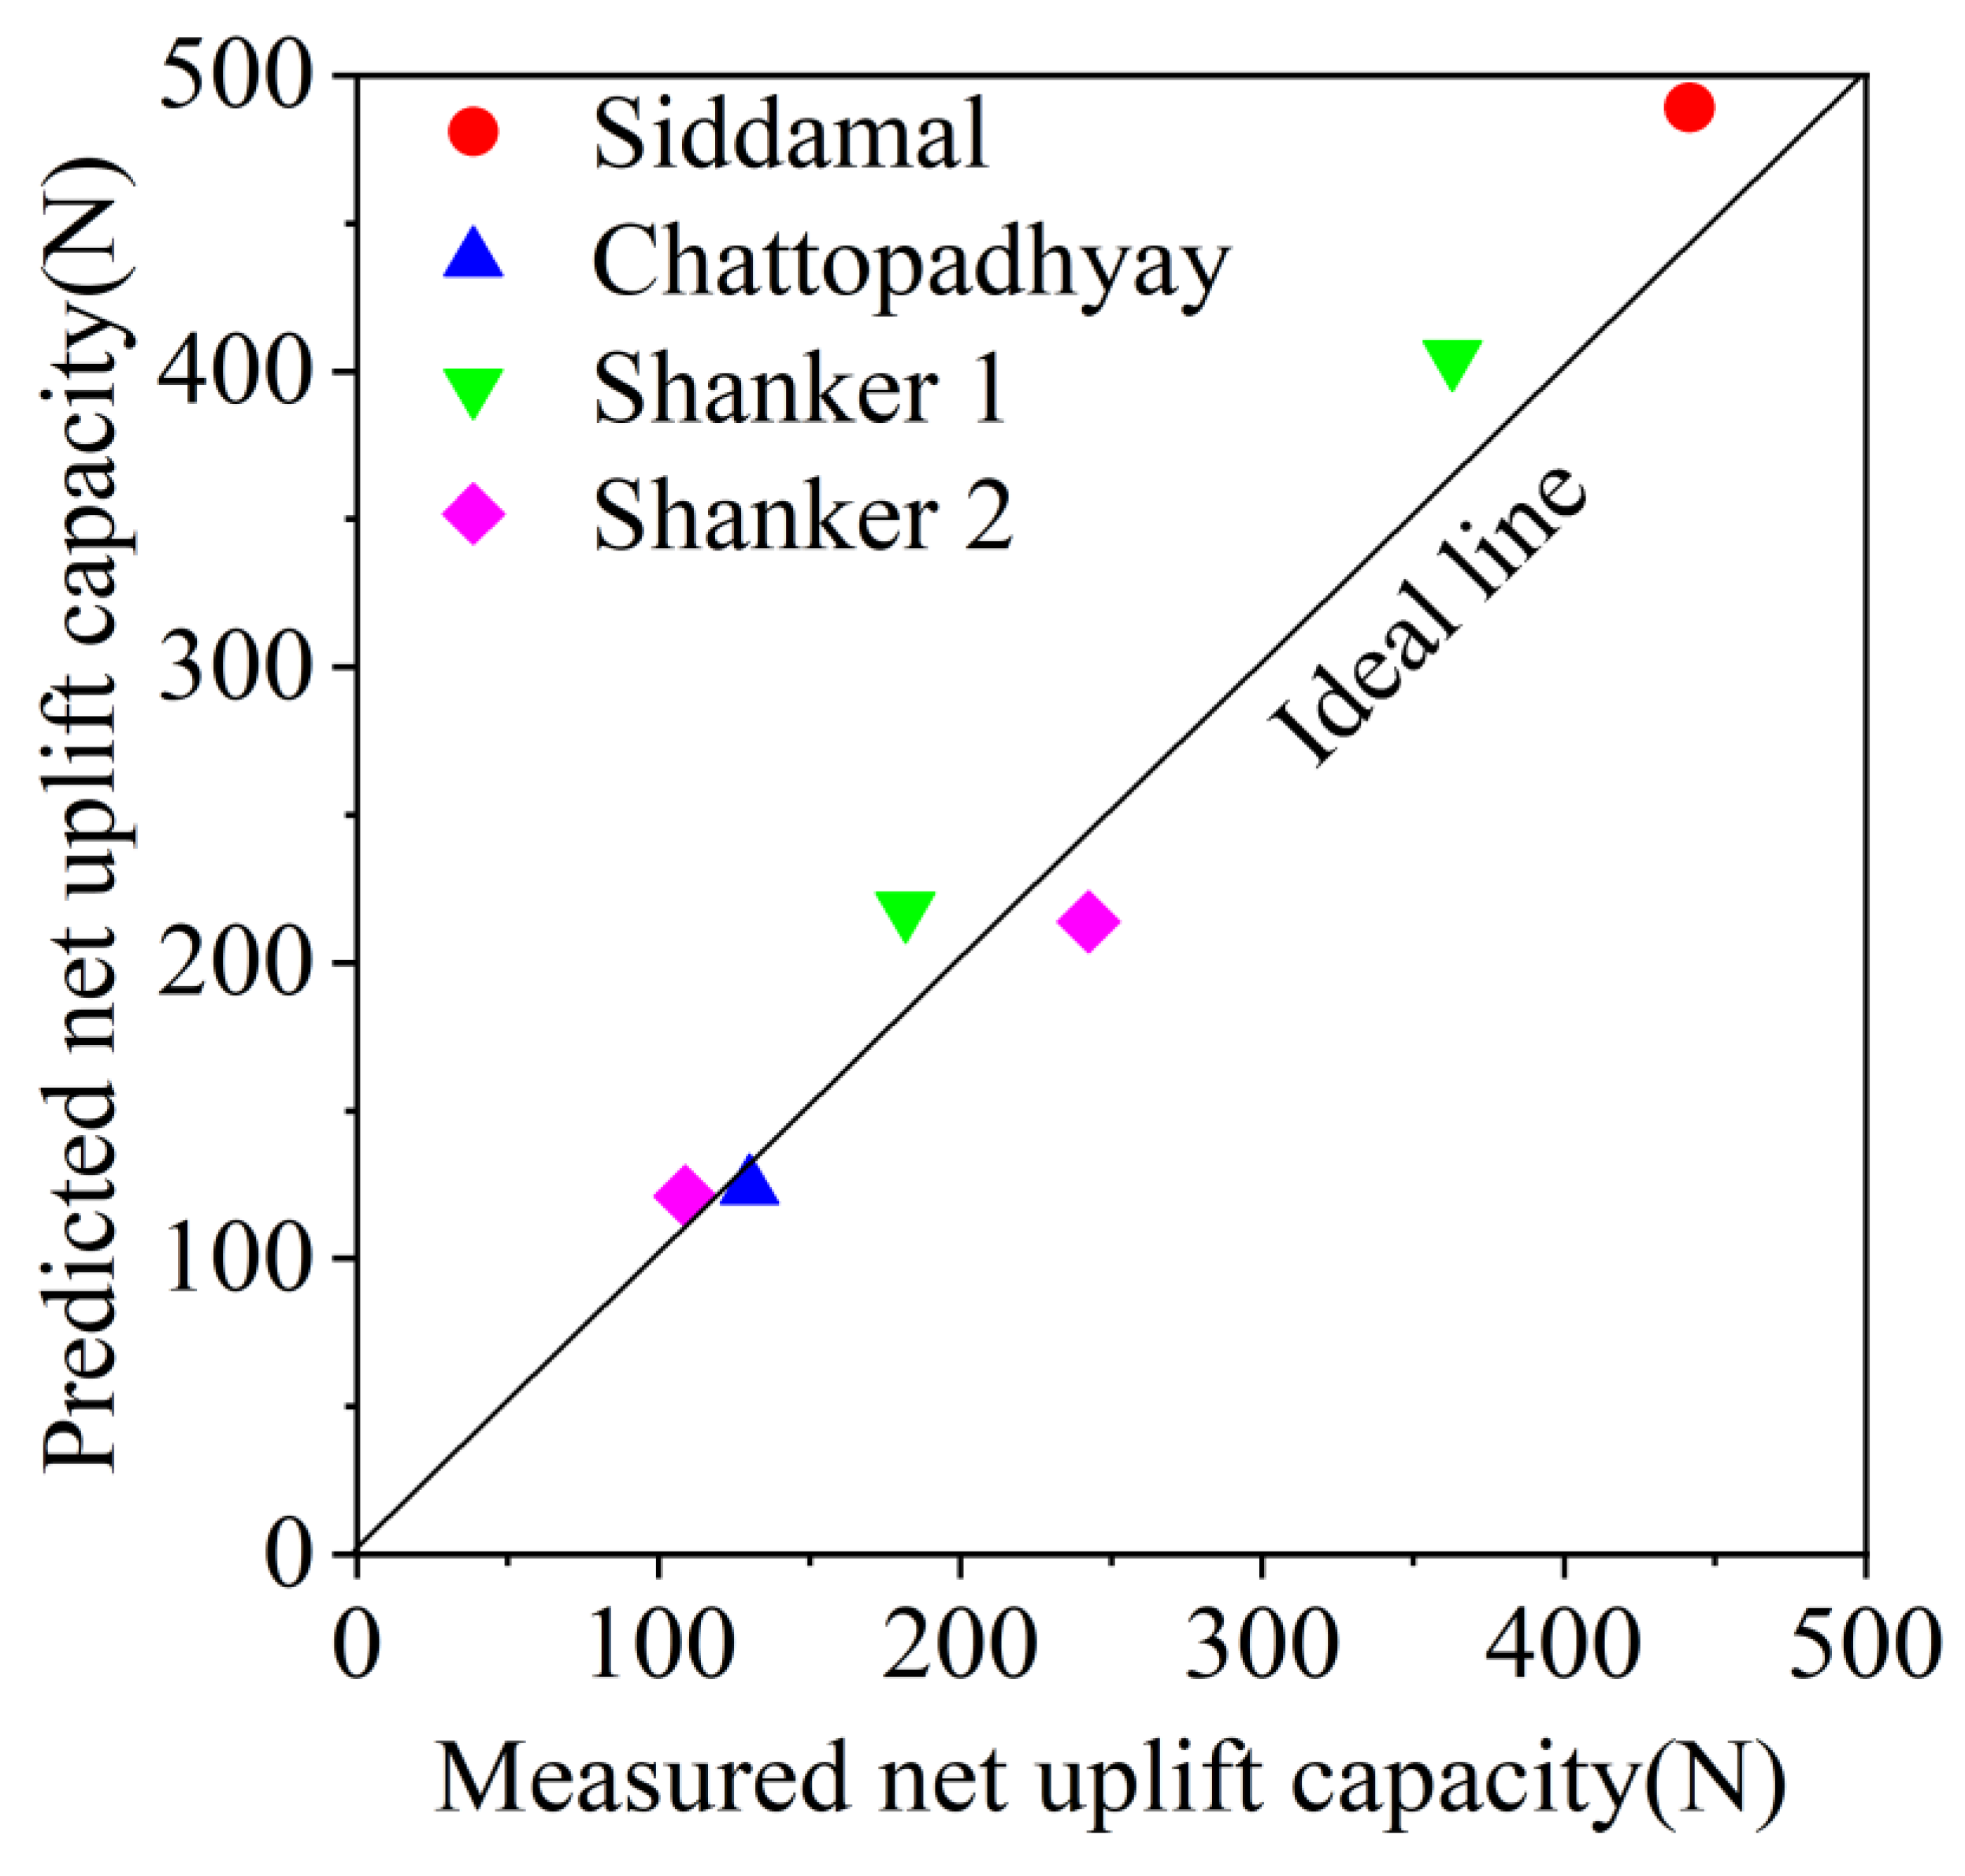
Siddamal [35], Chattopadhyay [19], and Shanker [20] reported a series of model tests on piles with ≥ 30 under uplift loads. Table 2 lists the test conditions, pile dimensions, theoretical predictions, and errors. The results show that the improved model has a very small error in the predictions for piles with high slenderness ratio compared to those of earlier models. Additionally, Figure 13 compares the results of the improved model with the measured values. The results show that the predicted values are in good agreement with the measured values, closely aligning with the ideal line, with the errors within 12%. This indicates that the improved model provides accurate predictions for the uplift capacity of micropiles.
Table 2.
The results of the improved model are compared with the experimental results.
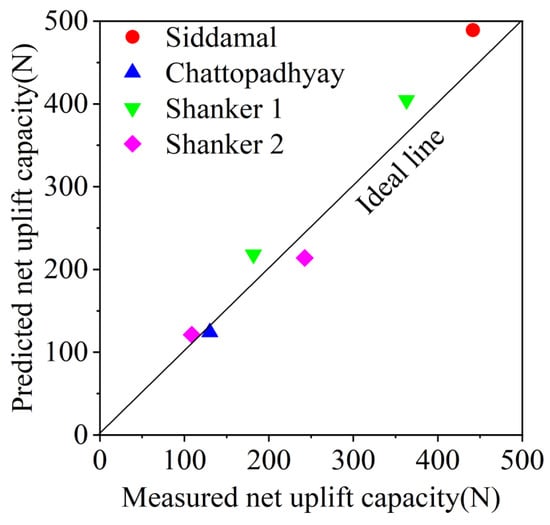
Figure 13.
The results of the improved model are compared with the experimental results [19,20,35].
5. Conclusions
This study investigates the uplift bearing performance and the deformation of the surrounding soil for micropiles using model tests and finite element simulations. A modified model for the ultimate uplift capacity of micropiles is created based on Shanker’s model. The following conclusions are obtained.
- (1)
- As the slenderness ratio increases, the ultimate uplift capacity of a pile gradually increases, but the rate of increase decreases progressively. The load distribution of the micropiles varies with their slenderness ratios, showing that as the slenderness ratio increases, the embedment effect and range of the surrounding soil at the lower part of the pile become more significant, and the critical embedment depth of the micropile shifts further away from the tip of the pile.
- (2)
- The improved model is suitable for predicting the uplift capacity of micropiles. Validation through case studies demonstrates that this method provides accurate predictions, with errors below 12%.
- (3)
- The improved model is easy to use without a complex analysis and is suitable for the rapid design of micropiles in engineering. It is recommended in practical projects to first calculate Lcr using Equation (14) based on the preliminarily designed . Subsequently, Pnu should be calculated via Equation (15), compared with the design value, and an appropriate selected to optimize the design of the micropile size.
- (4)
- The current model does not encompass specific soil conditions (e.g., expansive soil and collapsible loess). Future research will incorporate in situ testing and specialized soil analyses to expand the model’s applicability.
Author Contributions
Conceptualization: L.B. and Y.Z. (Yuesong Zheng). Methodology: Z.G. Software: Y.Z. (Yi Zhou) Validation: D.W., W.W. and Z.G. Formal analysis: Z.X. Investigation: Y.Z. (Yuesong Zheng). Resources: Z.X. Data curation: Y.Z. (Yi Zhou). Writing—original draft preparation: W.W. Writing—review and editing: Z.G. Visualization: Z.G. Supervision: Z.X. Project administration: Z.X. Funding acquisition: L.B. All authors have read and agreed to the published version of the manuscript.
Funding
The research was partially supported by a State Grid Henan Electric Power Company Science and Technology Project, named Research and Application of Key Technologies for Prefabricated Micro-Pile Foundations in Overhead Transmission Lines, under Grant No. 5217L024000Q.
Data Availability Statement
The data presented in this study can be made available on request to the corresponding author.
Acknowledgments
The authors sincerely thank the all respondents for their participation and the organizations for supporting this research.
Conflicts of Interest
Authors Linli Bao and Dongya Wu were employed by the company State Grid Henan Electric Power Company. The remaining authors declare that the research was conducted in the absence of any commercial or financial relationships that could be construed as a potential conflict of interest.
References
- Bruce, D.A.; Dimillio, A.F.; Juran, I. Introduction to Micropiles: An International Perspective; Kentucky Geotechnical Special Publication, ASCE: Louisville, KY, USA, 1995; pp. 1–26. [Google Scholar]
- Hwang, T.H.; Kim, K.H.; Shin, J.H. Experimental and numerical study on lateral resistance of micropile in sand. KSCE J. Civ. Eng. 2023, 27, 3740–3752. [Google Scholar] [CrossRef]
- Kyung, D.; Lee, J. Uplift load-carrying capacity of single and group micropiles installed with inclined conditions. J. Geotech. Geoenviron. Eng. 2017, 143, 04017031. [Google Scholar] [CrossRef]
- Wang, H.J. Research on micropile foundation of transmission tower on soft soil area. In Proceedings of the 2016 5th International Conference on Civil, Architectural and Hydraulic Engineering (ICCAHE 2016), Zhuhai, China, 30–31 July 2016; Beijing China Atlantis Press: Beijing, China, 2016; pp. 574–579. [Google Scholar]
- Yu, X.; Wang, X. Research on the Design of Miniature Pile Foundation for Transmission Line. E3S Web Conf. EDP Sci. 2019, 136, 02022. [Google Scholar] [CrossRef]
- Emirler, B.; Tolun, M.; Yildiz, A. Investigation on determining uplift capacity and failure mechanism of the pile groups in sand. Ocean Eng. 2020, 218, 108145. [Google Scholar] [CrossRef]
- Elsawwaf, A.; El Sawwaf, M.; Farouk, A.; Aamer, F.; El Naggar, H. Restoration of tilted buildings via micropile underpinning: A case study of a multistory building supported by a raft foundation. Buildings 2023, 13, 422. [Google Scholar] [CrossRef]
- Zhang, Y.; Zhang, F.; El Naggar, M.H.; Wu, W. Seismic response of pile group embedded in unsaturated soil considering the coupling of kinematic and inertia pile-pile interactions. Comput. Geotech. 2025, 178, 106937. [Google Scholar] [CrossRef]
- Li, L.; Yan, N.; Liu, Z.; Wu, W.; Jiang, G.; Chen, L.; Liu, H. Investigation on the cyclic laterally-loaded response of pile-bucket foundation with grouted connection. Mar. Struct. 2025, 103, 103808. [Google Scholar] [CrossRef]
- Borthakur, N.; Dey, A.K. Evaluation of group capacity of micro-pile in soft clayey soil from experimental analysis using SVM-based prediction model. Int. J. Geomech. 2020, 20, 04020008. [Google Scholar] [CrossRef]
- Li, H.; Ren, G. Horizontal and uplift bearing characteristics of a cast-in-place micropile group foundation in a plateau mountainous area. Sustainability 2023, 15, 13554. [Google Scholar] [CrossRef]
- Tsukada, Y.; Miura, K.; Tsubokawa, Y.; Otani, Y.; You, G.-L. Mechanism of bearing capacity of spread footings reinforced with micropiles. Soils Found. 2006, 46, 367–376. [Google Scholar] [CrossRef]
- Jang, Y.E.; Kim, B.; Wang, C.; Han, J.-T. Prediction of vertical bearing capacity of waveform micropile. Géotech. Lett. 2019, 9, 198–204. [Google Scholar] [CrossRef]
- Elsawwaf, A.; Nazir, A.; Azzam, W. The effect of combined loading on the behavior of micropiled rafts installed with inclined condition. Environ. Sci. Pollut. Res. 2022, 29, 81321–81336. [Google Scholar] [CrossRef] [PubMed]
- Lee, K.I.L.; Kim, M.Y.; Hwang, T.H. Reinforcement effect of micropile and bearing characteristics of micropiled raft according to the cohesion of soil and stiffness of pile. Geomech. Eng. 2024, 37, 511–525. [Google Scholar]
- Kishida, H. Stress distribution by model piles in sand. Soils Found. 1963, 4, 1–23. [Google Scholar] [CrossRef]
- Meyerhof, G.G. Uplift resistance of inclined anchors and piles. In Proceedings of the 8th International Conference on Soil Mechanics and Foundation Engineering, Moscow, Russia, 6–11 August 1973; Volume 2, pp. 167–172. [Google Scholar]
- Das, B.M. A procedure for estimation of uplift capacity of rough piles. Soils Found. 1983, 23, 122–126. [Google Scholar] [CrossRef]
- Chattopadhyay, B.C.; Pise, P.J. Uplift capacity of piles in sand. J. Geotech. Eng. 1986, 112, 888–904. [Google Scholar] [CrossRef]
- Shanker, K.; Basudhar, P.K.; Patra, N.R. Uplift capacity of single piles: Predictions and performance. Geotech. Geol. Eng. 2007, 25, 151–161. [Google Scholar] [CrossRef]
- Shelke, A.; Patra, N.R. Effect of arching on uplift capacity of pile groups in sand. Int. J. Geomech. 2008, 8, 347–354. [Google Scholar] [CrossRef]
- Zhang, Q.; Feng, R.; Liu, S.; Li, X.-M. Estimation of uplift capacity of a single pile embedded in sand considering arching effect. Int. J. Geomech. 2018, 18, 06018021. [Google Scholar] [CrossRef]
- Grindheim, B.; Trinh, N.; Li, C.C.; Høien, A.H. Investigating Load Arches and the Uplift Capacity of Rock Anchors: A Numerical Approach. Rock Mech. Rock Eng. 2024, 57, 7313–7342. [Google Scholar] [CrossRef]
- Deshmukh, V.B.; Dewaikar, D.M.; Choudhury, D. Computations of uplift capacity of pile anchors in cohesionless soil. Acta Geotech. 2010, 5, 87–94. [Google Scholar] [CrossRef]
- Chattopadyay, B.C. Uplift capacity of pile groups. In Proceedings of the 13thICSMFE, New Delhi, India, 5–10 January 1994; pp. 539–542. [Google Scholar]
- Hong, W.P.; Chim, N. Prediction of uplift capacity of a micropile embedded in soil. KSCE J. Civ. Eng. 2015, 19, 116–126. [Google Scholar] [CrossRef]
- Iai, S. Similitude for shaking table tests on soil-structure-fluid model in 1g gravitational field. Soils Found. 1989, 29, 105–118. [Google Scholar] [CrossRef]
- FHWA. Micropile Design and Construction Reference Manual for NHI Course 132078; Federal Highway Administration, United States Department of Transportation: Washington, DC, USA, 2005.
- Miura, K.; Tsukada, Y.; Tsubokawa, Y.; Ishito, M.; Nishimura, N.; Ohtani, Y.; You, G.L. Bearing capacity during the earthquake of the spread footing reinforced with micropiles. In Proceedings of the 12th World Conference on Earthquake Engineering, Auckland, New Zealand, Japan, 30 January–4 February 2000. [Google Scholar]
- ASTM D3080/D3080M-11; Standard Test Method for Direct Shear Test of Soils Under Consolidated Drained Conditions. ASTM: West Conshohocken, PA, USA, 2014.
- Da Silva, L.S.; Simões, R.; Gervásio, H. Design of Steel Structures: Eurocode 3: Design of Steel Structures, Part 1-1: General Rules and Rules for Buildings; John Wiley & Sons: Hoboken, NJ, USA, 2012. [Google Scholar]
- American Petroleum Institute. API RP 2GEO: Recommended Practice for Geotechnical and Foundation Design Considerations, 2nd ed.; API Publishing Services: Washington, DC, USA, 2021. [Google Scholar]
- Johnson, S.M.; Kavanagh, C.T. The Design of Foundations for Buildings; McGraw-Hill Book Company: New York, NY, USA, 1968. [Google Scholar]
- Hong, Y.; He, B.; Wang, L.Z.; Wang, Z.; Ng, C.W.W.; Masín, D. Cyclic lateral response failure mechanisms of semi-rigid pile in soft clay: Centrifuge tests numerical modelling. Can. Geotech. J. 2017, 54, 806–824. [Google Scholar] [CrossRef]
- Siddamal, U.V. Behavior of Pile Group Under Uplift Loads. Master’s Thesis, Indian Institute of Technology, Ghana City, India, 1989. [Google Scholar]

Disclaimer/Publisher’s Note: The statements, opinions and data contained in all publications are solely those of the individual author(s) and contributor(s) and not of MDPI and/or the editor(s). MDPI and/or the editor(s) disclaim responsibility for any injury to people or property resulting from any ideas, methods, instructions or products referred to in the content. |
© 2025 by the authors. Licensee MDPI, Basel, Switzerland. This article is an open access article distributed under the terms and conditions of the Creative Commons Attribution (CC BY) license (https://creativecommons.org/licenses/by/4.0/).