Article

Gammaherpesvirus Infection Stimulates Lung Tumor-Promoting Inflammation

1
Departments of Microbiology & Immunology and Pathology & Laboratory Medicine, School of Medicine, Tulane University, New Orleans, LA 70118, USA
2
Department of Obstetrics & Gynecology, School of Medicine, Tulane University, New Orleans, LA 70118, USA
3
Departments of Medicine & Pediatrics, School of Medicine, Tulane University, New Orleans, LA 70118, USA
4
Division of Pulmonary, Critical Care and Environmental Medicine, Department of Medicine, School of Medicine, Tulane University, New Orleans, LA 70118, USA
5
Department of Pathology & Laboratory Medicine, School of Medicine, Tulane Cancer Center, Tulane University, New Orleans, LA 70118, USA
6
Department of Microbiology and Immunology, School of Medicine, Tulane University, New Orleans, LA 70118, USA
*
Author to whom correspondence should be addressed.
Pathogens 2024, 13(9), 747; https://doi.org/10.3390/pathogens13090747 (registering DOI)
Submission received: 29 June 2024 / Revised: 27 August 2024 / Accepted: 28 August 2024 / Published: 31 August 2024
(This article belongs to the Special Issue Oncogenic Viruses)

Abstract

:
Lung tumor-promoting environmental exposures and γherpesvirus infections are associated with Type 17 inflammation. To test the effect of γherpesvirus infection in promoting lung tumorigenesis, we infected mutant K-Ras-expressing (K-RasLA1) mice with the murine γherpesvirus MHV68 via oropharyngeal aspiration. After 7 weeks, the infected mice displayed a more than 2-fold increase in lung tumors relative to their K-RasLA1 uninfected littermates. Assessment of cytokines in the lung revealed that expression of Type 17 cytokines (Il-6, Cxcl1, Csf3) peaked at day 7 post-infection. These observations correlated with the post-infection appearance of known immune mediators of tumor promotion via IL-17A in the lungs of tumor-bearing mice. Surprisingly, Cd84, an immune cell marker mRNA, did not increase in MHV68-infected wild-type mice lacking lung tumors. Csf3 and Cxcl1 protein levels increased more in the lungs of infected K-RasLA1 mice relative to infected wild-type littermates. Flow cytometric and transcriptomic analyses indicated that the infected K-RasLA1 mice had increased Ly6Gdim/Ly6Chi immune cells in the lung relative to levels seen in uninfected control K-RasLA1 mice. Selective methylation of adenosines (m6A modification) in immune-cell-enriched mRNAs appeared to correlate with inflammatory infiltrates in the lung. These observations implicate γherpesvirus infection in lung tumor promotion and selective accumulation of immune cells in the lung that appears to be associated with m6A modification of mRNAs in those cells.

1. Introduction

Lung cancer is the leading cause of cancer-related mortality worldwide, comprising almost 25% of all cancer-related deaths [1,2]. In the US, the primary environmental risk factor for lung cancer is tobacco smoke [3]. Human lung carcinogens such as tobacco smoke, asbestos, and silica elicit Type 17 inflammation, an inflammatory phenotype that induces tumorigenesis in autochthonous murine lung tumor models [4,5,6,7]. IL-17A (typically referred to as IL-17 and will be so hereafter), the hallmark cytokine of Type 17 inflammation, can be expressed by a variety of innate and adaptive immune cell types, but CD4+ T helper cells are the principal source [8]. The significance of the relationship between Type 17 inflammation and lung carcinogenesis has been heightened by the recent observation that normal human lung tissue displays a high incidence (>50%) of lung tumor-promoting oncogenes [9]. These observations are consistent with the concept that the chronic inflammation induced by environmental exposures, more specifically chronic Type 17 inflammation, contributes to the pathogenesis of lung cancer. Thus, other agents that trigger Type 17 inflammation could contribute to human lung cancer.
The observation that the genomes of two γherpesviruses, Herpesvirus saimiri and Kaposi’s sarcoma herpesvirus (KSHV), encode the Type 17 cytokines IL-17 and IL-6 [10,11], respectively, suggests that Type 17 inflammation is integral to γherpesvirus replication. The association of γherpesviruses with Type 17 inflammation suggests that these viruses, particularly Epstein–Barr virus (EBV) in humans, could be contributors to lung tumorigenesis [10,12,13,14]. The γherpesviruses are host specific; therefore, the similar murine γherpesvirus 68 (MHV68) has generally served as a genetically and biologically relevant model for in vivo interactions between the γherpesviruses and their host [15]. Like EBV, intranasal infection of mice with MHV68 leads to productive infection of cells of the respiratory mucosa and viral persistence in a variety of immune cell types, primarily B-lymphocytes. Plasma cell differentiation of latently infected B cells correlates with virus reactivation from latency [16]. The pathology induced by the γherpesvirus infection/reactivation is generally the consequence of T cell proliferation to repress virus-infected B cells [17].
Although it is estimated that EBV infects more than 90% of the world’s population [18], only a small fraction (~1.5%) of human cancers worldwide express EBV viral transcripts in the tumor cells [19]. EBV contributes to neoplastic and lymphoproliferative disorders including undifferentiated nasopharyngeal carcinoma, lymphomas, gastric carcinomas, and breast cancer [19,20,21], but its association with lung cancer has been less defined [22,23,24]. The ability of the virus to undergo latency and persist long term in memory B cells [19] provides a means to perpetuate chronic effects that benefit virus propagation and coincidentally favor tumorigenesis. Although not considered a major lung carcinogen, EBV has been suspected to play a role in exacerbating lung cancer [23,24]. In addition to the mode of γherpesvirus-related tumorigenesis in the tumor types cited above, the data shown here are consistent with the concept that virus infection gives rise to lung tumor-promoting inflammation, which includes lung accumulation of immune cells with characteristics previously identified as pro-tumorigenic in lung cancer [25].

2. Materials and Methods

2.1. MHV68 Preparation

BALB/3T12-3 cells were used to grow MHV68, whereas BHK-21/C-13 cells were used for viral titration. Both cell lines were purchased from ATCC and cultured in complete Dulbecco’s modified Eagle’s medium (DMEM with glutamax) supplemented with 10% fetal bovine serum (FBS), 100 U of penicillin/mL, and 100 mg of streptomycin/mL [26,27]. BALB/3T12-3 cells were passaged into 5–15 cm plates and grown until they reached 80–90% confluence. BALB/3T12-3 cells were infected with MHV68 (ATCC) at an MOI of 0.1 in DMEM (2% FBS, 1% penicillin/streptomycin) and incubated at 37.0 °C in the cell culture incubator and gently rocked at 15 min intervals. After 2 h, the media of the infected cells was replaced with 10% FBS and the cells were further incubated for another 2–8 days [28]. Once cytopathic effects (CPEs) were observed (75–80%), the incubation was terminated and the cells were collected by scraping and transferred into a 50 mL sterile tube with associated media and stored at −80 °C [29,30]. Cell lysis (mechanical disruption) was induced by freeze–thawing the cells 3 times, completely inverting tubes, and pipetting up and down multiple times. The cell lysate was centrifuged at 2800× g for 20 min at 16.0 °C to remove cell debris. The lysate was then layered over a thin layer of 20% sorbitol in an ultracentrifuge tube followed by ultracentrifugation at 22,000 rpm for 2 h and 40 min at 4.0 °C. The pellet (purified virus) was resuspended in 4 mL of PBS, aliquoted (200 µL) into vials, and stored in liquid nitrogen. MHV68 titration was performed in BHK-21/C-13 cells using 6-well plates. Cells were seeded at 150,000 cells/well in DMEM (10% FBS, 1% L-glutamine) and infected the next day at 50–70% confluency. Each viral dilution was performed in triplicate. An uninfected control and 6 serial 10-fold dilutions (10−3, 10−4, 10−5, 10−6, 10−7, 10−8) were included in the titration. The 1 h incubation was interrupted every 10–15 min to rock the plates gently. Upon completion, each well was overlaid with 4 mL of warm methyl cellulose (Sigma-Aldrich, St. Louis, MO, USA) in DMEM with glutamax (2.5% calf serum, 100 U of penicillin/mL, 100 mg of streptomycin/mL) and incubated a further 4 to 5 days at 37.0 °C. Once plaques were visible, the methyl cellulose was aspirated and the cells were stained with 0.1% crystal violet (Sigma) and then rocked on a plate shaker for 30 min at room temperature. The wells were washed with purified H2O and air dried. Plaques were counted with the naked eye and counts were later confirmed using an inverted microscope [27,28]. The titer was calculated using counts from 2 dilutions. Each count was an average of triplicate readings.

2.2. Animal Model

The National Cancer Institute Mouse Repository provided K-RasLA1 mice, which were crossed into the C57BL/6 (B6) background more than 10 times. Experimental protocols were approved by the Tulane University Institutional Animal Care and Use Committee in agreement with the National Institutes of Health guidelines provided by the Association for Assessment and Accreditation of Laboratory Animal Care. Mice were maintained under select pathogen-free conditions and mating pairs were set up for the procurement of WT and K-RasLA1 genotypes. Mouse chow and water were provided ad libitum. Littermates were infected with virus between 3.5 and 5 weeks of age with 40,000 plaque forming units (pfu) of MHV68 diluted in a 50 µL PBS solution. Control mice were treated with an equivalent volume of PBS. The anesthesia of mice during treatment was accomplished using isoflurane (VetOne, Boise, ID, USA), where its influx into a confined chamber for 15–25 s ensured loss of consciousness. Mice were subsequently hung vertically with a silk thread behind their front teeth. Pinching the nose and pulling the tongue forward allowed for viral delivery via oropharyngeal aspiration [4]. Infected and uninfected mice resided in separate microisolators until harvesting. Euthanasia of the mice was accomplished by intraperitoneal delivery of 0.8 mg/kg avertin (ThermoFisher, Waltham, MA, USA) followed by exsanguination. Cardiac puncture was performed using a 3 mL syringe targeting the ventricle of the heart. Approximately 0.5–1.0 mL of blood was collected and allowed to coagulate before centrifugation at 1500× g for 10 min. The renal artery was severed to allow for complete exsanguination before tissue collection.

2.3. RNA Preparation and Analysis

The spleen was collected for RNA extraction. The collection and processing of total lung tissue differed depending on the assay. Total RNA was prepared from the left lung for the time course (3–9 days post-infection, DPI) experiments. The left lung was removed, placed in bead tubes (ThermoFisher, Waltham, MA, USA), and homogenized for 1 min at 5 m/s in a Beadmill (ThermoFisher, Waltham, MA, USA) in 1 mL Trizol. The right lung was reserved for protein lysates by removal to cryovials before freezing in liquid nitrogen. For the tumor correlation assay (7 DPI), the left bronchus was ligated and the left lung was processed for RNA extraction as above. The right lung was inflated and fixed with formalin for tumor analysis. For the tumor promotion assay (7-weeks PI), both lungs were inflated and fixed with formalin for tumor analyses [4]. During lung inflation, lung(s) were inflated at 30cm pressure, fixed with formalin for 20 min, then stored at 4 °C in formalin overnight and transferred to PBS before paraffin embedding. Tail snips were collected to confirm genotypes. RNA was extracted using the RNeasy Mini Kit as described by the supplier (Qiagen, Germantown, MD, USA) [4]. Total RNA samples were Dnased using the Turbo DNA-free Kit (Invitrogen, Carlsbad, CA, USA) and then underwent cDNA Synthesis using the iScript cDNA Synthesis Kit (Bio-Rad, Hercules, CA, USA) [31]. A NanoDrop Spectrophotometer (ThermoFisher, Waltham, MA, USA) was used to quantify RNA.

2.4. Reverse Transcription-Quantitative Polymerase Chain Reaction (RT-qPCR)

RT-qPCR was carried out in 10 µL using Sso Advanced Universal SYBR Green Supermix (Bio-Rad). A mastermix was prepared for each primer set and loaded onto a 96-well plate along with the designated samples. Thermal cycling was run on a CFX Opus 96 Real-Time PCR System (Bio-Rad) using an optimized protocol: 95.0 °C for 3 min; 95.0 °C for 10 s; annealing temperature (usually 56.0 °C) for 30 sec; initial plate reading; return to step 2–39 times; melt curve 65.0 °C to 95.0 °C; increment 0.5 °C for 5 s; second plate reading. Dissociation (melting) curve analyses were performed. Quantification was performed using the 2-DDCt method, normalizing all CT scores to beta-actin (ß-actin). Final measurements were in fold change normalized to PBS-treated mice harvested on day 7 for the time course and tumor correlation assays. Orf65 mRNA levels were normalized to MHV68-infected mice on day 7 post-infection in the time course assay and in the tumor correlation assay. Table 1 presents the quantitative PCR mouse target genes with primer sets.

2.5. Protein Extraction of Mouse Lung Tissue

Protein was extracted from mouse lung tissue for ELISA assays. The protocol enlisted was optimized for the homogenization of protein using a Bead Mill 4 (ThermoFisher, Waltham, MA, USA). Samples were incubated in a 1:100 dilution of protease inhibitor cocktail (100×) (Cell Signaling Technology, Danvers, MA, USA) in PBS and homogenized using the Bead Mill for 30 s at a power of 5 m/s. RIPA buffer (Cell Signaling, Danvers, MA, USA) was added to a final 1× concentration and samples were vortexed briefly. Samples were centrifuged for 15 min at 20,817× g at 4.0 °C and the supernatant was subsequently stored at −80.0 °C. Lysates were quantified for protein concentration using the BCA Assay (ThermoFisher, Waltham, MA, USA).

2.6. Enzyme-Linked Immunosorbent Assay (ELISA)

Lung lysates and serum were used to quantify the protein levels of Csf3, Cxcl1, and Il-6 using ELISA. Detection of Csf3 and Cxcl1 was accomplished using Mouse CSF3/G-CSF and CXCL1/KC Immunoassay kits according to the supplier’s instructions (Quantikine, Minneapolis, MN, USA). The ELISA for Il-6 was carried out using the LEGEND MAXTM Mouse IL-6 ELISA Kit according to the supplier’s instructions (BioLegend, San Diego, CA, USA).

2.7. Tumor Counting

Pleural surface tumor counts on fixed inflated lung tissue was performed by 3 individuals independently while blinded to the sample’s identity. These counts were normalized for each individual’s average tumor counts of the PBS-treated mice. For tumor lesion counts, H&E-stained slides prepared from paraffin-embedded lung tissue were quantified for proliferative lesions by light microscopy in a blinded manner.

2.8. Immunofluorescence

Formalin-fixed paraffin-embedded lung tissue sections were co-stained with Ly6G and IL-6 antibodies in an immunofluorescence assay (Table 2). All incubations were performed in a humid chamber and incubation solutions were sterile filtered. Slides were heated overnight at 50.0 °C, deparaffinized in xylene, and hydrated in graded alcohol solutions. Antigen retrieval was performed by heating the slide in 10 mM Sodium Citrate for 20 min by bringing the solution to a boil (100.0 °C) with intervals of cooling. All washes were performed with 1x Dulbecco’s phosphate-buffered saline (DPBS) on a rocker prior to antibody incubations, whereas 1XDPBST with 0.1% tween was used for post-antibody washes. The samples were blocked with 1XDPBS 10% normal goat serum (NGS) for 1 h at room temperature and antibody dilutions were made in 1XDPBS with 2% NGS. The protocol was a sequential stain of 1 µg of Purified Rat anti-Mouse Ly6G (BD Pharmingen, San Diego, CA, USA), followed by a 1:150 dilution of IL-6 Antibody (Novus Biologicals, Centennial, CO, USA), and incubation overnight in 4.0 °C. The secondary antibodies for Ly6G and IL-6 were a 1:200 Goat Anti-Rat IgG H&L (Alexa Fluor 647) (Abcam, Waltham, MA, USA) and a 1:1000 Goat Anti-Rabbit IgG H&L (Alexa Fluor 488) (Abcam), respectively, which were incubated in the dark at room temperature for 1 h. Slides were mounted using ProLong Gold antifade reagent with DAPI (Invitrogen, Carlsbad, CA, USA). An inverted Nikon microscope was used for detection at 600× magnification.

2.9. Flow Cytometry

Flow cytometry was used to quantify MDSCs. Cells underwent single-cell isolation using a standard protocol designed for “Lung Harvest and Digestion for Flow Cytometry” [32]. Lung tissue was minced and digested with collagenase from clostridium histolyticum (Sigma) at a final concentration of 1 mg/mL. Cells were incubated horizontally on a shaker at 37.0 °C for 1 h on moderate-to-low speed and were then filtered through a 70-micron filter and centrifuged at 500× g for 5 min at 4.0 °C. The pellet was resuspended in RPMI media supplemented with 10% newborn calf serum (NCS), 100 U of penicillin/mL, and 100 mg of streptomycin/mL and counted in preparation for cell sorting. Cells were selected for Gr-1- myeloid cells using the Myeloid-Derived Suppressor Cell Isolation Kit (Miltenyi Biotec, Gaithersburg, MD, USA). Selected Ly6G-positive cells were stained with APC-eFluor780-CD11b (ThermoFisher, Waltham, MA, USA), APC anti-mouse Ly6C (BioLegend), V500 Mouse anti-Mouse CD45.2 (BD Horizon, Franklin Lakes, NJ, USA), and PE Rat Anti-Mouse Ly6G (BD Pharmingen) antibodies. The final concentration for all antibodies in solution was 0.01 µg/µL or 1 µg. An Fc-receptor blocking antibody TruStain FcXTM (anti-mouse CD16/32) Antibody (BioLegend, San Diego, CA, USA) (2.5 µg) and True-Stain Monocyte Blocker (1:20 dilution) were added to the staining solution. After incubation, the cells were washed with PBS and fixed in 1% formaldehyde PBS solution in preparation for flow cytometry [27,32]. Samples were processed via flow cytometry at the Microbiology/Immunology Core facility, a shared resource lab, whereby detection of fluorescently labeled cells passing through a cytometer identified Gr-1+ cells. Positive selection with anti-Gr1 antibodies in the flow through fraction from the Ly6G selection identified Ly6Gdim Ly6Chi cells.

2.10. Immunoprecipitation of Methylated mRNAs (m6A Me-RIP Assay)

Total RNA (70 µg) prepared from mouse lung tissue was submitted to LC Sciences for m6A immunoprecipitation and RNA sequencing. After RNA isolation and DNasing, as described above, the samples were subjected to additional purification using the RNeasy Mini Kit (Qiagen) prior to submission [33]. The processing of samples involved RNA fragmentation, RNA immunoprecipitation (RIP), and elution of m6A-modified transcripts as determined by the service provider (LC Sciences, Houston, TX, USA). Eluted m6A RNAs and input ribosomal-depleted RNA samples were sequenced at ~40 million 150 bp paired-end reads.

2.11. Statistical Analysis

Unless indicated otherwise, the data are reported as mean +/− SEM and significance is determined via Mann–Whitney two-tailed t-tests using GraphPad Prism software version 10 for statistical analysis. All data are normalized to the uninfected control mice. RT-qPCR data are normalized to ß-actin.

3. Results

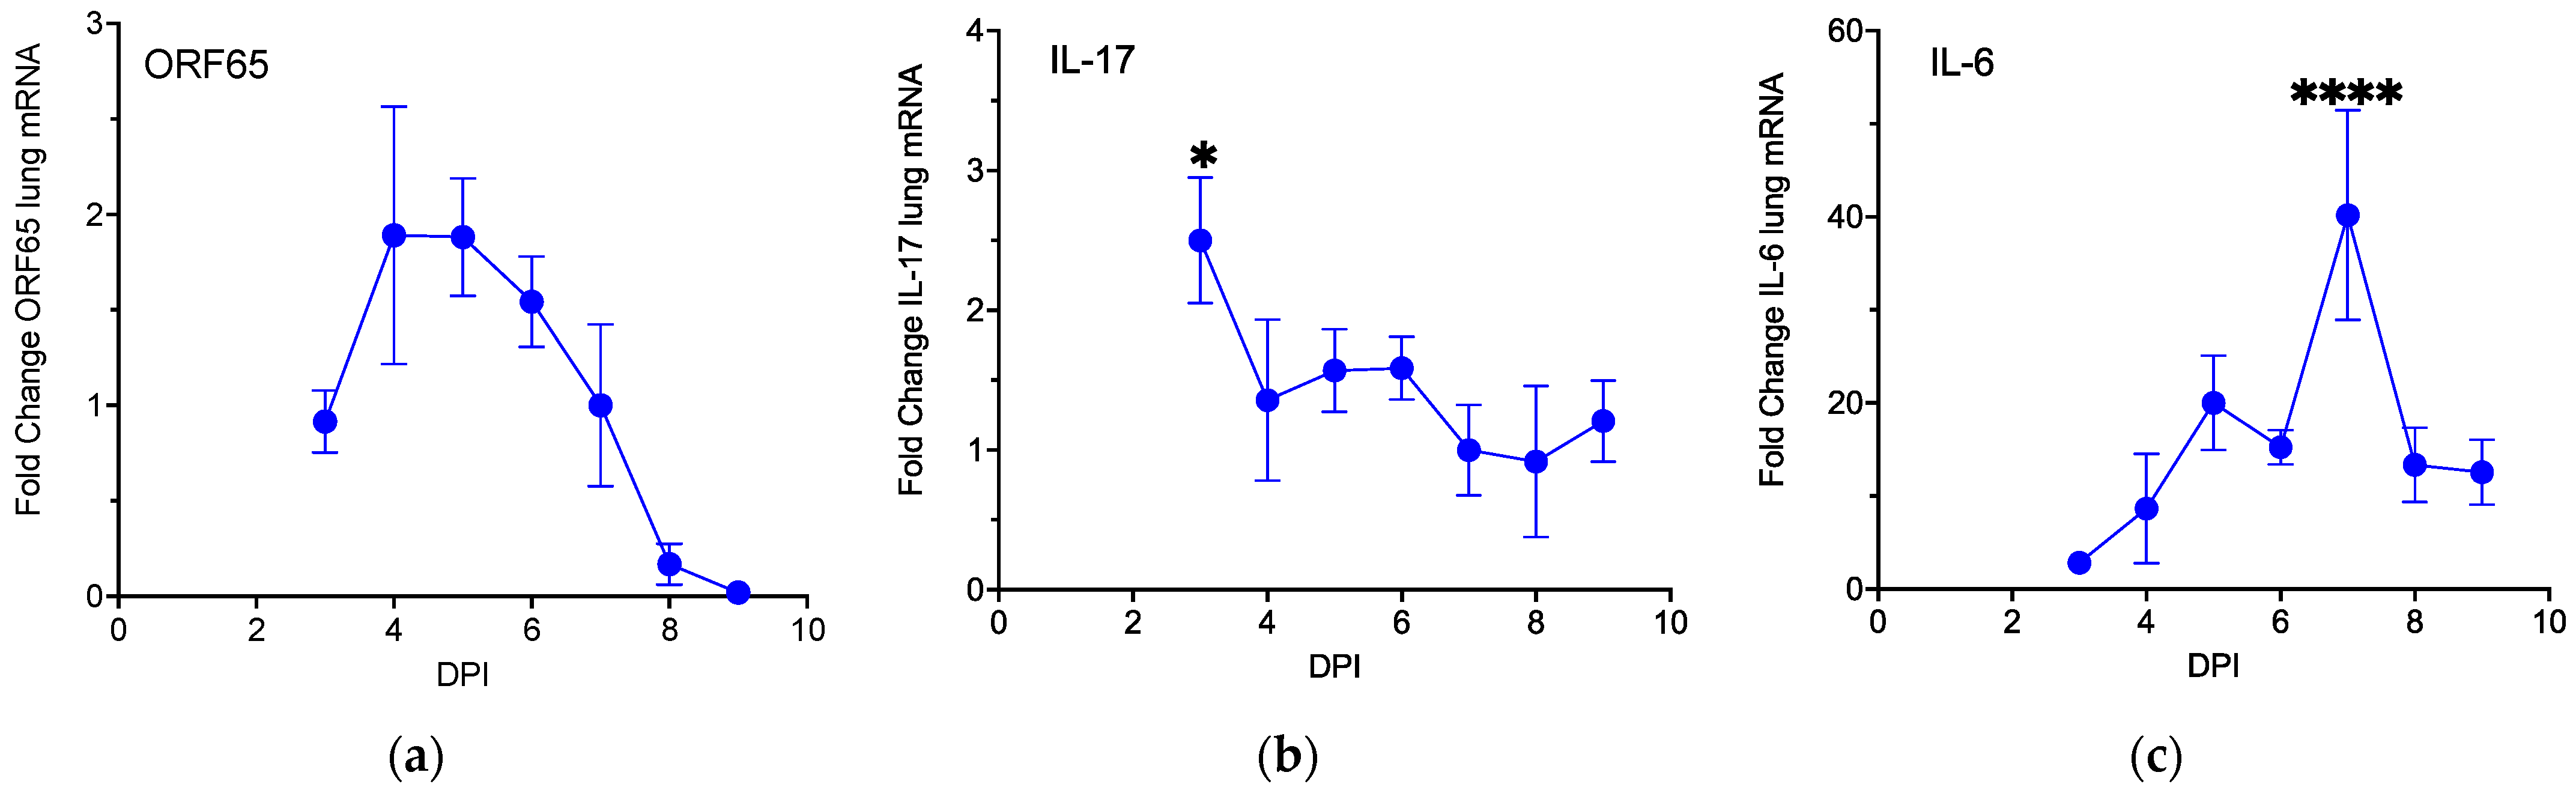
3.1. MHV68 Induces Type 17 Cytokines during Virus Infection

Since recent findings link Type 17 inflammation with MHV68 replication [12,13], we set out to test if MHV68 infection could accelerate tumorigenesis in lung-tumor-bearing K-RasLA1 mice. An initial experiment with increasing doses of virus demonstrated that 40,000 pfu of MHV68 elicited maximal Orf65 mRNA expression, a late transcript encoding a component of the viral capsid that is used here to monitor viral replication. This dose of virus elicited modest lung inflammation and no overt adverse effects on the mice in the form of lethargy or weight loss. Subsequently, to establish the relationship between cytokine production and viral infection, wild-type mice infected with 40,000 pfu MHV68 were harvested daily between days 3 and 9 post-infection and RNA was extracted from the lung tissues of the infected mice for RT-qPCR analysis. Mock-infected mice at day 7 were used as the negative control group. Serum and lung tissue lysates were also prepared for protein quantification by ELISAs. The levels of Orf65 mRNA in the lungs of MHV68-infected wild-type mice had increased by day 3 post-infection and diminished to near undetectable levels by day 9 (Figure 1a). The levels of Il-17 mRNA decreased ~2.5-fold from a high at day 3 to low levels at days 7 through 9 in MHV68-infected mice (Figure 1b). The most pronounced effect was observed for the mRNA levels of Il-6, which peaked on day 7 post-infection with a 40-fold increase relative to mock-infected mice (Figure 1c). Induction of IL-6 in MHV68-infected wild-type mice was further confirmed via ELISA assays for Il-6 in the serum and lung lysates, which revealed 1.8-fold and 9.4-fold increases, respectively, relative to mock-infected mice (Figure S1). These observations are consistent with induction of a Type 17 cytokine response to MHV68 infection.

3.2. MHV68 Infection Promotes Proliferative Lesions in Tumor-Bearing Mice

We next tested if MHV68 infection enhanced lung tumorigenesis. K-RasLA1 mice were infected with 40,000 pfu of MHV68 and control K-RasLA1 mice were mock-infected with vehicle (PBS). Both groups were harvested 7-weeks post-infection and tumor nodules on the pleural surface of fixed lung tissue were quantified. MHV68-treated K-RasLA1 mice had a 2-fold increase in tumors relative to their PBS-treated littermates (Figure 2a,b). The lung tissues were subsequently paraffin embedded for preparation of tissue sections that were stained with hematoxylin and eosin and assessed microscopically for proliferative lesions. The MHV68-infected mice had an almost a 3-fold increase in lung tumors relative to the mock-infected control group (Figure 2c,d). These analyses confirmed that MHV68 infection promoted tumorigenesis in mutant K-Ras-expressing mice.

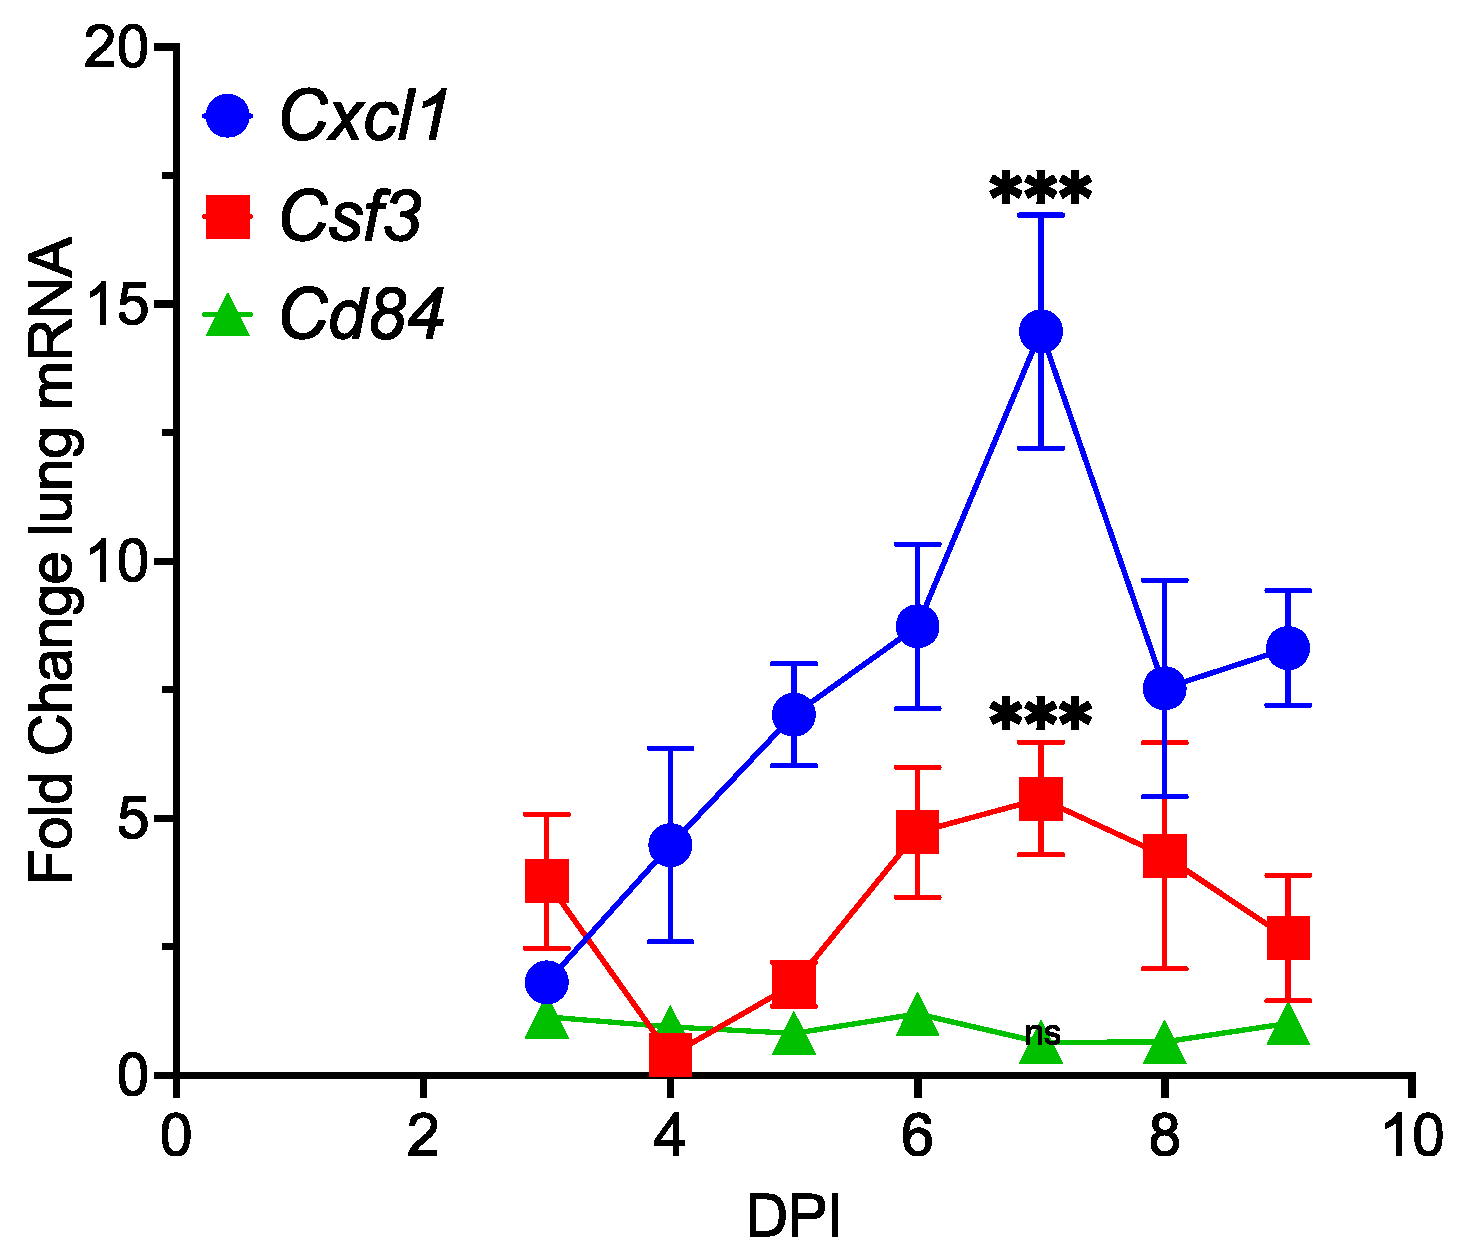
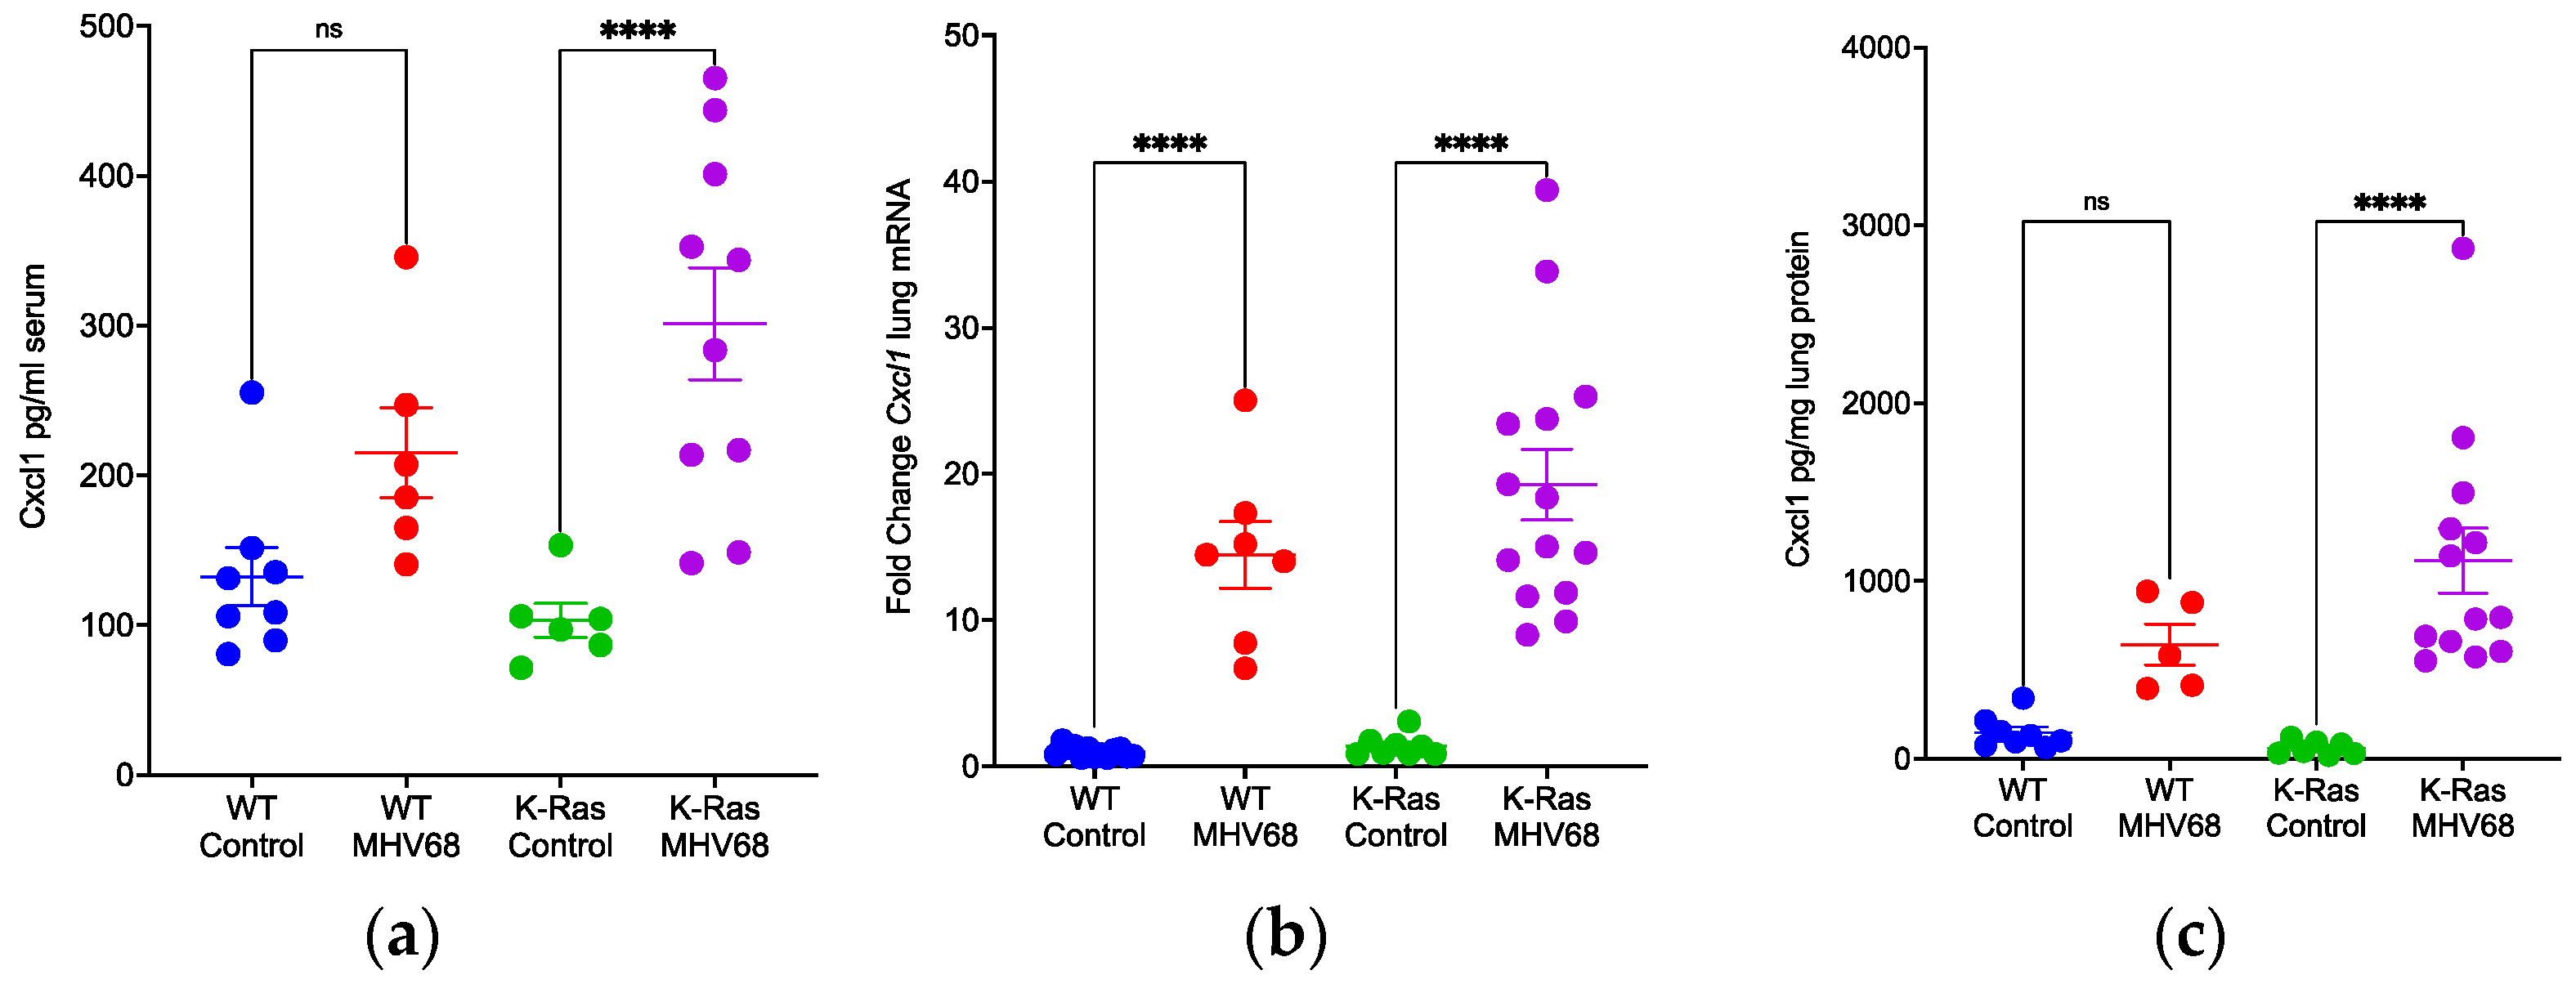
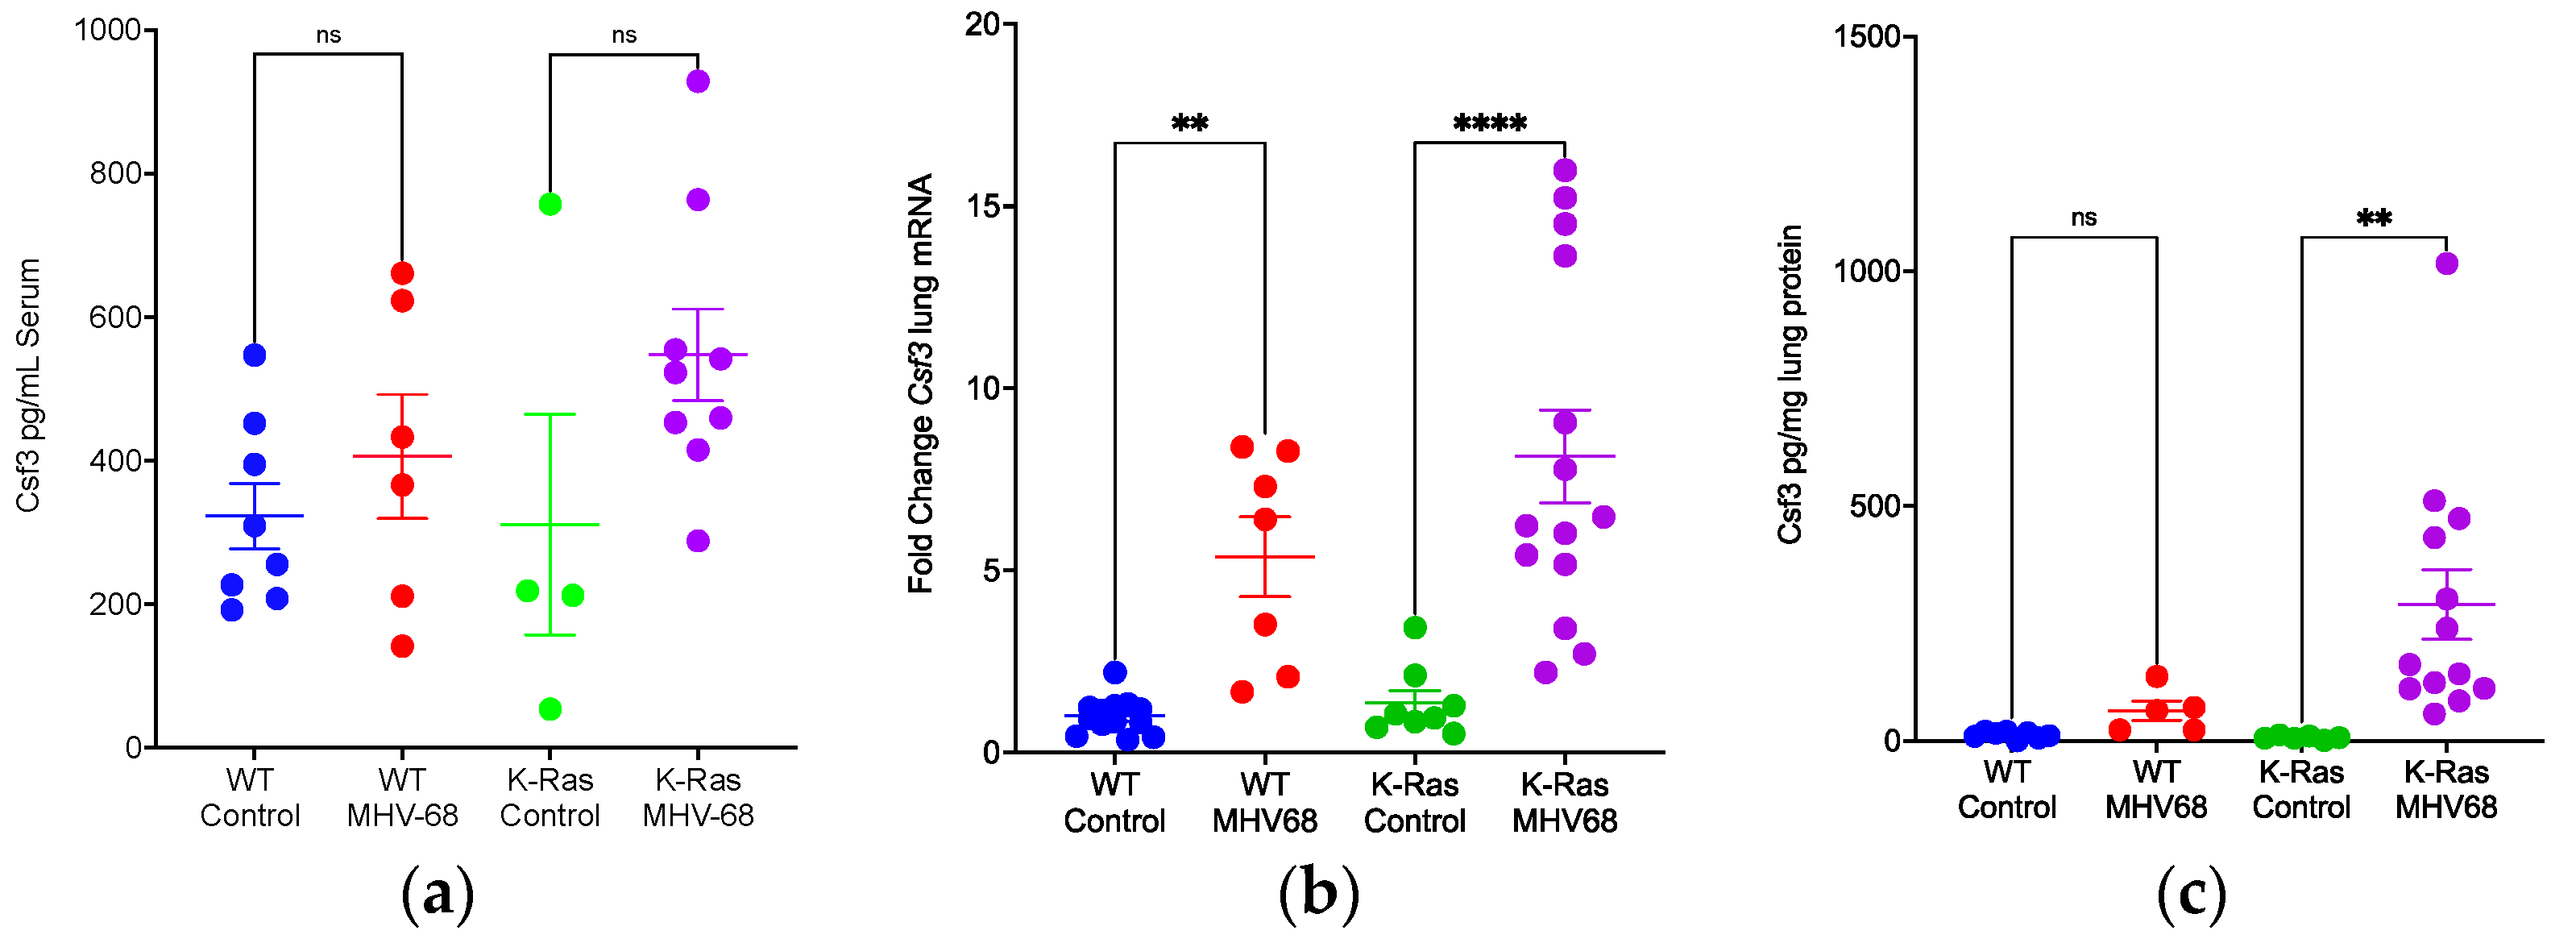
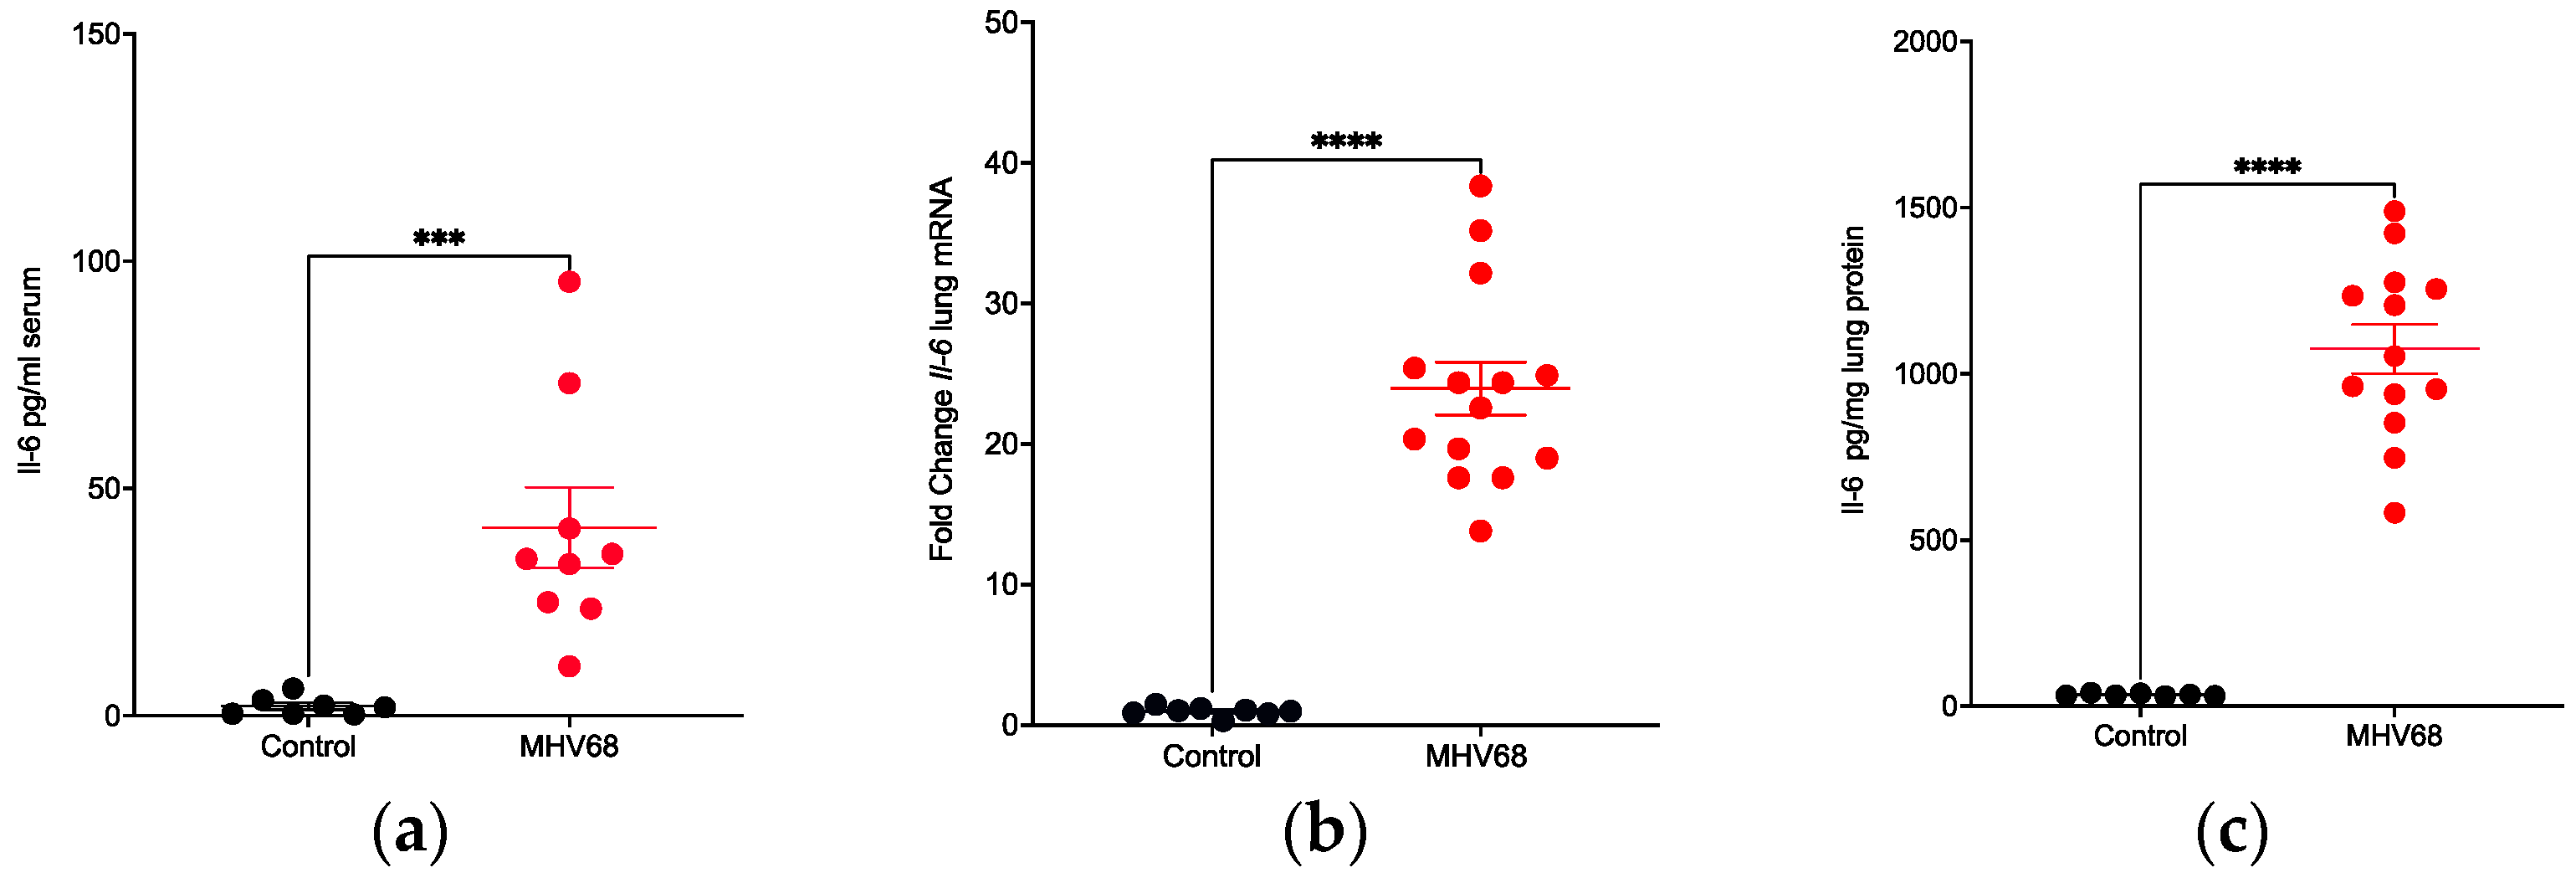
3.3. Promotion of Inflammation by MHV68 Infection

Lung tumor promotion by IL-17 is dependent upon the recruitment of immune cells [5,6]. Injection of an antibody against Gr-1 represses IL17-mediated enhancement of lung tumorigenesis in mutant K-Ras-expressing mice [5,6]. IL-17 upregulates the cytokines Cxcl1 and Csf3, which promote the recruitment and survival of MDSCs. [4,5,34,35,36,37]. Furthermore, mRNAs encoding these cytokines are induced by IL-17 in a murine lung tumor cell line (mK-Ras-LE cells) derived from K-RasLA1 mice (Figure S2). RT-qPCR analyses of total lung RNA at increasing times following the MHV68 infection of WT mice revealed a 5-fold increase in Csf3 mRNA and a 14-fold increase in Cxcl1 mRNA, both peaking on day 7 (Figure 3). Thus, mRNAs encoding cytokines involved in immune cell recruitment during lung tumor promotion by IL-17 are increased in MHV68-infected mice at day 7 post-infection.
Single-cell RNA sequencing studies identified Cd84 mRNA as a novel marker for MDSCs in a murine breast tumor model [34]. Lung RNA from the time course experiment described above was evaluated for Cd84 mRNA. In contrast to expectation, the analysis revealed little change in lung Cd84 mRNA levels in MHV68-infected wild-type mice (Figure 3). A time course analysis for an additional MDSC marker identified in the single-cell study, Jaml mRNA, revealed variable levels that did not appear to correlate with the cytokine mRNA profile shown in Figure 3 or the days post-infection of wild-type mice (Figure S3). These observations showed that the cytokine mRNAs (Cxcl1 and Csf3) involved in the recruitment and survival of MDSCs are expressed during the MHV68 infection of wild-type mice but that mRNA markers for those cells (Cd84 and Jaml) do not increase in the lung.

3.4. Disparate Recruitment of Immune Cells in Wild-Type and K-RasLA1 Mice

Tumor-bearing mice may respond differently to MHV68 infection than wild-type mice regarding immune cells and related cytokine profiles, and potential differences would be more pertinent to tumor development. K-RasLA1 and wild-type mice were infected with 40,000 pfu of MHV68 or mock-infected and harvested 7 days post-infection, a time of peak expression of Il-6, Csf3, and Cxcl1 mRNAs. Cd84 mRNA did not increase in MHV68 infected wild-type mice (Figure 4a), but Jaml mRNA did (Figure 4b). In contrast, both Cd84 and Jaml mRNAs increased in MHV68-infected K-RasLA1 mice (Figure 4a,b). Cd84 mRNA levels did not correlate with Jaml mRNA levels in wild-type mice after MHV68 infection (Figure 4c), but these two MDSC markers did correlate in MHV68-infected K-RasLA1 mice (Figure 4d).
Sequence analysis of lung RNA from uninfected and infected K-RasLA1 mice (Figure S4a) showed a strong correlation between Cd84 and Jaml mRNA expression (r2 = 0.87). Moreover, the RNA seq analyses revealed that both Cd84 and Jaml mRNA levels in uninfected and infected K-RasLA1 mice correlated well (r2 = 0.77 and 0.64, respectively) with the mRNA level for Triggering Receptors Expressed on Myeloid cells 2 (Trem2) mRNA (Figure S4b,c), which is also expressed by MDSCs, including in lung cancer [25,38,39]. These observations suggest immune cells are differentially recruited to the lung in wild-type and lung-tumor-bearing mice after infection with MHV68.
Analyses of TCGA data to correlate prognosis with cytokine mRNA expression in lung adenocarcinoma patients identified increased levels of the mRNAs for Csf3, Cxcl1, and IL-6 as significant indicators of a worse prognosis [40]. To better understand differential recruitment of immune cells to the lung between wild-type and K-RasLA1 mice during MHV68 infection, we evaluated expression of Cxcl1 in the four experimental groups shown in Figure 4. Cxcl1 lung mRNA increased 13.6-fold in the lungs of both wild-type and K-RasLA1 mice after infection with MHV68 (Figure 5b). However, Cxcl1 expression at the protein level in the lung showed a greater than 18-fold (p < 0.0001, ANOVA) increase in infected K-RasLA1 mice and much lower induction (4.3-fold, p = 0.057) in wild-type infected littermates (Figure 5c). After MHV68 infection, Cxcl1 protein levels in the serum increased 1.6-fold (p = 0.075 ANOVA) in wild-type mice and 2.9-fold (p < 0.0001, ANOVA) in K-RasLA1 mice (Figure 5a). Thus, the differential infection-related induction of Cxcl1 protein levels in the lungs and sera of K-RasLA1 mice relative to their wild-type littermates are consistent with differences in immune cell recruitment.
Similar analyses of Csf3 protein and mRNA expression revealed similar differences between wild-type and tumor-bearing mice after infection with MHV68. Csf3 levels in the serum were not significantly different between groups, but a potential modest increase (1.8-fold, p = 0.06, ANOVA) in infected tumor-bearing mice appeared to be reduced (1.3-fold, p = 0.45, ANOVA) in infected wild-type mice (Figure 6a). Both types of mice displayed infection-related increases (wild-type 5.4-fold, K-RasLA1 6-fold) in the levels of Csf3 mRNA in the lung (Figure 6b). Sharp differences appeared in the levels of Csf3 protein in the lung, which increased 49-fold (p = 0.0015, ANOVA) post-infection in K-RasLA1 mice relative to a 5-fold increase (p = 0.61, ANOVA) in mock-infected wild-type mice (Figure 6c). These observations may contribute to an altered immune environment in the lungs of K-RasLA1 mice post-infection relative to that in the infected wild-type mice. Since Csf3 participates in MDSC recruitment and tumor promotion in multiple tumor models [34,41,42,43], this difference may contribute to the observations with MHV68-infected tumor-bearing mice shown here. The sequencing of lung RNA from infected versus uninfected K-RasLA1 mice revealed increases in transcripts encoding immunosuppressive mediators (Figure S5), such as arginase 1 (Arg1, 6.6-fold), programmed death-ligand 1 (Pd-l1/cd274, ~20-fold), nitric oxide synthase 2 (Nos2, ~2.8-fold), and indoleamine 2,3-dioxygenase 1 (Ido1, ~110-fold). This observation is consistent with a tumor-promoting immune suppressive environment in the lung established by MHV68 infection at day 7 post-infection.

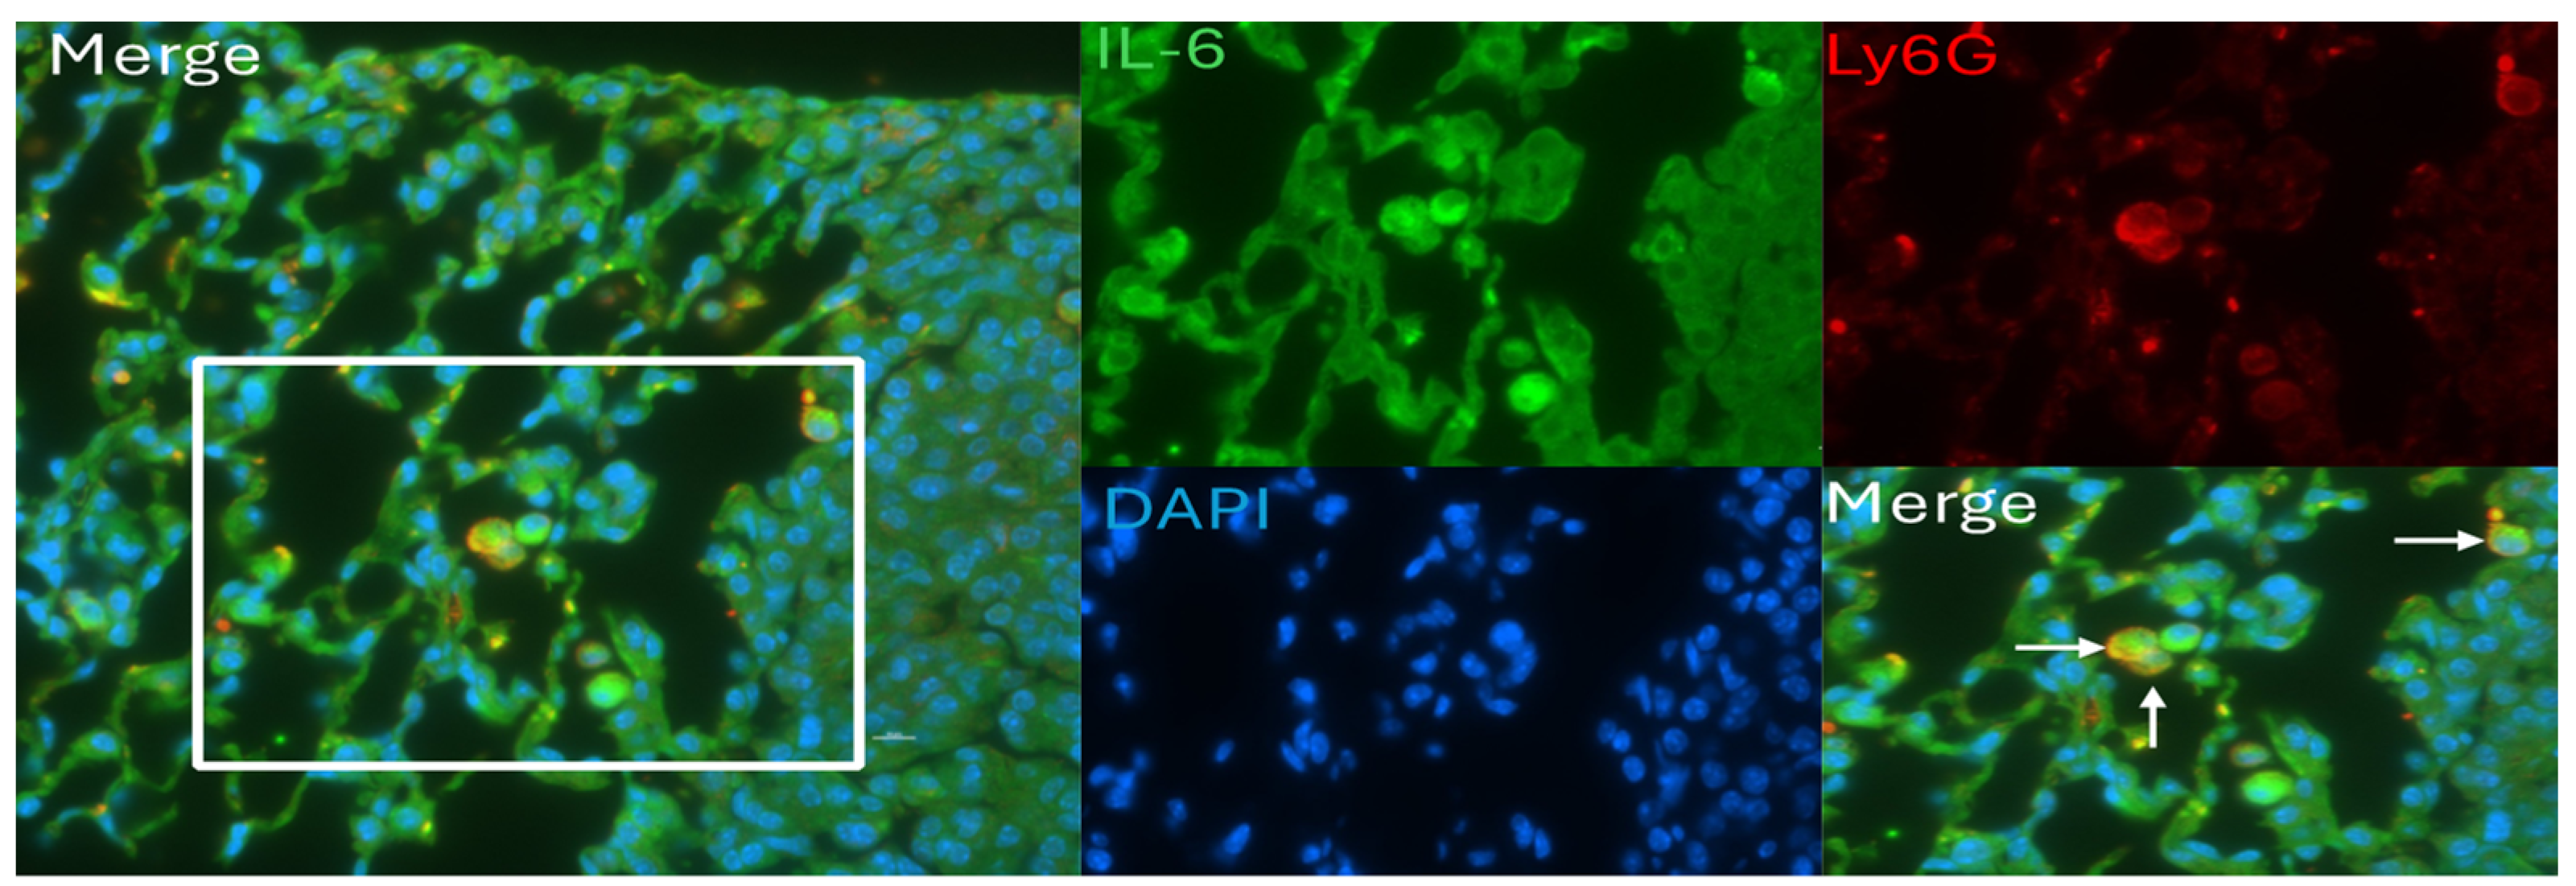
3.5. IL-6 Induction and Localization in Tumor-Bearing Mice

Since elevated levels of IL-6 in MHV68-infected wild-type mice were confirmed, the next question to address was how IL-6 would respond to infection in lung-tumor-bearing mice. MHV68 infection increased IL-6 protein levels in the serum of K-RasLA1 mice by about 19-fold relative to mock-infected control mice (Figure 7a). Similarly, the mRNA levels of Il-6 in the lung increased 25-fold relative to control (Figure 7b). The protein levels of IL-6 in lung tissue increased 31-fold (Figure 7c). Thus, MHV68 infection greatly enhanced both the mRNA (lung) and protein levels (lung, serum) of IL-6 in tumor-bearing mice.
Gr-1+ MDSCs are a source of IL-6 in a murine colon cancer model [44]. Since the cytokines (Cxcl1 and Csf3) involved in immune cell recruitment and survival and Cd84 are elevated at day 7 in tumor-bearing mice, we tested if Ly6G+ mononuclear cells are present in MHV68-infected mice and are also a source of IL-6. Lung tissue sections from MHV68-infected K-RasLA1 mice at day 7 post-infection co-stained positively for both Ly6G and IL-6 (white arrows, Figure 8). Thus, it seems likely that recruitment of these cells at day 7 post-infection with MHV68 contributes to the increase in IL-6 at this time point.

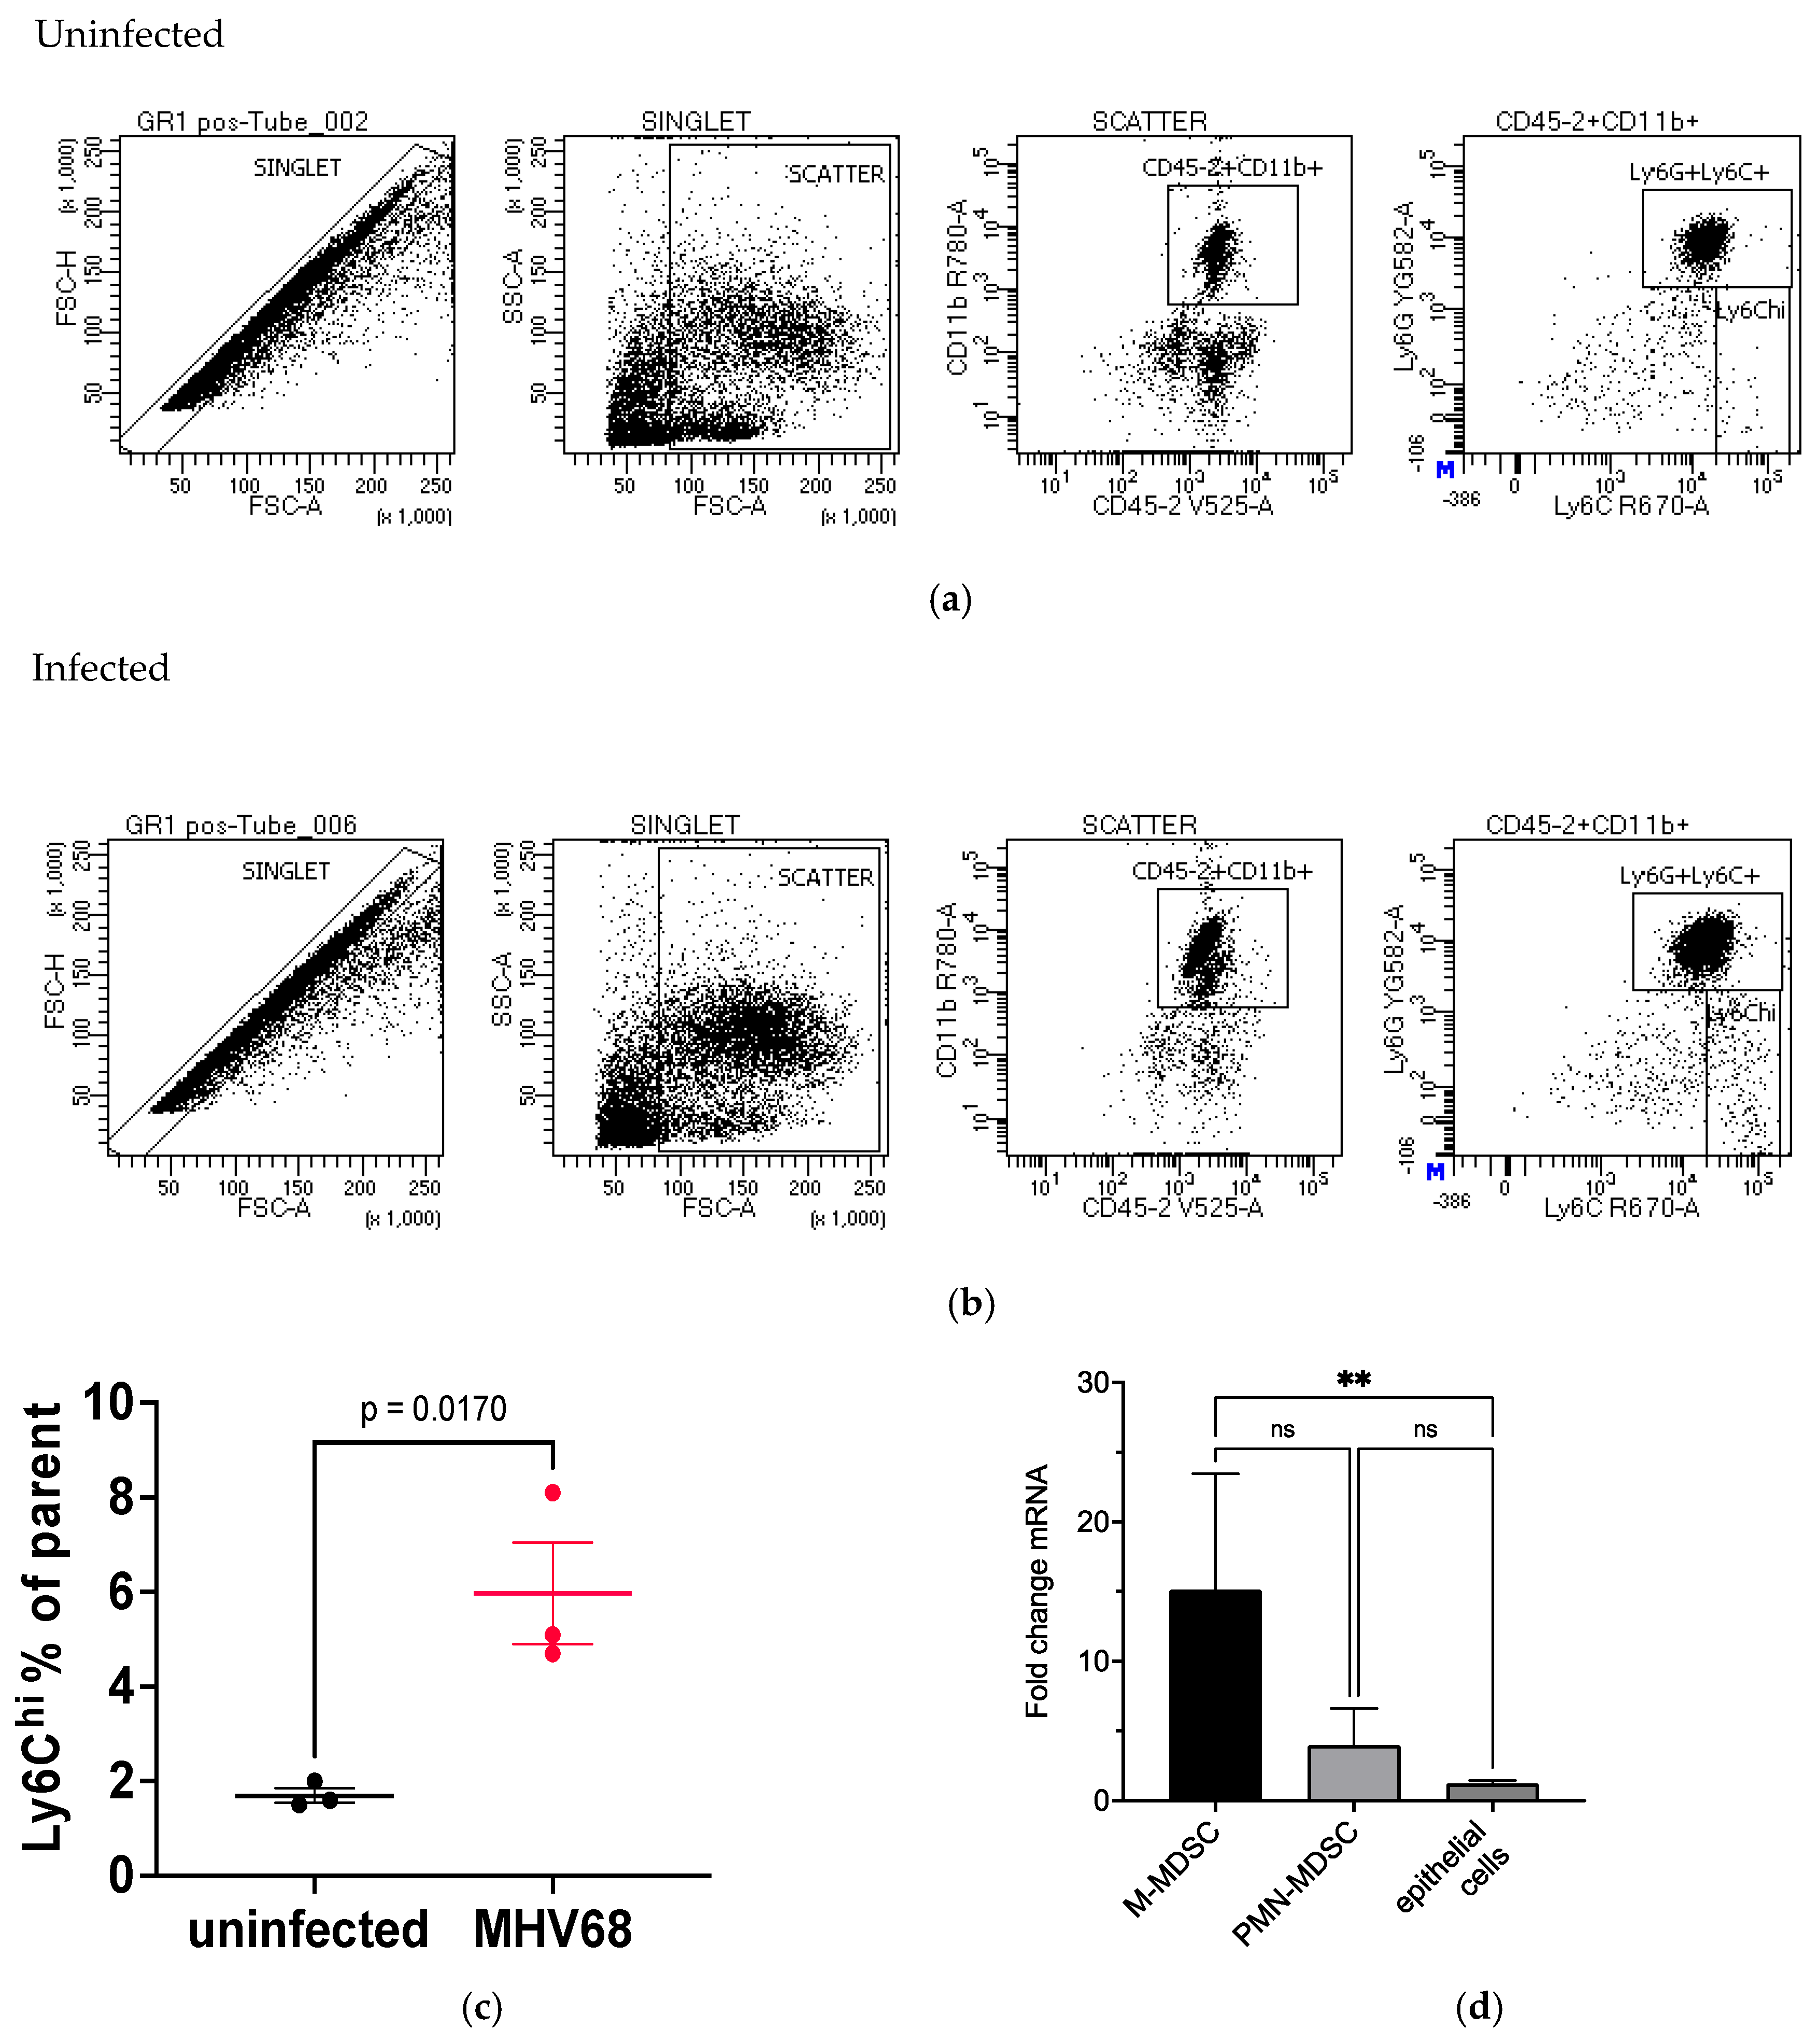
3.6. Evaluation of Immune Cells in MHV68-Infected Tumor-Bearing Mice

The preceding section describes immune cell recruitment and localization to the lung tumor microenvironment after MHV68 infection. We assessed Ly6G+ immune cells at day 7 after MHV68 infection of K-RasLA1 mice by flow cytometry. First, Ly6G+ cells were selected twice by magnetic bead capture from a cell suspension of lung tissue from uninfected and MHV68-infected K-RasLA1 mice. Then, the Ly6G+ cells were sorted by flow cytometry for CD45.2 and CD11b. The CD45.2/CD11b-enriched cells were then flow sorted with antibodies to Ly6G and Ly6C. The results showed very good Gr-1 enrichment, where Gr-1+ cells had a high content of Ly6G and Ly6C positive cells; however, we did not observe differences between MHV68-infected and uninfected tumor-bearing mice (Figure 9a,b). Further examination of the isolated Gr-1+ cells revealed differences in Ly6GDimLy6Chi cell numbers between the MHV68-infected mice versus the PBS-treated controls. MHV68 infection of K-RasLA1 mice induced selective recruitment of Ly6GDimLy6Chi cells relative to the uninfected K-RasLA1 mice (Figure 9c and Table S1). Ly6GDimLy6Chi is a phenotypic marker for M-MDSCs, which are derived from progenitor monocytes [35]. An infection-related influx of immune cells was supported by RNA sequencing data that showed marker mRNAs for M-MDSCs increased ~4-fold when compared to marker mRNAs for PMN-MDSCs and increased 15.1-fold when compared to lung epithelial (alveolar type 1 and 2) marker mRNAs (Figure 9d and Table S2). The results suggest that the MDSCs are being selectively recruited during MHV68 infection, with an inclination towards M-MDSCs. In accordance with this assessment, RNA seq analysis of lung mRNA from MHV68-infected K-RasLA1 mice revealed that Ly6c1 and Ly6c2 mRNAs, which encode the Ly6C surface marker, increased 3.1- and 10.1-fold, respectively, relative to their levels in lung mRNA from uninfected control K-RasLA1 mice (Figure S6). This observation agrees with the selective recruitment of M-MDSCs to the lung in response to MHV68 infection of tumor-bearing mice, but functional analysis of these cells will be required to confirm this conclusion.

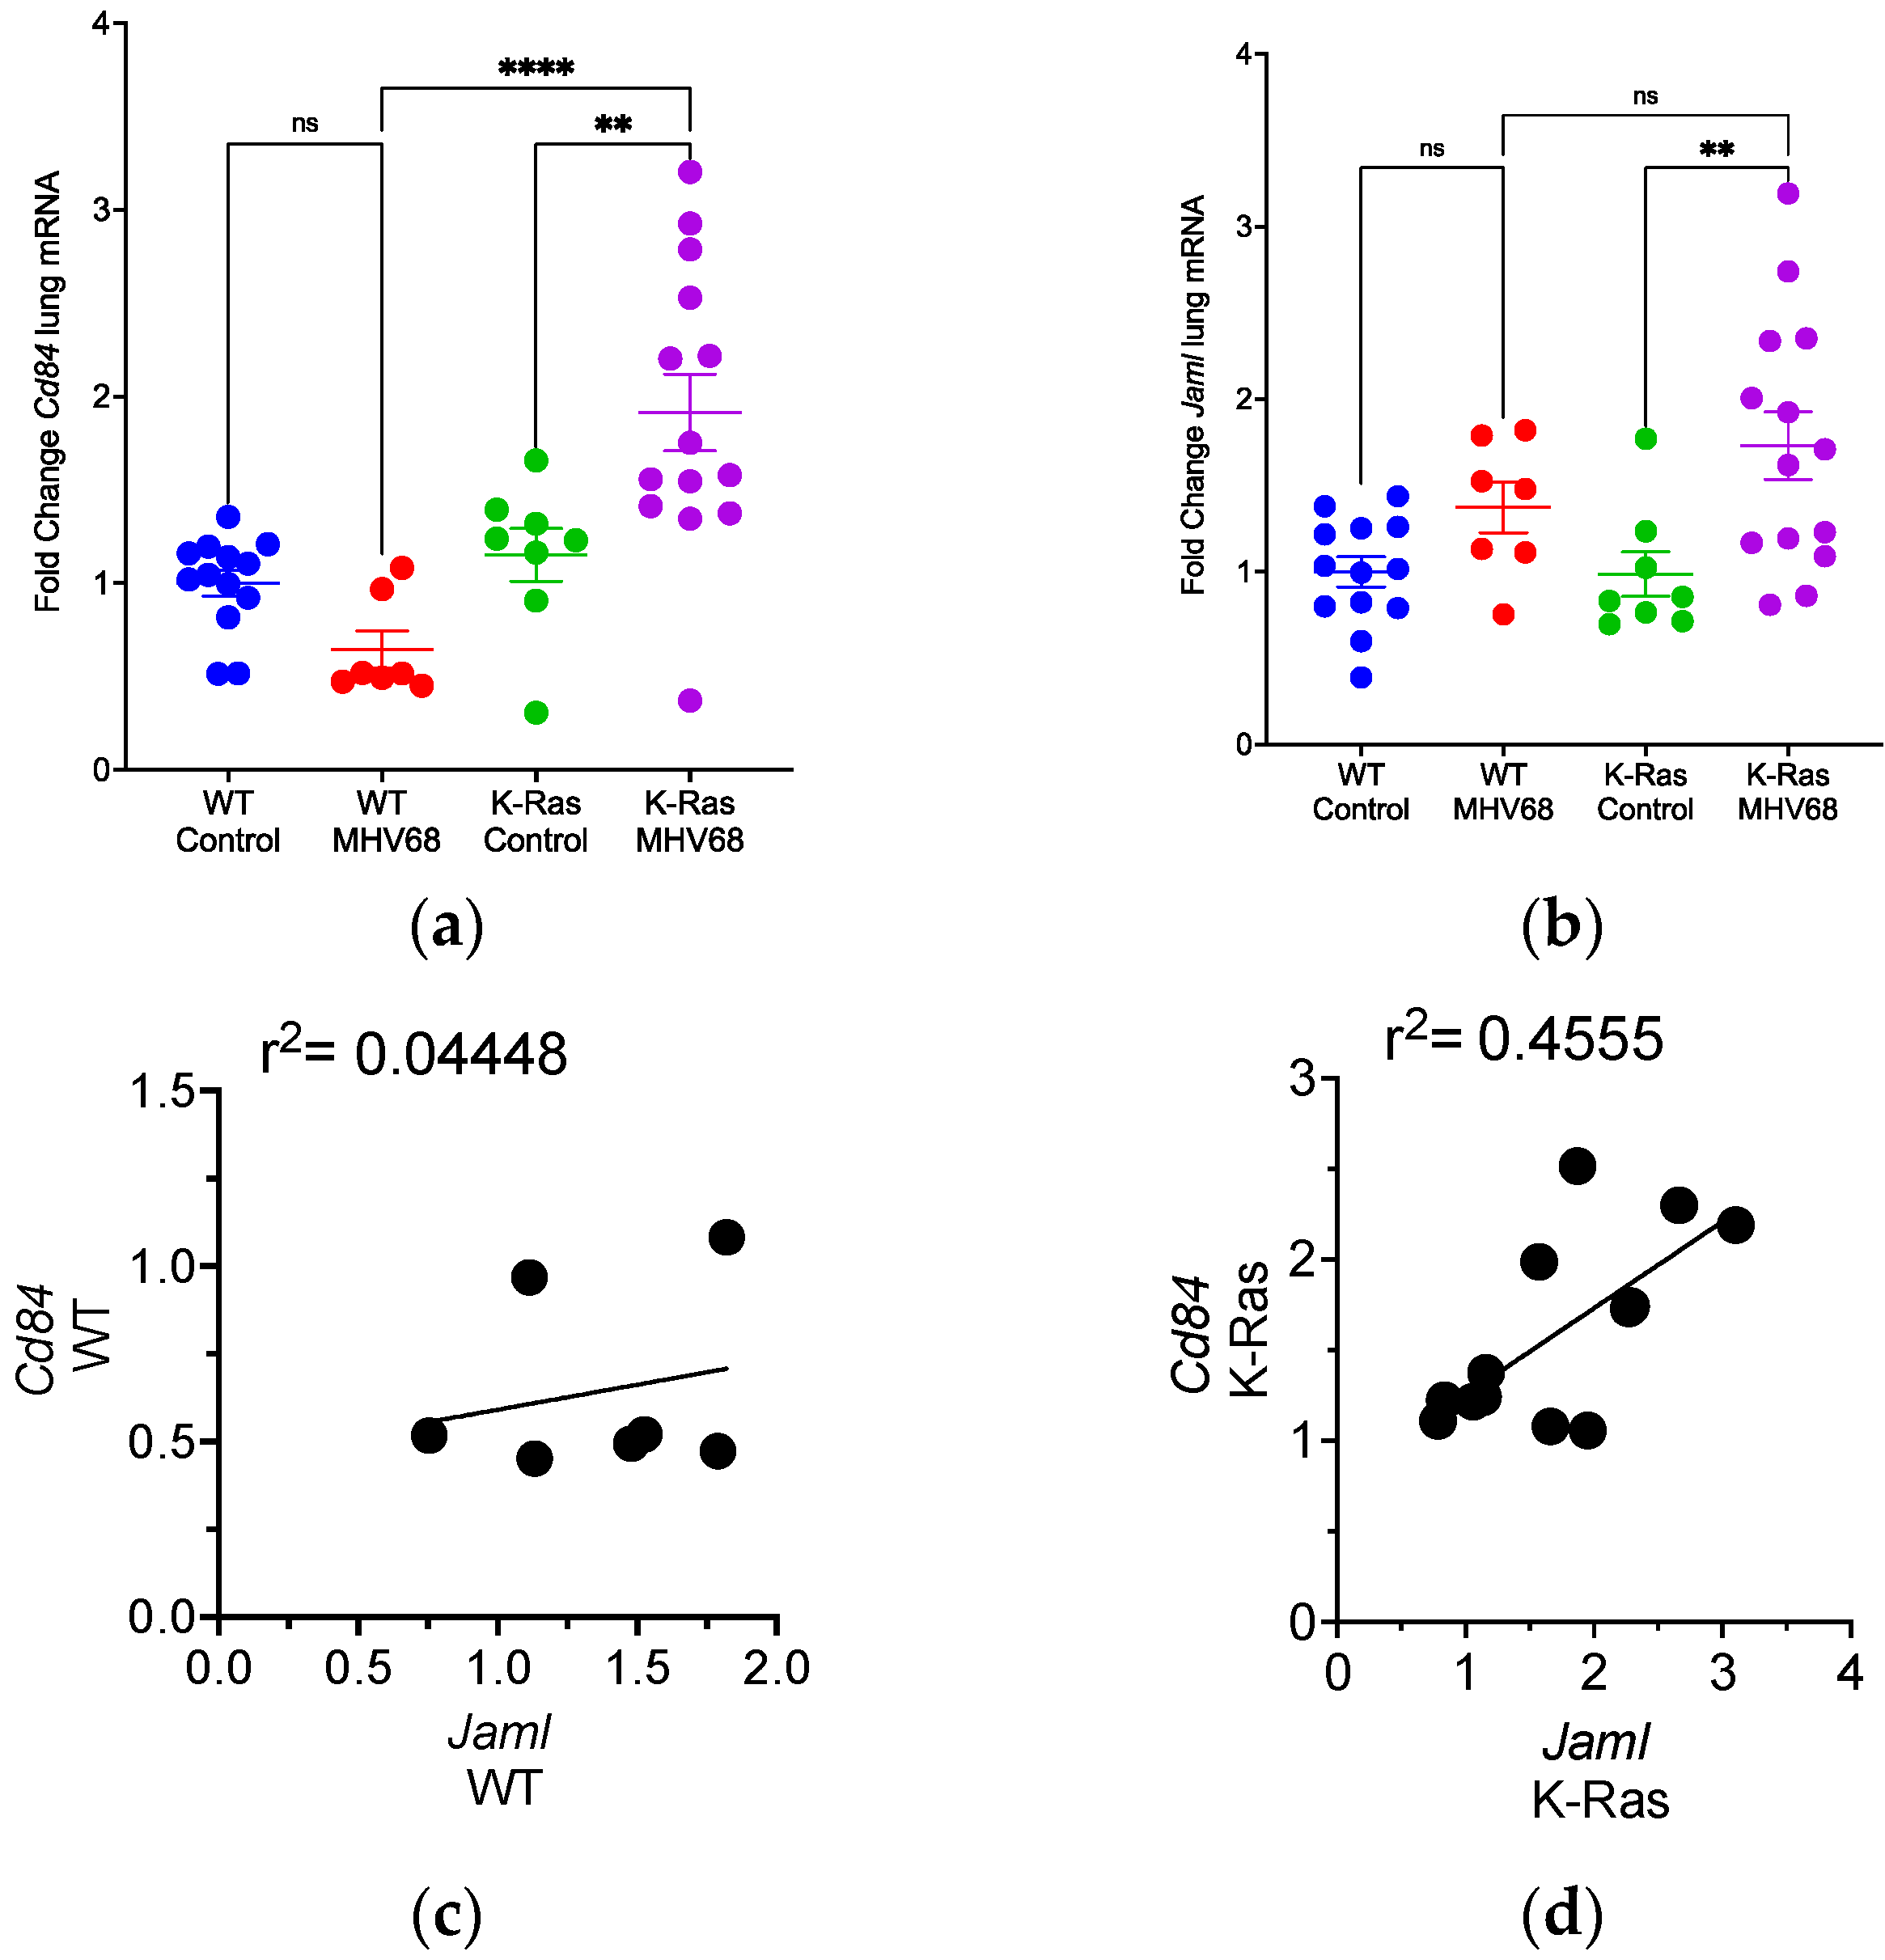
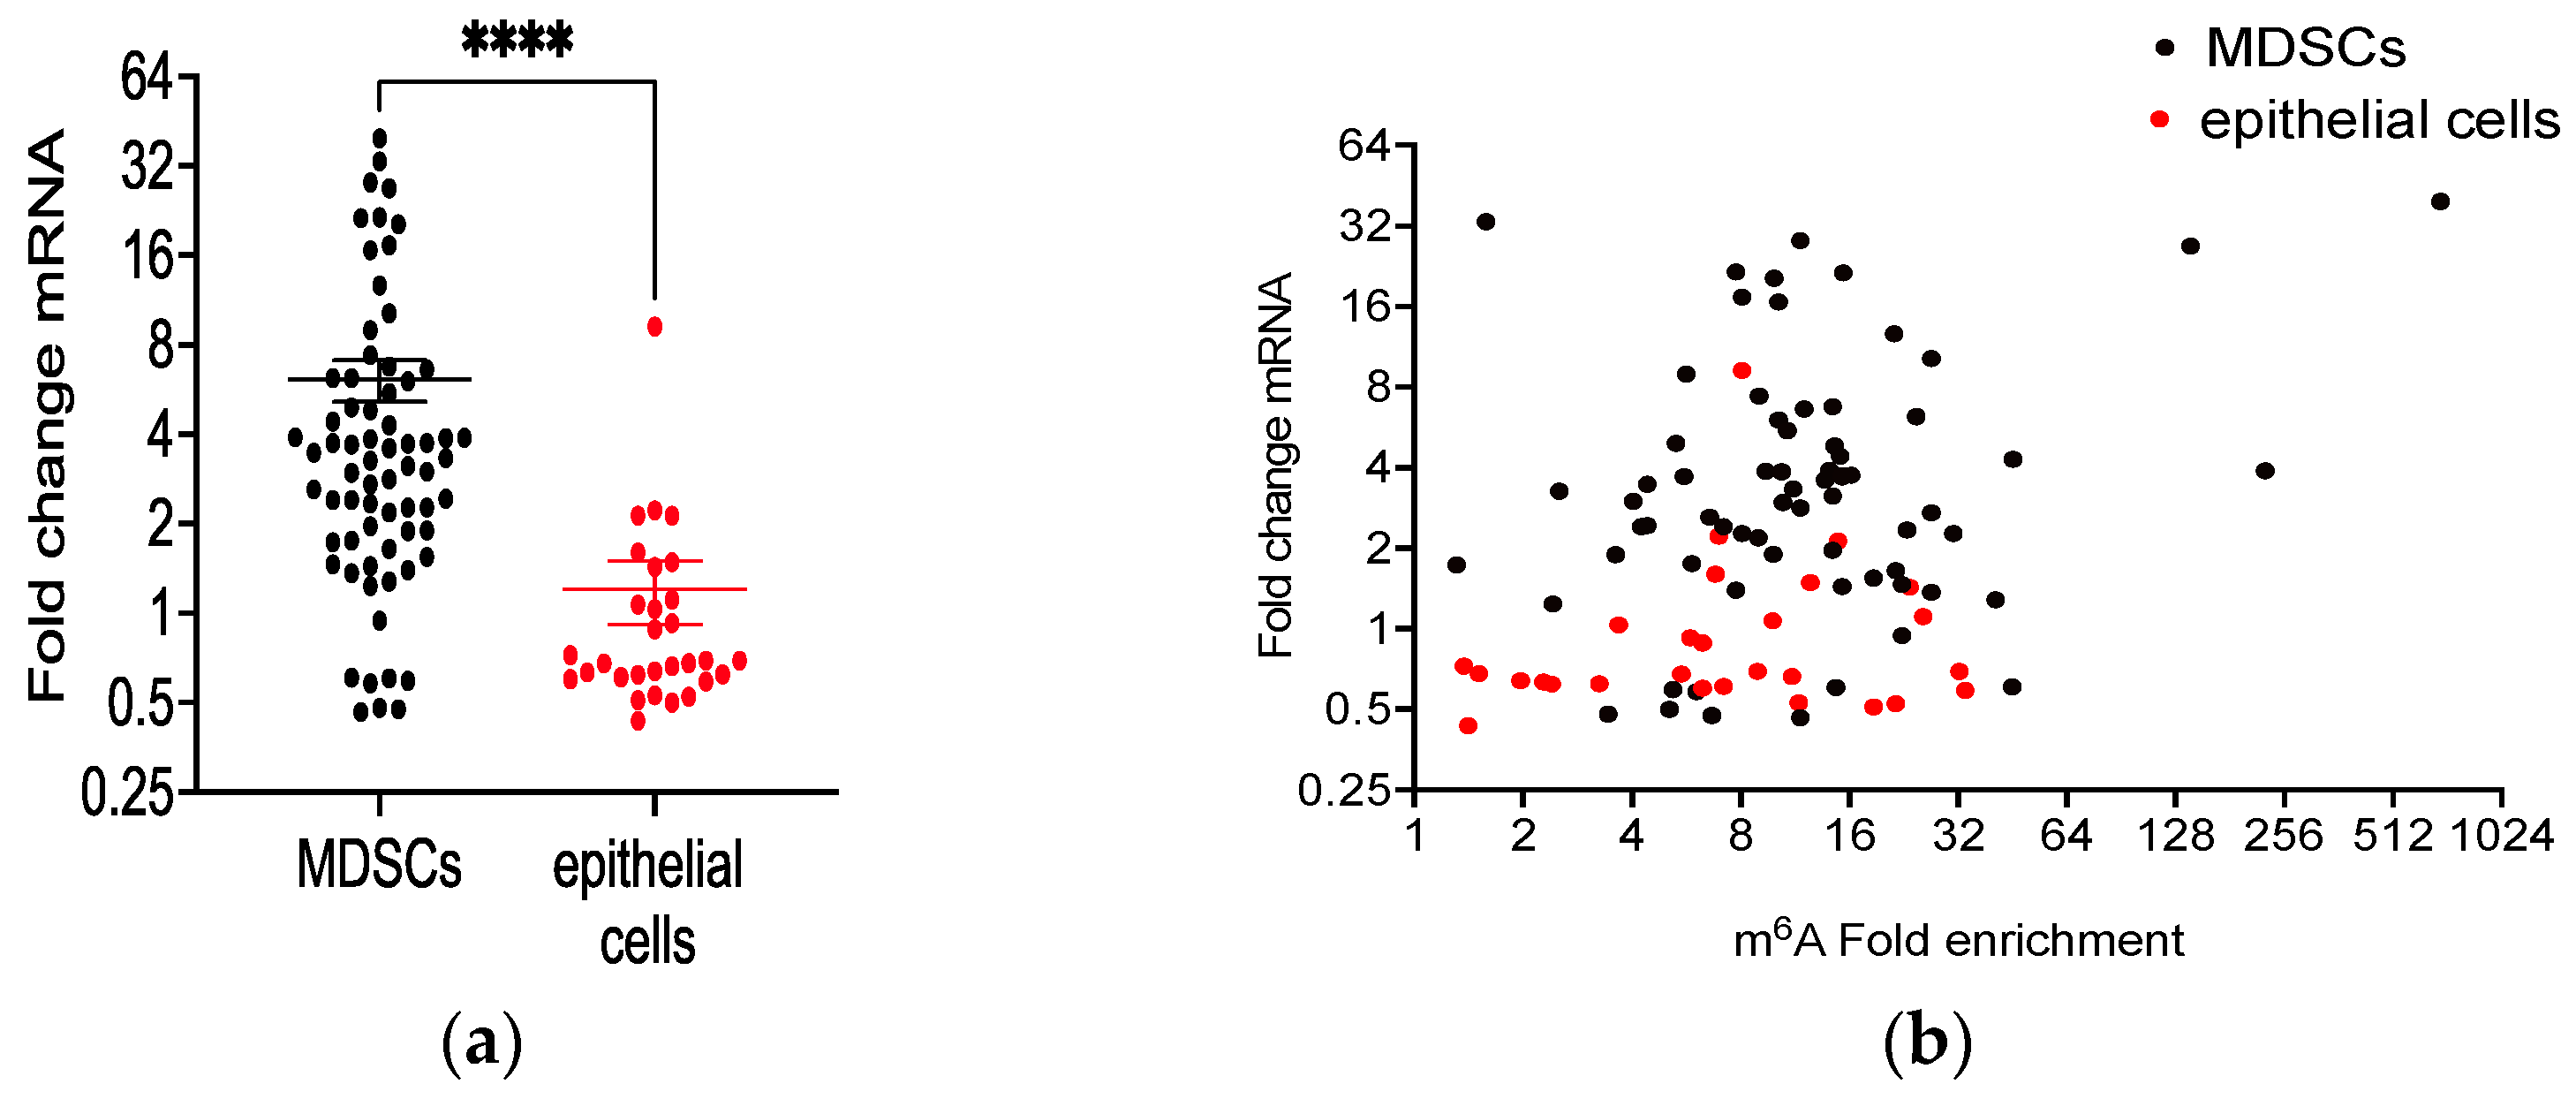
3.7. Differential m6A Methylation of Immune Cell Selective mRNAs in MHV68-Infected Tumor-Bearing Mice

Promotion of autoimmune glomerulonephritis by IL-17 is mediated, in part, by m6A modification of RNA and functional IGF2BP2 (IMP2) binding of selected transcripts: Cebpd, Ccl7, Mt2, Il-6, and Cxcl1 [33]. The expression level of each of these five transcripts in lung RNA was significantly enhanced by MHV68 infection of K-RasLA1 mice (Figure S7). However, RNA-seq analyses of lung RNA isolated via an anti-m6A pull-down from infected tumor-bearing mice revealed significant m6A modification of only the transcripts for Cebpd and Mt2. To gain further insight into the relationship between m6A RNA modification and tumor promotion in response MHV68 infection, mRNAs identified previously for selective expression in MDSCs [45] were assessed for m6A RNA modification by the pull-down assay. Methylation of 69 MDSC marker mRNAs (Table S3) correlated with a greater than 6fold increase in expression following MHV68 infection (Figure 10a). In comparison, m6A-modified marker mRNAs for epithelial (alveolar type 1, AT1 and alveolar type 2, AT2, Table S3) cells [46] only showed a modest 1.2-fold increase (Figure 10a). This difference did not appear to be related to an elevated fold enrichment of m6A targets in MDSCs (Figure 10b). These data suggest that MHV68 infection induced selective m6A modification of MDSC markers and these preferentially methylated transcripts showed increased expression levels. Whether m6A modification is integral to the lung recruitment of MDSCs and the functional validation of these cells from MHV68-infected lung-tumor-bearing mice will require additional investigation.

4. Discussion

The results showed that MHV68 infection in tumor-bearing K-RasLA1 mice increased the levels of Type 17 cytokines and proliferative lesions in the lung. The combination of virus infection and lung tumors correlated with the recruitment of immune cells to the lung. Although the presence of lung tumors was sufficient to promote lung recruitment of Gr-1+ cells, MHV68 infection led to recruitment of -Ly6Chi cells characteristic of M-MDSCs. In agreement with the recent observation regarding the recruitment of MDSCs (primarily Ly6Chi cells) following ionizing radiation [47], m6A modification of RNA appears to contribute to enhanced levels of mRNAs selectively expressed in MDSCs. These observations support the premise that γherpesvirus infection establishes an immune environment that facilitates lung tumorigenesis and identifies the m6A modification of mRNA as a contributor to that process.
IL-17 expression promotes tumorigenesis in autochthonous murine lung tumor models [4,5,6,48]. Our assays of wild-type and tumor-bearing mice showed that MHV68 infection induced Type 17 inflammation, with a marked induction of IL-6. Promotion of lung tumorigenesis by Type 17 inflammation can be abrogated by an antibody to Gr-1 [5,6], and we identified Type 17 cytokines and Gr-1+ cells in MHV68-infected mice. MDSCs produce IL-6 [44], and the diminishing levels of Gr-1+ cells likely reduce tumor promotion, in part through the reduction of IL-6 levels. It is notable that Kaposi’s sarcoma-associated herpesvirus, a γherpesvirus that causes a human malignancy derived from endothelial cells, encodes a viral gene with homology to Il-6 [11].
The induction of IL-6 and CSF3 in MHV68-infected K-RasLA1 mice implicates tumor promotion mediated by MDSC recruitment. Further study will be required to functionally validate these cells as M-MDSCs. Since the literature has demonstrated that IL-17, IL-6, and CSF3 promote lung tumorigenesis [4,5,6,41,49,50], we conjecture that MHV68 induces tumor promotion via induction of these cytokines. However, future experiments will be required to verify that CSF3 and IL-6 are involved in tumor promotion in this model. Corresponding to the observations here, conversion of slowly cycling tumor cells in culture to a highly proliferative and invasive phenotype requires the stromal synthesis of both CSF3 and IL-6 [51]. Stromal fibroblasts release IL-6, CSF3, and Activin-A, which promote the dedifferentiation of lung carcinoma cells to cancer stem cells [52]. Treatment of tumor stromal organoids in culture with docetaxel induces cytokine secretion (Csf3, Csf2, Il-6, Cxcl1, Cxcl2, and Tnfα) into the cell culture media while reducing levels of Vegf [51]. Our RNA sequencing data revealed that similar alterations of the mRNAs encoding these cytokines occurred in the lungs of MHV68-infected K-RasLA1 mice (with the exception of csf2, which did not change, Figure S8). In tumor-bearing mice, the combination of CSF3 and IL-6 cooperates to convert neutrophil precursors in the bone marrow into a pro-tumorigenic phenotype, while bone-marrow-derived neutrophils from mice lacking tumors have an anti-tumorigenic effect [53]. Consistent with this observation, the data shown here imply that the recruitment of immune cells (potentially MDSCs) depends on the combined effects of inflammation associated with viral infection and the presence of lung tumors, which correlates with increased expression of both IL-6 and CSF3. In multiple tumor models, tumor promotion by IL-17, IL-6, and CSF3 depends, at least in part, upon accumulation of MDSCs [5,6,34,35]. Co-staining demonstrated the presence of Ly6G and IL-6 double-positive cells in lung tissue sections from MHV68-infected K-RasLA1 mice 7-days post-infection. These results are consistent with our findings, which show that MHV68 infection enhanced both the mRNA (lung) and protein levels (lung, serum) of IL-6 in tumor-bearing mice 7-days post-infection, a time when MDSC-promoting cytokines (Csf3 and Cxcl1) and MDSC markers (Cd84, Jaml, and Trem2) were also significantly elevated. These results are further supported by the literature, which attests that Gr-1+ MDSCs are a source of IL-6 [44] and that IL-6 has a significant role in tumor promotion [54,55,56,57,58]. A cytokine with homology to IL-6 promotes invasion/metastasis via a feed-forward loop in a drosophila model [59]. In colon carcinoma, IL-6 is expressed by MDSCs in the tumor microenvironment and tumor promotion is abrogated upon ablation of IL-6 expression and enhanced by IL-6 overexpression [44]. IL-6 has pleiotropic effects on immune cells, which contributes to its role in tumor promotion and as a regulator of MDSC activity [49]. It also plays a role in tumor cell proliferation, survival, invasiveness, and metastasis [54,55,56,57,58].
In this model of lung tumor promotion by MHV68, induction of Csf3 requires both the infection and the presence of lung tumors. Csf3 mediates MDSC promotion [34] and chemotherapy resistance [51]. Elevated plasma levels of Csf3 are a poor prognostic indicator in non-small cell lung cancer [50]. Csf3 promotes the survival, proliferation, differentiation, and function of mature neutrophils and neutrophil precursors [34]. Csf3 and Cxcl1, which are induced by IL-17 in our lung tumor cell line from K-RasLA1 mice, contribute to the development, function, and recruitment of MDSCs [34,35]. The enhanced expression of Cd84, Jaml, and Trem2 mRNAs in MHV68-infected mice conform to MDSC accumulation in the lung. In mice injected with colon cancer cells, Csf3 promotes tumorigenesis by eliciting IL-10-producing FoxP3+ CD4+ and CD8+ T cells, and [60] mice lacking Csf3r display reduced levels of IL-10 and decreased growth of injected tumor cells [60]. In accord, we observed increased Il-10, Cd4, Cd8a, and Foxp3 mRNAs in our RNA-seq data from K-RasLA1 mice on day 7 post-infection (Figure S9). A significant difference in lung Csf3 and Cxcl1 protein levels between MHV68-infected wild-type and tumor-bearing mice was observed and appears to correlate with the differential lung recruitment of MDSCs as assessed by mRNA levels of Cd84, Jaml, and Trem2 expression in the lung and detection of CD45+CD11b+Ly6G+ and CD45+CD11b+Ly6GDimLy6C+ cells by flow cytometry.
MDSCs are a group of highly heterogeneous cells derived from immature myeloid progenitors that are usually divided into two subpopulations: polymorphonuclear MDSCs (PMN-MDSCs) and monocytic MDSCs (M-MDSCs) [61]. During tumor development, MDSCs are recruited to the tumor site by chemokines, where they induce tumor promotion by expressing IL-6 and suppressing T- and NK-cell activation [25,34,35,44,62]. Lower MDSC levels correlate with prolonged patient survival in glioblastoma and glioma [47]. PMN-MDSCs have been typically associated with tumor promotion by IL-17 [34]. At 7 days post-infection, there was more recruitment of Ly6Chi cells in the Ly6G+-isolated samples from MHV68-infected K-RasLA1 mice than there were in the uninfected K-RasLA1 mice. Since Ly6Chi is a phenotypic marker for M-MDSCs, these data imply these cells derived from progenitor monocytes are being induced by MHV68 infection. These Ly6Chi cells effectively suppress T cells [63], and Trem2 expression by M-MDSCs appears to play an essential role in the suppression of NK cells in lung cancer [25]. Potentially, the CCL2-CCR2 ligand–receptor pair are involved in recruitment of these Ly6G-/Ly6Chi cells to the lung. CCR2+ M-MDSCs suppress CD8 T cells in a murine melanoma model [64]. The enhanced detection of M-MDSC markers at day 7 post-infection (Figure 9c) indicates that these cells are being selectively recruited during MHV68 infection.
The most prevalent eukaryotic mRNA modification is N6-methyladenosine (m6A), and it is responsible for regulating the translation and stability of modified mRNAs [65]. RNA methylation appears to correlate with the enhanced expression of mRNAs selectively expressed in MDSCs (Figure 10). This correlation suggests that therapeutic targeting of RNA modification may provide a means to reverse mobilization of immune cells to the lung and thereby ameliorate γherpesvirus-dependent immune suppression in lung tumorigenesis. Our data describe an altered immune milieu during lung tumorigenesis associated with γherpesvirus infection.

Supplementary Materials

The following supporting information can be downloaded at: https://www.mdpi.com/article/10.3390/pathogens13090747/s1. Figure S1: MHV68 infection induces Il-6 protein expression in wild-type mice. Figure S2: IL-17 treatment of mK-Ras-LE cells induces mRNAs encoding cytokines that promote granulocyte recruitment and survival. Figure S3: Changes in Jaml mRNA levels at increasing times after infection of wild-type mice. Figure S4: MDSC marker correlations observed in the lungs of uninfected and MHV68-infected tumor-bearing mice. Figure S5: Induction of immunosuppressive mediators in MHV68-infected tumor-bearing mice. Figure S6: Increased expression of mRNAs encoding M-MDSC surface markers after infection with MHV68. Figure S7: MHV68-mediated induction of lung levels of mRNAs identified previously as m6A modified in an IL-17-dependent manner [33]. Figure S8: Profiling inflammatory cytokine mRNA expression in MHV68-infected tumor-bearing mice. Figure S9: mRNA markers of suppressed adaptive immunity in MHV68-infected mice one-week post-infection. Table S1: Analyses of Ly6G+ by flow cytometry. Table S2: mRNAs selectively expressed in M-MDSCs, PMN-MDSCs, Alveolar Type 1 (AT1) cells, and Alveolar Type 2 (AT2) cells. Table S3: Fold-change mRNA vs fold-m6A-enrichment for MDSC versus lung epithelium marker mRNAs.

Author Contributions

Conceptualization, C.A.M., Z.L. and G.F.M.; methodology, S.S.M., K.F.S., Y.Z., Q.Y. and G.F.M.; formal analysis, S.S.M. and G.F.M.; resources, G.P. and J.A.L.; data curation, S.S.M. and G.F.M.; writing—original draft preparation, S.S.M. and G.F.M.; writing—review and editing, all authors; supervision, G.F.M.; funding acquisition, E.F., C.A.M., Z.L. and G.F.M. All authors have read and agreed to the published version of the manuscript.

Funding

Supported by a pilot grant from the Tulane School of Medicine and the Department of Pathology (Z.L., G.F.M.). Funds also provided by the Department of Microbiology (C.A.M.) and by the Tulane Cancer Center (E.F.).

Institutional Review Board Statement

The animal study protocol was approved by the Institutional Animal Care and Use Committee of Tulane University (protocol ID: 1617; approved on 27 July 2022).

Informed Consent Statement

Not applicable.

Data Availability Statement

The original contributions presented in the study are included in the article/supplementary material, further inquiries can be directed to the corresponding author.

Acknowledgments

Louay Bachnak provided the protocol for flow cytometry sample preparation. Constance Porretta performed flow cytometry.

Conflicts of Interest

The authors declare no conflicts of interest.

References

  1. Sung, H.; Ferlay, J.; Siegel, R.L.; Laversanne, M.; Soerjomataram, I.; Jemal, A.; Bray, F. Global Cancer Statistics 2020: GLOBOCAN Estimates of Incidence and Mortality Worldwide for 36 Cancers in 185 Countries. CA Cancer J. Clin. 2021, 71, 209–249. [Google Scholar] [CrossRef]
  2. Jemal, A.; Bray, F.; Center, M.M.; Ferlay, J.; Ward, E.; Forman, D. Global cancer statistics. CA Cancer J. Clin. 2011, 61, 69–90. [Google Scholar] [CrossRef]
  3. Loeb, L.A.; Ernster, V.L.; Warner, K.E.; Abbotts, J.; Laszlo, J. Smoking and lung cancer: An overview. Cancer Res. 1984, 44, 5940–5958. [Google Scholar]
  4. Xu, B.; Guenther, J.F.; Pociask, D.A.; Wang, Y.; Kolls, J.K.; You, Z.; Chandrasekar, B.; Shan, B.; Sullivan, D.E.; Morris, G.F. Promotion of lung tumor growth by interleukin-17. Am. J. Physiol. Lung. Cell. Mol. Physiol. 2014, 307, L497–L508. [Google Scholar] [CrossRef]
  5. Chang, S.H.; Mirabolfathinejad, S.G.; Katta, H.; Cumpian, A.M.; Gong, L.; Caetano, M.S.; Moghaddam, S.J.; Dong, C. T helper 17 cells play a critical pathogenic role in lung cancer. Proc. Natl. Acad. Sci. USA 2014, 111, 5664–5669. [Google Scholar] [CrossRef]
  6. Akbay, E.A.; Koyama, S.; Liu, Y.; Dries, R.; Bufe, L.E.; Silkes, M.; Alam, M.M.; Magee, D.M.; Jones, R.; Jinushi, M.; et al. Interleukin-17A Promotes Lung Tumor Progression through Neutrophil Attraction to Tumor Sites and Mediating Resistance to PD-1 Blockade. J. Thorac. Oncol. 2017, 12, 1268–1279. [Google Scholar] [CrossRef]
  7. Takahashi, H.; Ogata, H.; Nishigaki, R.; Broide, D.H.; Karin, M. Tobacco smoke promotes lung tumorigenesis by triggering IKKbeta- and JNK1-dependent inflammation. Cancer Cell 2010, 17, 89–97. [Google Scholar] [CrossRef]
  8. Mills, K.H.G. IL-17 and IL-17-producing cells in protection versus pathology. Nat. Rev. Immunol. 2023, 23, 38–54. [Google Scholar] [CrossRef] [PubMed]
  9. Hill, W.; Lim, E.L.; Weeden, C.E.; Lee, C.; Augustine, M.; Chen, K.; Kuan, F.C.; Marongiu, F.; Evans, E.J., Jr.; Moore, D.A.; et al. Lung adenocarcinoma promotion by air pollutants. Nature 2023, 616, 159–167. [Google Scholar] [CrossRef]
  10. Yao, Z.; Fanslow, W.C.; Seldin, M.F.; Rousseau, A.M.; Painter, S.L.; Comeau, M.R.; Cohen, J.I.; Spriggs, M.K. Herpesvirus Saimiri encodes a new cytokine, IL-17, which binds to a novel cytokine receptor. Immunity 1995, 3, 811–821. [Google Scholar] [CrossRef] [PubMed]
  11. Sakakibara, S.; Tosato, G. Viral interleukin-6: Role in Kaposi’s sarcoma-associated herpesvirus: Associated malignancies. J. Interferon Cytokine Res. 2011, 31, 791–801. [Google Scholar] [CrossRef]
  12. Jondle, C.N.; Johnson, K.E.; Aurubin, C.; Sylvester, P.; Xin, G.; Cui, W.; Huppler, A.R.; Tarakanova, V.L. Gammaherpesvirus Usurps Host IL-17 Signaling To Support the Establishment of Chronic Infection. mBio 2021, 12, e00566-21. [Google Scholar] [CrossRef] [PubMed]
  13. Jondle, C.N.; Tarakanova, V.L. T Cell-Intrinsic Interleukin 17 Receptor A Signaling Supports the Establishment of Chronic Murine Gammaherpesvirus 68 Infection. J. Virol. 2022, 96, e0063922. [Google Scholar] [CrossRef]
  14. Guenther, J.F.; Cameron, J.E.; Nguyen, H.T.; Wang, Y.; Sullivan, D.E.; Shan, B.; Lasky, J.A.; Flemington, E.K.; Morris, G.F. Modulation of lung inflammation by the Epstein-Barr virus protein Zta. Am. J. Physiol. Lung Cell. Mol. Physiol. 2010, 299, L771–L784. [Google Scholar] [CrossRef]
  15. Wang, Y.; Tibbetts, S.A.; Krug, L.T. Conquering the Host: Determinants of Pathogenesis Learned from Murine Gammaherpesvirus 68. Annu. Rev. Virol. 2021, 8, 349–371. [Google Scholar] [CrossRef]
  16. Liang, X.; Collins, C.M.; Mendel, J.B.; Iwakoshi, N.N.; Speck, S.H. Gammaherpesvirus-driven plasma cell differentiation regulates virus reactivation from latently infected B lymphocytes. PLoS Pathog. 2009, 5, e1000677. [Google Scholar] [CrossRef]
  17. Cohen, J.I. Epstein-Barr virus infection. N. Engl. J. Med. 2000, 343, 481–492. [Google Scholar] [CrossRef] [PubMed]
  18. Tzellos, S.; Farrell, P.J. Epstein-barr virus sequence variation-biology and disease. Pathogens 2012, 1, 156–174. [Google Scholar] [CrossRef]
  19. Farrell, P.J. Epstein-Barr Virus and Cancer. Annu. Rev. Pathol. 2019, 14, 29–53. [Google Scholar] [CrossRef]
  20. Shechter, O.; Sausen, D.G.; Gallo, E.S.; Dahari, H.; Borenstein, R. Epstein-Barr Virus (EBV) Epithelial Associated Malignancies: Exploring Pathologies and Current Treatments. Int. J. Mol. Sci. 2022, 23, 14389. [Google Scholar] [CrossRef]
  21. Han, S.; Tay, J.K.; Loh, C.J.L.; Chu, A.J.M.; Yeong, J.P.S.; Lim, C.M.; Toh, H.C. Epstein-Barr Virus Epithelial Cancers-A Comprehensive Understanding to Drive Novel Therapies. Front. Immunol. 2021, 12, 734293. [Google Scholar] [CrossRef]
  22. Becnel, D.; Abdelghani, R.; Nanbo, A.; Avilala, J.; Kahn, J.; Li, L.; Lin, Z. Pathogenic Role of Epstein-Barr Virus in Lung Cancers. Viruses 2021, 13, 877. [Google Scholar] [CrossRef] [PubMed]
  23. Kheir, F.; Zhao, M.; Strong, M.J.; Yu, Y.; Nanbo, A.; Flemington, E.K.; Morris, G.F.; Reiss, K.; Li, L.; Lin, Z. Detection of Epstein-Barr Virus Infection in Non-Small Cell Lung Cancer. Cancers 2019, 11, 759. [Google Scholar] [CrossRef] [PubMed]
  24. Osorio, J.C.; Blanco, R.; Corvalán, A.H.; Muñoz, J.P.; Calaf, G.M.; Aguayo, F. Epstein-Barr Virus Infection in Lung Cancer: Insights and Perspectives. Pathogens 2022, 11, 132. [Google Scholar] [CrossRef]
  25. Park, M.D.; Reyes-Torres, I.; LeBerichel, J.; Hamon, P.; LaMarche, N.M.; Hegde, S.; Belabed, M.; Troncoso, L.; Grout, J.A.; Magen, A.; et al. TREM2 macrophages drive NK cell paucity and dysfunction in lung cancer. Nat. Immunol. 2023, 24, 792–801. [Google Scholar] [CrossRef]
  26. Virgin, H.W.t.; Presti, R.M.; Li, X.Y.; Liu, C.; Speck, S.H. Three distinct regions of the murine gammaherpesvirus 68 genome are transcriptionally active in latently infected mice. J. Virol. 1999, 73, 2321–2332. [Google Scholar] [CrossRef]
  27. Gargano, L.M.; Forrest, J.C.; Speck, S.H. Signaling through Toll-like receptors induces murine gammaherpesvirus 68 reactivation in vivo. J. Virol. 2009, 83, 1474–1482. [Google Scholar] [CrossRef] [PubMed]
  28. Wu, T.T.; Usherwood, E.J.; Stewart, J.P.; Nash, A.A.; Sun, R. Rta of murine gammaherpesvirus 68 reactivates the complete lytic cycle from latency. J. Virol. 2000, 74, 3659–3667. [Google Scholar] [CrossRef]
  29. Weck, K.E.; Barkon, M.L.; Yoo, L.I.; Speck, S.H.; Virgin, H.I. Mature B cells are required for acute splenic infection, but not for establishment of latency, by murine gammaherpesvirus 68. J. Virol. 1996, 70, 6775–6780. [Google Scholar] [CrossRef]
  30. Raffegerst, S.; Steer, B.; Hohloch, M.; Adler, H. Prevention of Tumor Formation by Latent Gammaherpesvirus Infection. PLoS ONE 2015, 10, e0145678. [Google Scholar] [CrossRef]
  31. Forrest, J.C.; Speck, S.H. Establishment of B-cell lines latently infected with reactivation-competent murine gammaherpesvirus 68 provides evidence for viral alteration of a DNA damage-signaling cascade. J. Virol. 2008, 82, 7688–7699. [Google Scholar] [CrossRef]
  32. Hoffmann, S.H.L.; Reck, D.I.; Maurer, A.; Fehrenbacher, B.; Sceneay, J.E.; Poxleitner, M.; Öz, H.H.; Ehrlichmann, W.; Reischl, G.; Fuchs, K.; et al. Visualization and quantification of in vivo homing kinetics of myeloid-derived suppressor cells in primary and metastatic cancer. Theranostics 2019, 9, 5869–5885. [Google Scholar] [CrossRef] [PubMed]
  33. Bechara, R.; Amatya, N.; Bailey, R.D.; Li, Y.; Aggor, F.E.Y.; Li, D.D.; Jawale, C.V.; Coleman, B.M.; Dai, N.; Gokhale, N.S.; et al. The m(6)A reader IMP2 directs autoimmune inflammation through an IL-17- and TNFα-dependent C/EBP transcription factor axis. Sci. Immunol. 2021, 6, eabd1287. [Google Scholar] [CrossRef] [PubMed]
  34. Alshetaiwi, H.; Pervolarakis, N.; McIntyre, L.L.; Ma, D.; Nguyen, Q.; Rath, J.A.; Nee, K.; Hernandez, G.; Evans, K.; Torosian, L.; et al. Defining the emergence of myeloid-derived suppressor cells in breast cancer using single-cell transcriptomics. Sci. Immunol. 2020, 5, aay6017. [Google Scholar] [CrossRef]
  35. Veglia, F.; Sanseviero, E.; Gabrilovich, D.I. Myeloid-derived suppressor cells in the era of increasing myeloid cell diversity. Nat. Rev. Immunol. 2021, 21, 485–498. [Google Scholar] [CrossRef]
  36. Li, X.; Bechara, R.; Zhao, J.; McGeachy, M.J.; Gaffen, S.L. IL-17 receptor-based signaling and implications for disease. Nat. Immunol. 2019, 20, 1594–1602. [Google Scholar] [CrossRef] [PubMed]
  37. Sun, D.; Novotny, M.; Bulek, K.; Liu, C.; Li, X.; Hamilton, T. Treatment with IL-17 prolongs the half-life of chemokine CXCL1 mRNA via the adaptor TRAF5 and the splicing-regulatory factor SF2 (ASF). Nat. Immunol. 2011, 12, 853–860. [Google Scholar] [CrossRef] [PubMed]
  38. Molgora, M.; Esaulova, E.; Vermi, W.; Hou, J.; Chen, Y.; Luo, J.; Brioschi, S.; Bugatti, M.; Omodei, A.S.; Ricci, B.; et al. TREM2 Modulation Remodels the Tumor Myeloid Landscape Enhancing Anti-PD-1 Immunotherapy. Cell 2020, 182, 886–900.e817. [Google Scholar] [CrossRef]
  39. Ford, J.W.; Gonzalez-Cotto, M.; MacFarlane, A.W.t.; Peri, S.; Howard, O.M.Z.; Subleski, J.J.; Ruth, K.J.; Haseebuddin, M.; Al-Saleem, T.; Yang, Y.; et al. Tumor-Infiltrating Myeloid Cells Co-Express TREM1 and TREM2 and Elevated TREM-1 Associates With Disease Progression in Renal Cell Carcinoma. Front. Oncol. 2021, 11, 662723. [Google Scholar] [CrossRef]
  40. Dong, Y.; Liu, Y.; Bai, H.; Jiao, S. Systematic assessment of the clinicopathological prognostic significance of tissue cytokine expression for lung adenocarcinoma based on integrative analysis of TCGA data. Sci. Rep. 2019, 9, 6301. [Google Scholar] [CrossRef]
  41. Kowanetz, M.; Wu, X.; Lee, J.; Tan, M.; Hagenbeek, T.; Qu, X.; Yu, L.; Ross, J.; Korsisaari, N.; Cao, T.; et al. Granulocyte-colony stimulating factor promotes lung metastasis through mobilization of Ly6G+Ly6C+ granulocytes. Proc. Natl. Acad. Sci. USA 2010, 107, 21248–21255. [Google Scholar] [CrossRef] [PubMed]
  42. Ouzounova, M.; Lee, E.; Piranlioglu, R.; El Andaloussi, A.; Kolhe, R.; Demirci, M.F.; Marasco, D.; Asm, I.; Chadli, A.; Hassan, K.A.; et al. Monocytic and granulocytic myeloid derived suppressor cells differentially regulate spatiotemporal tumour plasticity during metastatic cascade. Nat. Commun. 2017, 8, 14979. [Google Scholar] [CrossRef]
  43. Condamine, T.; Mastio, J.; Gabrilovich, D.I. Transcriptional regulation of myeloid-derived suppressor cells. J. Leukoc. Biol. 2015, 98, 913–922. [Google Scholar] [CrossRef]
  44. Ibrahim, M.L.; Lu, C.; Klement, J.D.; Redd, P.S.; Yang, D.; Smith, A.D.; Liu, K. Expression profiles and function of IL6 in polymorphonuclear myeloid-derived suppressor cells. Cancer Immunol. Immunother. 2020, 69, 2233–2245. [Google Scholar] [CrossRef] [PubMed]
  45. Bayik, D.; Zhou, Y.; Park, C.; Hong, C.; Vail, D.; Silver, D.J.; Lauko, A.; Roversi, G.; Watson, D.C.; Lo, A.; et al. Myeloid-Derived Suppressor Cell Subsets Drive Glioblastoma Growth in a Sex-Specific Manner. Cancer Discov. 2020, 10, 1210–1225. [Google Scholar] [CrossRef] [PubMed]
  46. Kobayashi, Y.; Tata, A.; Konkimalla, A.; Katsura, H.; Lee, R.F.; Ou, J.; Banovich, N.E.; Kropski, J.A.; Tata, P.R. Persistence of a regeneration-associated, transitional alveolar epithelial cell state in pulmonary fibrosis. Nat. Cell Biol. 2020, 22, 934–946. [Google Scholar] [CrossRef] [PubMed]
  47. Wang, L.; Dou, X.; Chen, S.; Yu, X.; Huang, X.; Zhang, L.; Chen, Y.; Wang, J.; Yang, K.; Bugno, J.; et al. YTHDF2 inhibition potentiates radiotherapy antitumor efficacy. Cancer Cell 2023, 41, 1294–308.e1298. [Google Scholar] [CrossRef] [PubMed]
  48. Jin, C.; Lagoudas, G.K.; Zhao, C.; Bullman, S.; Bhutkar, A.; Hu, B.; Ameh, S.; Sandel, D.; Liang, X.S.; Mazzilli, S.; et al. Commensal Microbiota Promote Lung Cancer Development via γδ T Cells. Cell 2019, 176, 998–1013.e1016. [Google Scholar] [CrossRef]
  49. Weber, R.; Groth, C.; Lasser, S.; Arkhypov, I.; Petrova, V.; Altevogt, P.; Utikal, J.; Umansky, V. IL-6 as a major regulator of MDSC activity and possible target for cancer immunotherapy. Cell. Immunol. 2021, 359, 104254. [Google Scholar] [CrossRef]
  50. Stathopoulos, G.P.; Armakolas, A.; Tranga, T.; Marinou, H.; Stathopoulos, J.; Chandrinou, H. Granulocyte colony-stimulating factor expression as a prognostic biomarker in non-small cell lung cancer. Oncol. Rep. 2011, 25, 1541–1544. [Google Scholar] [CrossRef]
  51. Ganesan, R.; Bhasin, S.S.; Bakhtiary, M.; Krishnan, U.; Cheemarla, N.R.; Thomas, B.E.; Bhasin, M.K.; Sukhatme, V.P. Taxane chemotherapy induces stromal injury that leads to breast cancer dormancy escape. PLoS Biol. 2023, 21, e3002275. [Google Scholar] [CrossRef]
  52. Rodrigues, C.F.D.; Serrano, E.; Patrício, M.I.; Val, M.M.; Albuquerque, P.; Fonseca, J.; Gomes, C.M.F.; Abrunhosa, A.J.; Paiva, A.; Carvalho, L.; et al. Stroma-derived IL-6, G-CSF and Activin-A mediated dedifferentiation of lung carcinoma cells into cancer stem cells. Sci. Rep. 2018, 8, 11573. [Google Scholar] [CrossRef] [PubMed]
  53. Yan, B.; Wei, J.J.; Yuan, Y.; Sun, R.; Li, D.; Luo, J.; Liao, S.J.; Zhou, Y.H.; Shu, Y.; Wang, Q.; et al. IL-6 cooperates with G-CSF to induce protumor function of neutrophils in bone marrow by enhancing STAT3 activation. J. Immunol. 2013, 190, 5882–5893. [Google Scholar] [CrossRef] [PubMed]
  54. Kumari, N.; Dwarakanath, B.S.; Das, A.; Bhatt, A.N. Role of interleukin-6 in cancer progression and therapeutic resistance. Tumour Biol. 2016, 37, 11553–11572. [Google Scholar] [CrossRef] [PubMed]
  55. Lin, M.T.; Juan, C.Y.; Chang, K.J.; Chen, W.J.; Kuo, M.L. IL-6 inhibits apoptosis and retains oxidative DNA lesions in human gastric cancer AGS cells through up-regulation of anti-apoptotic gene mcl-1. Carcinogenesis 2001, 22, 1947–1953. [Google Scholar] [CrossRef]
  56. Jourdan, M.; Veyrune, J.L.; De Vos, J.; Redal, N.; Couderc, G.; Klein, B. A major role for Mcl-1 antiapoptotic protein in the IL-6-induced survival of human myeloma cells. Oncogene 2003, 22, 2950–2959. [Google Scholar] [CrossRef]
  57. Wegiel, B.; Bjartell, A.; Culig, Z.; Persson, J.L. Interleukin-6 activates PI3K/Akt pathway and regulates cyclin A1 to promote prostate cancer cell survival. Int. J. Cancer 2008, 122, 1521–1529. [Google Scholar] [CrossRef]
  58. Zou, M.; Zhang, X.; Xu, C. IL6-induced metastasis modulators p-STAT3, MMP-2 and MMP-9 are targets of 3,3’-diindolylmethane in ovarian cancer cells. Cell Oncol. 2016, 39, 47–57. [Google Scholar] [CrossRef]
  59. Barrio, L.; Gaspar, A.E.; Muzzopappa, M.; Ghosh, K.; Romao, D.; Clemente-Ruiz, M.; Milán, M. Chromosomal instability-induced cell invasion through caspase-driven DNA damage. Curr. Biol. 2023, 33, 4446–4457.e5. [Google Scholar] [CrossRef]
  60. Karagiannidis, I.; Jerman, S.J.; Jacenik, D.; Phinney, B.B.; Yao, R.; Prossnitz, E.R.; Beswick, E.J. G-CSF and G-CSFR Modulate CD4 and CD8 T Cell Responses to Promote Colon Tumor Growth and Are Potential Therapeutic Targets. Front. Immunol. 2020, 11, 1885. [Google Scholar] [CrossRef]
  61. Yang, Z.; Guo, J.; Weng, L.; Tang, W.; Jin, S.; Ma, W. Myeloid-derived suppressor cells-new and exciting players in lung cancer. J. Hematol. Oncol. 2020, 13, 10. [Google Scholar] [CrossRef] [PubMed]
  62. Deng, X.; Li, X.; Guo, X.; Lu, Y.; Xie, Y.; Huang, X.; Lin, J.; Tan, W.; Wang, C. Myeloid-derived suppressor cells promote tumor growth and sorafenib resistance by inducing FGF1 upregulation and fibrosis. Neoplasia 2022, 28, 100788. [Google Scholar] [CrossRef] [PubMed]
  63. Liang, H.; Deng, L.; Hou, Y.; Meng, X.; Huang, X.; Rao, E.; Zheng, W.; Mauceri, H.; Mack, M.; Xu, M.; et al. Host STING-dependent MDSC mobilization drives extrinsic radiation resistance. Nat. Commun. 2017, 8, 1736. [Google Scholar] [CrossRef]
  64. Lesokhin, A.M.; Hohl, T.M.; Kitano, S.; Cortez, C.; Hirschhorn-Cymerman, D.; Avogadri, F.; Rizzuto, G.A.; Lazarus, J.J.; Pamer, E.G.; Houghton, A.N.; et al. Monocytic CCR2(+) myeloid-derived suppressor cells promote immune escape by limiting activated CD8 T-cell infiltration into the tumor microenvironment. Cancer Res. 2012, 72, 876–886. [Google Scholar] [CrossRef] [PubMed]
  65. Frye, M.; Harada, B.T.; Behm, M.; He, C. RNA modifications modulate gene expression during development. Science 2018, 361, 1346–1349. [Google Scholar] [CrossRef]
Figure 1. MHV68 infection activates expression of Type 17 cytokines. The graphs represent the mean fold change +/- SEM relative to the control for the indicated mRNA (n = 3–9 infected; n = 13 control) versus the days post-infection (DPI) for mRNAs encoding: (a) Orf65, normalized to the levels detected on day 7, (b) Il-17 (* p = 0.0205), and (c) Il-6 (**** p < 0.0001 uninfected versus MHV68 infected). Il-17 and Il-6 in MHV68-infected wild-type (WT) mice are normalized to PBS-treated control WT mice at day 7.
Pathogens 13 00747 g001
Figure 2. MHV68 infection induces proliferative lesions in K-RasLA1 mice. (a) Tumor nodules on the pleural surface of fixed lung tissue. (b) The tumor nodules from uninfected and MHV68-infected K-RasLA1 mice were counted by 3 individuals unaware of the sample identity. The individual values for each mouse were normalized to the mean of the control for each observer. Each symbol represents the fold change of the mean number tumors from the 3 assessments of each mouse (** p = 0.0013 mock-infected versus MHV68-infected). (c) The fixed lung tissues from the mice in panel b were paraffin-embedded prior to preparation of tissue sections, which were H&E stained to reveal histopathology. Proliferative lung lesions (encircled red) were identified in a blinded manner. (d) Proliferative lung lesions were totaled for each mouse. The graph shows the number of proliferative lesions per section for each mouse. (**** p < 0.0001 mock infected versus MHV68 infected).
Pathogens 13 00747 g002
Figure 3. MHV68 infection of wild-type mice elicits cytokines that promote granulocyte recruitment and survival while not affecting expression of Cd84, an immune cell marker mRNA. Levels of the mRNAs for Cxcl1, Csf3, and Cd84 in the lungs of wild-type mice were determined at increasing times post-infection with MHV68 (see Figure 1). The graph shows the fold-change lung mRNA for Cxcl1 (blue circles), Csf3 (red squares), and Cd84 (green triangles) for the indicated day post-infection (DPI). (*** p = 0.001 infected versus uninfected control, n = 3–9 infected; n = 13 control).
Pathogens 13 00747 g003
Figure 4. Differential expression of immune cell mRNA markers in the lungs of MHV68-infected wild-type and tumor-bearing mice. (a) Four-way comparison of mRNAs encoding immune cell markers between uninfected and infected wild-type and K-RasLA1 mice at 7 days post-infection. Each symbol on the graph depicts the relative levels of Cd84 mRNA in the lungs of a mouse in one of four treatment groups: uninfected wild-type (WT Control), infected wild-type (WT MHV68), uninfected K-RasLA1 (K-Ras Control), and infected K-RasLA1 (K-Ras MHV68). Each value is normalized to the mean of the WT Control group. Statistical significance was determined by ordinary one-way ANOVA. (ns, nonspecific; ** p = 0.0018, **** p < 0.0001). (b) Same as panel (a) except the levels of Jaml mRNA are shown. (ns, nonspecific; ** p = 0.0022). (c) Correlation graph for Cd84 mRNA levels versus Jaml mRNA levels in wild-type mice infected with MHV68 (r2 = 0.04448). (d) Same as panel (c) except levels of Cd84 mRNA are correlated with levels of Jaml mRNA in infected K-RasLA1 mice (r2 = 0.4555).
Pathogens 13 00747 g004
Figure 5. MHV68 infection selectively enhances expression of Cxcl1 protein in the lungs of tumor-bearing versus wild-type mice. Four-way comparison of Cxcl1 protein and mRNA expression between uninfected and infected wild-type and K-RasLA1 mice at day 7 post-infection. (a) Serum levels (pg/mL) of Cxcl1 protein determined by ELISA in 4 groups of mice: uninfected wild-type (WT Control), infected wild-type (WT MHV68), uninfected K-RasLA1 (K-Ras Control), and infected K-RasLA1 (K-Ras MHV68) (ns, nonspecific; **** p < 0.0001). (b) Relative levels of Cxcl1 mRNA in the lung. Same as Figure 4a except the relative levels of Cxcl1 mRNA are shown. (**** p < 0.0001). (c) Same as panel (a) except pg Cxcl1 per mg lung extract is shown. (ns, nonspecific; **** p < 0.0001). Statistical comparisons by one way ANOVA.
Pathogens 13 00747 g005
Figure 6. MHV68 infection selectively enhances expression of Csf3 protein in the lungs of tumor-bearing versus wild-type mice. Four-way comparison of Csf3 protein and mRNA expression between uninfected and infected wild-type and K-RasLA1 mice at day 7 post-infection. (a) Same as Figure 5a, except serum levels (pg/mL) of Csf3 protein are shown. (ns, nonspecific). (b) Same as Figure 5b, except the lung levels of Csf3 mRNA are shown (** p = 0.0042; **** p < 0.0001). (c) Same as panel (a) except pg Csf3 per mg lung extract is shown. (ns, nonspecific; ** p = 0.0015). Statistical comparisons by one way ANOVA (GraphPad Prism).
Pathogens 13 00747 g006
Figure 7. MHV68 infection induces IL-6 mRNA and protein expression in K-RasLA1 mice. (a) Comparison of IL-6 protein levels in the serum of uninfected and MHV68-infected K-RasLA1 mice. Each symbol represents the relative levels of IL-6 protein in the serum of an uninfected or MHV68-infected K-RasLA1 mouse (*** p = 0.0002). (b) Comparison of Il-6 mRNA levels in the lungs of uninfected and MHV68-infected K-RasLA1 mice. Each symbol represents the relative levels of Il-6 mRNA in the lungs of an uninfected or MHV68-infected K-RasLA1 mouse (**** p < 0.0001 unexposed versus MHV68). (c) Comparison of Il-6 protein levels in the lungs of uninfected and MHV68-infected K-RasLA1 mice. Each symbol represents the pg of IL-6 protein per mg lung extract from an uninfected or MHV68-infected mouse (**** p < 0.0001).
Pathogens 13 00747 g007
Figure 8. Ly6G/IL-6 double-positive cells in the lungs of MHV68-infected tumor-bearing mice. Formalin-fixed paraffin-embedded lung tissue sections from MHV68-infected K-RasLA1 mice were co-stained with antibodies against IL-6 (green) and Ly6G (red) by immunofluorescence. The nuclei were visualized (blue) by staining with 4′,6-diamidino-2-phenylindole (DAPI). Detection of Ly6G/IL-6 double-positive cells at 600× magnification (Merge, arrows, lower right panel). The white bar to the right of the white square area of interest in the left Merge panel is equal to 10 microns. The densely packed cells on the right side of each panel are primarily lung tumor cells.
Pathogens 13 00747 g008
Figure 9. Detection of Ly6G+ cells in MHV68-infected tumor-bearing mice. Flow cytometry was used to analyze Ly6G+ cells from uninfected and MHV68-infected K-RasLA1 mice 7days post-infection. Microbead-selected Ly6G+ cells were stained with CD45.2, CD11b, Ly6G, and Ly6C antibodies. (a) Representative flow cytometry data of Ly6G+/Ly6C+ cells from uninfected K-RasLA1mice. (b) Representative flow cytometry data from Ly6G + cells from MHV68-infected K-RasLA1 mice. (c) The graph represents the mean percentage of Ly6GDim/Ly6Chi cells relative to the input for the respective samples. Statistical comparison by unpaired t-test (GraphPad Prism). (d) The graph shows the fold change of selected marker mRNAs (Table S2) at day 7 after MHV68 infection relative to uninfected control K-RasLA1 mice. mRNAs representative of M-MDSCs, but not PMN-MDSCs, increased relative to epithelial cell marker mRNAs after MHV68 infection of K-RasLA1 mice (** p = 0.0047).
Pathogens 13 00747 g009
Figure 10. Differential expression of m6A-modified immune cell selective mRNAs in MHV68-infected tumor-bearing mice. (a) Post-infection m6A modification selectively enhances mRNA levels in MDSCs from infected K-RasLA1mice. The graph shows the fold change in K-RasLA1 mice at day 7 post-infection relative to the uninfected controls of m6A-modified marker mRNAs for MDSCs (black) and epithelial cells (AT1 and AT2 cells, red). (**** p < 0.0001 uninfected versus MHV68). (b) The graph shows the fold change for each m6A-modified mRNA versus m6A fold enrichment in the pull-down assay for marker mRNAs for MDSCs (black circles) and epithelial (AT1 and AT2) cells (red circles).
Pathogens 13 00747 g010
Table 1. Primers used for qPCR.
PrimerForward SequenceReverse Sequence
ORF655′GTCAGGGCCCAGTCCGTA3′5′TGGCCCTCTACCTTCTGTTGA3′
IL-17A5′CAGACTACCTCAACCGTTCCAC3′5′TCCAGCTTTCCCTCCGCATTGA3′
IL-65′TACCACTTCACAAGTCGGAGGC3′5′CTGCAAGTGCATCATCGTTGTT3′
CXCL15′CTGGGATTCACCTCAAGAACATC3′5′CAGGGTCAAGGCAAGCCTC3′
CSF35′ATGGCTCAACTTTCTGCCCAG3′5′CTGACAGTGACCAGGGGAAC3′
CD845′ATATAGCTGGAGTCCCTTTGGAG3′5′AAAGAGCACGGCCAATCCTC3′
JAML5′ATGCTTTGCCTCCTGAAACTG3′5′TGATTCACCCACATGCACTCT3′
ß-actin5′GATGTATGAAAGCTTTGGTC3′5′TGTGCACTTTTATTGGTCTC3′
Table 2. Antibodies used for immunofluorescence and flow cytometry.
AntibodyDetectionSource and Catalog Number
Purified Rat Anti-Mouse Ly6G (1A8)Ly6GBD Pharmingen cat#: 551459/clone1A8
Rabbit IL-6 AntibodyIL-6Novus Biologicals cat#: NB600-1131
Goat Anti-Rat IgG H&L (Alexa Fluor 647)Secondary anti-ratAbcam cat#: ab150159
Goat Anti-Rabbit IgG H&L (Alexa Fluor 488)Secondary anti-rabbitAbcam cat#: ab150077
Rat APC-eFluor780 CD11bCD11bInvitrogen cat#: 47-0112-80/clone M1/70
Rat APC Anti-Mouse Ly6CLy6CBioLegend cat#: 128015/clone HK1.4
Mouse V500 Mouse Anti-Mouse CD45.2CD45.2BD Horizon cat#: 562130/clone 104
PE Rat Anti-Mouse Ly6G (1A8)Ly6GBD Pharmingen/cat#: 561104/clone 1A8
Disclaimer/Publisher’s Note: The statements, opinions and data contained in all publications are solely those of the individual author(s) and contributor(s) and not of MDPI and/or the editor(s). MDPI and/or the editor(s) disclaim responsibility for any injury to people or property resulting from any ideas, methods, instructions or products referred to in the content.

