Abstract
This study was designed to explore the control effect of pulsed arc discharge plasma actuation on the incident shock wave/boundary layer interaction (ISWBLI). Research was conducted on an ISWBLI flow field with 10 kHz single-channel pulsed arc discharge plasma actuation and pulsed arc discharge plasma actuation array applied at Mach 2.0 experimentally and numerically. In the investigation, high-speed schlieren flow field visualization technology was adopted, focusing on the change in shock wave intensity caused by plasma actuation. Combined with the detached eddy simulation (DES) method, the numerical simulation focused on the regulating effect of plasma actuation on the separation zone. The key research results showed that, in terms of the spatial flow field, the simulation results were consistent with the experimental results. The single-channel actuation could only just achieve the control effect on the ISWBLI, while array actuation effectively weakened the shock wave intensity. Furthermore, the ISWBLI separation zone in the base flow field was crescent shaped. Its length at the middle of the flat plate was longer than that at the two sides. It was identified that, after applying single-channel actuation, the start of separation slightly moved forward. Similarly, after the application of array actuation, the start point of separation at the middle section in a spanwise direction moved forward by about 19 mm. The length of the separation zone increased by 30 mm but reduced at the two sides. Its influence, spanwise, was also significantly diminished.
1. Introduction
The supersonic inlet is an important part of an aircraft’s air intake system. When an aircraft is flying at supersonic speed, the inlet acts to slow down the airflow and provide subsonic airflow for the engine, ensuring the airflow is even and stable [1]. This process is of great importance as the quality of airflow directly affects the flight performance [2]. During the flight, the multiple compression configuration to slow down the airflow can significantly reduce the total pressure loss [3], but the ISWBLI triggered by compression is inevitable at the inlet lip. Moreover, the unsteadiness of the interaction region brings extra structural load to the aircraft [4,5], which threatens flight safety. In addition, with the adjustment of the flight attitude, the operating conditions of the inlet may change extremely. If that is the case, the ISWBLI can thicken the boundary layer and cause flow separation, resulting in total pressure loss and inlet unstart [6,7,8].
The ultimate approach to solve the ISWBLI issue is to address the separation of the boundary layer caused by the reverse pressure gradient. Therefore, flow control technologies based on boundary layer control are commonly used in the inlet [9]. In recent years, significant achievements have been made in solving the ISWBLI issue, regardless of their passive or active forms [10,11,12]. Various types of vortex generator (VG) were studied at different incoming Mach numbers, configurations, and layouts, revealing groundbreaking outcomes [13,14,15]. Huang et al. [15] discovered that a VG can achieve better results in suppressing flow separation. Similarly, other studies [16,17,18,19] concluded that a micro-vortex generator (MVG), with a size of only a fraction of the thickness of the boundary layer, can achieve similar control effects to a VG. They found that an MVG can also reduce the drag of the aircraft during high-speed flights [20]. Furthermore, modern scholars focused on the control of the ISWBLI with MVGs through experiments and numerical simulation. Yan et al. [16] compared the ISWBLI with and without MVG control at Mach 2.5. In their studies, the MVG reduced the separation zone and improved the shape factor. Their experimental results also showed that vortex rings play an important role in the reduction of the separation zone. Mohd et al. [17] found that the presence of micro-ramps reduces the upstream interaction length by delaying the pressure rise, hence, suppressing the SBLI’s effect. Their research proved that MVGs can also be efficiently applied in hypersonic ISWBLI control. However, with the continuous optimization of the aerodynamic shape of aircrafts, it is likely that the size of the inlet will be constantly reduced to reduce the drag and overall weight of the flight [21]. Besides, a flow control device with a convex shape could easily detach and damage the engine blades. For all of these reasons, higher requirements are imposed on flow control devices.
The plasma actuator is a kind of small-sized active flow control device without moving parts. It is easy to maintain and, therefore, meets the application needs in the inlet [22]. Plasma actuators have become a research hotspot in the field of flow control due to their advantageous features such as fast reactions [23,24], wide bandwidth, and tunable actuation intensity. The common forms of plasma actuator are dielectric barrier discharge (DBD), plasma synthetic jet (PSJ), and pulsed arc discharge (PAD). PSJs exhibit the unique ability to produce high-velocity (>300 m/s) pulsed jets at high frequency (>5 kHz); thus, they are widely used in high-speed flow control [25]. Venkat et al. [26] studied the control effect of a PSJ on the ISWBLI at Mach 3.0 and found that a PSJ can shift the dominant frequencies of the separated flow. Venkateswaran et al. [27] found that the position of the pulsed plasma jet can influence the control effect on the ISWBLI, suggesting that a more satisfactory effect is achieved when the actuator is located upstream of the separation zone rather than inside the separation zone. Kursat et al. [28] numerically tested the performance of a sweeping jet actuator on flow separation control. The simulation results suggested that the performance of the sweeping jet actuator, in terms of decreasing the size of the separation bubble, increases with the mass flow rate. Through numerical simulation, Kiyoshi et al. [29] studied two forms of DBD plasma actuators. They found that the electrode, in parallel with the incoming direction, increases the thermal effect of the plasma and exacerbates flow separation, but the form of the canted electrode generates a vortex and mitigates flow separation. Through experiments and simulations, Yan et al. [30] found that the thermal effect of arc plasma actuation can reduce the Mach number upstream of the shock wave. The shock wave intensity is also weakened. Upon the study of the streamwise array of pulsed spark discharge at different frequencies, Tang et al. [31] found that increased actuation frequency helps weaken shock intensity. Although studies on SWBLI control based on plasma actuators are widely available, many scholarly conclusions have focused on the configuration of the compression ramp. There is a research gap when it comes to the control of the ISWBLI based on plasma.
This paper focuses on the control effect of plasma actuation on shock intensity and the separation region. First, the control effect of the pulsed arc discharge plasma actuation on ISWBLI is verified by wind tunnel experiments. The difference in the control effect on the ISWBLI with single-channel and array pulsed arc discharge plasma actuation is studied by numerical simulation. Additionally, the spanwise control effect of plasma actuation on the separation region is also analyzed. The results will provide a reference for effective ISWBLI control in supersonic inlets.
2. Experimental Setup
2.1. Wind Tunnel and Experimental Model
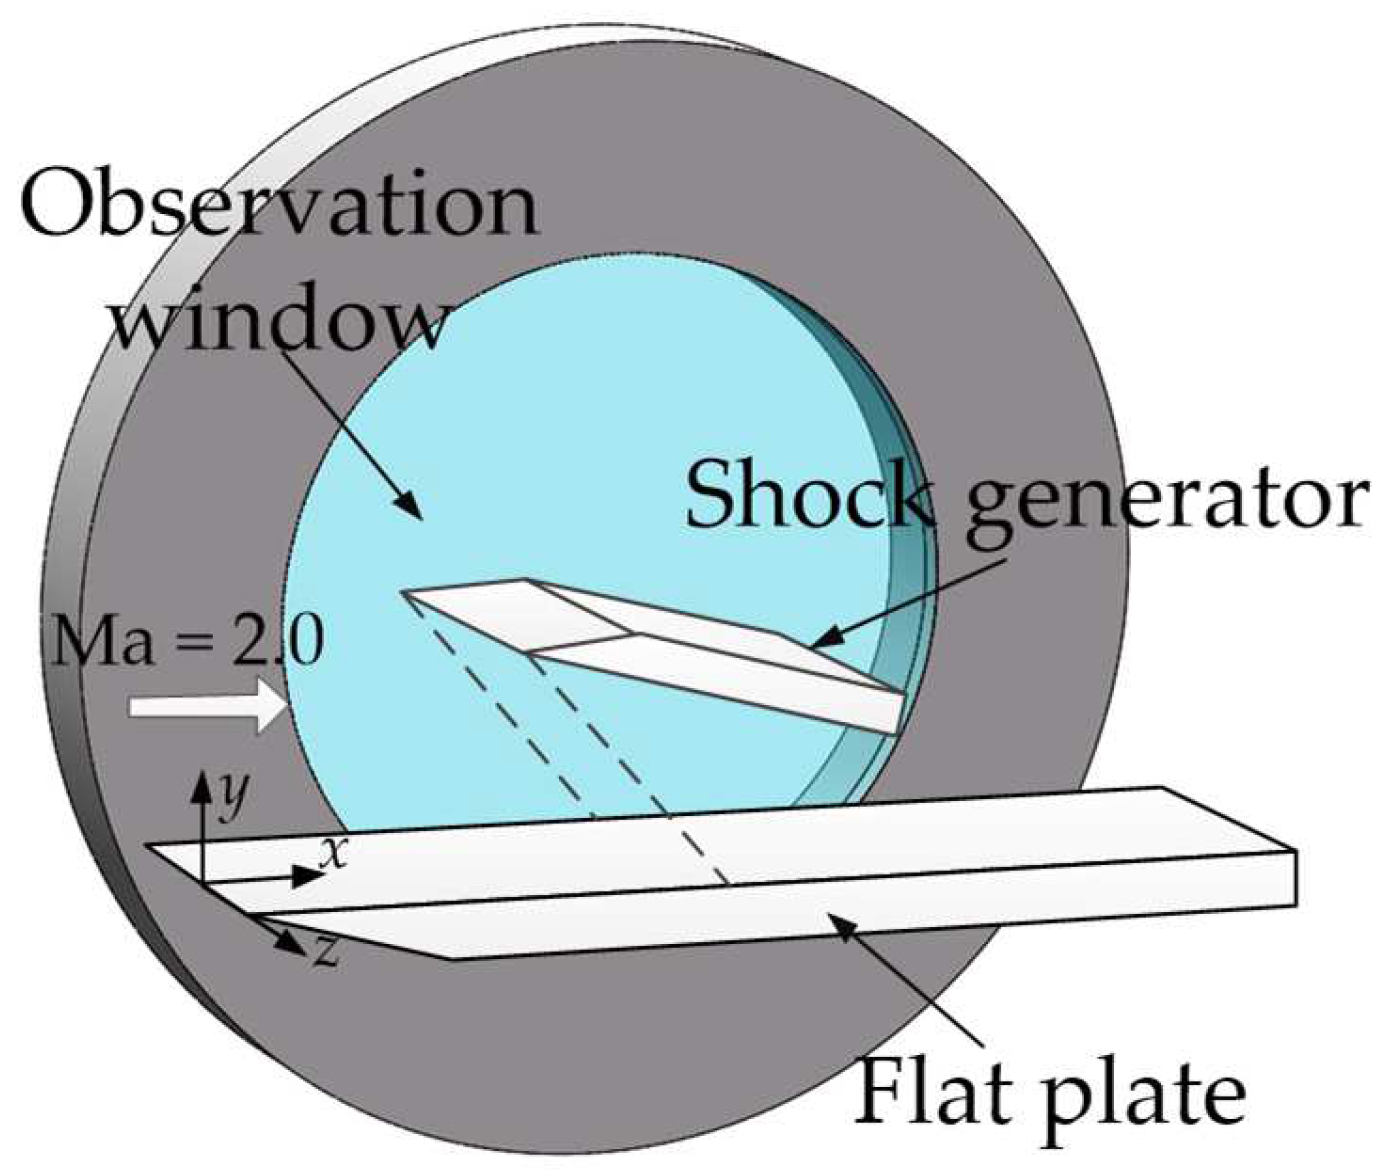
The experiment was carried out in the supersonic wind tunnel in the Science and Technology on Plasma Dynamics Laboratory, China. The wind tunnel is a blowdown with a total temperature of 300 K, total pressure of 95.6 kPa, and unit Reynolds number of 1.19 × 10⁷/m. It can provide Mach 2.0 supersonic flow for 2~3 s. The experimental section of the wind tunnel is equipped with a fixed bracket for model installation, allowing the position and angle of the model to be adjusted. There are two optical observation windows with a diameter of 250 mm on the side of the tunnel, providing light channels for observing the flow field. The installation of the experimental model in the wind tunnel is shown in Figure 1. The model consisted of a bottom flat plate and a top shock wave generator. The shock generator had a wedge angle of 15° at the front edge and was installed on the fixed bracket. It protruded downward through a strut and hung at the nozzle of the wind tunnel. Its lower surface formed an angle of 12.9° with the horizontal plane. The flat plate was made of acrylic plastic, and the upper surface was horizontal and remained at a spacing of 109.8 mm from the shock wave generator.

Figure 1.
Schematic diagram of installation of experimental model in the wind tunnel.
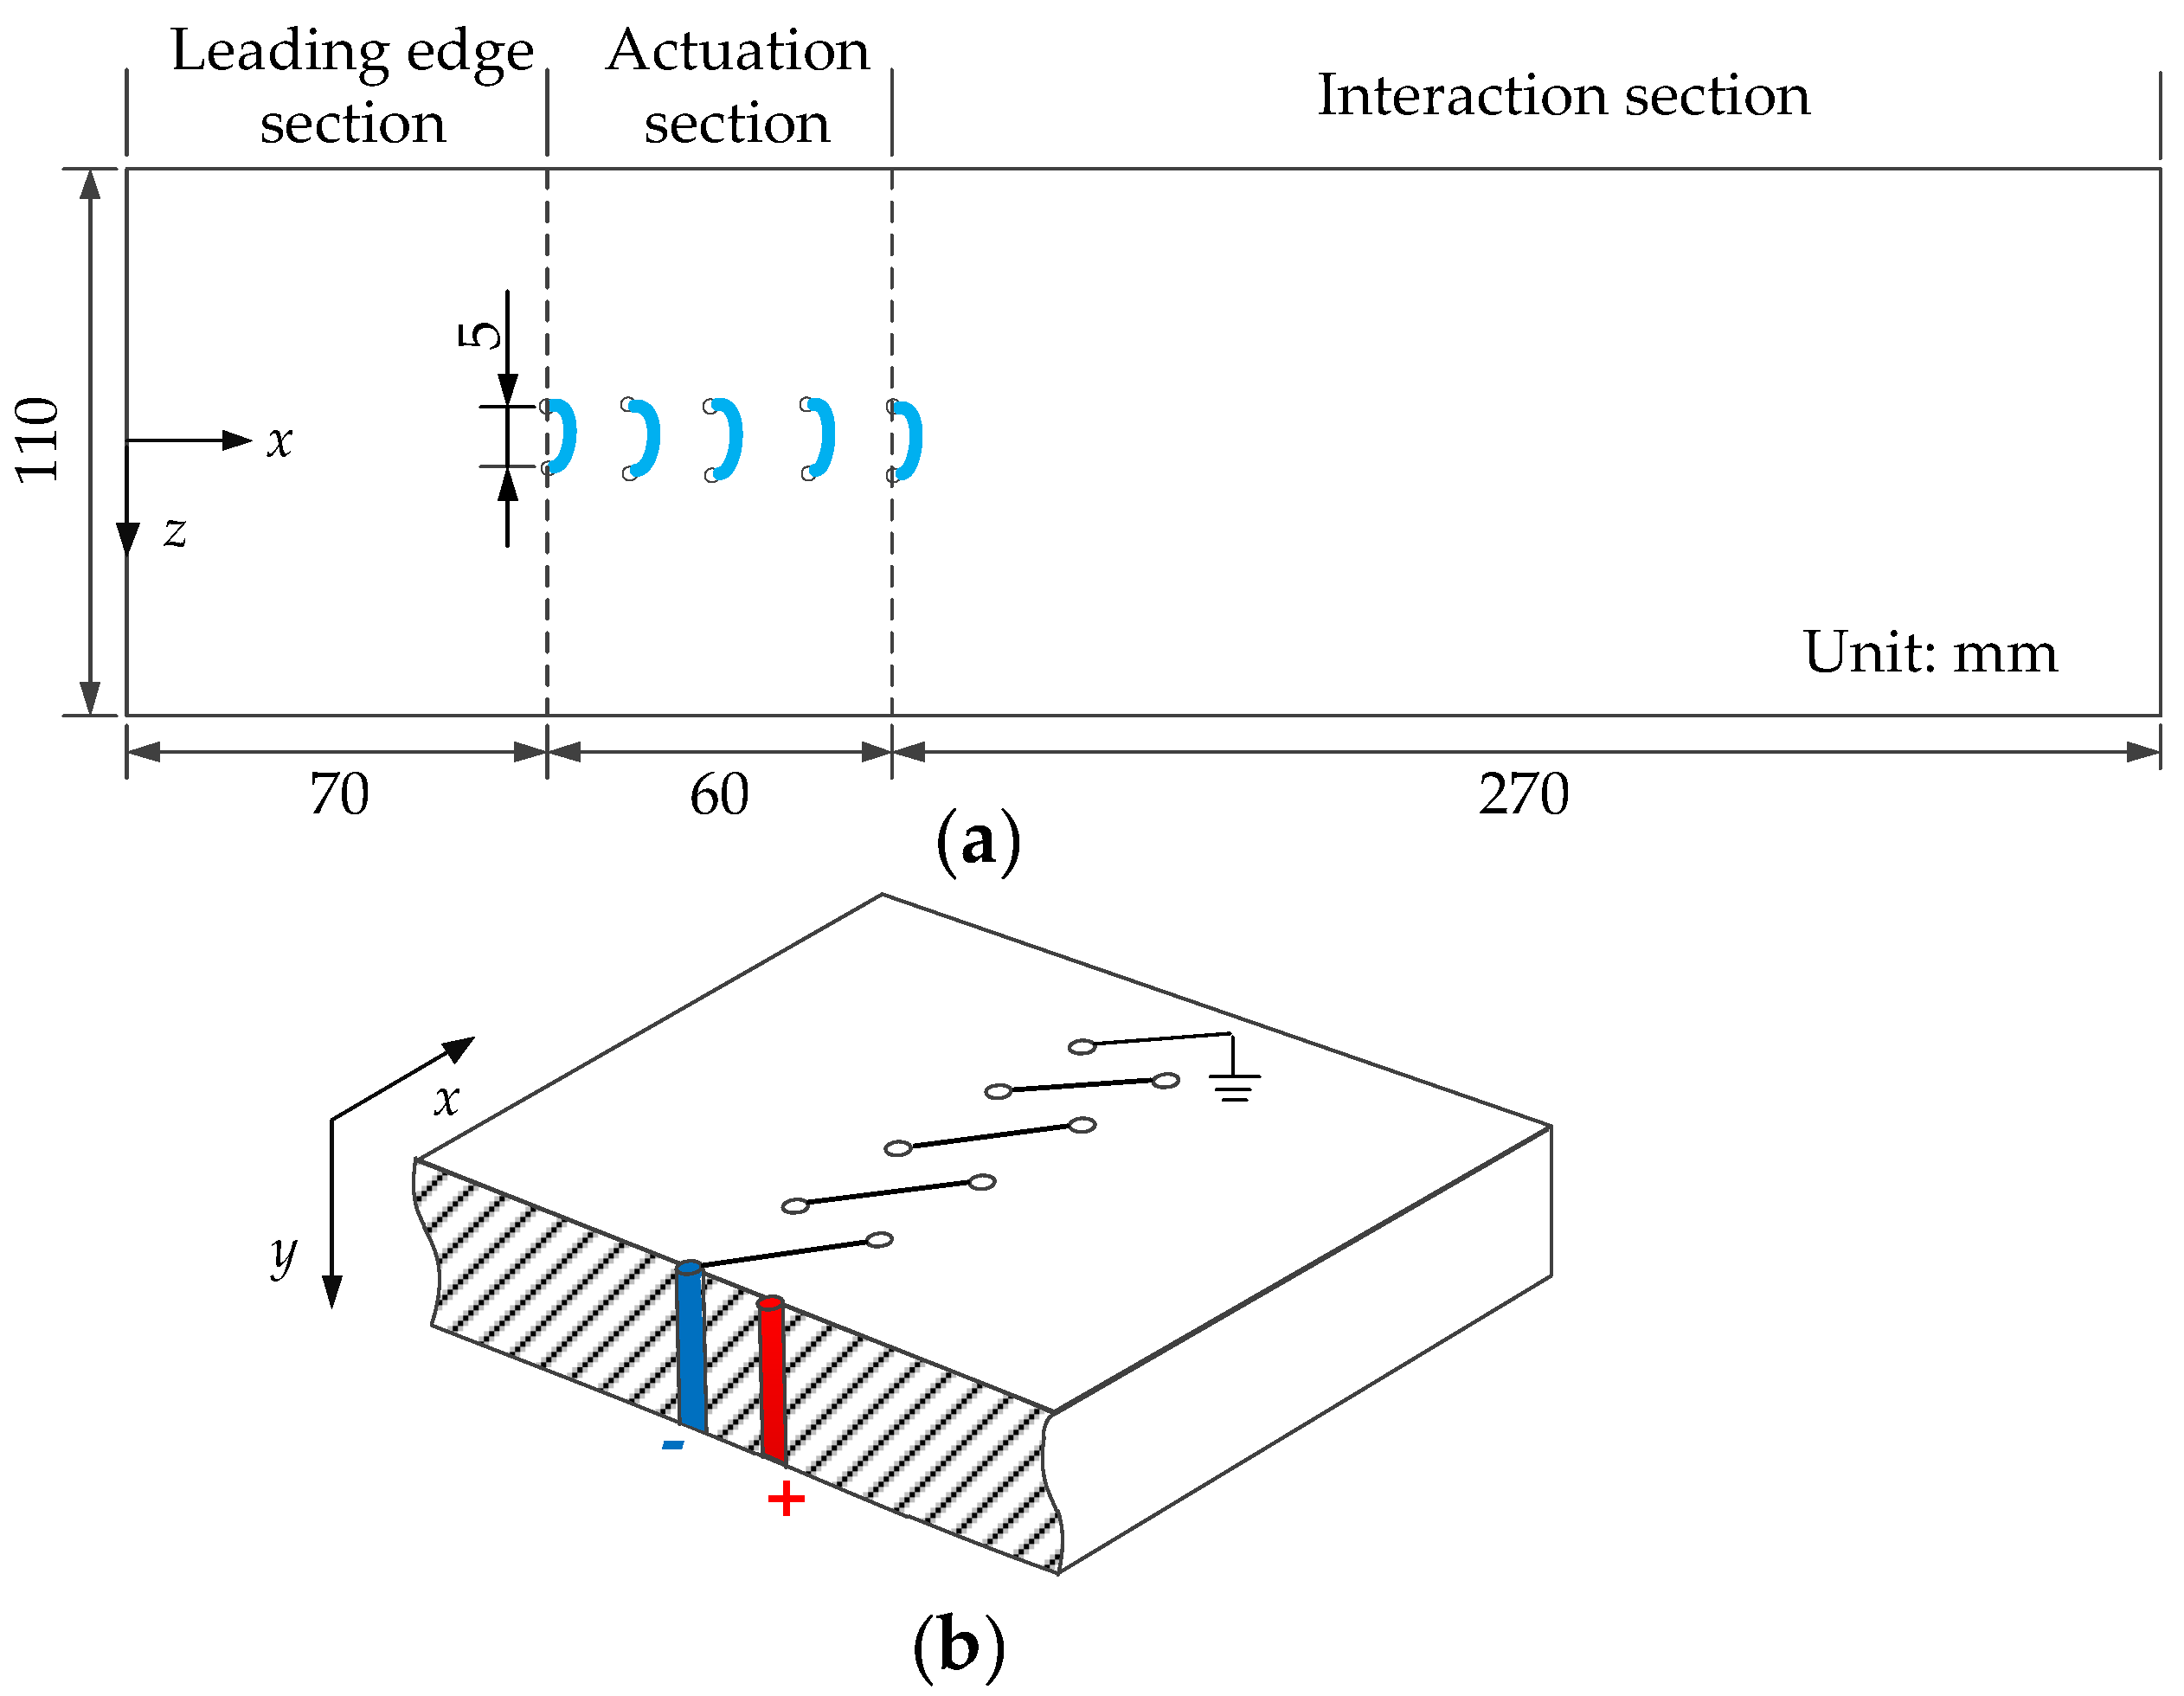
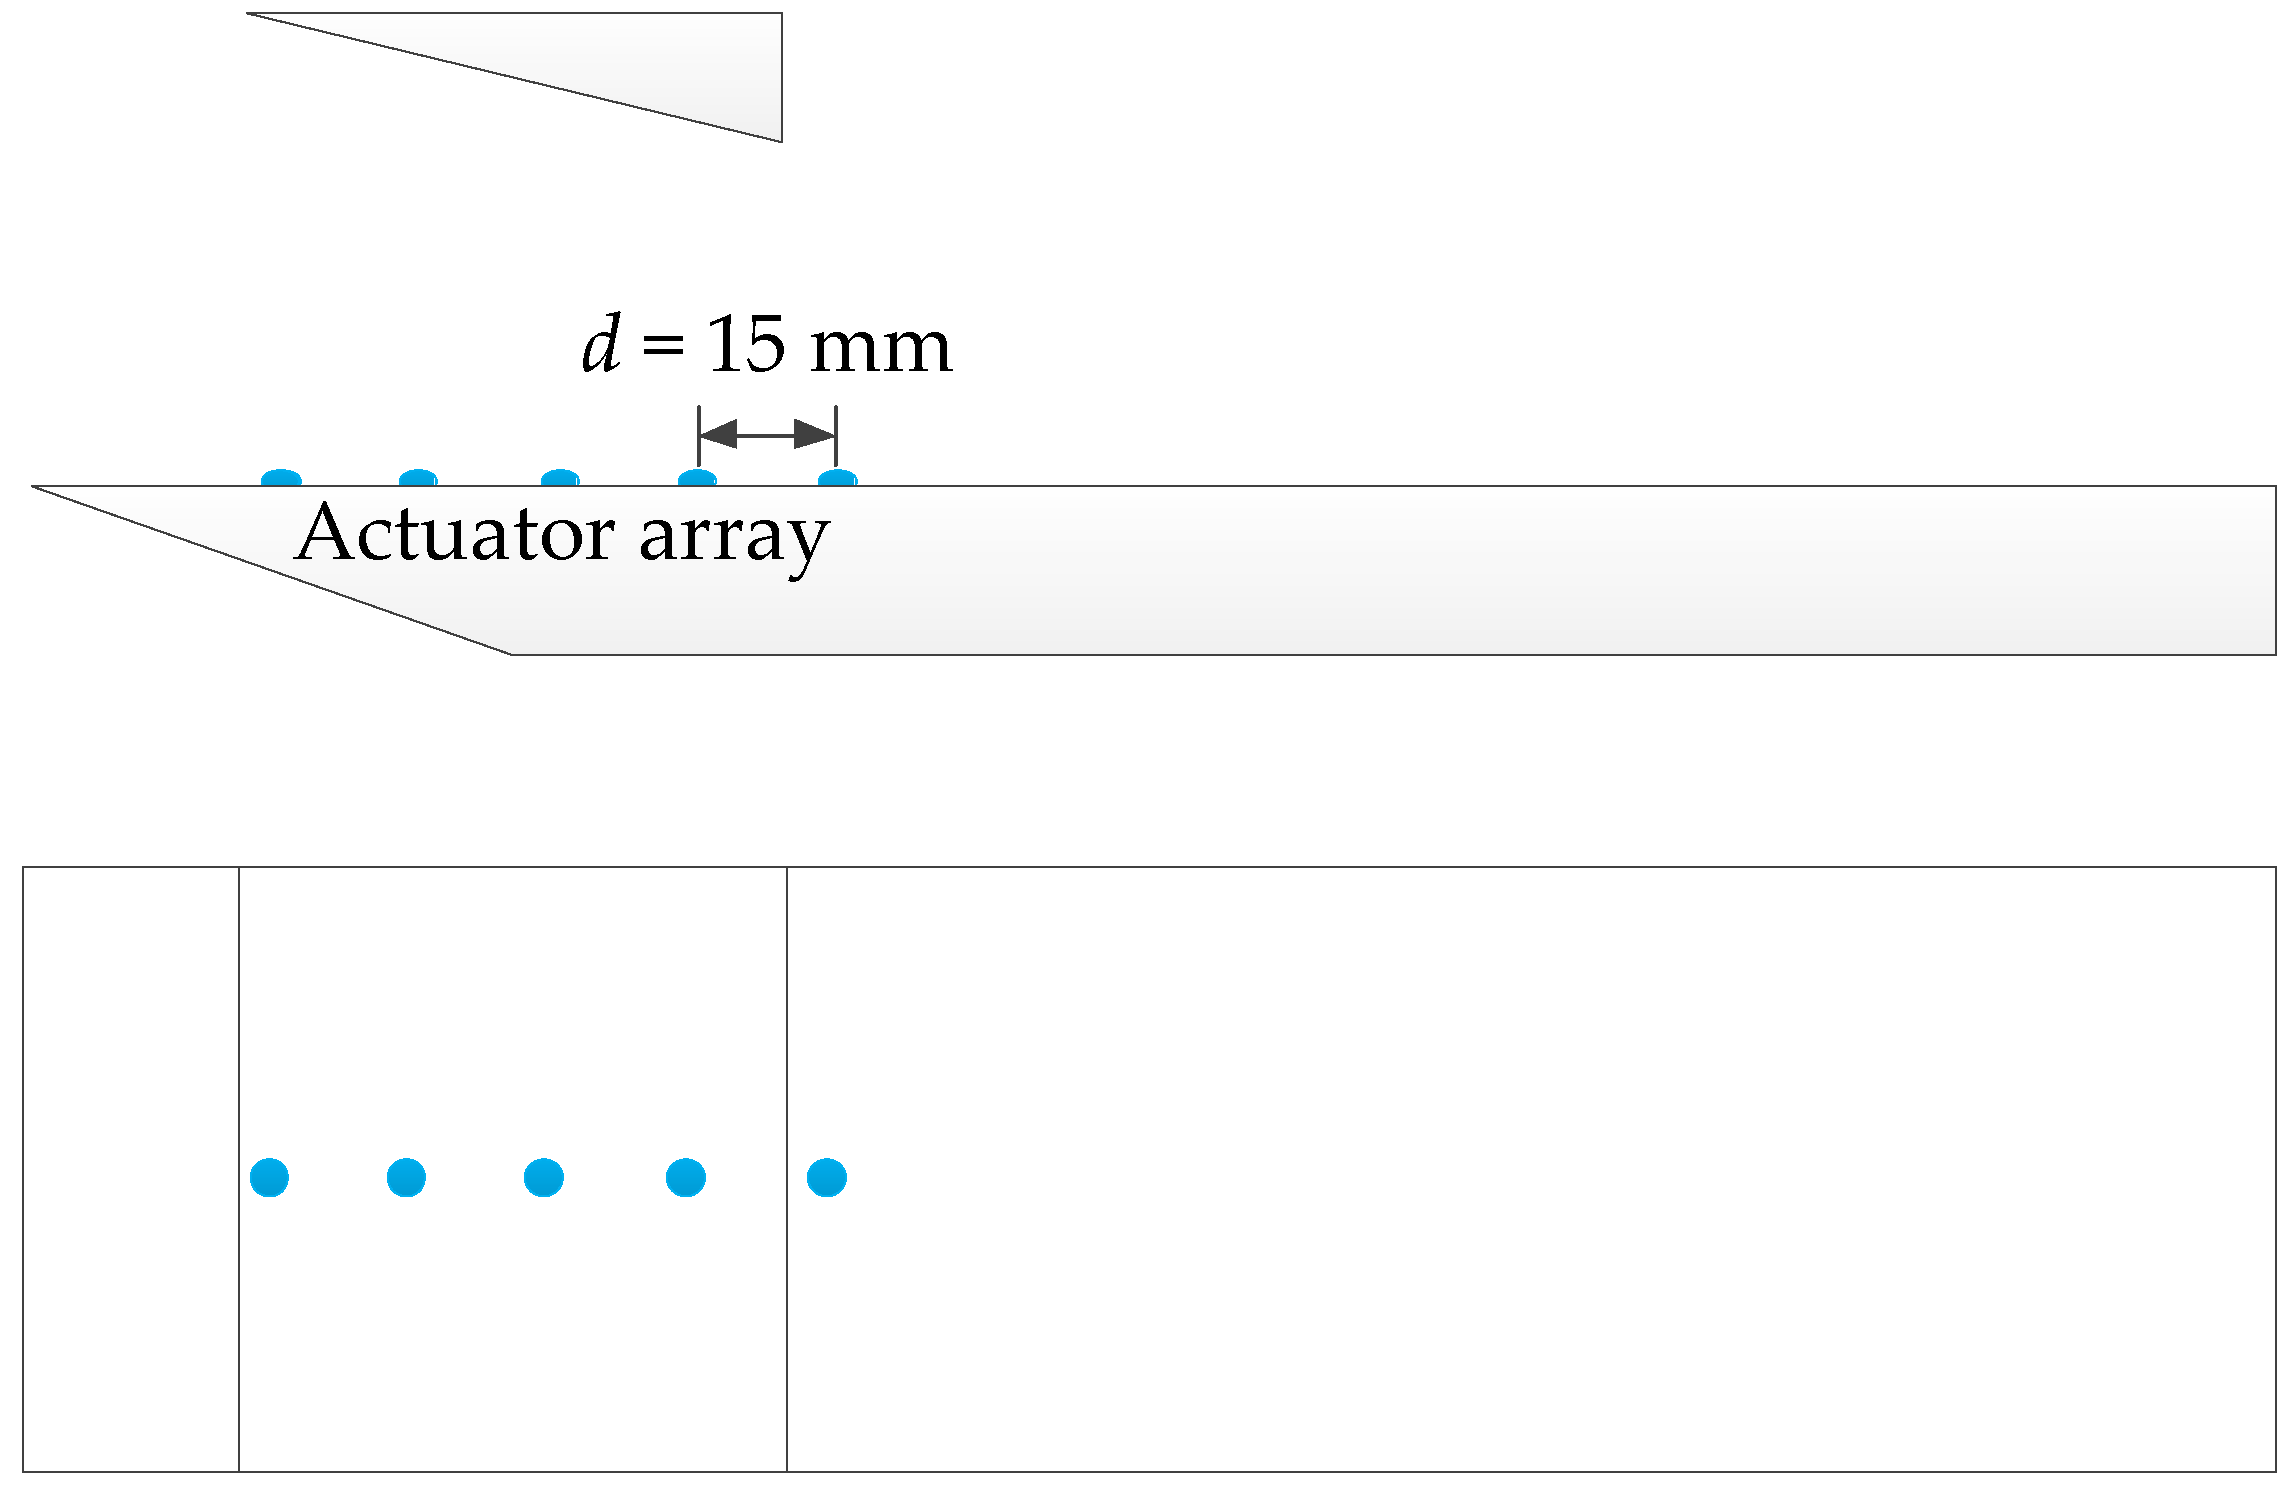
As shown in Figure 2a, the plate model was 400 mm in length and 110 mm in width. The model was divided into three sections according to its functions, i.e., leading-edge section, actuation section, and interaction section. The first section was the zone from the leading edge of the plate to the most upstream plasma actuator. It was 70 mm in length and mainly used for adjusting the development of the boundary layer to control the downstream boundary layer state. The second section was 270 mm in length and was located in the downstream zone from the plasma actuator. The ISWBLI occurred in this zone by adjusting the angle of the shock generator. The coupling of plasma actuation with the interaction flow field also occurred in this area. The actuation section was the zone between the aforementioned two sections, and the pulsed arc discharge plasma actuator was equipped at this section. With reference to the relatively mature control mechanism developed previously through compression corner SWBLI control using pulsed arc discharge plasma, two kinds of actuator were set in the actuation section, i.e., a single-channel pulsed arc discharge plasma actuator and a pulsed arc discharge plasma actuator array. The single-channel actuator was placed 70 mm away from the leading edge of the plate, and the distance between the positive and negative electrodes was 5 mm. Five single-channel actuators formed an actuator array, and each kept a spacing of 15 mm in the flow direction. The connection of the pulsed arc discharge plasma actuator array is illustrated in Figure 2b. The positive electrode of the first actuator was connected to the output end of the plasma power supply while the negative electrode was connected to the positive electrode of the next actuator. The five actuators were connected in series to form a pulsed arc discharge plasma actuator array.
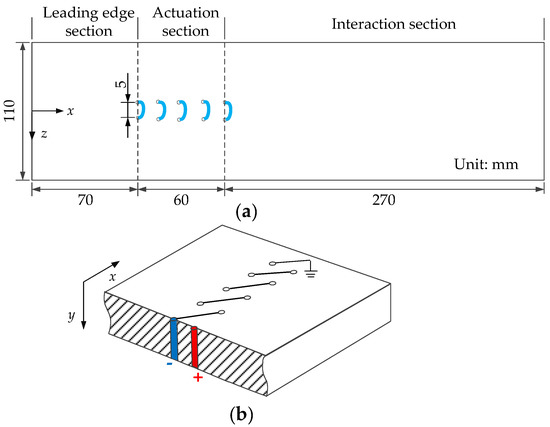
Figure 2.
Schematic diagram of experimental model. (a) plate model (b) The connection of the pulsed arc discharge plasma actuator array.
2.2. Plasma Actuation System and High-Speed Schlieren System
As shown in Figure 3, the triggering of the pulsed arc discharge plasma actuation and the collection of electrical parameters were dependent on the plasma actuation system. Additionally, the high-speed schlieren system was used for the capture of the ISWBLI flow field. As mentioned above, the positive electrode of the array actuator was connected to the output end of the plasma power supply. The plasma power supply selected for this paper was a nanosecond pulse power supply that could provide a pulsed, high voltage ranging from 1 Hz to 100 kHz. The parameters of voltage and current were transmitted to the oscilloscope through the probes and then collected by the oscilloscope. The high-speed schlieren system was a typical, Z-type, optical path schlieren. Reflected by two concave mirrors, the beam was partially blocked at the knife edge and then received by a CCD camera. This process allowed the flow field information carried by the beam to be properly captured. The nanosecond pulse power supply was set with the output voltage as 20 kV, frequency as 10 kHz, and pulse width as 1 μs. The rising and falling edges were both 50 ns. The time interval between two consecutive arc plasma actuations was 100 μs. Additionally, the frame rate of the CCD camera was 25,000 fps; hence, the frame interval was 40 μs.
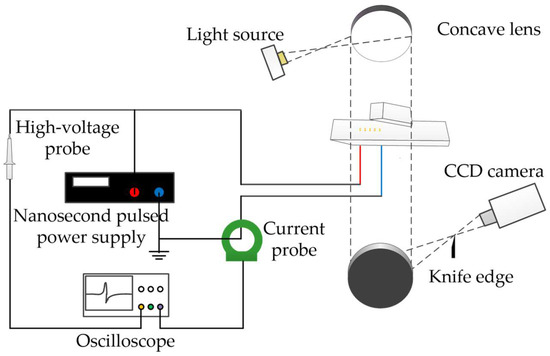
Figure 3.
Schematic diagram of plasma actuation system and high-speed schlieren system.
3. Experimental Results and Discussion
As the schlieren image reflected the spanwise integral effect of the spatial flow field, the control effect of the single-channel pulsed arc discharge plasma actuation on the ISWBLI flow field could not be effectively refined in the schlieren image; it will not be listed herein. More flow field information is analyzed and discussed in the numerical simulation section. The experimental results of controlling the ISWBLI with array pulsed arc discharge plasma array actuation are shown in Figure 4. Figure 4a represents the instantaneous schlieren image of the base flow field. As illustrated, a strong incident shock wave was generated at the leading edge of the shock generator, and the incoming flow boundary layer was relatively stable. The interaction between the incident shock wave and the boundary layer induced a typical ISWBLI flow field structure; affected by the reverse pressure gradient after the shock wave, the boundary layer near the interaction point was thickened and lifted up, resulting in local flow field compression and a separation shock induced at the leading edge of this region. Then, the boundary layer was reattached to form local flow field compression at the wall surface, after which another shock wave appeared, namely, reattached shock.
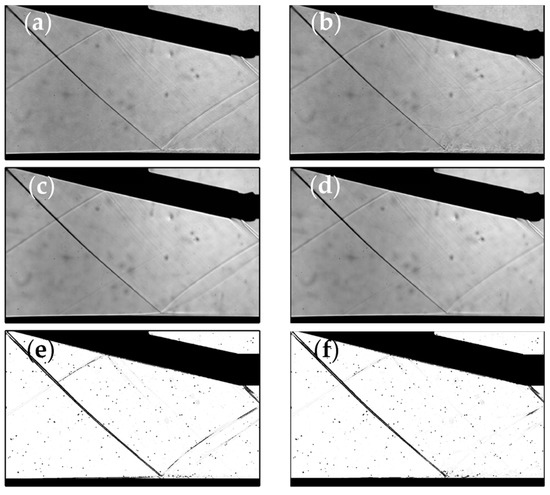
Figure 4.
Experimental schlieren results: (a,c,e) the base flow field; (b,d,f) the actuation flow field.
Figure 4b is the instantaneous schlieren image with 10 kHz array actuation. As shown in the figure, the high-frequency actuation induced a series of precursor blast waves in the flow field, and the entire region of the shock wave was covered with the precursor blast waves. Being constantly impacted by the continuous precursor blast waves, the structure of the separation shock wave and the reattached shock wave were furcated. Compared with the base flow field, the reattached shock wave almost disappeared, and the shock wave intensity was considerably weakened. On the other hand, the actuation created a thermal gas bulb. When passing through the interaction region, the thermal gas bulb was coupled with the shock wave and the boundary layer to make the structure divergent, showing that the thermal gas bulb plays a positive role in promoting flow mixing and increasing the kinetic energy of the boundary layer. Although the zone covered by the precursor blast waves included the foot of the incident shock wave, no significant change was observed in this part of the incident shock wave.
The structure of an ISWBLI flow field can be better displayed through time-averaged results; hence, 1000 schlieren images of the base flow field and the actuation flow field were averaged, respectively, as shown in Figure 4c,d. In the time-averaged results, after the actuation was applied, the reattached shock wave almost completely disappeared, and the gray value of the separation shock also decreased. Furthermore, the intensity of the two shock waves was weakened, and the size of the interaction region decreased, indicating that the thermal gas bulb successfully inhibited flow separation. As represented in Figure 4e,f, a flow field with or without actuation can be compared more intuitively according to the threshold value of the spatial gradient of schlieren intensity. In the base flow field, the separation shock wave and the reattached shock wave were shown as two discontinuous strips. The strips disappeared after actuation, indicating that the shock wave intensity was weakened.
4. Numerical Results and Discussion
In the previous section, the role of single-channel actuation and array actuation for ISWBLI was experimentally studied, and the results show that the high frequency pulsed arc plasma actuation array can effectively weaken the intensity of the separation shock wave. In this section, the action of pulsed arc plasma actuation in controlling the ISWBLI is further analyzed through numerical simulation. The analysis focuses on the influence of actuation on the separation zone in the spanwise direction. The ultimate goal is to obtain a comprehensive understanding of pulsed arc plasma actuation in controlling the ISWBLI.
4.1. Calculation Method
4.1.1. Physical Model
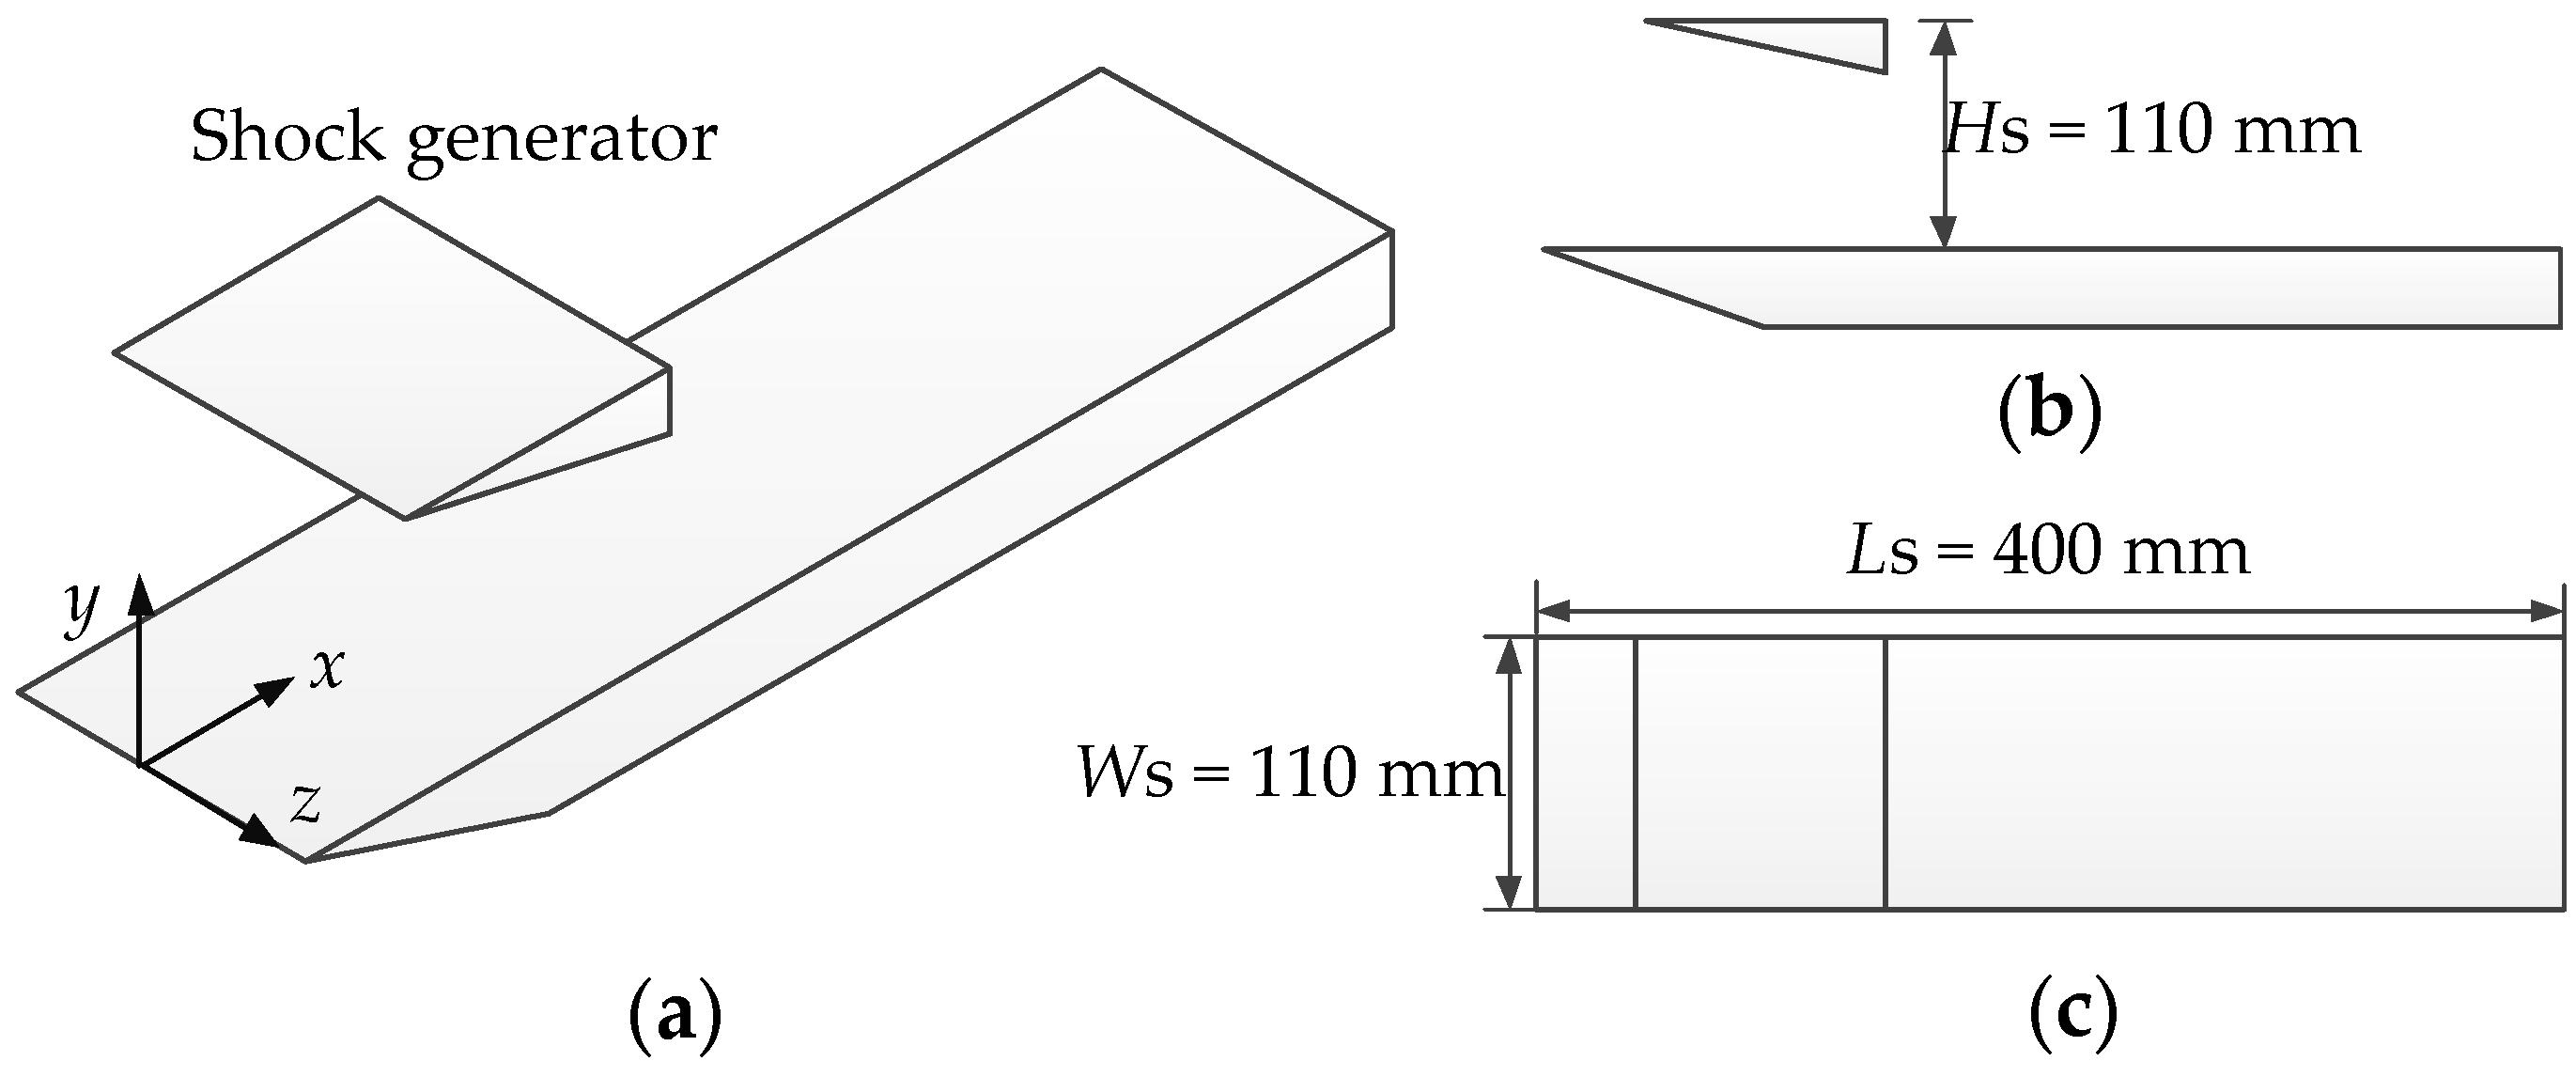
The ISWBLI model studied in this section consisted of a shock wave generator and a flat plate, as shown in Figure 5. The length of the plate model was Ls = 400 mm. The shock generator was located above the plate, and its height from the surface of the plate was Hs = 110 mm. The width of the shock wave generator was Ws = 110 mm, corresponding with that of the plate. The angle was also consistent with the shock wave generator model studied in the experiment. It is worth specifying that the origin of the coordinates was located at the center of the plate’s leading edge. Furthermore, the positive direction of the x-axis was the incoming flow direction; the positive direction of the y-axis was the normal direction of the wall surface; and the z-axis was the spanwise direction of the plate.
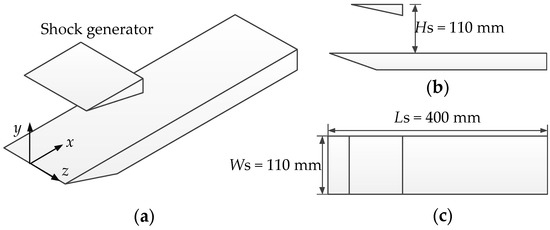
Figure 5.
Computational model of ISWBLI: (a) 3D view; (b) front view; (c) top view.
4.1.2. Computational Grid and DES
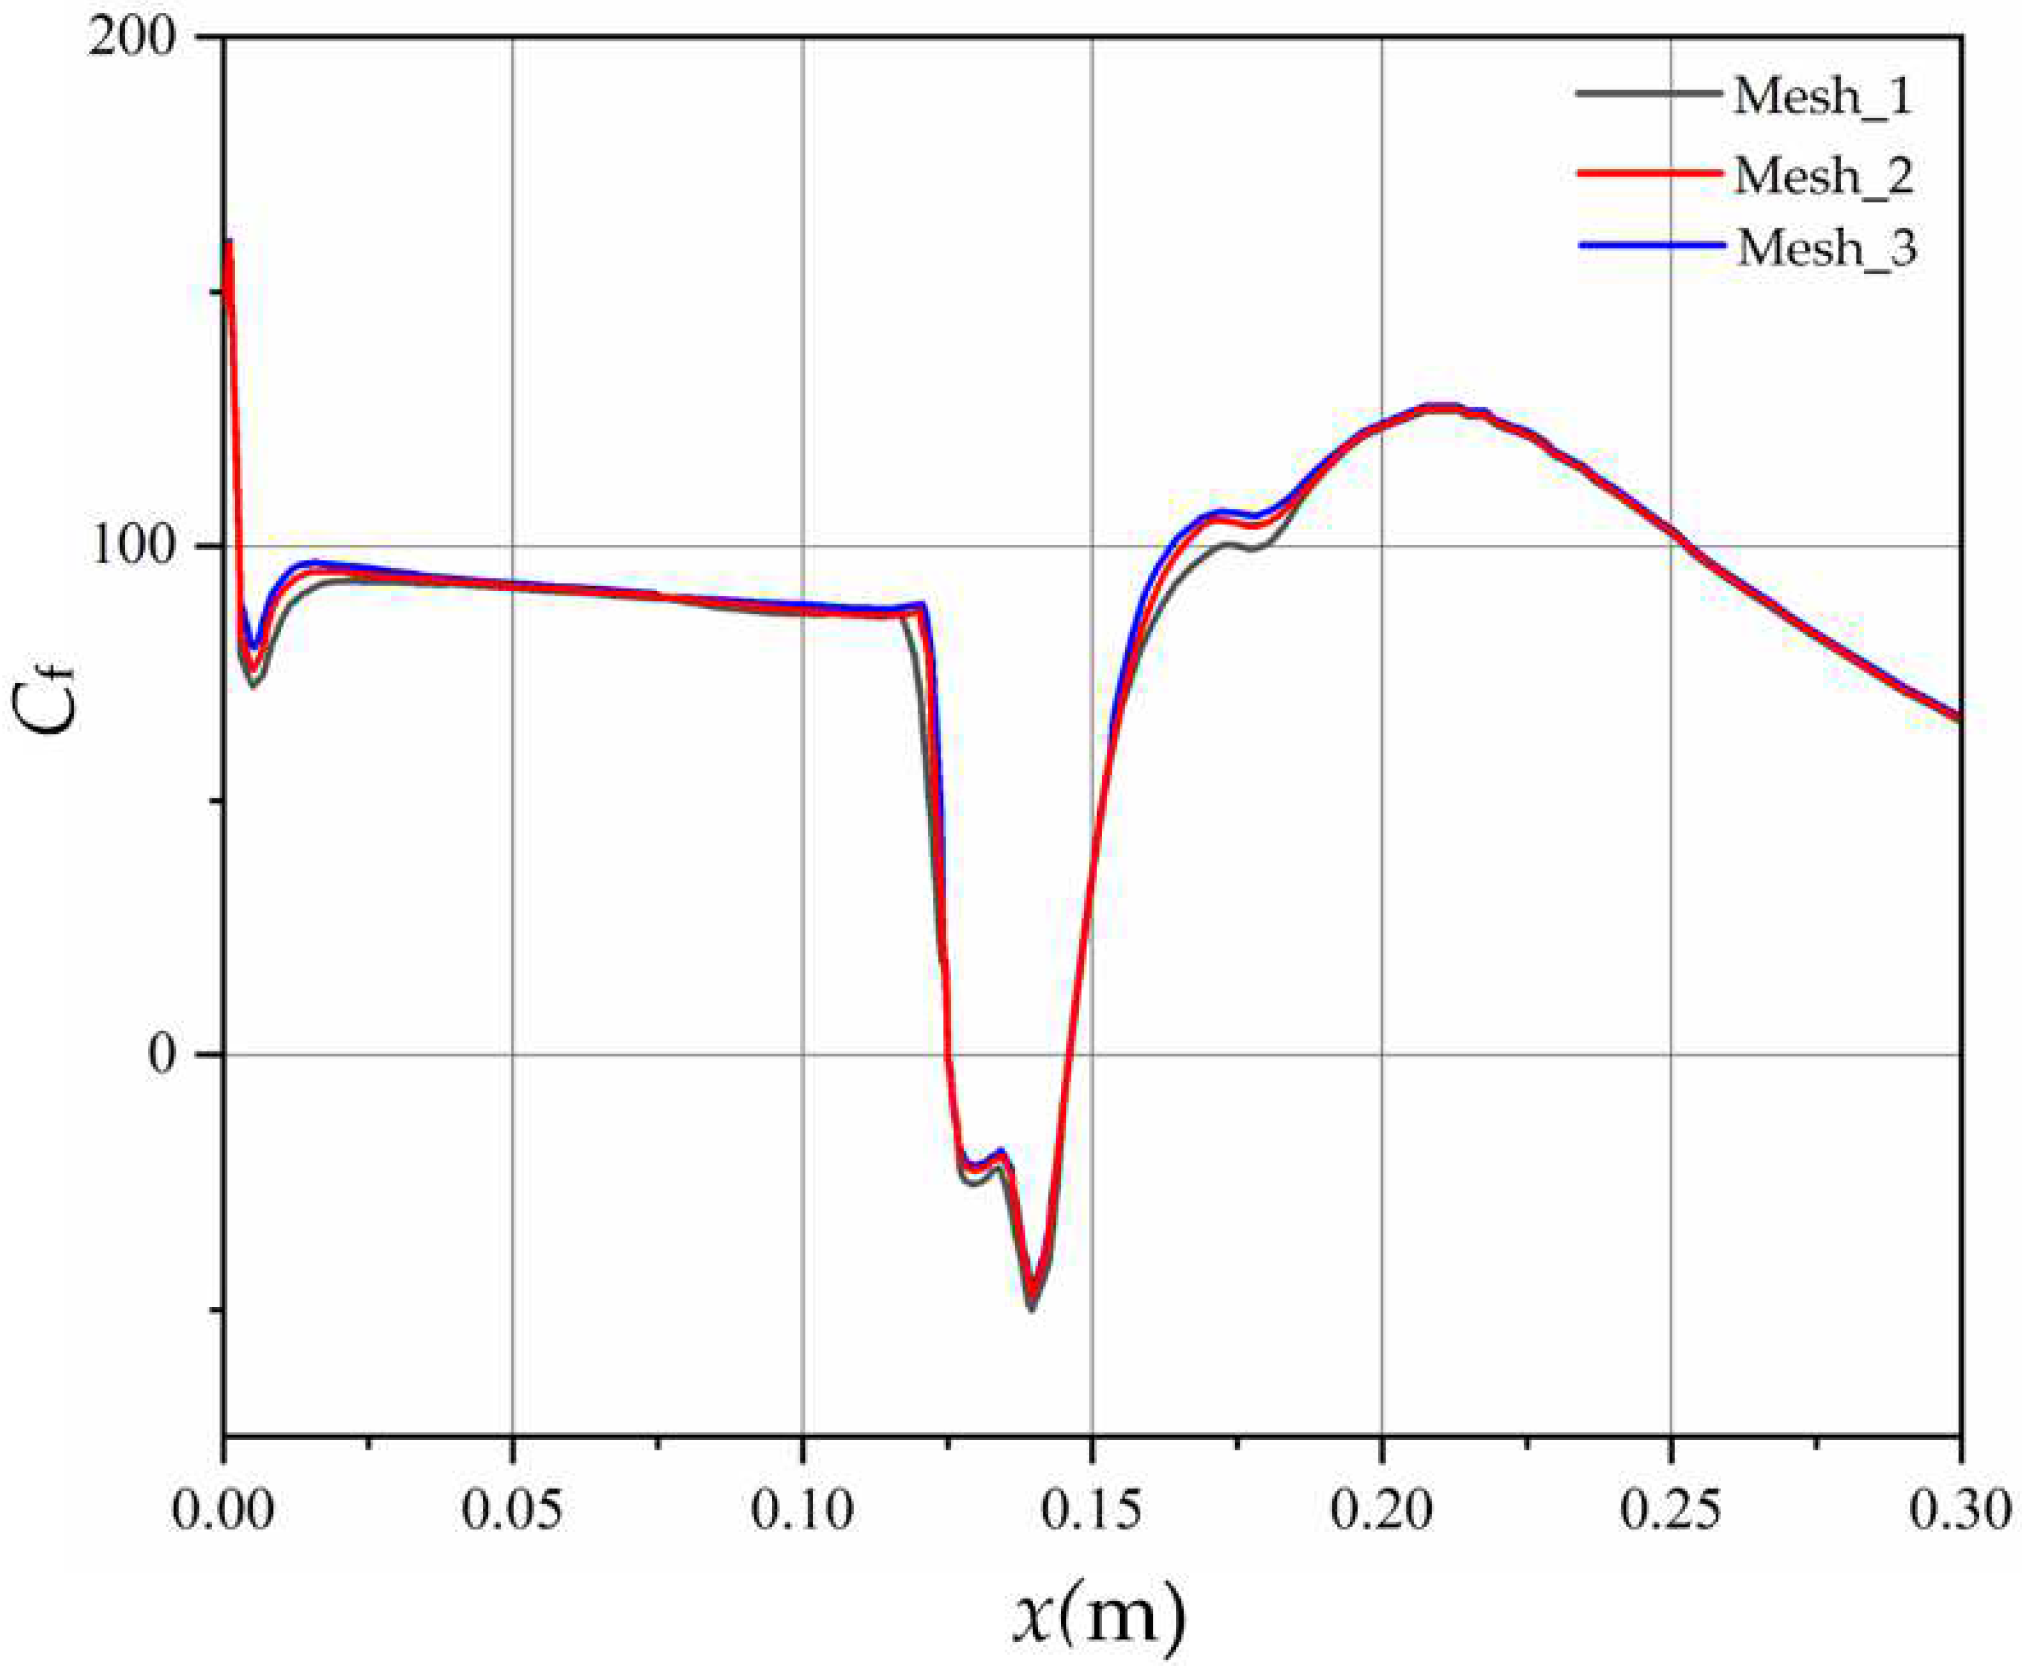
ICEM was used to divide the computational grid into structured grids. At the same time, dense grids were located in the ISWBLI region, separation shock wave region, and plasma actuation region to obtain a more refined flow field structure. Three sets of grids were obtained. The number of the basic grids (Mesh_1) was 4.21 million. On this basis, two sets of denser meshes (Mesh_2, Mesh_3) were obtained, and the number of grids was 6.27 million and 7.63 million, respectively. Comparing the skin friction coefficients calculated by three sets of grids, as shown in Figure 3, Mesh_2 and Mesh_3 were in good agreement; hence, Mesh_2 (6.27 million) was chosen for further simulations, as shown in Figure 6. The height of the first layer of the skin was set to 0.007 mm to ensure y+ < 1.
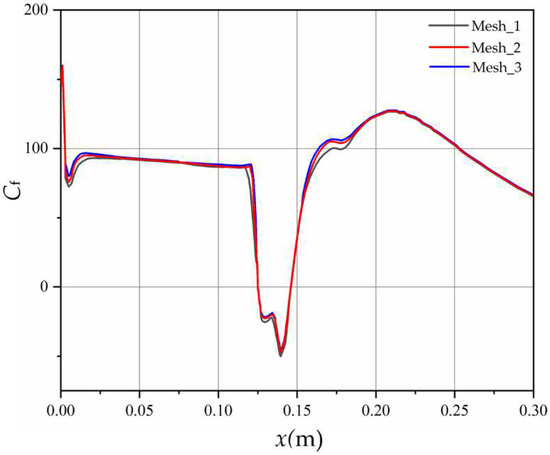
Figure 6.
Verification of mesh independence.
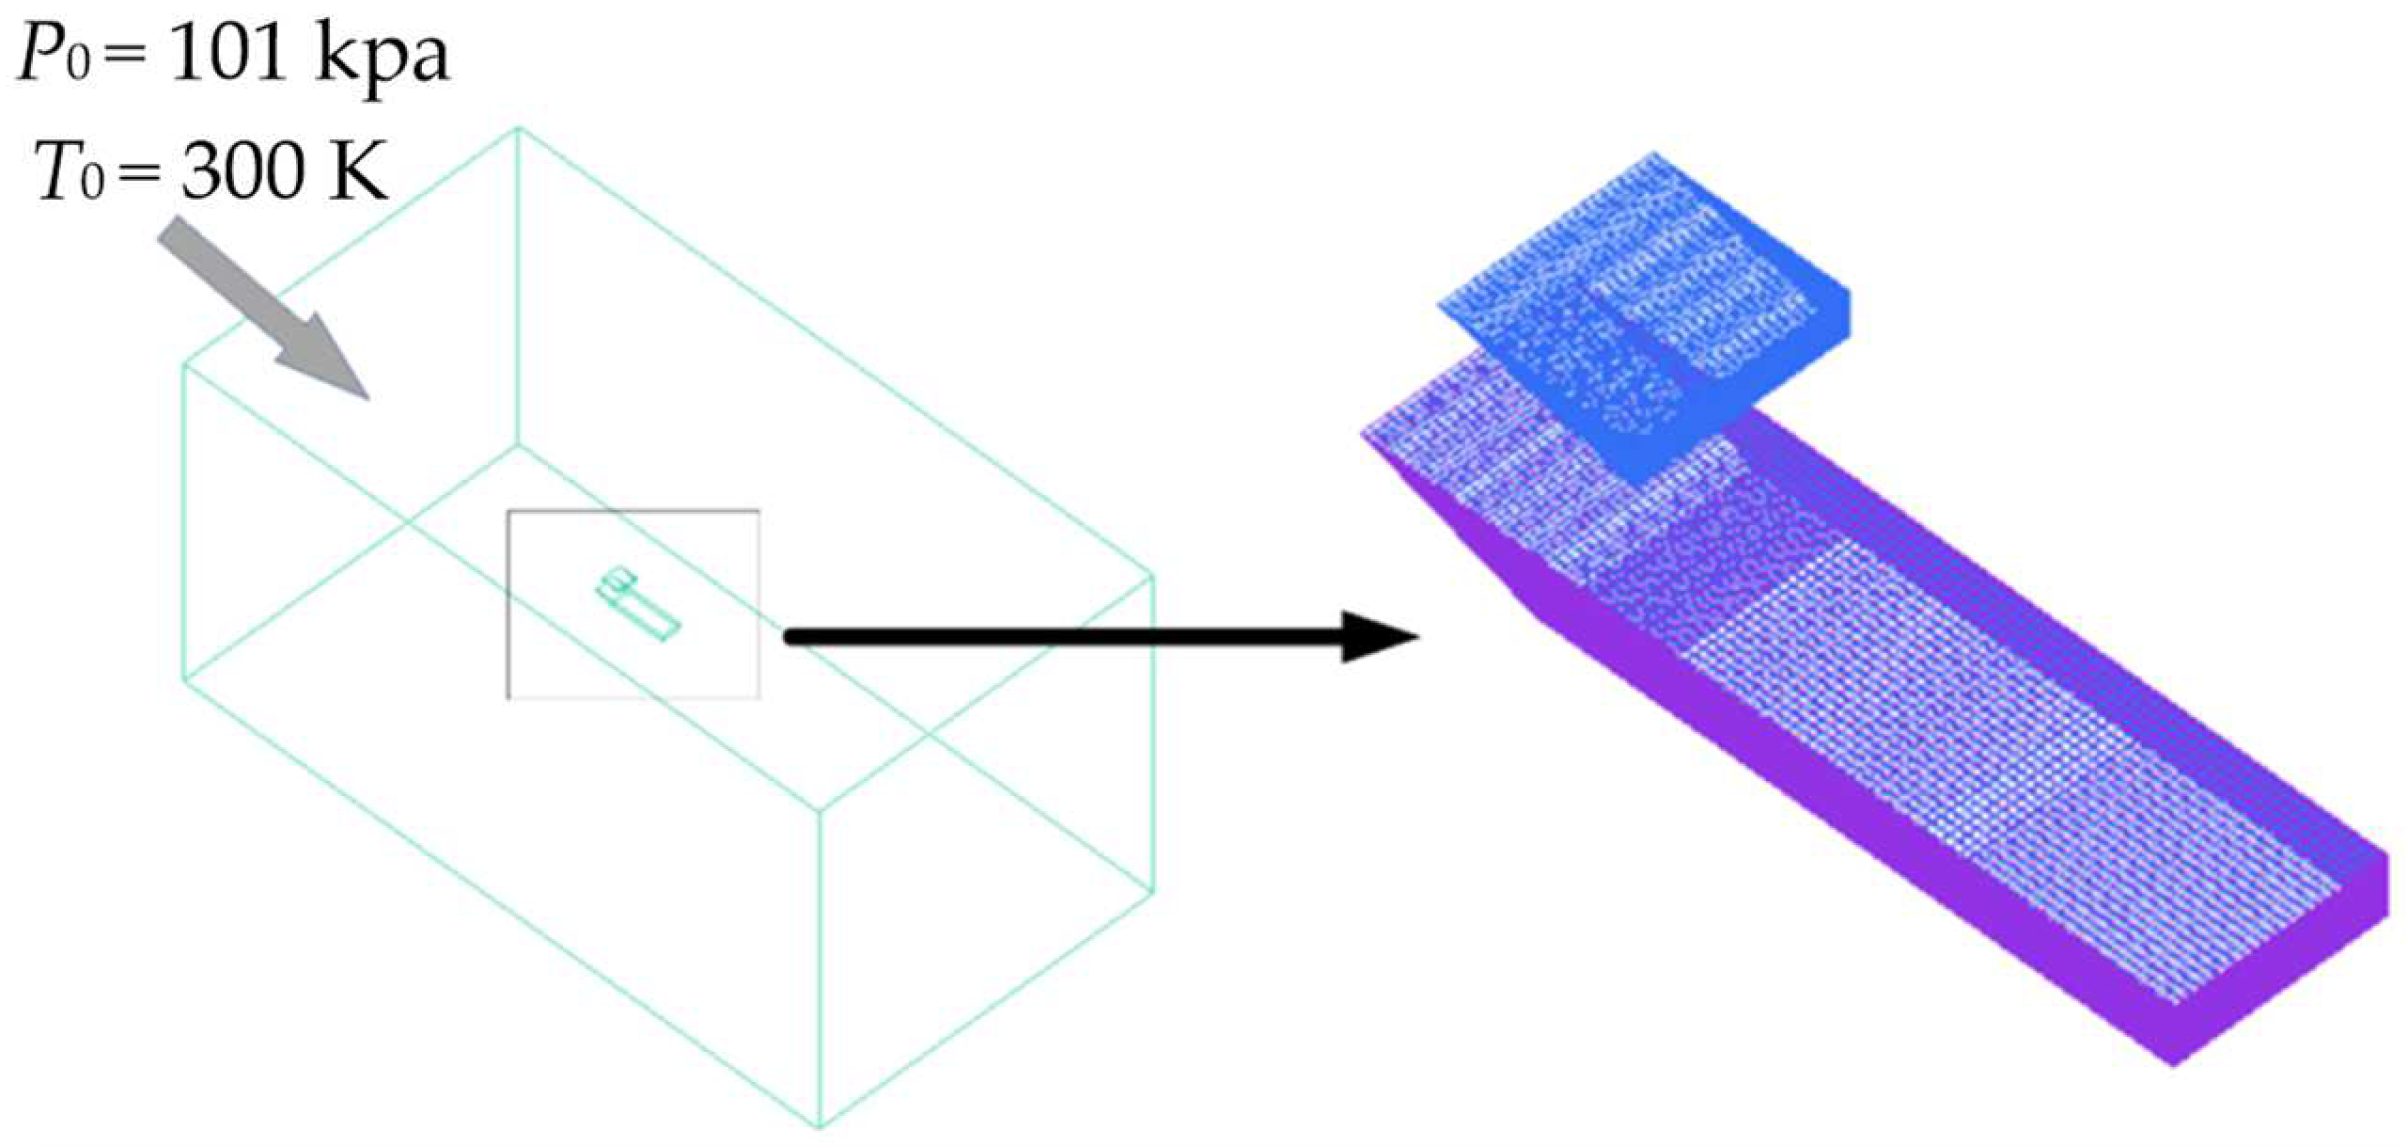
The spanwise width of the flow field entrance was 5.275 Ls; the normal height was 5 Ls; and the distance from the leading edge of the plate was 3.75 Ls. The far-field boundary conditions of pressure were set based on the experimental conditions. As shown in Figure 7, the total pressure was 1.01 × 10⁵ Pa; the total temperature was 300 K; and the incoming Mach number was Ma = 2.0. Adiabatic non-slip skin boundary conditions were adopted for the plate and shock wave generator.
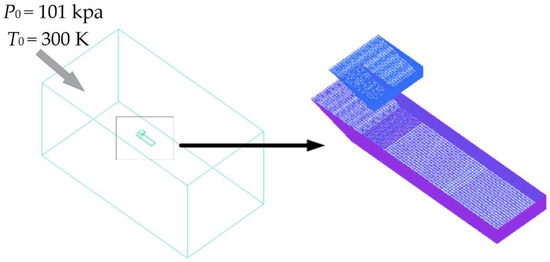
Figure 7.
Model grid and boundary conditions.
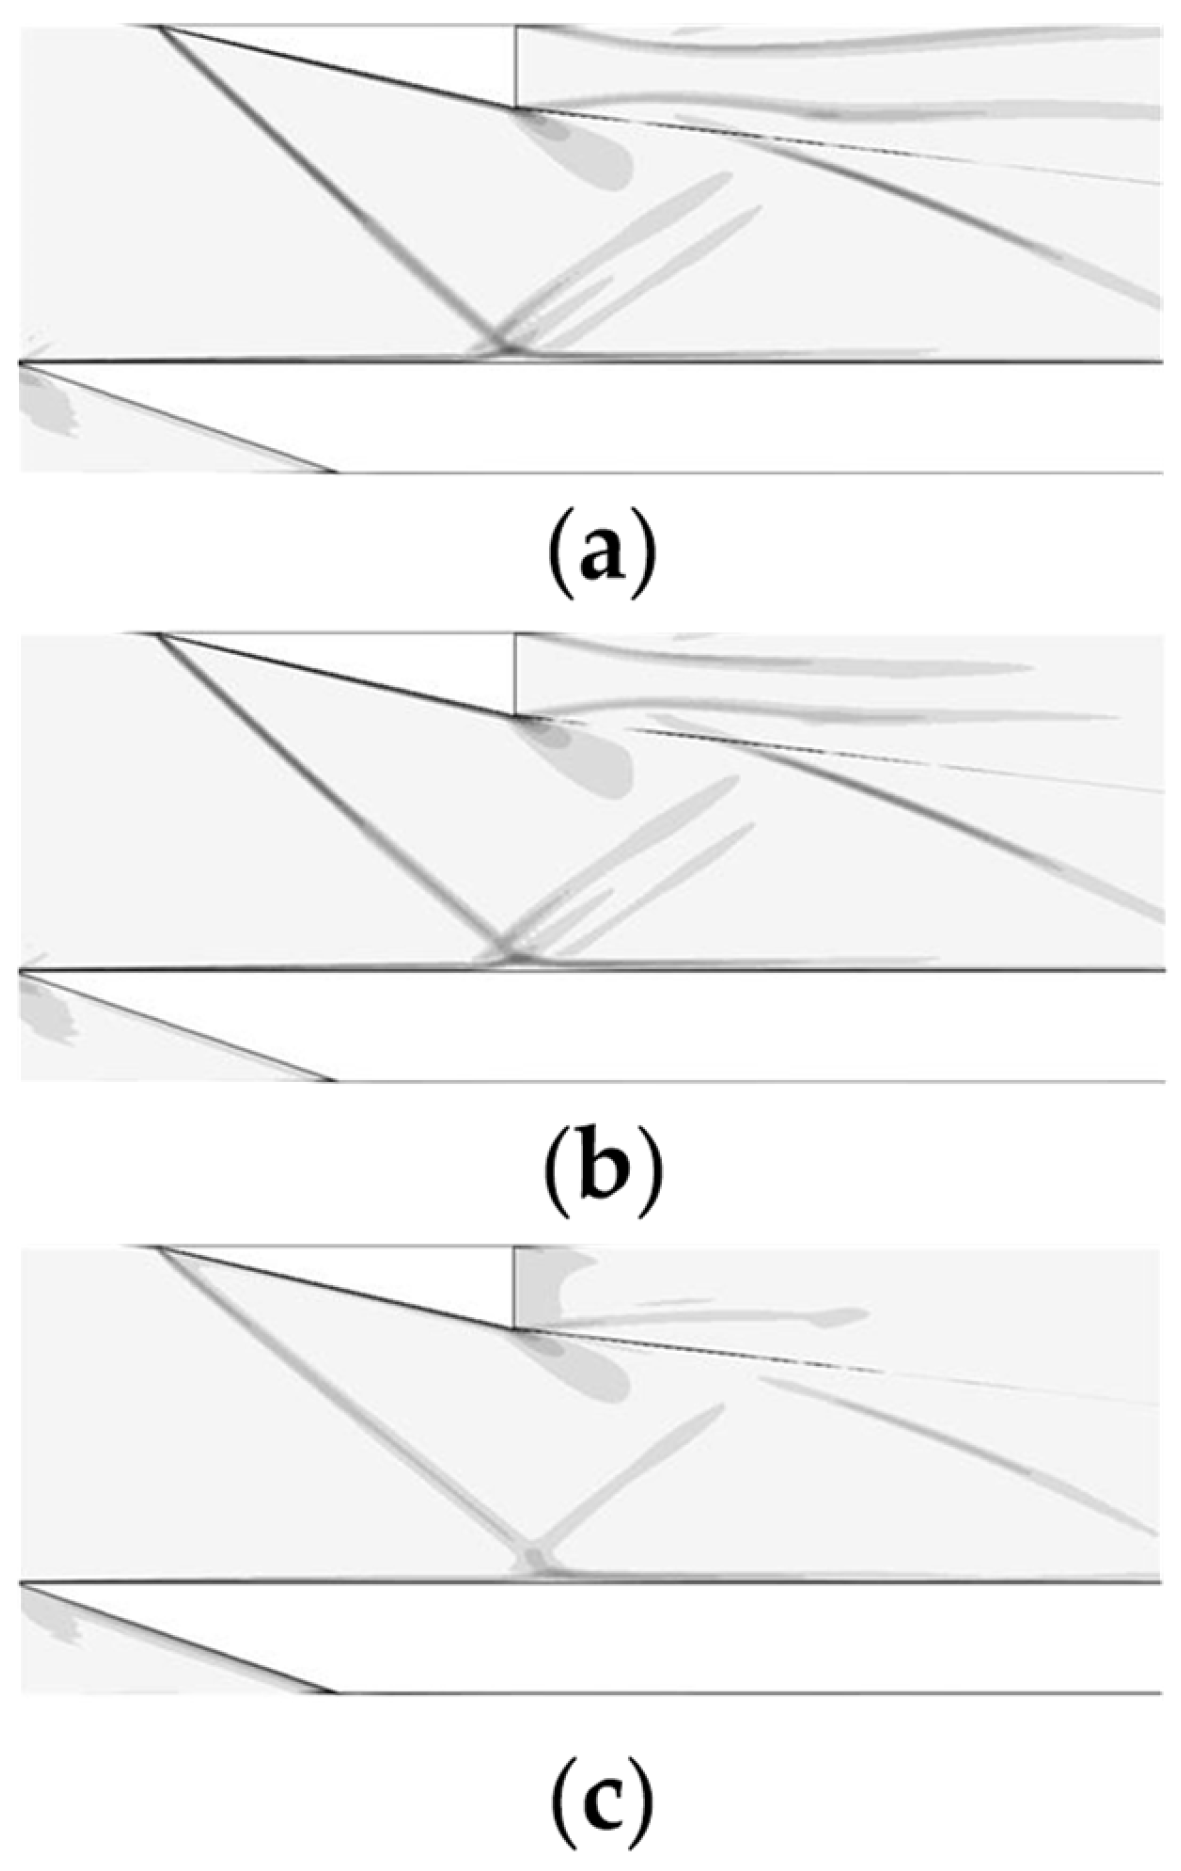
The DES method was used to calculate the three-dimensional ISWBLI flow field and the characteristics of the flow field under the control of plasma actuation. Figure 8 shows the comparison of the numerical schlieren and the experimental schlieren. Figure 8a shows the flow field structure of the experimental mean schlieren. As mentioned in the previous section, near the foot of the incident shock wave, the boundary layer thickened, and a separation shock wave appeared. As the boundary layer reattached to the wall, a weak reattachment shock wave appeared. It can be seen that the angle of the incident shock wave was about 41.2°, that of the separation shock wave was about 38.4°, and that of the reattachment shock wave was about 33.6°. Upstream of the interaction region, the boundary layer was very thin and was a stable laminar boundary layer. The thickness of the boundary layer increased after passing through the interaction region. Figure 8b shows the simulation results calculated with the DES method. The figure clarifies that the angle of the incident shock wave was about 40.8°. The difference between the simulation and the experiment was about 0.1% of the experimental results. The separation shock wave was slightly smaller, about 37°, which is 3.6% less than the experimental results, and the reattachment shock wave was about 34.7°, which is 3.3% higher than that in Figure 8a. Furthermore, the structure of the interaction region was well simulated in the numerical schlieren, and the boundary layer thickened, passing through the interaction region, which is consistent with the experimental results. Based on the analysis above, it can be concluded that the simulation result was credible.
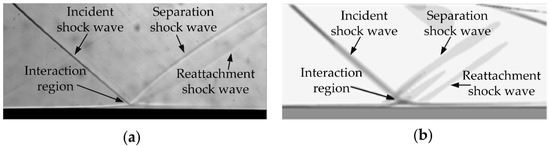
Figure 8.
Comparison of experimental schlieren and DES simulation calculation: (a) experimental schlieren; (b) numerical schlieren.
4.1.3. Phenomenological Model of Plasma Actuation
In-house and foreign studies showed that the control effect of arc plasma actuation over the flow field is mainly a thermal effect. The phenomenological model of plasma actuation is a standard structure used to study plasma simulation. Differing from other physical models, this one simplified plasma flow control into the injection of kinetic and thermal energy into the flow field due to plasma discharge, which considerably reduced the amount of calculation, and can be successfully coupled with the NS equation. Therefore, in this study, the arc plasma actuation was simplified as a heat source model, and it was added to the flow field in the form of a heat source term. The energy of a single actuation was set to 10 mJ, and the density of the discharge heating power was 1 × 10¹¹ W/m3. This value was a rough estimate based on several wind tunnel experiments. The efficiency of the pulsed arc actuation in this paper was approximately 67%. It was the total thermal efficiency of actuators, including instantaneous rapid heating of gas, material heating of models, heat dissipation, and other thermal energies. The shape of the plasma heat source model was set as a square with a side length of 5 mm due to the fact that the spacing of the arc plasma actuation in the experiment was 5 mm.
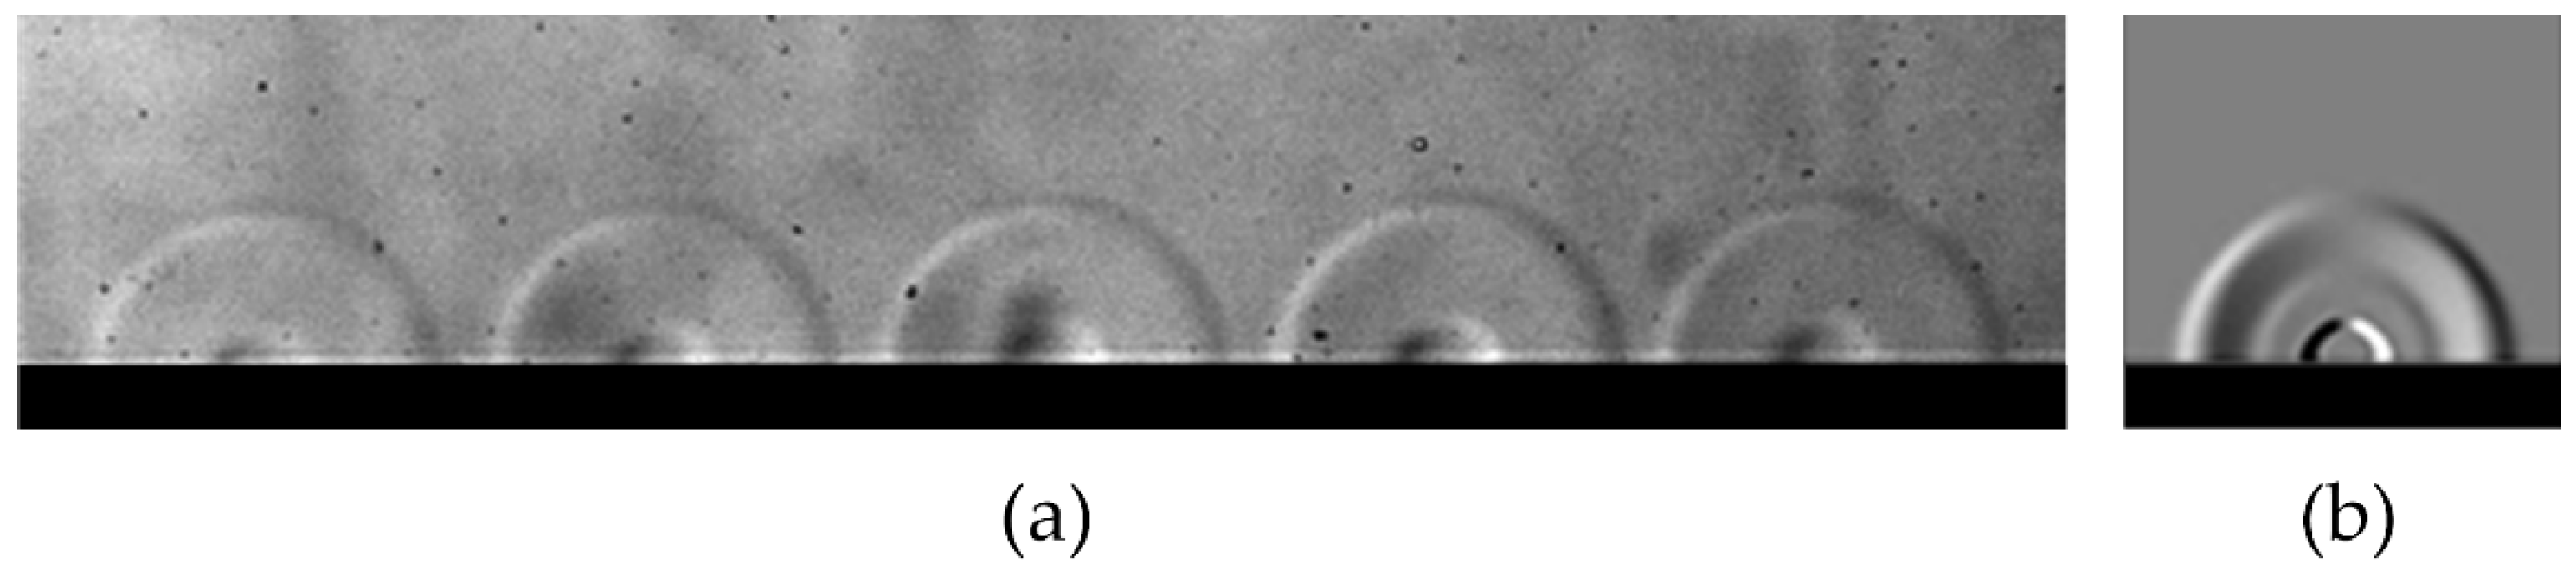
In order to verify the accuracy of the plasma heat source model, the simulation results were compared with the experimental results obtained in the supersonic wind tunnel, as shown in Figure 9. To make the comparison more rigorous, the experimental five-channel array actuation was selected, as shown in Figure 9a. The precursor blast wave and thermal gas bulb produced by each actuation channel had similar structures, which showed that the experimental results were reliable. Figure 9b reveals that the calculated precursor blast wave and thermal gas bulb were consistent with the experiment. The simulation of the arc plasma actuation based on the proposed heat source model could achieve accurate results.

Figure 9.
Plasma actuation evolution: (a) experimental schlieren; (b) numerical schlieren.
4.2. Simulation Result and Disscussion
4.2.1. Base Flow Field
Figure 10 shows the density gradient contours of different spanwise cross sections. At the spanwise middle cross section (z = 0), the structure of the separation shock wave, reattached shock wave, and the separation zone could be clearly identified in the density gradient contour. Furthermore, the separation zone still existed at z = 0.025 m. The strength of the shock wave was lower than that at the spanwise middle cross section. At the cross section at the edge of the plate (z = 0.054 m), the reattached shock wave and the separation zone disappeared, and the ISWBLI was a regular reflection because of the strong turbulence in the boundary layer at the edge of the plate. Based on the flow field structures at the three cross sections, it can be concluded that the ISWBLI demonstrates significant, spanwise, three-dimensional characteristics.
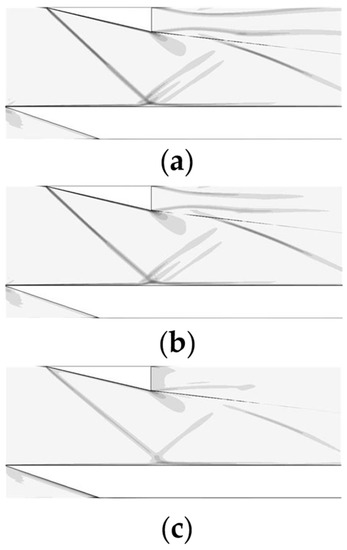
Figure 10.
Density gradient contour of different cross sections: (a) z = 0; (b) z = 0.025 m; (c) z = 0.054 m.
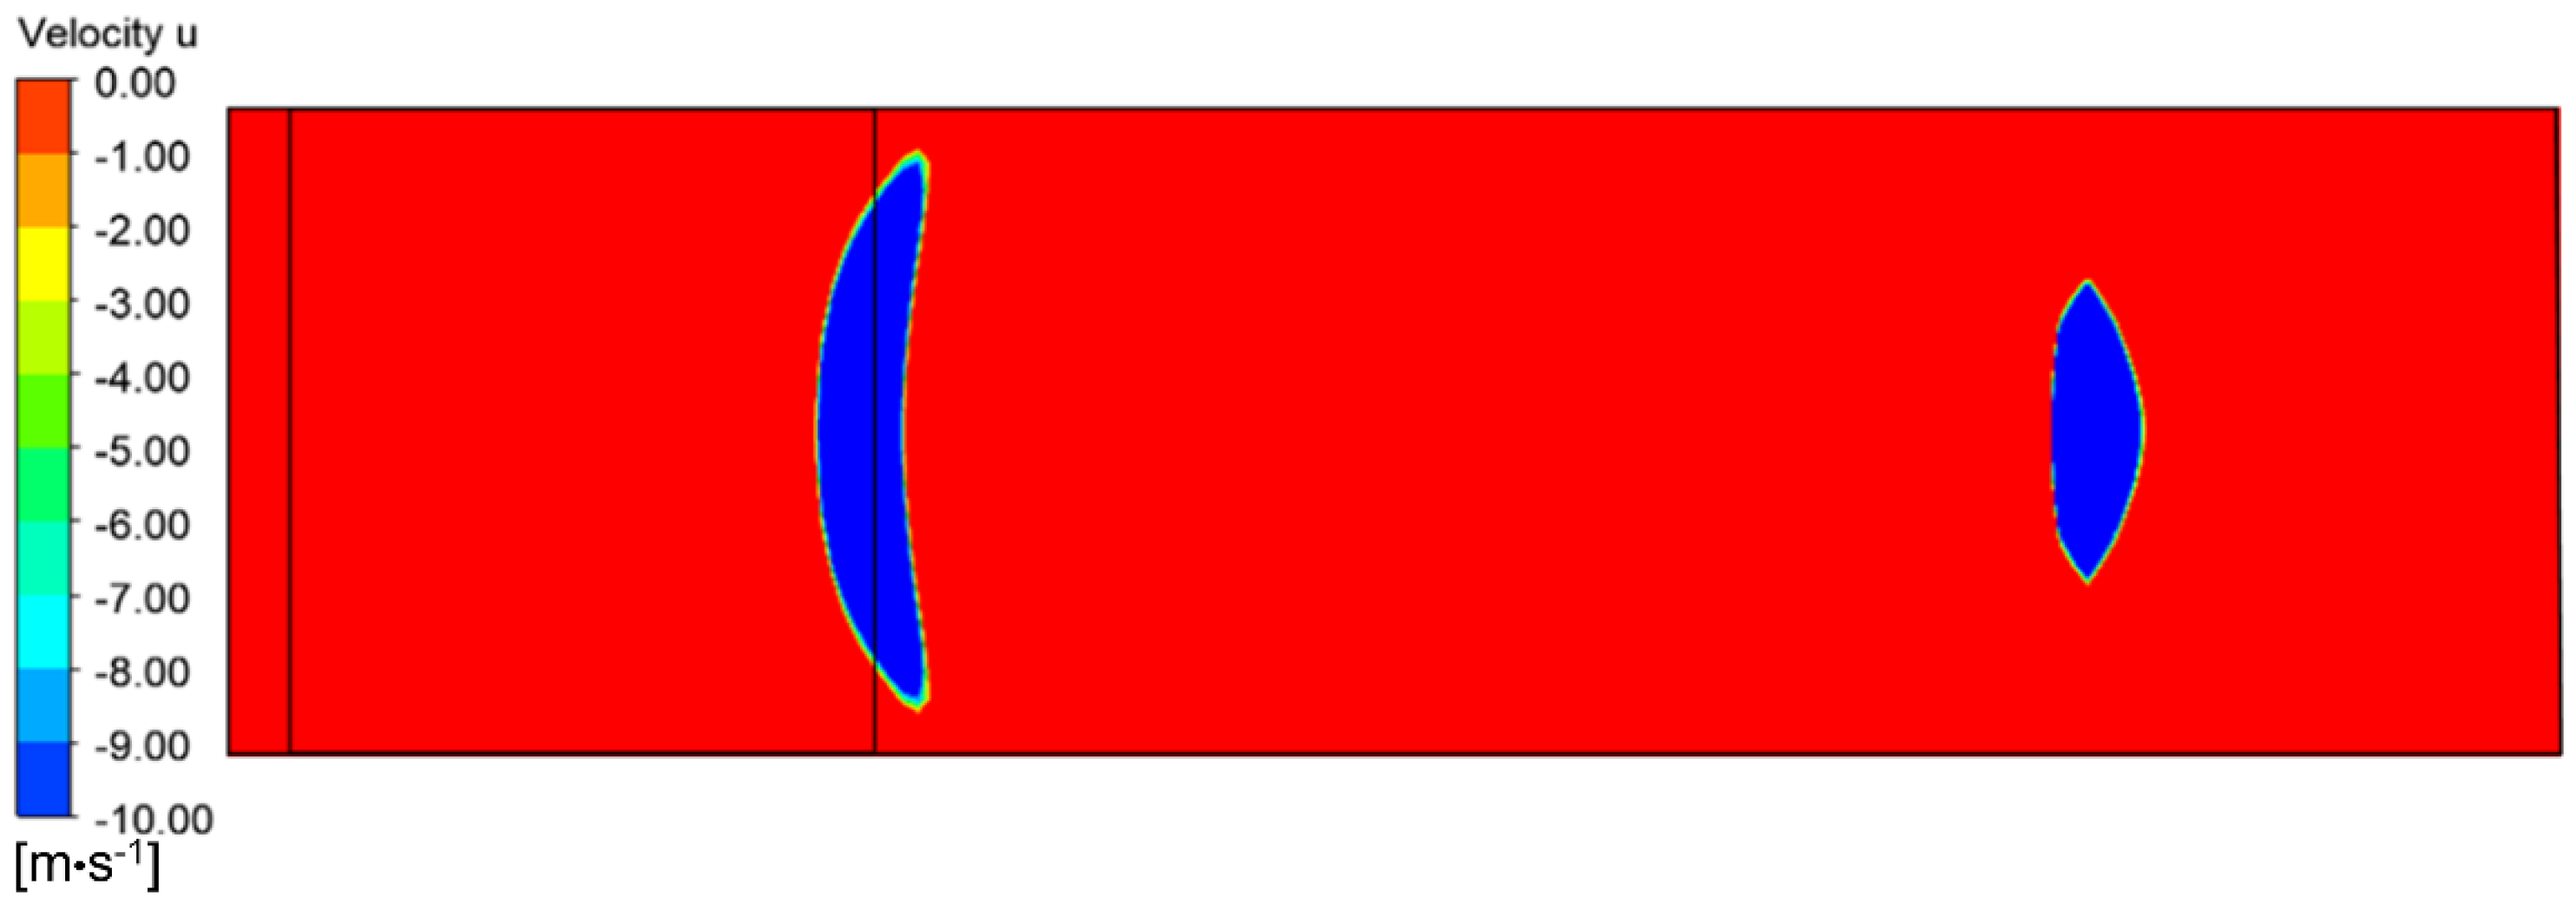
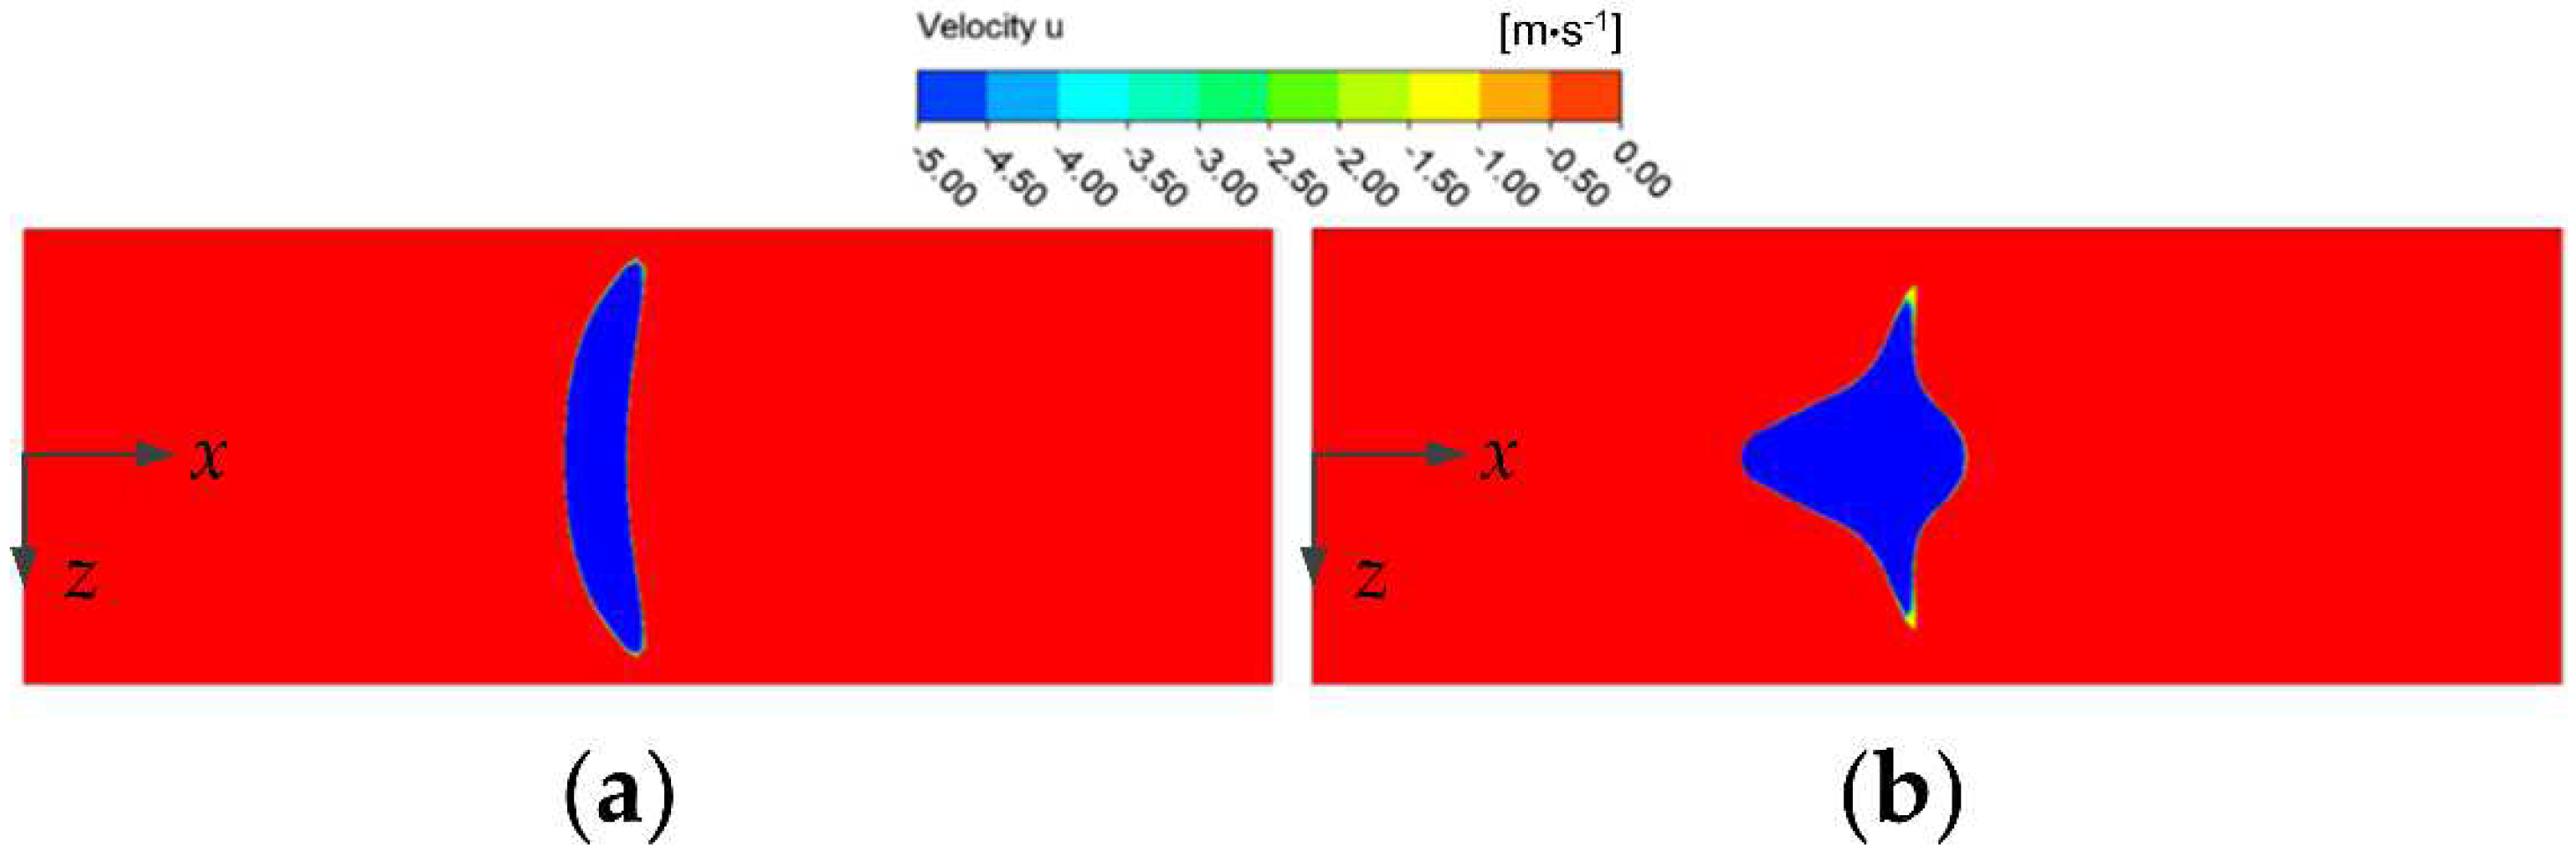
The velocity contour in the ISWBLI zone was further analyzed. Figure 11 shows the velocity contour at the y = 0 cross section. Velocity u represents the velocity in the x-axis direction of the flow field, and the region where Velocity u is less than 0 is defined as the separation zone, which is showed in blue in Figure 11. The calculation results show that the separation zone induced by the incident oblique shock wave was crescent shaped, and the length of the separation zone reached its peak at the central section of the plate and decreased spanwise. The separation zone had a width smaller than that of the shock wave generator and the plate and basically disappeared at the edge of the plate. These outcomes demonstrate that the ISWBLI flow field has significant, spanwise, three-dimensional characteristics, which is consistent with the conclusion extracted from Figure 10.
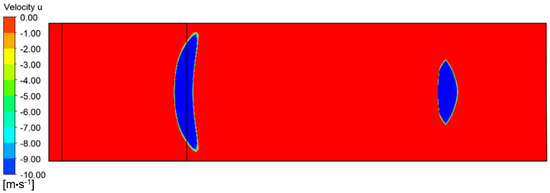
Figure 11.
Velocity contour of ISWBLI at y = 0 cross section.
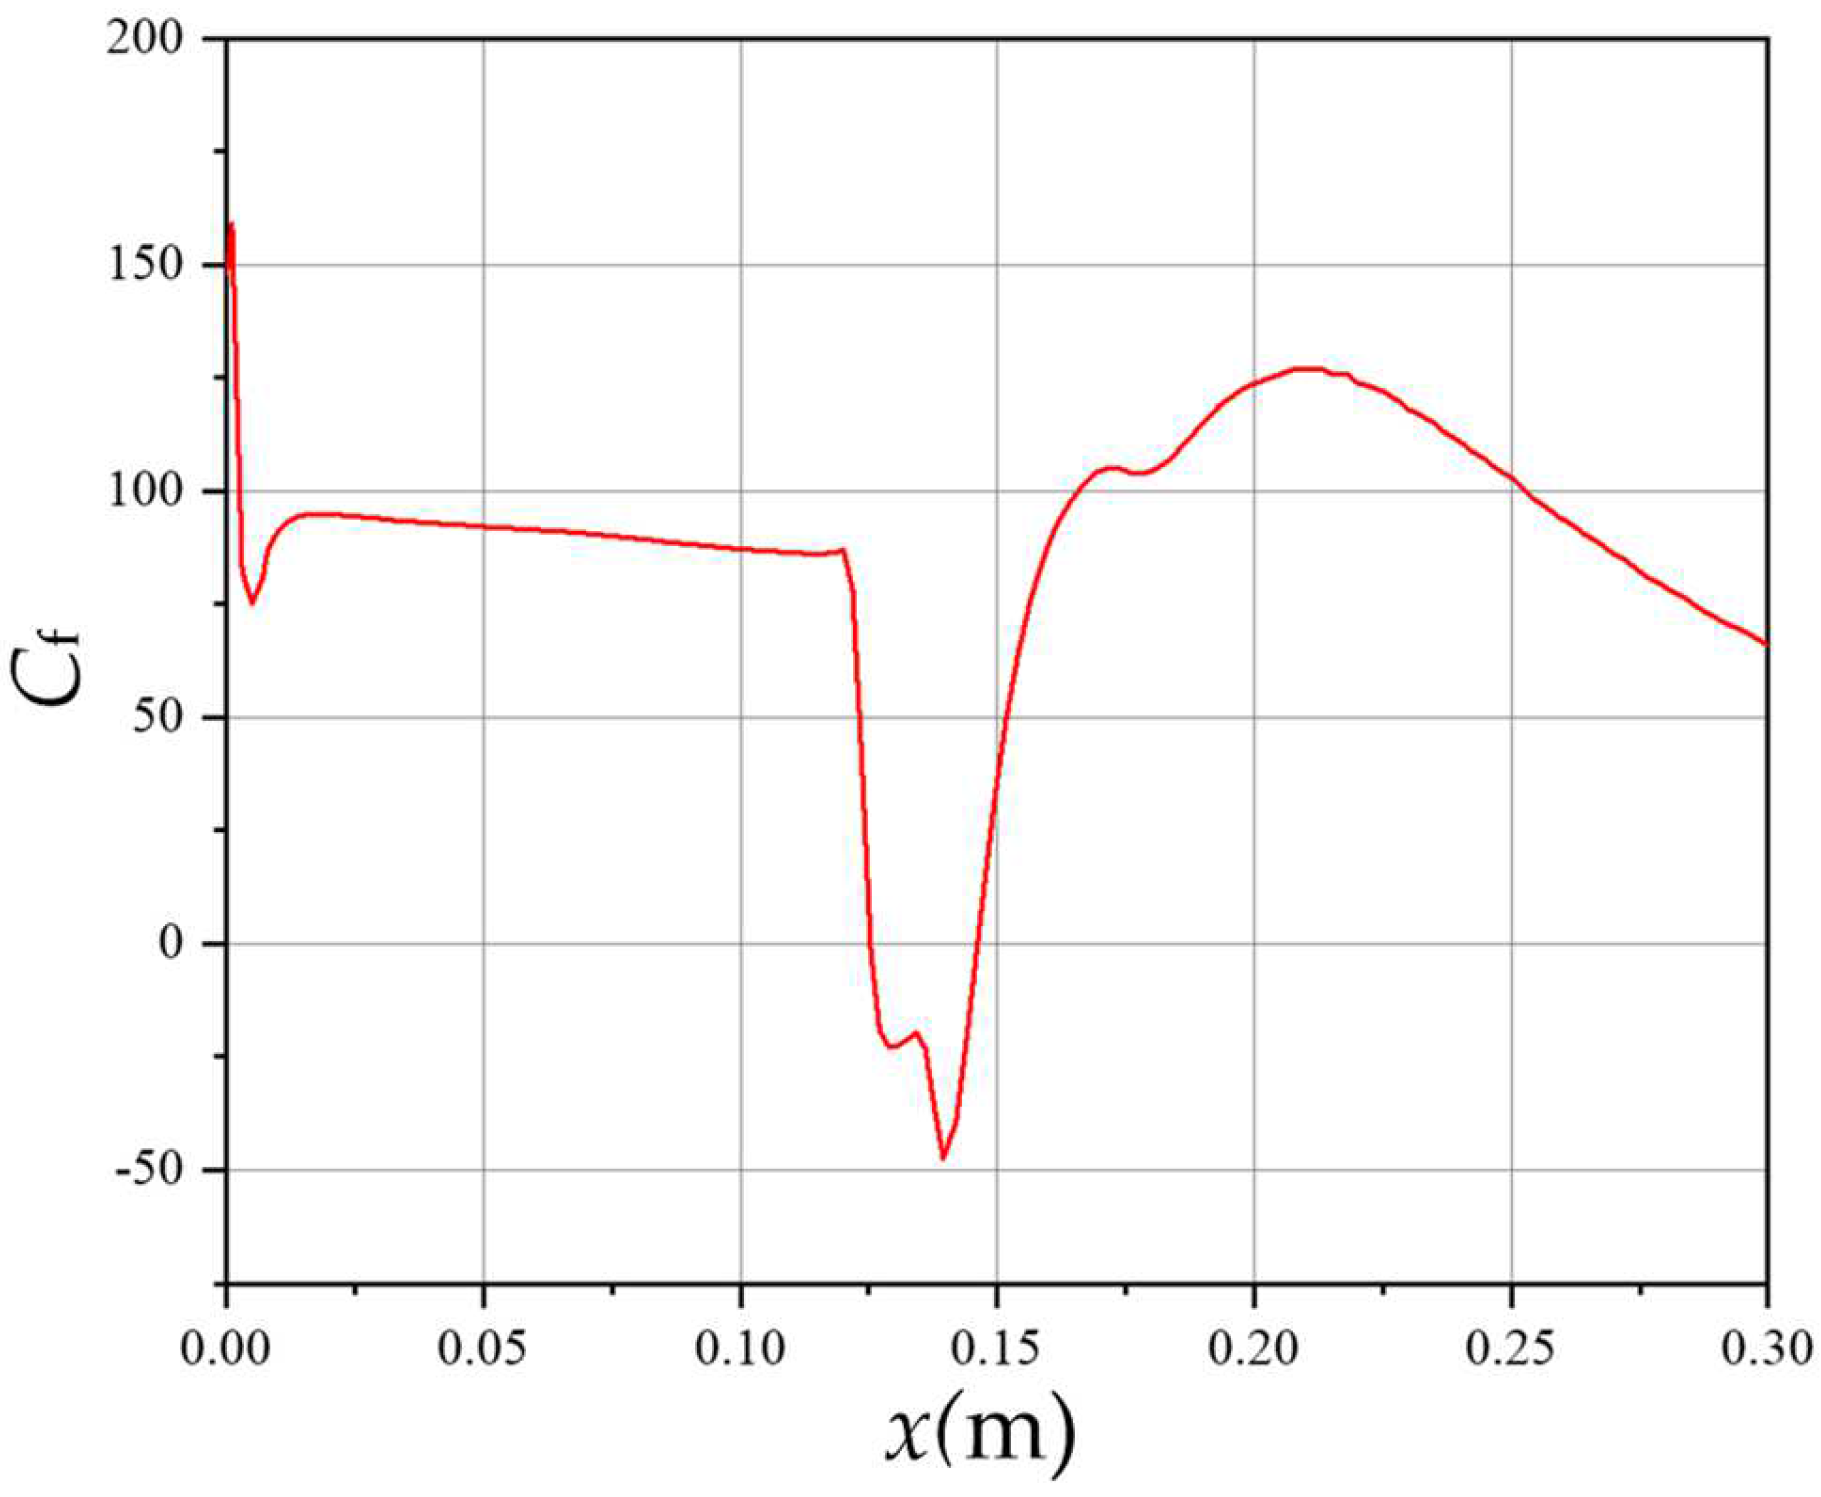
The specific location of the separation zone could be determined based on the skin friction coefficient Cf. Figure 12 represents the change curve of Cf at the z = 0 cross section and, as can be seen, at the central cross section of the plate, Cf had a negative value from x = 0.126 m to x = 0.146 m in the flow direction. This indicates that the length of the separation zone at the central cross section of the plate was 20 mm.
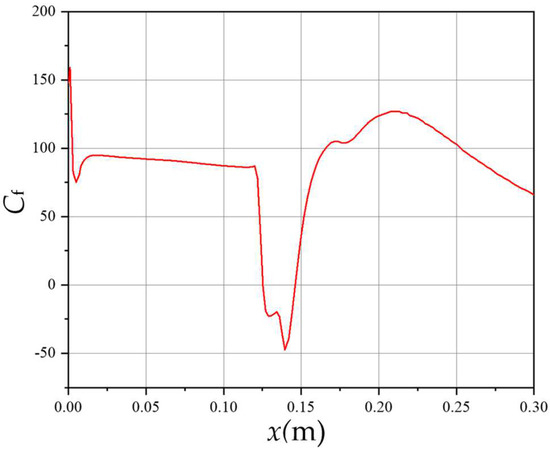
Figure 12.
Skin friction coefficient curve of base flow field at z = 0 cross section.
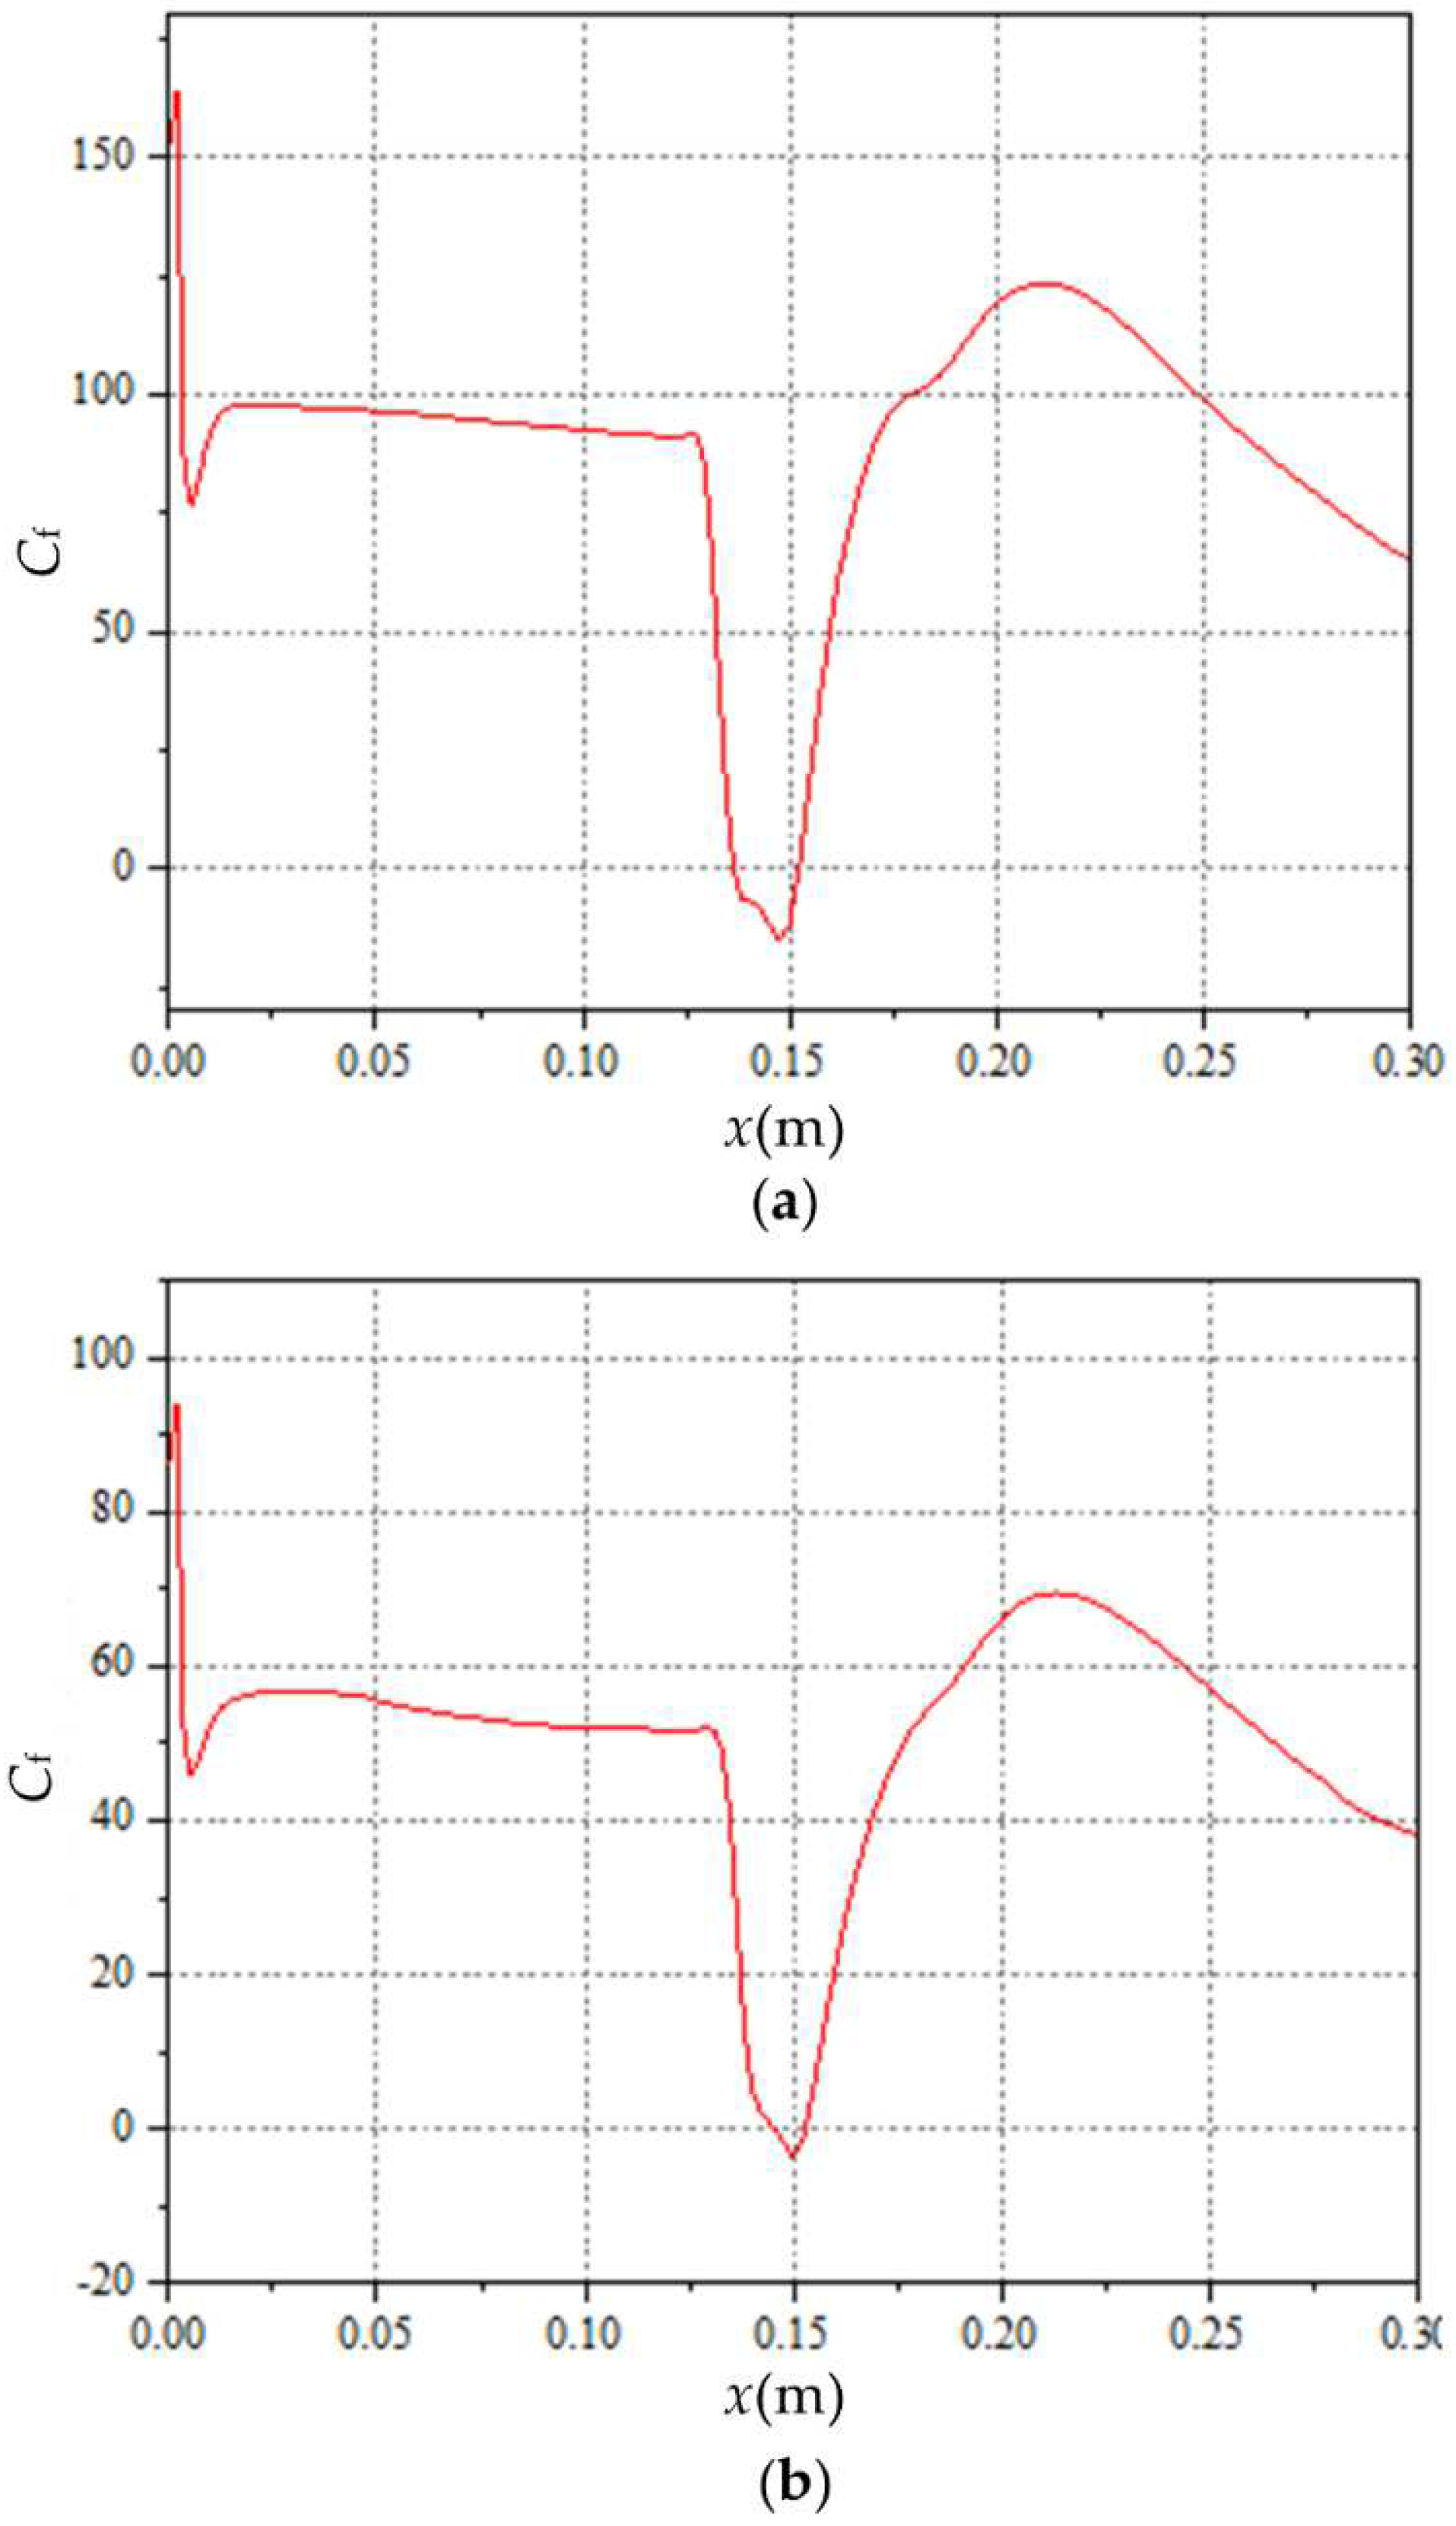
Figure 13a,b shows the skin friction coefficient curves at the z = 0.025 m cross section and z = 0.054 m cross section, respectively. It can be interpreted from the figure that, at z = 0.025 m, the separation zone was about 16 mm in length from x = 0.0136 m to x = 0.0152 m. At z = 0.054 m cross section, the separation zone was located at x = 0.146 m~x = 0.153 m with a length of 7 mm. The separation moved backward with a smaller size. This result shows that the size of the separation zone at the edge of the plate was smaller than that at the middle of the plate.
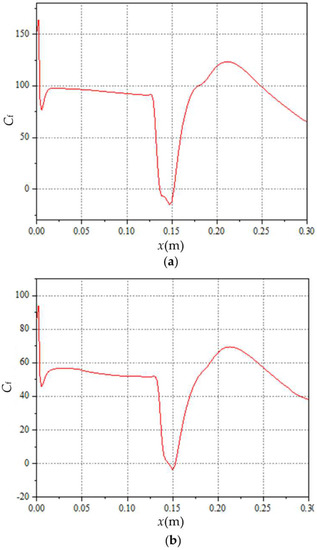
Figure 13.
Skin friction coefficient curve of base flow field at different spanwise cross sections: (a) z = 0.025 m; (b) z = 0.054 m.
4.2.2. Single-Channel Actuation Flow Field
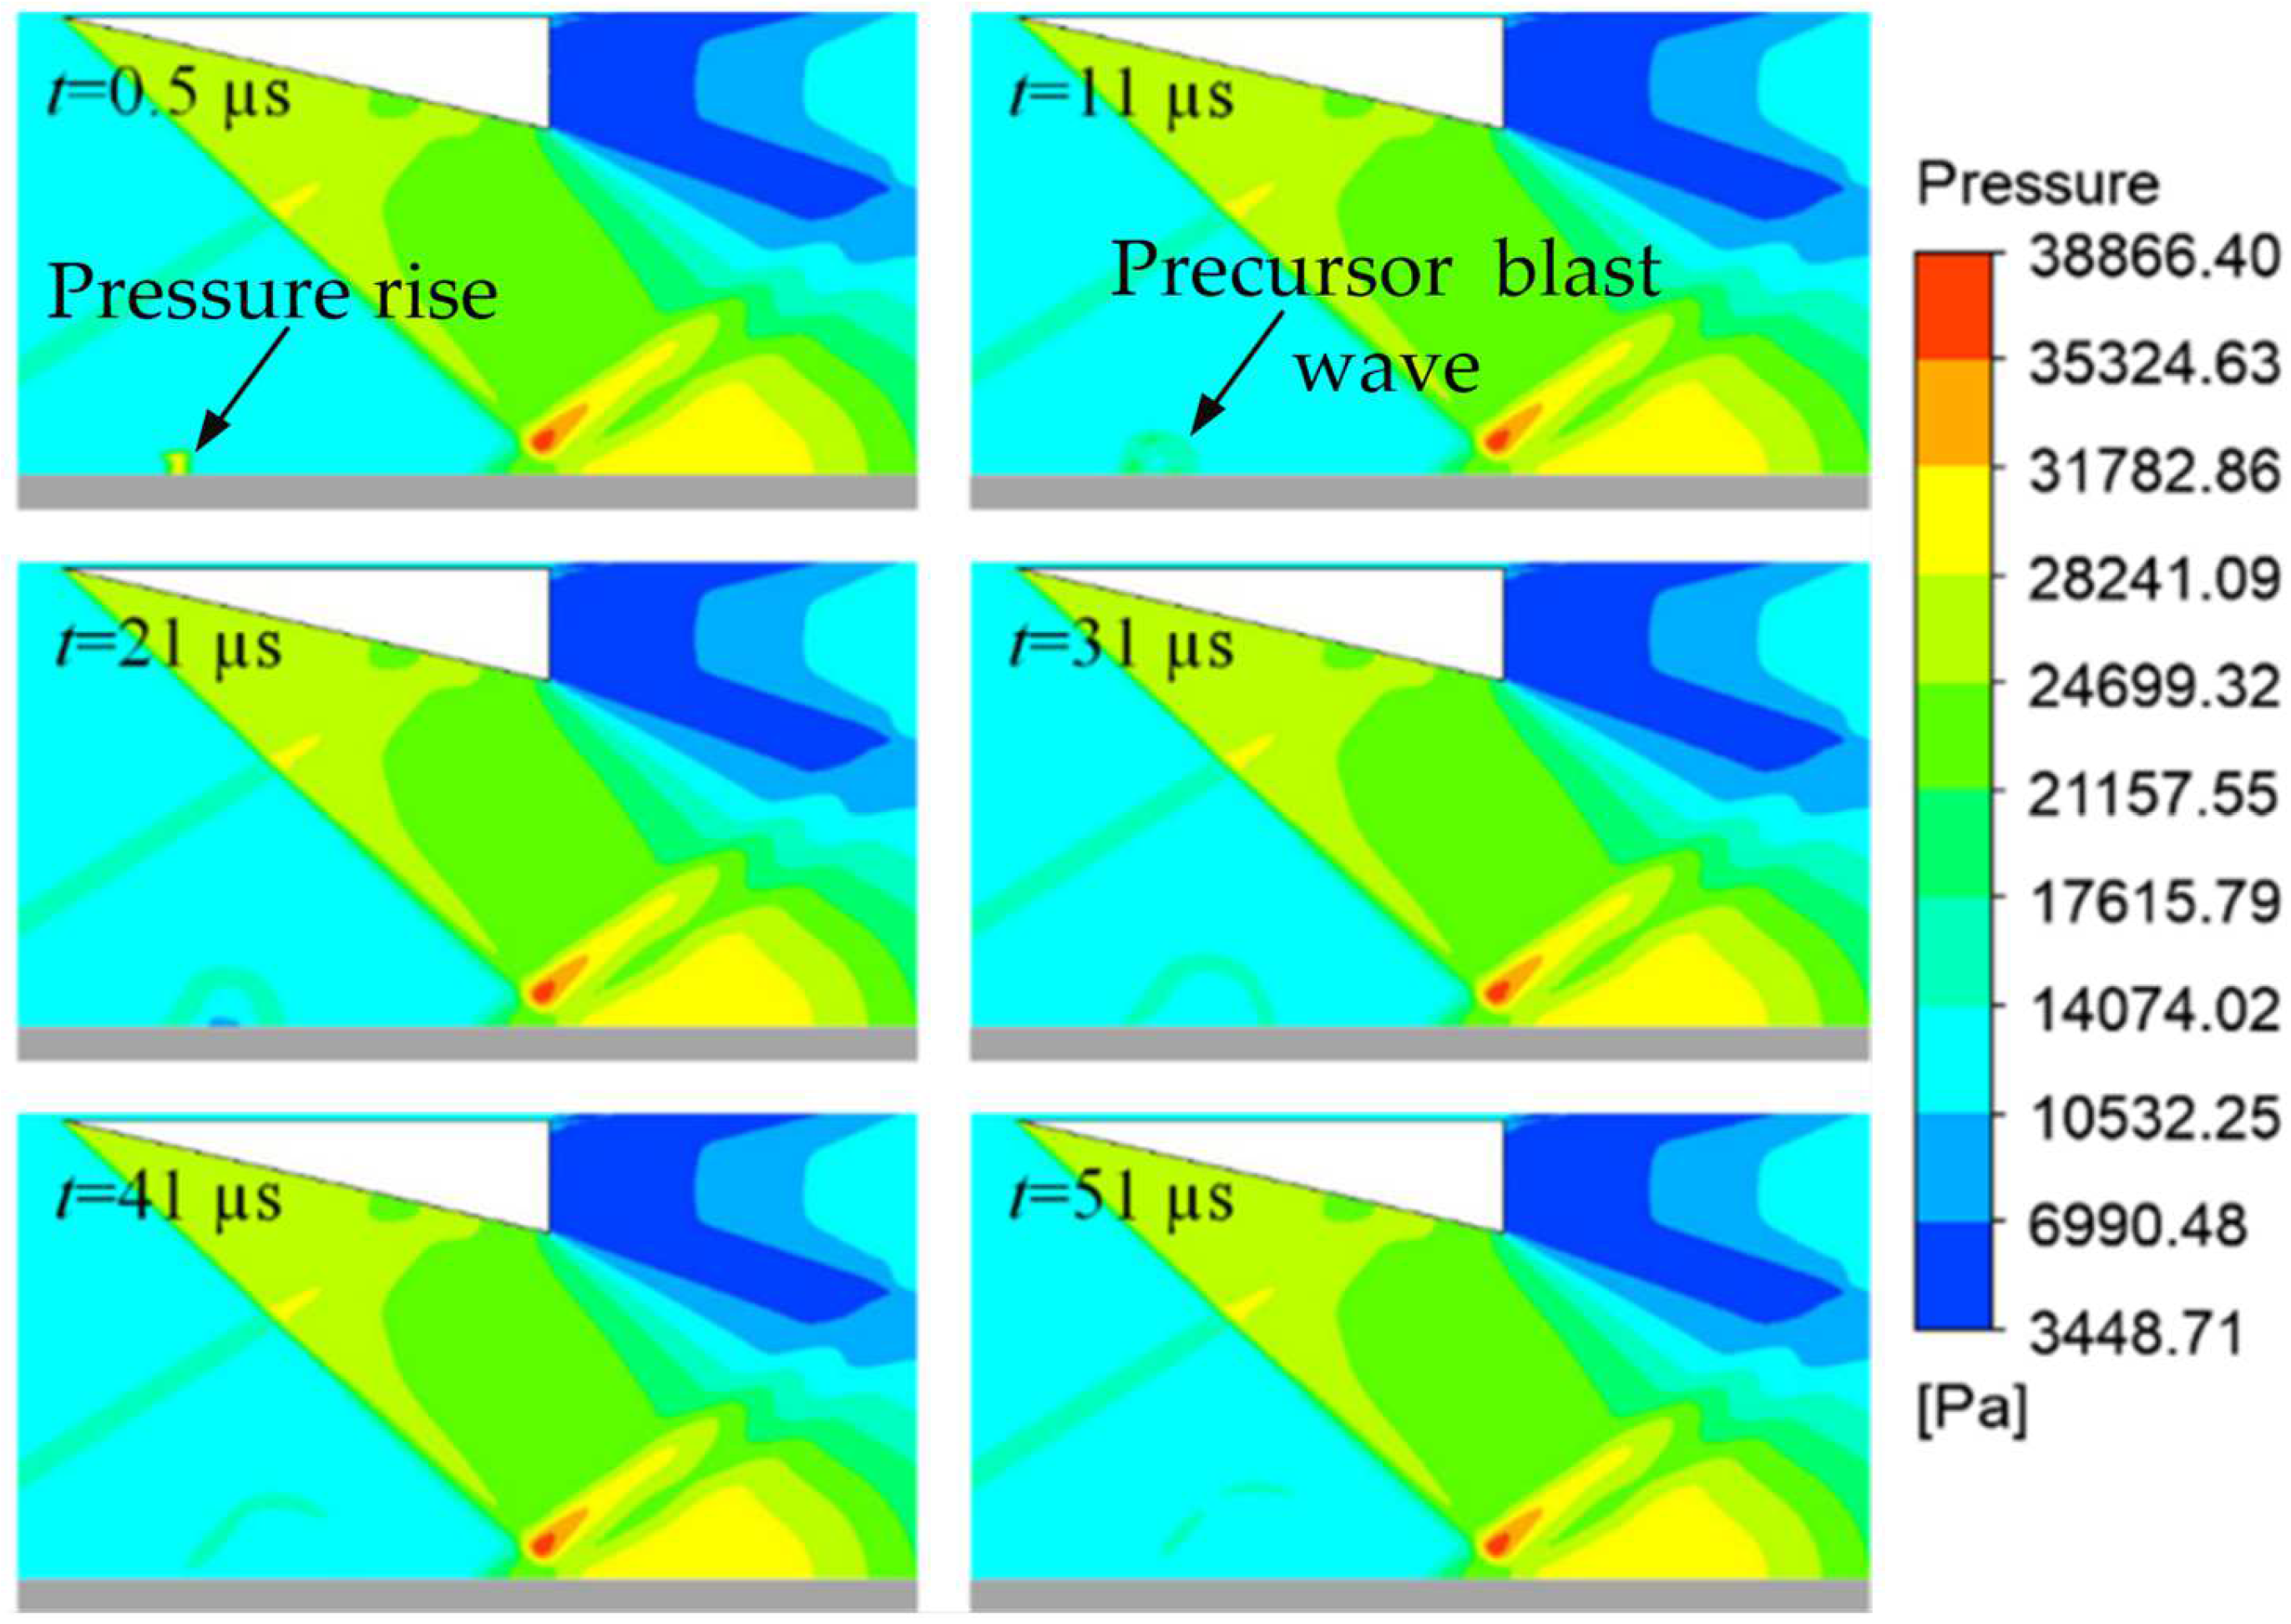
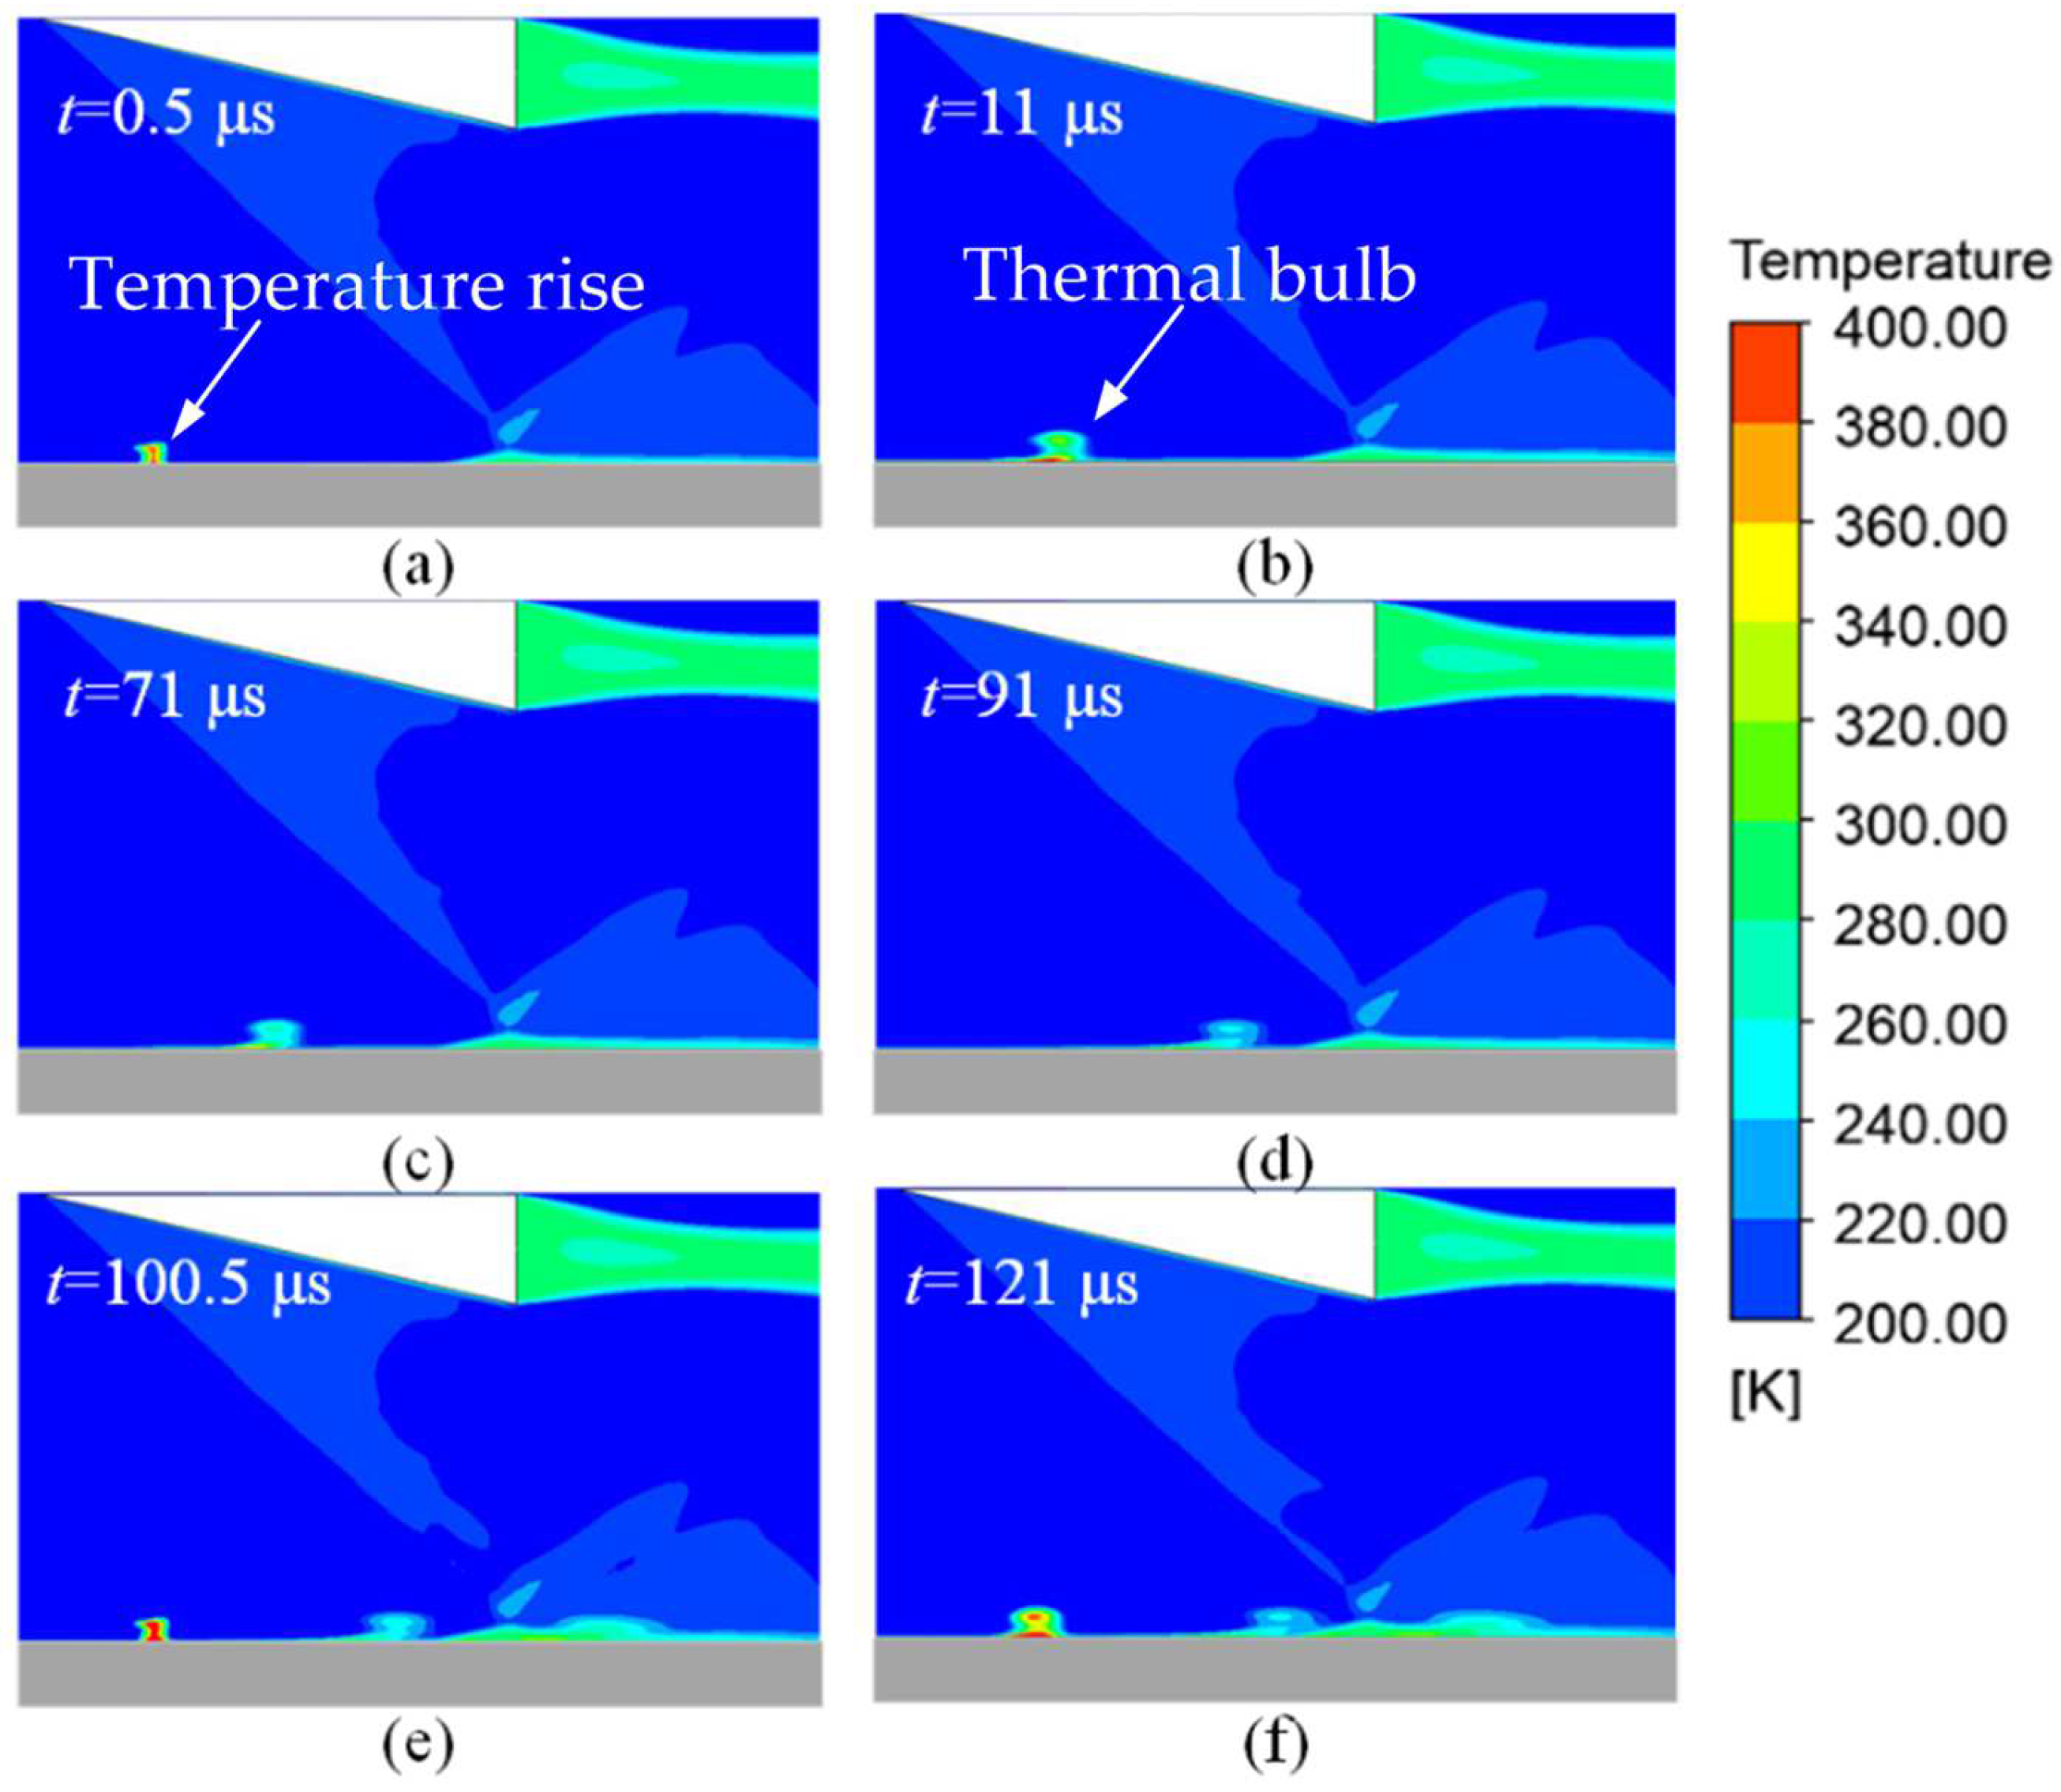
In this section, the coupling of single-channel arc plasma actuation and the ISWBLI flow field was studied. The single-channel actuation was set at the central cross section of the plate, 70 mm from its leading edge. The actuation frequency was set to 10 kHz, and the actuation energy was 10 mJ. Figure 14 shows the pressure contour of the ISWBLI flow field controlled by plasma actuation at different moments. The start time of discharge was recorded as t = 0. When t = 0.5 µs, a region with increased pressure appeared at the actuation position, because a local, high-pressure region was induced by high temperature due to the discharge. The high-pressure region was a square, similar to the shape of the plasma source term. When t = 11 µs, the precursor blast wave structure induced by actuation appeared in the flow field, which was essentially generated due to the outward transfer of local high pressure. When t = 21 µs~t = 41 µs, the precursor blast wave continued to spread. It can be interpreted from the figure that the precursor blast wave weakened as it spread and almost entirely disappeared when t = 51 µs.

Figure 14.
Pressure contour at z = 0 cross section at different moments.
Subsequently, the evolution of the thermal gas bulb generated by the arc plasma actuation was analyzed through the temperature contour of the flow field. As shown in Figure 15a, when t = 0.5 μs, a local, high-temperature zone appeared at the actuation position with a maximum temperature of 715 K. A thermal gas bulb was generated near the surface due to discharge heating. Then, the thermal gas bulb propagated downstream, accompanied by energy loss and structural diffusion. As shown in Figure 14c,d, since the structure of the thermal gas bulb was slightly higher than the boundary layer, the moving speed of the part far from the skin was higher while that of the part close to the skin was lower. This difference happened due to the mainstream shear force. When t = 100.5 μs, the second actuation was already triggered. At this time, the thermal gas bulb generated by the previous discharge propagated to the ISWBLI zone. As shown in Figure 15e, affected by the thermal gas bulb, the boundary layer was thickened. It can be concluded that the disturbance caused by the actuation was not only due to the shock, but also the thermal gas bulb.
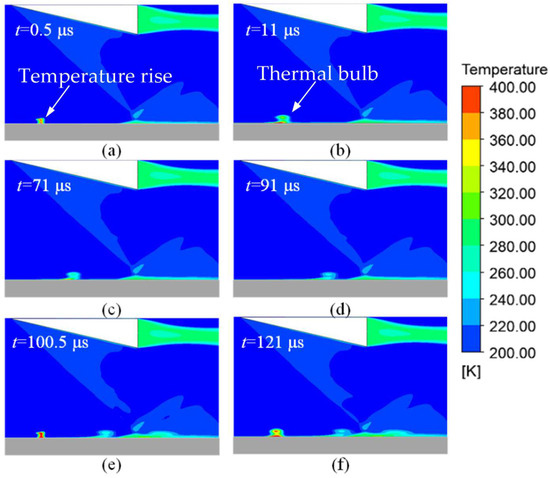
Figure 15.
Temperature contour at z = 0 cross section at different moments.
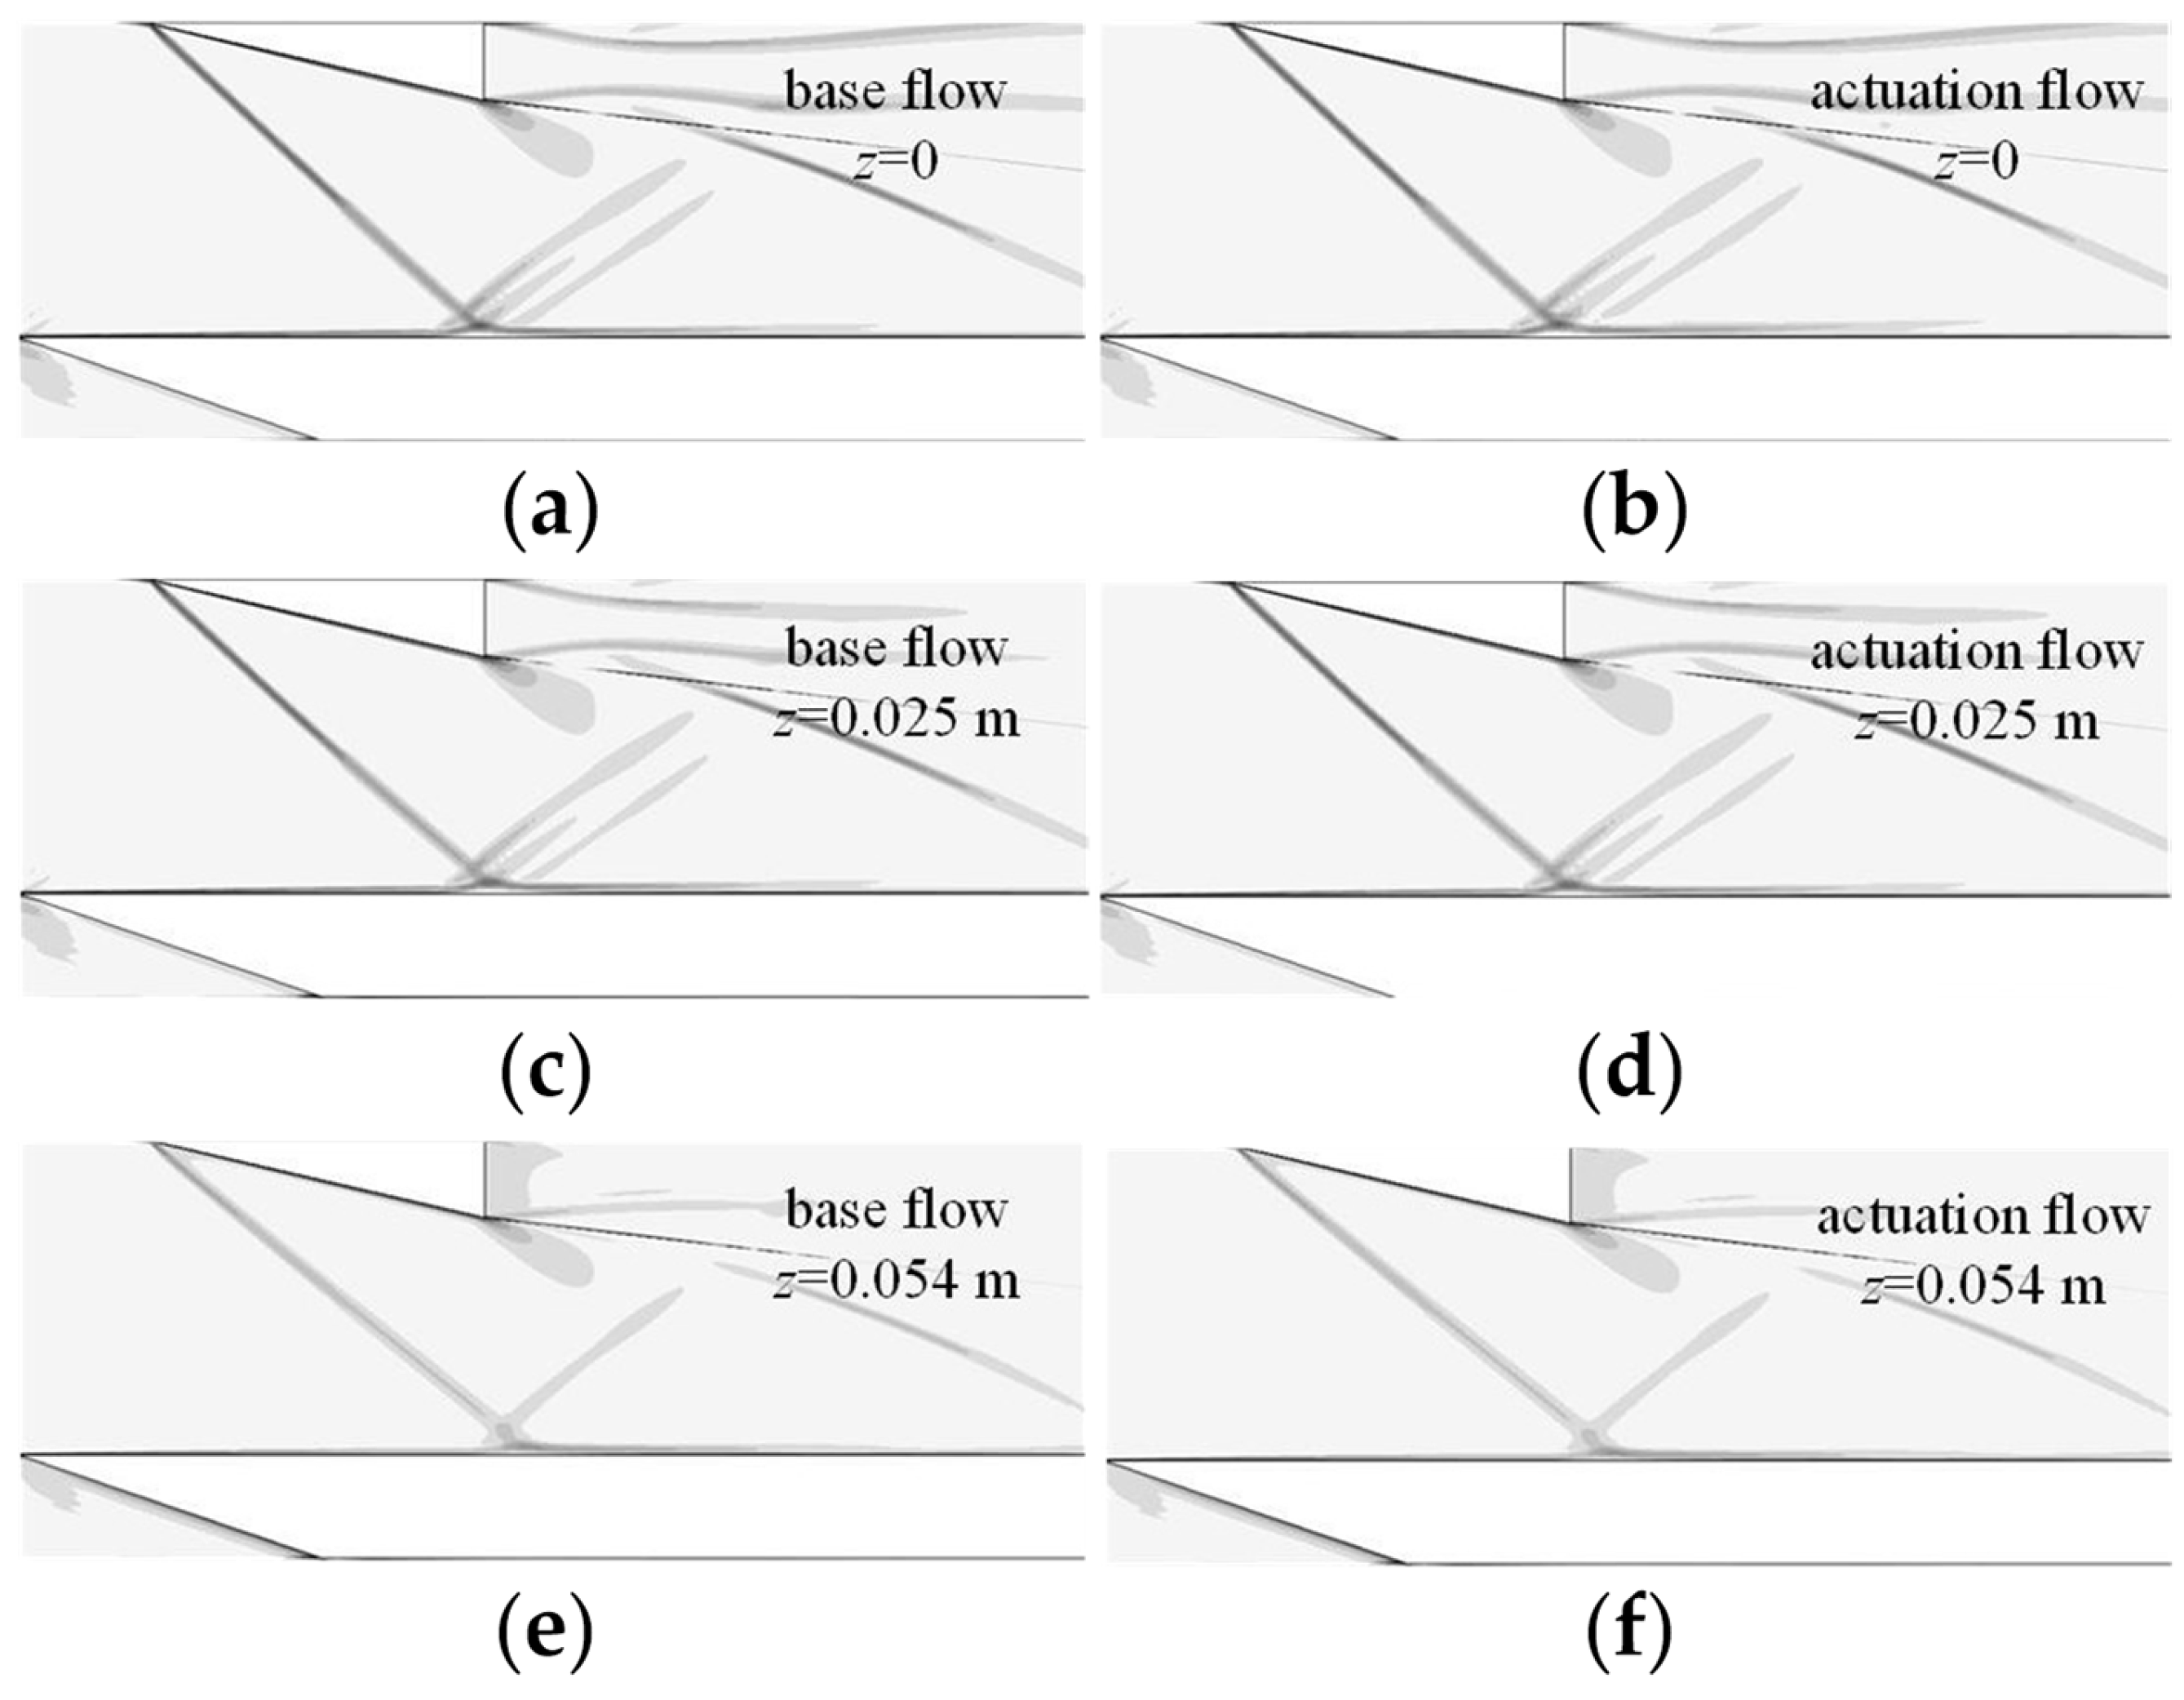
Figure 16 shows the numerical schlieren time-averaged flow field with and without the single-channel actuation flow field at different spanwise cross sections. At the three selected cross sections (z = 0, z = 0.025 m, z = 0.054 m), no obvious changes in the shock wave structure and the separation zone were identified after the actuation was applied.
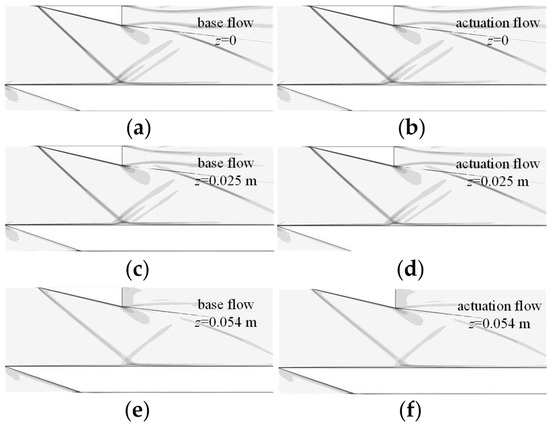
Figure 16.
Numerical schlieren of three cross sections: (a) z = 0 base flow field; (b) z = 0 actuation flow field; (c) z = 0.025 m base flow field; (d) z = 0.025 m actuation flow field; (e) z = 0.054 m base flow field; (f) z = 0.054 m actuation field.
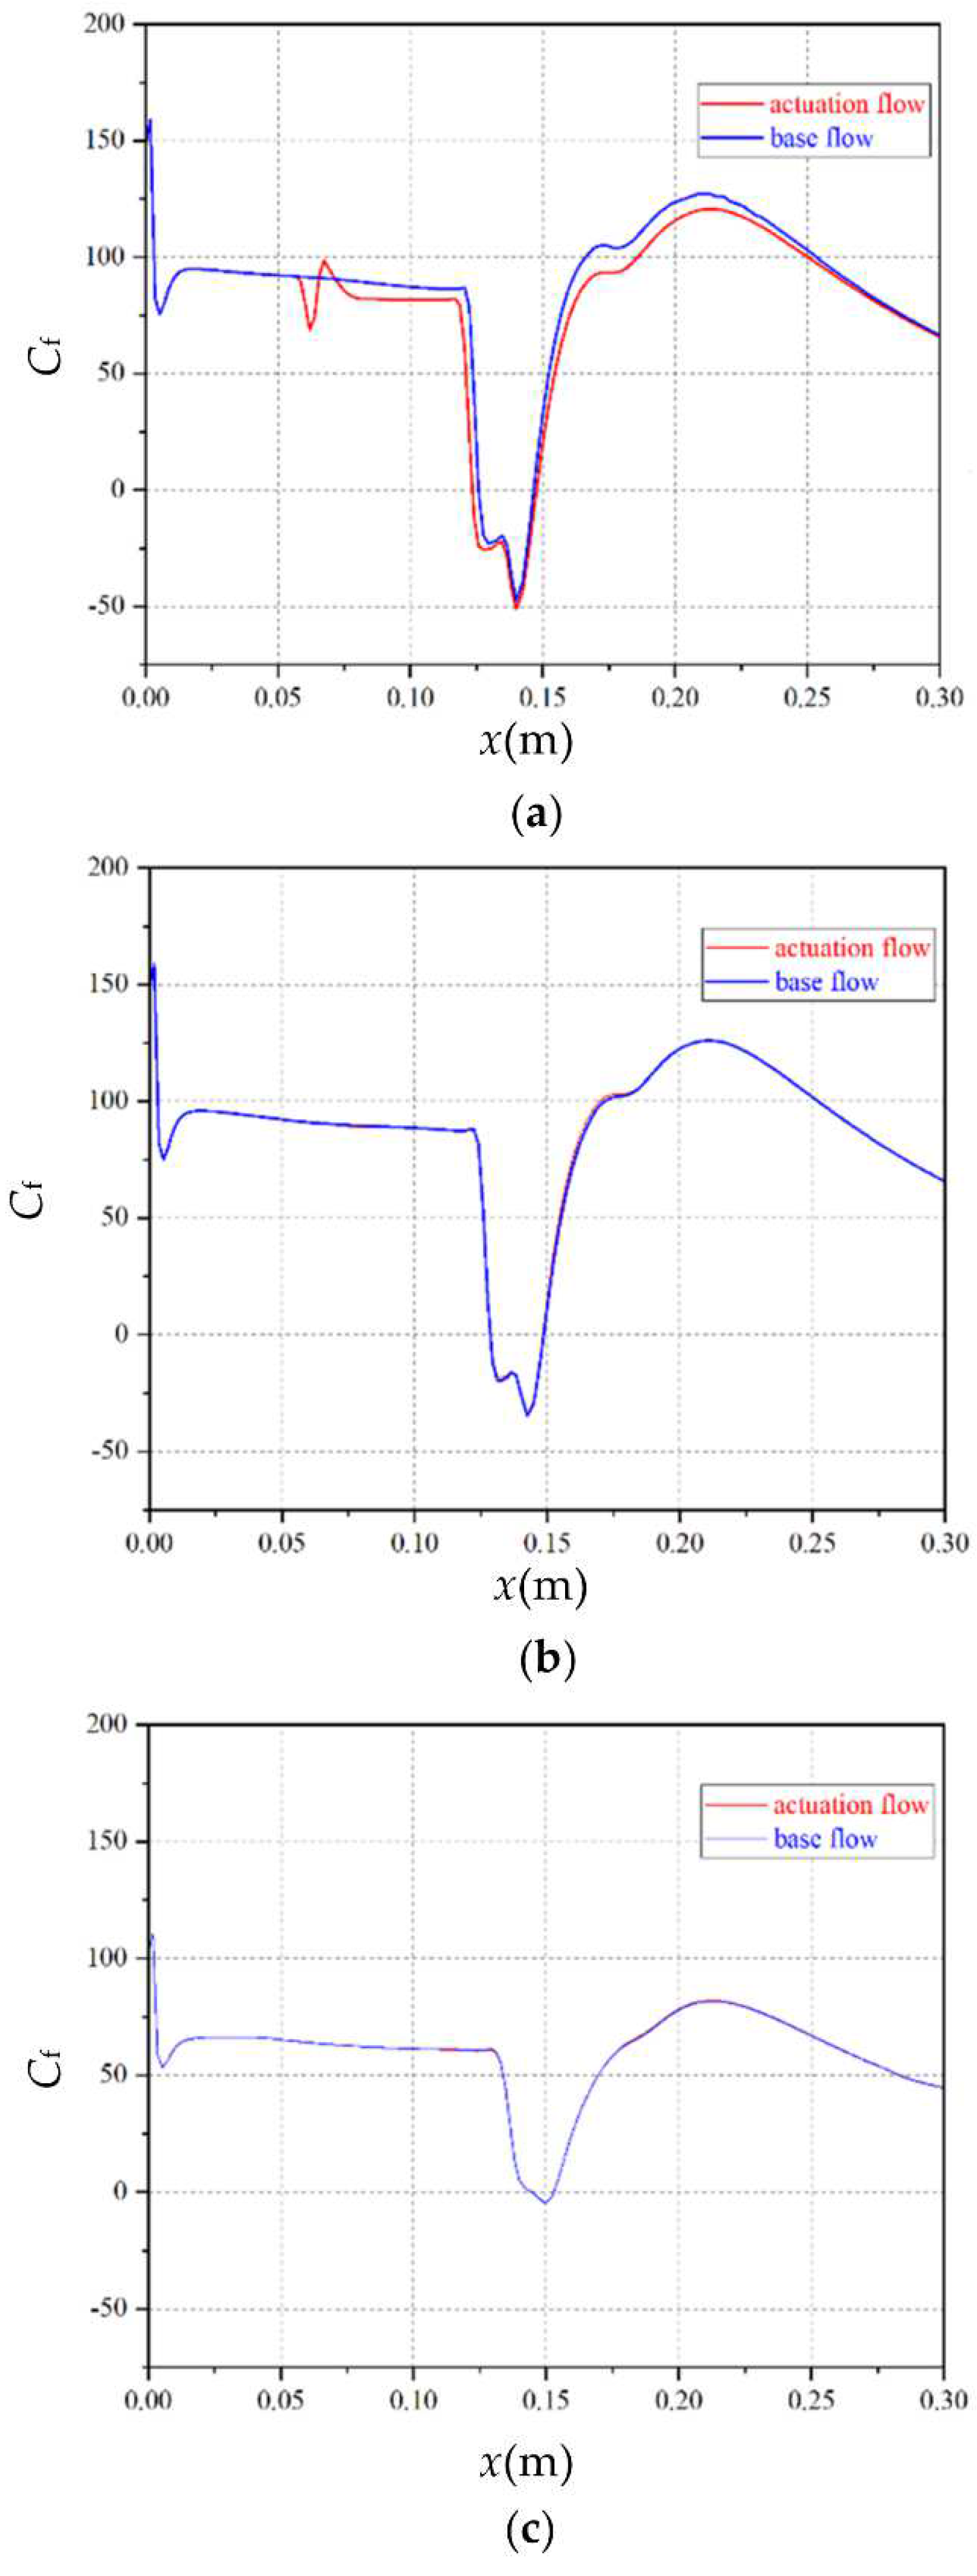
Figure 17 shows the curves of the skin friction coefficient at different spanwise cross sections. At three selected cross sections (z = 0, z = 0.025 m, z = 0.054 m), the curves of the skin friction coefficient of the base flow field and the actuation flow field were basically the same. At the z = 0 cross section, the length of the separation zone slightly increased in the actuation flow field, and the start of separation moves forward moderately. At the cross section away from the center of plate (z = 0.025 m, z = 0.054 m), the skin friction coefficient curved of the base flow field, and the actuation flow field completely overlapped.
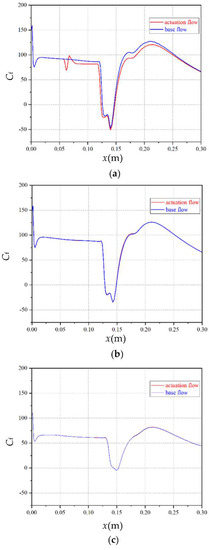
Figure 17.
Skin friction coefficient curve at different spanwise cross sections: (a) z = 0; (b) z = 0.025 m; (c) z = 0.054 m.
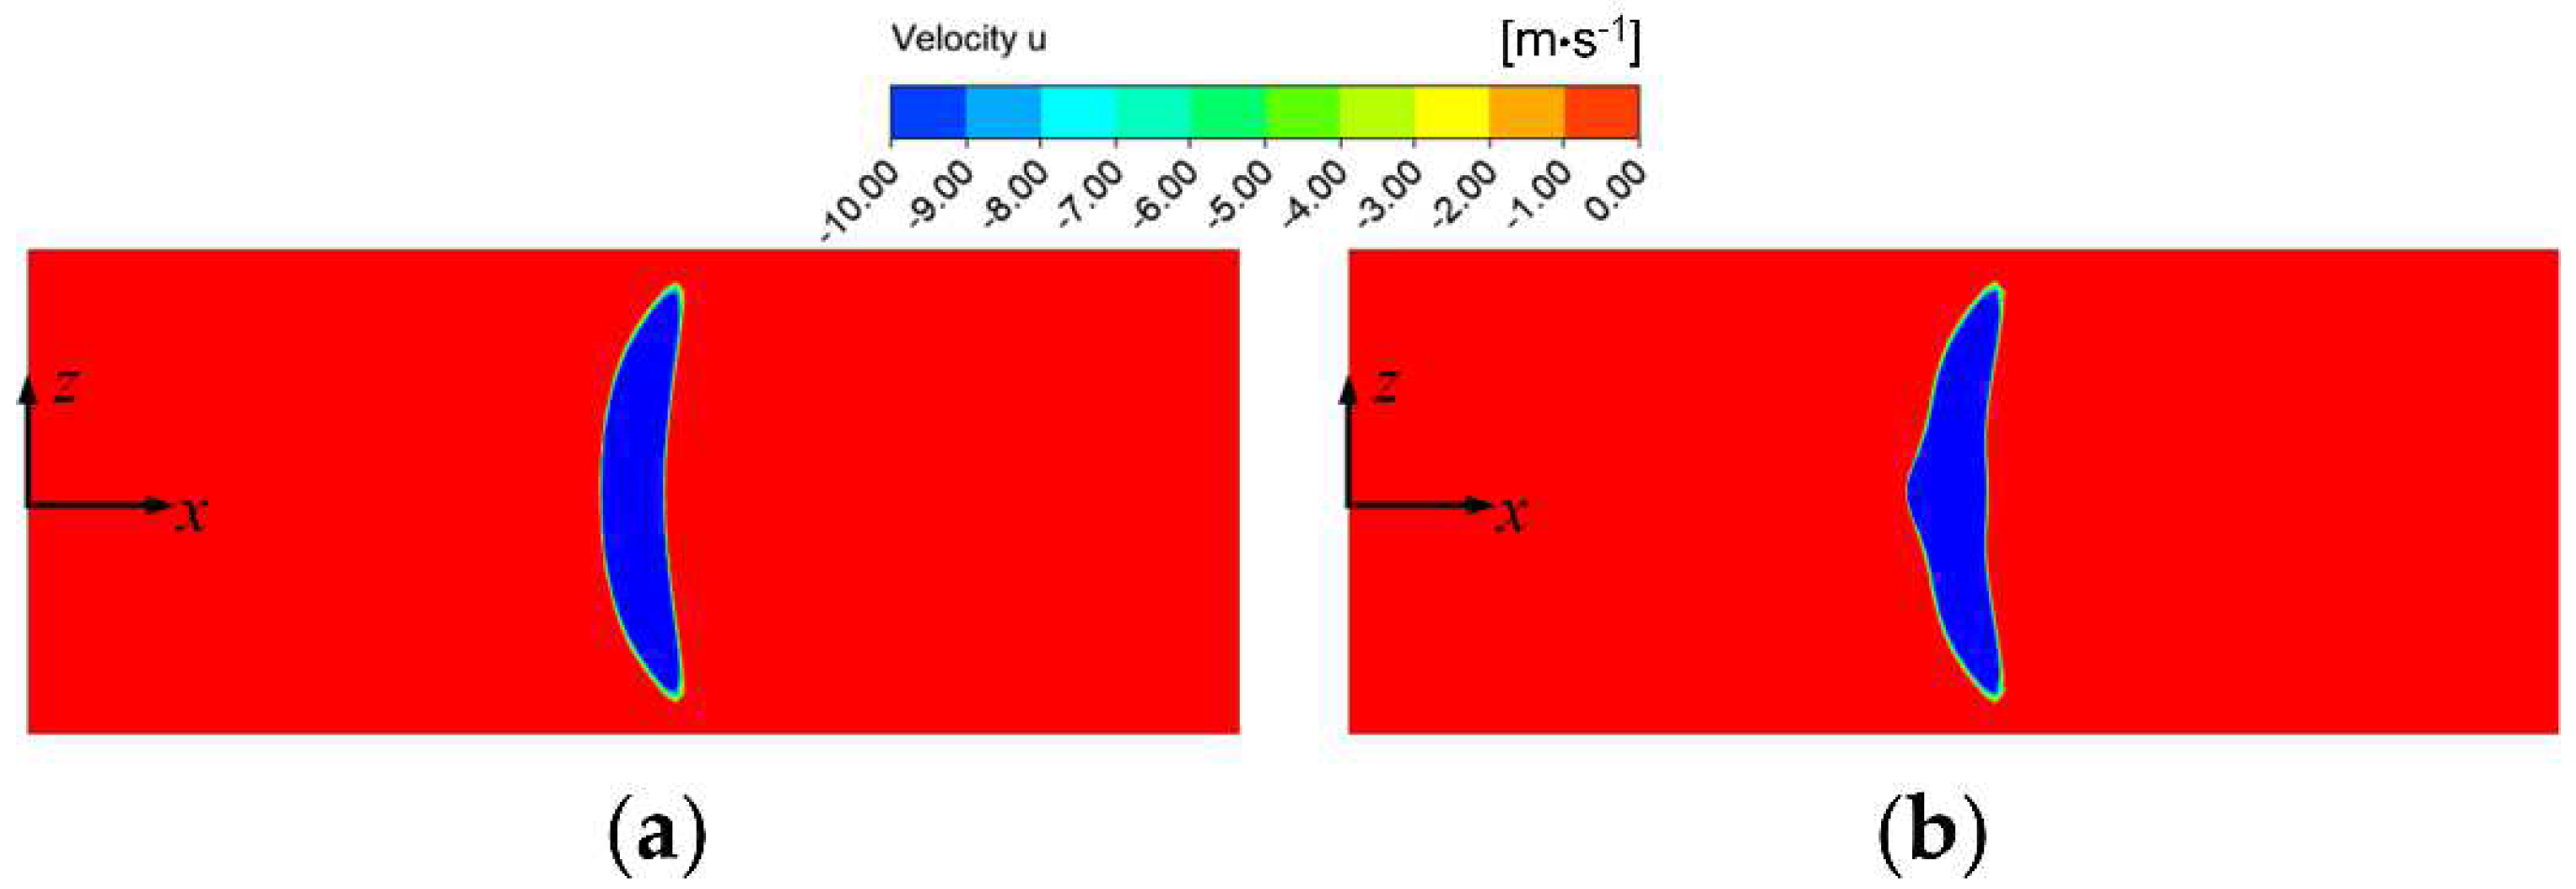
The form of the separation zone with and without actuation was also taken into account. Figure 18 illustrates the velocity contour of the y = 0 cross section. Compared with the crescent-shaped separation zone in the base flow field, the length of the separation zone at the spanwise central cross section increased slightly with single-channel actuation, and the start of separation moved forward. However, no obvious changes were identified in the separation zone on both sides of the plate.
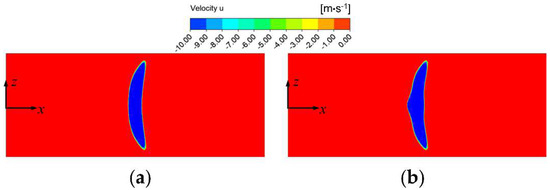
Figure 18.
The form of separation zone at y = 0 cross section: (a) base flow field; (b) actuation flow field.
Based on the abovementioned results, when a 10 kHz single-channel actuation was applied, the intensity of the separation shock wave and the reattached shock wave in the ISWBLI flow field remained stable (barely weakened). Similarly, the size and shape of the separation zone did not change significantly either. Therefore, it was concluded that single-channel actuation can only just achieve the control effect over the ISWBLI flow field.
4.2.3. Array Actuation Flow Field
The effect of array actuation on the ISWBLI was further simulated. As shown in Figure 19, array actuation was applied at the central cross section of the plate; the single-channel actuation energy was set to 10 mJ; the actuation frequency was 10 kHz; the actuation point was 70 mm away from the plate’s leading edge; and the actuation spacing was 15 mm. The array actuator was located upstream of the ISWBLI region, about 15~20 mm away from the interaction region.
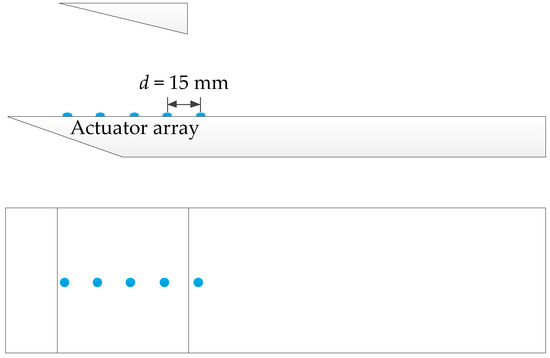
Figure 19.
The schematic diagram of array actuation model.
Figure 20 shows the numerical schlieren image of the time-averaged actuation flow field and the time-averaged base flow field at the z = 0 cross section. As shown in Figure 20a, at the z = 0 cross section, after the array actuation was applied, the separation shock wave basically disappeared, and the angle of the reattached shock wave was reduced from 34.6° in the base flow field to 30.5°. These changes indicate that the array actuation can effectively weaken the intensity of the separation shock and reattached shock waves. Further, it was concluded that, after the application of actuation, the height of the separation zone at the z = 0 cross section was significantly increased. The height of the separation zone in the base flow field was about 5 mm, but, in the separation zone in the actuation flow field, it rose to 10 mm as the start of separation moved forward by about 19 mm. It can be concluded that the application of plasma actuation increases the size of the separation zone at the spanwise middle cross section and causes the start of separation to move forward. Upon further comparison of the time-averaged numerical schlieren, it was found that the intensity and angle of the incident shock wave remained unchanged, indicating that plasma actuation has no significant effect on the incident shock wave. This outcome is consistent with the experimental results presented in the previous section.
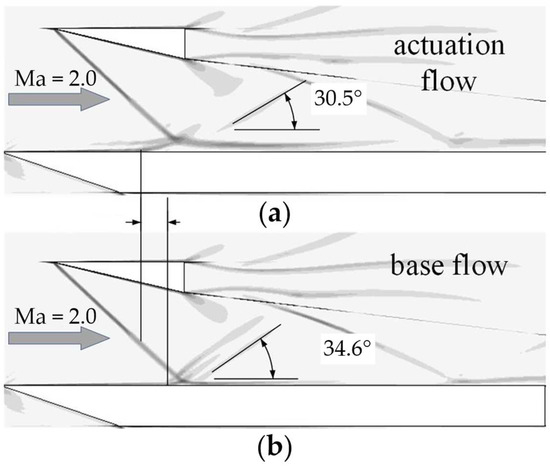
Figure 20.
Numerical schlieren at z = 0 cross section: (a) 10 kHz actuation flow field; (b) base flow field.
The flow field at different cross sections was also analyzed. Figure 21a,b represents the numerical schlieren at the z = 0.025 m cross section and shows that the array actuation effectively weakened the intensity of the separation shock wave. Figure 21c,d show the numerical schlieren at the z = 0.054 m cross sections at the edge of the plate. The results show that the structure and intensity of the separation shock wave were not significantly affected after the actuation was applied. Hence, it can be concluded that actuation in the flow direction can hardly exert a full, spanwise control effect. In subsequent studies, the coupled layout of actuators in spanwise and flow directions should be considered to achieve a better control effect.
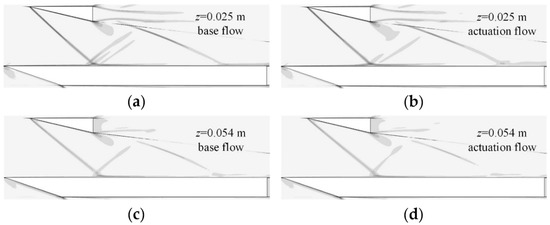
Figure 21.
Numerical schlieren of two cross sections: (a) z = 0.025 m base flow field; (b) z = 0.025 m actuation flow field; (c) z = 0.054 m base flow field; (d) z = 0.054 m actuation field.
Complementarily, the interaction region of the ISWBLI at the y = 0 cross section was also examined. Figure 22a,b shows the velocity contours at the ISWBLI zone with and without actuation. The images show that, after the array actuation was applied, the start of separation at the spanwise middle position moved forward, and the length of the separation zone was increased. At the same time, the length of the separation zone near the edge of the plate was reduced, and the spanwise, affected area of the separation zone was also diminished.
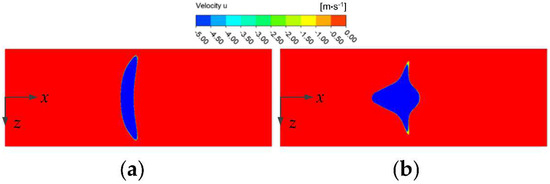
Figure 22.
Velocity contour of ISWBLI y = 0 cross section: (a) base flow field; (b) actuation flow field.
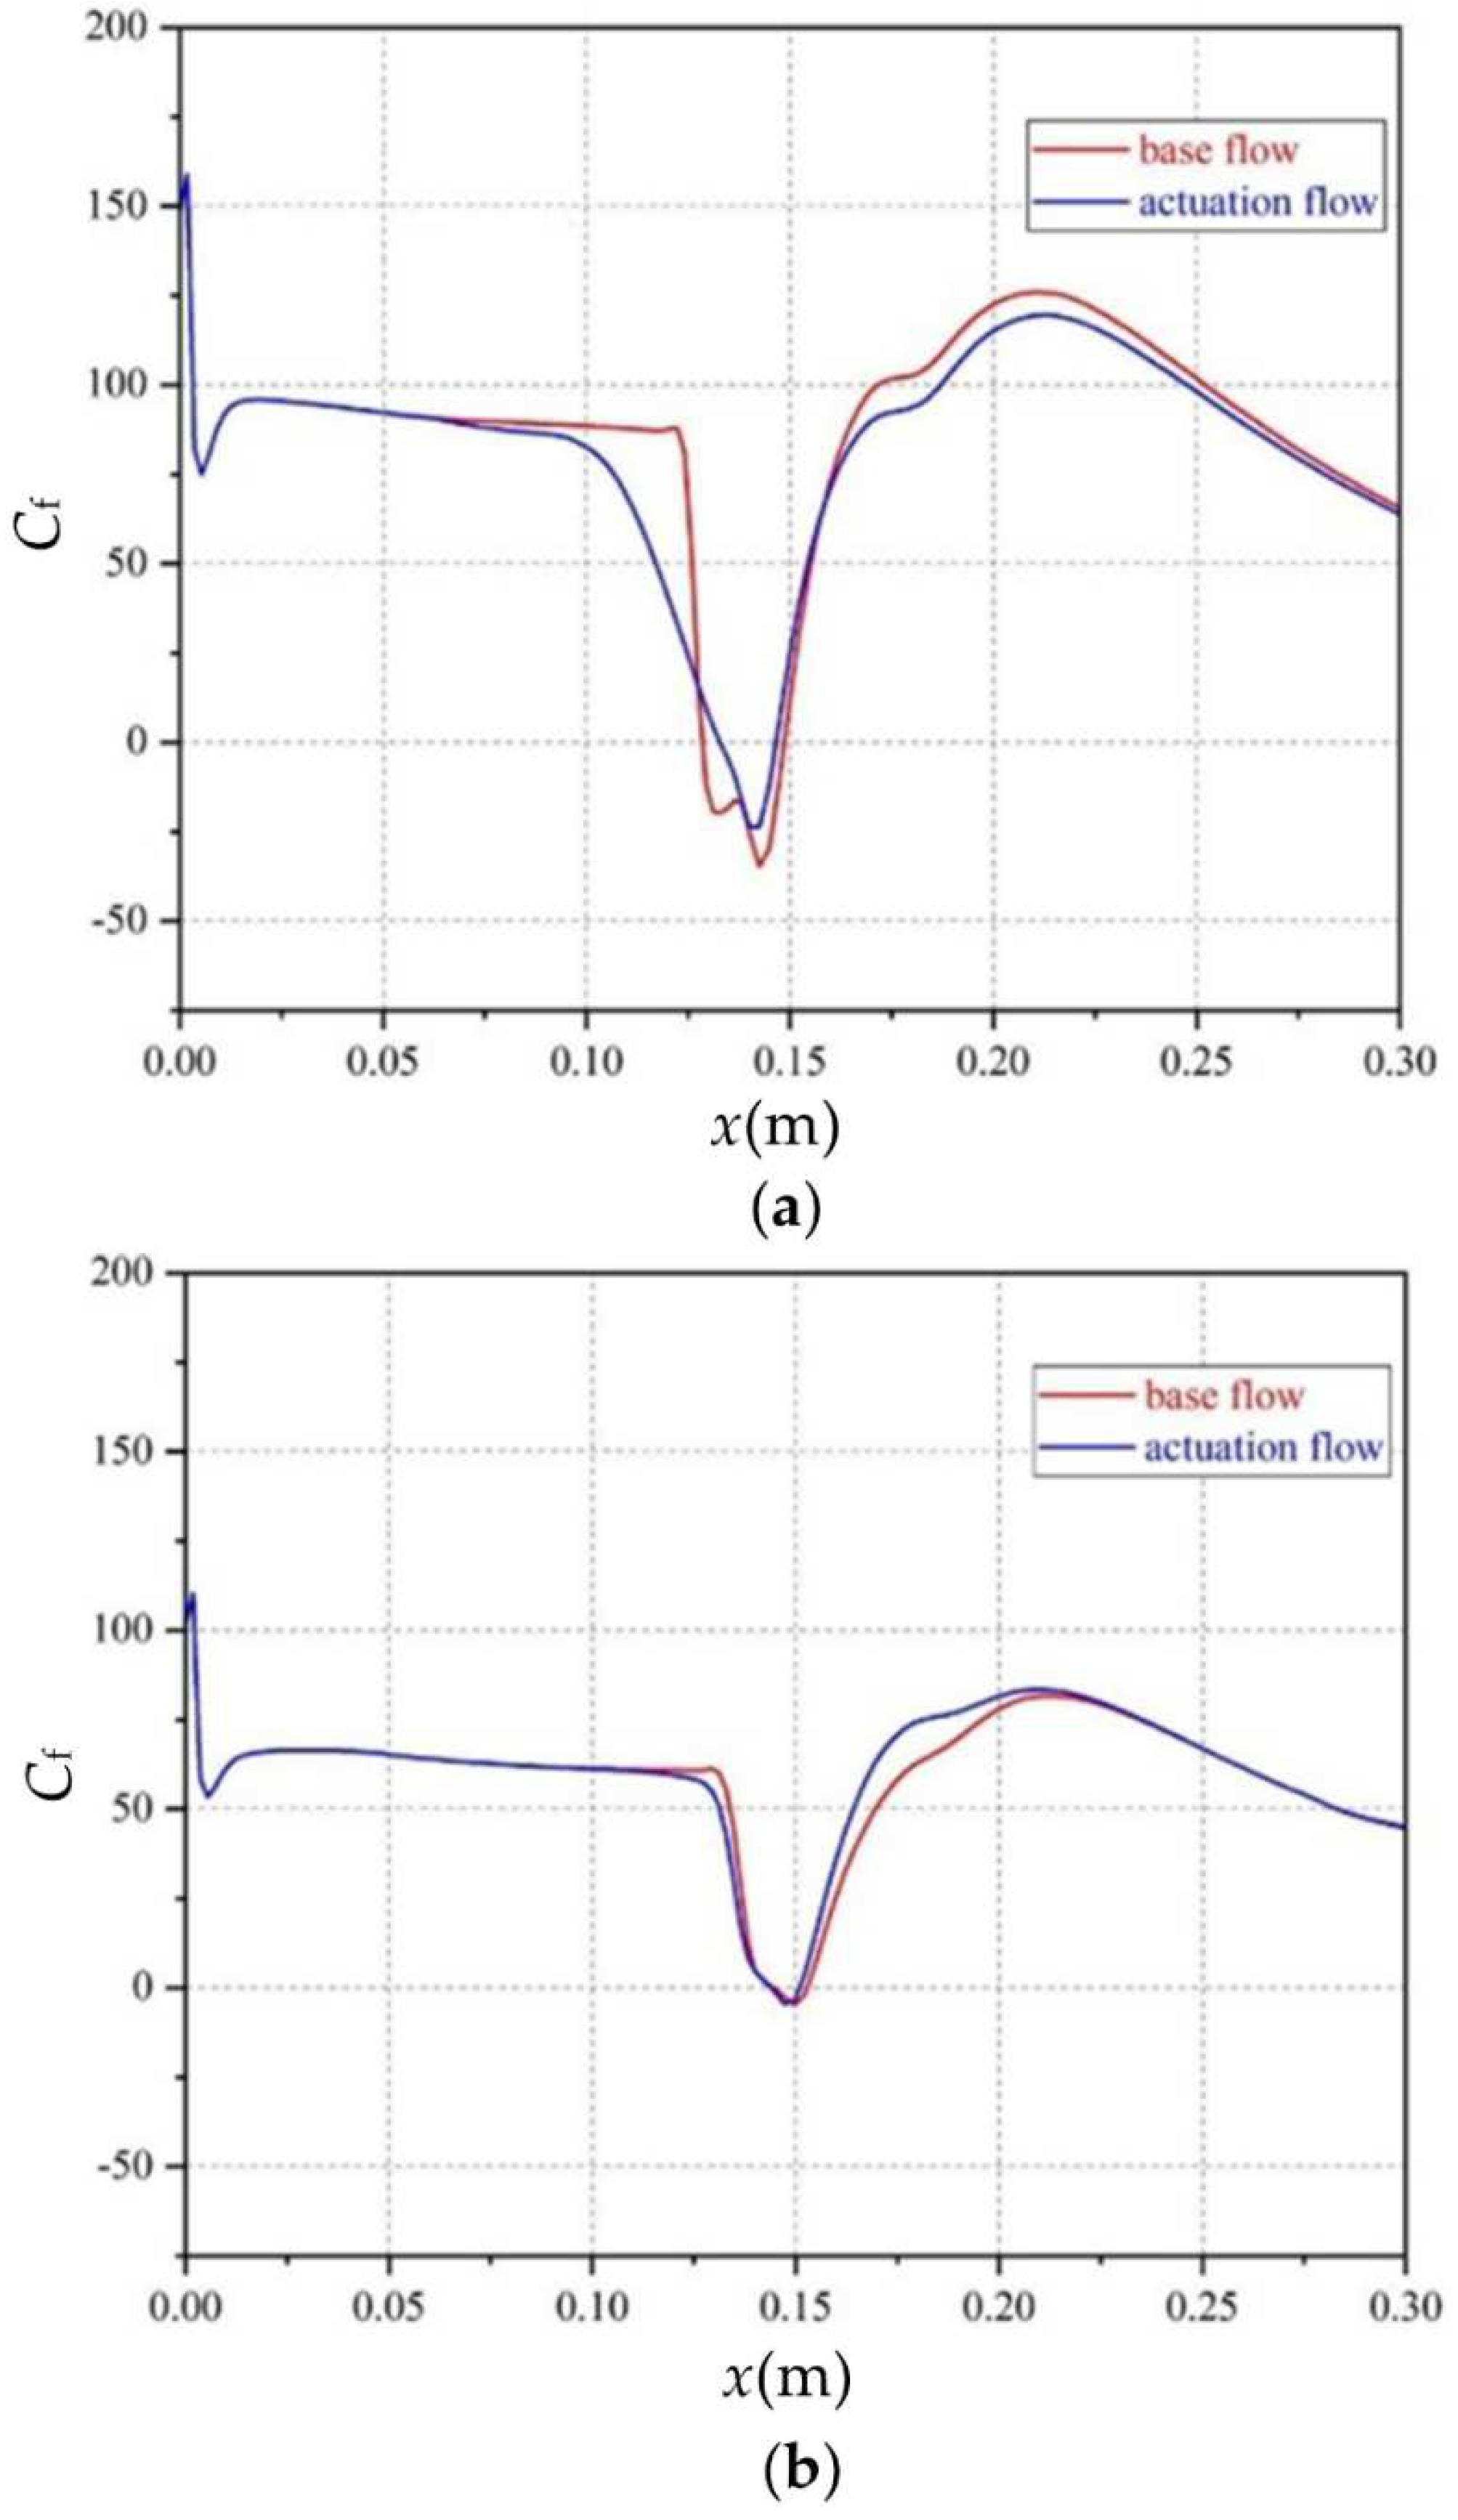
Figure 23 shows the curve of the skin friction coefficient at the z = 0 cross section in the x-direction. The red and blue lines represent the base flow field and the actuation flow field, respectively. After the array actuation was applied, the length of the separation zone at the z = 0 cross section increased from 20 mm to 50 mm, which was an increase of 125%. The start of separation in the base flow field was about 120 mm from the plate’s leading edge, and the start of separation in the actuation flow field moved forward, about 100 mm from the plate’s leading edge. These changes show that array actuation is likely to increase the length of the separation zone at the z = 0 cross section, making the start point of separation move forward.
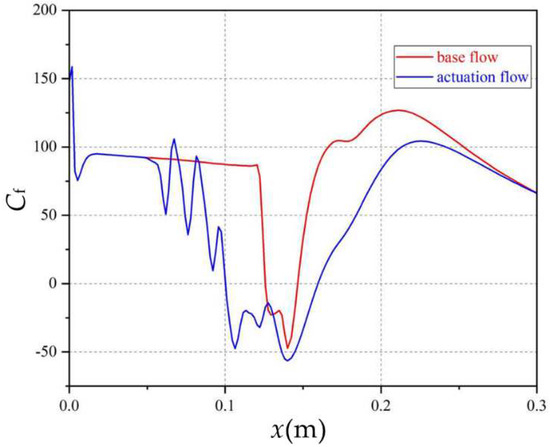
Figure 23.
Skin friction coefficient curve at z = 0 cross section.
The other spanwise cross sections of the flow field were the last to be examined. Figure 24a,b shows the curves of the skin friction coefficient of the flow field with and without actuation at the z = 0.025 m cross section and z = 0.054 m cross section, respectively. At the z = 0.025 m cross section, array actuation resulted in the decreased length of the separation zone, making the separation point move backward. At the z = 0.054 m cross section, the length of the separation zone was close to 0, and the Cf curves with and without actuation tended to be consistent. This result indicates that plasma actuation has a poor control effect over the separation zone at the edge of the plate.
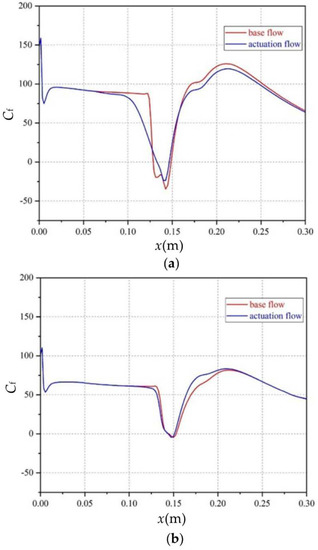
Figure 24.
Skin friction coefficient curve at different spanwise cross sections: (a) z = 0.025 m; (b) z = 0.054 m.
5. Conclusions
In this research, experiments and simulations were carried out to closely examine the control of the ISWBLI through pulsed arc discharge plasma actuation. The high-speed schlieren technology was used to study the control effect of actuation on the shock intensity. The spanwise, three-dimensional characteristics of the flow field with and without actuation were analyzed using the DES method. The major conclusions are presented below:
- (1)
- In the experimental study, the intensity of single-channel actuation was relatively weak. Comparatively, the five-channel array actuation effectively weakened the intensity of the separation shock wave and the reattached shock wave. The incident shock wave did not change significantly under these two forms of actuation;
- (2)
- The numerical simulation results of the base flow field showed that the separation zone of the ISWBLI was crescent shaped, and the length of the separation zone at the middle cross section was longer than that at both sides. The length of the separation zone at the central cross section was about 20 mm; however, the separation zone almost entirely disappeared at the edge of the plate;
- (3)
- The transient simulation results of the single-channel actuation showed that the pulsed arc discharge plasma actuation produced two disturbance forms in the supersonic flow field: the precursor blast wave and the thermal gas bulb. The pressure and temperature contours showed that the disturbance of the thermal gas bulb had a significant effect on the ISWBLI;
- (4)
- Single-channel actuation can only just achieve a control effect over ISWBLI, as there was no significant change in the shock wave structure of the ISWBLI flow field with or without actuation. The length of the separation zone at the central cross section of the plate increased by 3 mm, and the start of separation moved forward by about 2 mm. There was no significant change in the separation zone on both sides of the plate;
- (5)
- The five-channel pulsed arc discharge plasma array actuation could effectively weaken the intensity of the separation shock wave. After the application of actuation, the separation shock wave disappeared in the time-average flow field, and the angle of the reattached shock wave decreased from 34.6° to 30.5°. The application of the array actuation could change the shape of the separation zone; the start of separation moved forward by about 19 mm; and the length increased by 30 mm at the central cross section. It was also observed that the length of the separation zone on both sides was reduced. Furthermore, the array actuation could effectively mitigate the spanwise influence zone in the separation zone.
Author Contributions
C.Z. performed the experimental investigation. Y.L. performed the numerical simulations and analyzed the results; H.L. and S.G. supervised the work and reviewed and edited the manuscript; C.Z. and H.Y. wrote the main manuscript. All authors have read and agreed to the published version of the manuscript.
Funding
This research was founded by the National Science and Technology Major Project (Grant No. J2019-II-0014-0035).
Institutional Review Board Statement
Not applicable.
Informed Consent Statement
Not applicable.
Data Availability Statement
The data and materials are available upon request.
Conflicts of Interest
The authors declare no conflict of interest.
References
- Yamamoto, J.; Kojima, Y.; Kameda, M.; Watanabe, Y.; Hashimoto, A.; Aoyama, T. Prediction of the onset of supersonic inlet buzz. Aerosp. Sci. Technol. 2020, 96, 105523. [Google Scholar] [CrossRef]
- Ferrero, A. Control of a Supersonic Inlet in Off-Design Conditions with Plasma Actuators and Bleed. Aerospace 2020, 7, 32. [Google Scholar] [CrossRef] [Green Version]
- Titchener, N.; Babinsky, H. Shock wave/boundary-layer interaction control using a combination of vortex generators and bleed. AIAA J. 2013, 51, 1221–1233. [Google Scholar] [CrossRef]
- Trapier, S.; Duveau, P.; Deck, S. Experimental study of supersonic inlet buzz. AIAA J. 2006, 44, 2354–2365. [Google Scholar] [CrossRef]
- Chen, H.; Tan, H.J.; Zhang, Q.F.; Zhang, Y. Throttling Process and Buzz Mechanism of a Supersonic Inlet at Overspeed Mode. AIAA J. 2018, 56, 1–12. [Google Scholar] [CrossRef]
- Herrmann, C.; Koschel, W. Experimental investigation of the internal compression inside a hypersonic intake. In Proceedings of the 38th AIAA/ASME/SAE/ASEE Joint Propulsion Conference & Exhibit, Indianapolis, IN, USA, 7–10 July 2002; p. 4130. [Google Scholar]
- Zhang, Y.; Tan, H.; Du, M.; Wang, D.P. Control of shock/boundary-layer interaction for hypersonic inlets by highly swept microramps. J. Propuls. Power 2015, 31, 133–143. [Google Scholar] [CrossRef]
- Xie, W.Z.; Wu, Z.M.; Yu, A.Y.; Guo, S. Control of severe shock-wave/boundary-layer interactions in hypersonic inlets. J. Propuls. Power 2018, 34, 614–623. [Google Scholar] [CrossRef]
- Babinsky, H.; Ogawa, H. SBLI control for wings and inlets. Shock Waves 2008, 18, 89–96. [Google Scholar] [CrossRef]
- Gruhn, P.; Gülhan, A. Experimental investigation of a hypersonic inlet with and without sidewall compression. J. Propuls. Power 2011, 27, 718–729. [Google Scholar] [CrossRef]
- Häberle, J.; Gülhan, A. Experimental investigation of a two-dimensional and a three-dimensional scramjet inlet at Mach 7. J. Propuls. Power 2008, 24, 1023–1034. [Google Scholar] [CrossRef]
- Zhang, Y.; Tan, H.; Sun, S.; Rao, C.Y. Control of cowl shock/boundary-layer interaction in hypersonic inlets by bump. AIAA J. 2015, 53, 3492–3496. [Google Scholar] [CrossRef]
- Vignesh Ram, P.S.; Das, S.; Kim, H.D. Influence of vortex generator on cylindrical protrusion aerodynamics at various Mach numbers. Aerosp. Sci. Technol. 2016, 58, 267–274. [Google Scholar]
- Titchener, N.; Babinsky, H.; Loth, E. The effects of various vortex generator configurations on a normal shock wave/boundary layer interaction. In Proceedings of the 51st AIAA Aerospace Sciences Meeting including the New Horizons Forum and Aerospace Exposition, Grapevine, TX, USA, 7–10 January 2013; p. 18. [Google Scholar]
- Huang, J.B.; Xiao, Z.X.; Fu, S.; Zhang, M. Study of control effects of vortex generators on a supercritical wing. Sci. China Technol. Sci. 2010, 53, 2038–2048. [Google Scholar] [CrossRef]
- Yan, Y.; Chen, L.; Li, Q.; Liu, C. Numerical study of micro-ramp vortex generator for supersonic ramp flow control at Mach 2.5. Shock. Waves 2017, 27, 79–96. [Google Scholar] [CrossRef]
- Saad, M.R.; Zare-Behtash, H.; Che-Idris, A.; Kontis, K. Micro-ramps for hypersonic flow control. Micromachines 2012, 3, 364–378. [Google Scholar] [CrossRef]
- Grébert, A.; Bodart, J.; Jamme, S.; Joly, L. Simulations of shock wave/turbulent boundary layer interaction with upstream micro vortex generators. Int. J. Heat Fluid Flow 2018, 72, 73–85. [Google Scholar] [CrossRef] [Green Version]
- Bagheri, H.; Mirjalily, S.A.A.; Oloomi, S.A.A.; Salimpour, M.R. Effects of micro-vortex generators on shock wave structure in a low aspect ratio duct, numerical investigation. Acta. Astronaut. 2021, 178, 616–624. [Google Scholar] [CrossRef]
- Panaras, A.G.; Lu, F.K. Micro-vortex generators for shock wave/boundary layer interactions. Prog. Aerosp. Sci. 2015, 74, 16–47. [Google Scholar] [CrossRef]
- Oorebeek, J.; Nolan, W.; Babinsky, H. Comparison of bleed and micro-vortex generator effects on supersonic boundary-layers. In Proceedings of the 50th AIAA Aerospace Sciences Meeting Including the New Horizons Forum and Aerospace Exposition, Nashville, TN, USA, 9–12 January 2012; p. 45. [Google Scholar]
- Wang, J.J.; Choi, K.S.; Feng, L.H.; Jukes, T.N.; Whalley, R.D. Recent developments in DBD plasma flow control. Prog. Aerosp. Sci. 2013, 62, 52–78. [Google Scholar] [CrossRef]
- Moreau, E. Airflow control by non-thermal plasma actuators. J. Phys. D Appl. Phys. 2007, 40, 605. [Google Scholar] [CrossRef]
- Choi, K.S.; Jukes, T.; Whalley, R. Turbulent boundary-layer control with plasma actuators. Philos. Trans. Royal Soc. A 2011, 369, 1443–1458. [Google Scholar] [CrossRef] [PubMed]
- Zong, H.; Chiatto, M.; Kotsonis, M.; De Luca, L. Plasma synthetic jet actuators for active flow control. Actuators 2018, 7, 77. [Google Scholar] [CrossRef] [Green Version]
- Narayanaswamy, V.; Raja, L.L.; Clemens, N.T. Control of a shock/boundary-layer interaction by using a pulsed-plasma jet actuator. AIAA J. 2012, 50, 246–249. [Google Scholar] [CrossRef]
- Narayanaswamy, V.; Raja, L.L.; Clemens, N.T. Control of unsteadiness of a shock wave/turbulent boundary layer interaction by using a pulsed-plasma-jet actuator. Phys. Fluids 2012, 24, 076101. [Google Scholar] [CrossRef] [Green Version]
- Kara, K.; Kim, D.; Morris, P.J. Flow-separation control using sweeping jet actuator. AIAA J. 2018, 56, 4604–4613. [Google Scholar] [CrossRef]
- Kinefuchi, K.; Starikovskiy, A.Y.; Miles, R.B. Numerical investigation of nanosecond pulsed plasma actuators for control of shock-wave/boundary-layer separation. Phys. Fluids 2018, 30, 106105. [Google Scholar] [CrossRef] [Green Version]
- Yan, H.; Liu, F.; Xu, J.; Xue, Y. Study of oblique shock wave control by surface arc discharge plasma. AIAA J. 2018, 56, 532–541. [Google Scholar] [CrossRef]
- Tang, M.; Wu, Y.; Guo, S.; Sun, Z.; Luo, Z. Effect of the streamwise pulsed arc discharge array on shock wave/boundary layer interaction control. Phys. Fluids 2020, 32, 076104. [Google Scholar] [CrossRef]


Publisher’s Note: MDPI stays neutral with regard to jurisdictional claims in published maps and institutional affiliations. |
© 2022 by the authors. Licensee MDPI, Basel, Switzerland. This article is an open access article distributed under the terms and conditions of the Creative Commons Attribution (CC BY) license (https://creativecommons.org/licenses/by/4.0/).