Article

Development of Static Test Equipment and a System for Lever-Loaded Air Springs

School of Traffic and Vehicle Engineering, Shandong University of Technology, Zibo 255000, China
*
Author to whom correspondence should be addressed.
Actuators 2024, 13(7), 231; https://doi.org/10.3390/act13070231
Submission received: 14 May 2024 / Revised: 15 June 2024 / Accepted: 18 June 2024 / Published: 22 June 2024

Abstract

:
In light of the heavy load applied by traditional air spring test equipment and its complex structural system design, a lever-type torque loading air spring test system is designed. It adopts the principle of Chinese scales to apply the load on the air spring in the form of proportional amplification, which can apply a simulated load on the air spring of 500–800 kg, using the vertical sliding shaft as the transverse limit to make the air spring elongate and compress by 280 mm in the longitudinal direction. The measurement and control system of the test equipment is then developed based on the LabVIEW platform, and the required sensors are selected and installed. The system can achieve real-time data acquisition of the air pressure, load, height and other parameters of the air spring and air spring charging and discharging control. Following the debugging of the function of the test equipment, the function of each subsystem is normal and able to meet the requirements of air spring characteristic and pressure tightness tests. For small spaces, such as laboratories, by reducing the installation of hydraulic and other oil source systems, avoiding the use of large mass blocks to simulate the loading of air spring loads and optimizing the complex installation and debugging process, this miniaturized design for air spring test equipment has benefits for practical applications.

1. Introduction

Air suspension is a form of suspension that is commonly selected for high-end commercial vehicles. Compared with other commonly used types of suspension, it contains air springs in the assembly, so it has the advantages of adjustable and controllable stiffness, a lower natural frequency, and good vibration and sound insulation, which enables vehicles loaded with air springs to offer a better riding experience and improved driving quality [1]. The research and development of air springs in China is at a relatively early stage. However, it is worth noting that due to the state of development of relevant production technologies in the automobile industry, especially the shortcomings of rubber synthetic materials related to air springs, the mass production of domestic air springs is still in its infancy [2]. A large number of researchers have performed the mathematical modeling of air springs using computer numerical analysis software [3,4] and have analyzed the inherent characteristics of air springs with the help of finite element simulation software [5,6]. However, the performance of air springs is affected by multiple factors, such as the synthetic materials used, the production processes and the production batches [7]. In the actual production process, the designed air spring requires a large number of tests to determine the practical performance of the air spring with the help of relevant test equipment after trial production. In the course of testing, a key issue is the application of the simulated load. Under the loading condition of the air spring, the load comes from the car body and other related spring equipment, and the load is constant but the value is large. At present, scholars and manufacturers often use hydraulic cylinders or electric cylinders as the active load in equipment design [8,9], which need to be equipped with a perfect energy and control system, involving a complex structure. Alternatively, large mass blocks can be used to simulate body loading [10], which results in the overall equipment being heavy, as shown in Figure 1. Accordingly, it would be of value to design a kind of test equipment which can increase the load but with a reduced volume.
In this work, special test equipment for lever-type torque loaded air springs is developed. It is designed for use in small spaces, such as laboratories, which avoids the requirement for the hydraulic and other energy systems used in mainstream air spring test equipment described above, or the use of large masses to simulate air spring loads, and which optimizes the complex design structure and debugging process. In addition, the test equipment can analyze the real-time state of the air spring using real-time data collected by the sensor and can complete the characteristic and pressure tightness tests of the air spring. Moreover, it combines the target working mode planning of the test equipment and uses LabVIEW to complete the development of the control system and data analysis and other functions.

2. Design Requirements for Test Equipment
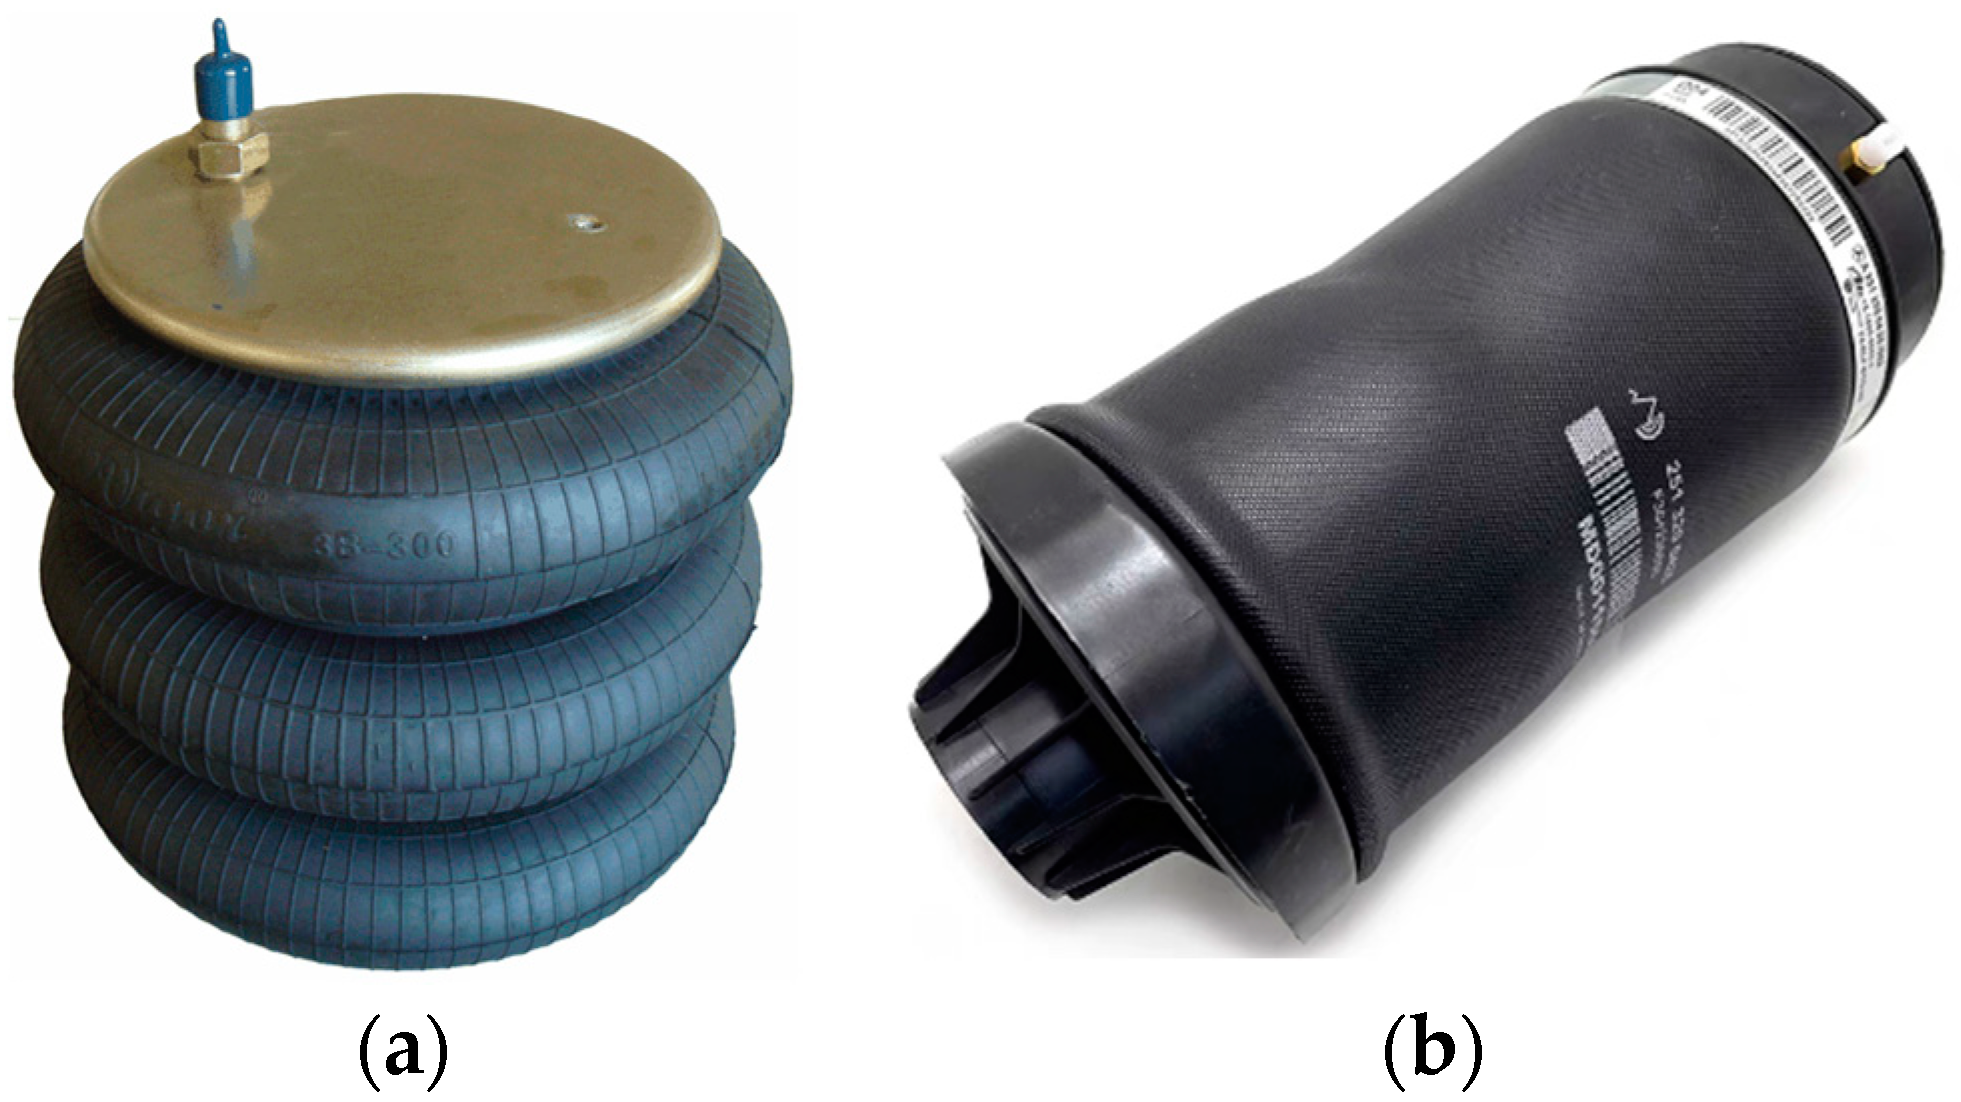
2.1. Test Subjects

The device only conducts tests for the membrane air springs, and mainly verifies the accuracy of the air springs and the performance data provided by the responsible party through the equipment. The maximum load of a single air spring of an automobile or light truck is between 500 and 800 kg. The structural design of the test equipment can meet the requirements of performance testing and can achieve testing of different air springs. An air spring has excellent nonlinear characteristics, and its spring stiffness changes with a change in load mass. It can maintain a stable natural frequency under different loads. Its load capacity can be varied by changing the air pressure inside the cavity, so it can adapt to a variety of load needs. The structure of the air spring mainly comprises a capsule air spring and a membrane air spring, as shown in Figure 2. Their working characteristics are different. The former uses capsule deformation to maintain the stability of the body. When compressed, the capsule wall will fold and the effective diameter will increase rapidly, so the stiffness and natural frequency will be higher, subjecting the body to continuous large vibrations, so the current bladder air spring is less used in vehicles. In contrast to this, in a membrane air spring, which mainly uses the pressure in the capsule to make its edge sink into the groove of the upper and lower covers, the structure is more compact and the height of its installation is lower, which effectively reduces the height of the body, enabling the vehicle to exhibit better dynamic performance.
According to the requirements of the project, the diaphragm air spring is tested according to the relevant standards in the industry. Based on existing research [11,12,13], its vertical stiffness is:
k = ( P P 0 ) d A d x + m P A 2 V
Wherein P represents the pressure inside the air spring chamber; P 0 represents the indoor air pressure; A represents the effective area of the air spring; x represents the vertical displacement of the air spring; V represents the volume of the air spring chamber; and m represents the mass of air inside the air spring chamber.
The above equation suggests that its vertical stiffness is mostly dependent on the pressure inside the chamber P , the rate of change of effective bearing area with vertical displacement d A / d x , and the initial volume of the air spring chamber. To ensure the accuracy of the verification of the air spring characteristics, it is necessary to measure important physical quantities such as the load, pressure, and vertical displacement of the air spring and to monitor the changes in these physical quantities in real time, thus ensuring a more ideal experimental effect.

2.2. Design Plan

According to the pre-set test function, a special lever-type torque-loaded dynamic and static performance test device for air springs is designed. The design of our test device roughly includes test equipment mechanical system design and measurement and control system design. The mechanical part of the test equipment applies a load via lever-type torque loading and installs the air spring between the upper and lower baffles, featuring a linear bearing with a sliding fit on the sliding shaft to realize the elongation and compression of the air spring during the charging and discharging process. An air pump, air storage tank and air distribution valve in the test equipment are adopted to provide compressed air for the air spring. The state of the air spring in the test is detected by the force sensor, height sensor and air pressure sensor and transmitted to the host computer software in real time via CAN communication. The upper computer control system outputs the air distribution valve control signal to control the air spring according to the control strategy adopted. As shown in Figure 3—the mechanical structure assembly drawing—the devices and layout methods used in this test equipment completely reproduce the suspension layout of some passenger cars using air springs at present, enabling us to complete an air spring characteristic test, an adjustable loading charging and discharging test and various verification tests under different control strategies.

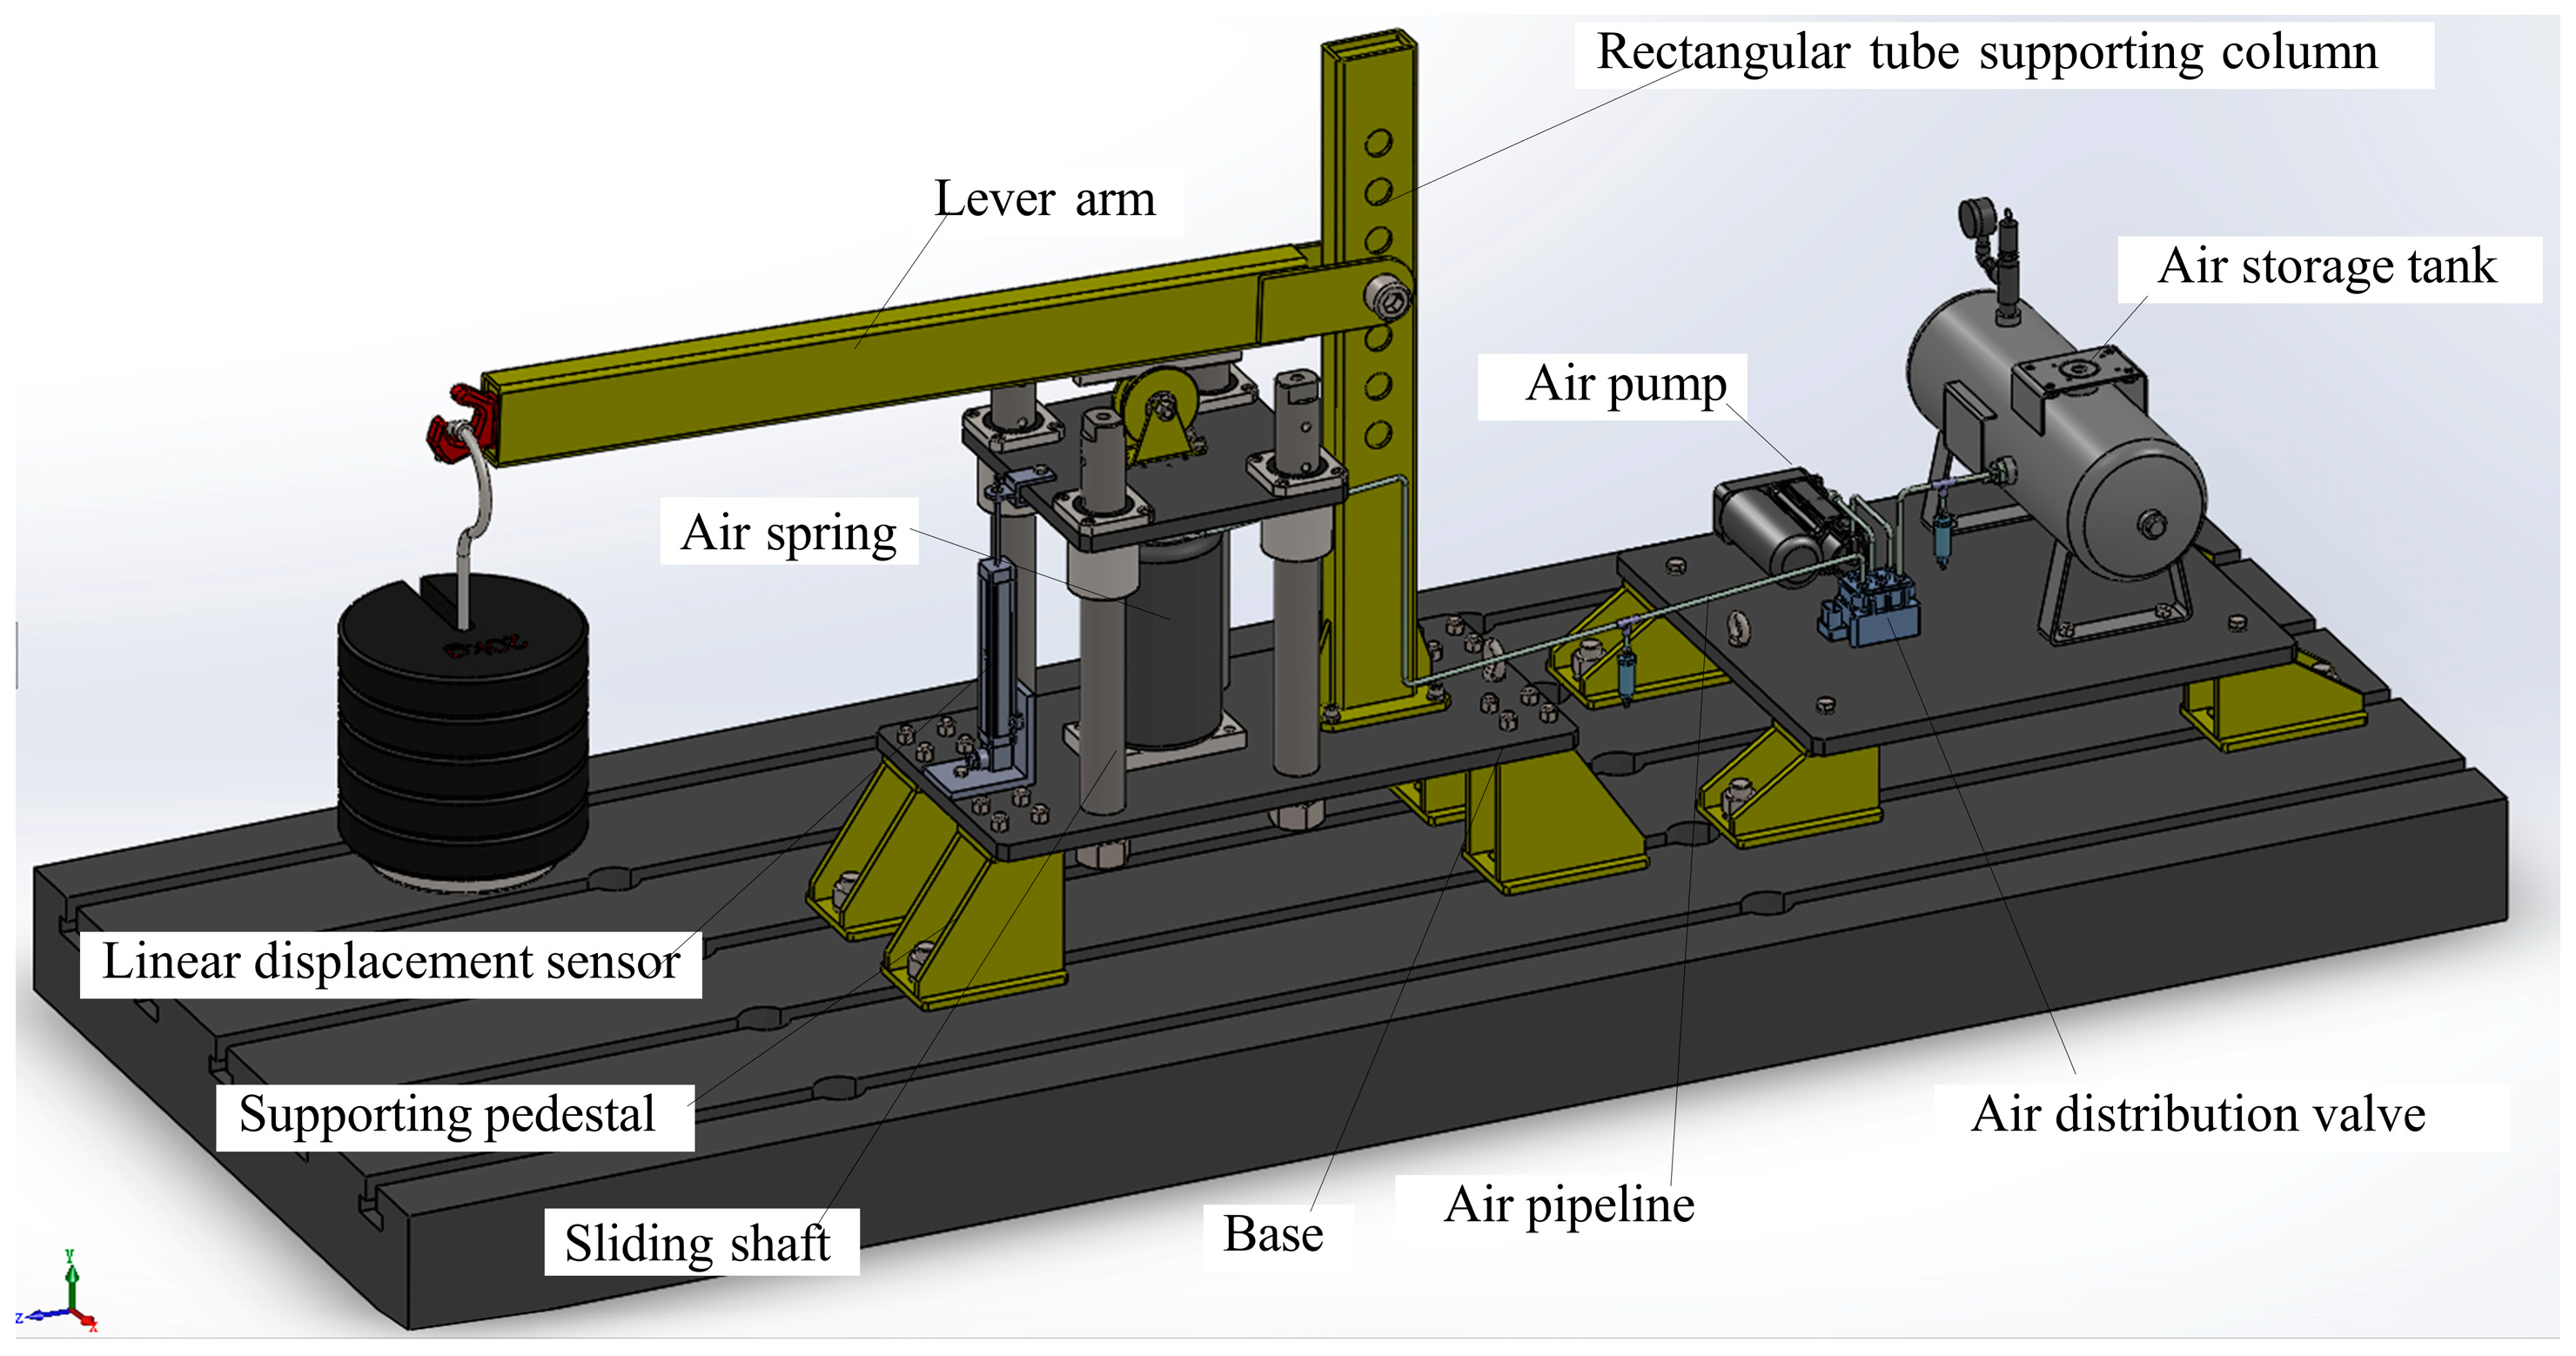
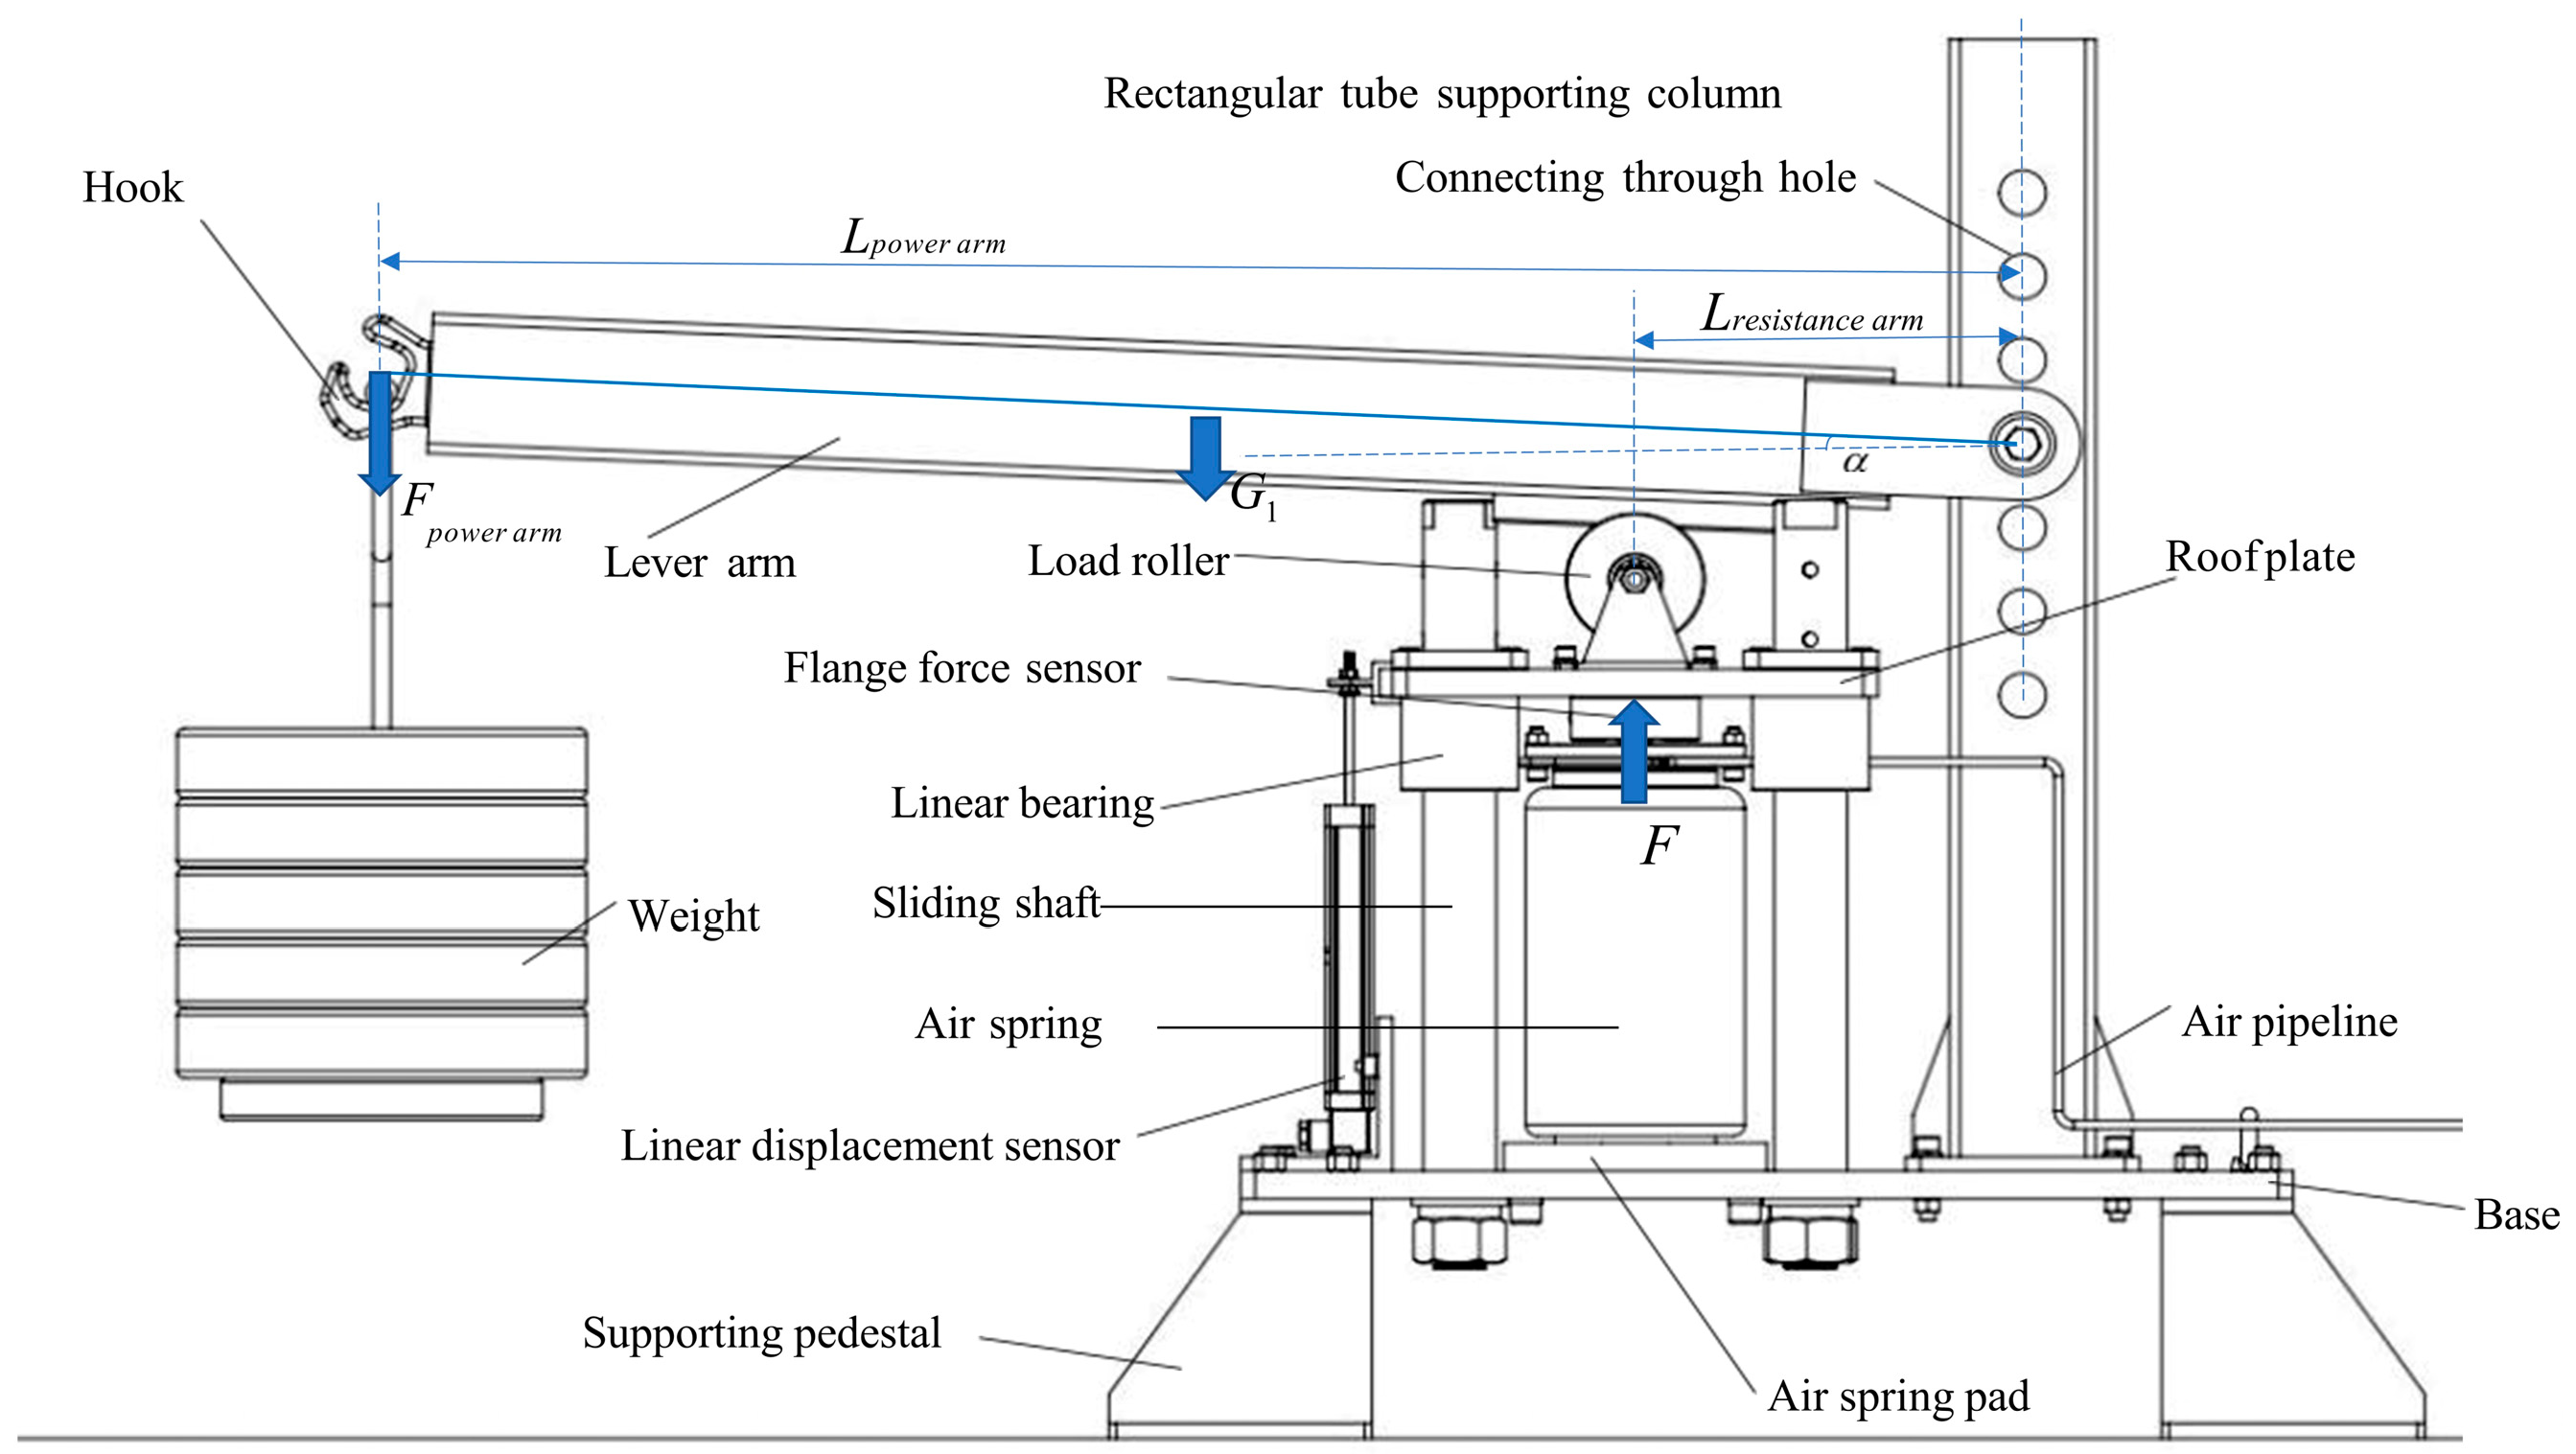
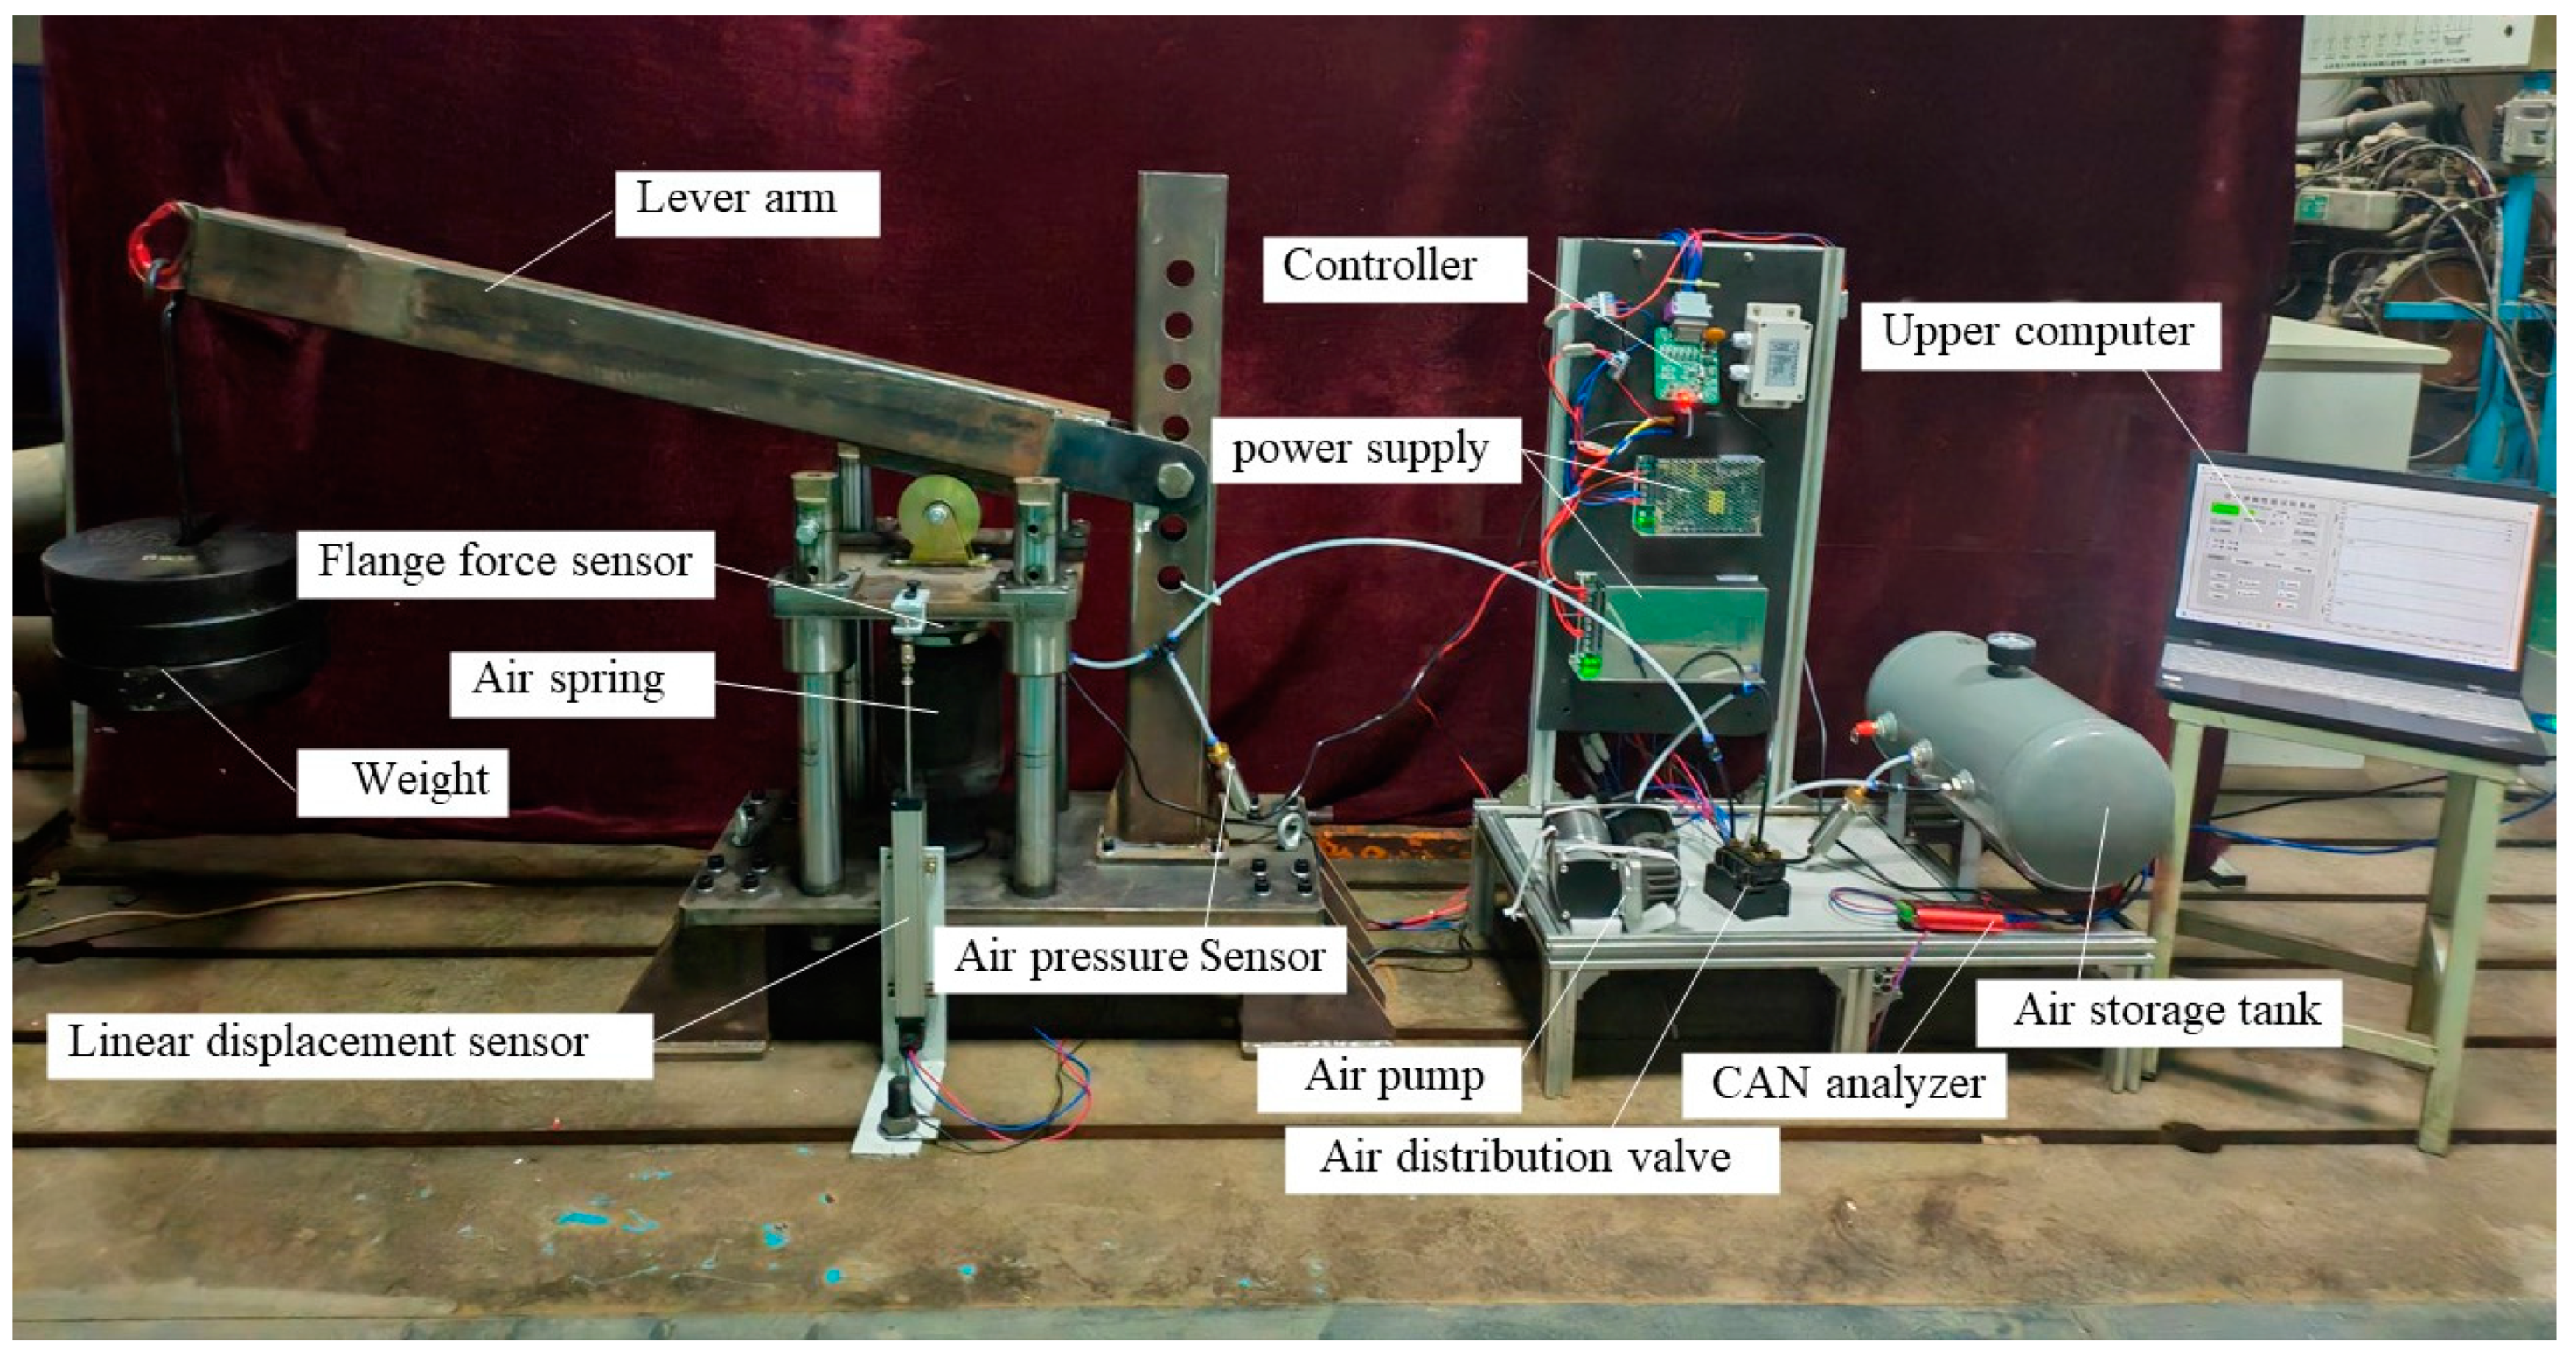
3. Mechanical System Design

3.1. Leveraged Load Loading System

Based on the weighing principle of the Chinese scale, special test equipment which can apply the lever ratio magnifying load to the test air spring is designed [14], as shown in Figure 4. This figure demonstrates load assembly and the load platform, which is basically composed of a bottom plate, a support column, a load transverse arm and the load weight, and the bottom plate is fixedly connected to the cast iron platform by T-shaped bolts, playing a supporting role. The supporting column adopts a rectangular pipe structure and is fixedly connected to the equipment base plate by bolts, and the upper end of the supporting column is provided with connecting through-holes of different heights to connect the lever arm. One end of the utility model is hinged to the connecting through-hole of the supporting column, and the other end can be loaded with different load weights. A load roller is fixed under the lever arm, and the vertical force above the roof is always maintained by the load roller. The upper roof of the load has a vertical sliding shaft as the horizontal limit and the support releases the vertical degrees of freedom at the same time, which ensures that the air spring can stretch freely longitudinally under the load. This design enables our test equipment to amplify the load applied on the air spring using the lever principle, thus effectively analyzing and verifying the working characteristics of the air spring.
The lever arm is taken as the research object, as shown in Figure 4. In the process of charging and discharging the air spring, the roof slides longitudinally under the constraint of the sliding shaft, while the weight of the flange force sensor is essentially derived from the weight under the lever arm and the weight of the roof and the load pulley, namely:
F = F p 1 + F p 2 + G 2
wherein G 2 represents the equivalent weight of the roof plate and load pulley; F represents the weight borne by the force sensor; F p 1 represents the weight borne by the load pulley when the counterweight is loaded and the lever arm is pressed down; and F p 2 represents the weight borne by the load pulley when the lever arm is pressed down due to its own weight.
When the air spring reaches a steady-state equilibrium, the lever balance equation is expressed as:
L r F r = L p F p
wherein F p represents the weight borne by the hook, i.e., the weight of the load; L p represents the horizontal distance from the hook to the axis of the rectangular tube connecting the lever arm and the support column when the load is applied; and L r represents the horizontal distance from the center of the load pulley to the axis of the rectangular tube connecting the lever arm and the support column.
In lever arm design, the ratio of the resistance arm to the power arm is determined when the lever arm is horizontal.
L r / L p = 1 / 4
When the air spring is charged and discharged, the resistance arm L p does not change.
L cos α F p = L 4 F r 1
L 2 cos α G 1 = L 4 F r 2
wherein G 1 represents the lever arm assembly weight; L represents the lever arm length.
The height of the air spring is z when the lever arm is horizontal, and the height of the air spring is z a when charging and discharging are completed to reach equilibrium:
tan α = | z a z | L r = 4 | z a z | L
Solving Equations (2)–(7), the weight borne by the force sensor is obtained.
F = 2 cos arctan 4 | z a z | L 2 F p + G 1 + G 2
According to the actual working conditions and the test requirements of the air spring, the maximum load of a single air spring is about 800 kg. Considering that the lever ratio of the lever arm is 1:4, the vertical load applied at the hook is 2000 N. The maximum equivalent stress and maximum deformation of the static characteristics are shown in Figure 2. According to Figure 5a, the maximum stress of the lever arm is 76.536 MPa, which is much less than the yield stress (235 MPa) of ordinary carbon steel used in the lever arm, indicating that the strength of the lever arm meets the requirements, including the safety and availability requirements. According to Figure 5b, the maximum deformation of the lever arm is 0.30034 mm; the amount of deformation is almost negligible and the maximum deformation appears at the hook. In addition, from the hook of the lever arm to the connecting hole, the deformation gradually decreases until it is reduced to 0 mm, indicating that the lever arm satisfies the strength requirements.
Similarly, the rectangular pipe of the supporting column was analyzed; the maximum stress is 17.419 MPa, the maximum deformation is 0.0059386 mm, and the maximum deformation appears at the upper edge of the connecting through hole. From the top of the support column to the bottom, the average position deformation is small, except for the connection through hole. As shown in Figure 6, the strength of the rectangular tube with a supporting column meets the design standard.

3.2. Air Spring Charging and Discharging System

In the charging and discharging process of the air spring, the air spring can be raised and reduced by controlling the air pump and the air distribution valve to make the air flow into or out of the air spring through the air distribution valve. As shown in Figure 7, the air pump, air distribution valve, air spring, and air reservoir are all used in a vehicle model equipped with air springs, which facilitates the feasibility verification of the subsequent air spring height adjustment strategy. The charging and discharging process of air springs involves the theory of thermodynamics and fluid mechanics. In order to realize the modeling of the charging and discharging process of air springs, it is necessary to remove the subtle factors that affect the system first and assume the following are true.
Hypothesis 1.
The test subject is a membrane air spring, and the effective area change rate of the air spring during the charging and discharging process is negligible.
Hypothesis 2.
During the test, the air in the air spring cavity, the air tank and the pipeline is regarded as ideal air during the charging and discharging process, the changes in kinetic energy and potential energy are not considered, and the internal air is uniform.
Hypothesis 3.
There is no loss of air flow in the system during the charging process of the air spring.
Hypothesis 4.
The air distribution valve is equivalent to a thin-walled small hole.
Hypothesis 5.
The volume of the air storage tank is large and it contains high-pressure air, so the pressure change in the air tank is almost negligible when the air spring is charged once, and the air is simplified to an ideal high-pressure air source with constant pressure.
According to Hypothesis 1, the relationship between the mass loaded on the air spring and its internal air pressure is:
F = ( P P 0 ) A 0
wherein A 0 represents the effective area of the air spring.
First, the air spring is taken as the subject of study, and according to Hypothesis 2 and by the first law of thermodynamics [15],
d Q + d W + d H = d U
wherein Q represents the heat exchanged between the air spring and the outside world; W represents the work done by the air spring when it is raised or lowered; H represents the energy introduced by the air spring when it is charged and discharged; and U represents the energy added by the air spring.
The rise or fall of an air spring is a fast process, and it can be considered that the temperature in the air spring does not change; i.e., the heat transferred, Q, in this process is equal to zero.
d Q = K ( T 1 T 0 ) dt
d W = P d V
dH = d m C P T 1
dU = d m C v T 1 + m C V d T 1
wherein K represents the air thermal conductivity; V represents the volume inside the air spring chamber; T 0 represents the initial temperature inside the air spring chamber; T 1 represents the temperature inside the air spring chamber during charging and discharging; m represents the mass of air inside the air spring chamber; C P represents the specific heat capacity of air at constant pressure; and C V represents the specific heat capacity of air at constant volume.
During the process of charging and discharging an air spring, according to the ideal air state equation:
p V = m R T 1
wherein R represents the air constant.
Rearranging Equations (14) and (15), we obtain:
d U = C ν R ( P d V + V d P )
For ideal air, the relationships between C p , C ν and R are as follows:
C p C ν = κ
C p C ν = R
wherein κ represents the air variable coefficient.
The specific enthalpy of the air inflow h i n and outflow h o u t of the spring during the charging and discharging process is:
h i n = h o u t = C P T 1
After rearranging the equation, a mathematical model of the air spring is obtained as:
d P V = κ P dV + κ R T 1 ( q i n q o u t )
According to Hypothesis 3, it can be concluded that:
d P A 0 ( z 0 + z x ) + κ P dz x = κ R T 1 ( q i n q o u t )
wherein z 0 represents the initial height value of the air spring and z x represents the change in height of the air spring during the charging and discharging process.
In the charging and discharging system of the air spring, the inflow or outflow of air is generally achieved by controlling the opening and closing of the air distribution valve. The air distribution valve we used is a kind of vehicle-mounted distribution valve that is widely used for this purpose, and is essentially a kind of on–off valve which is characterized by an upstream high-pressure air source in the distribution valve and pressurized air in the air spring cavity, the pipeline and the cross-sectional area of the air distribution valve’s port. According to Hypothesis 4, the flow into and out of the air spring through the air distribution valve can be expressed as [16]:
q p u , p d = 2 κ + 1 κ + 1 2 ( κ 1 ) κ R T p u S 0 < p d / p u b 2 κ + 1 κ + 1 2 ( κ 1 ) κ R T p u S 1 p d / p u b 1 b 2 b < p d / p u 1
wherein S represents the equivalent cross-sectional area of the air distribution valve, p u and p d represent the upstream and downstream air pressures for the solenoid valve, and b is the critical pressure ratio.
An air storage tank, a fixed-capacity high-pressure air source filled with air springs, is used after compressing the air using an air pump. The maximum air pressure of the air pump used in this test platform is 1.5 MPa, and its main function is to automatically replenish the air to 1.1 MPa when the air pressure in the air storage tank is lower than 0.4 MPa and maintain the pressure in the air storage tank. The charging and discharging process of the air storage tank can be regarded as an adiabatic process, and according to Hypothesis 5, its characteristics can be expressed according to the first theorem of variable mass thermodynamics [17].
κ R T d m 1 d t = V 1 d P 1 d t
wherein m 1 represents the mass of air flowing out of the air tank, V 1 represents the volume of the air tank, and P 1 represents the change in pressure inside the air tank.

4. Measurement and Control System Design

4.1. Measurement and Control Section

The measurement and control system mainly consists of test equipment for measurements and control. The system components include sensors, controlled units, controllers, power supplies, computers (host computers), CAN analyzers, etc. The measurement and control system architecture is shown in Figure 8.
In order to accurately track and measure the vertical height change of the air spring, a pull rod linear displacement sensor is installed between the upper roof and the lower bottom plate by using a lifting lug structure. Extension and compression of the air spring can change the length of the pull rod, allowing measurements of the vertical height of the air spring, and the real-time measured values are fed back to the control system of the test bench. An air pressure sensor is installed on one side of the air spring and the air storage tank, and will detect the air pressure of the air spring and the air storage tank in a timely manner and minimize the inaccuracy of the pressure value caused by the error caused by the air flow. The load cell, which is mounted between the load top plate and the air spring, provides a real-time measurement of the change in the load of the lever arm caused by the change in the height of the air spring, which is beneficial for the accurate analysis of the structural parameters of the air spring according to the load applied above the air spring and the change in the internal air pressure.
As a transmission and control execution unit for measurement data, the controller is the core part of the whole measurement and control system, and mainly includes a voltage analog input module, a control output module and a CAN signal transceiver module. It is connected to a computer through the USBCAN analyzer and communicates with the host computer software to receive and send CAN messages for sensor data signal input and control signal output.
The whole test equipment is powered by a 220 V power supply and uses a transformer to convert the voltage from 220 V to 5 V to provide 5 V power for the sensor assembly. The controlled unit and controller are powered by a high-power 220 V to 12 V power supply. In order to ensure electrical safety and avoid confusion of multiple lines, the sensors, controlled units and controllers are connected to the terminal. The main operating parameters of the selected equipment are shown in Table 1.

4.2. Host Computer Software Design

The host computer software of this test platform was developed by using LabVIEW software, which is a graphical programming language that allows users to create programs by visually connecting functional blocks, which simplifies the programming process and enhances code readability [18]. It provides a wide range of functions and libraries for various design modules, such as data acquisition (DAQ), serial communication, data analysis and visualization, and network communication. In addition, LabVIEW provides users with functions to create and use custom dynamic link libraries (DLLs).
The host computer software was specifically designed for the test platform, and the functional modules include serial communication, data acquisition and processing, data saving, parameter setting, chart display, historical data viewing and so on, as shown in Figure 9. After starting the program, CAN communication is activated by the loop main program of the serial communication module. There are corresponding Boolean control prompts to determine whether communication is activated and whether the data can be sent. Then, the required message data are filtered according to the ID information of sending and receiving messages, and then the message is converted from hexadecimal to decimal and hexadecimal to binary by calling the sub-VI program. The received data are then processed by the parameter setting module, which can display the sensor measurement data of the test equipment and the opening and closing of pumps and distribution valves in real time. Then, the test equipment performs the charging and discharging action according to the test requirements, and the host computer can display the changes in the data waveform and store data in real time. The program framework of the function module of the host computer will be introduced in detail below.

4.2.1. Parameter Settings

The parameters that can be set in the system include the working parameters, the parameters of measurement and correction, and the allowable limit. The data are accurately output and displayed in the form of setting parameters in order to achieve the best test effect. The working parameters include the simulated height position of the air spring and the maximum and minimum pressure of the air storage tank during charging and discharging. The correction coefficient of inspection and measurement indicates if there is an error between the output value of the sensor and the actual value affected by the environment. A range of actual pressure values and analog voltage values are measured via physical measuring instruments and multimeters, and then the measured data are fitted in the form of y = ax + b so as to determine the values of a and b and re-calibrate the data. The allowable limit value refers to the maximum operating limit value during operation. After exceeding this limit, the equipment will stop working and there will be an associated Boolean flashing warning.
The parameter setting module adopts the mode of event structure plus main loop and saves the parameters with the help of parameter read-write sub-VI. The data are saved in the form of a configuration settings (.ini) file. After opening the front panel, the parameter data are automatically extracted and displayed from the configuration settings file; one must click to save the parameter front panel data into the file. The specific program block diagram is shown in Figure 10.

4.2.2. Data Storage

The producer and consumer model in Labview provides a more flexible design process. This mode can not only process data quickly and stably, but also avoid data loss caused by speed mismatch between data acquisition and data processing by making use of the first-in-first-out characteristics of data in the queue [19]. The data storage function part uses this mode to build the program block diagram, as shown in the figure. This mode consists of two parts: the producer loop, which is responsible for adding the real-time data displayed on the front panel to the queue according to the set number of samples per second, and the consumer loop, which is responsible for extracting, processing and saving the data in the queue. There is a fixed storage path for writing in the consumer loop, and two storage formats, CSV and TXT, are available. The specific program block diagram is shown in Figure 11.

4.2.3. Historical Data Extraction

In general, the historical data extraction module mainly includes the functions of early test data fetching, waveform analysis and report generation. This module focuses on introducing the report generation function. The report generation function has a report display interface on the front panel, including the title, test time, test personnel, test overview, test flow and the curve of the extracted data and other parameter settings. The report generation button is selected to generate a word report automatically. The program implementation of this function was designed by a state machine. According to the pre-set commands, the program is divided into five different states, including initialization, waiting, bundling parameters, generation and stop [20]. The specific program block diagram is shown in Figure 12.
In the process of software debugging, there are two problems that are deeply embedded in the system. The corresponding solutions are put forward. The specific problems are as follows: The first is the CAN communication channel congestion problem. The CAN card debugging software verifies that when the baud rate of the CAN channel is set to 500 K, the CAN channel data rate is about 3100 frames per second. When the controller sends data quickly, channel data congestion and the data packet loss phenomenon are more likely. The controller cannot receive the instructions sent by the upper computer; that is, the commands of the upper computer cannot be executed. To address such problems, the data transmission speed of the controller is reduced by 200 frames/s; that is, it is one frame every 5 ms, which is enough to ensure smooth system data acquisition. In addition, in the upper computer software, the command cannot be executed 2 s after the cancel mechanism, and there are related content prompts. The second problem is data processing. The data transmitted by CAN packets are hexadecimal; that is, each byte contains a maximum of 255 data. When the output value exceeds the maximum value, data overflow occurs. That is, two bytes are used in the CAN packet data to output data; the high and low bits are set to prevent data overflow. In addition, for the AD value output by the controller, the data are prone to fluctuations and instability. A low-pass filter is used in the receiving end of the host computer to process the data to ensure the stable output of the data. According to the experimental requirements and a reasonable and compact layout of the test page, the human–computer interaction page is shown in Figure 13.

5. Experiment Verification

5.1. Upper Computer Software Testing

According to the functional requirements required at this stage, the sensor data reading and host computer function in the test equipment are preliminarily tested. The contents tested are as follows [21], and the specific process is shown in Figure 14.
(1)
Test the control instruction parsing of the host computer and the sending and receiving functions of CAN messages;
(2)
Test the accuracy of the pressure value output of the sensor and whether the calibration coefficient is required;
(3)
Test whether the controller can perform the charging and discharging action of the air spring when the host computer performs the button operation;
(4)
Test the module functions of the host computer such as the waveform display, data storage and the historical data viewer.
The specific testing process is shown in the figure below:
Figure 14. Test process diagram.
Actuators 13 00231 g014

5.2. Sensor Pressure Value Calibration

Before the formal experiment, the load cell and pressure sensor were calibrated. Taking the pressure sensor on the air spring side as an example, this pressure sensor is mainly responsible for collecting the pressure data of the air spring. It needs to be calibrated and verified for accuracy to ensure the accuracy of the pressure value collected. According to the calibration data provided in the pressure sensor manual, the relationship between the sensor output voltage V o u t and the air pressure P is:
P = 0.85 V o u t 0.25
The pressure value of the air spring is measured by the pressure gauge and displayed, the output voltage value of the sensor is read in real time by using a multimeter, and the value displayed on the pressure gauge and the voltage value measured by the multimeter are recorded after the pressure is stable. The measured pressure and the actual output voltage obtained are shown in Table 2 after the measurement of ten sets of data; the fitted formula is shown in Figure 15.
The calibration equation is obtained as:
P = 0.8681 V o u t 0.3545
The calibration equation differs slightly from the equation provided in the sensor manual, so it was necessary to recalibrate the air pressure sensor coefficients.

5.3. Building a Model of the Air Spring in AMESim

The air suspension system is an extremely complex nonlinear system, and it is difficult to analyze it by means of mathematical model modeling. AMESim has an extensive model library that covers almost all common systems in the mechanical field, including mechanical, pneumatic, hydraulic and other components [22]. A combination of variable volume pneumatic chamber elements and a pneumatic piston with a fixed body is adopted to model the air spring. The main components of the air spring are shown in Figure 16.
The input signal of the model is the load loading information defined by the dynamic_time_table element, which is the data collected by the flange pressure sensor when the air spring height changes when the input data are 30kg, 50kg and 70kg, respectively. The piston diameter is 140 mm, the air spring length is 160 mm and the initial air pressure is set at 4.5 bar. In addition, AMESim provides a variable batch parameter function, which can analyze the impact on the system when specific parameters are changed [23,24]. The initial air pressure of the air spring and the volume value of the air spring are changed; that is, the length of the air spring is changed during the simulation and the curves obtained are shown in Figure 17 and Figure 18. As can be seen from the figure, the greater the inflation pressure of the air spring, that is, the greater the load at the upper end of the air spring, the greater the stiffness value and the worse the ride loss. The larger the volume of the air spring cavity, the smaller the stiffness value of the air spring and the better the comfort.

5.4. Charging and Discharging Test

Using a short air spring, a vertical static stiffness test of the air spring was conducted; the specific steps are as follows:
(1)
Turn on the host computer, controller and power supply equipment to ensure that the test can be carried out normally.
(2)
Apply a 30 kg weight to the hook, inflate the air spring so that the lever arm is in a horizontal position and record the pressure value and load value in the air spring.
(3)
Use an air pump to slowly charge and discharge the air spring and save the data; the compression elongation stroke of the air spring is ±50 mm.
(4)
Add 20 kg and 40 kg weights, respectively, perform multiple charging and discharging tests and save data.
(5)
Filter the data and process them to obtain a smooth data curve.
(6)
Use AMESim software to carry out a simulation; the effective diameter of the simulation is set to 130 mm according to the measured air spring data. Considering that there is a certain error in the measurement process, rather than the actual working length, the length of the cylinder is set to 180 mm and the initial pressure is 1.65 bar, 2.4 bar and 3.2 bar.
The change in the air spring rate value with height is obtained by processing the test data and the simulation data, as shown in Figure 19. Obviously, the elongation and compression of the air spring are within the stroke range. The test data of 30 kg, 50 kg and 70 kg loaded weights are consistent with the simulation data, indicating that the simulation in AMESim software is in line with the actual situation and the equipment meets the requirements of the test. According to the analysis of multiple sets of data, the main reason for the error is that the effective area of the air spring changes greatly in the actual working conditions, while the effective area change rate of the air spring in the simulation does not change by default. In addition, it is possible that the mechanical vibration during inflation and deflation has an effect on the detection of the actual value of the air spring, resulting in distortion of the collected data.
Based on the preliminary test and simulation results, the air spring was charged and deflated many times and an air spring model was built in AMESim software. The experimental data and simulation data were compared and analyzed, indicating the feasibility of the air spring experiment equipment and providing a wide range of air spring simulation loads. Multiple types of air springs can be tested and a better range of options for air spring matching suspension systems can be provided. In addition, the design of the experimental equipment not only meets the requirements, but also greatly reduces the equipment volume, increases the equipment quality, makes the disassembly and handling of the test bench more flexible, reduces the manufacturing costs and improves the use efficiency of the test device. The assembly of the test equipment is shown in Figure 20.

6. Conclusions

(1)
In order to meet requirements of the project, the designed test equipment optimized the problem of load application at the upper end of the air spring with lever-type torque loading, avoided using an oil source and the installation of a large mass, reduced costs, improved the safety and provided a solution for the miniaturization and simplification of laboratory equipment.
(2)
Using the graphical programming advantages of LabVIEW, an air spring measurement and control system was designed; module functions, such as test data acceptance and processing, waveform display, saving, and report generation, were executed; and the air filling and deairing control of the air spring was achieved.
(3)
The test process was introduced and a simple air spring model was established in AMESim. The simulation data obtained were analyzed and compared with the actual test data, which proved that the test equipment could meet the technical requirements of the air spring characteristic test, providing a test basis for the performance analysis of air spring products and the subsequent development of air spring height control strategies.

Author Contributions

Conceptualization, Y.Z.; methodology, Y.Z. and S.Z.; software, S.Z.; validation, S.Z., B.Q. and X.T.; resources, S.Z.; data curation, S.Z.; writing—original draft preparation, Q.Z.; writing—review and editing, Y.Z.; visualization, S.Z. All authors have read and agreed to the published version of the manuscript.

Funding

This research was supported by the Natural Science Foundation of China (12202252), the Natural Science Foundation of Shandong Province (ZR2022QE018), and the Key Technology R&D and Industrialization Project of Automotive Intelligent Suspension System of Shandong Province (2023CXGC010211).

Data Availability Statement

Data available on request from the authors.

Conflicts of Interest

The authors declare no conflicts of interest.

References

  1. Aboazoum, A. An overview of the most common vehicle suspension problems. Brill. Res. Artif. Intell. 2022, 2, 120–124. [Google Scholar] [CrossRef]
  2. Dandavate, K.D.; Kale, P.R. A Review on Controlling Methods for Active Suspension Systems. Int. J. Res. Appl. Sci. Eng. Technol. 2023, 11, 1675. [Google Scholar] [CrossRef]
  3. Abid, H.J.; Chen, J.; Nassar, A.A. Equivalent air spring suspension model for quarter-passive model of passenger vehicles. Int. Sch. Res. Not. 2015, 2015, 974020. [Google Scholar] [CrossRef] [PubMed]
  4. Chao, Y.; Shen, L.-M. Nonlinear stiffness characteristics and model of air spring for mattress based on finite element and numerical analysis. Adv. Theory Simul. 2022, 5, 2200393. [Google Scholar] [CrossRef]
  5. Shin, Y.-H.; Lee, J.-H. Estimation of the complex dynamic stiffness of inflated rubber diaphragms in pneumatic springs using finite element method. Sensors 2020, 20, 6728. [Google Scholar] [CrossRef] [PubMed]
  6. Ye, J.; Huang, H.; He, C.; Liu, G. Analysis of vertical stiffness of air spring based on finite element method. MATEC Web Conf. 2018, 153, 06006. [Google Scholar] [CrossRef]
  7. Moheyeldein, M.M.; Abd-El-Tawwab, A.M.; Abd El-gwwad, K.A.; Salem, M.M.M. An analytical study of the performance indices of air spring suspensions over the passive suspension. Beni-Suef Univ. J. Basic Appl. Sci. 2018, 7, 525–534. [Google Scholar] [CrossRef]
  8. Zhu, W.; Zhao, Z.; Zhou, X.; Cao, X.; Ye, M.; Cao, C.; Alam, M.M. Research on Damping Hole Optimization of Hydro-Pneumatic Suspension for Mining Trucks under Variable Load Conditions. Actuators 2024, 13, 163. [Google Scholar] [CrossRef]
  9. Xu, M.; Wan, Y.; Du, F.; He, L. Study on Characteristics of Hydro-Pneumatic Suspension in Passenger Cars. In Applied Mathematics, Modeling and Computer Simulation; IOS Press: Amsterdam, The Netherlands, 2022; pp. 1–7. [Google Scholar]
  10. Lee, S.J. Development and analysis of an air spring model. Int. J. Automot. Technol. 2010, 11, 471–479. [Google Scholar] [CrossRef]
  11. Goodarzi, A.; Lu, Y.; Khajepour, A. Vehicle Suspension System Technology and Design; Springer Nature: Berlin/Heidelberg, Germany, 2023. [Google Scholar]
  12. Pelz, P.F.; Buttenbender, J. The dynamic stiffness of an air-spring. In Proceedings of the ISMA2004 International Conference on Noise and Vibration Engineering, Leuven, Belgium, 20–22 September 2004. [Google Scholar]
  13. Gmiterko, A.; Miková, Ľ.; Prada, E. Analysis of air-spring for a link of hyper-redundant manipulator. Tech. Sci. Technol. 2018, 4, 66–77. [Google Scholar]
  14. Li, X.; He, Y.; Liu, W.; Wei, Y. Research on the vertical stiffness of a rolling lobe air spring. Inst. Mech. Eng. Part F J. Rail Rapid Transit 2016, 230, 1172–1183. [Google Scholar] [CrossRef]
  15. Huang, T.; Chen, G.; Zong, C.; Zhou, T. Research on Vehicle Height Adjustment Control of Electronically Controlled Air Suspension; SAE Technical Paper; SAE International: Warrendale, PA, USA, 2015; ISSN 0148-7191. [Google Scholar]
  16. Hedrich, P.; Johe, M.; Pelz, P.F. Design and realization of an adjustable fluid powered piston for an active air spring. In Proceedings of the 10th International Fluid Power Conference, Dresden, Germany, 8–10 March 2016. [Google Scholar]
  17. Shan, H.Y. Vehicle height control of automotive air suspension system using fuzzy neural network approach. Appl. Mech. Mater. 2015, 727, 781–784. [Google Scholar] [CrossRef]
  18. Škamo, A.; Jokić, D. Advantages of early adoption of LabVIEW as industry-standard software in academia. In Proceedings of the 2023 12th Mediterranean Conference on Embedded Computing (MECO), Budva, Montenegro, 6–10 June 2023; pp. 1–4. [Google Scholar]
  19. Liu, L.; Wang, M.; Hussain, S.; Altameem, T.; Liu, J.; Fouad, H.; Akhtar, M.S.; Qiao, G.; Liu, G. Design of a multi-channel gas sensor detection system based on STM32 microcontroller and LabVIEW. J. Nanoelectron. Optoelectron. 2023, 18, 17–24. [Google Scholar] [CrossRef]
  20. Kavga, A.; Thomopoulos, V.; Pischinas, E.; Tsipianitis, D.; Nikolakopoulos, P. Design and Simulation of a Greenhouse in a Computational Environment (ANSYS/FLUENT) and an Automatic Control System in a LABVIEW Environment. Simul. Model. Pract. Theory 2023, 129, 102837. [Google Scholar] [CrossRef]
  21. Sreenivasan, G.P.; Keppanan, M.M. Analytical approach for the design of convoluted air suspension and experimental validation. Acta Mech. Sin. 2019, 35, 1093–1103. [Google Scholar] [CrossRef]
  22. Tang, G.; Zhu, H.; Zhang, Y.; Sun, Y. Studies of Air Spring Mathematical Model and Its Performance in Cab Suspension System of Commercial Vehicle; SAE Technical Paper; SAE International: Warrendale, PA, USA, 2015; ISSN 0148-7191. [Google Scholar]
  23. Jiang, X.; Xu, X.; Shan, H. Model-Based Fault Diagnosis of Actuators in Electronically Controlled Air Suspension System. World Electr. Veh. J. 2022, 13, 219. [Google Scholar] [CrossRef]
  24. Chen, Z.; Peng, L.; Fan, J.; Chen, Z.; Peng, T.; Yang, C. Fault injection strategies for air brake system of high-speed train with AMESim/Simulink co-simulation. FAC-PapersOnLine 2022, 55, 803–808. [Google Scholar] [CrossRef]
Figure 1. Mainstream air spring test set. (a) Hydraulic loading. (b) Weight block loading.
Actuators 13 00231 g001
Figure 2. Mainstream types of air springs. (a) Bladder air springs. (b) Membrane air springs.
Actuators 13 00231 g002
Figure 3. Mechanical structure assembly diagram.
Actuators 13 00231 g003
Figure 4. Schematic diagram of lever arm load loading structure.
Actuators 13 00231 g004
Figure 5. Static analysis of lever arm. (a) Stress contours. (b) Deformation contours.
Actuators 13 00231 g005
Figure 6. Static analysis of supporting column. (a) Stress contours. (b) Deformation contours.
Actuators 13 00231 g006
Figure 7. Diagram of charging and discharging.
Actuators 13 00231 g007
Figure 8. Measurement and control system architecture.
Actuators 13 00231 g008
Figure 9. Software functional architecture diagram.
Actuators 13 00231 g009
Figure 10. Program block diagram for parameter settings.
Actuators 13 00231 g010
Figure 11. Data storage program diagram based on the producer/consumer pattern.
Actuators 13 00231 g011
Figure 12. State machine structure diagram for report generation.
Actuators 13 00231 g012
Figure 13. State machine structure diagram for report generation.
Actuators 13 00231 g013
Figure 15. Data calibration curve and fitting equation.
Actuators 13 00231 g015
Figure 16. AMESim model of an air spring.
Actuators 13 00231 g016
Figure 17. Effect of different pressures on stiffness of air springs.
Actuators 13 00231 g017
Figure 18. Effect of different volumes of air springs on stiffness values.
Actuators 13 00231 g018
Figure 19. Curve of air spring stiffness as a function of height.
Actuators 13 00231 g019
Figure 20. Equipment assembly structure.
Actuators 13 00231 g020
Table 1. Main working parameters.
NameFeatures
Flange force sensor1000 kg; analog voltage signal
Air pressure transmitterRange 0–4 MPa; analog voltage signal
Displacement sensorRange 0–200 mm; analog voltage signal
Air pump-
Air distribution valve-
Air tankVolume 10 L, pressure 1.5 MPa.
Table 2. Verification values of barometric pressure sensors.
NO.Measured Pressure/MPaMeasured Output Voltage/VController Output Value/MPaAbsolute%
10.100.520.190.92
20.200.640.290.47
30.300.750.390.29
40.400.870.490.22
50.501.000.600.20
60.601.100.690.14
70.701.210.780.11
80.801.320.870.09
90.901.450.980.09
101.001.561.080.08
Disclaimer/Publisher’s Note: The statements, opinions and data contained in all publications are solely those of the individual author(s) and contributor(s) and not of MDPI and/or the editor(s). MDPI and/or the editor(s) disclaim responsibility for any injury to people or property resulting from any ideas, methods, instructions or products referred to in the content.

