Article

Structural Optimization and Fluid–Structure Interaction Analysis of a Novel High-Speed Switching Control Valve

1
School of Mechanical Engineering, Shandong University, Jinan 250061, China
2
Key Laboratory of High-Efficiency and Clean Mechanical Manufacture at Shandong University, Ministry of Education, Jinan 250061, China
3
National Demonstration Center for Experimental Mechanical Engineering Education at Shandong University, Jinan 250061, China
4
Rizhao Research Institute, Shandong University, Rizhao 276800, China
5
School of Chemical Process Automation, Shenyang University of Technology, Liaoyang 111003, China
*
Authors to whom correspondence should be addressed.
Actuators 2025, 14(4), 163; https://doi.org/10.3390/act14040163
Submission received: 20 January 2025 / Revised: 20 March 2025 / Accepted: 21 March 2025 / Published: 24 March 2025
(This article belongs to the Special Issue Design, Hydrodynamics, and Control of Valve Systems)

Abstract

:
Laver fluffy is an indispensable link in the processing of laver products. After fluffing, the laver acquires an appealing color, which is conducive to better marketability. During the primary mechanical processing of laver, a valve capable of rapid opening and closing is required to ensure that the laver’s surface becomes fluffy and lustrous post-processing. However, valve products that can meet the specific requirements of laver fluffing are scarce. This study proposes a novel principle for a high-speed switching control valve. This valve can quickly turn on or cut off the high-pressure gas path during laver processing while also taking into account the response speed and service life. The structure and principle of the new control valve were introduced. Different flow field models in the valve were designed, and their flow characteristics and flow field performance under various schemes were compared and discussed by using Fluent. Subsequently, an optimized control valve structure model was proposed. Based on this, a strength analysis of the control valve was conducted via fluid–structure interaction, revealing the response characteristics of the valve under the working state. The results indicate that, when different cone angles and bell shapes were selected for the upper chamber inlet of the control valve, the number and intensity of vortices in the upper chamber can be reduced. The height of the upper chamber affected the formation of the throttle between the top and bottom surfaces of the upper chamber. When the height of the upper chamber was 32 mm, the energy loss in the upper chamber remains basically stable. Simultaneously changing the inlet shape and height of the upper chamber can effectively prevent the throttle formed by the height of the upper chamber, which was conducive to increasing the valve outlet flow rate. Through the analysis of the flow field with different valve chamber structures, the improved control valve adopted the bell-shaped inlet, with an upper chamber height of 32 mm and curved transition for the internal flow channel. Compared to the original fluid domain, when the opening was 100%, the outlet flow rate of the 10° conical tube and bell-shaped inlet increased by 12.77% and 12.59%, respectively. The outlet flow rate at the curved transition position rose by 15.35%, and the outlet flow of the improved control valve increased by 32.70%. When the control valve was operating under a preload pressure of 1 MPa, at 20% opening, the maximum equivalent stress of the valve body was 52.51 MPa, and the total deformation was 12.56 microns. When the preload pressure exceeded 1.5 MPa, the equivalent stress and total deformation of the control valve body and T-shaped valve stem exhibited an upward trend with further increases in the preload pressure.

1. Introduction

Porphyra is extensively distributed across cold, temperate, subtropical, and tropical sea areas. Currently, there are two main types of laver globally: porphyra haitanensis and porphyra yezoensis. Among them, porphyra haitanensis is more favored by fishermen, because its output is several times that of porphyra yezoensis [1,2].
During the mechanical processing of porphyra haitanensis, it is inevitable to perform a fluffy treatment after the dehydration station is completed, so the surface of the processed Porphyra haitanensis is made fluffy and shiny. In the working station of the processing process, a control valve with the characteristics of large flow, high pressure and quick opening is needed to meet the fluffy requirements of laver. At present, no control valve with such performance has been found in the industry, and only multiple electromagnetic directional valves are used as a substitute instead. Every time fluffy is completed, the electromagnetic directional valves need to reciprocate twice, and more than a dozen or even dozens of electromagnetic directional valves need to act simultaneously; however, their switching speed often fails to meet the speed requirements required for fluffy. Therefore, resolving the issues of slow response speed, high cost and low service life of valves used in laver puffing stations has been a long-standing difficult challenge in the industry.
Recently, researchers have conducted a large number of research on the structural characteristics and flow field performance of valves. Moujaes et al. [3] employed numerical simulation and experiment to explore the influence of Reynolds number on the flow coefficient and pressure loss of ball valves. Salvador et al. [4] carried out numerical simulations of cavitation, noise and vibration within the control valve and made a comparison of the results between the numerical simulation and experiment. Large et al. [5] used CFD simulation to analyze the flow characteristics of the butterfly valve pipeline system and studied the mechanical vibration of the valve stem caused by the vortex falling off. Zaryankin et al. [6] conducted a comprehensive series of studies on the interaction between fluid pressure pulsation and the vibration of pipe system and valve that it induces. Shin et al. [7,8] analyzed the influence of structural parameters and control parameters on the dynamic characteristics of the system by establishing the relevant mathematical models of a pressure-reducing valve and valve core. Chern et al. [9] investigated the failure mechanism of cavitation inside the globe valve on the internal structure of the valve and proposed measures to mitigate this effect. Mazur et al. [10] conducted in-depth theoretical analysis and experimental research on the stability and full-open pressure loss of the control valves, and they optimized and improved the valve based on their findings to improve their performance. Chernus et al. [11] used the Fluent software package to study the gas dynamics of electro-gas throttle spool, with a focus on the particularity of the airflow through the valve and the influence of the valve geometry on the airflow. Merati et al. [12] analyzed the flow and vortex of the two-dimensional V-shaped ball valve model, and they used dynamic pressure sensor, LDV and high-speed camera to measure and observe the Strouhal frequency, flow velocity, turbulence intensity and flow field distribution of the valve, finding good agreement between simulation and experimental results. Choi et al. [13] conducted computational analysis on the fluid dynamic characteristics of the opening and closing valves in the linear compressor considering fluid–structure interaction. Gamboa et al. [14] applied an accurate turbulence model in CFD to reduce the flow vorticity inside the valve by improving its internal geometry. Simic et al. [15] presented a method for optimizing the geometric structure of the valve spool and housing of the small hydraulic valve seat. To resolve the problem of the large impact and noise of an electromagnetic variable valve landing, an external buffer was proposed by Zhou et al. [16], and the coupling relationship between the buffer and actuator in the electromagnetic variable valve system was studied. Lisowski et al. [17] simulated the initial opening stage of the valve spool and put forward an improved scheme for the geometric structure of the spool under a small working opening. Amirante et al. [18,19] investigated the flow field, jet angle, and unstable fluid load inside the slide valve based on CFD simulation and experiments. By changing the structure of the valve spool to alter the pressure distribution inside the valve chamber, the unstable fluid load was effectively compensated.
Given the fluffy characteristics of laver, this paper proposes a large-flow rapid on/off control valve for laver primary processing equipment. This valve can be used to swiftly connect or disconnect the high-pressure gas path during laver processing, and it is characterized by large flow, fast response speed, frequent equal interval opening and closing, and a good sealing effect. In our previous research, we provided a detailed introduction to the structure, working principle, and flow characteristics of this control valve [20]. However, during the laver fluffing process, due to the structural characteristics of the control valve chamber, the velocity, pressure, and direction of the gas inside the valve change sharply. This results in increased friction and collision between gases, making it easy for vortices to form within the valve chamber. These vortices can cause local losses and reduce the valve outlet flow rate, thus weakening the fluffy effect of laver. Therefore, in order to minimize the energy loss of fluid in the flow process and to increase outlet flow the rate, this study investigates the influence of different control valve chamber structural characteristics on the flow field. Additionally, when the control valve was working, the high-pressure gas inside the valve would cause a certain impact on the valve structure. Therefore, in order to enhance the safety performance of the control valve, a fluid–structure interaction analysis of the improved valve chamber was also conducted.

2. Structure and Principle of Laver Fluffy Control Valve

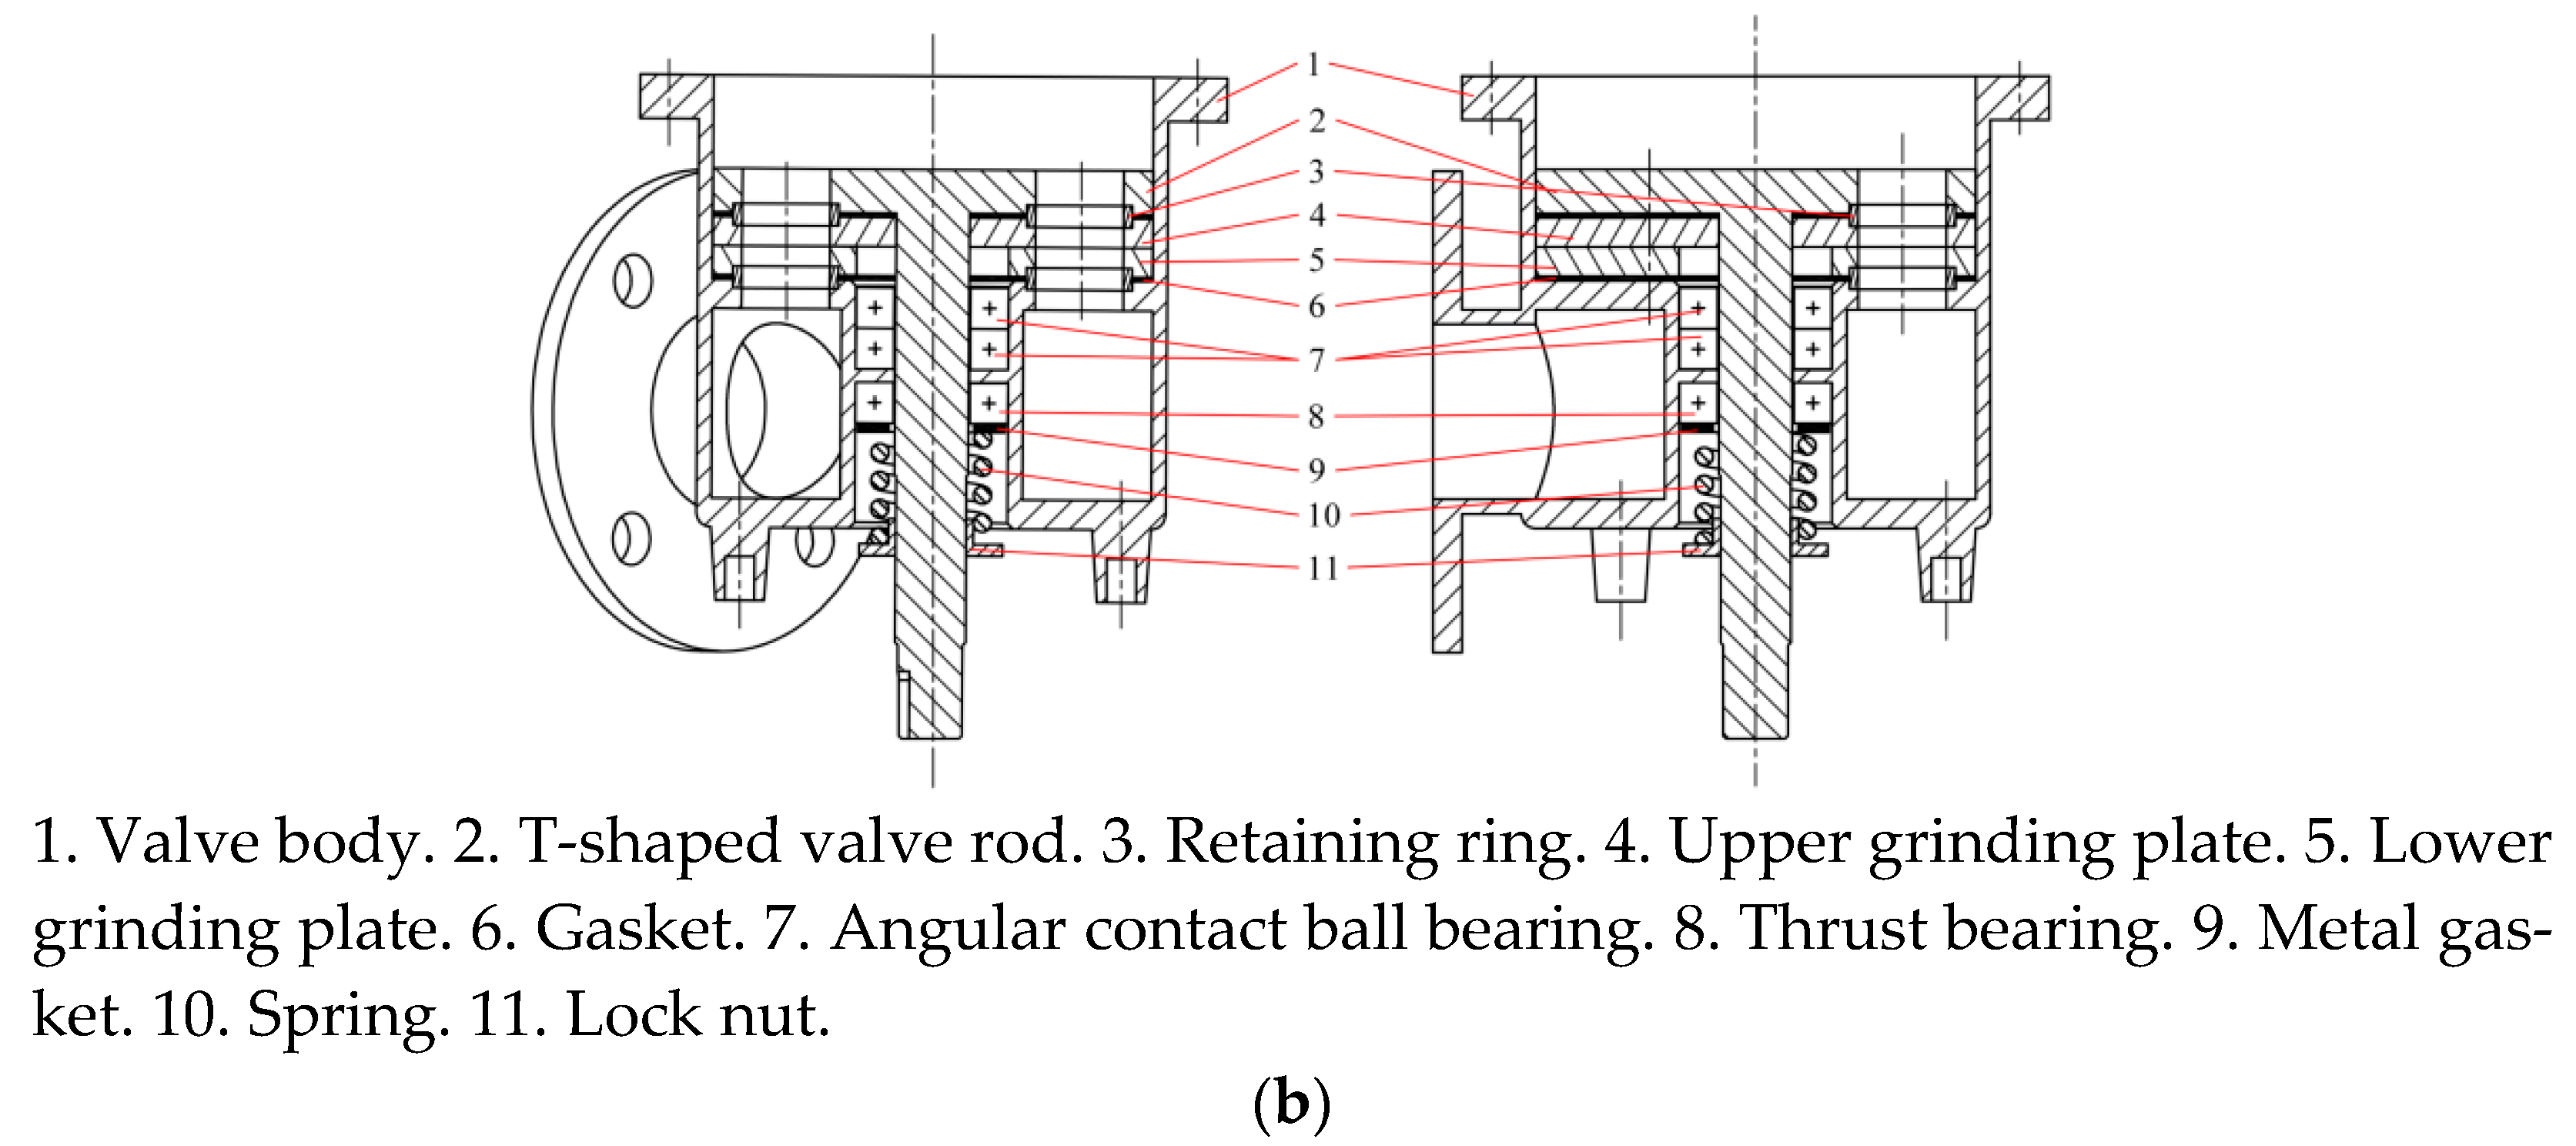
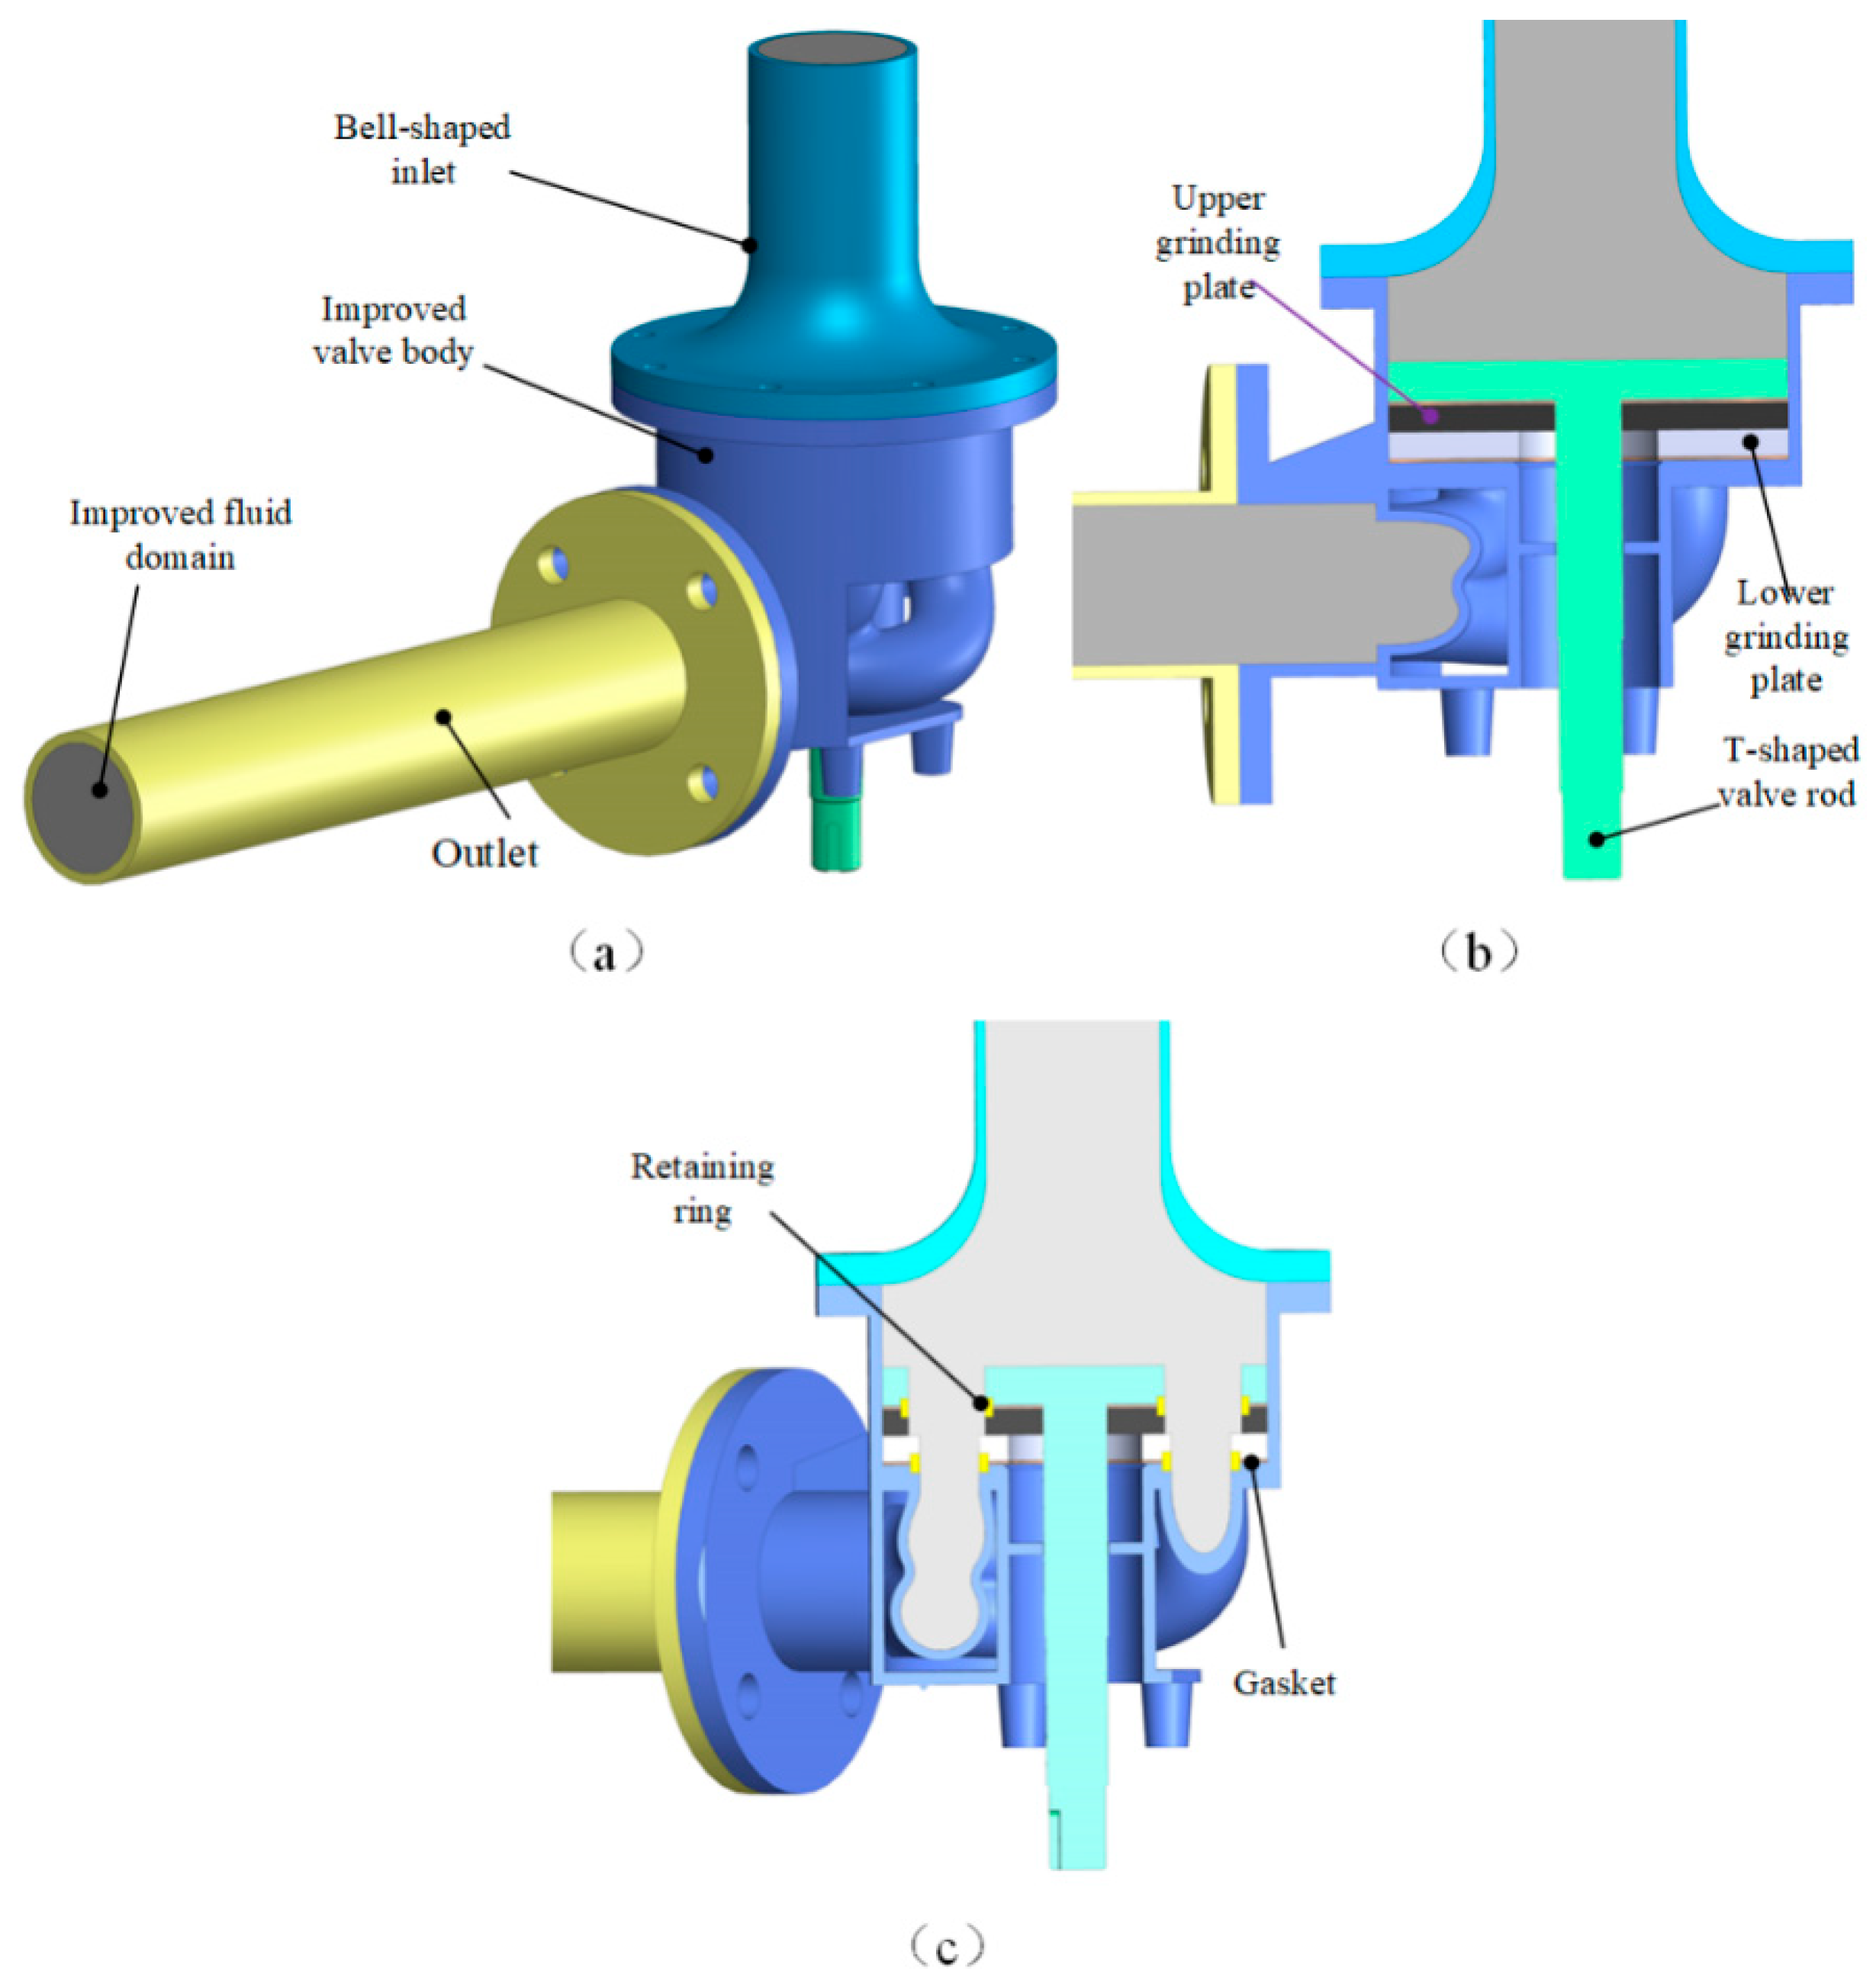
Figure 1 illustrates the structure of the laver fluffy control valve, which is divided into three distinct parts: a stationary part, a moving part and a locking support part.
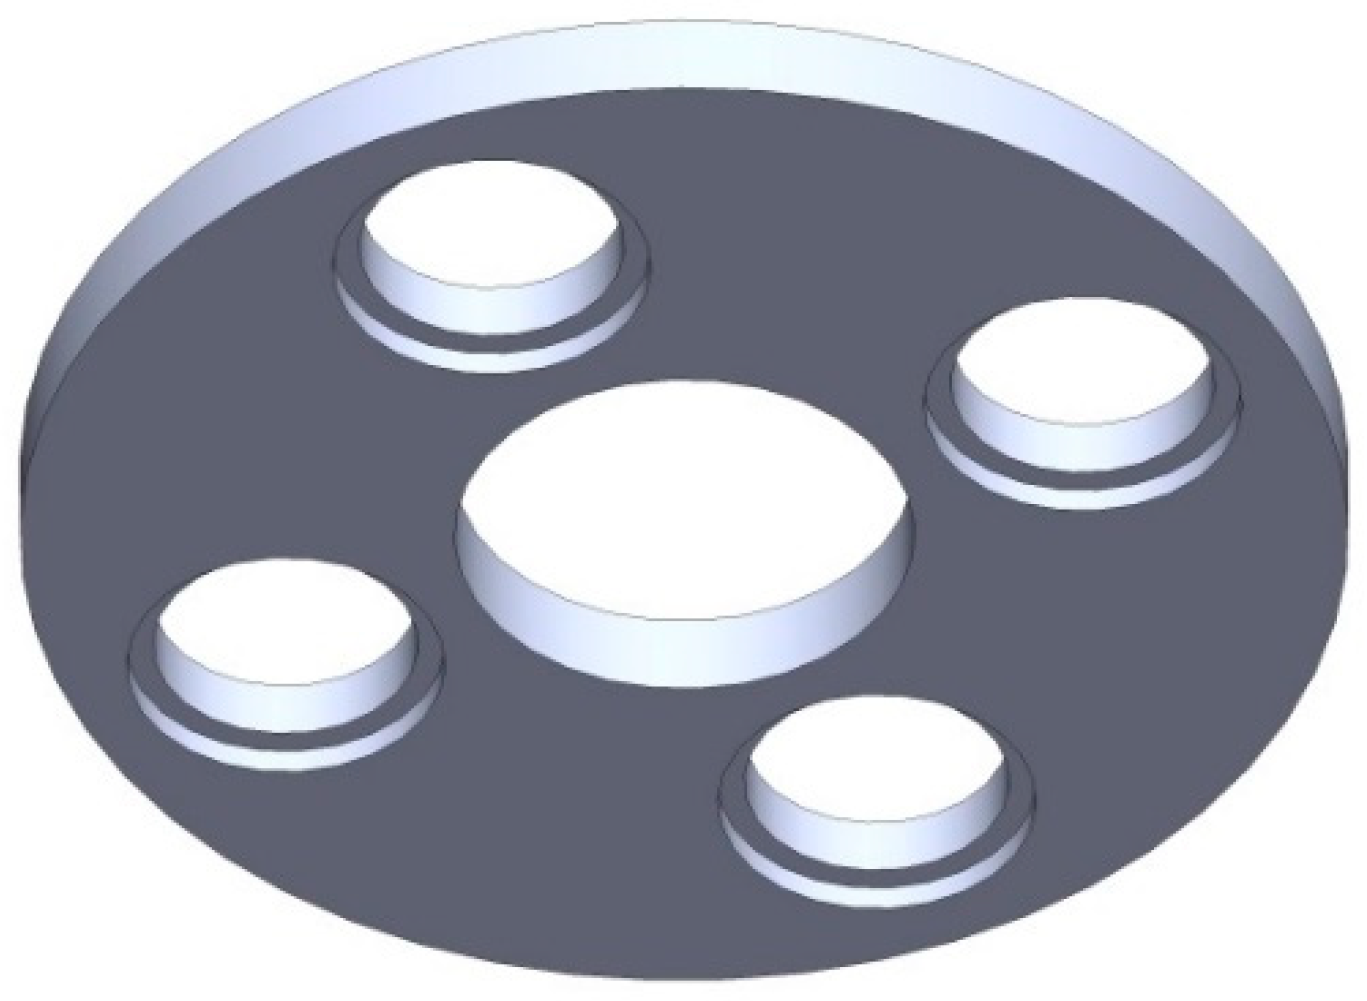
The stationary part is composed of a valve body, a retaining ring, a lower grinding plate and a gasket. In Figure 1, the valve body comprises an upper chamber and a lower chamber. Four stepped holes of the identical diameter are opened on the bottom surface of the lower grinding plate, as shown in Figure 2, which is designed to facilitate gas circulation. The step is used to place the retaining ring, and, due to the fixing effect of the retaining ring, the two parts in contact with the retaining ring remain relatively stationary in the circumferential direction.
The moving part consists of a T-shaped valve rod, a retaining ring, an upper grinding plate and a gasket. The upper grinding plate and T-shaped valve rod are relatively stationary in the circumferential direction due to the retaining ring. The power of the motor controlling the valve actuator is transmitted to the T-shaped valve rod through the reducer, and, subsequently, the valve rod drives the upper grinding plate through the retaining ring for rotational movement. The gasket at the stationary and moving sections are used for sealing and preventing high-pressure gas leakage.
The locking support part consists of a pair of angular contact ball bearings, thrust bearings, metal gaskets, springs and lock nuts. Specifically, a pair of angular contact ball bearings provide support for the rotation of the T-shaped valve rod. One end of the spring is in contact with the lock nut, and one end is in contact with the thrust bearing through the metal gasket. When compressed, the spring generates elastic force, which is then transmitted as a downward axial force to the T-shaped valve rod through the lock nut. This force ensures close contact among the T-shaped valve rod, gasket, upper grinding plate, and lower grinding plate, pressing them firmly against the grinding plate support plate of the valve body, thereby realizing the movement restriction of the moving part in the vertical direction. In addition, by adjusting the spring’s compression degree, the axial force acting on the T-shaped valve rod can be modified. The thrust bearing, in contact with the bearing support plate of the valve body, enables the spring to achieve the relative movement with respect to the valve body.
In brief, the lower grinding plate is fixed on the valve body to remain stationary, and the T-shaped rod transmits power to the upper grinding disk, enabling the upper grinding disk to rotate relative to the lower grinding disk. The core motion of the control valve lies in the relative movement of the upper grinding plate and the lower grinding plate: when the two grinding plate through holes overlap each other, the upper chamber of the valve body is connected to the lower chamber, allowing the high-pressure gas to flow from the upper chamber into the lower chamber, thus opening the valve. When the upper and lower grinding plates are staggered with each other, the upper chamber of the valve is closed relative to the lower chamber, and the valve is closed.

3. Methodology

3.1. Flow Field Simulation Method of Laver Fluffiness Control Valve

To determine the optimal structure of the fluffy control valve, various valve structures were designed, and the steady flow field analysis was analyzed using Ansys Fluent 17.0 software.

3.1.1. Model Construction

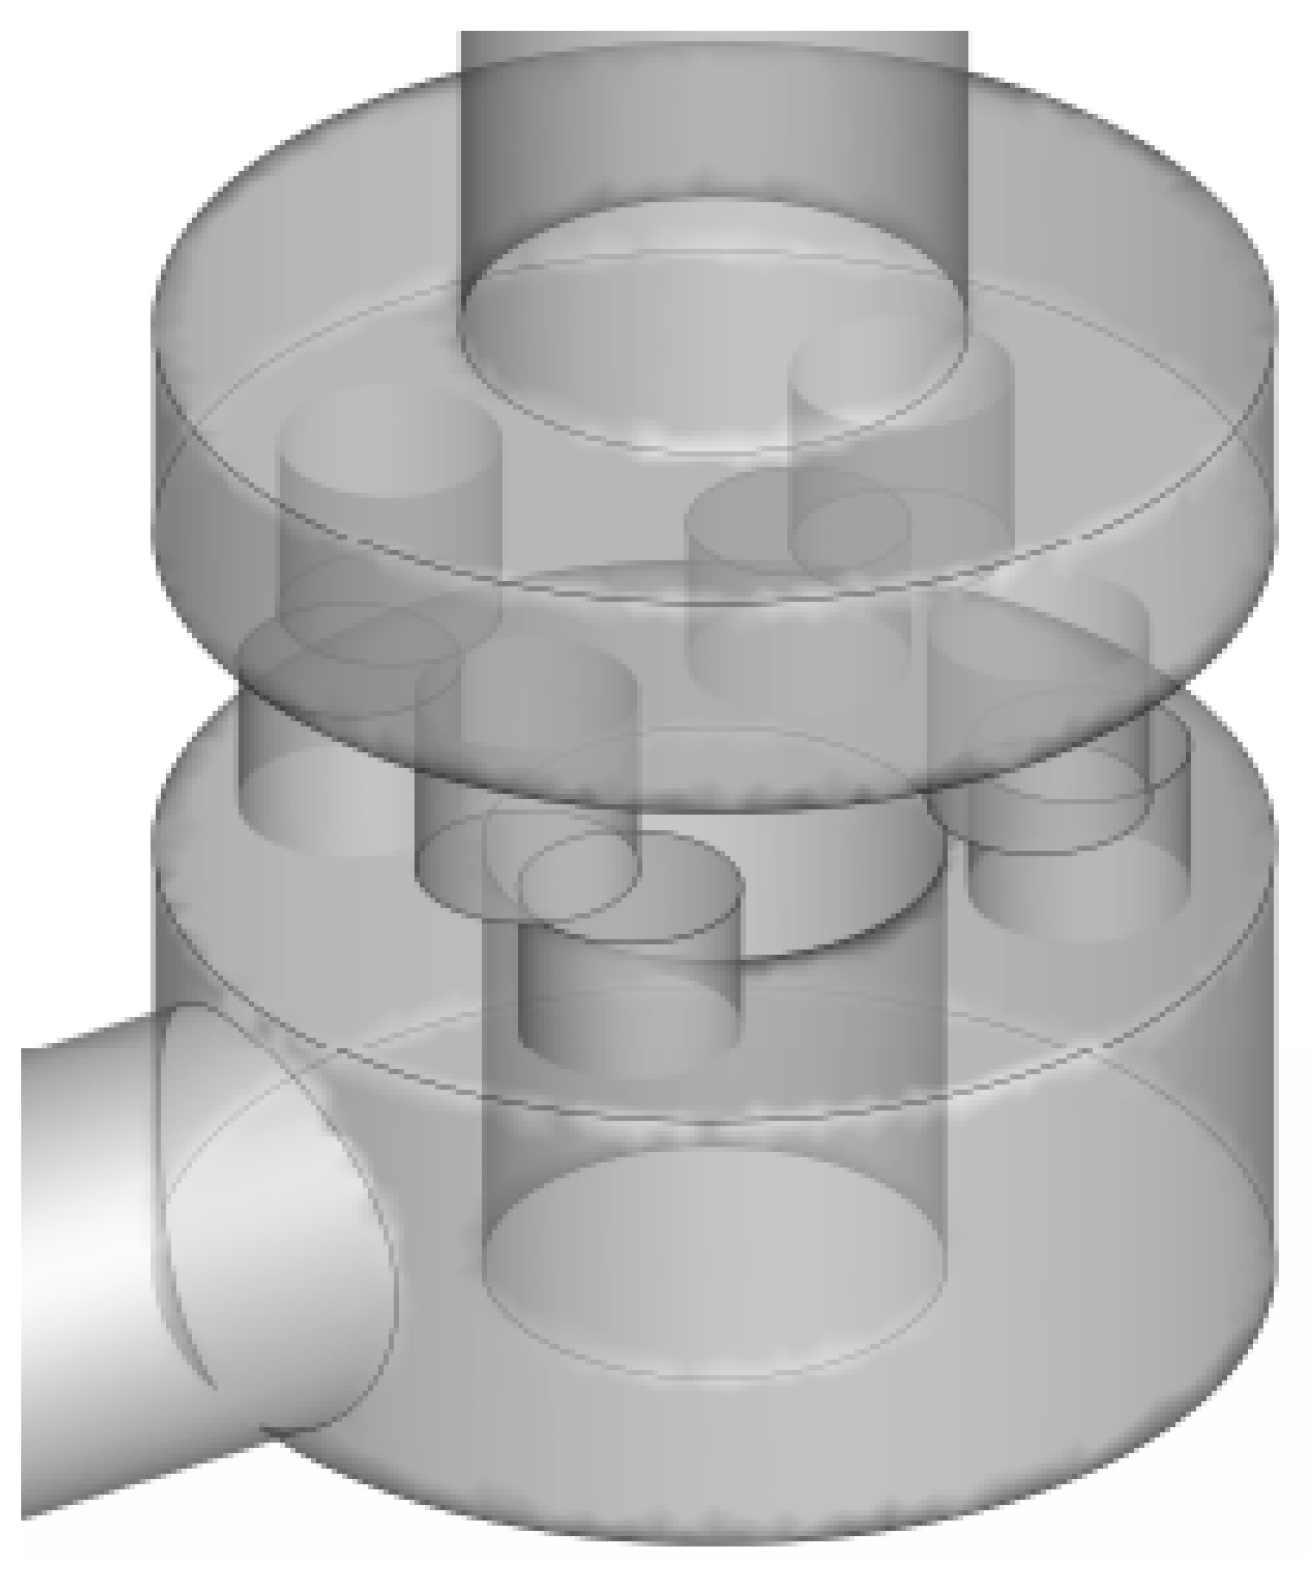
According to the cavity structure of the control valve, Solidworks 2024 software was used to create an original three-dimensional model of the fluid domain inside the control valve, as shown in Figure 3, in which the fluid domain was divided into five parts, namely, inlet channel, outlet channel, upper chamber, middle-lower chamber and middle-lower channel. To ensure unobstructed flow of fluid, the valve inlet was extended by 2 times the pipe diameter, and the outlet is extended by 6 times [21,22].

3.1.2. Grid Division and Boundary Condition Setting

For the fluid domains of control valves with different designs, the grids were divided, respectively. Subsequently, the divided mesh model was imported into Ansys Fluent for settings. The medium in the fluid field inside the control valve was high-pressure air with a density of 11.69 kg/m3. The inlet and outlet of the fluid domain model were set as pressure inlet and pressure outlet, with values of 1 MPa and 0.9 MPa, respectively. The grid division method and solver settings in Fluent were introduced in detail in our previous work [20].
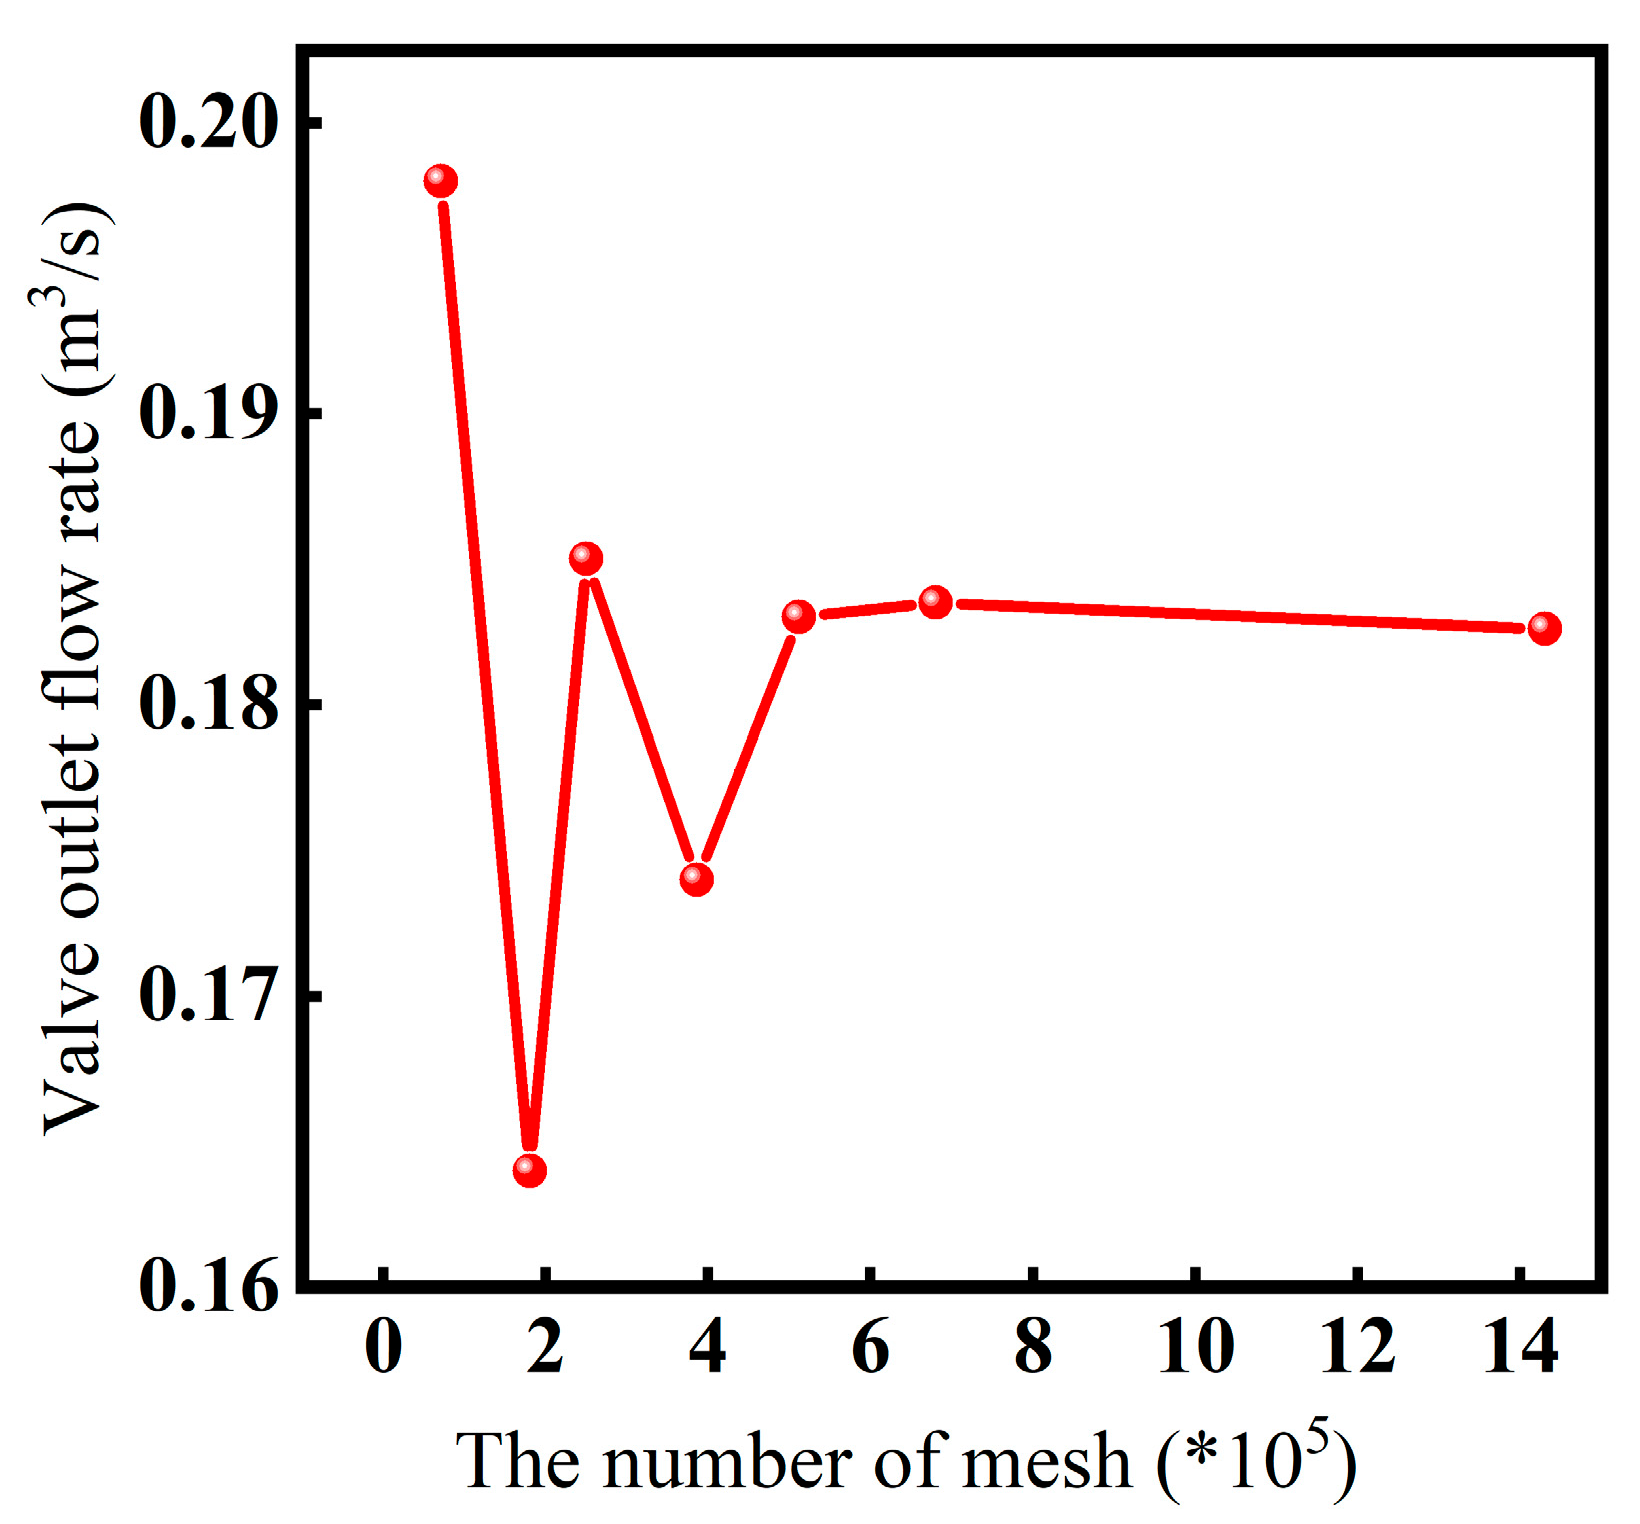
To eliminate the influence of the mesh number on the numerical calculation, mesh independence verification was performed. The valve outlet flow rate was monitored under the pressure difference of 0.1 MPa between the valve inlet and outlet. As shown in Figure 4, when the number of mesh reached 510,000, the outlet flow rate remained unchanged with the variation in the number of mesh. Thus, this mesh-density configuration was selected for the simulation model.

3.2. Fluid–Structure Interaction Method for Laver Fluffiness Control Valve

3.2.1. Fluid–Structure Interaction Finite Element Model

According to the data transmission method of fluid–structure interaction, it can be divided into unidirectional and bidirectional fluid–structure interaction. During the coupling process between the control valve structure and flow field, the stress-induced deformation of components such as the valve body and valve spool under the stress might alter the shape of the flow field. Therefore, the various structures of the valve were bidirectionally coupled with the flow field. However, considering the negligible impact of the valve structures’ small stress-induced deformations on the flow field, a unidirectional fluid–structure analysis was adopted.
To conduct a fluid–structure interaction analysis, two physics need to be established: one is the fluid physical quantity with the fluid in the valve as the research object, and the other is the structural physics field with the valve structure as the research object. The valve structure model is mainly composed of valve body, T-shaped valve rod, upper grinding plate, lower grinding plate, retaining ring and gasket, along with bell-shaped inlet pipeline and outlet pipeline connected to the control valve. During the analysis, the fluid physical field in the control valve was first calculated, and the nodal pressure obtained by the flow field calculation was added to the valve structure physics as a “pressure load” for structural mechanical analysis, enabling the calculation of the force and deformation of each valve structure under the action of fluid [23,24].
The fluid–structure interaction computational model was built in ANSYS Workbench 17.0, as shown in Figure 5.
Subsequently, the calculated flow-field pressure was transferred to the Static Structural module, and the structural analysis was performed using the finite-element simulation software in Workbench. Thus, a fluid–structure interaction model with the control-valve structure and the valve-internal fluid domain as the research object was established, as shown in Figure 6.

3.2.2. Boundary Conditions and Related Parameters

In the coupling system, the solid-domain valve-structure model was suppressed during the flow field calculation, and the meshing, correlation verification, inlet and outlet boundary conditions of the flow field model in the fluid domain valve were consistent with Section 3.1. In order to ensure the tightness between the T-shaped valve rod and the upper grinding plate, between the upper grinding plate and the lower grinding plate, and between the lower grinding plate and the valve body when the valve is working, a preload pressure needs to be applied to the upper surface of the T-shaped valve rod.
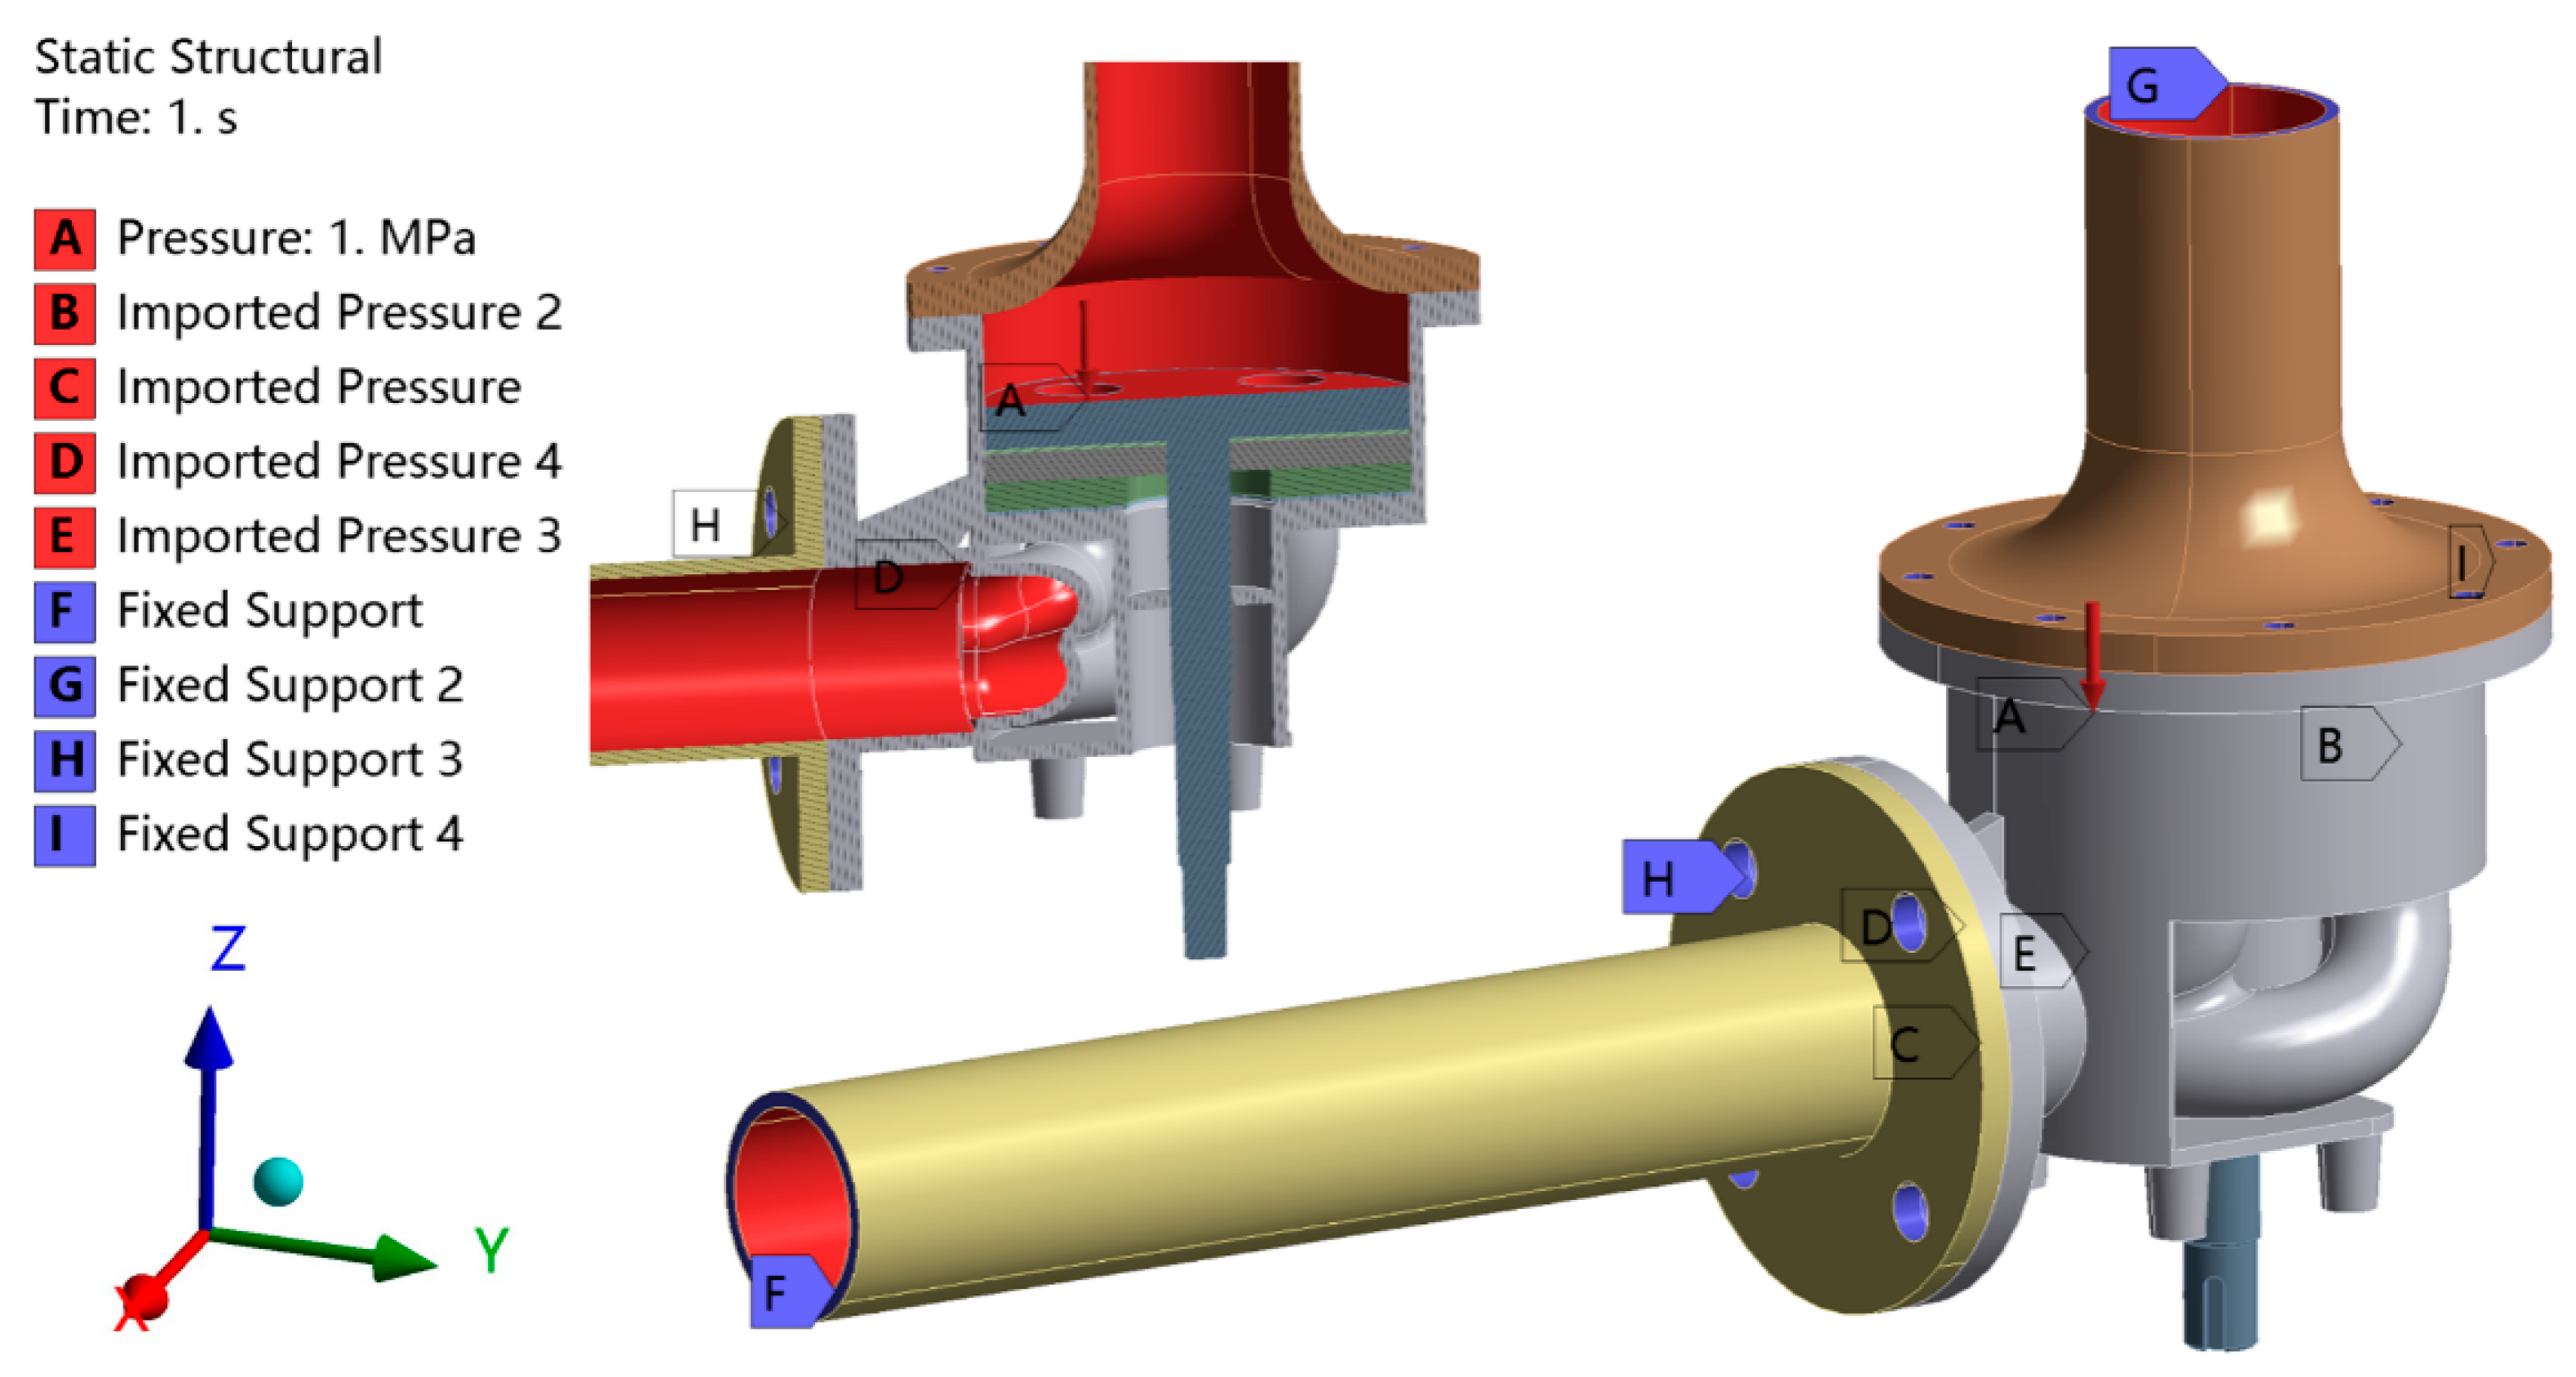
In the coupling system, the flow field model in the fluid domain was suppressed during the finite element calculation of the solid domain structure. In the contact setting, since the parts of the moving part move relative to the valve body, and the upper grinding plate moves relative to the lower grinding plate, the contacts between the valve body and the T-shaped rod, the valve body and the upper grinding plate, as well as the valve body and the gasket, were set to Frictionless, while the contact between the upper grinding plate and the lower grinding plate was set to Frictional, with a friction coefficient of 0.05. The grid was divided using the Meshing module, and the hexahedron-based division method was selected. Boundary conditions and loads were applied according to the actual working conditions of the valve. Boundary conditions: fixed constraints were applied at both ends of the inlet and outlet flanges of the control valve, and fixed constraints were applied to the end faces of the bell-shaped inlet pipeline and outlet pipeline. Load application: the flow field transferred the pressure load to the solid domain through the liquid-solid coupling surface, as shown in Figure 7.
The valve body, bell-shaped inlet pipe and outlet pipe are made of gray cast iron, the T-shaped valve rod, lower grinding plate and retaining ring are fabricated from 45# steel, the upper grinding plate is composed of polytetrafluoroethylene and the gasket is made of silicone, and their physical properties are shown in Table 1.

3.3. Simulation Validation

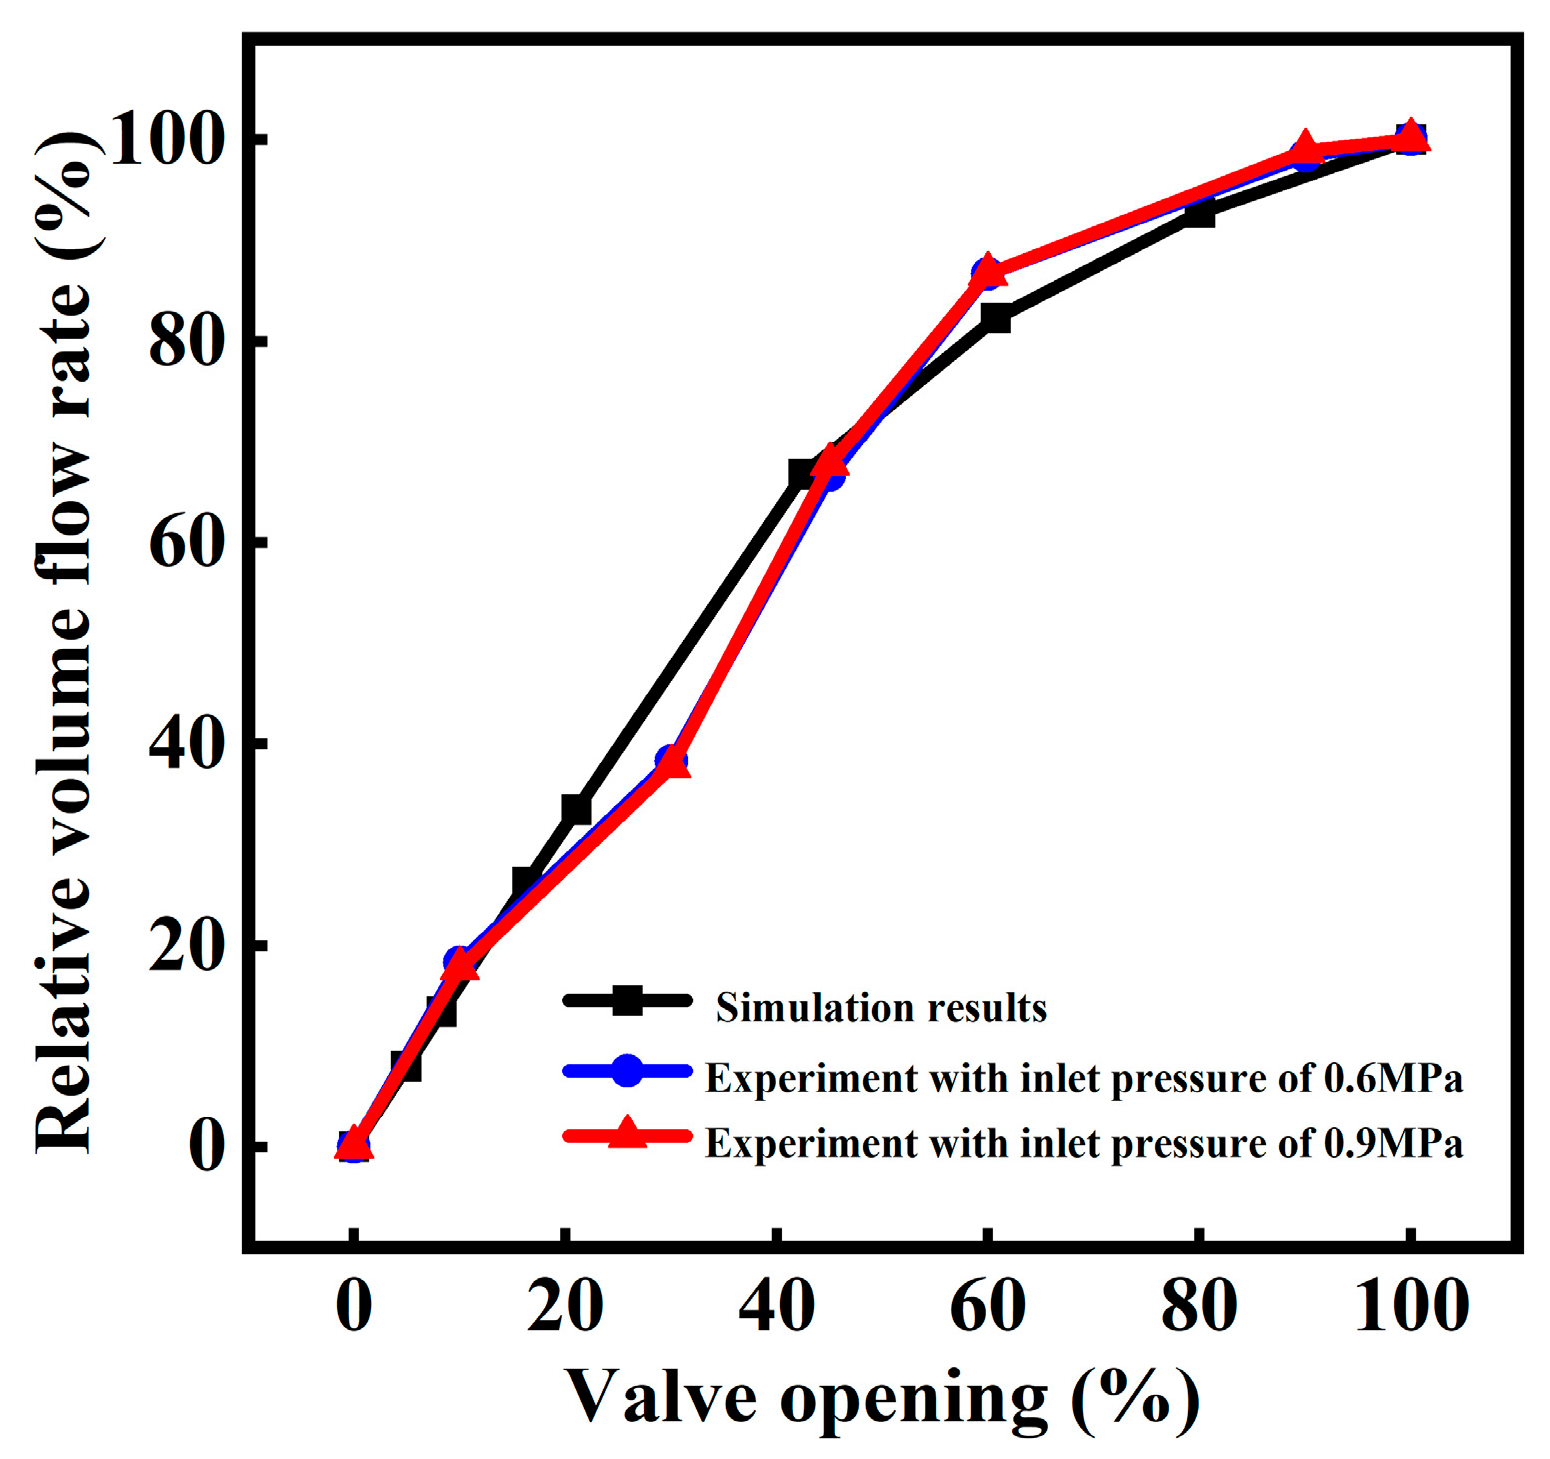
To verify the feasibility of the simulation, a comparison was made between the simulation and experimental results. Firstly, the volume flow rate of the control valve at different openings was obtained through the simulation calculation, as shown in Table 2. Subsequently, the experiment was conducted to measure the volume flow rate of the control valve under two different inlet pressures, with the results shown in Table 3 and Table 4.
The relative volume flow rate obtained from the simulation and experiment was compared, as shown in Figure 8. The results indicate that the simulation results are in good agreement with the experimental results, and the simulation is feasible and has referential value. As the opening increased, both exhibited a parabolic increasing trend.

4. Results and Discussion

4.1. Flow Field Analysis of Laver Fluffiness Control Valve Under Different Valve Structures

4.1.1. Influence of Inlet Shape

The flow of fluid from the inlet runner into the upper chamber experiences a sudden expansion of the flow beam, causing the main beam to form vortices with the wall of the upper chamber. To weaken the upper cavity vortices, a gradual expansion of the flow beam is employed.
(1)
Choice of Entrance Shape
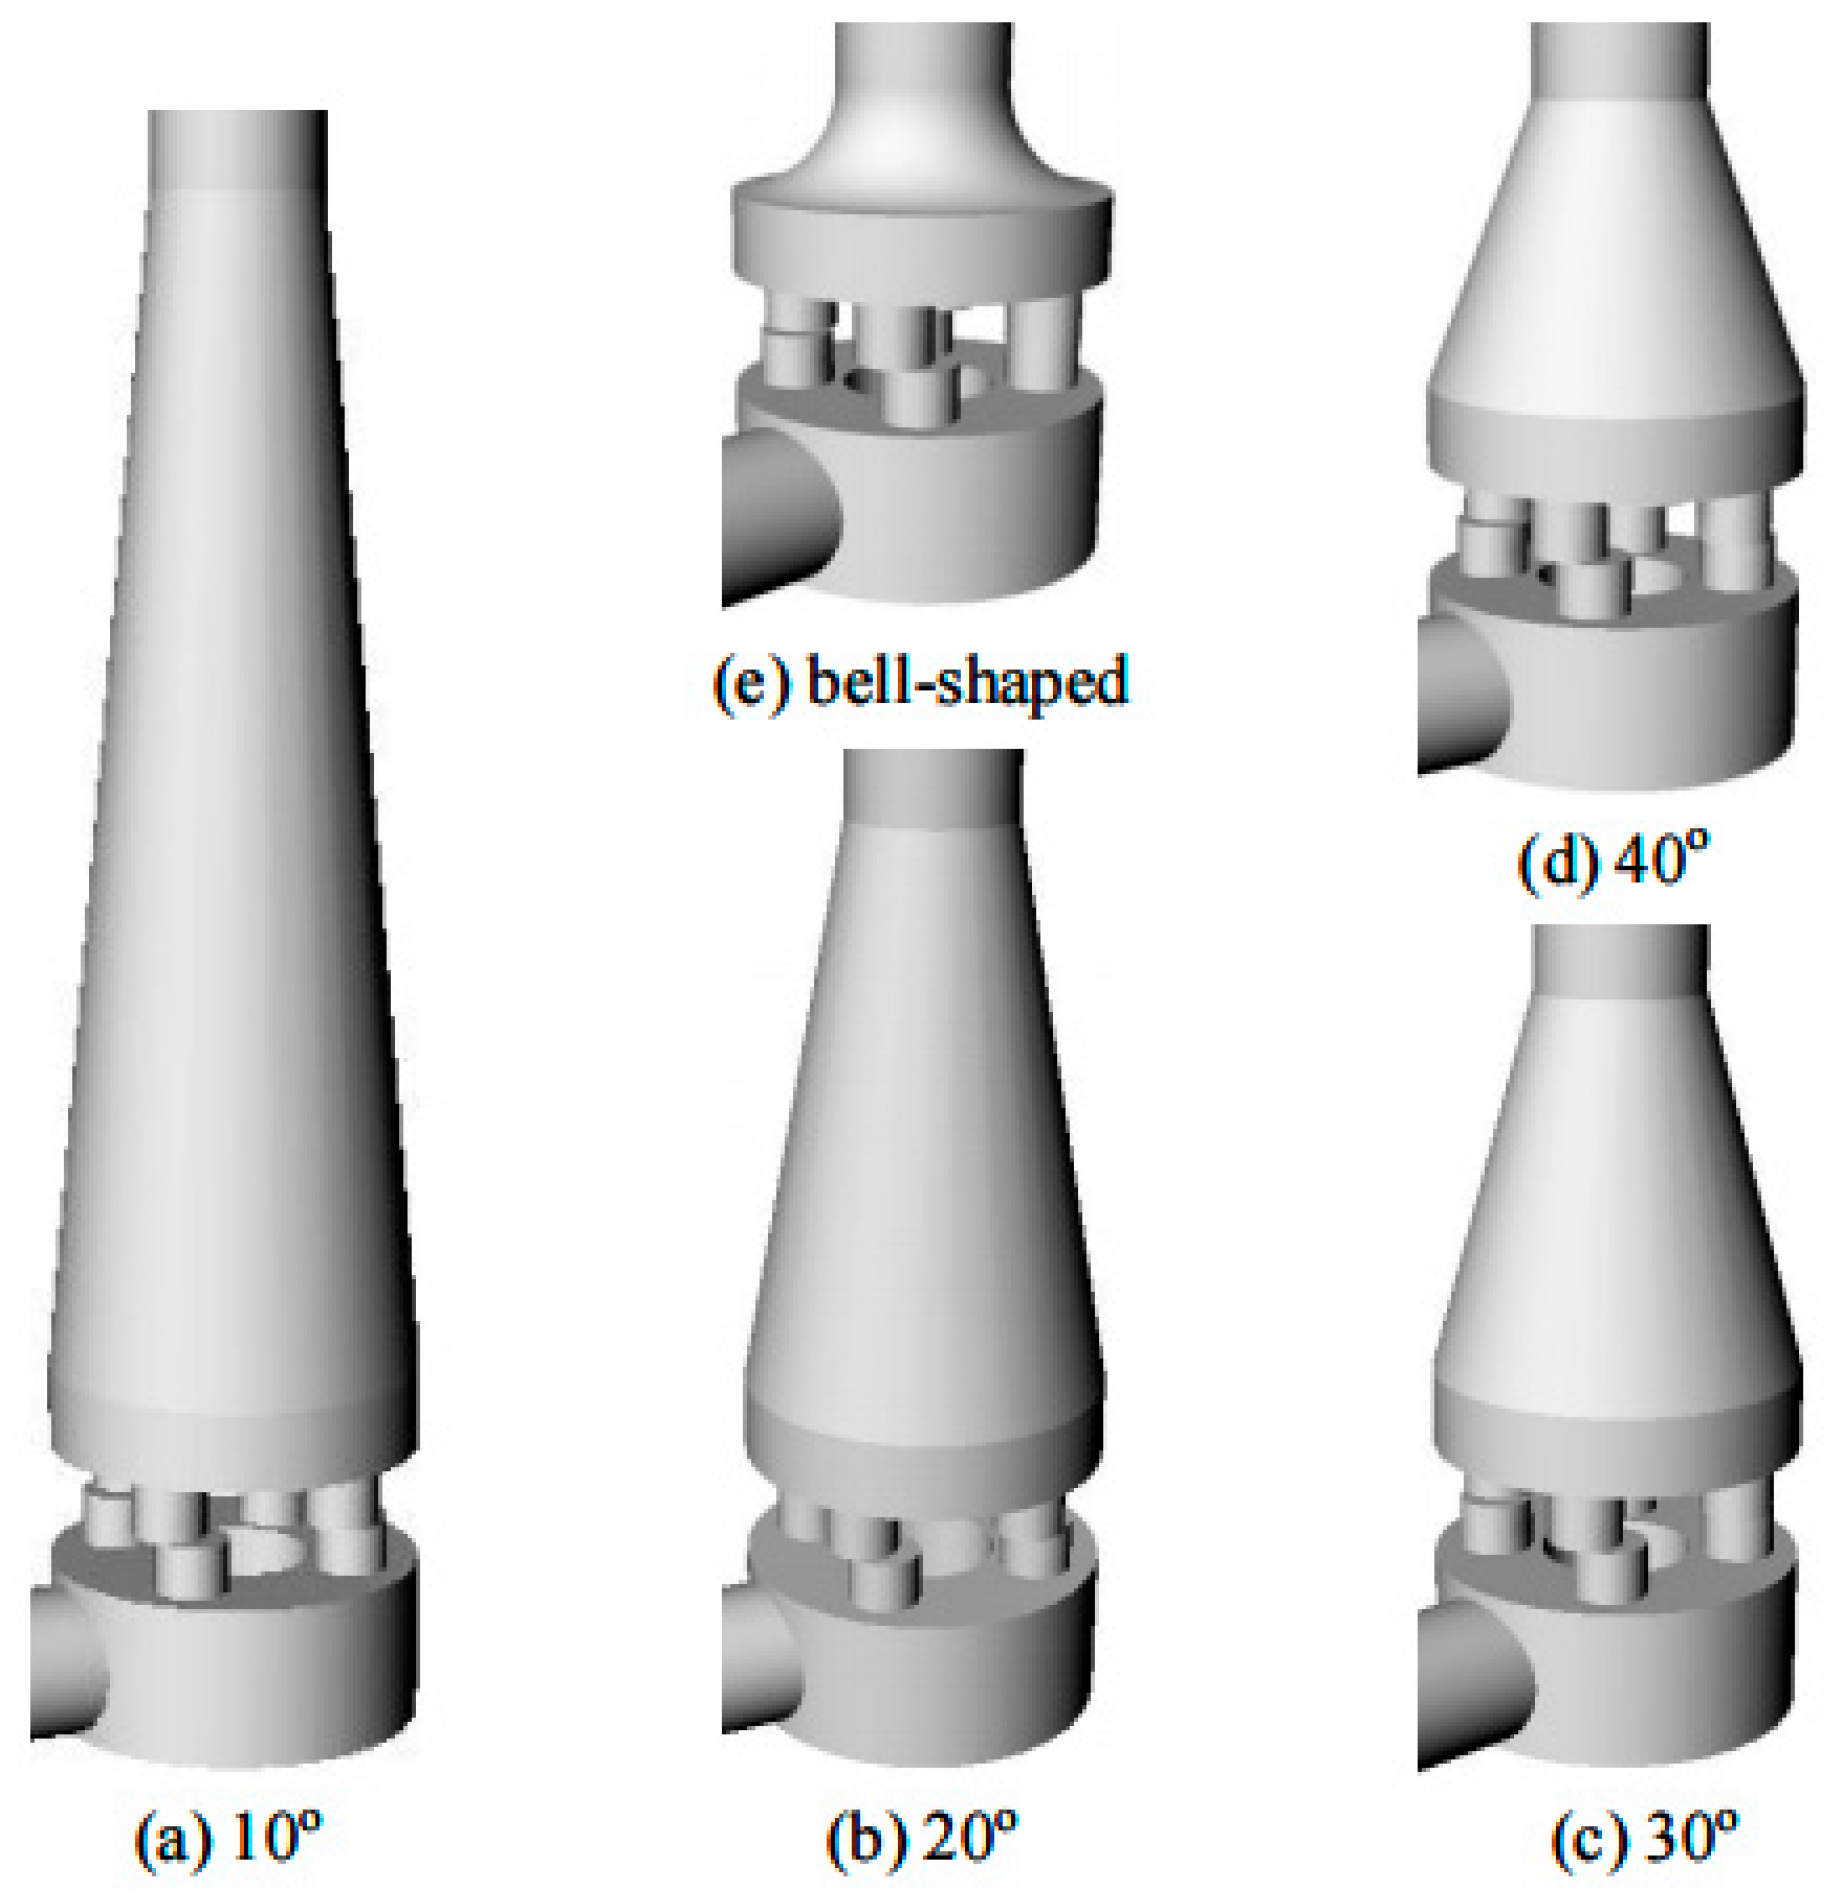
To achieve a gradual transition of the flow section at the inlet flow channel to the upper cavity, at the entrance of the upper cavity, a gradually enlarged cone tube or bell-shaped inlet tube is installed, as shown in Figure 9, where α is the cone angle, and l is the height increase. When the inlet is a cone tube, the cone angles of 10°, 20°, 30° and 40° are selected, and the height increases in the control valve are 468.63 mm, 232.52 mm, 153.01 mm and 112.65 mm, respectively. When the inlet is bell-shaped, the height of the control valve is increased by 41 mm.
The original fluid domain (see Figure 3) is reconstructed by Solidworks software, and 10°, 20° and 20° are set at the entrance 30° and 40° cones and bell-shaped pipes, as shown in Figure 10.
(2)
Volume Flow of Outlet
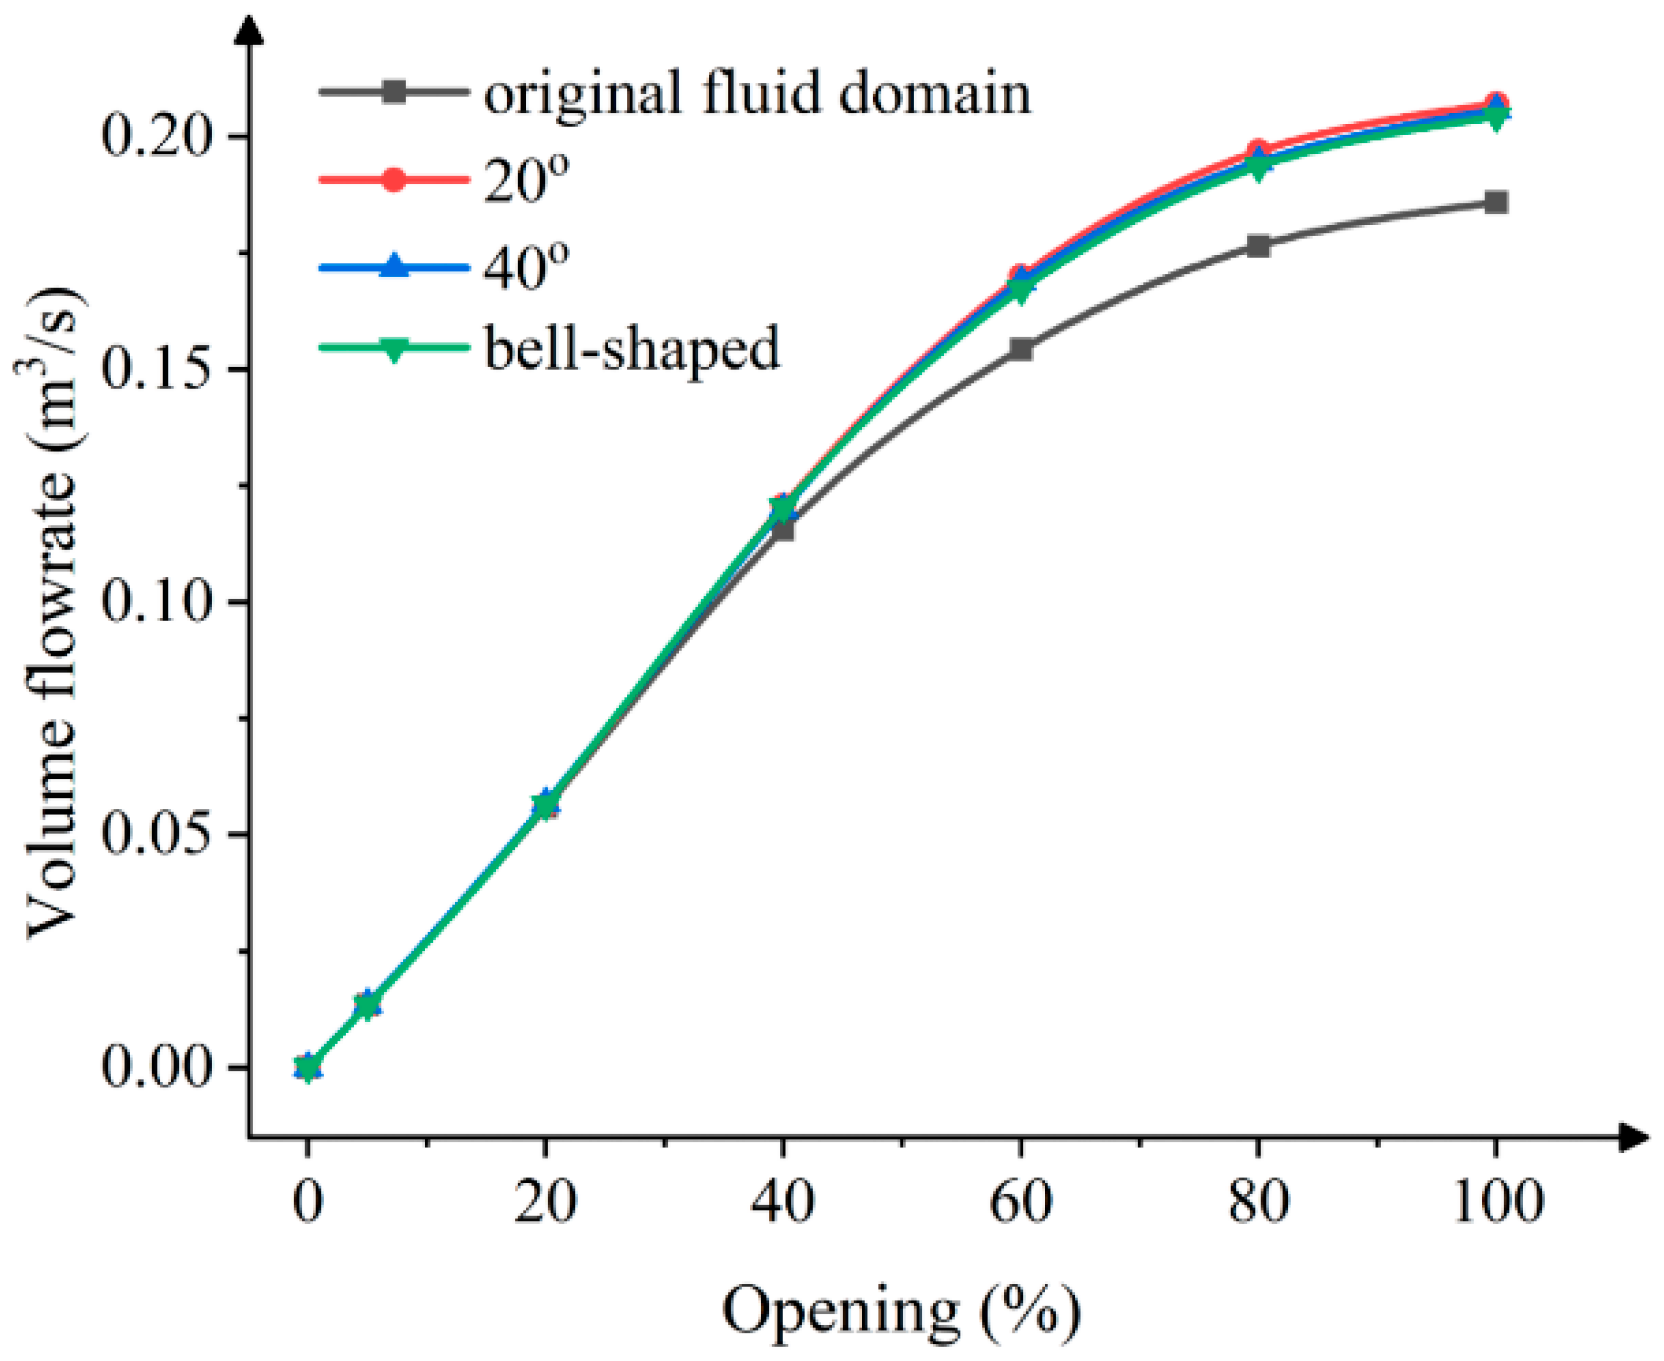
The volume flow calculation results of each fluid domain model under different openings are shown in Table 5. As can be seen from Table 5, as the opening increases, the volume flow of each cone inlet and bell-shaped inlet increases. Under the same opening, the volume flow rates corresponding to different inlet shapes are relatively close. When the opening is 100% and the inlet cone angle is 20°, the volume flow rate is 0.2067 m3/s, and the height increase is 232.52 mm. Compared with the cone angle of 10°, the volume flow rate of the two are similar, but the height increase is reduced by half. When the opening is less than 40%, the increase in volume flow of the cone inlet and bell-shaped inlet is relatively small. When the opening is larger than 40%, the increase in volume flow becomes more significant, among which, when the opening of the cone inlet is 60%, the increase in the volume flow is 3.6 times that under the 40% opening, and, for the bell-shaped inlet at 60% opening, the increase in volume flow is 2.8 times that at 40% opening.
(3)
Comparison of Flow Field Results
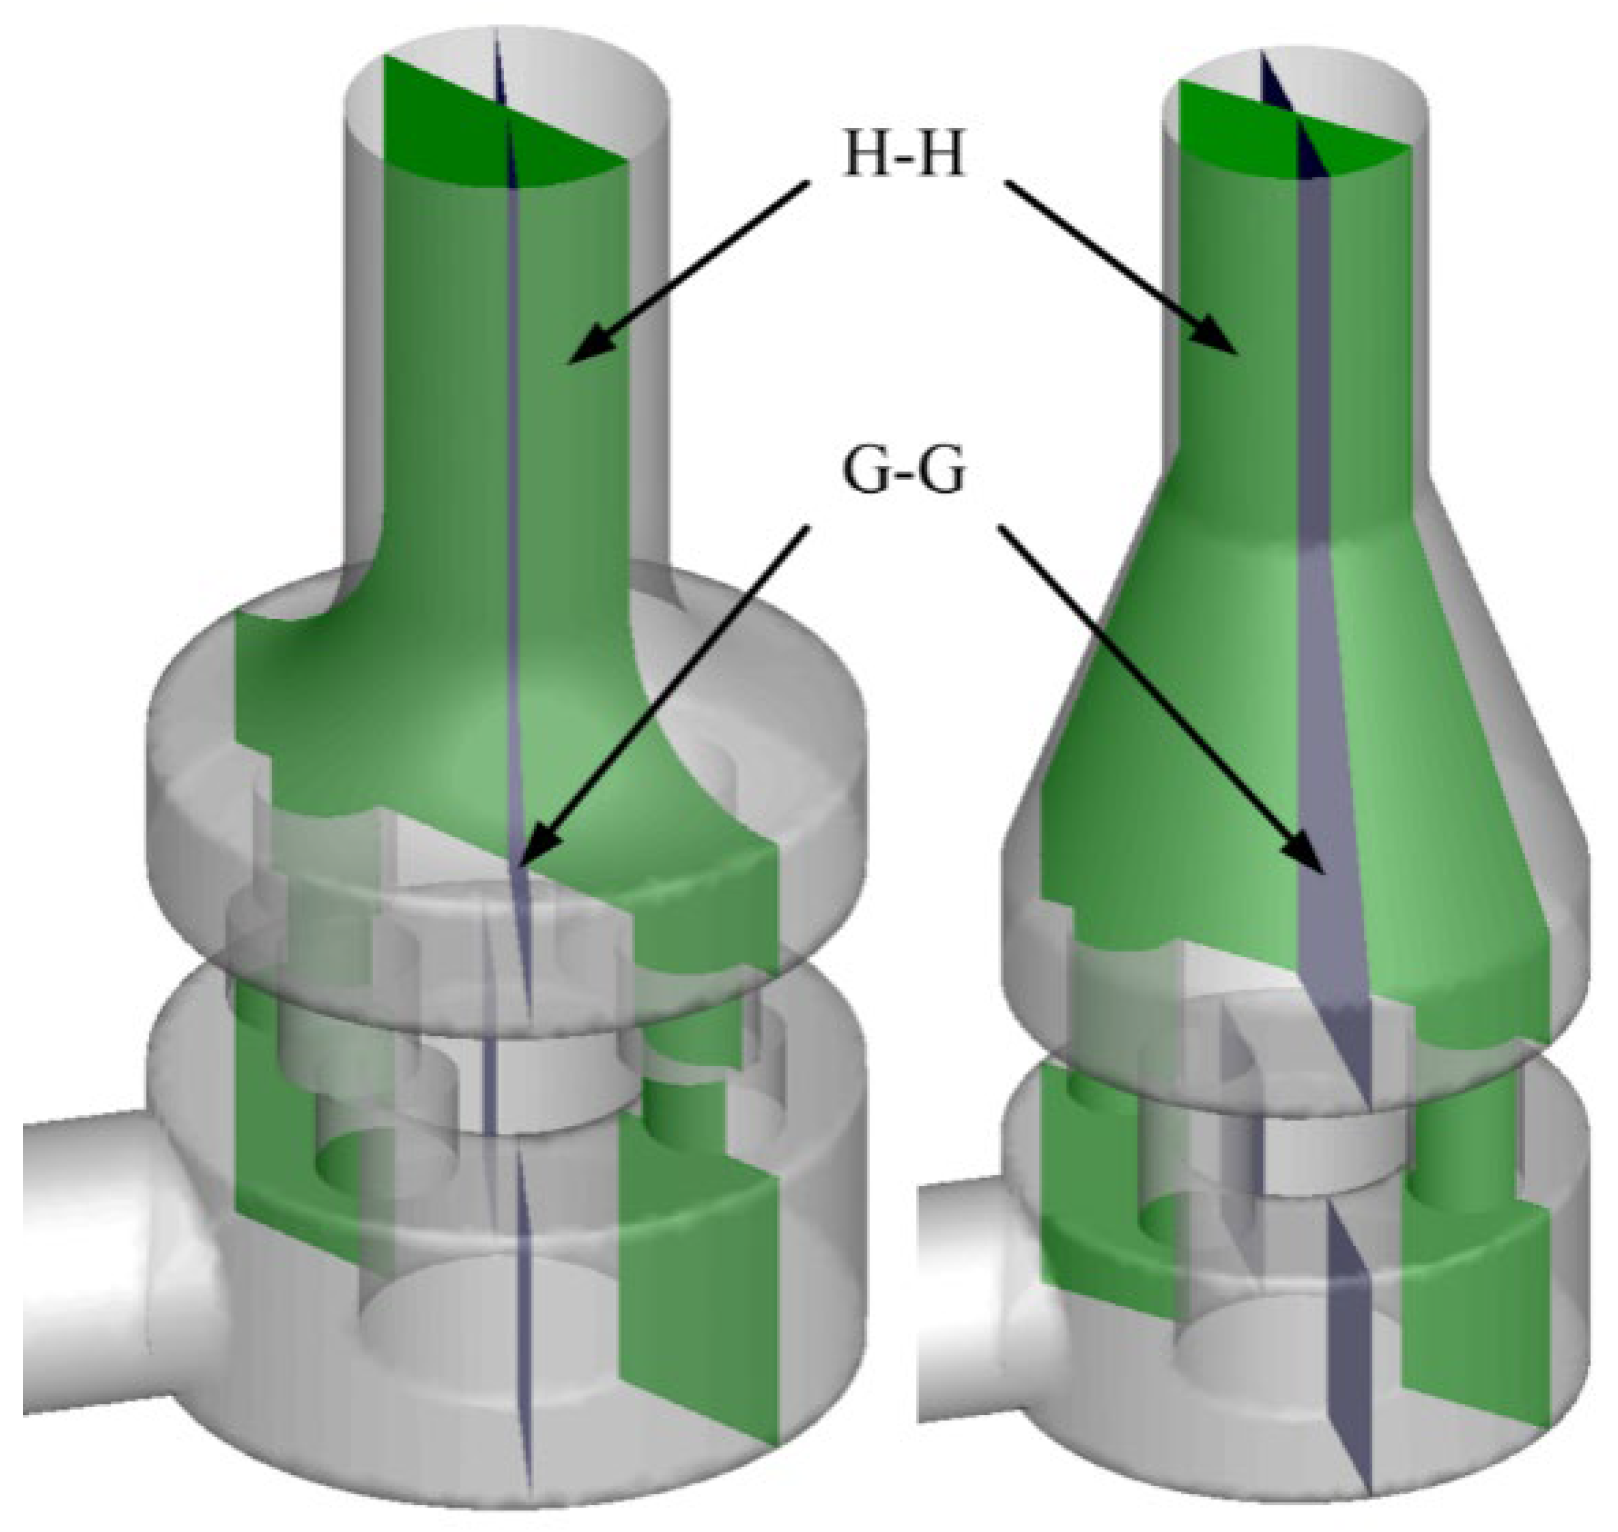
With the increase in the opening degree, the flow rate and flow velocity of each inlet model increase, and the flow field changes become more intense. The model under a 100% opening is selected to make an analysis of the flow field under different inlet shapes. Two sections, G-G and H-H, are taken to describe the flow field of different inlet upper cavities, and the cross-section positions are shown in Figure 11, wherein the left side of Figure 11 is the bell-shaped inlet model, while the right-hand side is the cone inlet model.
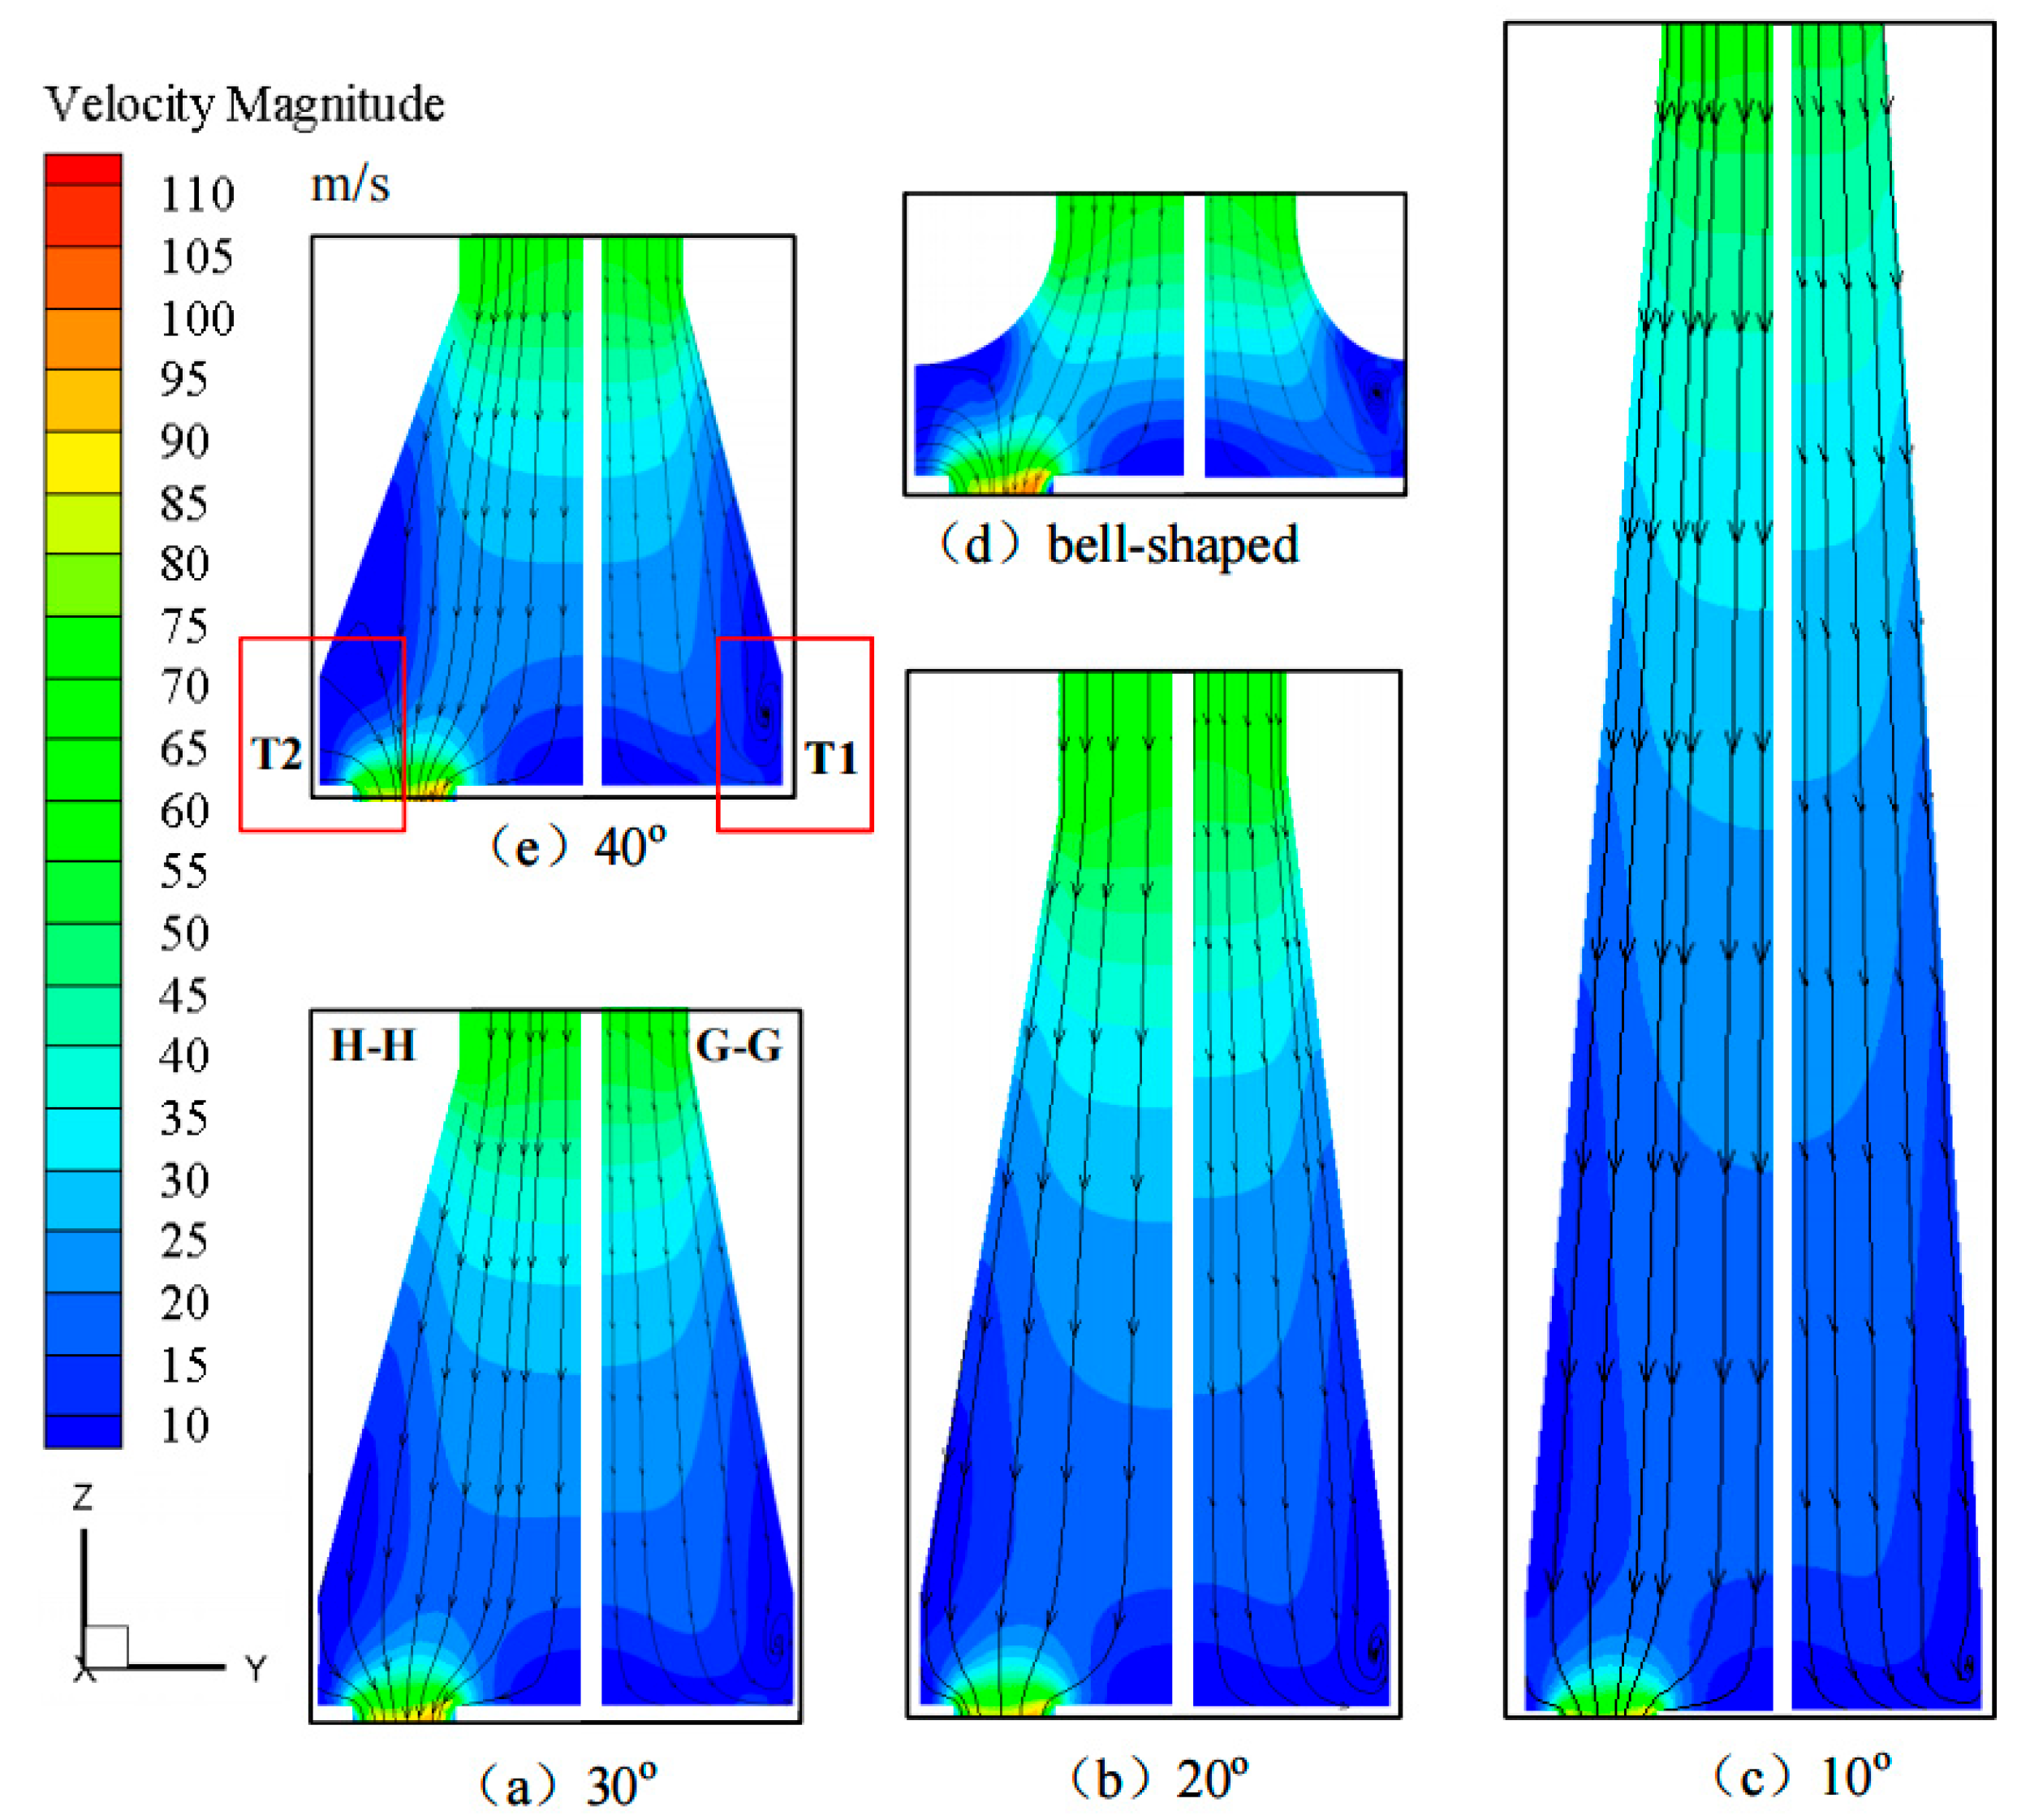
Figure 12c shows the flow field when the inlet cone angle is 10°. The fluid flows along the conical tube, and, as the diameter of the flow section increases, the flow area increases, and the fluid near the conical wall deflects towards the conical wall due to the increase in the pipe diameter. When the opening is fixed, the volumetric flow rate in the fluid domain remains constant. Therefore, the larger the pipe diameter, the relatively lower the flow velocity. In other words, as the fluid flows along the cone, the flow velocity tends to decrease. Moreover, on the same flow section, the flow rate reduction rate of the fluid close to the conical wall is large, and the flow rate reduction rate is small near the cone axis, resulting in a flow-rate difference on the same flow section. Furthermore, as the cone angle decreases, the inlet length increases relatively, that is, the decrease in the cone angle leads to an increase in the fluid flow stroke. During the flow process of the fluid, the friction between the fluid and the wall and the adjacent fluid due to the difference in velocity produce friction between the fluids, continuously convert mechanical energy into heat energy and dissipate.
When the inlet cone angle is 40°, with the increase in the fluid stroke in the cone tube, the velocity gradient of the fluid tends to become flat, and the fluid area within the same gradient range expands, taking on a bell-shaped form. As the fluid moves, a low-velocity region is formed in the center of the upper chamber, and, at this time, the bell shape becomes M-shaped. When the fluid moves to the upper chamber, because the fluid passes through the cone tube, the vortex caused by the sudden change in the flow diameter is slowed down. Compared with the flow field of the original fluid domain, the amount of fluid directly entering the intermediate flow channel increases. Although vortices still form between the main beam and the upper chamber wall in the upper chamber fluid between the two intermediate flow channels, the vortex area decreases, and its intensity decreases (region T1), after which the fluid flows into the middle flow channel (region T2).
As shown in Figure 12a–e, with the increase in the cone angle, the stroke of fluid motion decreases, and the velocity gradient distribution of fluid in the cone tube is gradually intense. In the upper chamber, as the cone angle increases, the vortex area T1 expands, the amount of fluid directly entering the intermediate channel decreases, and the amount of fluid flowing into the intermediate channel increases after the vortex is formed. Additionally, as the cone angle increases, the velocity distribution of the same gradient tends to be M-shaped. As shown in Figure 12d, the velocity gradient distribution of the bell inlet is more intense than that of the cone inlet. Also, the velocity distribution of the same gradient is M-shaped because the height increase in the bell-shaped inlet is relatively small.
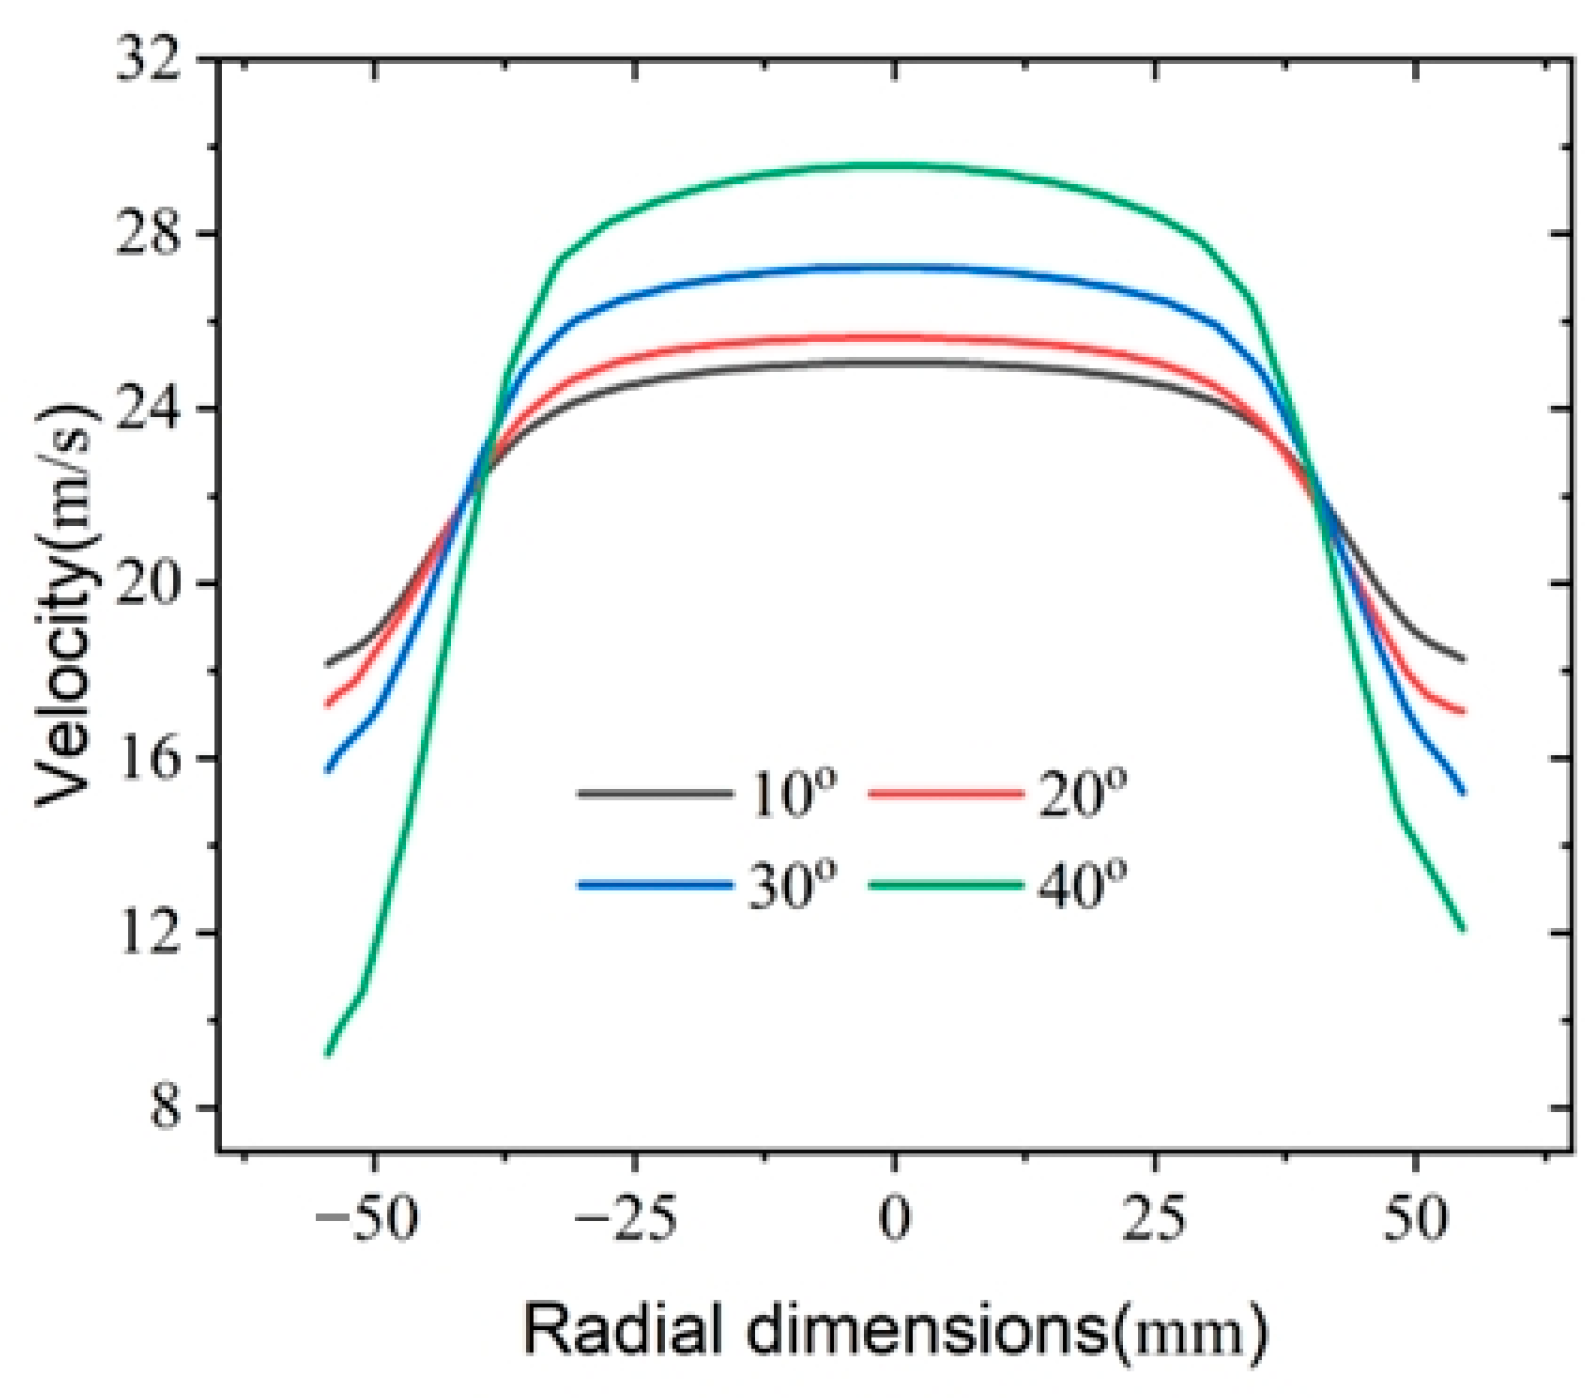
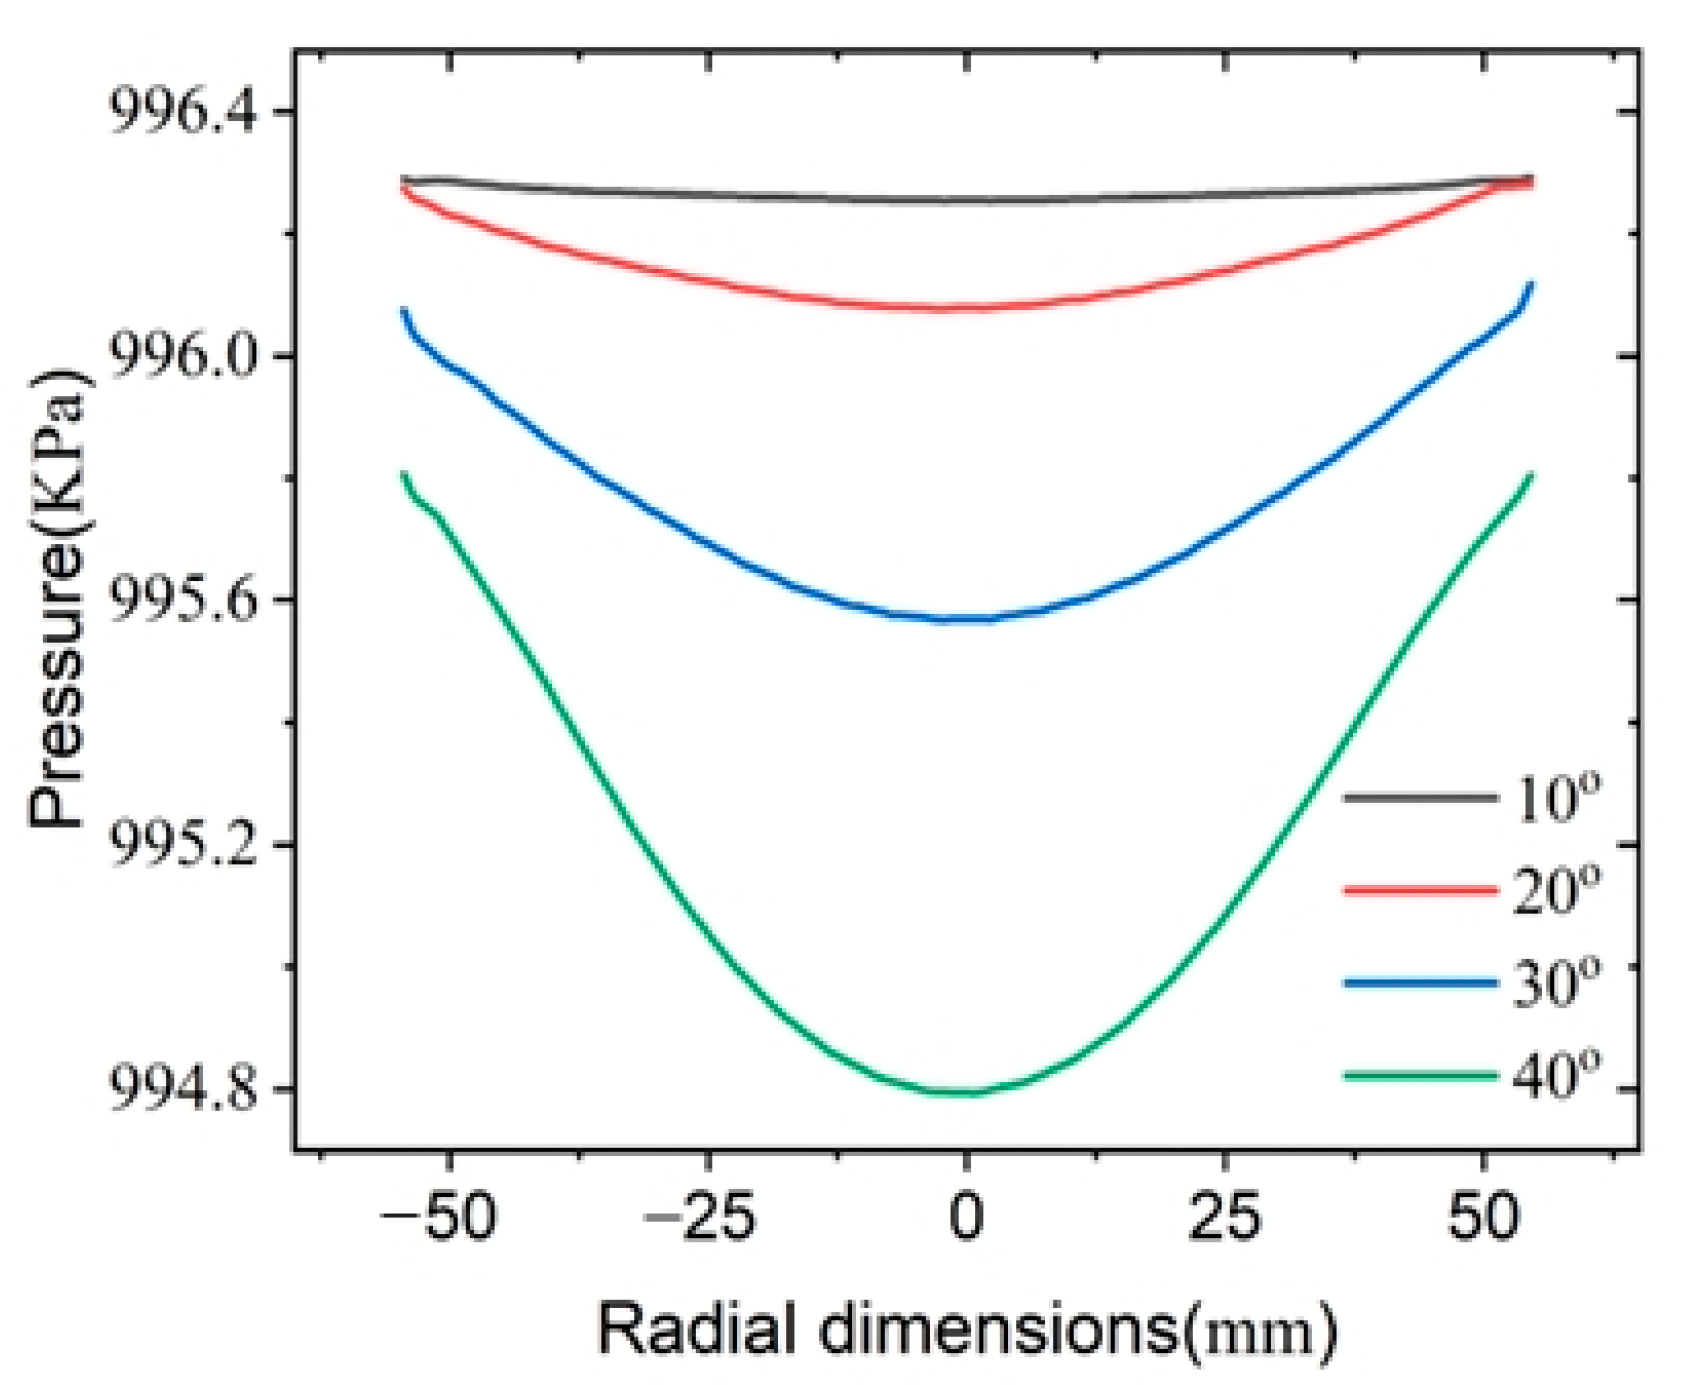
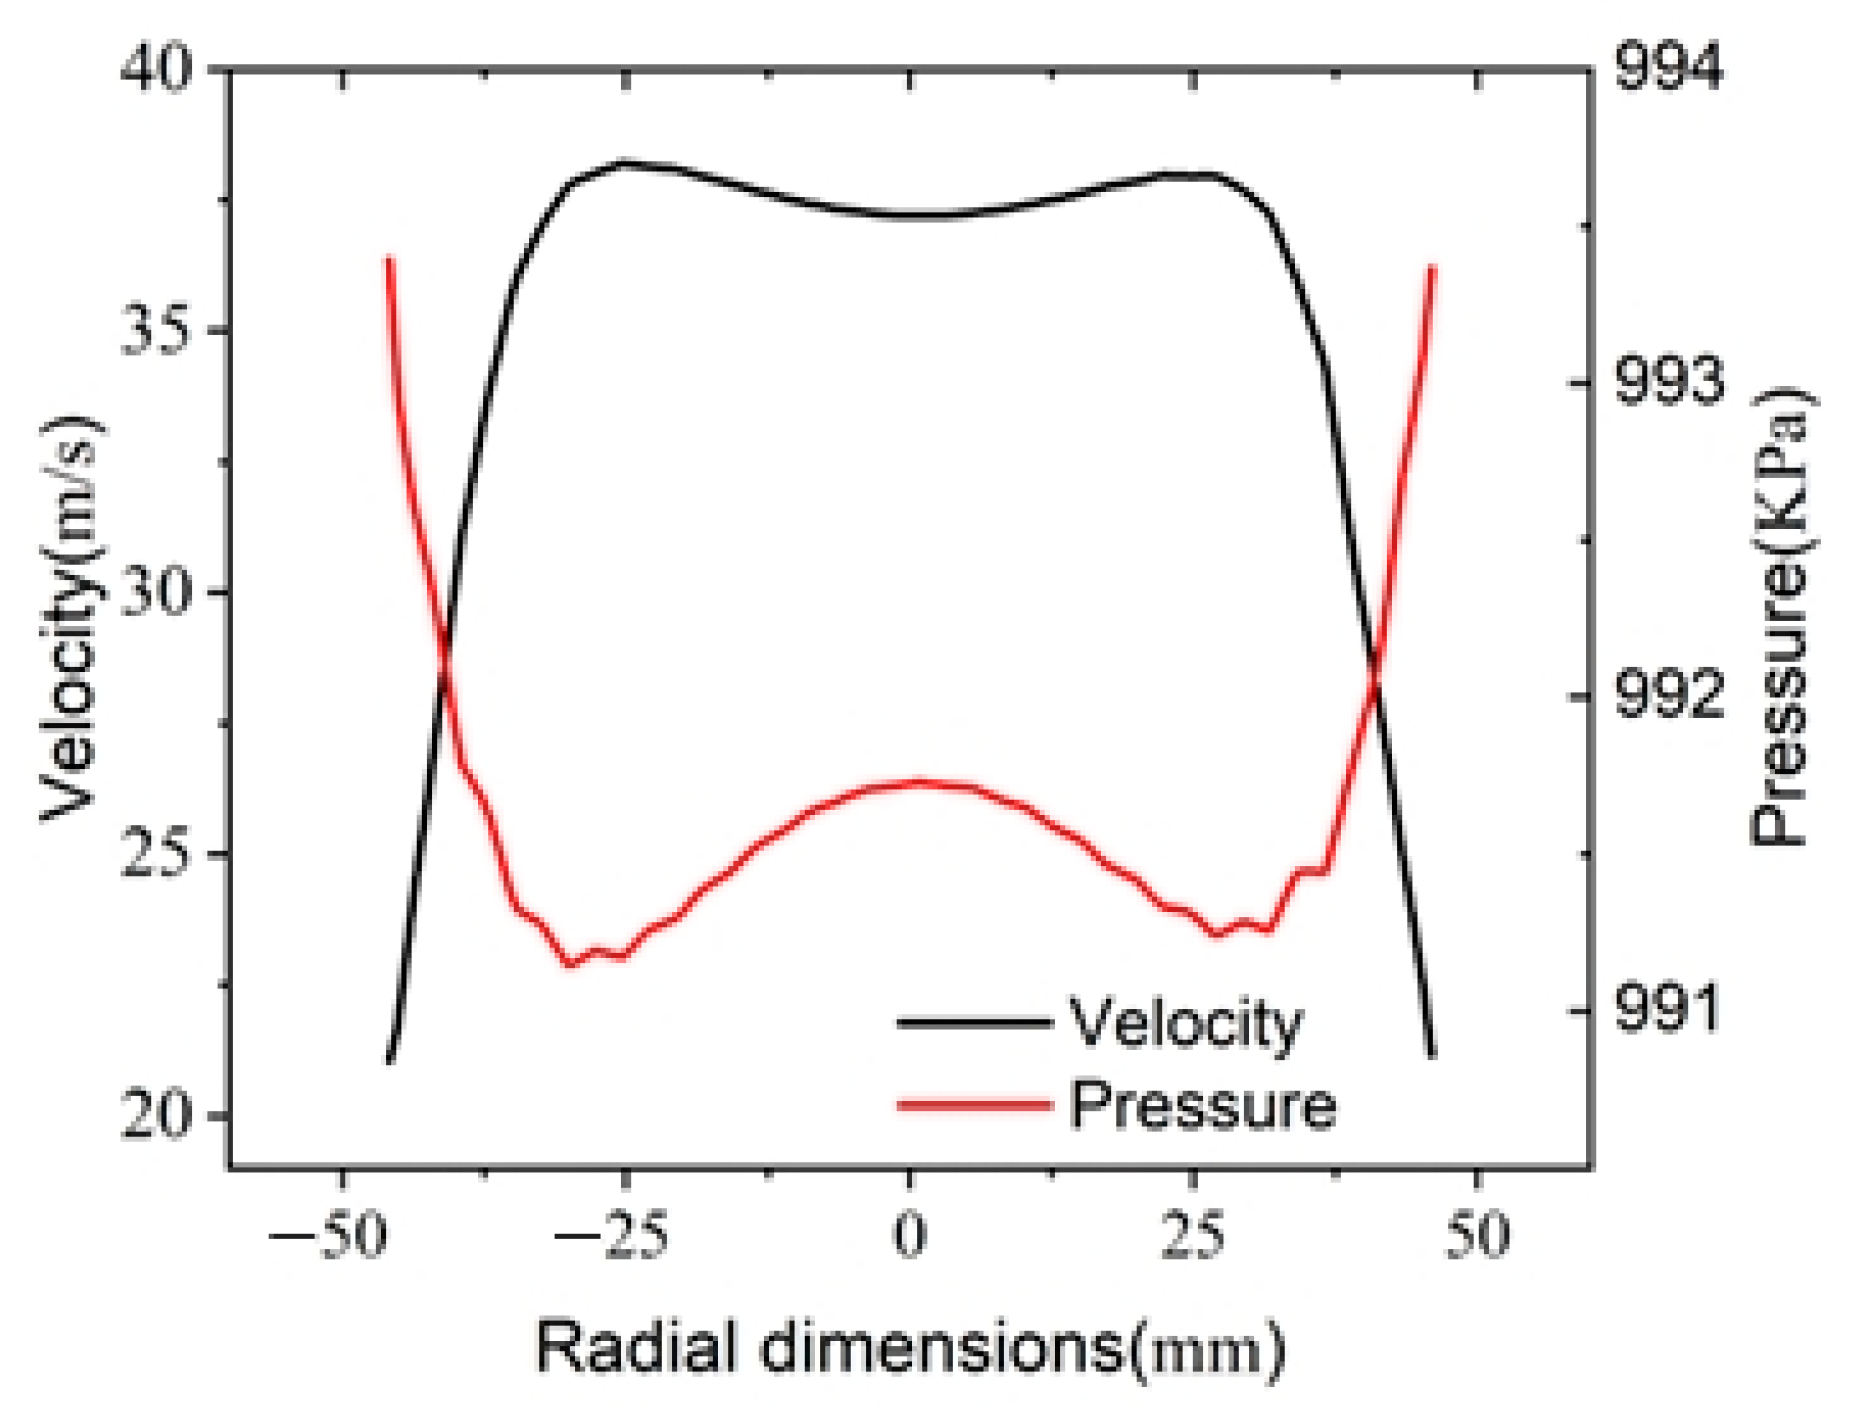
When the opening degree is 100%, in the section H-H, the middle positions of each inlet pipe are considered. The straight lines corresponding to the 10°, 20°, 30° and 40° cones and bell-shaped inlets are Z = 266.315 mm, Z = 148.260 mm, Z = 108.505 mm, Z = 88.325 mm and Z = 44.009 mm, respectively. Their speed and pressure distributions are shown in Figure 13 and Figure 14. At the same height, for the cone tube, the speed and pressure on both sides are relatively small, while the middle speed is large, and the pressure is small. Overall, the speed and pressure change with the radial direction, showing a bell-shaped pattern. Additionally, as the cone angle increases, when the radial size is greater than 36 mm, the speed decreases, and, when the radial size is less than 36 mm, the speed increases. In general, the speed and pressure at the middle position of the bell-shaped entrance are M-shaped, and the change trend of pressure and speed is just the opposite. At the radial size of 46 mm, the pressure reaches its maximum size, and the speed is at its minimum. At the central position and the radial size of 28 mm, local peaks and troughs occur, as shown in Figure 14.

4.1.2. Influence of Upper Chamber Height

The main beam impacts the bottom surface of the upper cavity, deflects in direction, and subsequently flows radially. Part of it joins the middle flow channel, while the other part impacts the side wall of the upper cavity. The fluid is deflected upward along the side wall and deflects again after hitting the top surface of the upper cavity, and, then, it forms a vortex driven by the mainstream beam and finally merges into the middle flow channel. Therefore, the upper chamber height is one of the factors affecting the formation of the vortex of the upper chamber, and its influence on the flow field of the upper chamber is studied by varying the upper chamber height.
(1)
Selection of the Height of the Upper Chamber
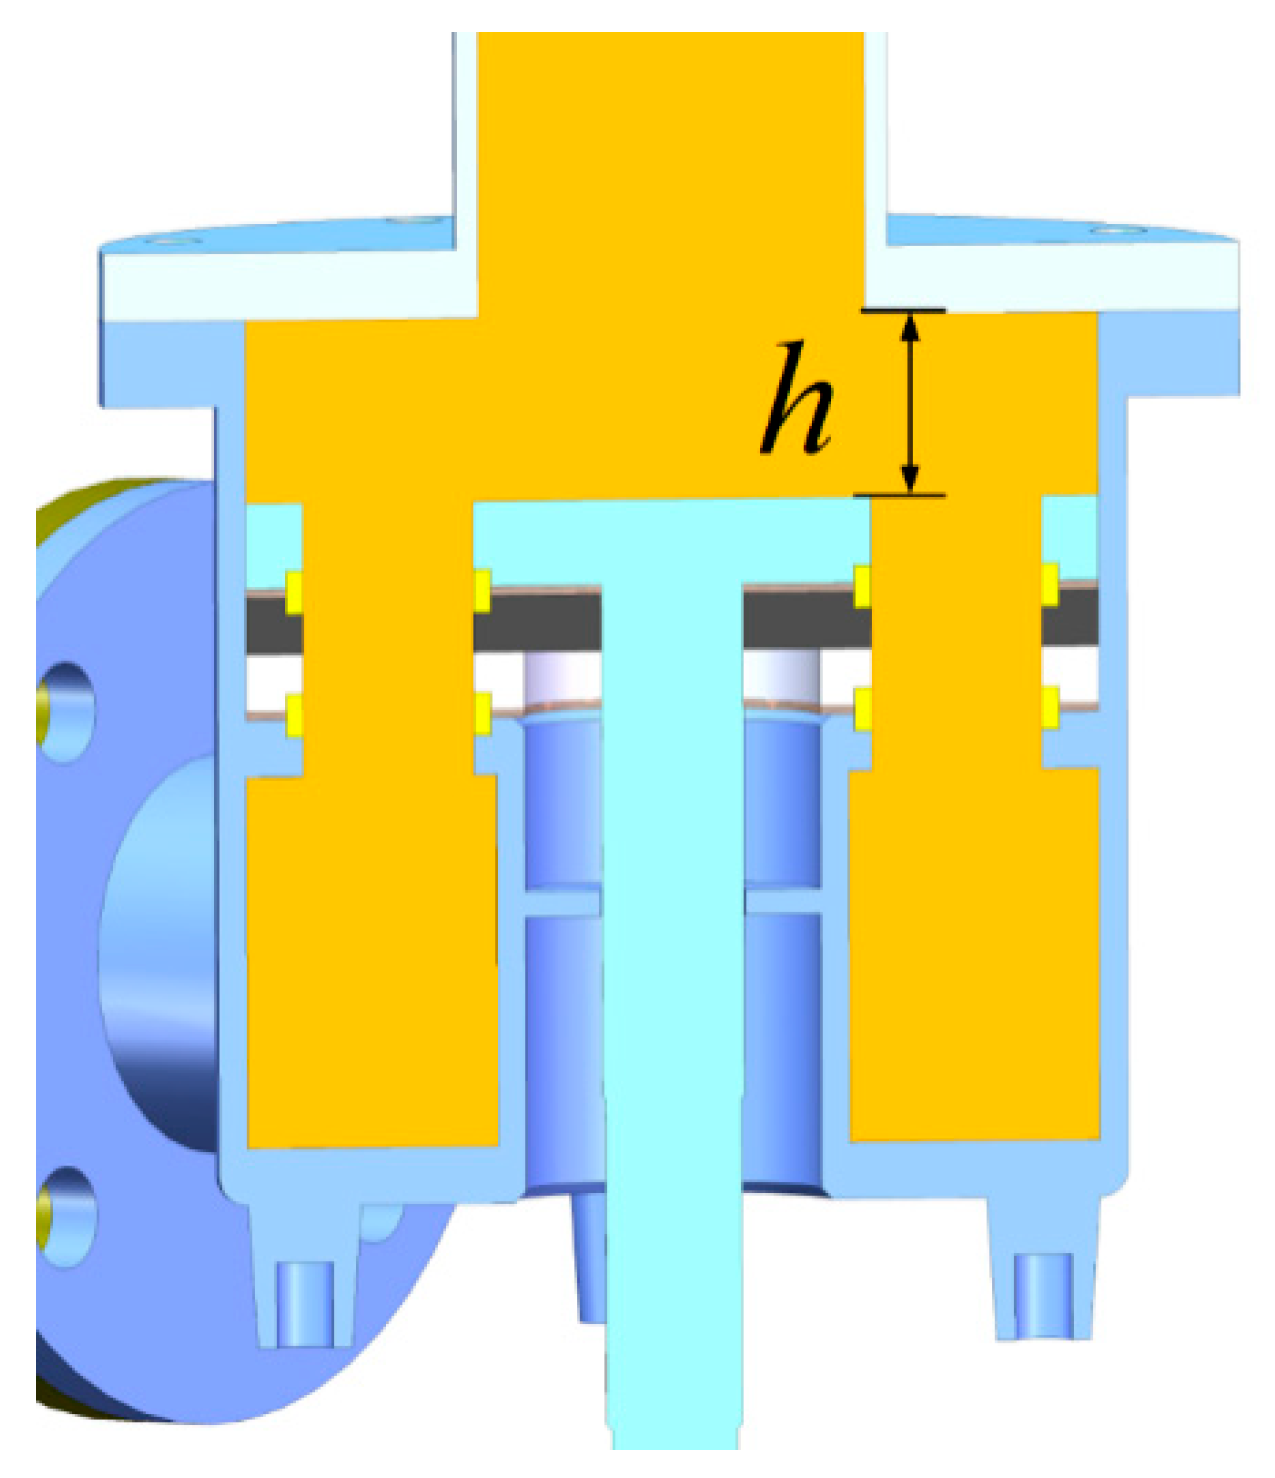
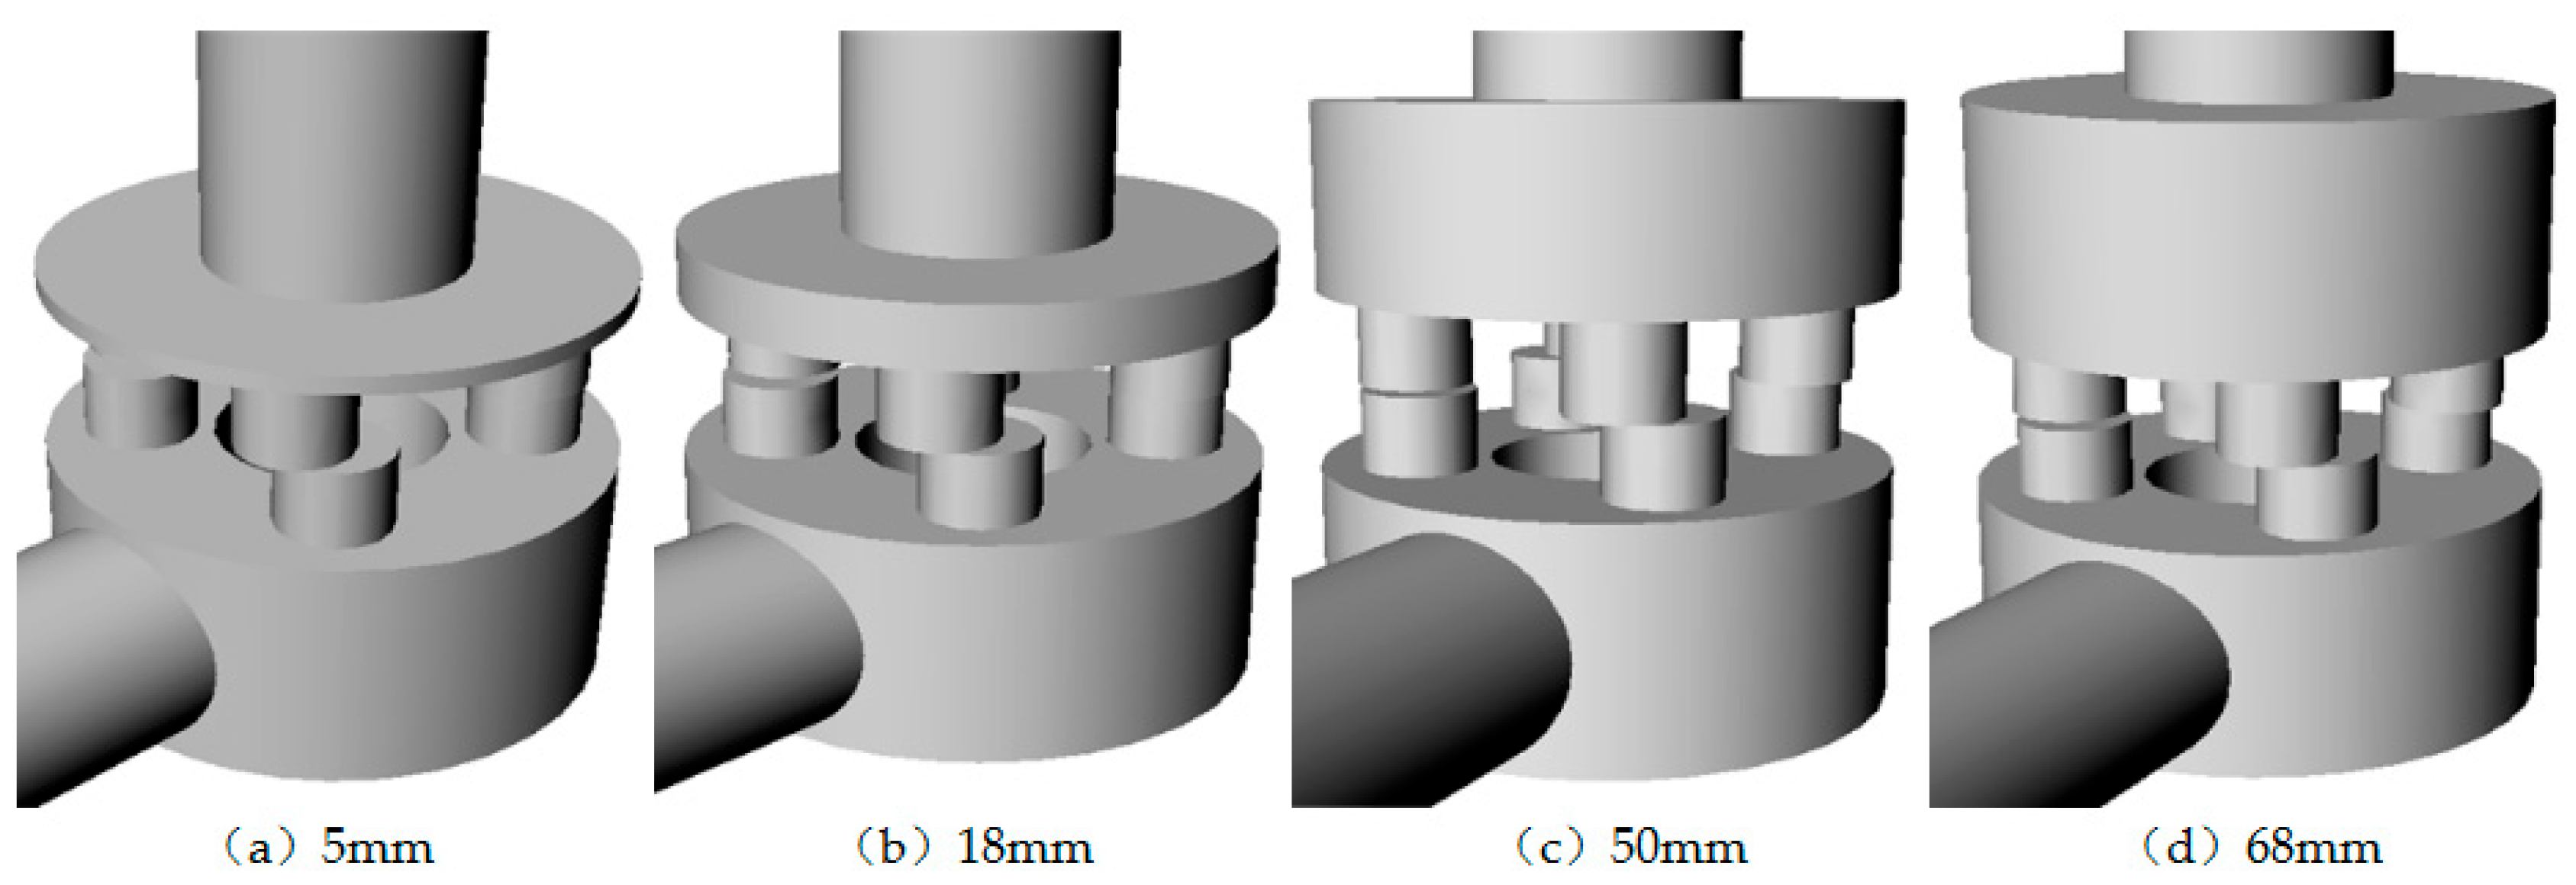
Figure 15 shows a schematic diagram of the upper chamber. The main-beam impact on the bottom surface of the upper cavity is similar to that of the jet impact plate, and the height h of the upper cavity represents the impact distance. The height of the upper cavity of the original control valve is 32 mm, and the other upper cavity heights are set as 5 mm, 18 mm, 50 mm and 68 mm, respectively. The fluid domain model is reconstructed accordingly, as shown in Figure 16.
(2)
Volume Flow of Outlet
The calculation results of the volume flow in the fluid domain of each upper cavity height under different openings are shown in Table 6.
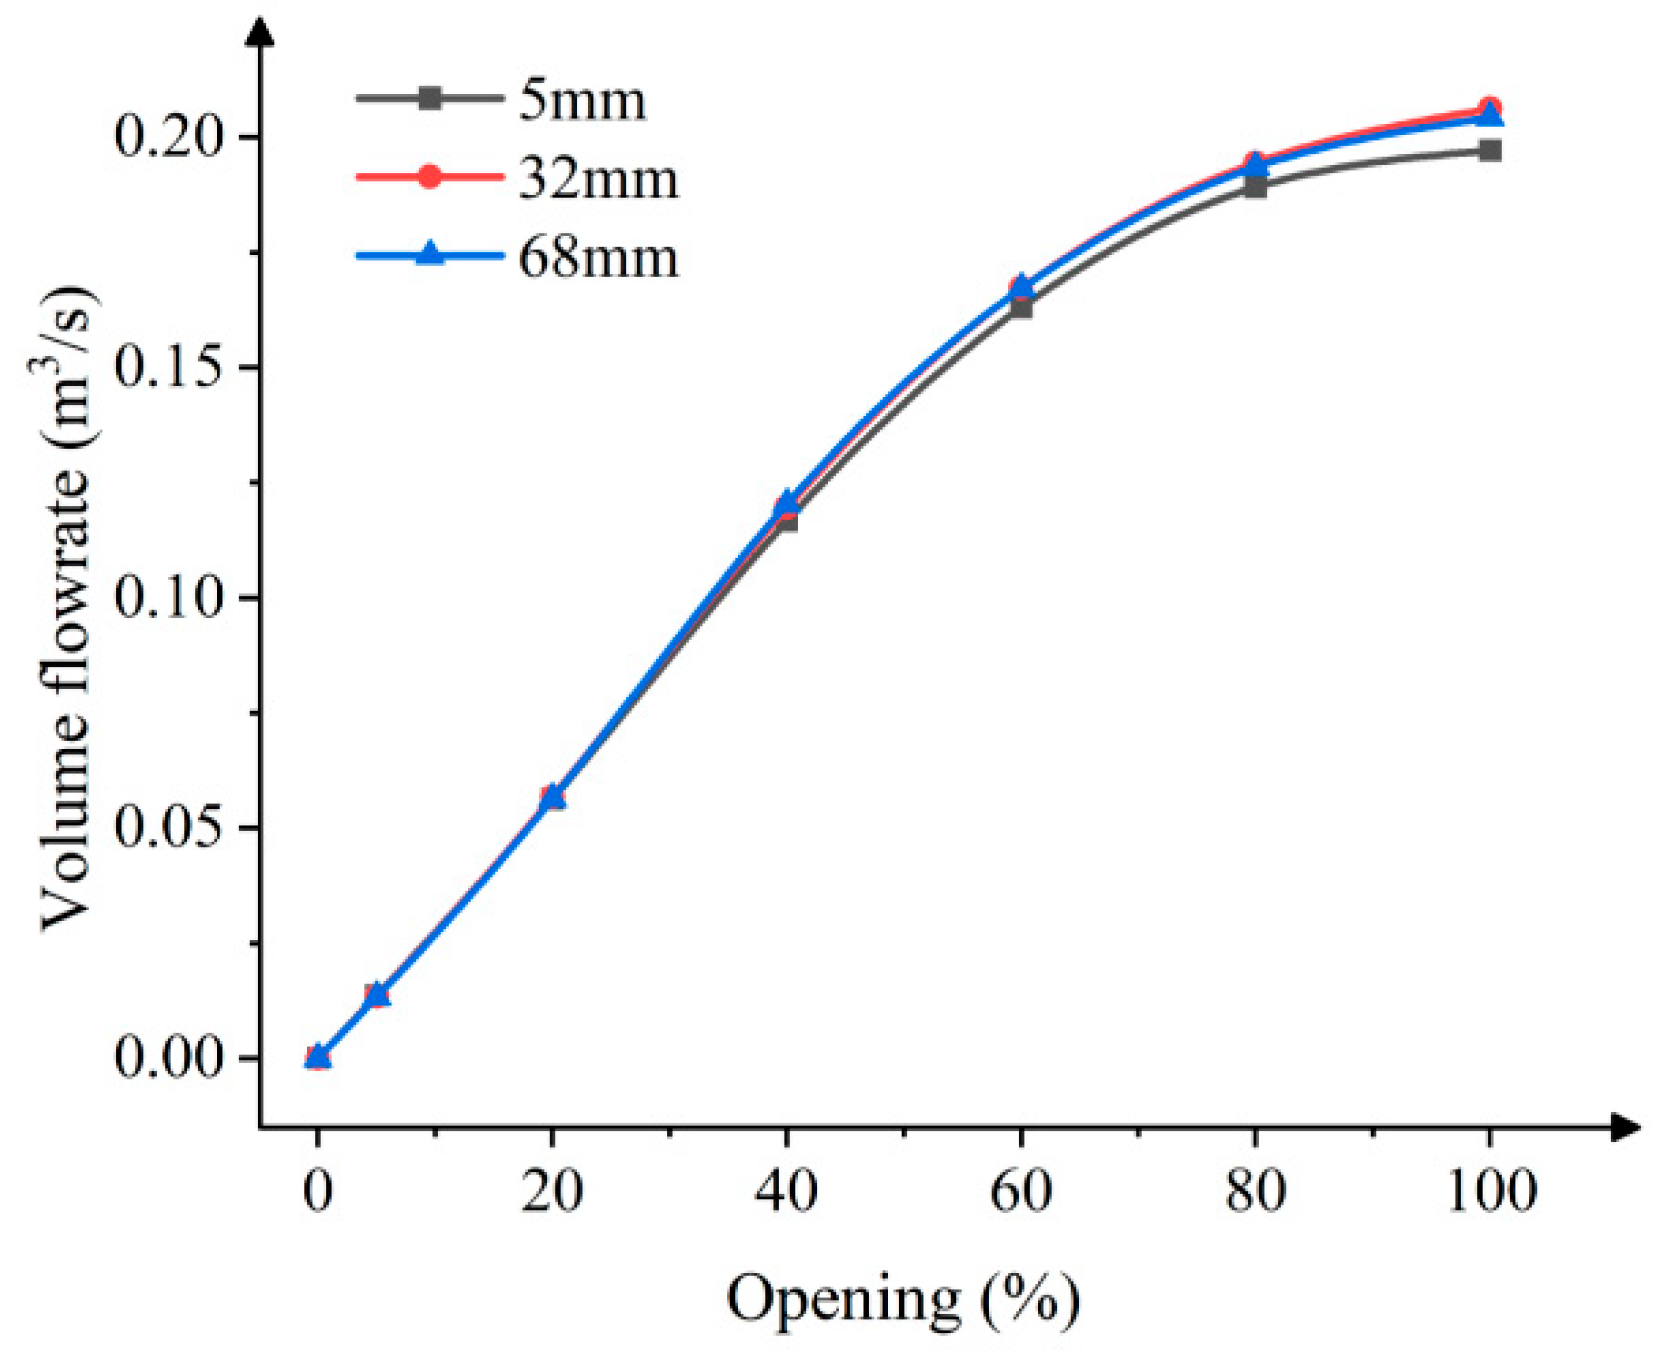
Based on Table 6, the opening flow curve for each upper cavity height fluid domain is plotted, as shown in Figure 17. As the opening increases, the volume flow of each upper cavity height increases. Among them, when the opening is 5%, the volume flow rate at the height of the upper cavity of 5 mm is the largest compared to other upper cavity heights. However, when the opening is greater than 60%, the volume flow rate of the upper cavity height of 5 mm increases slowly. When the height of the upper cavity increases sequentially from 5 mm to 18 mm and 32 mm, the volume flow rate increases under the same opening, but, as the height of the upper cavity increases further, the volume flow rate approaches that of the original fluid domain.
(3)
Comparison of Flow Field Results
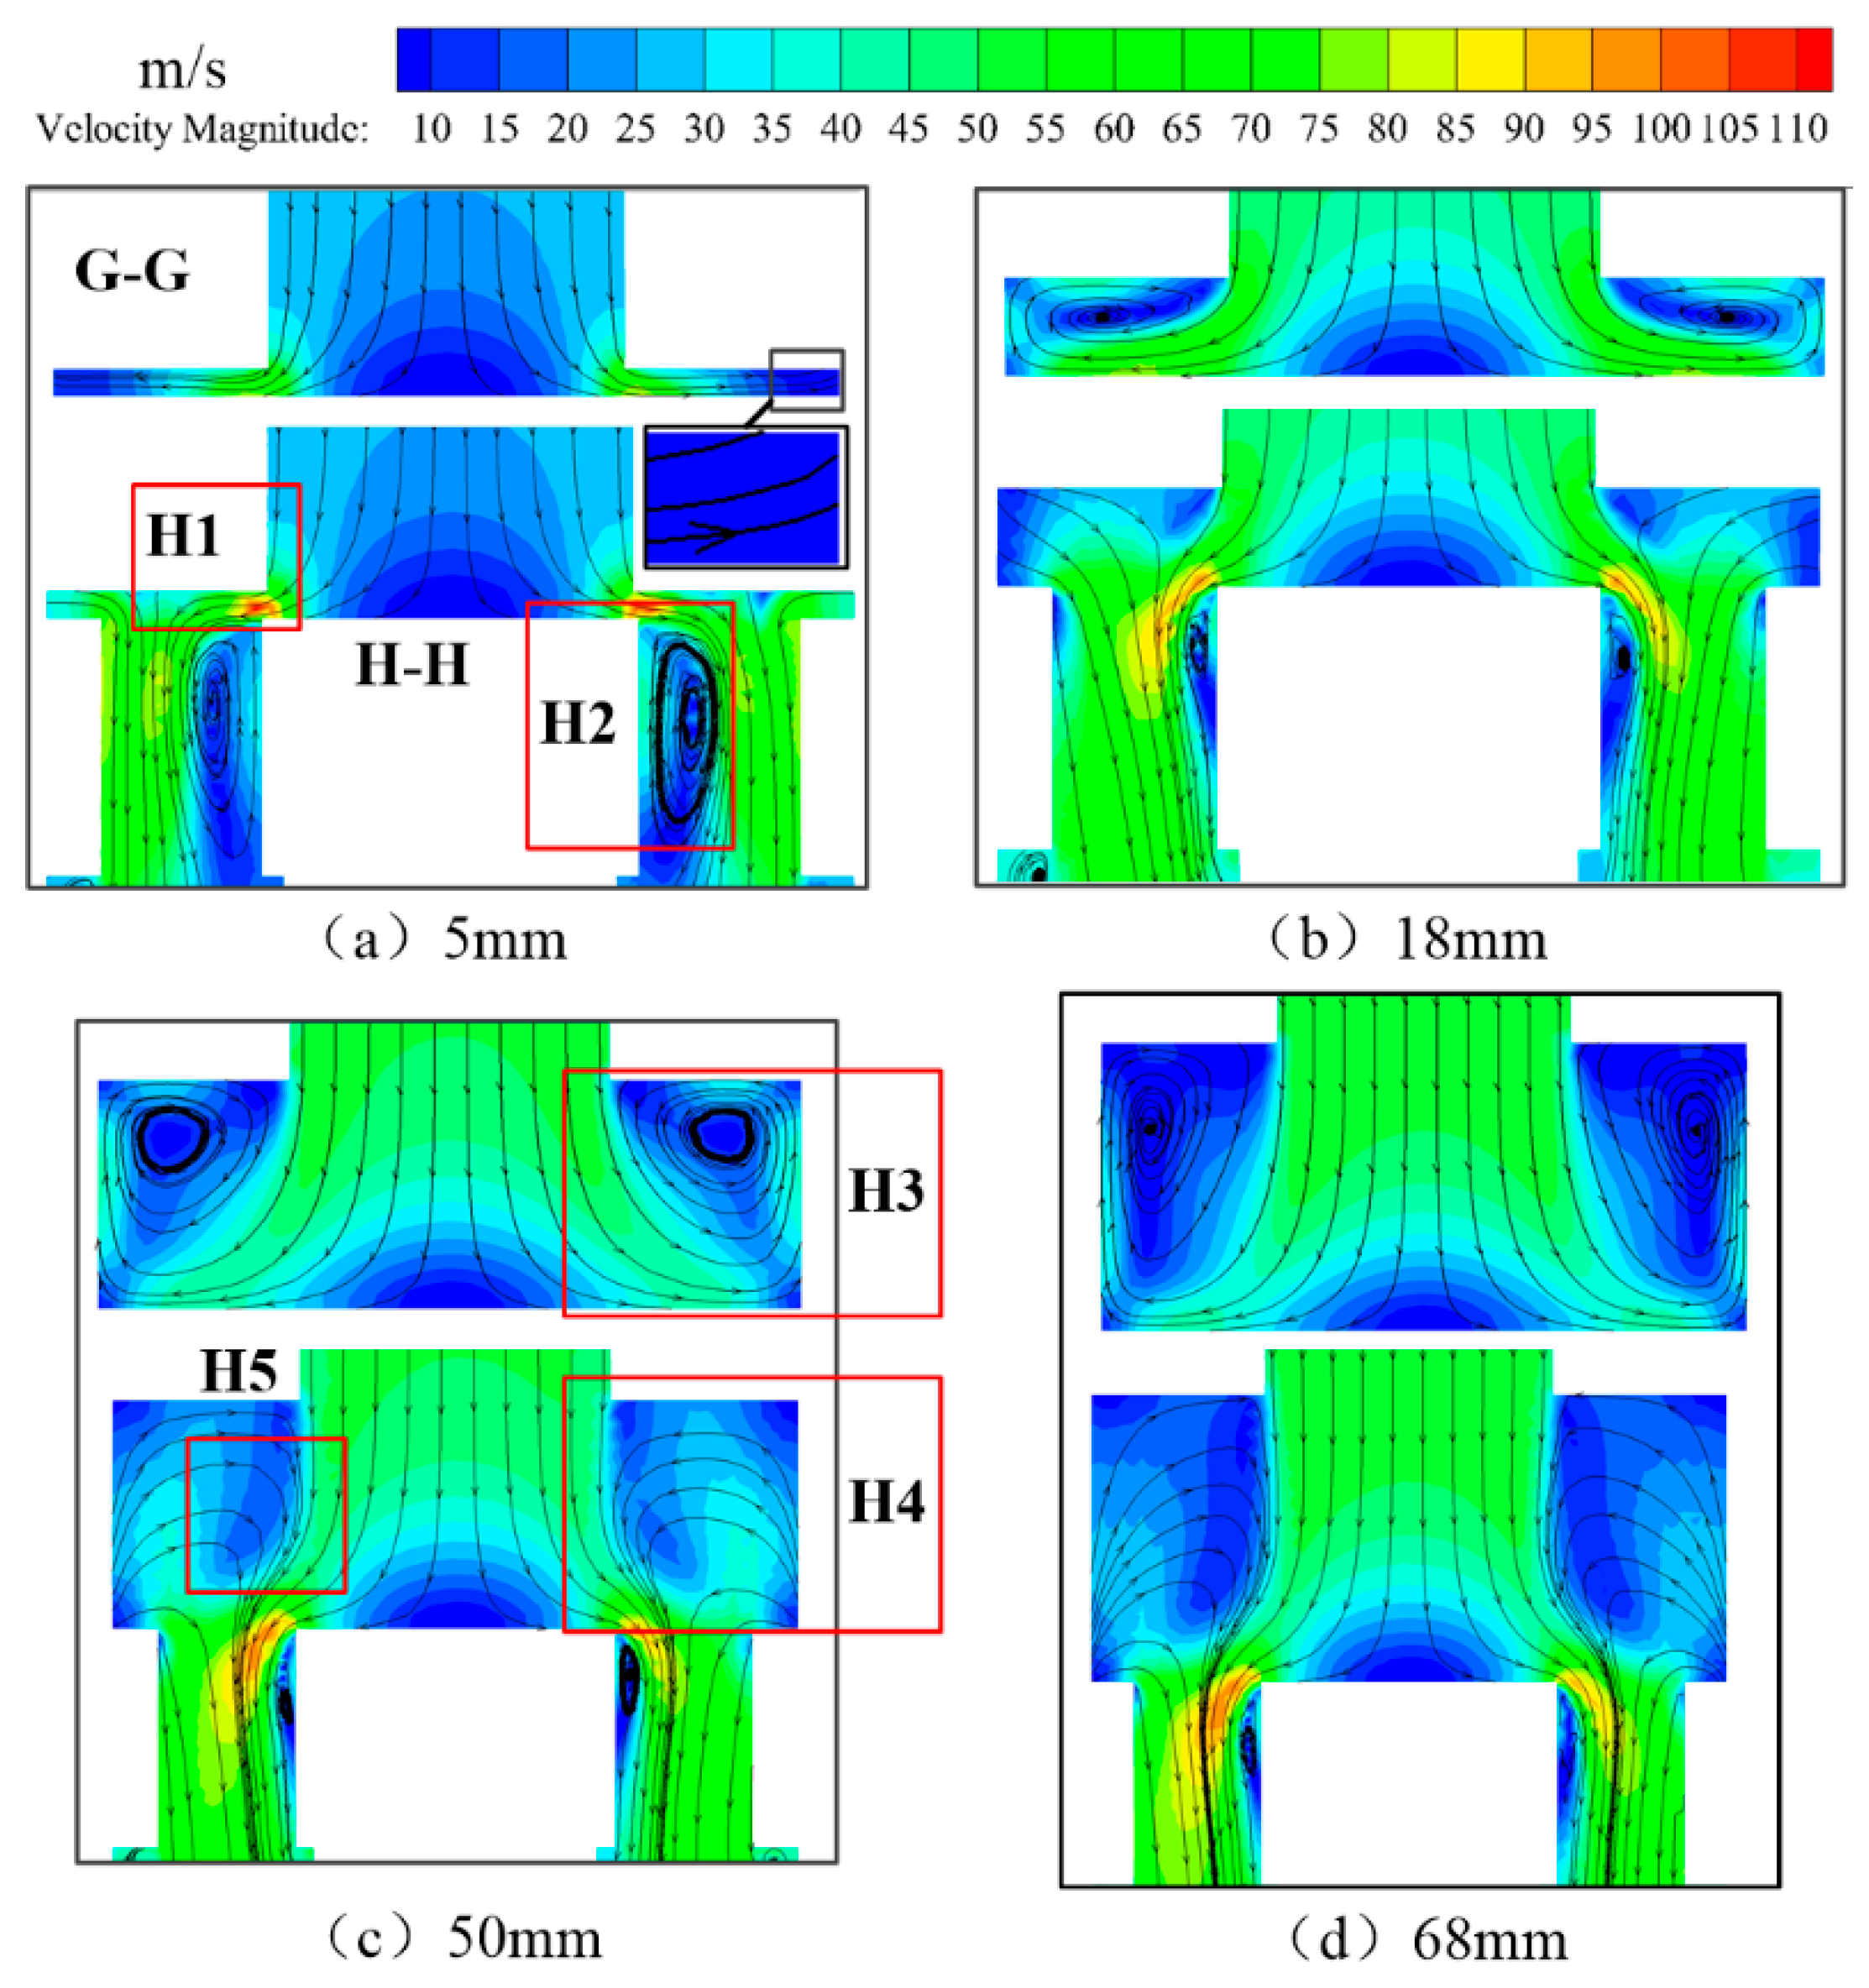
The cross-section at the same position in Figure 11 is selected for the analysis of the upper cavity flow field, and the calculation results are shown in Figure 18. In Figure 18a, when the opening is 100% and the height of the upper cavity is 5 mm, a throttle (area H1) is formed between the top and bottom surfaces of the upper cavity in the area above the middle flow channel. This throttle obstructs the flow of fluid to the intermediate flow channel, causing a sharp change in the flow rate at the throttle port. Additionally, in the upper chamber, no significant vortex is formed in the region between two adjacent intermediate runners (region H3). Furthermore, at the inner corner of the middle upper side channel, due to the creation of the throttle, the fluid forms a jet there, and a vortex is formed on the inside of the middle upper side channel (area H2). In Figure 18a–d, as the height of the upper cavity increases, a vortex is formed at region H3, and the vortex in this region gradually approaches the side wall and top surface of the upper cavity. Due to the existence of this vortex, the flow beam directly flowing into the middle channel does not show an increasing trend (regions H4, H5). The vortex at H2 and the low-velocity region tended to decrease with the increase in the height of the upper cavity.
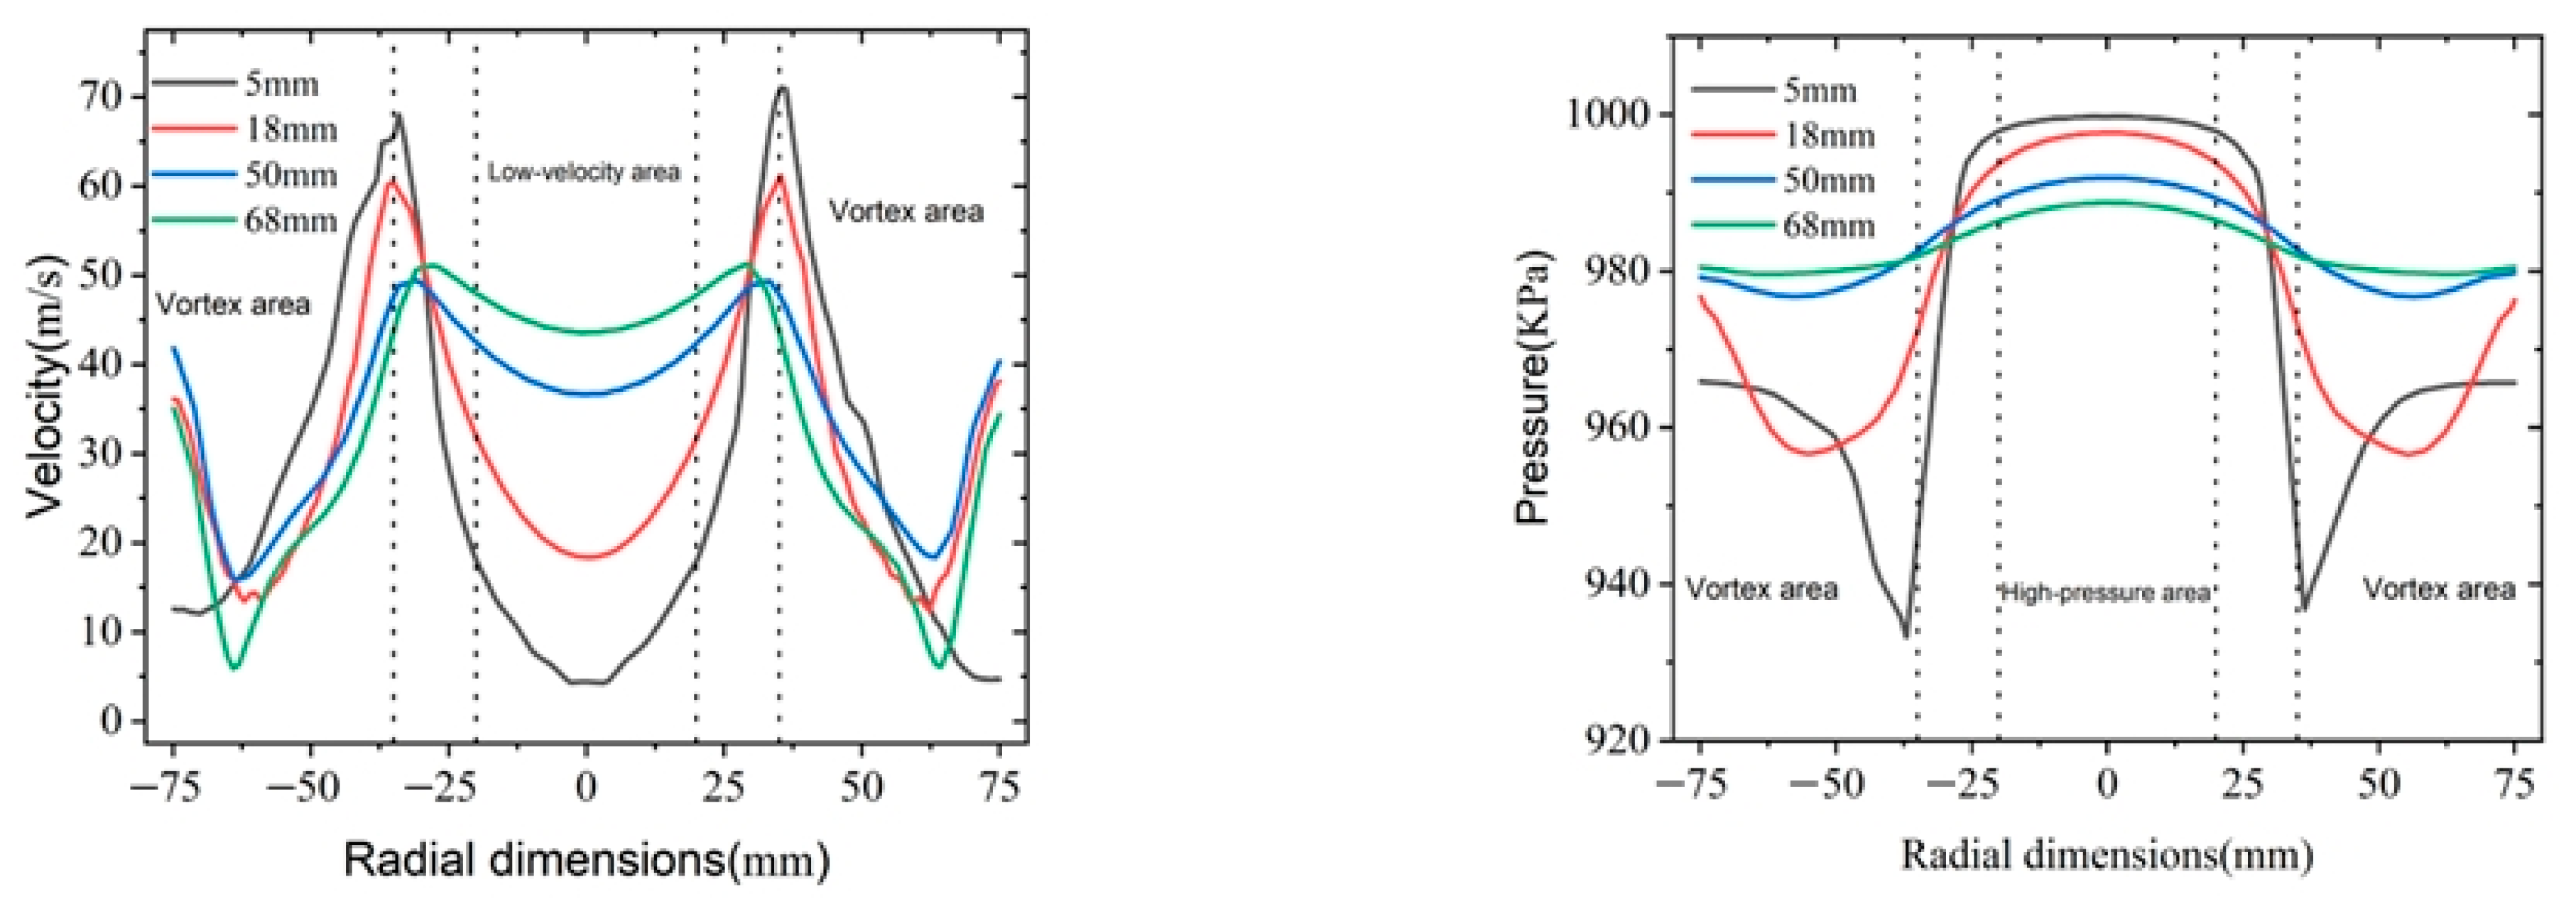
Because the flow field changes most drastically at 100% opening, the velocity and pressure at the middle of each upper cavity in the G-G section are shown in Figure 19. Among them, the intermediate straight lines corresponding to the heights of 5 mm, 18 mm, 50 mm and 68 mm are Z = 2.5 mm, Z = 9 mm, Z = 25 mm and Z = 34 mm, respectively. When the height of the upper cavity is 5 mm, at the radial size of 36 mm, velocity peaks and pressure troughs occur. Additionally, as the height of the upper cavity increases, the radial size of the velocity crest decreases, the peak decreases, the radial size of the pressure trough increases and the trough value increases. When the radial size is 63 mm, the speed reaches a trough, and, with a further increase in the radial size, the speed and pressure show an increasing trend.

4.1.3. The Combined Influence of the Shape and Height of the Upper Chamber Inlet

Based on the results from the previous two sub-sections, the influence of both on the volume flow rate is studied, considering the simultaneous change in the shape and height of the upper cavity inlet.
(1)
Selection of Models
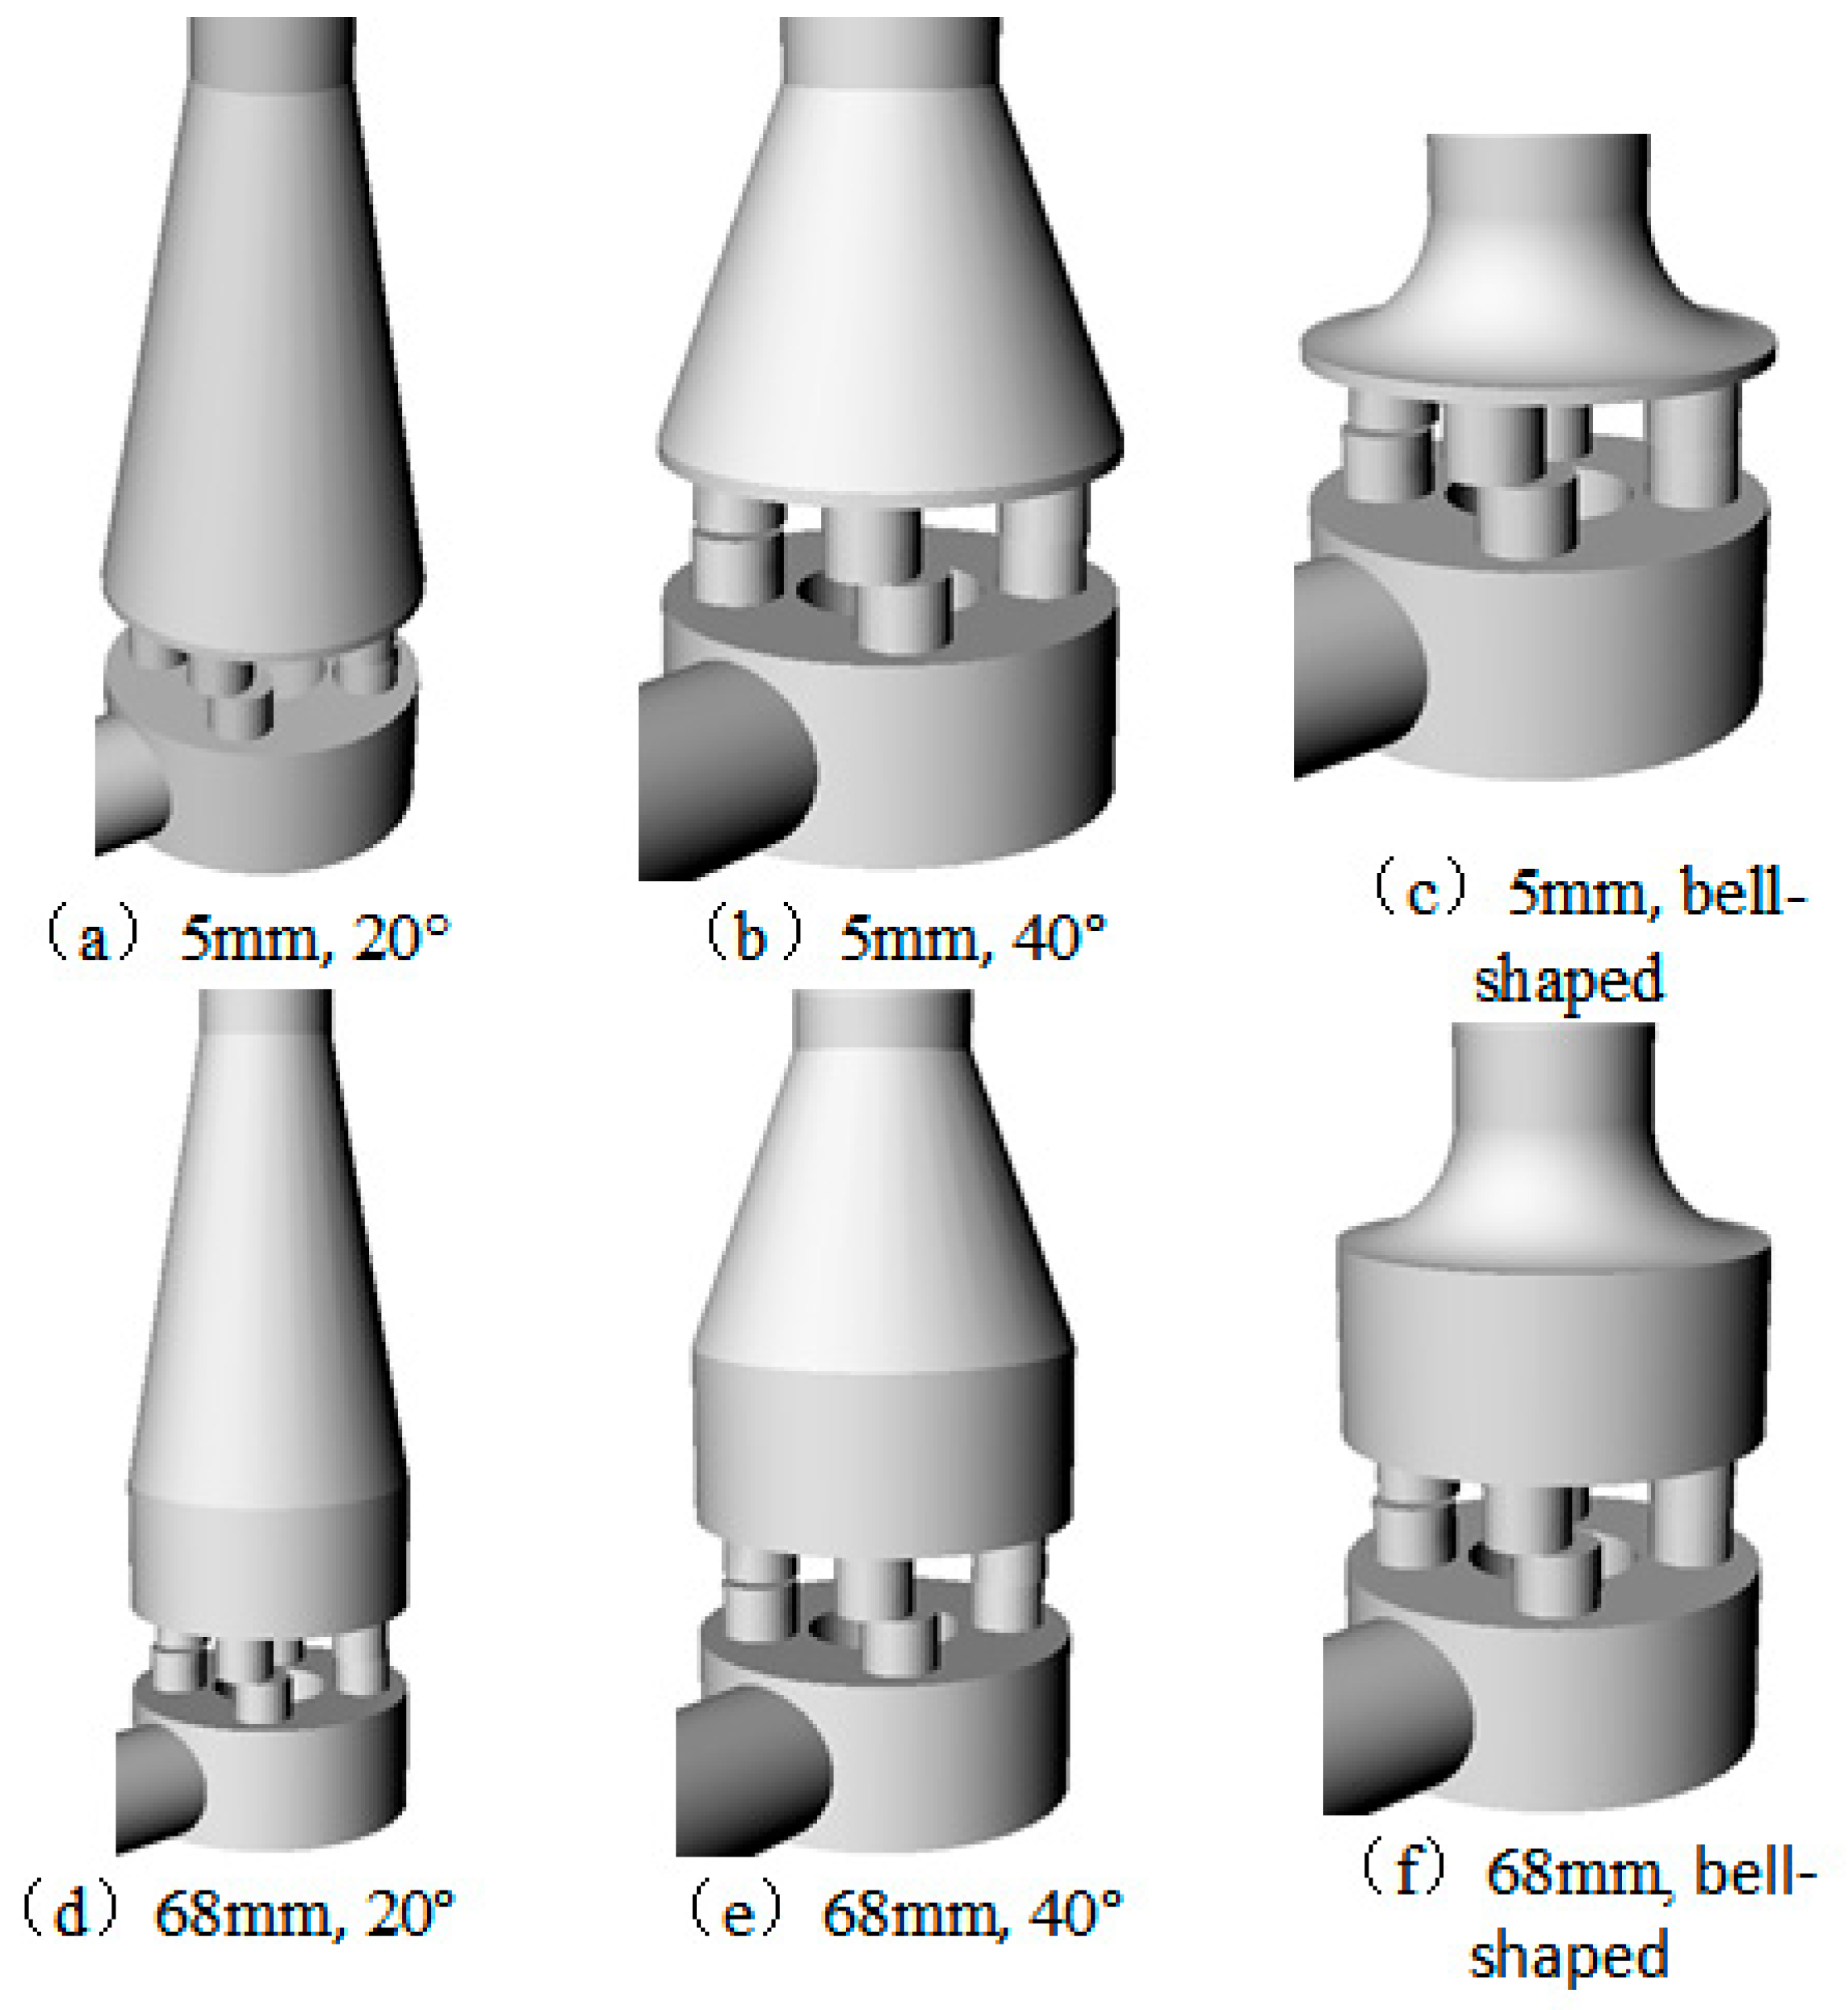
Cone angles of 20° and 40° are chosen as the medium and large cone angle, respectively, while the heights of the upper chamber of 5 mm and 68 mm are selected as the small and large upper-cavity heights, respectively. Additionally, a bell-shaped entrance is adopted. The inlet cone angle and upper chamber height are set in pairs, and the fluid domain model is shown in Figure 20. The upper chamber of the fluid domain of the original control valve experiences a sudden enlargement at the inlet, with a height of 32 mm.
(2)
Changes in Volume Flow
When simultaneously changing the upper cavity inlet and height, the volume flow calculated for each fluid domain is shown in Table 7. By combining Table 5, Table 6 and Table 7, the opening-flow curve is plotted, as shown in Figure 21, Figure 22 and Figure 23. However, it is observed that, when the inlet adopts 20° and 40° cones, the height of the upper cavity has a negligible effect on the volume flow, and the opening flow curves almost overlap.
As shown in Figure 21, when a bell-shaped inlet is used and the upper cavity height is 32 mm, the outlet flow is affected at a large opening. The bell-shaped inlet can be regarded as a special cone tube with an increasing inlet cone angle. When the cone angle reaches 90°, the flow section suddenly becomes larger. When the opening degree is greater than 40%, the fluid velocity and distribution, the deformation of the streamline line, etc., are more obvious. Therefore, a bell-shaped inlet with an upper cavity height of 32 mm is available.
As shown in Figure 22, when the height of the upper cavity is 5 mm and the inlet experiences a sudden enlargement, due to the formation of a throttle port on the top and bottom surfaces of the upper cavity, the volume flow rate is lower than that of other inlets. However, when the inlet adopts a bell-shaped or cone transition, the disappearance of the throttle port leads to an increase in the volume flow. Additionally, the volume flow rate of the bell inlet is less affected than that of the cone inlet. When the height of the upper cavity is 68 mm, the volume flow rate of the bell and cone inlets is basically the same under the same opening, as shown in Figure 23. Since the upper cavity inlet adopts a slow transition, the flow rate of the fluid domain is close at different upper cavity heights, and a relatively smaller upper cavity height can be considered. Therefore, the cone angle with 40° and the upper cavity height is 5 mm can be chosen.

4.1.4. Effects of the Lower Chamber

The lower cavity of the fluid domain of the original control valve is an annular flow channel, and the intermediate flow channel is evenly distributed along the ring channel. During the flow process, the fluid flowing into the lower cavity from each intermediate flow channel will form numerous vortices, leading to energy loss. In this section, the annular flow channel of the lower chamber will be analyzed to reduce energy loss between fluids.
(1)
Selection of the Lower Chamber Shape
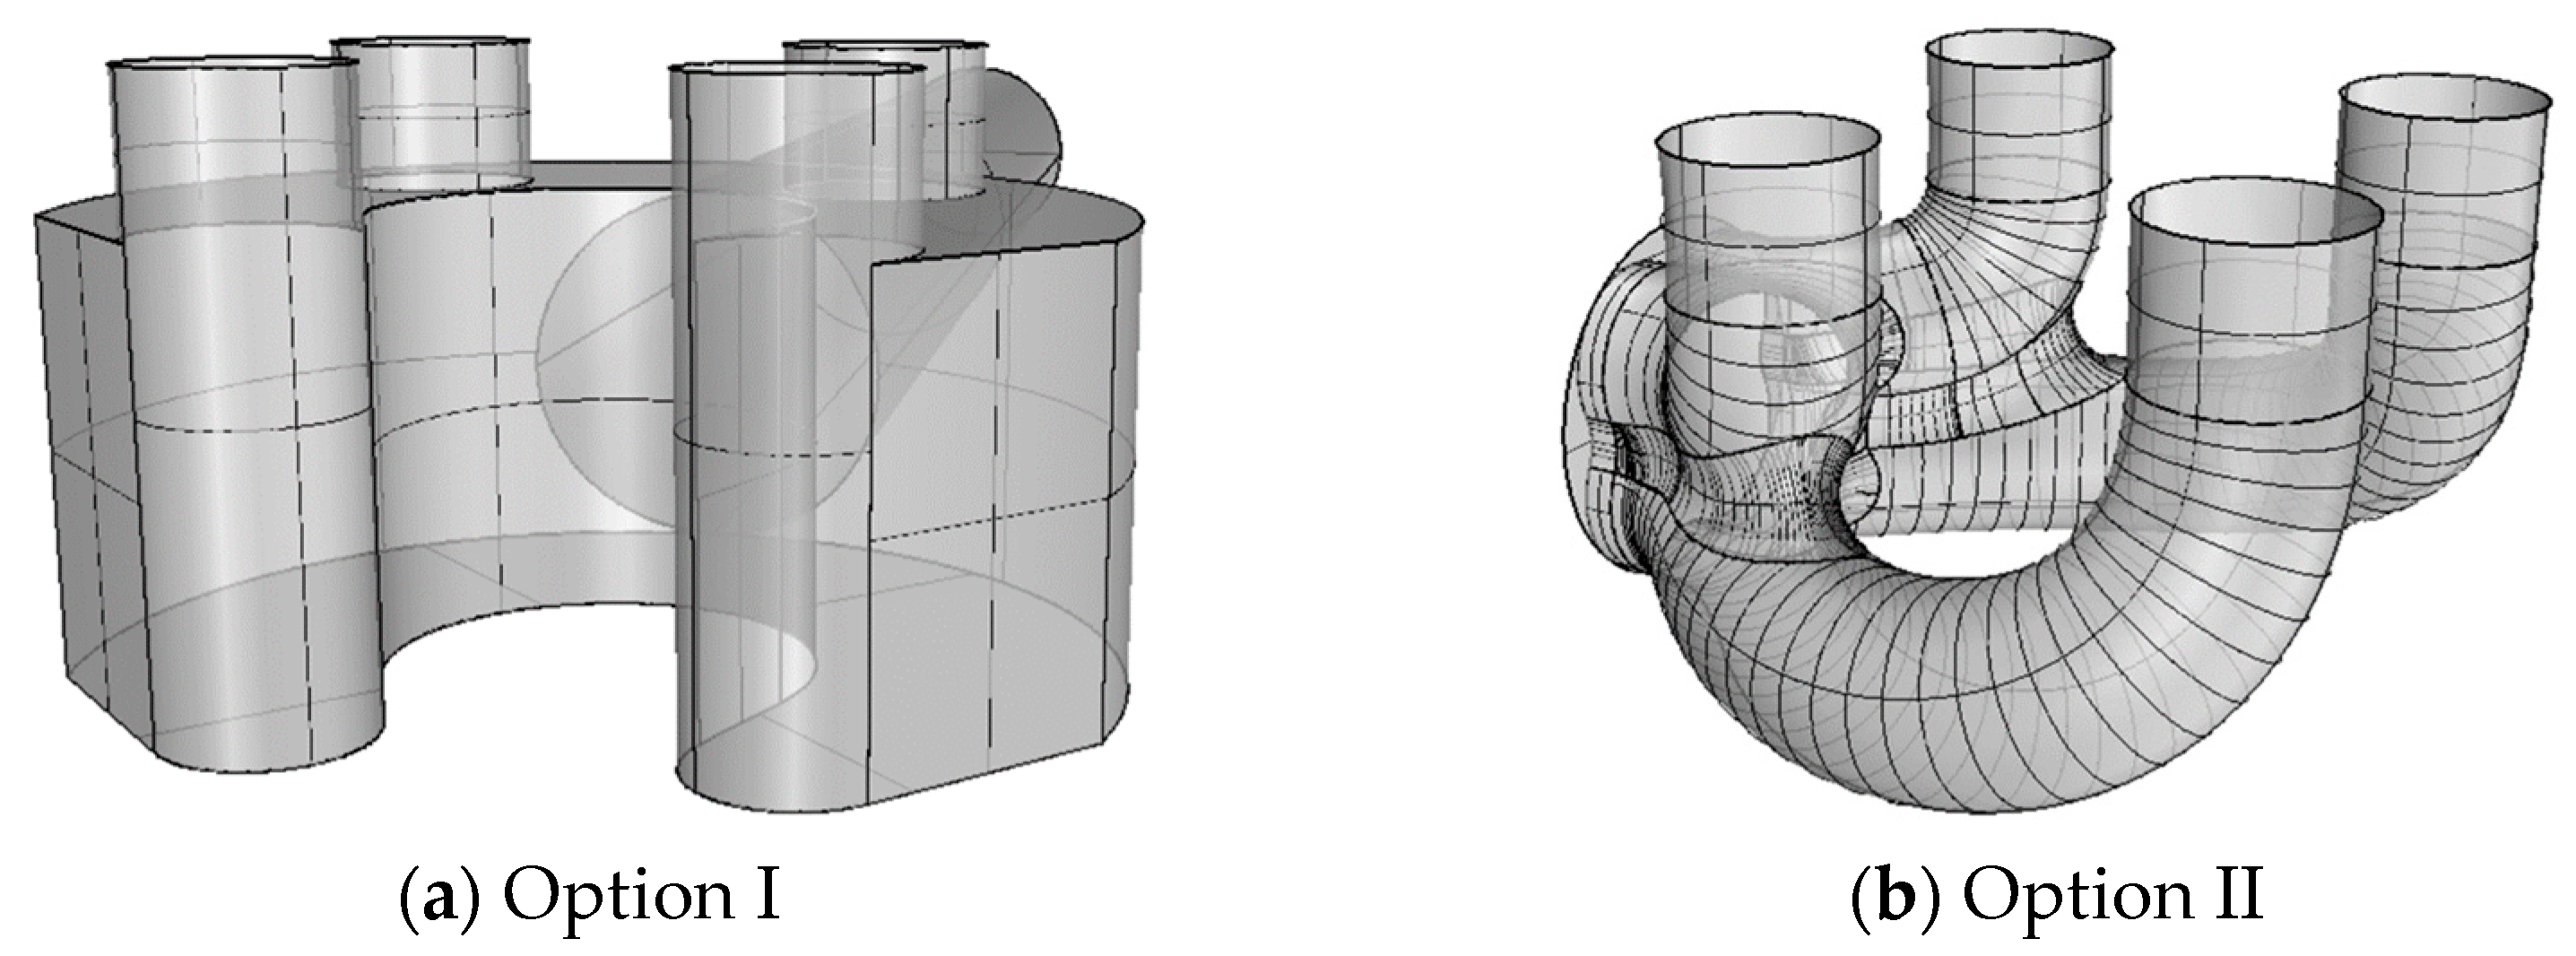
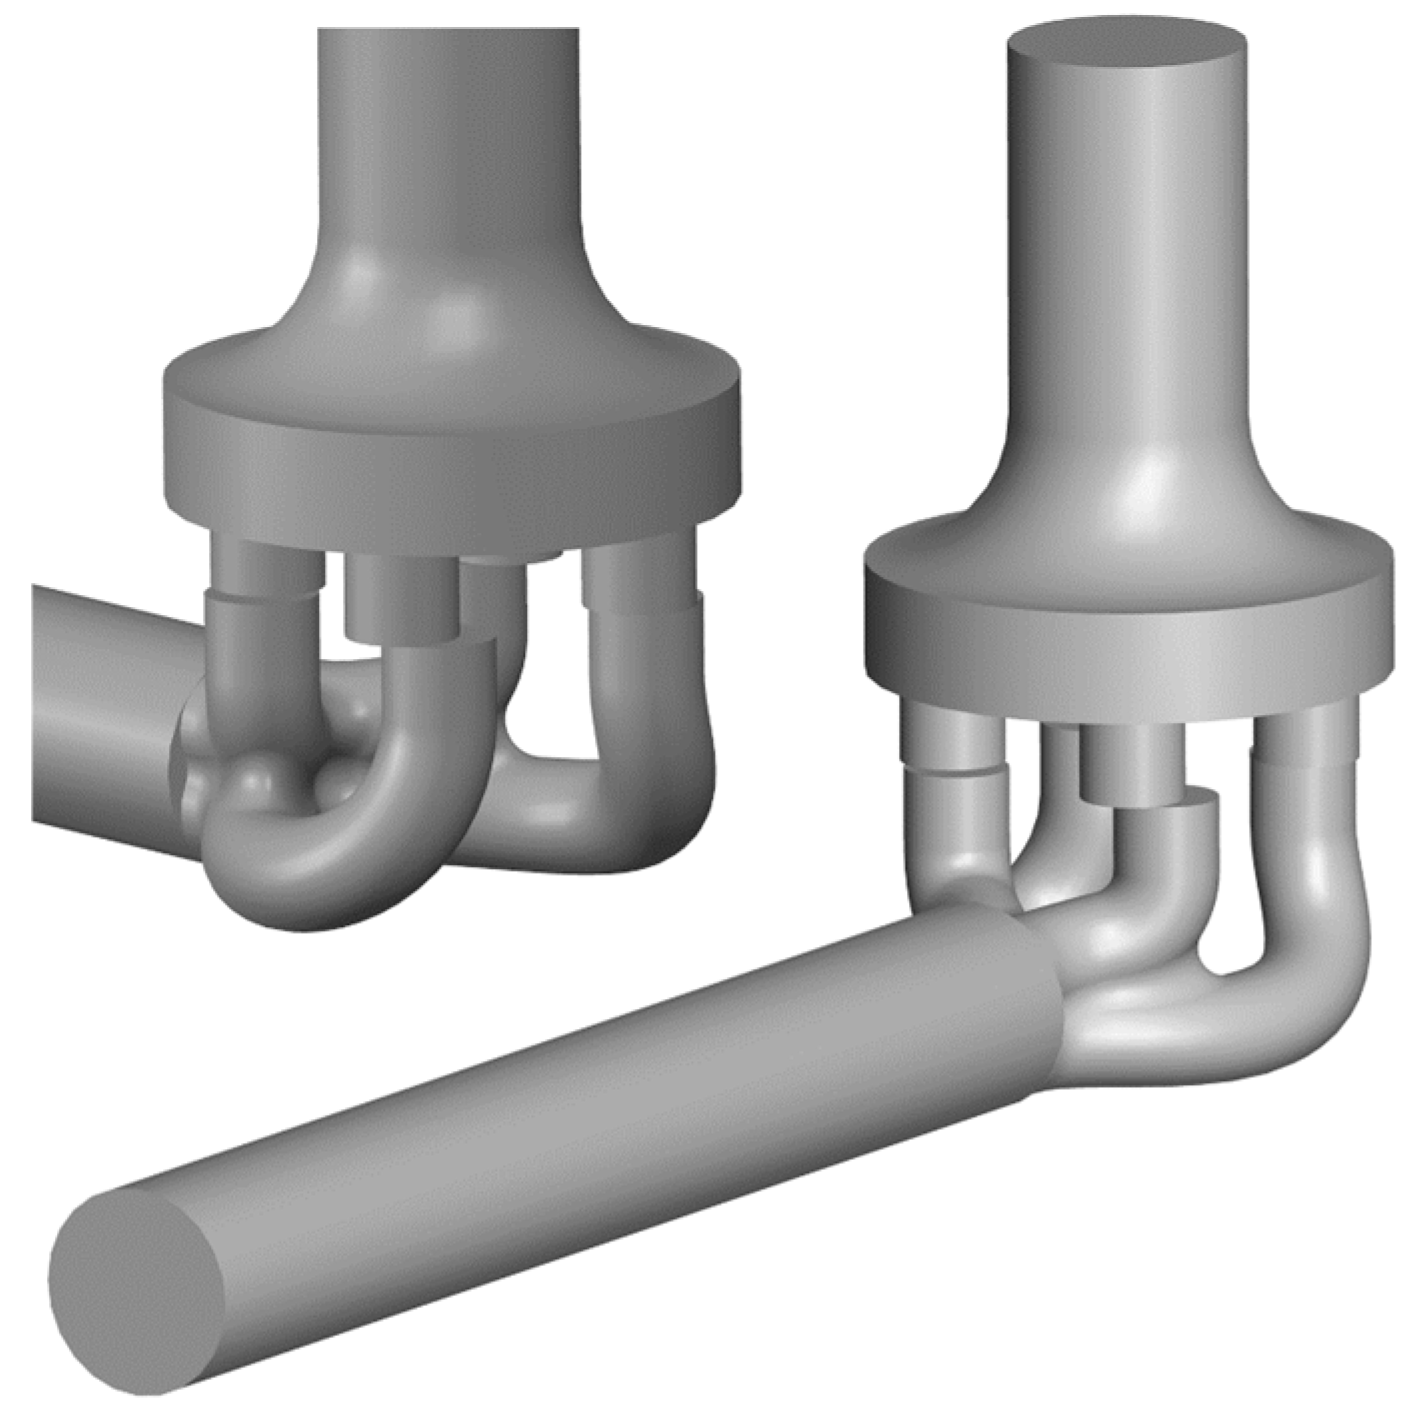
Two schemes are adopted. One is to partition the lower cavity at the symmetrical outlet to minimize the circular movement of the fluid under small opening. The other is to use a bend to direct the fluid from the intermediate flow channel to the outlet, as shown in Figure 24.
(2)
Volume Flow of Outlet
After calculation, the outlet volume flow under the two schemes is calculated as shown in Table 8. It can be seen from the table that, under the same opening, the volume flow rate of Option I is close to that of the original fluid domain, indicating that the annular flow channel under the partition has little effect on the volume flow. In the corresponding Option II, under the same opening, the volume flow rate changes significantly. The opening-flow curves for each scheme are plotted according to Table 8, as shown in Figure 25.
Figure 25 shows that, as the opening increases, the volume flow rate of the two schemes increases. When the opening degree is lower than 40%, the volume flow rate of the two schemes is close to the volume flow rate of the raw fluid domain. When the opening degree exceeds 40%, the volume flow rate of scheme 2 surpasses those of scheme 1 and the original fluid domain. At 100% opening, the volume flow rate of scheme 2 shows a 15.35% increase compared to that of the original fluid domain. Therefore, the lower chamber should adopt scheme 2, a bend transition.
(3)
Comparison of Flow Field Results
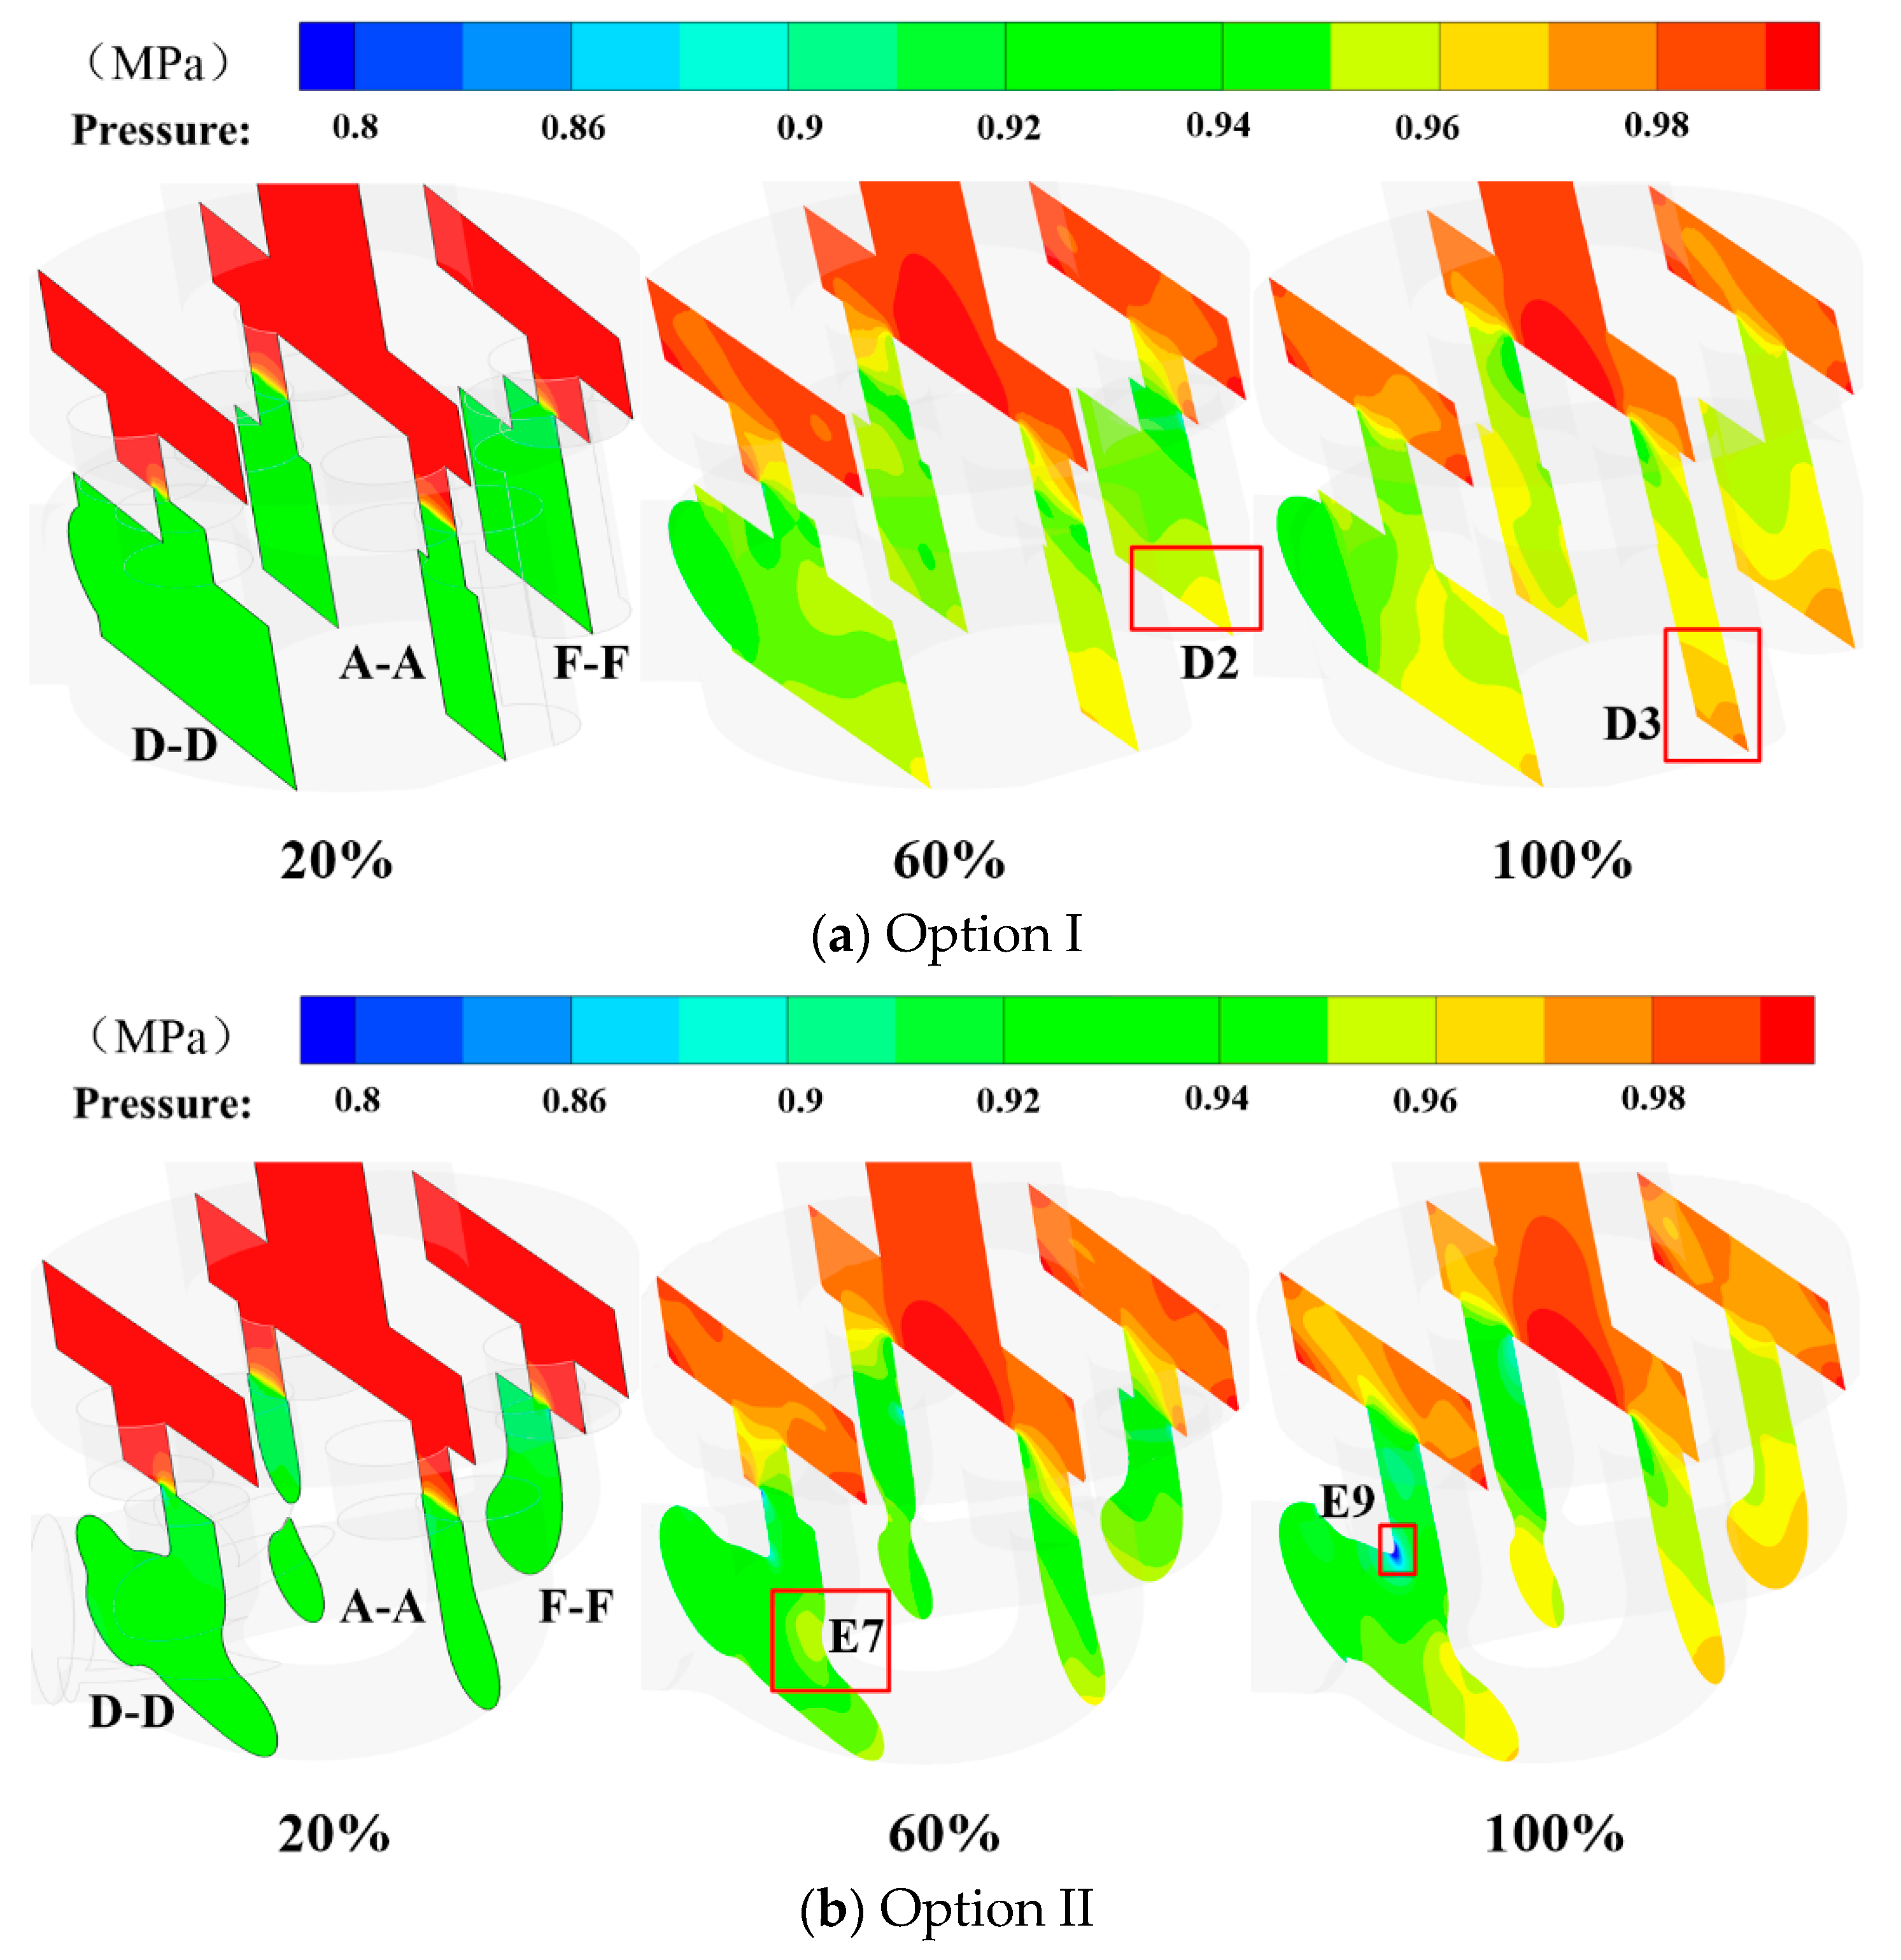
In Figure 26, sections A-A, D-D, F-F are chosen, respectively, to characterize the flow field near the outlet, the flow field away from the outlet and the jet flow field. Among them, the model of Option II is shown on the left side of Figure 26, while the model of Option I is on the right.
(1)
Pressure flow field
As shown in Figure 26, when the opening is small, the disparity in pressure distribution values between the two schemes is small, and the pressure changes sharply as the opening increases. Among them, the flow field separated by the lower cavity bears resemblance to the annular lower cavity. As the opening increases, the bottom of the separation area (areas D2, D3) gradually appears in the high-pressure area. At 100% opening, the relatively higher pressure in the high-pressure area occurs at the corners of the side wall and the bottom surface. When the elbow transition is used, the area with higher pressure is mainly concentrated at the intersection of the ipsilateral bend (area E7) and the outer wall surface of each elbow. At 100% opening, a local low-pressure area (area E9) occurs at the inner corner of the elbow near the outlet.
Figure 26. Pressure contours at selected cross-sections corresponding to the two options.
Actuators 14 00163 g026
(2)
The velocity flow field for Option I
As shown in Figure 27, when comparing the velocity flow field separated by the lower chamber with the annular flow channel, the following characteristics can be observed: At the opening of 20%, under the intermediate flow channel away from the outlet, the jet beam impacts the bottom surface of the lower cavity, deflects to the wall on both sides (area D3), and eventually forms a low-velocity zone (area D2) at the corner between the bottom surface of the lower cavity and the side wall. Below the intermediate channel near the outlet, the jet beam is deflected to one side of the wall of the flow channel, after which it forms a vortex with the other side wall (region D1), and the fluid of the ipsilateral intermediate channel meets to form a vortex (region D4). As the opening increases, the low-velocity region D2 moves upward along the side wall of the lower cavity. Meanwhile, the vortex region D4 gradually tends to be formed away from the movement of the outlet fluid, and the low-velocity region becomes concentrated at the corner of the top surface and the sidewall of the lower cavity (region D5). In addition, with the increase in the opening, the flow velocity increases, the vortex region D1 tends to shift to the right, and the fluid moves along the partition side wall towards the outlet (region D3).
(3)
The velocity flow field for Option II
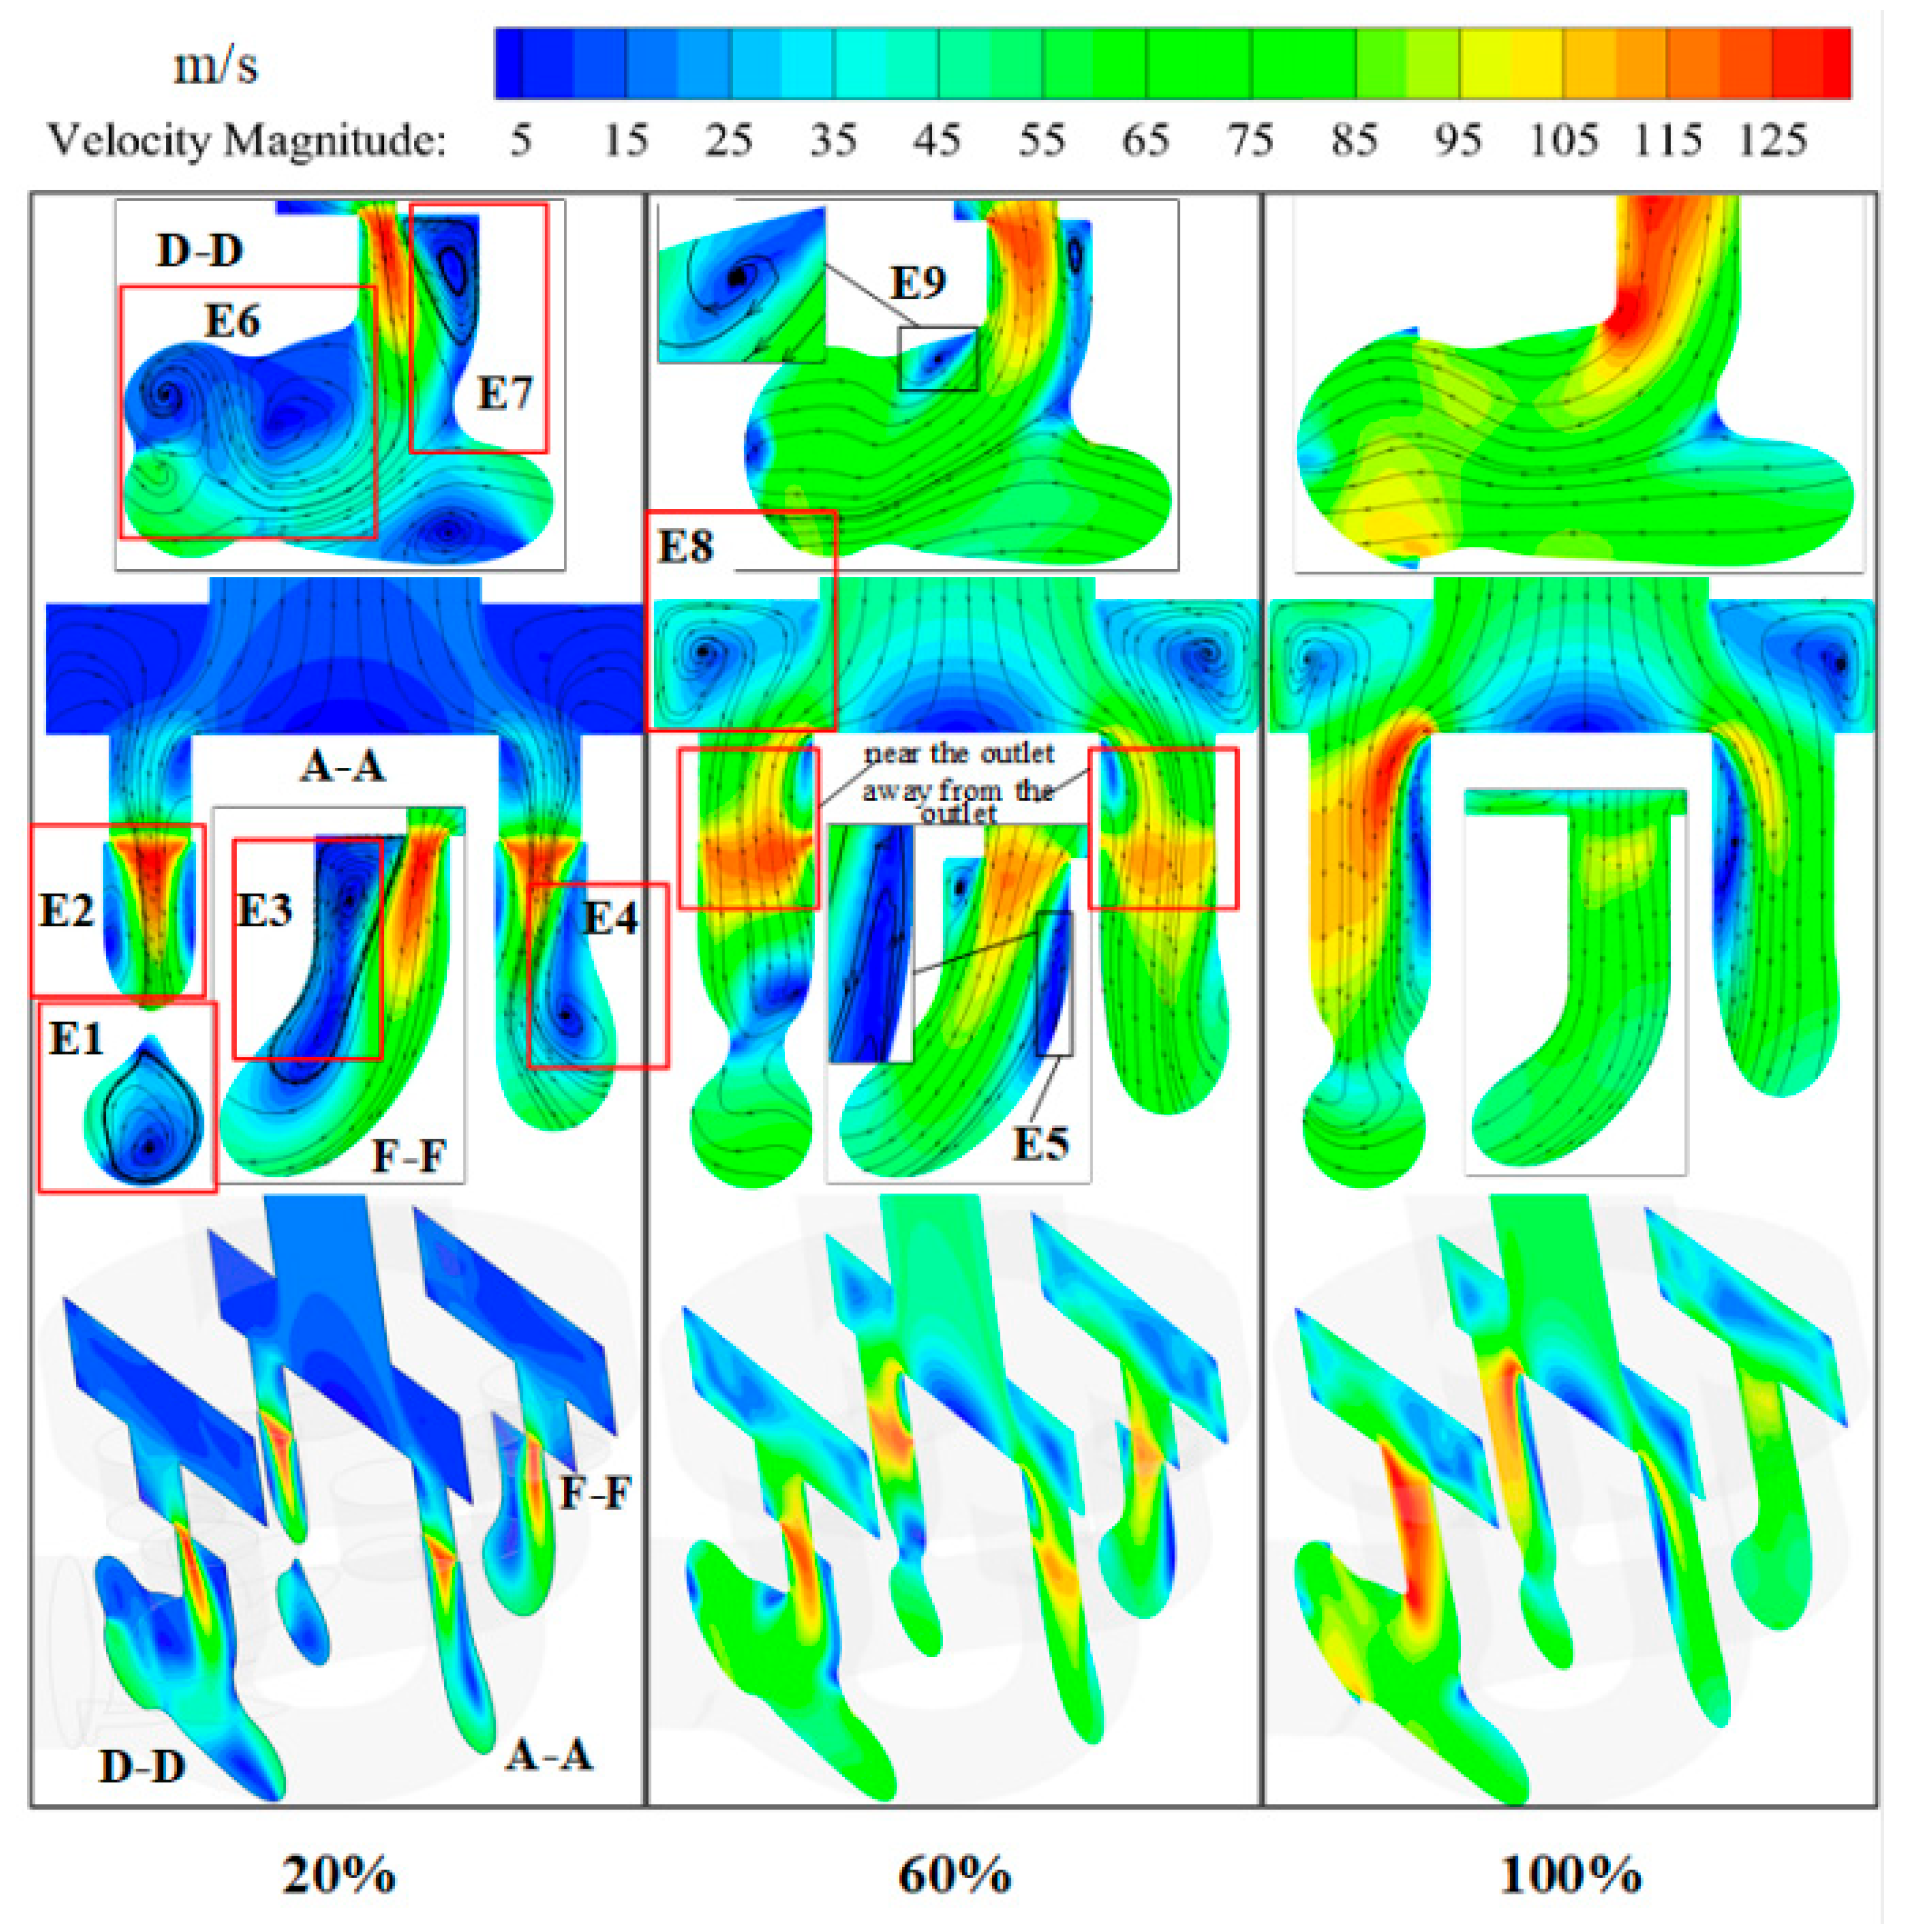
Figure 28 shows the flow channel on the right side of section A-A and the velocity cloud under section F-F. At the opening of 20%, the jet beam flows along the side of the wall of the bend (area E5), the jet main beam forms a vortex with the rest of the wall of the bend (area E3, E4), and the area E1 is the pipe section away from the outlet bend when it intersects with other bends. Here, the fluid can be observed to flow spirally forward along the elbow wall. As the opening increases, the jet intensity weakens, the vortex at regions E3 and E4 decreases, the low-velocity region appears in the region E5, and vortexes exist. When the opening reaches 100%, the vortex disappears at areas E3, E4 and E5.
For the left flow channel of section A-A and section D-D, when the opening is 20%, the jet flows along the wall surface on the side of the elbow, and the jet main beam forms a vortex with the other walls of the bend (zone E2, E7). Meanwhile, at the intersection of each elbow, eddy currents and low-speed areas are formed. When the opening is 60%, the number of low-velocity regions in region E6 decreases, while smaller vortices start to form in region E9. In addition, as the opening increases, the vortex of the region E8 also becomes increasingly noticeable.
Figure 27. Velocity magnitude contours and streamline in the control valve for Option I.
Actuators 14 00163 g027
Figure 28. Velocity magnitude contours and streamline in the control valve for Option II.
Actuators 14 00163 g028

4.1.5. Determination of the Optimized Fluid Domain Model

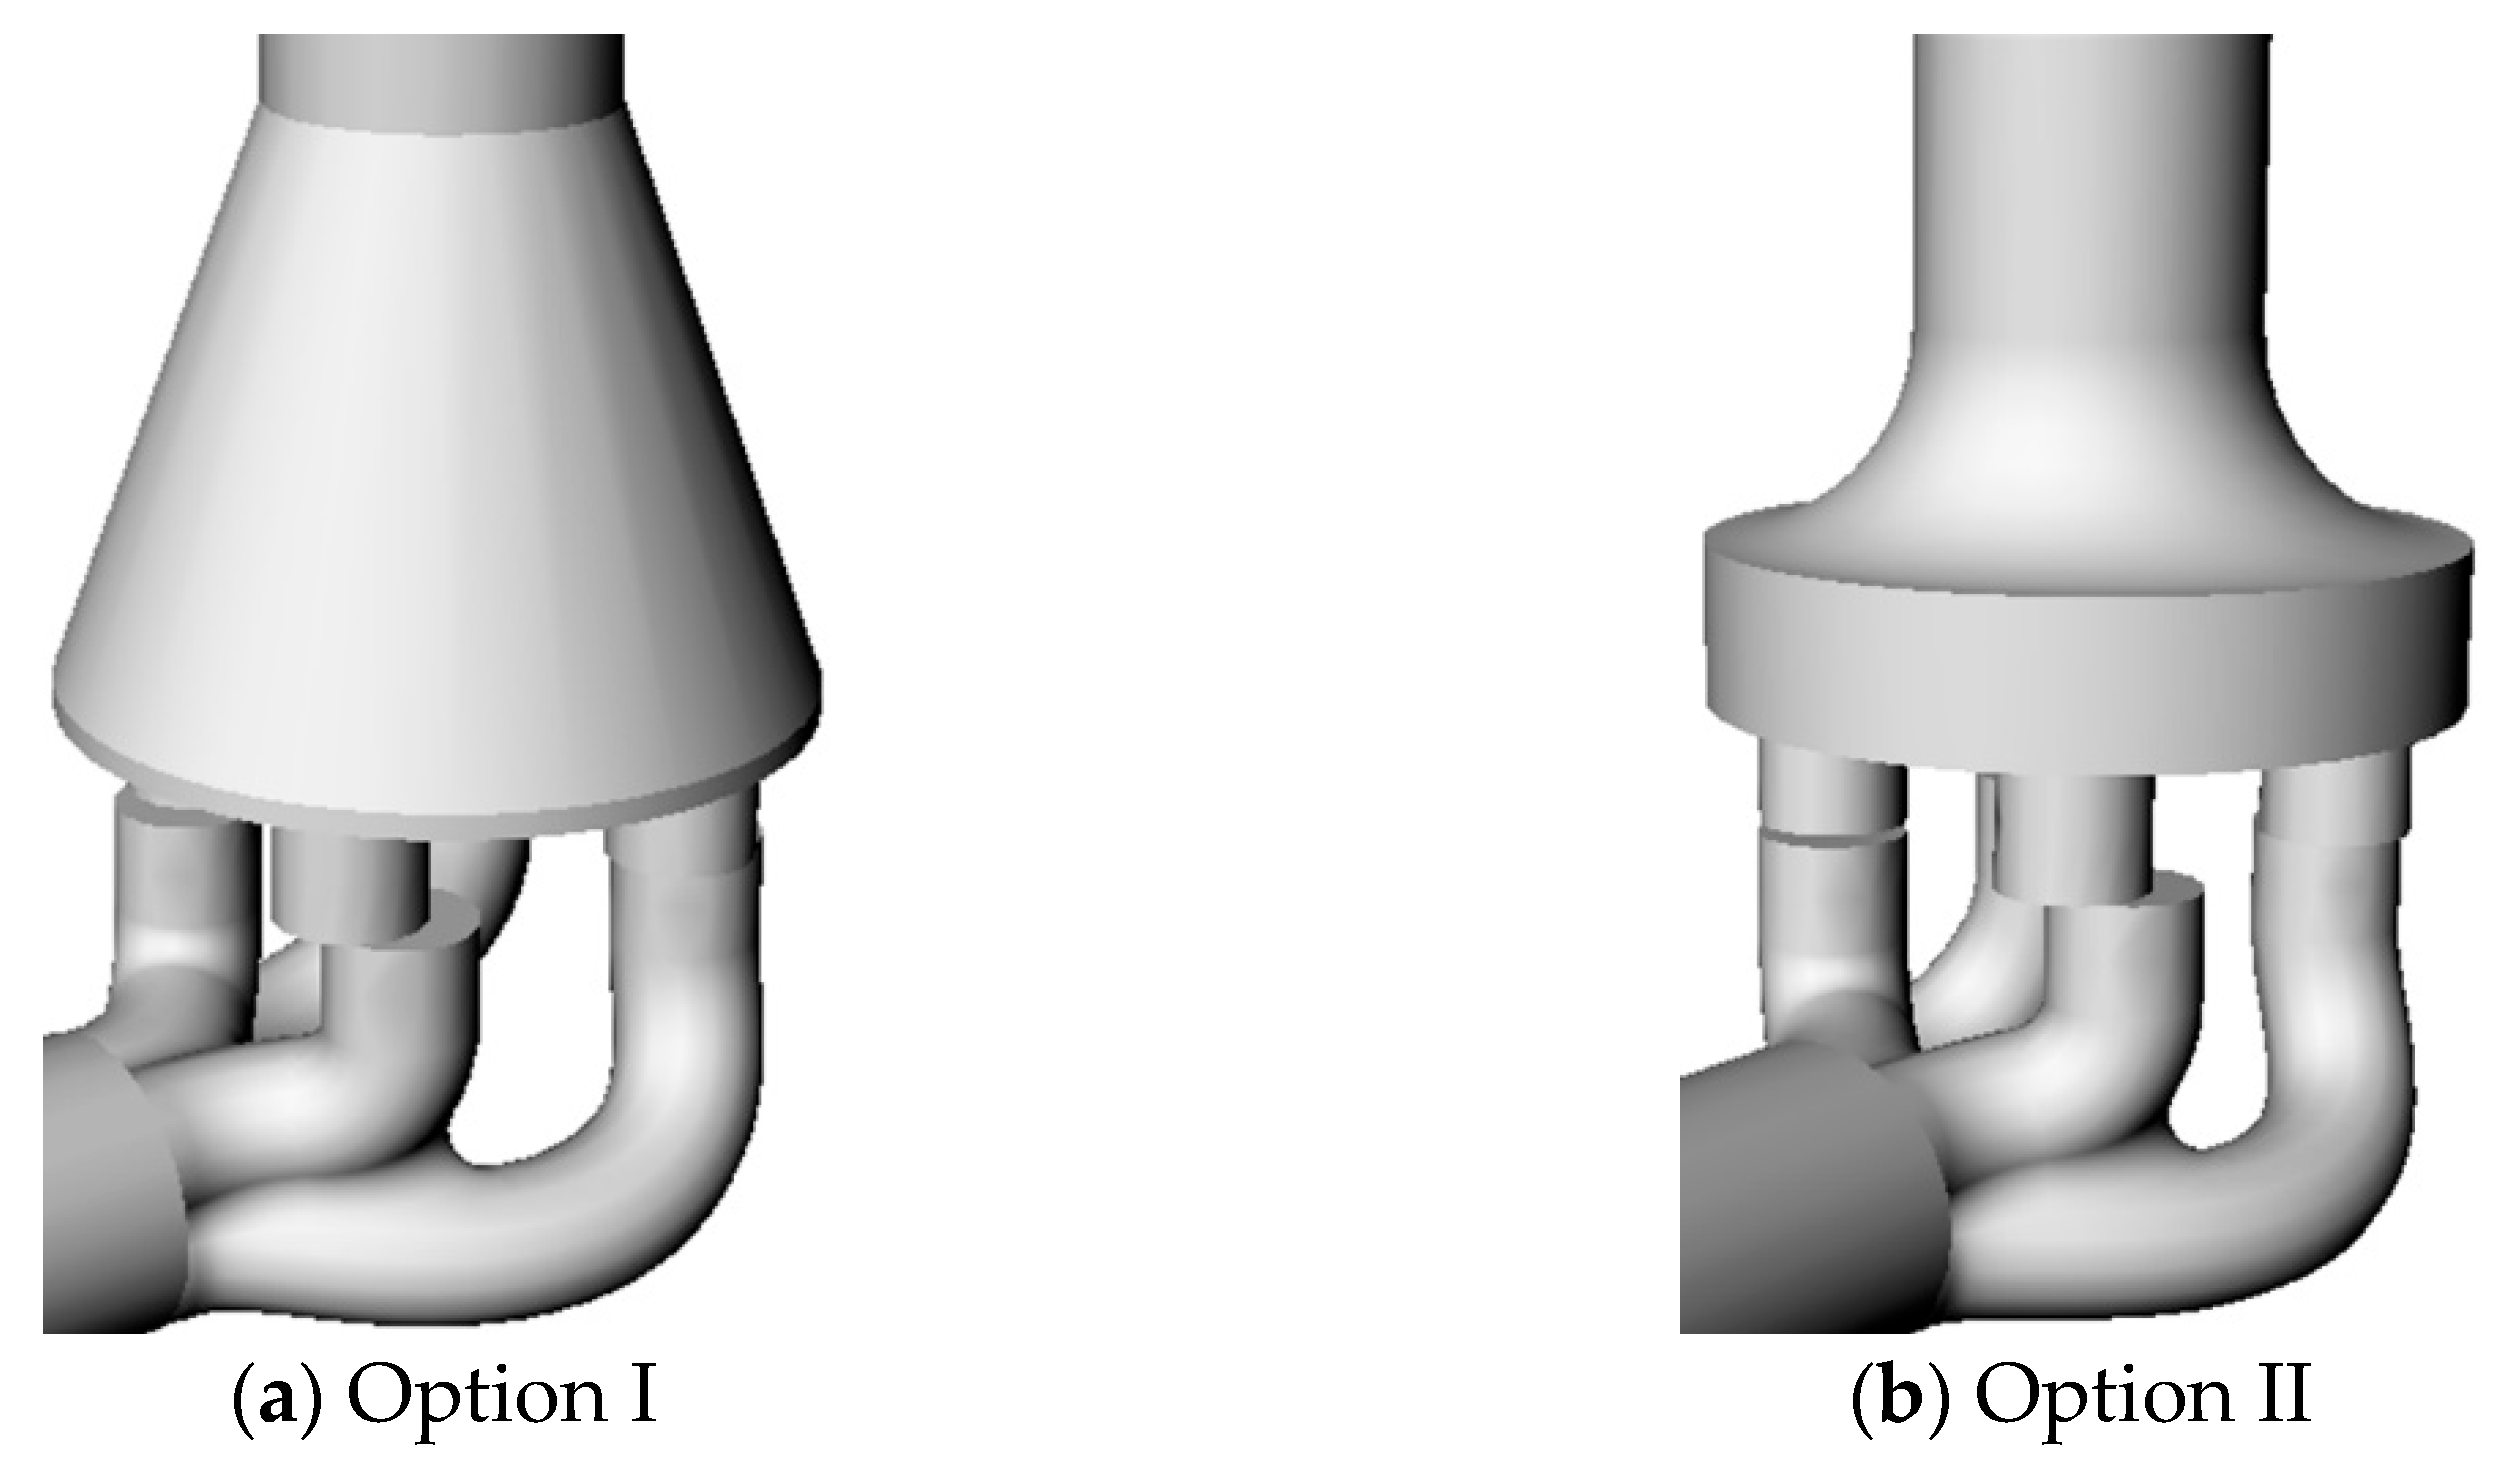
Drawing on the conclusions from the first four sections, the final optimization model of the fluid domain adopts two schemes: scheme 1 adopts a cone inlet, a 5 mm upper cavity height, and a bend transition. The second scheme adopts a bell-shaped inlet, a 32 mm upper cavity height, and a bend transition. These two schemes are modeled as shown in Figure 29.
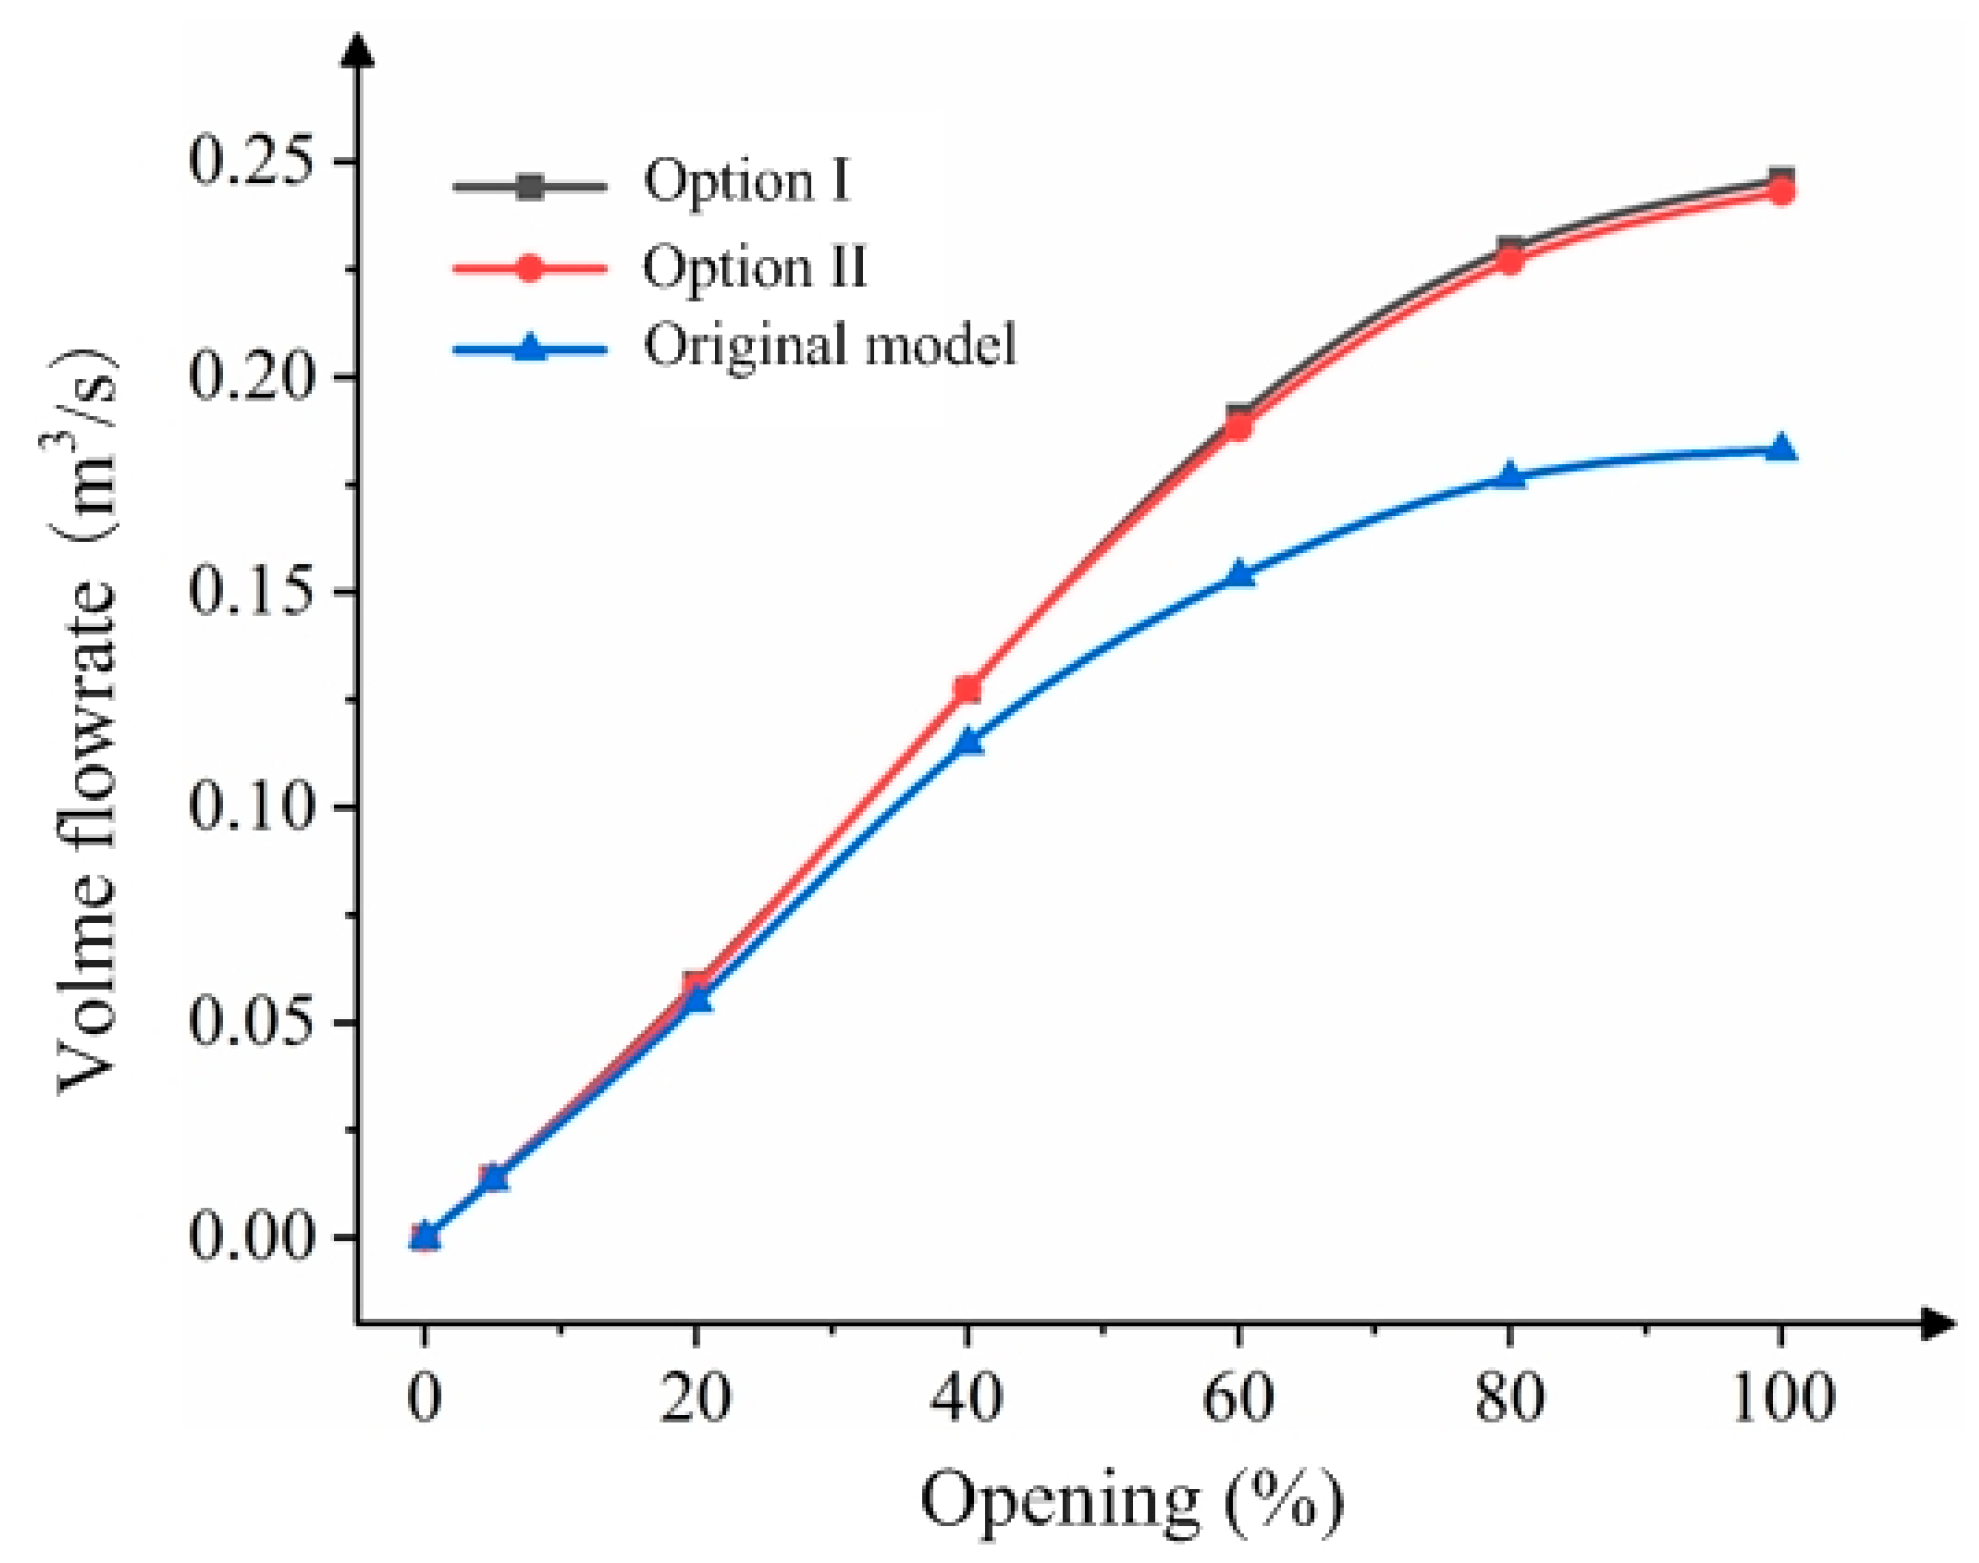
The volume flow rate of the valve outlet under different improvement schemes and the volume flow rate of the valve outlet under the original scheme are shown in Table 9. Furthermore, the change rate of the flow rate under the improvement schemes compared to the original scheme was also obtained in Table 10. And the volume flow rate comparison curves for different schemes are presented in Figure 30. It can be seen that, compared with the original fluid domain model, when the opening degree exceeds 20%, the volume flow rate of the improved two scheme models changes significantly. At the opening of 100%, the volume flow rates of Option I and Option II increased by 34.24% and 32.71%, respectively. Through the optimization, the improved Option I and Option II have increased the outlet flow rate of the control valve [25]. In addition, the volume flow of scheme 1 is slightly larger than the volume flow of scheme 2 as a whole at each opening. With respect to the increase in the outlet volume flow, scheme 1 is better than scheme 2.
However, during the fluffing process, the upper grinding plate rotates 90 degrees at a constant speed, causing the valve to open and close once. As the valve opens and closes, it releases fluffy gas. Assuming the valve is switched on and off at the same speed once, according to the volume flow data in Table 9, it can be approximated that, compared to the fluid domain model of the original control valve, the gas release at the outlet of the scheme 1 and scheme 2 models is increased by 23.37% and 22.11%, respectively, and the gas release percentage at the outlet of the two scheme models is similar. Additionally, the height increase in the upper chamber of scheme 1 and scheme 2 is 85.65 mm and 41 mm, respectively, and the height increase in scheme 2 is less than half of that of scheme 1. After comprehensive consideration, the second option is chosen.
Therefore, taking into account the influence of the flow field of each part of the fluid domain structure, the fluid domain model is improved as shown in Figure 31, with a bell-shaped inlet, a height of 32 mm for the upper chamber, and a curved transition for the lower chamber.

4.2. Fluid–Structure Interaction Analysis of Laver Fluffiness Control Valve

The previous analysis of control valve’s flow field demonstrates that the flow of fluid in the control valve is a complex unsteady turbulent flow. When high-pressure gas passes through the throttle position of the valve, it is prone to forming a high-speed jet. This process is accompanied by the high-speed rotational movement of the upper and lower grinding plates. The flow characteristics of the fluid and the internal components of the valve are mutually coupled, which, to a certain extent, can induce the vibration of the valve body, noise and other instability phenomena. Therefore, by addressing the fluid–structure interaction problem, a strength analysis of the control valve under working state is carried out. This analysis can also provide guidance for the design of the control valve.

4.2.1. The Force of Each Opening Under the Action of 1 MPa Preload Pressure

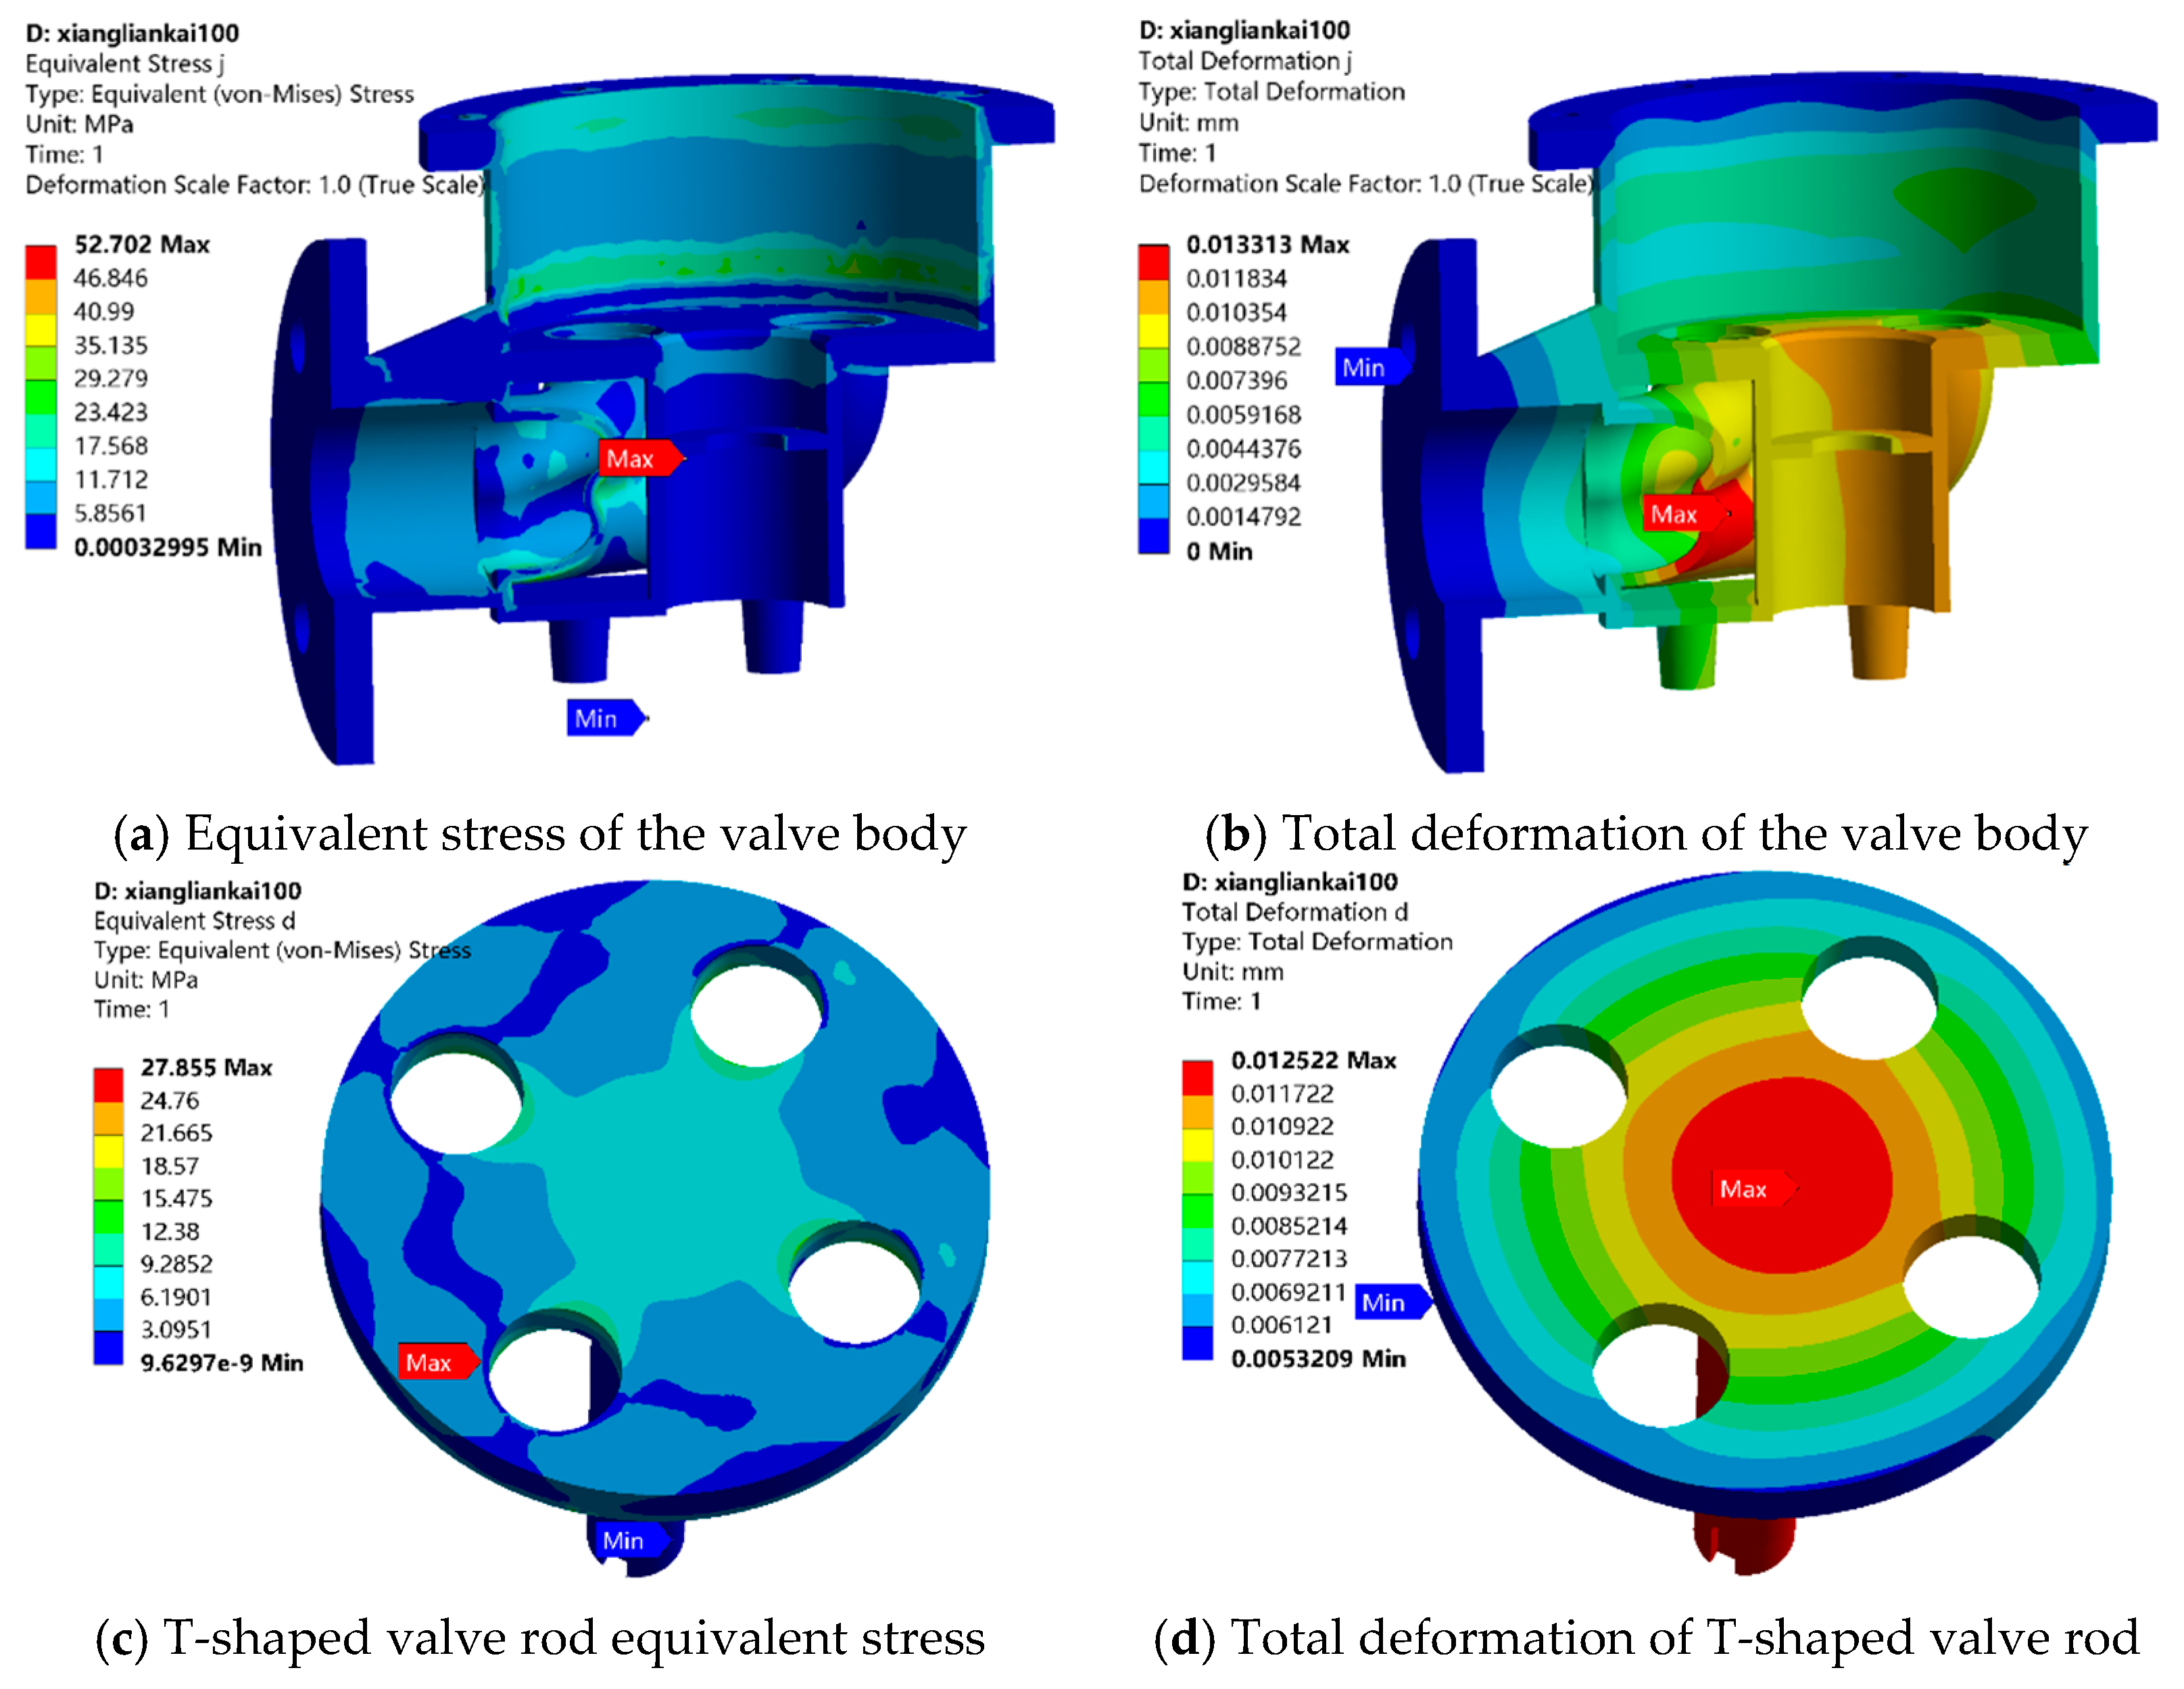
The pressure within the internal flow field varies depending on different valve openings. In this study, the opening degrees considered are 20%, 60% and 100%, which represent a small opening, a medium opening, and a large opening, respectively. When the valve is opened at 20%, 60% and 100%, the distribution of equivalent force and total deformation in the valve body exhibits similarities. The maximum equivalent stresses are 52.515 MPa, 51.519 MPa and 52.702 MPa, while the maximum deformations are 12.560 microns, 12.764 microns and 13.313 microns, respectively. It can be seen that, under the small opening, medium opening and large opening, the maximum stress and total deformation change fluctuations of the valve body are small. Figure 32 shows the equivalent stress and total deformation cloud of the valve body and T-shaped valve rod under a 100% opening.
As can be seen from Figure 32a,b, the intersection of the elbow in the valve body experiences the maximum equivalent stress and maximum deformation. Since the fluid enters the elbow from the upper cavity of the valve body and impacts the wall of the elbow, the pressure distribution of the inner wall of the elbow is extremely complex, and the area with large stress in the bend is concentrated near the intersection of the elbow, and there is a low-stress area at the outer wall of the intersection of the ipsilateral bend. According to Figure 32c, the center of the T-shaped valve rod has a high equivalent stress. Due to the fluid flowing towards the through-hole and the impact effect on the end-face of the T-shaped rod, the equivalent stress is significant from the center of the T-shaped end-face to the through-hole. At the inner-side corner of the through-hole, a large equivalent stress of approximately 13 MPa is present. Figure 32d indicates that the position of the maximum deformation is offset from the exit.
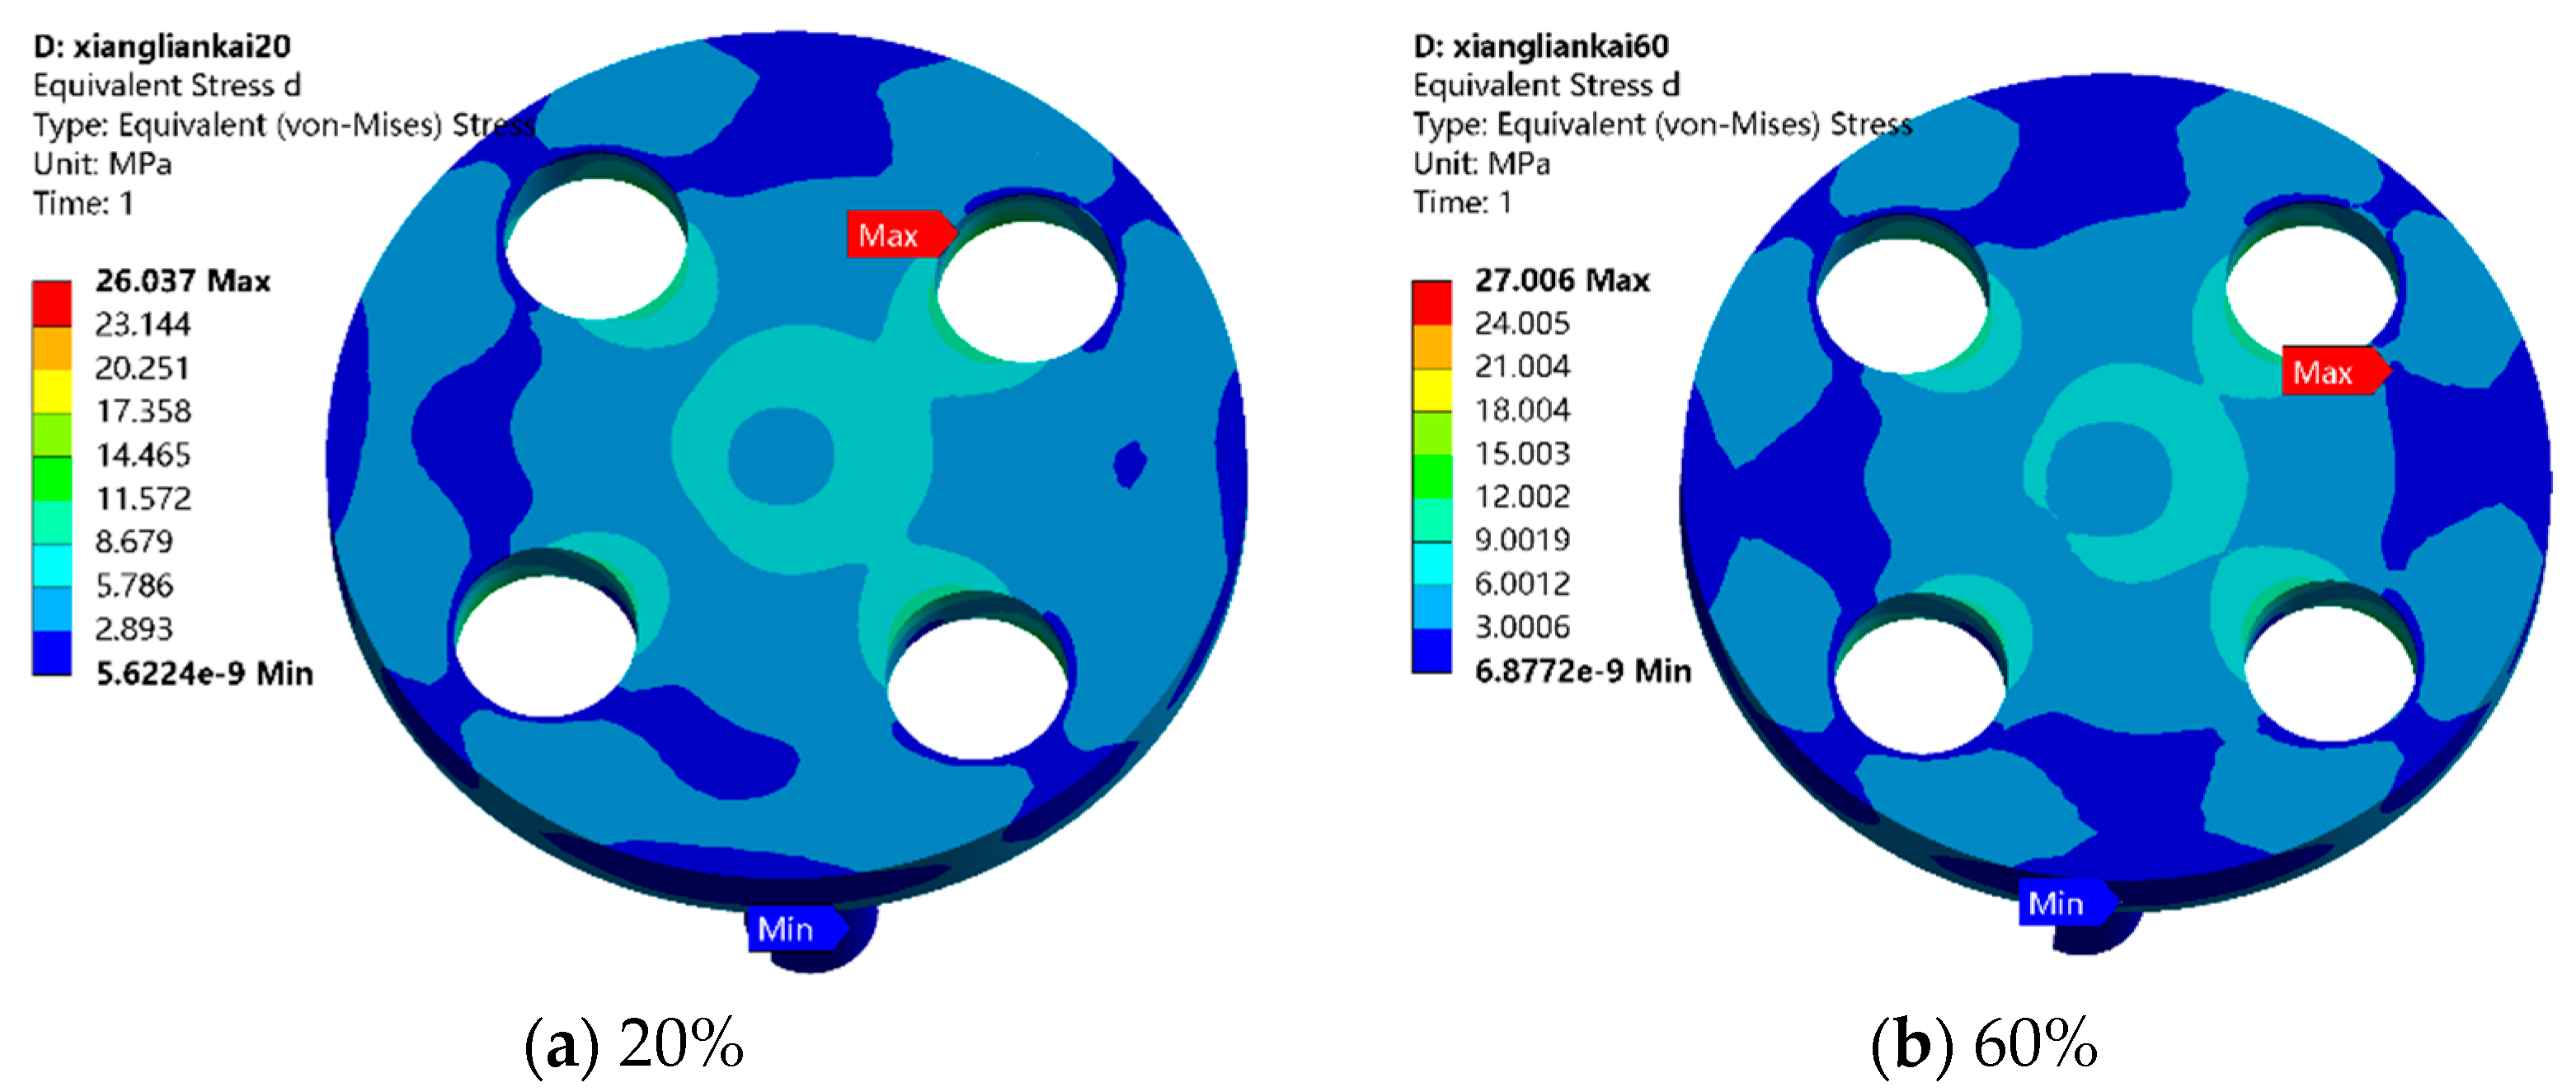
In addition, the pressure of the upper cavity decreases with the increase in the opening degree, and the impact force of the fluid on the surface of the T-shaped valve rod is different. As shown in Figure 33, a low-stress region is formed on the end face of the T-shaped valve rod between two adjacent through-holes. When the valve opening reaches a medium level, this low-stress region tends to expand. However, when the opening is too large, the low-stress region decreases due to the increased flow trend of fluid around the through hole.

4.2.2. The Force of Each Opening Under Different Preload Pressures

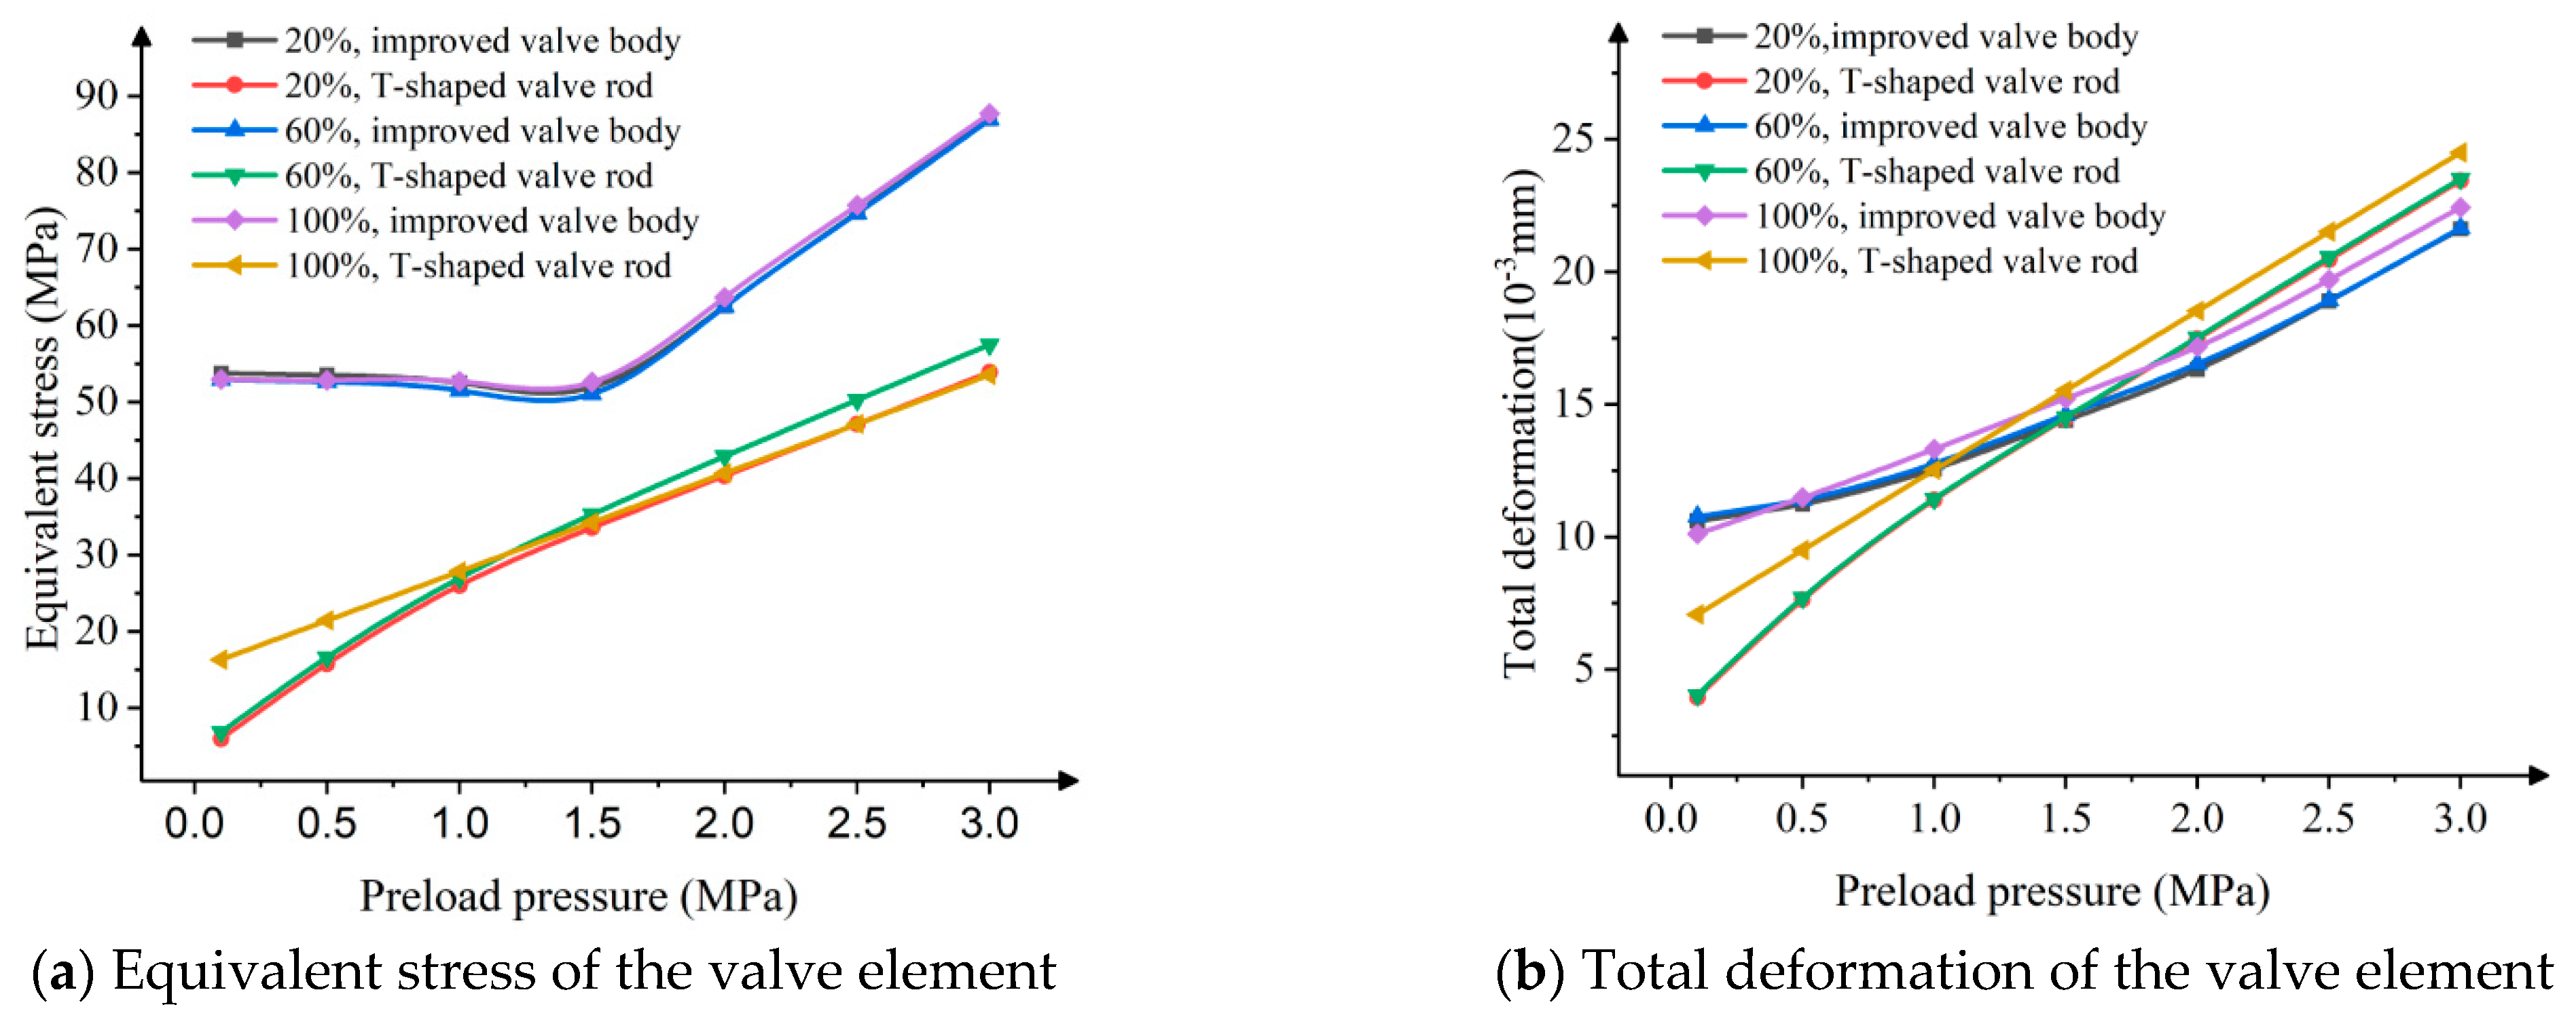
The preload pressures were set at 0.1 MPa, 0.5 MPa, 1.5 MPa, 2 MPa, 2.5 MPa and 3 MPa, respectively. The equivalent stress and total deformation of each opening are shown in Figure 34 under the action of different preload pressures. It can be observed that, as the preload pressure increases, the curves of the maximum equivalent stress of the valve body at different openings are similar. When the preload pressure is less than 1.5 MPa, the change in the equivalent stress fluctuates small, while, when it is greater than 1.5 MPa, the equivalent stress increases approximately linearly with the increase in the preload pressure. When the preload pressure is less than 1 MPa, the equivalent stress values of 20% and 60% opening are close, yet both are lower than the equivalent stress under 100% opening. As the preload pressure rises, the difference between these values gradually diminishes. When the opening degree is greater than 1 MPa, the equivalent stress values at 20% and 100% opening are close, but both are less than the equivalent stress at 60% opening. Moreover, as the preload pressure continues to increase, the difference between these values gradually enlarges. Additionally, when the preload pressure is increased from 0 to 3 MPa, the preload pressure on the improved valve body is consistently higher than that on the T-shaped valve stem.
As shown in Figure 34b, as the preload pressure increases, the maximum deformation of the improved valve body shows an increasing trend, and the growth rate is accelerated. The maximum deformation values at 20% and 60% openings are relatively close. When the preload pressure exceeds 0.5 MPa, the maximum deformation at these openings is less than that at 100% opening. With the increase in preload pressure, the maximum deformation of the T-shaped valve rod increases linearly, among which, the maximum deformation is close to 20% and 60% opening, but both are less than the maximum deformation at 100% opening. When the preload pressure is less than 1 MPa, the maximum deformation of the T-shaped valve rod is less than that of the improved valve body. However, when the preload pressure exceeds 1 MPa, this relationship is reversed [26].
Furthermore, it is crucial to note that many components of the valve are fabricated from steel. Given the high-frequency cyclic loading in this system, the maximum stress should be below the fatigue limit of the material. Thus, an analysis of the fatigue strength is presented. The analysis of the fatigue strength is introduced. According to reference [27], the fatigue limit expressed by the stress amplitude σ 1 is approximately
σ 1 = 0.9 σ b + 100 ψ
where σ b is the ultimate strength, and ψ is the reduction in area of the material.
The control valve is made of 45 steel material. The ultimate strength of 45 steel is 600 MPa, and the reduction in area of 45 steel is about 40%. Therefore, the fatigue limit of the valve is 274 MPa. Therefore, the maximum stress of the valve is clear of the fatigue limit of the material.

5. Conclusions

This paper studied the influence of different valve chamber structures on the flow field and provided an optimized flow channel structure for the valve chamber. In addition, the fluid–structure interaction analysis of the improved valve chamber was also conducted. The results of this study are as follows:
(1)
A gradual expansion of the inlet flow in the upper chamber can effectively decrease the number and intensity of vortices in the upper chamber. Compared to the original fluid domain, when the valve opening is 100%, the outlet flow rates of the conical tube and bell-shaped inlet increase by 12.77% and 12.59%, respectively.
(2)
If the shape of the inlet of the upper cavity and its inlet height are modified simultaneously, it is possible to effectively avoid the formation of a throttle port due to the height of the upper cavity. The outlet flow rate is increased while reducing the increase in the height of the upper cavity. The lower cavity adopts the elbow transition, which can effectively reduce the energy loss of the fluid in the lower cavity. Specifically, when the valve opening reaches 100%, the outlet flow of the configuration with the bend transition demonstrates a 15.35% increase compared to that of the original fluid domain.
(3)
Based on the influence of the valve cavity structure on the flow field, after comprehensive consideration, the control valve fluid domain adopts a bell-shaped inlet, a 32 mm upper cavity height and an elbow transition. When the opening is 100%, the outlet flow of the control valve increases by 32.70%, the valve is switched on and off once, and the gas release is increased by 22.11%.
(4)
Under the small opening, medium opening and large opening, the equivalence force and total deformation distribution of the control valve body are similar. The maximum equivalent force and total deformation occur at the intersection of the elbow. The maximum equivalent stress of the T-shaped valve rod is mainly concentrated at the center of the rod, while the maximum deformation is offset from the outlet. When the pre-load pressure exceeds 1.5 MPa, as the pre-load pressure increases, the equivalent stress and total deformation of the control-valve body and T-shaped valve rod also increase.
Furthermore, the limitation of this paper is that all numerical simulations assume a steady state condition. In the future, we will further carry out the dynamic analysis of the valve.

Author Contributions

Conceptualization, Y.W., J.H. and H.J.; methodology, J.H. and Y.W.; software, Y.S. and Y.L.; validation, H.J. and S.Y.; resources, Y.X., D.S. and Y.L.; writing—original draft preparation, H.J., J.H. and Y.S.; writing—review and editing, Y.W. and Y.X.; supervision, Y.W., Y.L. and J.H.; project administration, S.Y., D.S. and Y.X. All authors have read and agreed to the published version of the manuscript.

Funding

This work was supported by the National Natural Science Foundation of China (grant number 51875316), the National Natural Science Foundation of China (grant number 52275259), the National Natural Science Foundation of China (grant number 51775310), the Shandong Province Natural Science Foundation of China (grant number ZR2024QE437), the Shandong Province Natural Science Foundation of China (grant number ZR2019MEE025), the Shandong Province Science and Technology SMEs Innovation Capacity Enhancement Project (grant number 2022TSGC2028), the Key Laboratory of High-efficiency and Clean Mechanical Manufacture at Shandong University, Ministry of Education, and Rizhao Research Institute, Shandong University.

Institutional Review Board Statement

Not applicable.

Informed Consent Statement

Not applicable.

Data Availability Statement

The authors declared no potential conflicts of interest with respect to the research, authorship, and publication of this article.

Conflicts of Interest

The authors declare no conflicts of interest.

References

  1. Ou, Y.J.; Guo, Y.H.; Xu, L.; Lu, X.D.; Guo, Z.B.; Zheng, B.D. Structural characterization and hypoglycemic activity of glycoproteins extracted from porphyra haitanensis by ammonium sulfate and ethanol extraction methods. Food Biosci. 2023, 54, 102868. [Google Scholar] [CrossRef]
  2. Zheng, M.; Ma, M.; Yang, Y.; Liu, Z.; Liu, S.; Hong, T.; Ni, H.; Jiang, Z. Structural characterization and antioxidant activity of polysaccharides extracted from Porphyra haitanensis by different methods. Int. J. Biol. Macromol. 2023, 242, 125003. [Google Scholar] [CrossRef]
  3. Moujaes, S.F.; Jagan, R. 3D CFD predictions and experimental comparisons of pressure drop in a ball valve at different partial openings in turbulent flow. J. Energy Eng. 2008, 134, 24–28. [Google Scholar] [CrossRef]
  4. Palau-Salvador, G.; Gonzalez-Altozano, P.; Arviza-Valverde, J. Three-dimensional modeling and geometrical influence on the hydraulic performance of a control valve. J. Fluids Eng. Trans. ASME 2008, 130, 011102. [Google Scholar] [CrossRef]
  5. Large, J.; Fouque, J.; Reungoat, D. Study of the hydrodynamic phenomena and fluid–structure interactions of a bypass butterfly valve with double disc. Adv. Hydroinformatics 2014, 337–347. [Google Scholar] [CrossRef]
  6. Zaryankin, A.E.; Zroichikov, N.A.; Paramonov, A.N.; Noskov, V.V.; Ev, E.Y.G. Pressure pulsations in the turbine steam-admission path and their influence on the vibration state of the turbine control valves. Therm. Eng. 2012, 59, 106–112. [Google Scholar] [CrossRef]
  7. Shin, C.H.; Ha, J.M.; Lee, C.G. Transient pressure characteristics in a pressure regulating system by using 1-D analytic valve modeling. J. Mech. Sci. Technol. 2008, 22, 374–381. [Google Scholar] [CrossRef]
  8. Shin, C.H. A numerical study on the characteristics of transient flow in a pressure regulator resulting from closure of the pressure control valve. J. Mech. Sci. Technol. 2013, 27, 443–449. [Google Scholar] [CrossRef]
  9. Chern, M.J.; Hsu, P.H.; Cheng, Y.J.; Tseng, P.Y.; Hu, C.M. Numerical study on cavitation occurrence in globe valve. J. Energy Eng. 2013, 139, 25–34. [Google Scholar] [CrossRef]
  10. Mazur, Z.; Urquiza, G.; Campos, R. Improvement of the turbine main stop valves with flow simulation in erosion by solid particle impact CFD. Int. J. Rotating Mach. 2004, 10, 1–12. [Google Scholar] [CrossRef]
  11. Chernus, P.; Sharovatov, V. Consideration of influence of peculiarities of compressed gas on mathematical model parameters of spool valve. Procedia Eng. 2015, 100, 1046–1054. [Google Scholar] [CrossRef]
  12. Merati, P.; Macelt, M.J.; Erickson, R.B. Flow investigation around a V-sector ball valve. J. Fluids Eng. 2001, 123, 662–671. [Google Scholar] [CrossRef]
  13. Choi, Y.S.; Lee, J.H.; Jeong, W.B.; Kim, I.G. Dynamic behavior of valve system in linear compressor based on fluid-structure interaction. J. Mech. Sci. Technol. 2010, 24, 1371–1377. [Google Scholar] [CrossRef]
  14. Gamboa, A.R.; Morris, C.J.; Forster, F.K. Improvements in fixed-valve micropump performance through shape optimization of valves. J. Fluids Eng. 2005, 127, 339–346. [Google Scholar] [CrossRef]
  15. Simic, M.; Herakovic, N. Reduction of the flow forces in a small hydraulic seat valve as alternative approach to improve the valve characteristics. Energy Convers. Manag. 2015, 89, 708–718. [Google Scholar] [CrossRef]
  16. Zhou, Q.Y.; Liu, L.; Zheng, C.; Xu, Z.P.; Wang, X.H. Design of Valve Seating Buffer for Electromagnetic Variable Valve System. Actuators 2023, 12, 19. [Google Scholar] [CrossRef]
  17. Lisowski, E.; Filo, G.; Rajda, J. Analysis of flow forces in the initial phase of throttle gap opening in a proportional control valve. Flow Meas. Instrum. 2018, 59, 157–167. [Google Scholar] [CrossRef]
  18. Amirante, R.; Catalano, L.A.; Tamburrano, P. The importance of a full 3D fluid dynamic analysis to evaluate the flow forces in a hydraulic directional proportional valve. Eng. Comput. 2014, 31, 898–922. [Google Scholar] [CrossRef]
  19. Amirante, R.; Moscatelli, P.G.; Catalano, L.A. Evaluation of the flow forces on a direct (single stage) proportional valve by means of a computational fluid dynamic analysis. Energy Convers. Manag. 2007, 48, 942–953. [Google Scholar] [CrossRef]
  20. Ji, H.X.; Han, J.Z.; Wang, Y.; Wang, Q.X.; Yang, S.; Xie, Y.D.; Song, Y.L.; Wang, H.B. Numerical study on the internal flow field characteristics of a novel high-speed switching control valve. Actuators 2024, 13, 213. [Google Scholar] [CrossRef]
  21. Han, J.Z.; Xie, Y.D.; Wang, Y.; Wang, Q.X. Dynamic simulation of a warship control valve based on a mechanical-electric-fluid cosimulation model. Sci. Technol. Nucl. Install. 2021, 2021, 6683871. [Google Scholar] [CrossRef]
  22. Zhang, X.; Xie, Y.D.; Han, J.Z.; Wang, Y. Design of control valve with low energy consumption based on Isight platform. Energy 2022, 239, 122328. [Google Scholar] [CrossRef]
  23. Zhang, Y.Y.; Peng, J.H.; Li, S.J. Flow characteristic investigation on Laval-type flow rate regulating valves by fluid-thermal-structure interaction. Int. Commun. Heat Mass Transf. 2023, 144, 106771. [Google Scholar] [CrossRef]
  24. Chen, C.; Shi, W.K.; Shen, Y.M.; Chen, J.Q.; Zhang, A.M. A multi-resolution SPH-FEM method for fluid-structure interactions. Comput. Methods Appl. Mech. Eng. 2022, 401, 115659. [Google Scholar] [CrossRef]
  25. Chattopadhyay, H.; Kundu, A.; Saha, B.K.; Gangopadhyay, T. Analysis of flow structure inside a spool type pressure regulating valve. Energy Convers. Manag. 2012, 53, 196–204. [Google Scholar] [CrossRef]
  26. Beune, A.; Kuerten, J.G.M.; Heumen, M.P.C.V. CFD analysis with fluid-structure interaction of opening high-pressure safety valves. Comput. Fluids 2012, 64, 108–116. [Google Scholar] [CrossRef]
  27. Zheng, X.L.; Wei, J.F. On the prediction of P–S–N curves of 45 steel notched elements and probability distribution of fatigue life under variable amplitude loading from tensile properties. Int. J. Fatigue 2005, 27, 601–609. [Google Scholar] [CrossRef]
Figure 1. Laver fluffy control valve structure: (a) three-dimensional model of the valve; (b) cross-sectional view of the valve.
Actuators 14 00163 g001aActuators 14 00163 g001b
Figure 2. Lower grinding plate model.
Actuators 14 00163 g002
Figure 3. Original flow field model of the laver fluffy control valve.
Actuators 14 00163 g003
Figure 4. Mesh independence verification.
Actuators 14 00163 g004
Figure 5. Flow structure coupling calculation process: (A) flow field simulation calculation; (B) static structural calculation; (C) fluid-structure interaction results.
Actuators 14 00163 g005
Figure 6. Finite element model of the control valve: (a) fluid-structure interaction model; (b) sectional view; (c) side sectional view.
Actuators 14 00163 g006
Figure 7. Load and constraint application.
Actuators 14 00163 g007
Figure 8. Comparison between experimental results and simulation results.
Actuators 14 00163 g008
Figure 9. Cross-sectional diagram for two different inlet pipe shapes.
Actuators 14 00163 g009
Figure 10. Fluid domain model of the control valve under different inlet shapes.
Actuators 14 00163 g010
Figure 11. Schematic diagram of the location of different inlet runner sections.
Actuators 14 00163 g011
Figure 12. Velocity magnitude contours and streamline in the control valve under different inlet upper cavity shapes.
Actuators 14 00163 g012
Figure 13. Velocity and pressure distribution at the middle position of each cone.
Actuators 14 00163 g013aActuators 14 00163 g013b
Figure 14. Velocity and pressure distribution at the middle position of the bell-shaped inlet.
Actuators 14 00163 g014
Figure 15. Schematic diagram of the upper chamber.
Actuators 14 00163 g015
Figure 16. Fluid domain model for different upper cavity heights.
Actuators 14 00163 g016
Figure 17. Volume flow rates at different openings (%) and upper cavity heights (mm).
Actuators 14 00163 g017
Figure 18. Velocity magnitude contours and streamline in the control valve under different upper cavity heights.
Actuators 14 00163 g018
Figure 19. Velocity and pressure changes in the middle of each upper chamber.
Actuators 14 00163 g019
Figure 20. Fluid domain model when the upper cavity inlet and height change at the same time.
Actuators 14 00163 g020
Figure 21. Volume flow rates at different openings (%) and upper cavity heights (mm) under bell-shaped inlet.
Actuators 14 00163 g021
Figure 22. Volume flow rates at different openings (%) and inlet shapes under 5 mm upper cavity height.
Actuators 14 00163 g022
Figure 23. Volume flow rates at different openings (%) and inlet shapes under 68 mm upper cavity height.
Actuators 14 00163 g023
Figure 24. Different lower chamber designs.
Actuators 14 00163 g024
Figure 25. Volume flow rates at different openings (%) and lower chamber schemes.
Actuators 14 00163 g025
Figure 29. Fluid domain models under different improvement schemes.
Actuators 14 00163 g029
Figure 30. Comparison of the volume flow rate of the valve outlet for different schemes.
Actuators 14 00163 g030
Figure 31. Model of the improved fluid domain.
Actuators 14 00163 g031
Figure 32. Equivalent stress and total deformation of the valve element at 100% opening.
Actuators 14 00163 g032
Figure 33. Equivalent stress of the T-shaped valve rod at different openings.
Actuators 14 00163 g033
Figure 34. Equivalent stress and total deformation of the valve element under working conditions.
Actuators 14 00163 g034
Table 1. Material properties of control valve structure.
MaterialDensity (kg/m3)Modulus of Elasticity (GPa)Poisson’s Ratio
Gray iron72501500.25
45# steel78502090.269
Polytetrafluoroethylene23005000.4
Silica gel12302.90.47
Table 2. The outlet volume flow rate of the valve at different openings obtained from the simulation.
Rotation Angle (Degrees)Valve Opening (%)Volume Flow (m3/s)Relative Volume Flow Rate (%)
34.92000
30.64.920.02048.08
28.88.270.034013.47
25.216.390.066426.30
23.421.030.084633.50
16.242.480.168566.73
10.860.720.207882.30
5.480.010.234292.75
01000.2525100
Table 3. The outlet volume flow rate of the valve at different openings with the valve inlet pressure of 6 bar obtained from the experiment.
Valve Opening (%)Valve Inlet
Pressure (Bar)
Valve Outlet
Pressure (Bar)
Volume Flow Rate (m3/s)Relative Volume Flow Rate (%)
06.00000
106.000.900.01118.33
306.002.480.02338.33
456.003.900.04066.67
606.005.000.05286.67
906.005.900.05998.33
1006.006.000.060100
Table 4. The outlet volume flow rate of the valve at different openings with the valve inlet pressure of 9 bar obtained from the experiment.
Valve Opening (%)Valve Inlet
Pressure (Bar)
Valve Outlet
Pressure (Bar)
Volume Flow Rate (m3/s)Relative Volume Flow Rate (%)
09.00000
109.001.370.01617.78
309.003.700.03437.78
459.005.900.06167.78
609.007.500.07886.67
909.008.860.08998.89
1009.009.000.090100
Table 5. Volume flow at each upper cavity inlet.
Flow Rate (m3/s)Opening (%)
520406080100
Inlet shape (degrees or type)10°0.01350.05670.11930.16990.19700.2065
20°0.01330.05650.12070.16960.19710.2067
30°0.01340.05640.11930.16940.19630.2064
40°0.01340.05660.12010.16710.19520.2059
Bell-shaped0.01340.05670.11960.16720.19440.2062
Table 6. Volume flow rate at each upper cavity height.
Flow Rate (m3/s)Opening (%)
5%20%40%60%80%100%
Upper cavity height (mm)50.01360.04940.07820.08950.09240.0929
180.01340.05480.10920.14280.16010.1684
320.01330.05480.11480.15370.17650.1831
500.01350.05580.11350.15080.17210.1818
680.01350.05600.11560.15430.17650.1859
Table 7. Volume flow rate for each fluid domain model.
Entrance TypeUpper Cavity Height (mm)Opening (%)
5%20%40%60%80%100%
20° cone50.01370.05640.11920.16940.19770.2080
680.01340.05640.12060.16990.19690.2070
40° cone50.01370.05660.11830.16800.19560.2081
680.01360.05680.12000.16880.19460.2058
Bell-shaped50.01370.05630.11670.16310.18910.1971
680.01330.05640.12040.16720.19360.2043
Table 8. Volume flow rates for different lower chamber schemes.
Volume Flow Rate (m3/s)Opening (%)
5%20%40%60%80%100%
Lower chamber schemeOriginal fluid domain0.01330.05480.11480.15370.17650.1831
Option I0.01310.05550.11140.15350.17530.1841
Option II0.01650.05740.11950.17800.20110.2112
Table 9. Volume flow rates of the valve outlet corresponding to the two schemes.
Flow Rate (m3/s)Opening (%)
5%20%40%60%80%100%
Lower chamber schemeOriginal model0.01330.05480.11480.15370.17650.1831
Option I0.01380.05890.12720.19090.22980.2458
Option II0.01370.05820.12760.18830.22680.2430
Table 10. Volume flow rate change rate under two schemes.
Flow Rate (m3/s)Opening (%)
5%20%40%60%80%100%
Lower chamber schemeOption IIncrease the amount0.00050.00410.01240.03720.05330.0627
growth rate3.76%7.48%10.80%24.20%30.20%34.24%
Option IIIncrease the amount0.00040.00340.01280.03460.05030.0599
growth rate3.00%6.20%11.15%22.51%28.50%32.71%
Disclaimer/Publisher’s Note: The statements, opinions and data contained in all publications are solely those of the individual author(s) and contributor(s) and not of MDPI and/or the editor(s). MDPI and/or the editor(s) disclaim responsibility for any injury to people or property resulting from any ideas, methods, instructions or products referred to in the content.