
Ten-Week Sucralose Consumption Induces Gut Dysbiosis and Altered Glucose and Insulin Levels in Healthy Young Adults

 , , , , , , and
Abstract
:1. Introduction
2. Materials and Methods
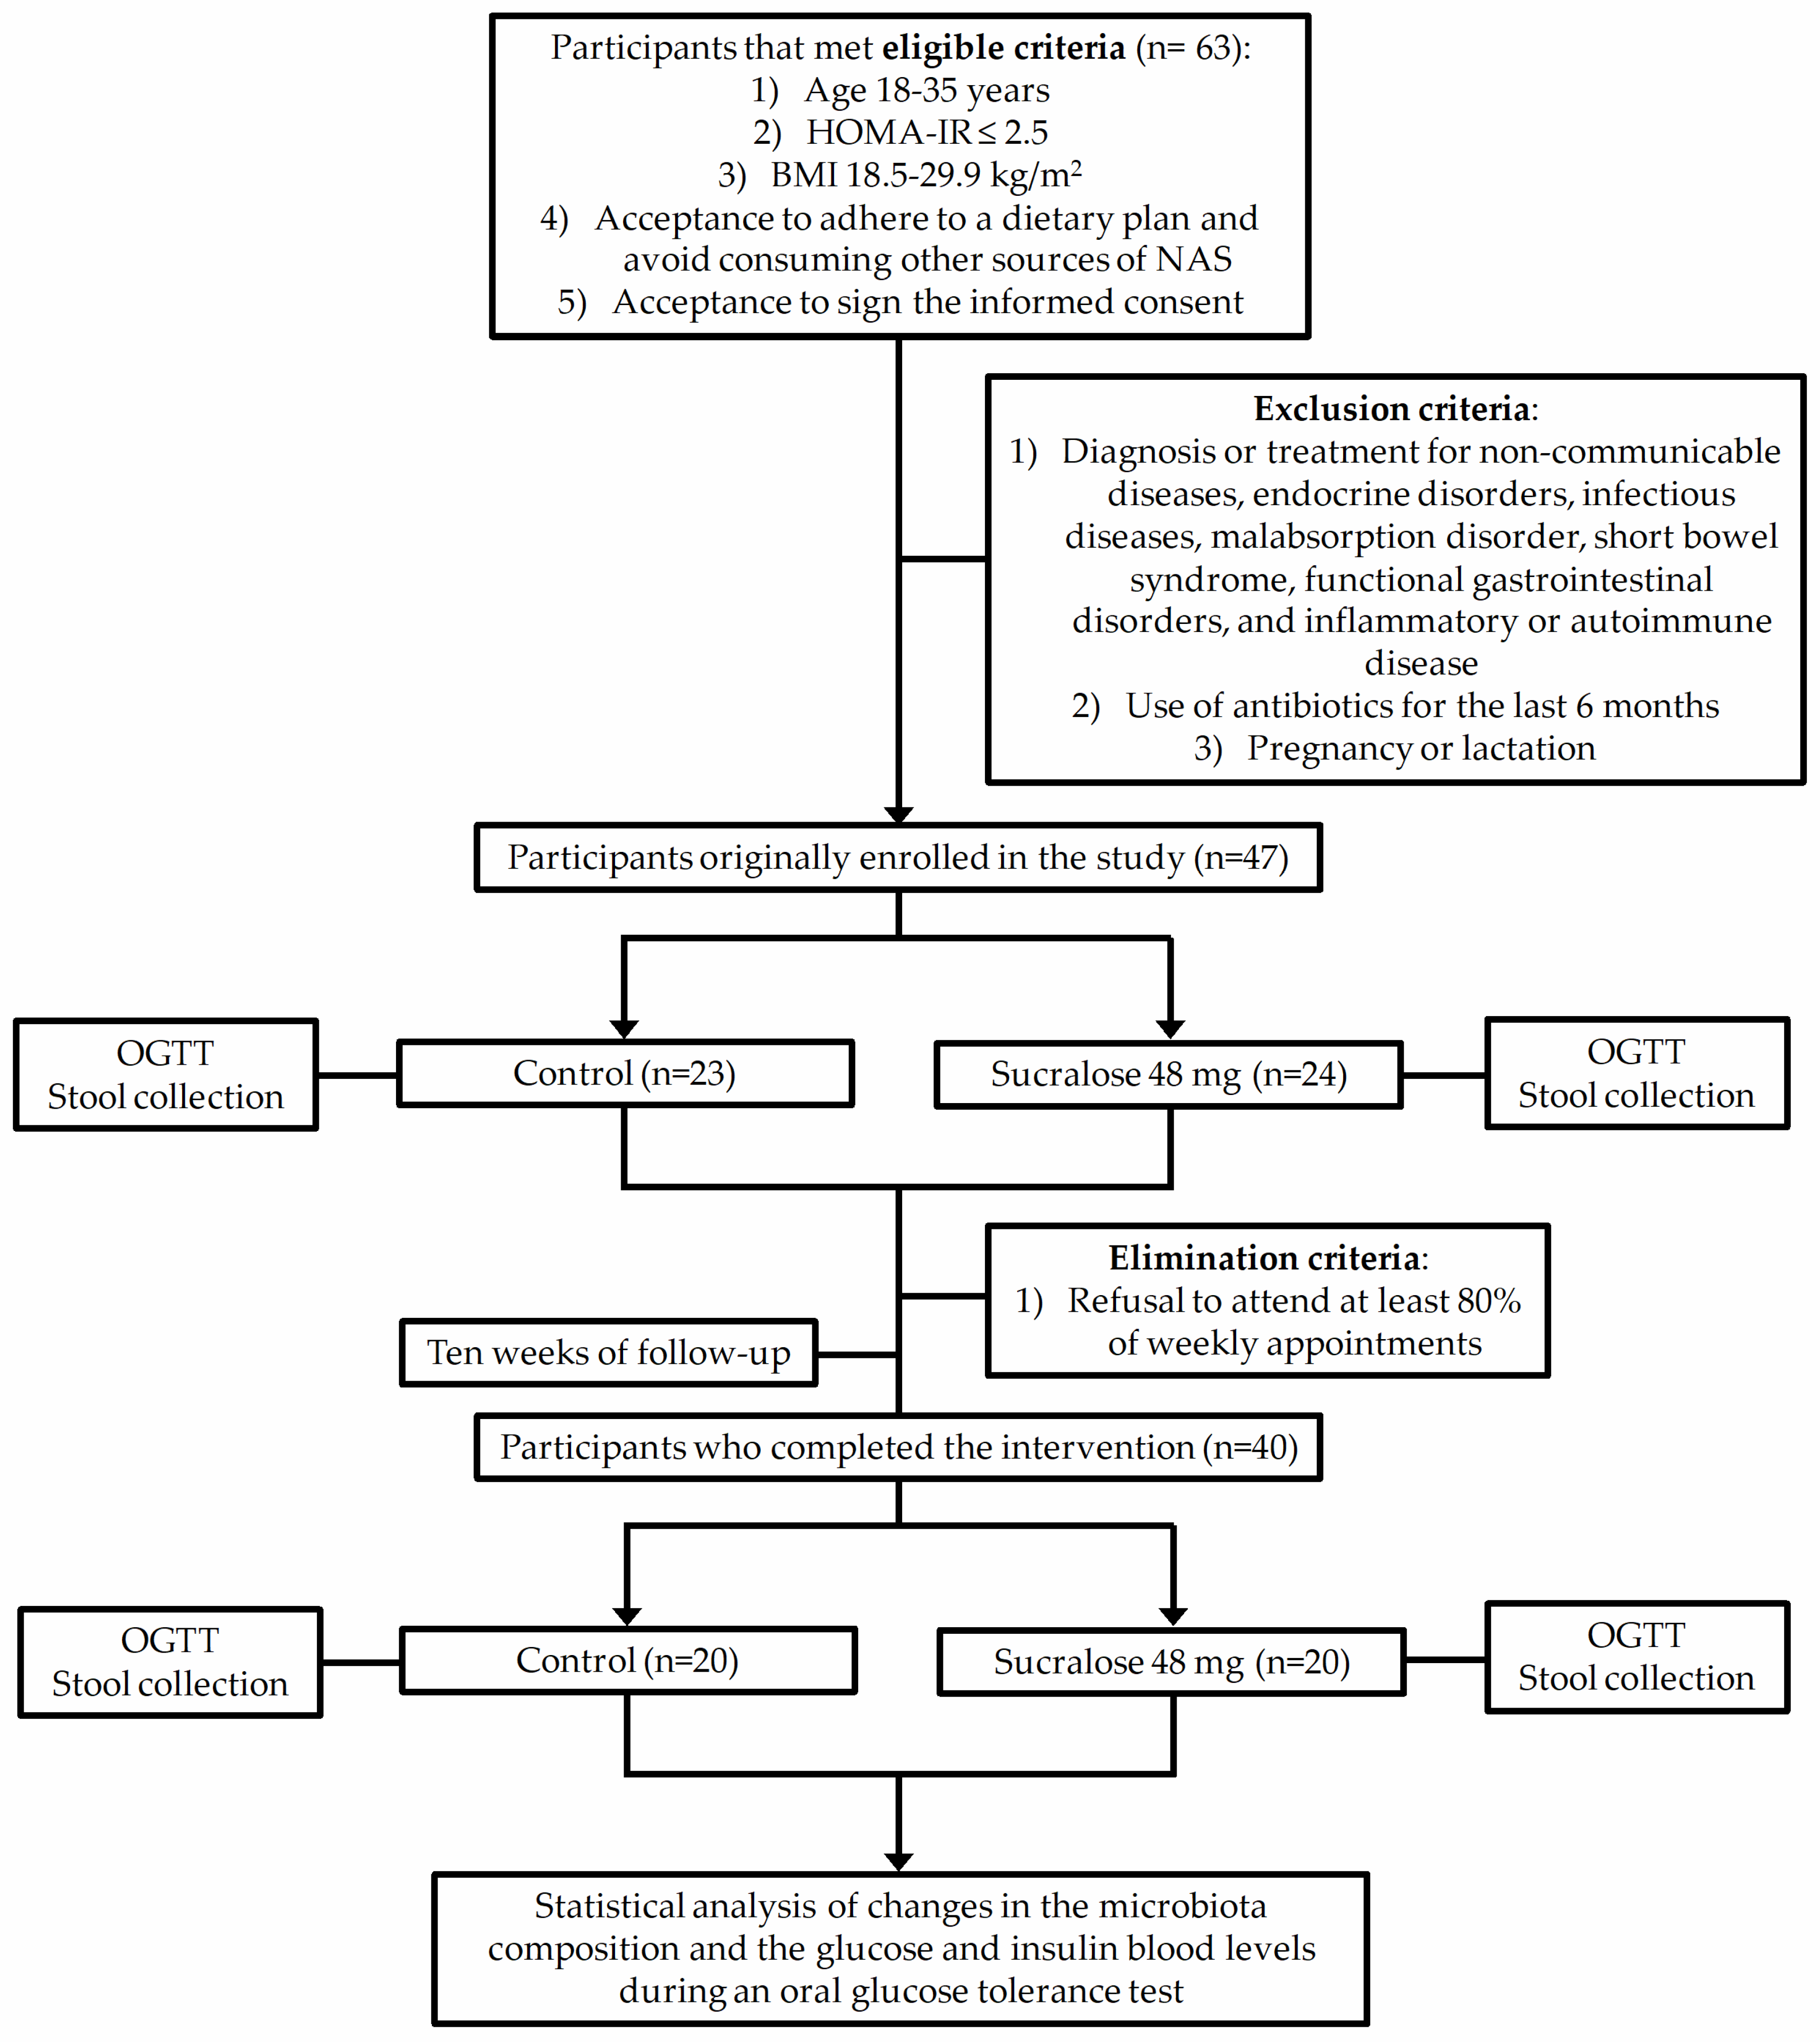
2.1. Subjects
2.2. Study Design
2.3. Bacterial Species Identification
2.4. Statistics
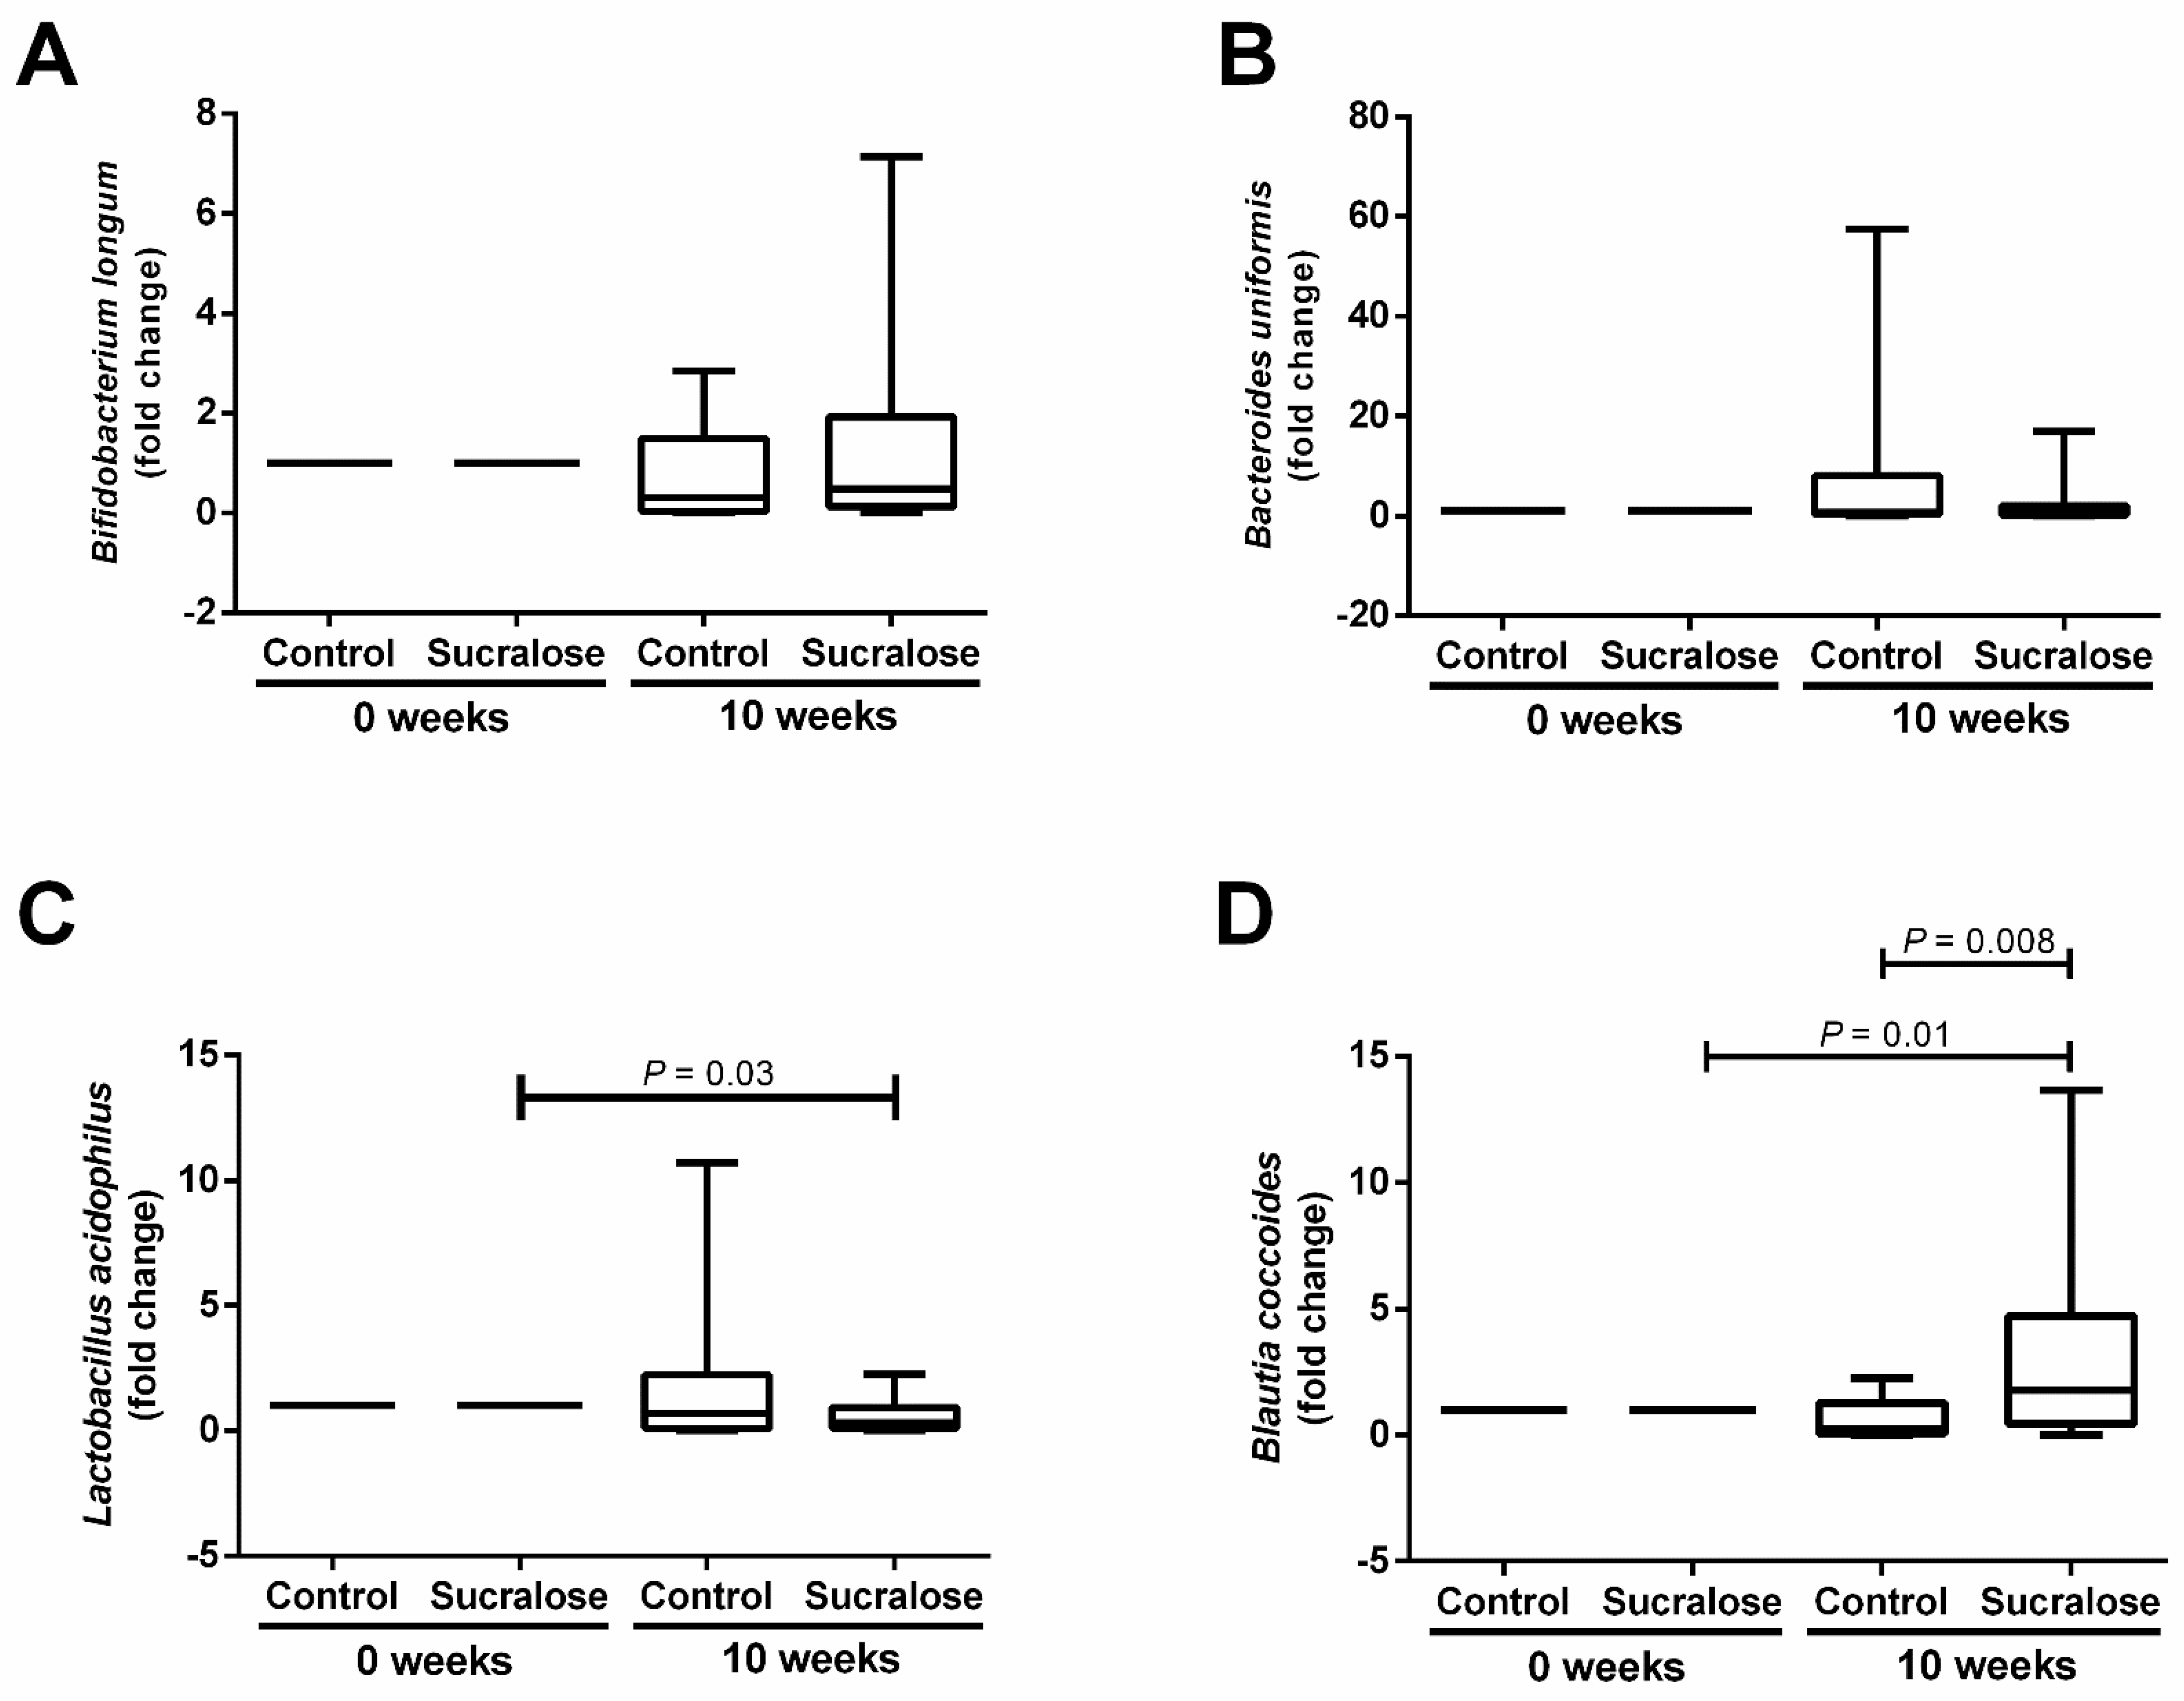
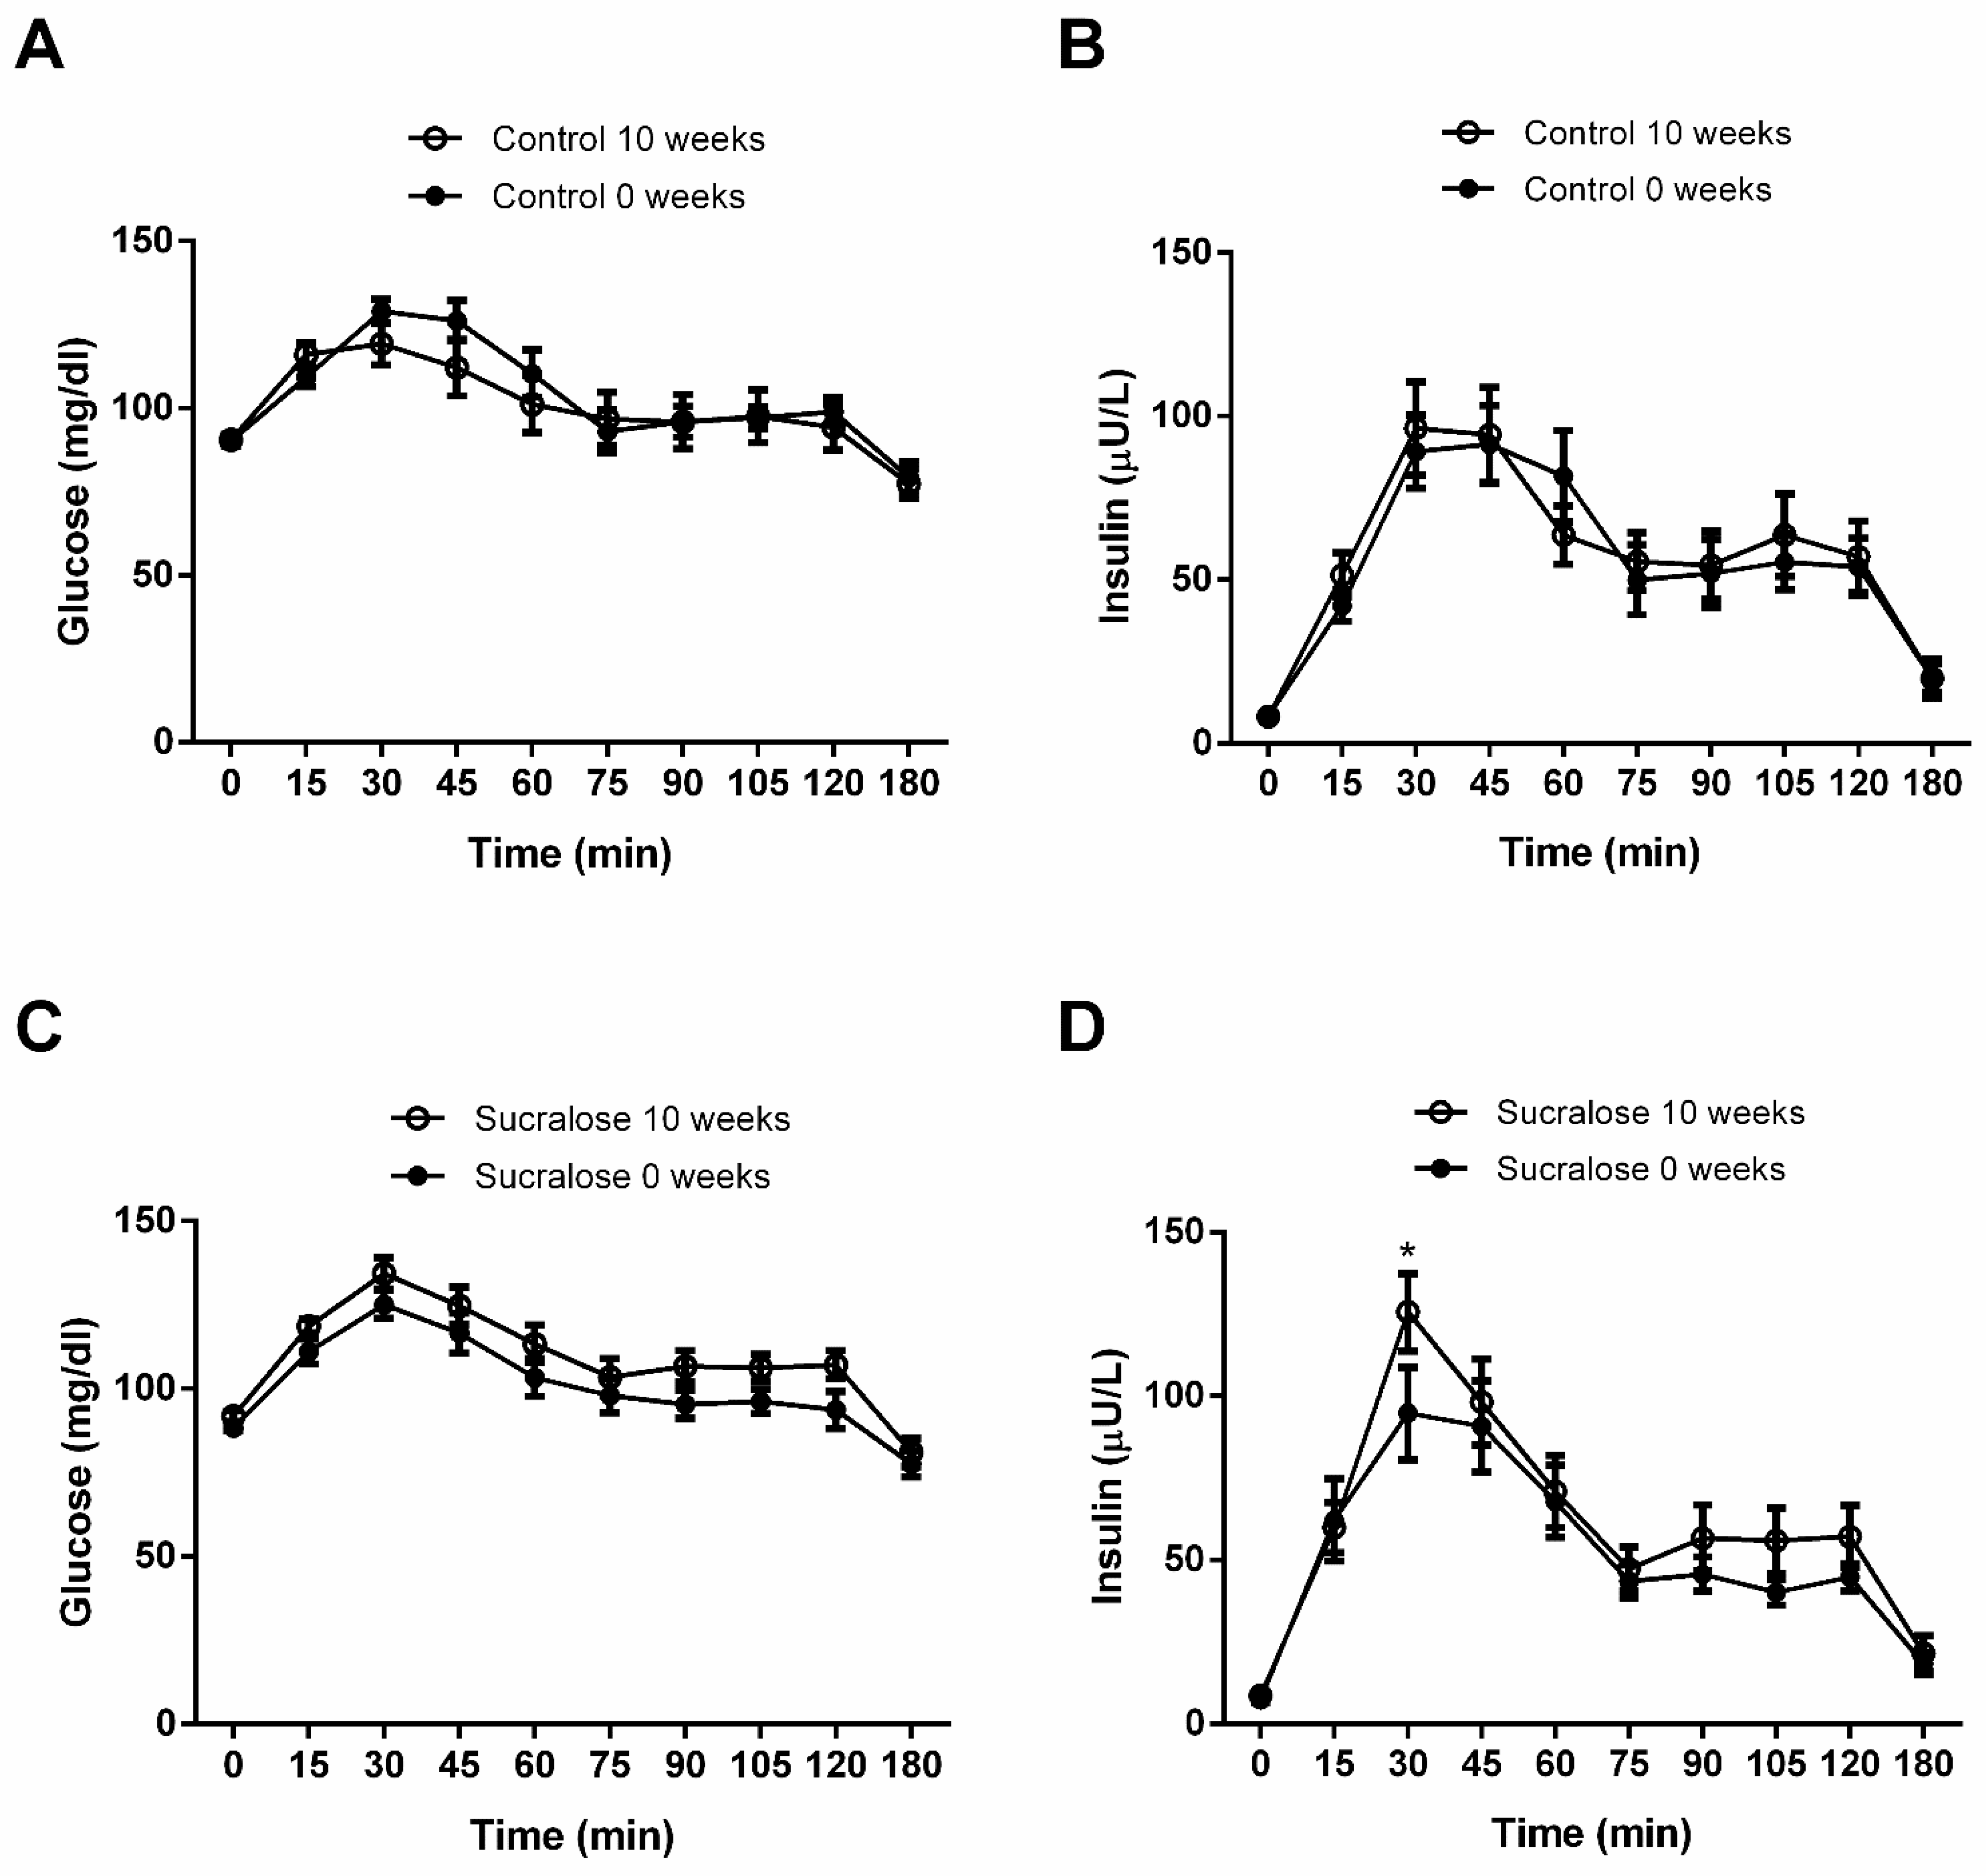
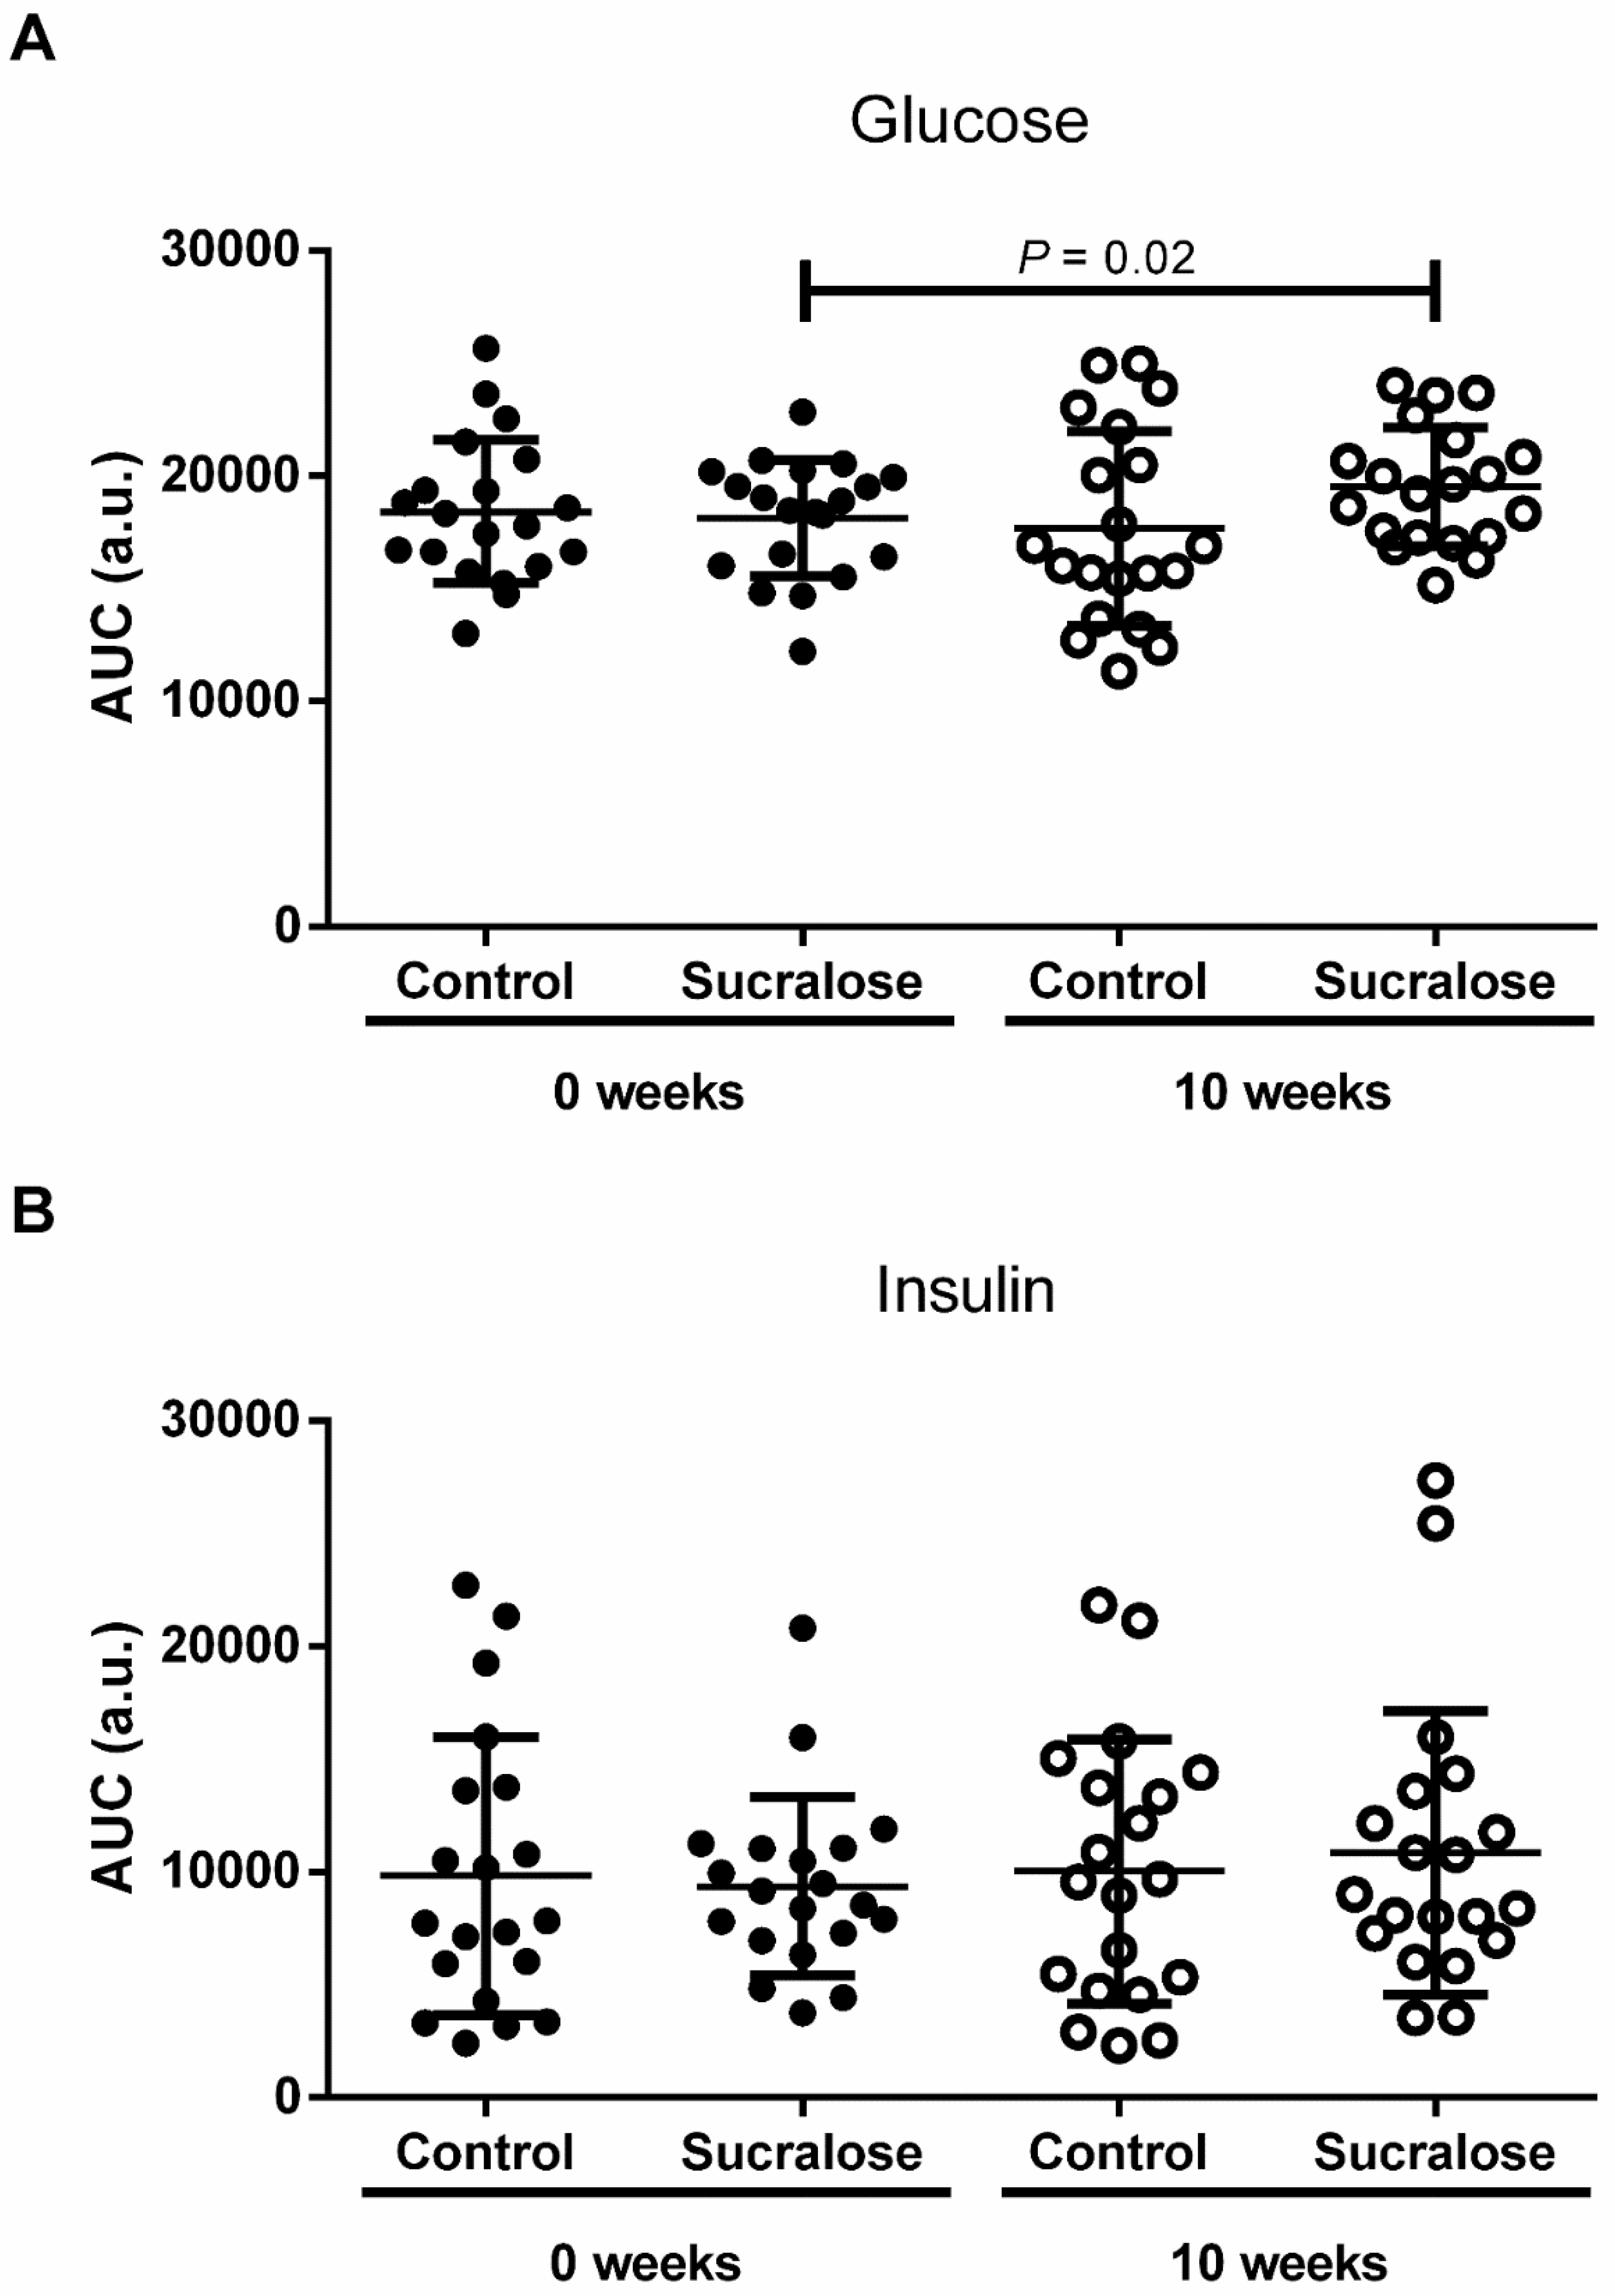
3. Results
4. Discussion
5. Conclusions
Author Contributions
Funding
Institutional Review Board Statement
Informed Consent Statement
Data Availability Statement
Acknowledgments
Conflicts of Interest
References
- Chattopadhyay, S.; Raychaudhuri, U.; Chakraborty, R. Artificial sweeteners—A review. J. Food Sci. Technol. 2014, 51, 611–621. [Google Scholar] [CrossRef] [Green Version]
- Suez, J.; Korem, T.; Zeevi, D.; Zilberman-Schapira, G.; Thaiss, C.A.; Maza, O.; Israeli, D.; Zmora, N.; Gilad, S.; Weinberger, A.; et al. Artificial sweeteners induce glucose intolerance by altering the gut microbiota. Nature 2014, 514, 181–186. [Google Scholar] [CrossRef]
- Wang, Q.P.; Browman, D.; Herzog, H.; Neely, G.G. Non-nutritive sweeteners possess a bacteriostatic effect and alter gut microbiota in mice. PLoS ONE 2018, 13, e0199080. [Google Scholar] [CrossRef] [PubMed]
- Bian, X.; Chi, L.; Gao, B.; Tu, P.; Ru, H.; Lu, K. Gut microbiome response to sucralose and its potential role in inducing liver inflammation in mice. Front. Physiol. 2017, 8, 487. [Google Scholar] [CrossRef] [Green Version]
- Vetrani, C.; Maukonen, J.; Bozzetto, L.; Della Pepa, G.; Vitale, M.; Costabile, G.; Riccardi, G.; Rivellese, A.A.; Saarela, M.; Annuzzi, G. Diets naturally rich in polyphenols and/or long-chain n-3 polyunsaturated fatty acids differently affect microbiota composition in high-cardiometabolic-risk individuals. Acta Diabetol. 2020, 57, 853–860. [Google Scholar] [CrossRef] [PubMed]
- Kapar, F.S.; Ciftci, G. The effects of curcumin and Lactobacillus acidophilus on certain hormones and insulin resistance in rats with metabolic syndrome. J. Diabetes Metab. Disord. 2020, 19, 907–914. [Google Scholar] [CrossRef] [PubMed]
- Ahmad, S.Y.; Friel, J.; Mackay, D. The effects of non-nutritive artificial sweeteners, aspartame and sucralose, on the gut microbiome in healthy adults: Secondary outcomes of a randomized double-blinded crossover clinical trial. Nutrients 2020, 12, 3408. [Google Scholar] [CrossRef] [PubMed]
- Thomson, P.; Santibanez, R.; Aguirre, C.; Galgani, J.E.; Garrido, D. Short-term impact of sucralose consumption on the metabolic response and gut microbiome of healthy adults. Br. J. Nutr. 2019, 122, 856–862. [Google Scholar] [CrossRef] [Green Version]
- Gerasimidis, K.; Bryden, K.; Chen, X.; Papachristou, E.; Verney, A.; Roig, M.; Hansen, R.; Nichols, B.; Papadopoulou, R.; Parrett, A. The impact of food additives, artificial sweeteners and domestic hygiene products on the human gut microbiome and its fibre fermentation capacity. Eur. J. Nutr. 2020, 59, 3213–3230. [Google Scholar] [CrossRef] [Green Version]
- American Dietetic Association DoC. Position of the American Dietetic Association and Dietitians of Canada: Nutrition and women’s health. J. Acad. Nutr. Diet. 2004, 104, 984–1001. [Google Scholar]
- Martyn, D.; Darch, M.; Roberts, A.; Lee, H.Y.; Yaqiong Tian, T.; Kaburagi, N.; Belmar, P. Low-/no-calorie sweeteners: A review of global intakes. Nutrients 2018, 10, 357. [Google Scholar] [CrossRef] [PubMed] [Green Version]
- Romo-Romo, A.; Aguilar-Salinas, C.A.; Brito-Cordova, G.X.; Gomez-Diaz, R.A.; Almeda-Valdes, P. Sucralose decreases insulin sensitivity in healthy subjects: A randomized controlled trial. Am. J. Clin. Nutr. 2018, 108, 485–491. [Google Scholar] [CrossRef]
- Bueno-Hernandez, N.; Esquivel-Velazquez, M.; Alcantara-Suarez, R.; Gomez-Arauz, A.Y.; Espinosa-Flores, A.J.; de Leon-Barrera, K.L.; Mendoza-Martínez, V.M.; Medina, G.A.S.; León-Hernández, M.; Ruiz-Barranco, A.; et al. Chronic sucralose consumption induces elevation of serum insulin in young healthy adults: A randomized, double blind, controlled trial. Nutr. J. 2020, 19, 32. [Google Scholar] [CrossRef] [PubMed] [Green Version]
- Peng, L.; Li, Z.R.; Green, R.S.; Holzman, I.R.; Lin, J. Butyrate enhances the intestinal barrier by facilitating tight junction assembly via activation of AMP-activated protein kinase in Caco-2 cell monolayers. J. Nutr. 2009, 139, 1619–1625. [Google Scholar] [CrossRef] [PubMed]
- Chen, F.C.; Shen, K.P.; Chen, J.B.; Lin, H.L.; Hao, C.L.; Yen, H.W.; Shaw, S.Y. PGBR extract ameliorates TNF-alpha induced insulin resistance in hepatocytes. Kaohsiung J. Med. Sci. 2018, 34, 14–21. [Google Scholar] [CrossRef]
- Sender, R.; Fuchs, S.; Milo, R. Revised estimates for the number of human and bacteria cells in the body. PLoS Biol. 2016, 14, e1002533. [Google Scholar] [CrossRef] [Green Version]
- Yang, F.; Zhu, W.J.; Edirisuriya, P.; Ai, Q.; Nie, K.; Ji, J.M.; Li, Y.; Zhou, K. Beneficial effects of a combination of Clostridium cochlearium and Lactobacillus acidophilus on body weight gain, insulin sensitivity, and gut microbiota in high-fat diet-induced obese mice. Nutrition 2022, 93, 111439. [Google Scholar] [CrossRef]
- Kashtanova, D.A.; Tkacheva, O.N.; Doudinskaya, E.N.; Strazhesko, I.D.; Kotovskaya, Y.V.; Popenko, A.S.; Tyakht, A.V.; Alexeev, D.G. Gut microbiota in patients with different metabolic statuses: Moscow study. Microorganisms 2018, 6, 98. [Google Scholar] [CrossRef] [Green Version]
- Caricilli, A.M.; Saad, M.J. The role of gut microbiome on insulin resistance. Nutrients 2013, 5, 829–851. [Google Scholar] [CrossRef] [Green Version]
- Gomes, A.C.; Hoffmann, C.; Mota, J.F. The human gut microbiota: Metabolism and perspective in obesity. Gut Microbes 2018, 9, 308–325. [Google Scholar] [CrossRef] [Green Version]
- Lopetuso, L.R.; Scaldaferri, F.; Petito, V.; Gasbarrini, A. Commensal Clostridia: Leading players in the maintenance of gut homeostasis. Gut Pathog. 2013, 5, 23. [Google Scholar] [CrossRef] [Green Version]
- Boesmans, L.; Valles-Colomer, M.; Wang, J.; Eeckhaut, V.; Falony, G.; Ducatelle, R.; Van Immerseel, F.; Raes, J.; Verbeke, K. Butyrate producers as potential next-generation probiotics: Safety assessment of the administration of Butyricicoccus pullicaecorum to healthy volunteers. mSystems 2018, 3, e00094-18. [Google Scholar] [CrossRef] [Green Version]
- Abou-Donia, M.B.; El-Masry, E.M.; Abdel-Rahman, A.A.; McLendon, R.E.; Schiffman, S.S. Splenda alters gut microflora and increases intestinal p-glycoprotein and cytochrome p-450 in male rats. J. Toxicol. Environ. Health A 2008, 71, 1415–1429. [Google Scholar] [CrossRef]
- Andreasen, A.S.; Larsen, N.; Pedersen-Skovsgaard, T.; Berg, R.M.; Møller, K.; Svendsen, K.D.; Jakobsen, M.; Pedersen, B.K. Effects of Lactobacillus acidophilus NCFM on insulin sensitivity and the systemic inflammatory response in human subjects. Br. J. Nutr. 2010, 104, 1831–1838. [Google Scholar] [CrossRef] [Green Version]
- Hsieh, M.C.; Tsai, W.H.; Jheng, Y.P.; Su, S.L.; Wang, S.Y.; Lin, C.C.; Chen, Y.H.; Chang, W.W. The beneficial effects of Lactobacillus reuteri ADR-1 or ADR-3 consumption on type 2 diabetes mellitus: A randomized, double-blinded, placebo-controlled trial. Sci. Rep. 2018, 8, 16791. [Google Scholar] [CrossRef]
- Qin, X. Letter: Non-nutritive sweeteners may have a bell-shaped dose response for dysbiosis-related adverse effects that contributed to discrepancies between prospective cohort and randomized controlled studies. J. Obes. Metab. Syndr. 2020, 29, 237–239. [Google Scholar] [CrossRef]
- Ahmad, S.Y.; Azad, M.B.; Friel, J.; MacKay, D. Recent evidence for the effects of nonnutritive sweeteners on glycaemic control. Curr. Opin. Clin. Nutr. Metab. Care 2019, 22, 278–283. [Google Scholar] [CrossRef] [PubMed]
- Ahmad, S.Y.; Friel, J.K.; Mackay, D.S. Effect of sucralose and aspartame on glucose metabolism and gut hormones. Nutr. Rev. 2020, 78, 725–746. [Google Scholar] [CrossRef]
- Li, X.; Liu, Y.; Wang, Y.; Li, X.; Liu, X.; Guo, M.; Tan, Y.; Qin, X.; Wang, X.; Jiang, M. Sucralose Promotes Colitis-Associated Colorectal Cancer Risk in a Murine Model Along With Changes in Microbiota. Front. Oncol. 2020, 10, 710. [Google Scholar] [CrossRef]
- Guo, M.; Liu, X.; Tan, Y.; Kang, F.; Zhu, X.; Fan, X.; Wang, C.; Wang, R.; Liu, Y.; Qin, X.; et al. Sucralose enhances the susceptibility to dextran sulfate sodium (DSS) induced colitis in mice with changes in gut microbiota. Food Funct. 2021, 12, 9380–9390. [Google Scholar] [CrossRef]
- Liu, C.W.; Chi, L.; Tu, P.; Xue, J.; Ru, H.; Lu, K. Quantitative proteomics reveals systematic dysregulations of liver protein metabolism in sucralose-treated mice. J. Proteom. 2019, 30, 1–10. [Google Scholar] [CrossRef]
- Zhang, X.; Gu, J.; Zhao, C.; Hu, Y.; Zhang, B.; Wang, J.; Lv, H.; Ji, X.; Wang, S. Sweeteners Maintain Epithelial Barrier Function Through the miR-15b/RECK/MMP-9 Axis, Remodel Microbial Homeostasis, and Attenuate Dextran Sodium Sulfate-Induced Colitis in Mice. J. Agric. Food Chem. 2022, 12, 171–183. [Google Scholar] [CrossRef]


| Parameter | Control (n = 20) | p Value | Sucralose (n = 20) | p Value | p Value ac | p Value bd | ||
|---|---|---|---|---|---|---|---|---|
| Basal a | 10 Weeks b | Basal c | 10 Weeks d | |||||
| Gender (w/m) | 12/8 | 12/8 | 1.0 | 14/6 | 14/6 | 1.0 | 0.7 | 0.7 |
| Age (years) | 22.7 ± 3.8 | 22.8 ± 3.7 | 0.8 | 22.9 ± 3.4 | 23 ± 3.3 | 0.7 | 0.5 | 0.4 |
| Physical activity (yes/no) | 8/12 | 6/14 | 0.7 | 7/13 | 9/11 | 0.7 | 1.0 | 0.5 |
| Weight (kg) | 66.7 ± 13.5 | 66.5 ± 13.6 | 0.2 | 63.9 ± 11.9 | 64.2 ± 12.3 | 0.2 | 0.3 | 0.3 |
| BMI (kg/m2) | 24.9 ± 4.5 | 24.7 ± 4.6 | 0.1 | 24.3 ± 2.6 | 23.5 ± 4.9 | 0.4 | 0.9 | 0.9 |
| Waist circumference (cm) | 80.8 ± 10.6 | 81 ± 10.7 | 0.6 | 80.4 ± 8 | 79.7 ± 7.9 | 0.7 | 0.7 | 0.7 |
| Hip circumference (cm) | 99.5 ± 9.9 | 99.6 ± 10.6 | 0.9 | 98.7 ± 6.2 | 98.9 ± 6.7 | 0.6 | 0.8 | 0.9 |
| Fat (%) | 36.3 ± 8.4 | 36.3 ± 8.2 | 0.8 | 37.7 ± 4.6 | 37.9 ± 5.3 | 0.8 | 0.6 | 0.7 |
| Total body water (%) | 46 ± 6 | 45.8 ± 5.9 | 0.7 | 44.5 ± 4 | 44.6 ± 4.2 | 0.7 | 0.5 | 0.5 |
| Lean dry mass (%) | 17.6 ± 2 | 17.7 ± 2.6 | 0.2 | 17.6 ± 1.4 | 17.6 ± 1.5 | 0.3 | 0.7 | 0.4 |
| SBP (mmHg) | 112 ± 9.4 | 112 ± 7 | 0.5 | 110 ± 10.9 | 111 ± 8.7 | 0.5 | 0.6 | 0.7 |
| DBP (mmHg) | 72.7 ± 6.5 | 74 ± 4.7 | 0.1 | 72.7 ± 6.7 | 72.5 ± 8.5 | 0.8 | 0.7 | 0.4 |
| Blood glucose (mg/dL) | 87 ± 5.4 | 88 ± 7.2 | 0.2 | 89.1 ± 5.5 | 90.2 ± 4.3 | 0.2 | 0.2 | 0.3 |
| HbA1c (%) | 5.2 ± 0.2 | 5.2 ± 0.3 | 0.6 | 5.2 ± 0.2 | 5.2 ± 0.2 | 0.8 | 0.7 | 0.9 |
| Serum insulin (mU/L) | 7.7 ± 2.8 | 8.1 ± 3.5 | 0.6 | 7.7 ± 2.7 | 8.3 ± 4.5 | 0.6 | 0.8 | 0.8 |
| HOMA-IR (a.u.) | 1.6 ± 0.5 | 1.7 ± 0.8 | 0.8 | 1.7 ± 0.6 | 1.7 ± 0.7 | 0.9 | 0.8 | 0.7 |
| Triglycerides (mg/dL) | 80.6 ± 33.3 | 98.2 ± 45.3 | 0.08 | 102.1 ± 64.3 | 97 ± 60.8 | 0.2 | 0.06 | 0.8 |
| Total cholesterol (mg/dL) | 159.4 ± 29.2 | 165 ± 39.6 | 0.5 | 163.5 ± 28.1 | 161.6 ± 31.5 | 0.4 | 0.5 | 0.7 |
| LDL (mg/dL) | 93.4 ± 25.5 | 99.1 ± 34.5 | 0.3 | 93.2 ± 20.1 | 93.9 ± 21.4 | 0.7 | 0.8 | 0.6 |
| HDL (mg/dL) | 44.3 ± 11.3 | 46.2 ± 9.8 | 0.3 | 41.8 ± 10.1 | 44.1 ± 11.2 | 0.1 | 0.4 | 0.5 |
| Serum creatinine (mg/dL) | 0.7 ± 0.1 | 0.8 ± 1 | 0.5 | 0.7 ± 0.1 | 0.7 ± 0.2 | 0.2 | 0.6 | 0.6 |
| Lipids (g/day) | 70.8 ± 39.4 | 68.5 ± 38.2 | 0.1 | 69.3 ± 45.1 | 66.4 ± 40.7 | 0.4 | 0.5 | 0.1 |
| Carbohydrates (g/day) | 267.3 ± 101.6 | 252 ± 11.7 | 0.1 | 285.2 ± 116.3 | 249 ± 104.5 | 0.4 | 0.2 | 0.2 |
| Protein (g/day) | 105.7 ± 70.8 | 107.5 ± 68.1 | 0.5 | 99.4 ± 65.2 | 101.2 ± 69.3 | 0.8 | 0.8 | 0.8 |
| Energy (kcal/day) | 2090 ± 941 | 1857 ± 671 | 0.4 | 1994 ± 792 | 2167 ± 802 | 0.2 | 0.9 | 0.2 |
Publisher’s Note: MDPI stays neutral with regard to jurisdictional claims in published maps and institutional affiliations. |
© 2022 by the authors. Licensee MDPI, Basel, Switzerland. This article is an open access article distributed under the terms and conditions of the Creative Commons Attribution (CC BY) license (https://creativecommons.org/licenses/by/4.0/).
Share and Cite
Méndez-García, L.A.; Bueno-Hernández, N.; Cid-Soto, M.A.; De León, K.L.; Mendoza-Martínez, V.M.; Espinosa-Flores, A.J.; Carrero-Aguirre, M.; Esquivel-Velázquez, M.; León-Hernández, M.; Viurcos-Sanabria, R.; et al. Ten-Week Sucralose Consumption Induces Gut Dysbiosis and Altered Glucose and Insulin Levels in Healthy Young Adults. Microorganisms 2022, 10, 434. https://doi.org/10.3390/microorganisms10020434
Méndez-García LA, Bueno-Hernández N, Cid-Soto MA, De León KL, Mendoza-Martínez VM, Espinosa-Flores AJ, Carrero-Aguirre M, Esquivel-Velázquez M, León-Hernández M, Viurcos-Sanabria R, et al. Ten-Week Sucralose Consumption Induces Gut Dysbiosis and Altered Glucose and Insulin Levels in Healthy Young Adults. Microorganisms. 2022; 10(2):434. https://doi.org/10.3390/microorganisms10020434
Chicago/Turabian StyleMéndez-García, Lucía A., Nallely Bueno-Hernández, Miguel A. Cid-Soto, Karen L. De León, Viridiana M. Mendoza-Martínez, Aranza J. Espinosa-Flores, Miguel Carrero-Aguirre, Marcela Esquivel-Velázquez, Mireya León-Hernández, Rebeca Viurcos-Sanabria, and et al. 2022. "Ten-Week Sucralose Consumption Induces Gut Dysbiosis and Altered Glucose and Insulin Levels in Healthy Young Adults" Microorganisms 10, no. 2: 434. https://doi.org/10.3390/microorganisms10020434