
Effect of Periodontal Interventions on Characteristics of the Periodontal Microbial Profile: A Systematic Review and Meta-Analysis

 ,
, 
 and
and 
Abstract
:1. Introduction
2. Materials and Methods
2.1. Study Registration
2.2. Specific Research Goals
- To find the changes in the composition of the periodontal microbiome community after periodontal treatment. By composition, we intend to find patterns in disease-associated shifts in the periodontal microbiota that differ in their directionality (microbiota pre-intervention vs. microbiota post-intervention);
- To find the magnitude of difference in alpha diversity metrics before and after periodontal treatment. Some of the commonly used measures include several OTU counts (richness), Shannon diversity index (accounts for both abundance and evenness of the species), and Chao1 index (non-parametric method for assessing the number of species in a community). To find the difference in beta diversity before and after treatment. The commonly used measures of beta diversity include UniFrac, PCA, PCoA, Bray Curtis dissimilarity, Jaccard distance, and Principal Coordinates Analysis; and
- To find the predominant bacterial species present in the periodontal microbiome and the total number of bacterial species that differ between the treatment group and control group identified through high throughput sequencing.
2.3. Search Strategy
2.4. Study Selection Criteria
2.4.1. Types of Participants
2.4.2. Type of Interventions
2.4.3. Types of Outcome Measures
2.5. Selection Criteria
2.5.1. Inclusion Criteria
2.5.2. Exclusion Criteria
2.5.3. Selection of Studies
2.6. Data Extraction
2.7. Assessment of Risk of Bias and Quality of Evidence Assessment
2.8. Statistical Analysis
2.9. Power Calculation for Meta-Analysis
3. Results
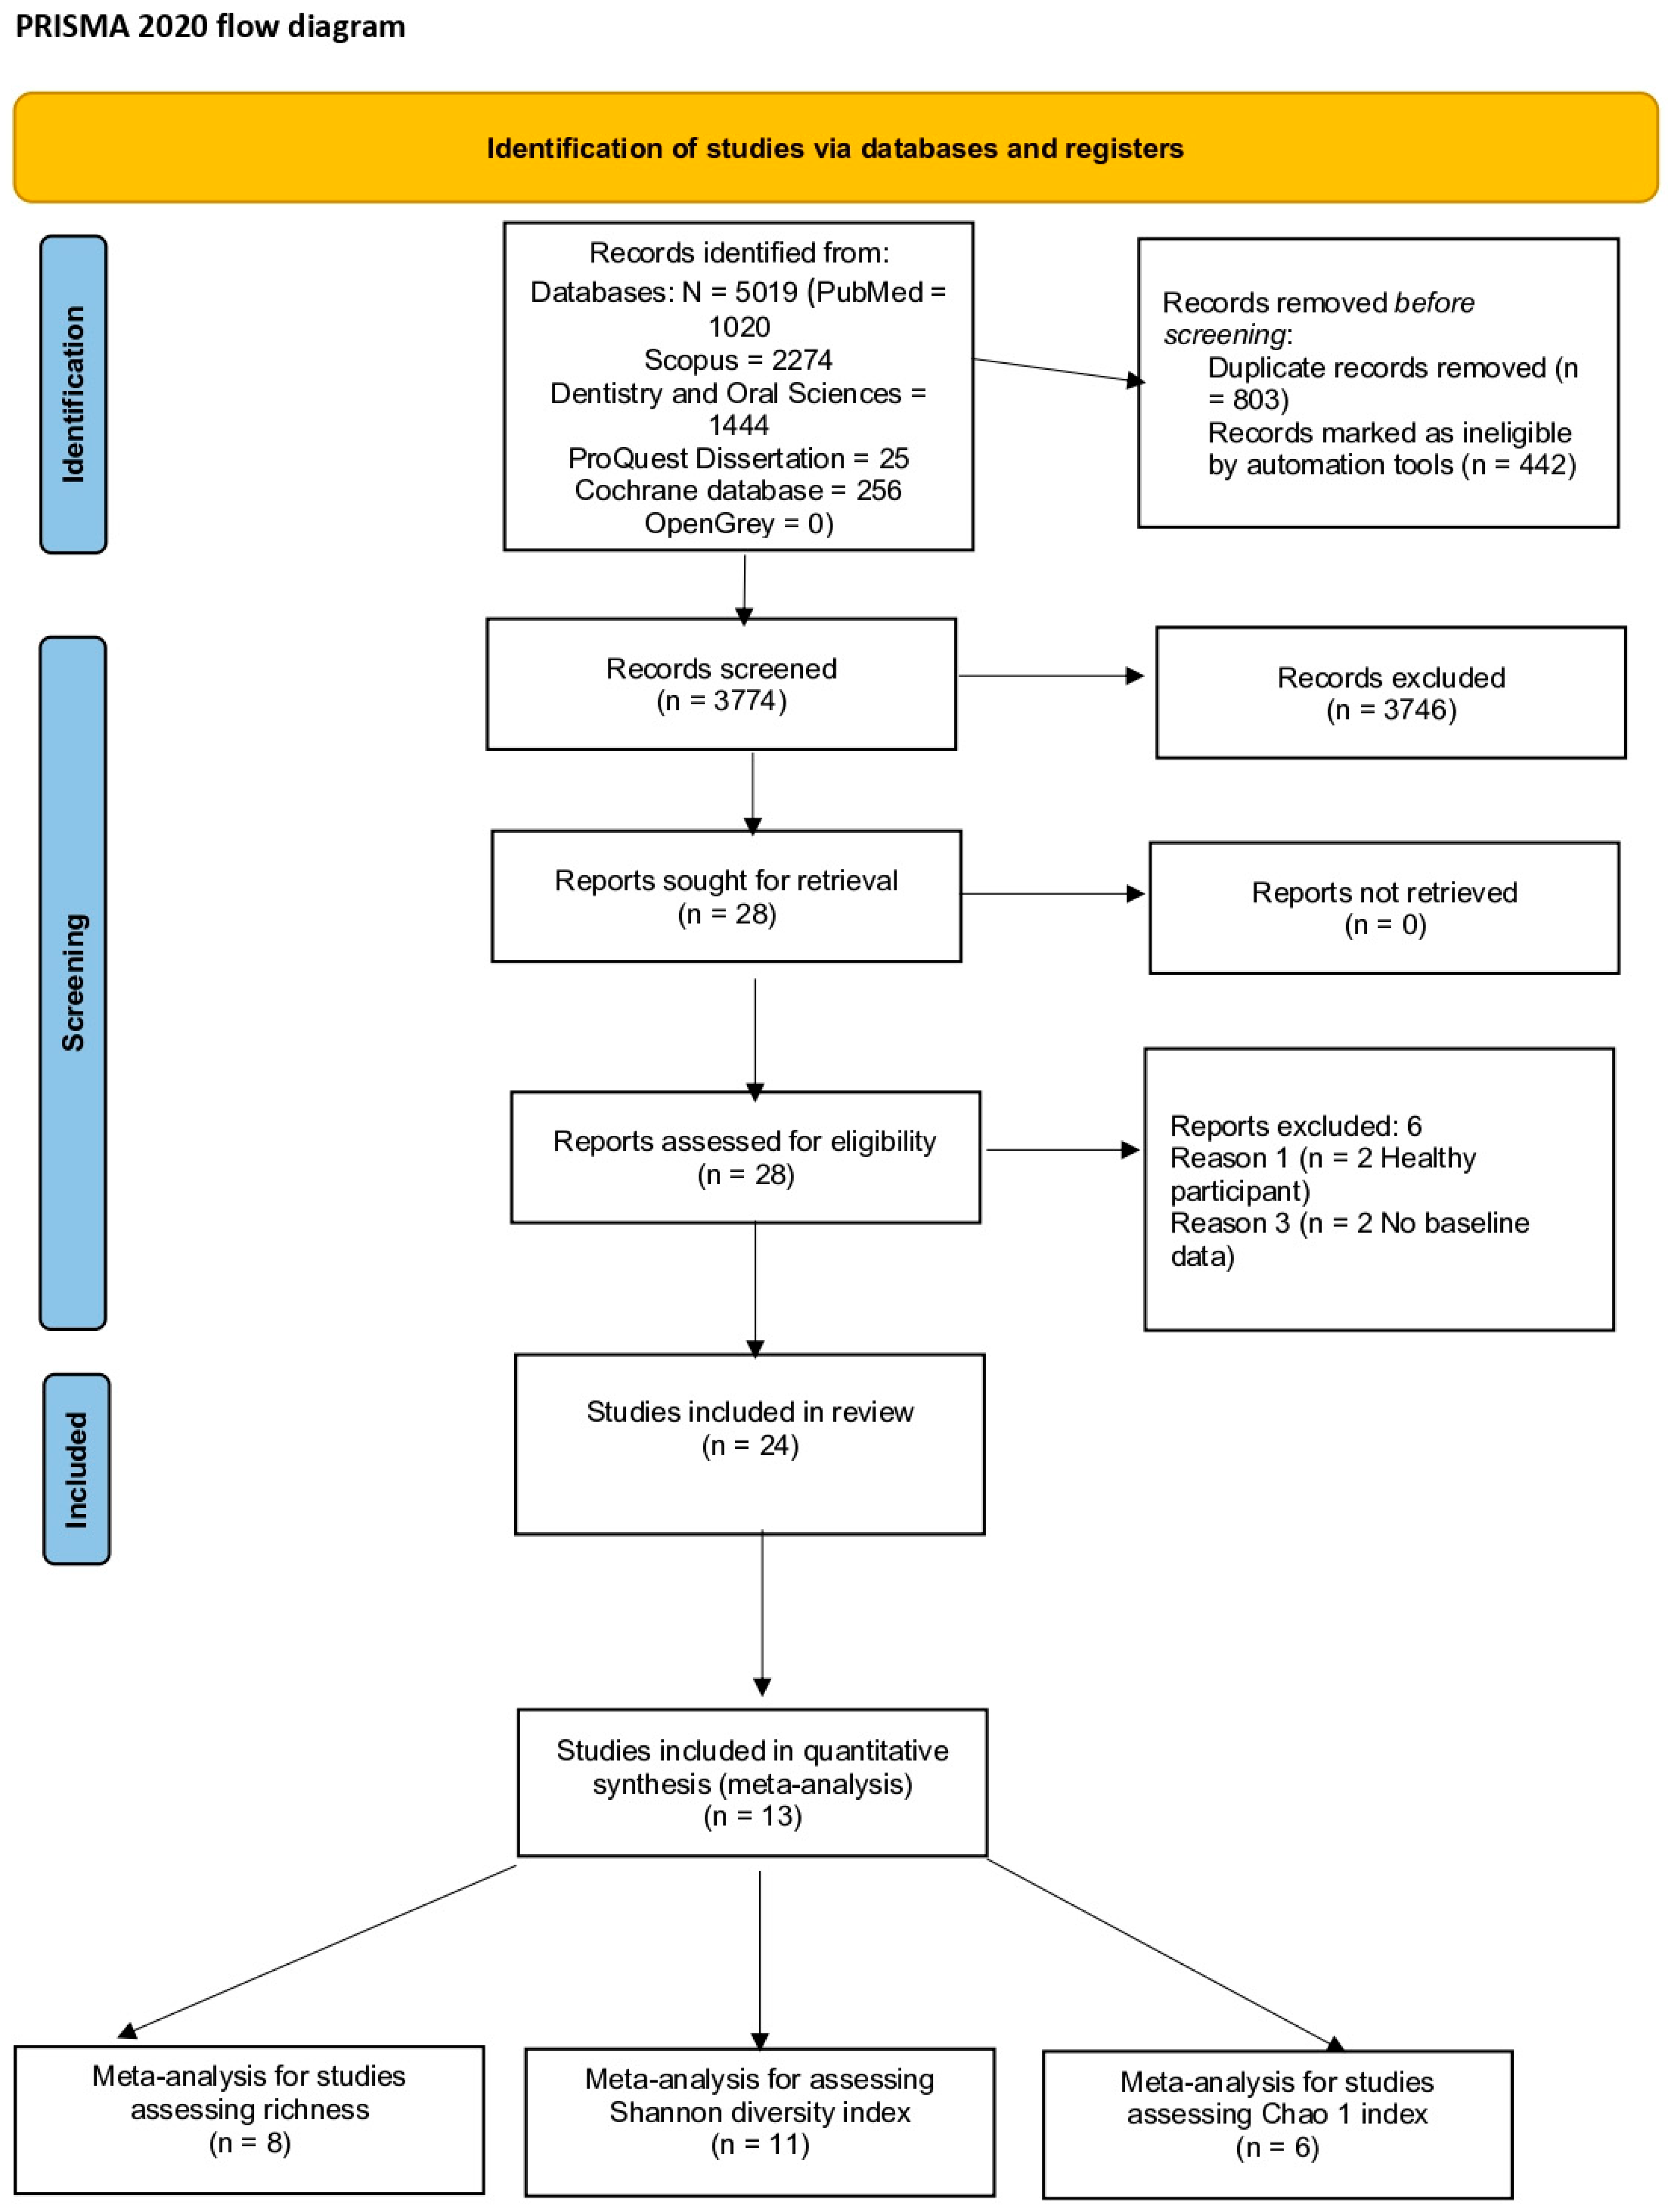
3.1. Search Strategy and Screening Process
3.2. Characteristics of Included Studies
3.2.1. Study Type and Intervention
3.2.2. Study Participants
3.2.3. Study Methodology and Metagenomics Analysis
3.2.4. Bioinformatics and Statistical Test
3.2.5. Measures of Alpha Diversity
3.2.6. The Measure of Beta Diversity
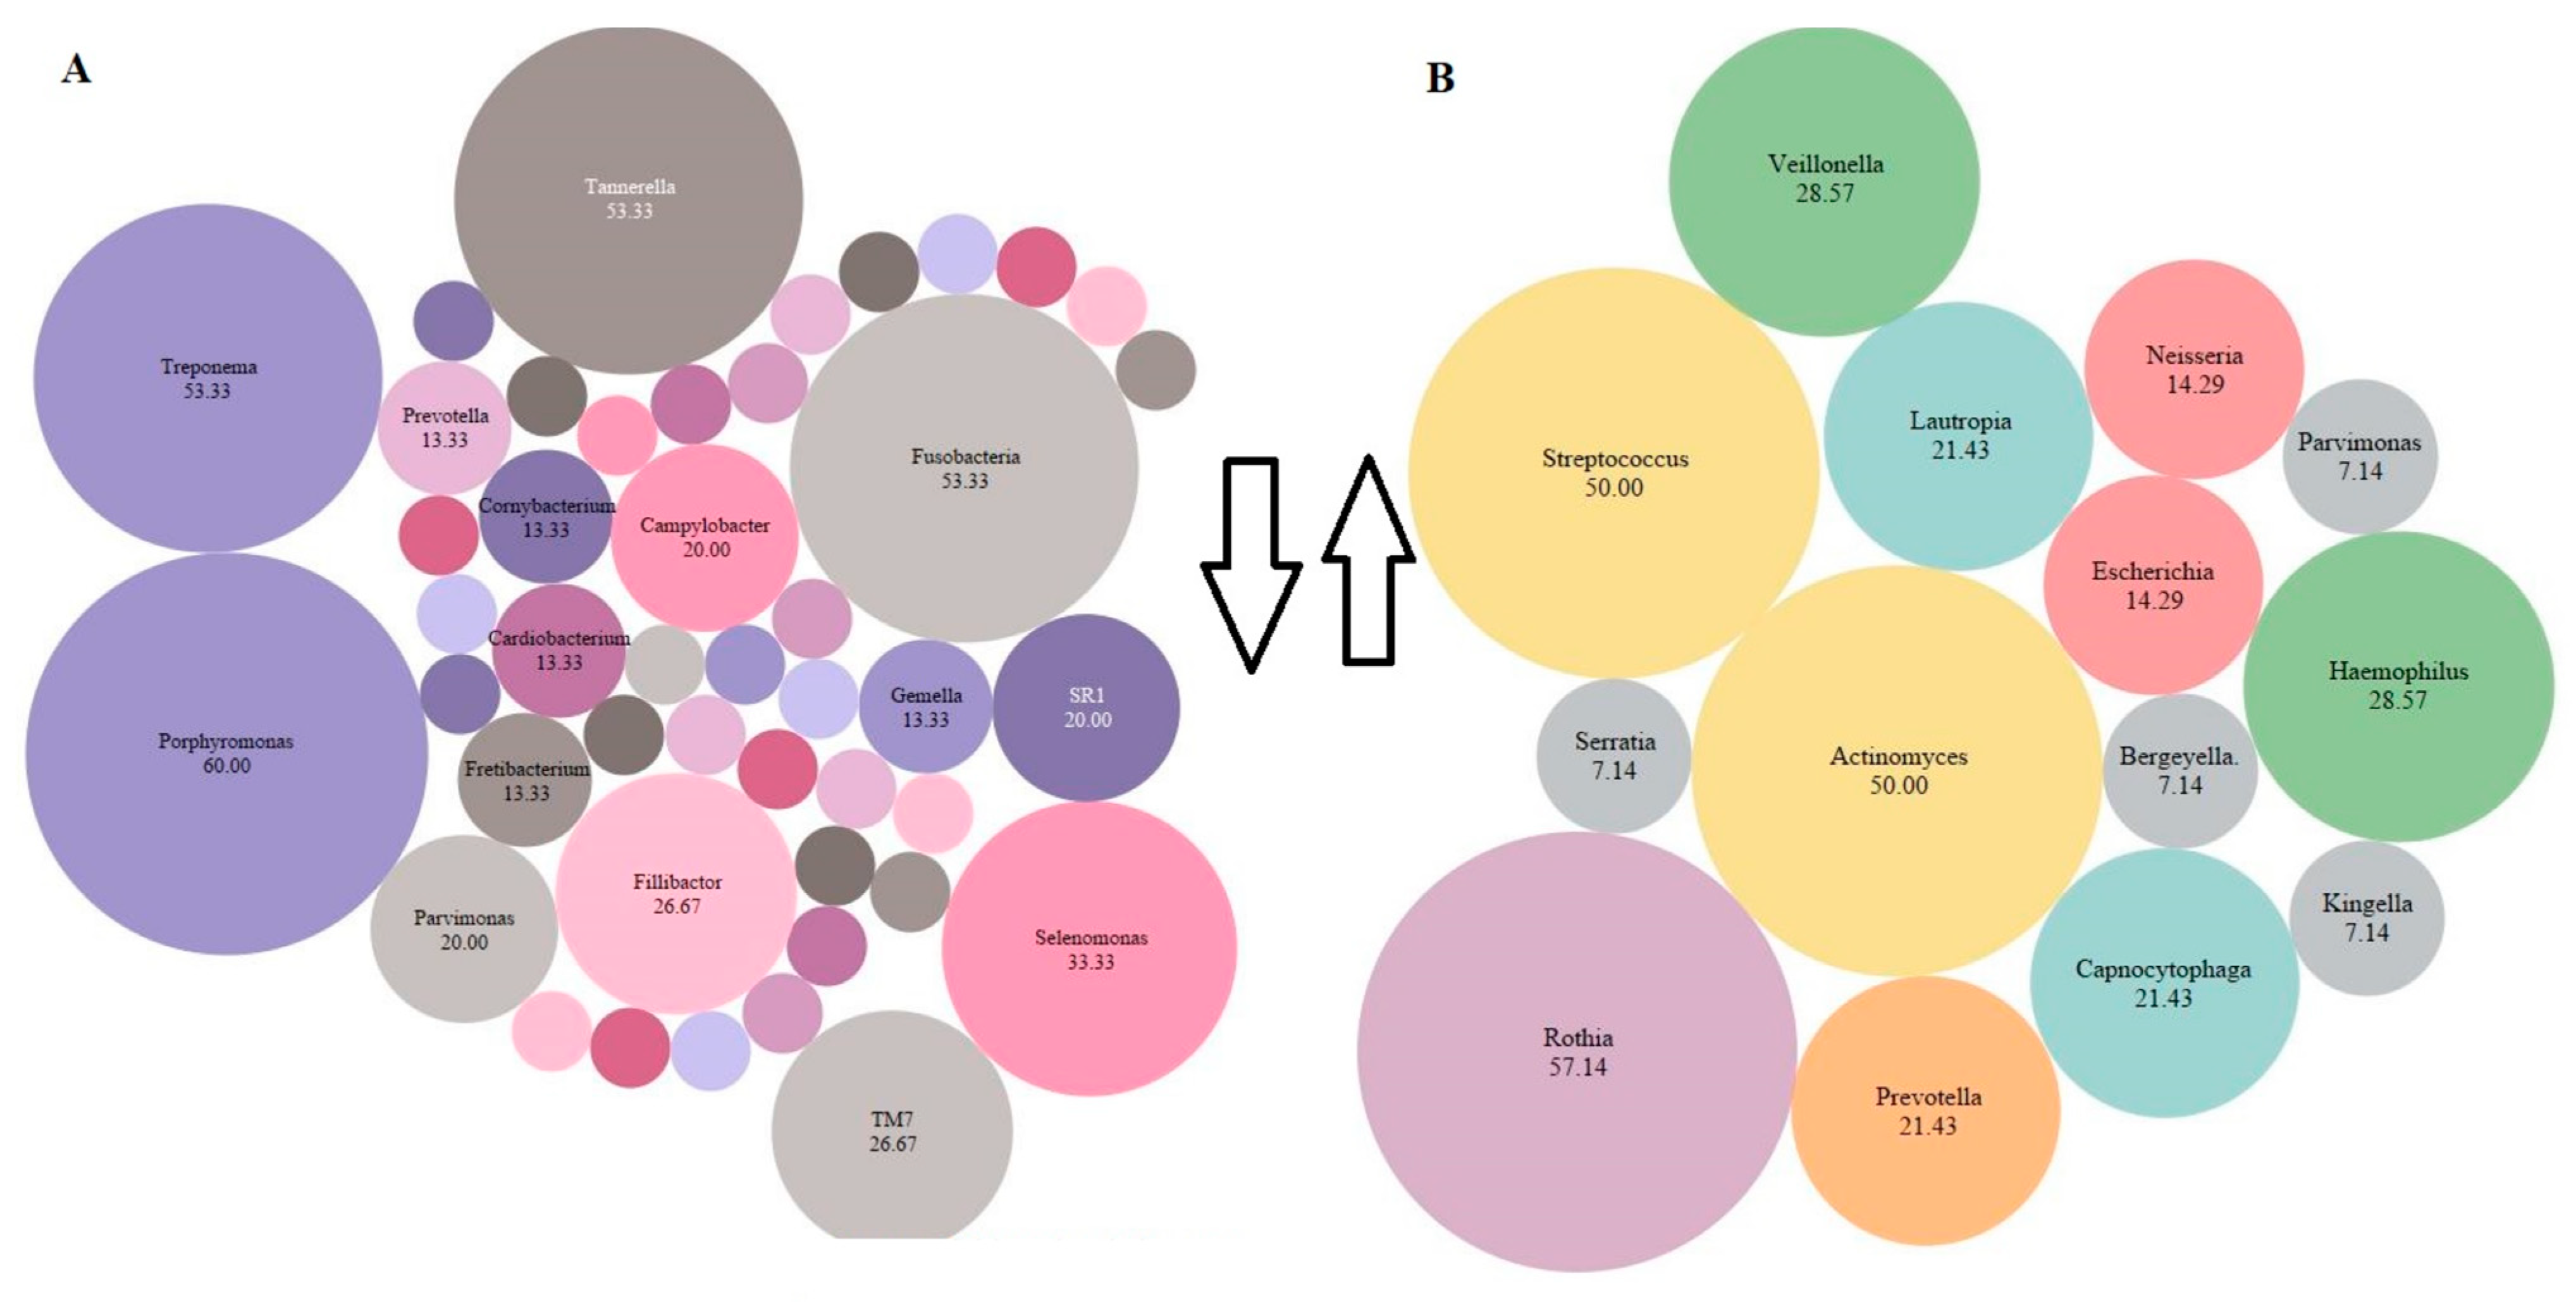
3.2.7. Relative Abundance of Bacterial Genera
3.3. Synthesis of Results
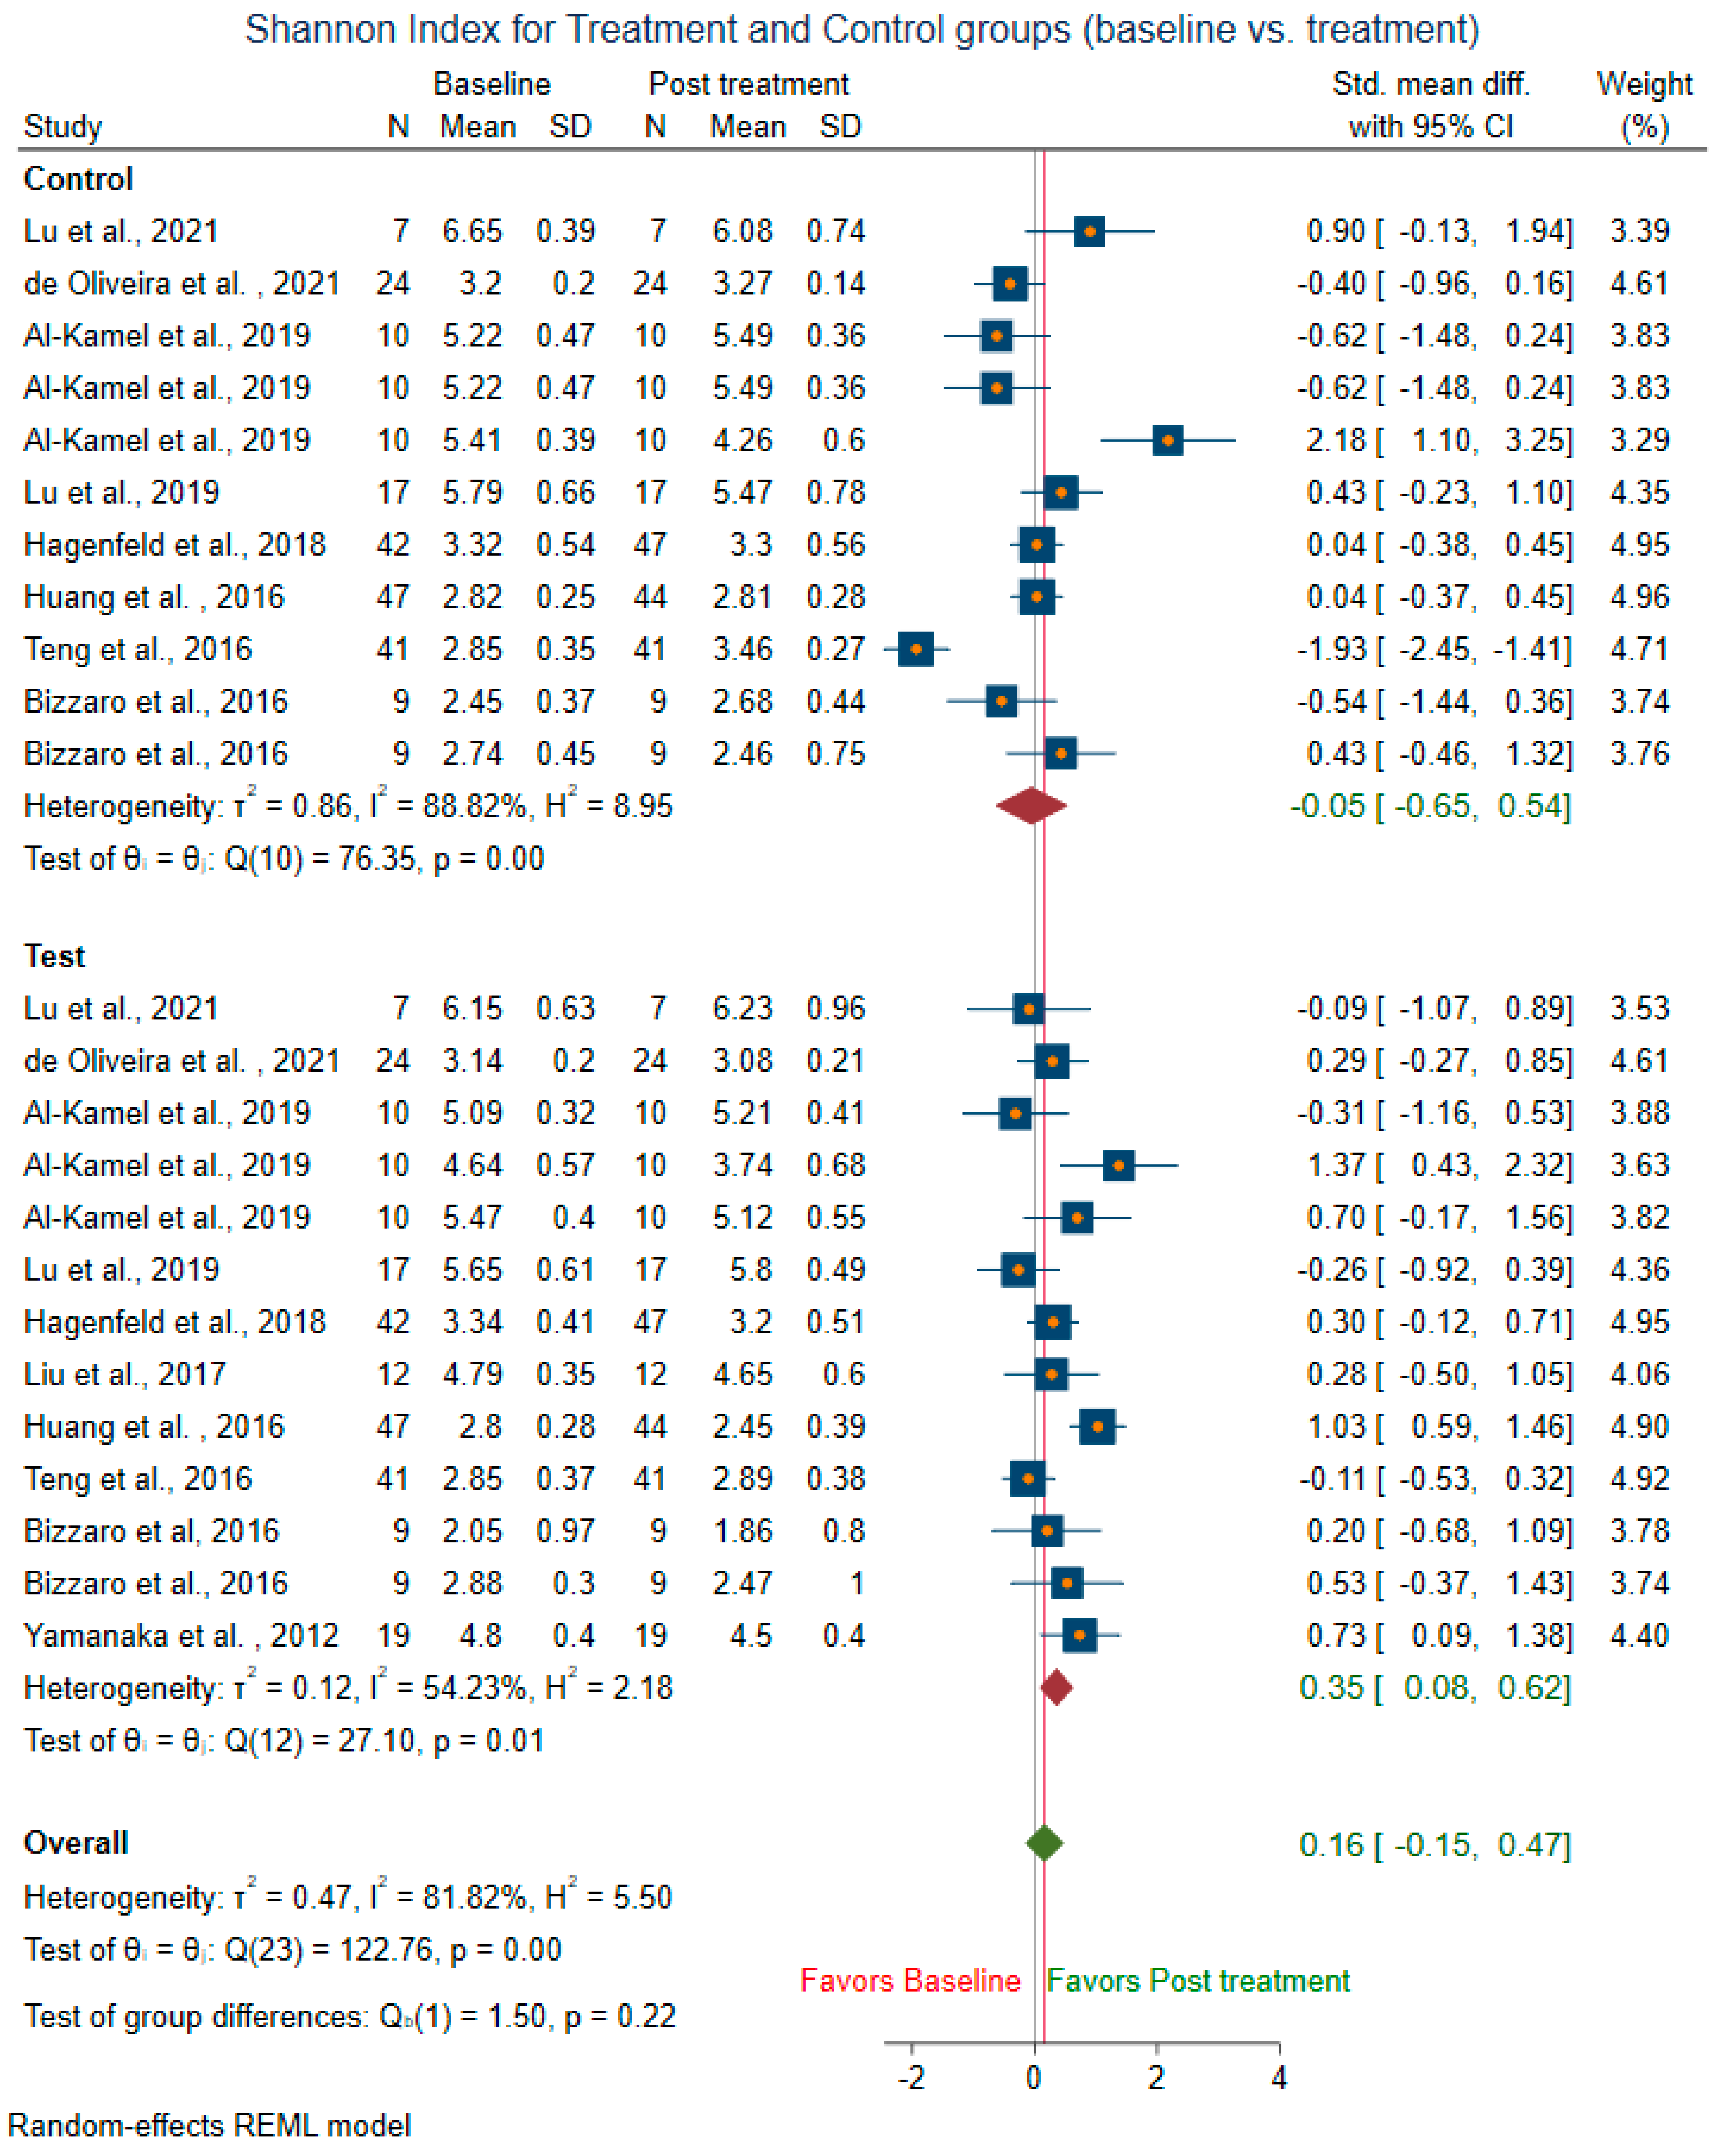
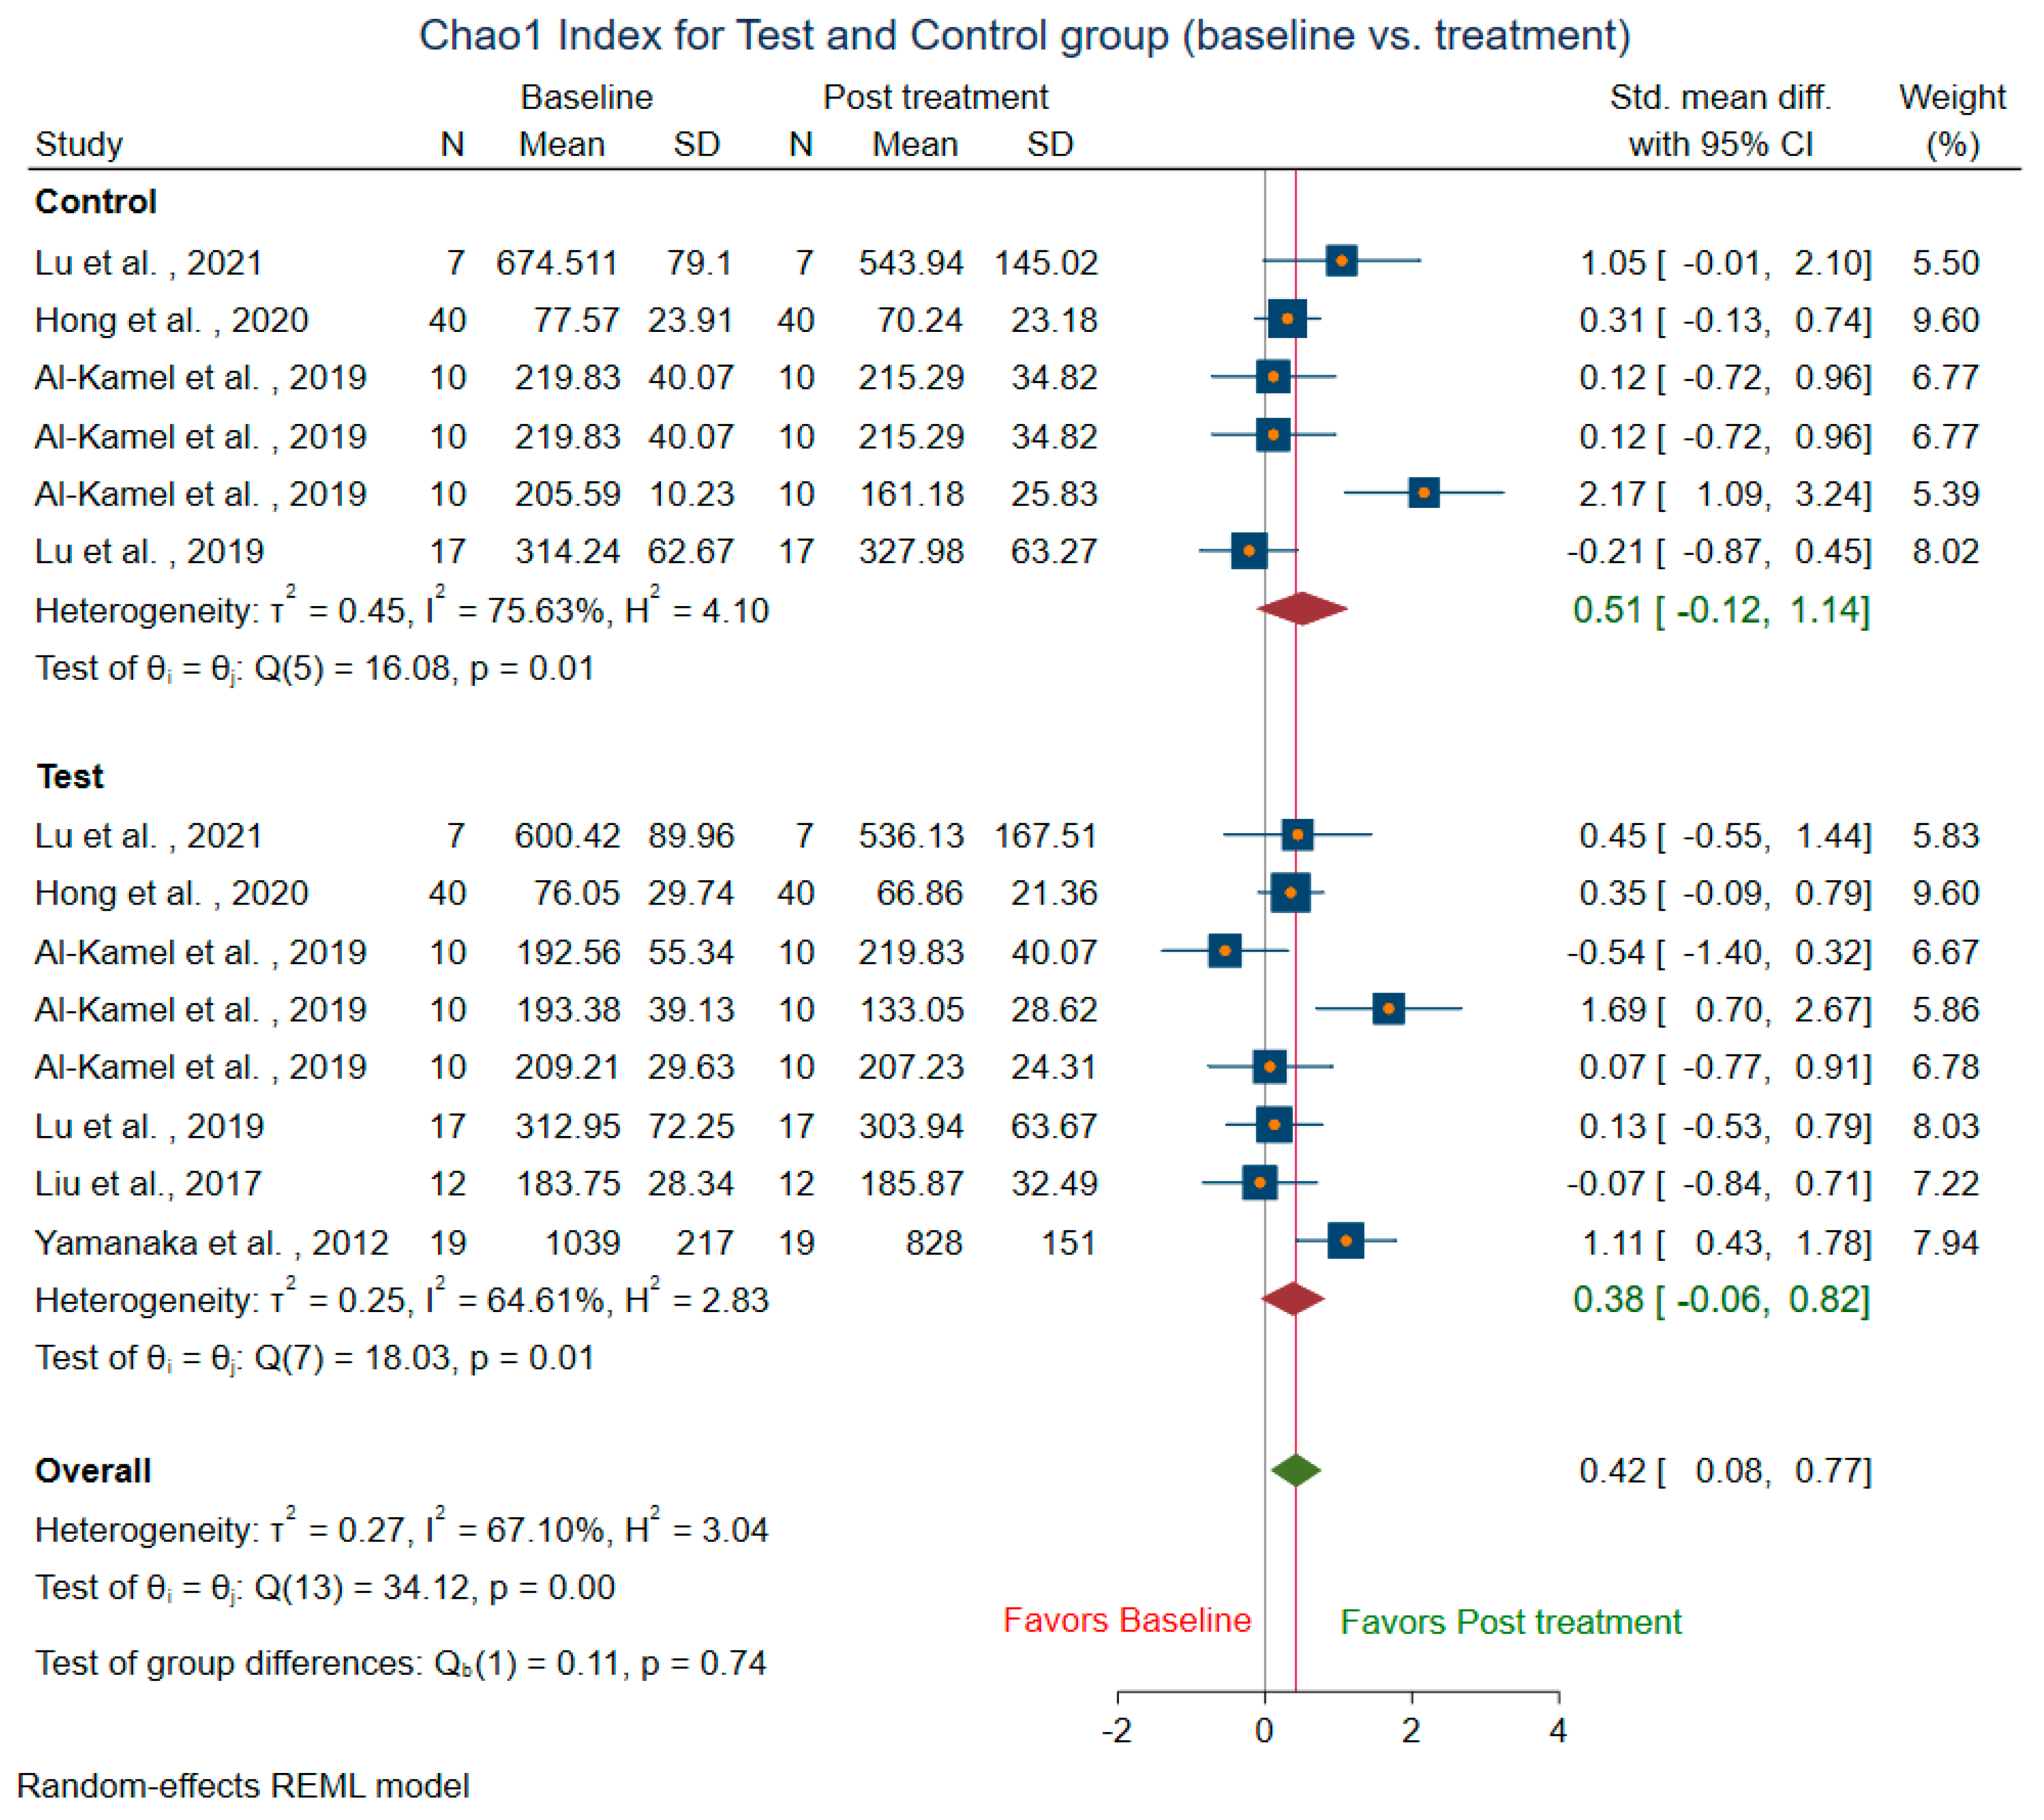
3.3.1. Within-Group Alpha Diversity for Treatment and Control Groups (Baseline vs. Treatment)
3.3.2. Between-Group Alpha Diversity (Test vs. Control)
3.3.3. Heterogeneity among Studies and Publication Bias
3.4. Risk of Bias Assessment and Quality of Evidence
4. Discussion
5. Conclusions
Future Research
Supplementary Materials
Author Contributions
Funding
Institutional Review Board Statement
Informed Consent Statement
Data Availability Statement
Acknowledgments
Conflicts of Interest
Appendix A

| Database | Search String | Results |
|---|---|---|
| Medline(PubMed) | ((((“Metagenomics” [MeSH Terms] OR “Metagenome” [MeSH Terms] OR “High-Throughput Nucleotide Sequencing” [MeSH Terms] OR “microbiota” [MeSH Terms] OR “genes, bacterial” [MeSH Terms] OR “Metagenomics” [Title/Abstract] OR “16S rDNA” [Title/Abstract] OR “16S rRNA” [Title/Abstract]) AND (“Or” [All Fields] AND “Pyrosequencing” [Title/Abstract])) OR “next-generation sequencing” [Title/Abstract] OR “Illumina sequencing” [Title/Abstract] OR “Functional gene array” [Title/Abstract] OR “Oral microbiome” [Title/Abstract] OR “Bacterial diversity” [Title/Abstract] OR “Bacterial community” [Title/Abstract]) AND (“Tooth Diseases” [MeSH Terms] OR “Mouth Diseases” [MeSH Terms] OR “Gingival diseases” [MeSH Terms] OR “Gingivitis” [MeSH Terms] OR “Periodontal diseases” [MeSH Terms] OR “Periodontal debridement” [MeSH Terms] OR “Periodontal index” [MeSH Terms] OR “Periodontal pocket” [MeSH Terms] OR “probing depth” [Title/Abstract] OR “periodont*” [All Fields] OR “plaque score” [All Fields]) AND “humans” [MeSH Terms]) AND (humans [Filter]) | 1020 |
| Scopus | (TITLE-ABS-KEY (“Metagenomics” OR “Metagenome” OR “High-Throughput Nucleotide Sequencing” OR “microbiota” OR “Genes, Bacterial” OR “metagenomics” OR “16S rDNA” OR “16S rRNA” OR pyrosequencing OR “next-generation sequencing” OR “Illumina sequencing” OR “Functional gene array” OR “Oral microbiome” OR “Bacterial diversity” OR “Bacterial community”) AND TITLE-ABS-KEY (“Tooth Diseases” OR “Mouth Diseases” OR “Gingival diseases” OR “Gingivitis” OR “Periodontal diseases” OR “Periodontal debridement” OR “Periodontal index” OR “Periodontal pocket” OR “probing depth” OR “periodont*” OR “plaque score”)) AND (LIMIT-TO (EXACTKEYWORD, “Human”)) AND (EXCLUDE (DOCTYPE, “re”) OR EXCLUDE (DOCTYPE, “ed”) OR EXCLUDE (DOCTYPE, “le”) OR EXCLUDE (DOCTYPE, “no”) OR EXCLUDE (DOCTYPE, “cp”) OR EXCLUDE (DOCTYPE, “ch”) OR EXCLUDE (DOCTYPE, “sh”) OR EXCLUDE (DOCTYPE, “tb”) OR EXCLUDE (DOCTYPE, “Undefined”)) | 2274 |
| Dentistry & Oral Sciences source | (“Metagenomics” OR “Metagenome” OR “High-Throughput Nucleotide Sequencing” OR “microbiota” OR “Genes, Bacterial” OR “metagenomics” OR “16S rDNA” OR “16S rRNA” OR pyrosequencing OR “next-generation sequencing” OR “Illumina sequencing” OR “Functional gene array” OR “Oral microbiome” OR “Bacterial diversity” OR “Bacterial community”) AND (“Tooth Diseases” OR “Mouth Diseases” OR “Gingival diseases” OR “Gingivitis” OR “Periodontal diseases” OR “Periodontal debridement” OR “Periodontal index” OR “Periodontal pocket” OR “probing depth” OR “periodont*” OR “plaque score”) | 1444 |
| ProQuest Dissertation | “Oral microbiome” OR “16S rDNA” OR “16S rRNA” AND (“Gingival diseases” OR “Gingivitis” OR “Periodontal diseases”) AND “clinical trial” AND filter (dissertations) | 25 |
| OpenGrey database | “Oral microbiome” OR “16S rDNA” OR “16S rRNA”AND (“Gingival diseases” OR “Gingivitis” OR “Periodontal diseases”) AND “clinical trial” | 0 |
| Cochrane database of systematic reviews | “Oral microbiome” OR “16S rDNA” OR “16S rRNA” AND (“Gingival diseases” OR “Gingivitis” OR “Periodontal diseases”) AND “clinical trial” | 256 |
| Variable | Definition | |
|---|---|---|
| Study Characteristics | ||
| 1. | SID | Unique identification number of study |
| 2. | Author | Last name of first author |
| 3. | Year | Year of publication |
| 4. | Country | Country of study conducted |
| 5. | Study design | Design of the study (e.g., parallel or split) |
| 6. | Randomization | Describes if randomization was performed (Yes = 1, No = 2, Not clear = 99) |
| 7. | Blinding | Describes if blinding was done and level of blinding (Single = 1, double = 2, triple = 3, none = 4, not clear = 99) |
| 8. | Sample size | Did the researchers calculate the sample size (Yes = 1, No = 2, Not clear = 99) |
| Participant Characteristics | ||
| 9. | Cases_n | Total number of cases |
| 10. | Control_n | Total number of control |
| 11. | age_mean, age_sd | Age of included participants [mean (SD), median (IQR), or categorical age, as reported] |
| 12. | Periodontal disease type | Describe the periodontal condition |
| 13. | Periodontal definition | Describe the definition used for classifying periodontal disease |
| 14. | Test description | Describes the intervention used for test group |
| 15. | Control description | Describes the intervention/placebo/no treatment for the control group |
| 16. | Treatment duration | Describes the recalls, and total duration of intervention |
| Collection and extraction method | ||
| 17. | Plaque_collection | Describes the site for plaque collection (supra or subgingival) and the instrument used for collection (e.g., paper point or sterile curette) |
| 18. | Hypervariable region | Describes the variable region used for DNA extraction |
| Measures of alpha diversity | ||
| 19. | OTU count (richness) | The OTU count scores at baseline and post-intervention; mean and SD |
| 20. | Chao1 index | The Chao1 scores at baseline and post-intervention; mean and SD |
| 21. | Shannon diversity index | The Shannon diversity scores at baseline and post-intervention; mean and SD |
| Outcome | Overall results of the study. | |
| Author and Year | Pre-Intervention Abundant Taxa | Post-Intervention Abundant Taxa | Post-Intervention Increase | Post-Intervention Decrease | Overall Abundant Taxa |
|---|---|---|---|---|---|
| Lu et al., 2021 | Porphyromonas, Treponema, Prevotella, Fusobacterium, Filifactor, Saccharibacteria TM7 G-5, and Peptostreptococcaceae XIG-6, | Actinomyces and Capnocytophaga | Actinomyces, Rothia, Neisseria, Capnocytophaga, Lautropia, and Cardiobacterium | Porphyromonas, Treponema, Filifactor, TM7 G-5, Peptostreptococcaceae XI G-6, Fretibacterium, Dialister, and Peptococcus. | Porphyromonas, Treponema, Prevotella, Fusobacterium, Filifactor, Saccharibacteria, Peptostreptococcaceae XIG-6, Actinomyces and Capnocytophaga |
| de Oliveira et al., 2021 | Capnocytophaga spp., Enterobactereacea, P.acnes, Staphylococus CN. | Actinomyces spp. Aggregatibacter actinomycetemcomitans, Acinetobacter baumannii, Clostridium difficile, Candida albicans, Campylobacter spp., Corynebacterium matruchotii, Dialister pneumosintes, Eikenella corrodens, Eubacterium spp., Enterococcus faecalis, Fusobacterium periodonticum, Fusobacterium nucleatum, Filifactor alocis, Gemella spp., Hafnia alvei, Helicobacter pylori, L.buccalis, Lactobacillus spp. Olsenella uli, Parvimonas micra, Paeriginosa, Porphyromonas gingivalis, Prevotella spp., streptococci spp. Staphylococcus aureus, Treponema socranskii, Treponema denticola, Tannerella forsythia, Veillonella parvula | N/A | N/A | Prevotella spp., Tannerella forsythia, Treponema denticola, Pseudomonas aeruginosa, Porphyromonas gingivalis, Actinomyces spp. |
| Wang et al., 2021 | Red complex bacteria | N/A | N/A | Porphyromonas gingivalis and Treponema denticola, Tannerella forsythia | Porphyromonas gingivalis and Treponema denticola, Tannerella forsythia |
| Hong et al., 2020 | Firmicutes, Proteobacteria | Streptococcus | Firmicutes | Phylum: Spirochaetes, Proteobacteria, Fusobacteria. Genus: Haemophilus, Fusobacterium and Capnocytophaga | Phylum: Firmicutes, Proteobacteria, Actinobacteria Genus: Streptococcus, Actinomyces, Lautropia, Actinomyces, Haemophilus, f_Neisseriaceae, Neisseria, Rothia, Corynebacterium, Capnocytophaga |
| Kruse et al., 2020 | Gram-positive aerobic cocci, Gram-positive aerobic rods, Gram-positive anaerobic rods, and Gram-negative anaerobic rods. | Gram-positive aerobic cocci, Gram-positive anaerobic cocci, Gram-positive anaerobic rods | Slackia exigua, Eubacterium yurii, Atopobium rimae, Filifactor alocis, Bifidobacterium dentium, Solobacterium moorei, Olsenella uli | Actinomyces meyeri, Actinomyces oris, Actinomyces odontolyticus, Actinomyces naeslundii, Actinomyces gerencseriae, Corynebacterium matruchotii, Rothia mucilaginosa, Rothia aeria, Streptococcus oralis, Streptococcus mitis, Streptococcus sanguinis, Streptococcus cristatus, Streptococcus sinensis, Streptococcus salivarius, Streptococcus anginosus, Streptococcus constellatus, Streptococcus intermedius, Streptococcus mutans, Gemella morbillorum, Streptococcus spp. | Porphyromonas gingivalis, Prevotella intermedia, Prevotella nigrescens, Prevotella tannerae, Prevotella buccae, Fusobacterium nucleatum, Campylobacter rectus, Tannerella forsythia, Selenomonas spp., parvula, Dialister pneumosintes, Anaeroglobus geminaus, Anaeroglobus geminatus, Parvimonas micra, Capnocytophaga ochracea, Capnocytophaga gingivalis, Aggregatibacter aphrophilus, Cardiobacterium hominis, Eikenella corrodens, Neisseria macacae/mucosa, Neisseria elongate, Neisseria flavescens, Neisseria bacilliformis, Nesseria spp., Lautropia mirabilis, Actinomyces meyeri, Actinomyces oris, Actinomyces odontolyticus, Actinomyces naeslundii, Actinomyces gerencseriae, Corynebacterium matruchotii, Rothia mucilaginosa, Rothia aeria, Streptococcus oralis, Streptococcus mitis, Streptococcus sanguinis, Streptococcus cristatus, Streptococcus sinensis, Streptococcus salivarius, Streptococcus anginosus, Streptococcus constellatus, Streptococcus intermedius, Streptococcus mutans, Gemella morbillorum, Streptococcus |
| Al-Kamel et al., 2019 Prevention sub-study | Streptococcus, Fusobacterium, Leptotrichia, Veillonella, Haemophilus, Actinomyces, Lautropia, Rothia, Capnocytophaga | NAC: Fusobacterium, Streptococcus, Leptotrichia, Cardiobacterium, Campylobacter, TM7_G_1_. CHX: Fusobacterium. Streptococcus, Granulicatella, Neisseria, Capnocytophaga. | NAC: Haemophilus, Lautropia, Rothia, Kingella, Brevundimonas, Escherichia. CHX: Rothia, Actinomyces, Cardiobacterium, Porphyromonas, Peptostreptococcus, Actinobaculum, Lachnospiraceae_G_3_, Lachnoanaerobaculum. | NAC: SR1_G_1_, Selenomonas, Olsenella, Parvimonas, Dialister, Oribacterium, TM7_G_1_, Cardiobacterium, Campylobacter, Fusobacterium. CHX: Granulicatella | Fusobacterium, Streptococcus, Leptotrichia, Veillonella, Propionibacterium, Actinomyces |
| Al-Kamel et al., 2019 Treatment sub-study | Fusobacterium, Streptococcus, TM7_G_1_, Leptotrichia, Prevotella, Veillonella, Porphyromonas | CHX: Fusobacterium, Streptococcus, Capnocytophaga, Bacteroidales_G_2, Prevotella, Veillonella NAC: Fusobacterium, Streptococcus, TM7_G_1, Leptotrichia, Propionibacterium, Cardiobacterium | Capnocytophaga | Corynebacterium, Stomatobaculum, Selenomonas, SR1-G_1, Lachnospiraceae_G1, TM7_G_3_, Lachnoanaerobaculum, Gemella, Propionibacterium, Veillonella, Tannerella, Cardiobacterium, Actinomyces, TM7_G_1_ | Fusobacterium, Streptococcus, TM7_G_1_, Leptotrichia, Prevotella, Veillonella, Propionibacterium. |
| Hagenfeld et al., 2019 | Fusobacterium, Prevotella, Veillonella | N/A | N/A | N/A | Fusobacterium, Prevotella, Veillonella, Porphyromonas, Alloprevotella, Campylobacter, Treponema_2, Streptococcus |
| Lu et al., 2019 | Streptococcus, and Saccharibacteria | N/A | Streptococcus, Escherichia, Acidopropionibacterium, Serratia | Treponema, Bacteroidacea | Actinomyces, Streptococcus, Leptotrichia, Capnocytophaga, Lautropia, Fusobacterium, Neisseria. |
| Woelber et al., 2019 | Streptococcus, Veillonella, Fusobacterium, Actinomyces, Prevotella | Fusobacterium, Veillonella, Streptococcus, Actinomyces, Prevotella. | Prevotella, Veillonella, Rothia | Streptococcus, Fusobacterium, Campylobacter, Cornybacterium | Fusobacterium, Veillonella, Streptococcus, Actinomyces, Rothia, Prevotella. |
| Hagenfeld et al., 2018 | Fusobacterium, Porphyromonas, Tannerella, Fretibacterium. | N/A | Streptococcus, Veillonella. | Porphyromonas, Tannerella, Treponema, Prevotella, Campylobacter, Fusobacterium, Parvimonas, Fretibacterium, Fillibactor, Oceanivirga. | N/A |
| Chen et al., 2018 | Fillifactor, Desulfobulbus, Eubacterium, Hallella, Porphyromonas, Phocaeicola, Tanerella, Bacteroidetes, Alloprevotella, Johnsonella, Treponema, Leptotrichia, Mogibacterium | N/A | N/A | N/A | Fusobacterium, Prevotella, Porphyromonas, Treponema, Corynebacterium, Leptotrichia, Selenomonas, Actinomyces, Campylobacter, Tanerella (total 27 genus) |
| Belstrom et al., 2018 | Prevotella, Treponema, Porphyromonas, Fusobacterium | Rothia, Prevotella, Streptococcus | Streptococcus, Rothia, Actinomyces | Porphyromonas, Treponema | Prevotella, Treponema, Porphyromonas, Fusobacterium, Rothia, Streptococcus, Cornyebacterium, Actinomyces. |
| Quieiroz et al., 2017 | Fusobacterium, Pseudomonas, Streptococcus, Fillifactor, Parvimonas. | N/A | N/A | Selenomonas, Fillifactor, Fusobacterium | Actinomyces, Campylobacter, Fillifactor, Fusobacterium, Gemella, Parvimonas, Psedomonas, Propionibacterium, Selenomonas, Streptococcus, Haemophilus, Veillonella |
| Han et al., 2017 | Sharpea, Moryella, Fusobacterium, Johnsonella, Peptostreptococcus, Peptococcus, Treponema, TG5, Desulfobulbus, Fillifactor, Tannerella, Porphyromonas, Megamonas, Esherichia, Selemonas, Dialister, Megasphaera, Prevotella, Leptotrichia, Hylemonella, Campylobacter, Bacteroides, Syntrophomonas | Kingella, Sphingopyxis, Lautropia, Capnocytophagam Neisseria, Aggregatibacter, Cornybacterium, Actinomyces, Parasscardovia, Veillonella, Rothia, Streptococcus | Actinobacteria, Proteobacteria | Bacteroidetes, Spirochaetes, Fusobacteria | Phyla: Bacteroidetes, Actinobacteria, Proteobacteria, Firmicutes, Fusobacteria, Spirochaetes, Synergistetes |
| Liu et al., 2017 | Porphyromonas, Treponema, Fretibacterium | Streptococcus, Lautropia, Haemophilus, Actinomyces | Lautropia, Actinomyces, Haemophilus | Treponema, Porphyromonas, Fretibacterium | Neisseria, Streptococcus, Fusobacterium |
| Califf et al., 2017 | Porphyromonas, Desulfovibrio, SHD-231, Treponema, Haemophilus, Acholeplasma, TG5, Mycoplasma, Eikenella, Desulfobulbus, Pseudoramibacter_Eubacterium, Methylobacterium Mogibacterium, Scardovia | Desulfovibrio, Streptococcus, Methanobrevibacter, PedobacterBE24, Butyrivibrio Peptococcus, Rhizobium, Aerococcus, Filifactor, Slackia | N/A | N/A | Desulfovibrio, Butyrivibrio, Methanobrevibacter, Pedobacter, Peptococcus, Filifactortreptococcus, Aerococcus, Slackia |
| Bizarro et al., 2016 | Porphyromonas, Treponema, Fusobacterium, Fillifactor. | Actinomyces, Streptococcus, Veillonella, Neisseria, Haemophilus | Both groups: Neisseria, Rothia, Capnocytophaga, Streptococcus Test group: Veillonella, Haemophilus Control group: Parvimonas, Actinomyces | Both groups: Fillifactor, Tannerella, uncultured Clostridiales family xiii incertae sedis, Porphyromonas, Treponema, uncultured Synergistaceae Test group: Paludibacter, Fusobacterium, Parvimonas | Fusobacterium, Prevotella, Treponema, Parvimonas, Porphyromonas, Paludibacter, Neisseria, Rothia, Fillifactor, Actinomyces, Streptococcus, Veillonella, Tannerella, Uncult. Clostridiales, Capnocytophaga, Haemophilus, Campylobacter |
| Teng et al., 2016 | Streptococcus, Actinomyces, Rothia, Veillonella | Leptotrichia, Neisseria, Capnocytophaga, Prevotella, Fusobacterium, Haemophilus, Lautropia, Abiotropia | Haemophilus, Lautropia, Neisseria, Capnocytophaga, Propioni-bacterium | Porphyromonas, Peptostreptococcus, Prevotella, Peptococcus, Selenomonas, Solobacterium, SR1, Tannerella, TM7 genus, Uncultured_Lachnospiraceae, Atopobium, Gemella, Megasphaera, Mogibacterium, Moraxella, Oribacterium and Shuttleworthia | Strptococcus, Leptotrichia, Actinomyces, Neisseria, Capnocytophaga, Rothia, Prevotella, Fusobacterium, Haemophilus, Lautropia, Porphyromonas, Cornyebacterium, Abiotropia |
| Huang et al., 2016 | Prevotella, Leptotrichia, Selenomonas, uncultured Lachnospiraceae, TM7, Tannerella, Peptococcus, and unclassified Veillonellaceae | Rothia, Granulicatella, Bergeyella and Lautropia | Actinomyces | T-Actinobaculum, TM7 and Leptotrichia C-Actinobaculum, TM7 and Leptotrichia | Rothia, Bergeyella, Lautropia, Granulicatella, Prevotella, Leptotrichia, Selenomonas, uncultured Lachnospiraceae, TM7, Tannerella, Peptococcus, and unclassified Veillonellaceae. |
| Shi et al., 2015 | Porphyromonas, Treponema, Tannerella, Olsnella, Peptostreptococcus, Synergistes, Fillifactor, Mycoplasma | Actinomyces, Streptococcus, Rothia, Bergeyella | Actinomyces, Streptococcus, Rothia, Bergeyella. | Porphyromonas, Treponema, Tannerella | Prevotella, Fusobacterium |
| Schwarzberg et al., 2014 | N/A | N/A | Streptococcus, Veillonella | Prevotella, Fusobacterium, Leptotrichia | Prevotella, Fusobacterium, Streptococcus |
| Laksmana et al., 2012 | Fusobacterium, Porphyromonas, Prevotella, Synergistetes spp., Fillifactor, Actinomyces, Treponema | Fusobacterium, Porphyromonas, Prevotella, Streptococcus, Veillonella | Streptococcus, Rothia, Actinomyces, Veillonella | Fusobacterium, Porphyromonas, Treponema, Tannerella | N/A |
| Junemann et al., 2012 | Porphyromonas, Prevotella, Treponema, Fusobacterium, Tannerella. | Prevotella, Streptococcus, Fusobacterium | Prevotella, Selenomonas, Streptococcus, Actinomyces, Rothia | Test group: Treponema, Fillifactor, Porphyromonas, Tannerella Control group: Porphyromonas, Tannerella | Phyla: Bacteroidetes, Firmicutes, Fusobacteria, Proteobacteria, Actinobacteria, Spirochaetes, and Synergistetes |
| Yamanaka et al., 2012 | Streptococcus, Leptotrichia, Actinomyces, Rothia, Fusobacterium | Streptococcus, Leptotrichia, Actinomyces, Rothia, Corynebacterium | Corynebacterium | Fusobacterium, Kingella | Streptococcus, Prevotella, Veillonella, Rothia, Actinomyces, Neisseria, Porphyromonas, Gemelia, Fusobacterium, Leptotrichia, Granulicatella, Capnocytophaga, Corynebacterium |
References
- Verma, D.; Garg, P.K.; Dubey, A.K. Insights into the human oral microbiome. Arch. Microbiol. 2018, 200, 525–540. [Google Scholar] [CrossRef] [PubMed]
- Dewhirst, F.E.; Chen, T.; Izard, J.; Paster, B.J.; Tanner, A.C.; Yu, W.H.; Lakshmanan, A.; Wade, W.G. The human oral microbiome. J. Bacteriol. 2010, 192, 5002–5017. [Google Scholar] [CrossRef] [PubMed]
- Sender, R.; Fuchs, S.; Milo, R. Revised Estimates for the Number of Human and Bacteria Cells in the Body. PLoS Biol. 2016, 14, e1002533. [Google Scholar] [CrossRef] [PubMed]
- Zarco, M.F.; Vess, T.J.; Ginsburg, G.S. The oral microbiome in health and disease and the potential impact on personalized dental medicine. Oral Dis. 2012, 18, 109–120. [Google Scholar] [CrossRef]
- Kilian, M. The oral microbiome—friend or foe? Eur. J. Oral Sci. 2018, 126 (Suppl. S1), 5–12. [Google Scholar] [CrossRef]
- Huang, S.; Li, R.; Zeng, X.; He, T.; Zhao, H.; Chang, A.; Bo, C.; Chen, J.; Yang, F.; Knight, R.; et al. Predictive modeling of gingivitis severity and susceptibility via oral microbiota. ISME J. 2014, 8, 1768–1780. [Google Scholar] [CrossRef]
- Diaz, P.I. Microbial diversity and interactions in subgingival biofilm communities. Front. Oral Biol. 2012, 15, 17–40. [Google Scholar]
- Abusleme, L.; Dupuy, A.K.; Dutzan, N.; Silva, N.; Burleson, J.A.; Strausbaugh, L.D.; Gamonal, J.; Diaz, P.I. The subgingival microbiome in health and periodontitis and its relationship with community biomass and inflammation. ISME J. 2013, 7, 1016–1025. [Google Scholar] [CrossRef]
- Haas, A.N.; Furlaneto, F.; Gaio, E.J.; Gomes, S.C.; Palioto, D.B.; Castilho, R.M.; Sanz, M.; Messora, M.R. New tendencies in non-surgical periodontal therapy. Braz. Oral Res. 2021, 35 (Suppl. S2), e095. [Google Scholar] [CrossRef]
- Bouchard, P.; Carra, M.C.; Boillot, A.; Mora, F.; Rangé, H. Risk factors in periodontology: A conceptual framework. J. Clin. Periodontol. 2017, 44, 125–131. [Google Scholar] [CrossRef]
- Zhang, Y.; Qi, Y.; Lo, E.C.M.; McGrath, C.; Mei, M.L.; Dai, R. Using next-generation sequencing to detect oral microbiome change following periodontal interventions: A systematic review. Oral Dis. 2020, 27, 1073–1089. [Google Scholar] [CrossRef] [PubMed]
- Nath, S.; Pulikkotil, S.J.; Dharmarajan, L.; Arunachalam, M.; Jing, K.T. Effect of locally delivered doxycycline as an adjunct to scaling and root planing in the treatment of periodontitis in smokers: A systematic review of randomized controlled trials with meta-analysis and trial sequential analysis. Dent. Res. J. 2020, 17, 235–243. [Google Scholar] [CrossRef]
- Al-Kamel, A.; Baraniya, D.; Al-Hajj, W.A.; Halboub, E.; Abdulrab, S.; Chen, T.; Al-Hebshi, N.N. Subgingival microbiome of experimental gingivitis: Shifts associated with the use of chlorhexidine and N-acetyl cysteine mouthwashes. J. Oral Microbiol. 2019, 11, 1608141. [Google Scholar] [CrossRef] [PubMed]
- Liu, G.; Luan, Q.; Chen, F.; Chen, Z.; Zhang, Q.; Yu, X. Shift in the subgingival microbiome following scaling and root planing in generalized aggressive periodontitis. J. Clin. Periodontol. 2018, 45, 440–452. [Google Scholar] [CrossRef] [PubMed]
- Nath, S.; Zilm, P.; Jamieson, L.; Kapellas, K.; Goswami, N.; Ketagoda, K.; Weyrich, L.S. Development and characterization of an oral microbiome transplant among Australians for the treatment of dental caries and periodontal disease: A study protocol. PLoS ONE 2021, 16, e0260433. [Google Scholar] [CrossRef]
- Adams, S.E.; Arnold, D.; Murphy, B.; Carroll, P.; Green, A.K.; Smith, A.M.; Marsh, P.D.; Chen, T.; Marriott, R.E.; Brading, M.G. A randomised clinical study to determine the effect of a toothpaste containing enzymes and proteins on plaque oral microbiome ecology. Sci. Rep. 2017, 7, 43344. [Google Scholar] [CrossRef]
- Huang, S.; Li, Z.; He, T.; Bo, C.; Chang, J.; Li, L.; He, Y.; Liu, J.; Charbonneau, D.; Li, R.; et al. Microbiota-based Signature of Gingivitis Treatments: A Randomized Study. Sci. Rep. 2016, 6, 24705. [Google Scholar] [CrossRef]
- Teng, F.; He, T.; Huang, S.; Bo, C.P.; Li, Z.; Chang, J.L.; Liu, J.Q.; Charbonneau, D.; Xu, J.; Li, R.; et al. Cetylpyridinium Chloride Mouth Rinses Alleviate Experimental Gingivitis by Inhibiting Dental Plaque Maturation. Int. J. Oral Sci. 2016, 8, 182–190. [Google Scholar] [CrossRef]
- Haffajee, A.D.; Roberts, C.; Murray, L.; Veiga, N.; Martin, L.; Teles, R.P.; Letteri, M.; Socransky, S.S. Effect of herbal, essential oil, and chlorhexidine mouthrinses on the composition of the subgingival microbiota and clinical periodontal parameters. J. Clin. Dent. 2009, 20, 211–217. [Google Scholar]
- Iniesta, M.; Herrera, D.; Montero, E.; Zurbriggen, M.; Matos, A.R.; Marín, M.J.; Sánchez-Beltrán, M.C.; Llama-Palacio, A.; Sanz, M. Probiotic effects of orally administered Lactobacillus reuteri-containing tablets on the subgingival and salivary microbiota in patients with gingivitis. A randomized clinical trial. J. Clin. Periodontol. 2012, 39, 736–744. [Google Scholar] [CrossRef]
- Morales, A.; Gandolfo, A.; Bravo, J.; Carvajal, P.; Silva, N.; Godoy, C.; Garcia-Sesnich, J.; Hoare, A.; Diaz, P.; Gamonal, J. Microbiological and clinical effects of probiotics and antibiotics on nonsurgical treatment of chronic periodontitis: A randomized placebocontrolled trial with 9-month follow-up. J. Appl. Oral Sci. 2018, 26, e20170075. [Google Scholar] [CrossRef] [PubMed]
- Guerra, F.; Mazur, M.; Ndokaj, A.; Corridore, D.; La Torre, G.; Polimeni, A.; Ottolenghi, L. Periodontitis and the microbiome: A systematic review and meta-analysis. Minerva Stomatol. 2018, 67, 250–258. [Google Scholar] [CrossRef] [PubMed]
- Shi, B.; Chang, M.; Martin, J.; Mitreva, M.; Lux, R.; Klokkevold, P.; Sodergren, E.; Weinstock, G.M.; Haak, S.K.; Lia, H. Dynamic changes in the subgingival microbiome and their potential for diagnosis and prognosis of periodontitis. MBio 2015, 6, e01926-14. [Google Scholar] [CrossRef] [PubMed]
- Moon, J.H.; Lee, J.H.; Lee, J.Y. Subgingival microbiome in smokers and non-smokers in Korean chronic periodontitis patients. Mol. Oral Microbiol. 2015, 30, 227–241. [Google Scholar] [CrossRef]
- Moon, J.-H.; Lee, J.-H. Probing the diversity of healthy oral microbiome with bioinformatics approaches. BMB Rep. 2016, 49, 662–670. [Google Scholar] [CrossRef]
- Page, M.J.; McKenzie, J.E.; Bossuyt, P.M.; Boutron, I.; Hoffmann, T.C.; Mulrow, C.D.; Shamseer, L.; Tetzlaff, J.M.; Akl, E.A.; Brennan, S.E.; et al. The PRISMA 2020 statement: An updated guideline for reporting systematic reviews. BMJ 2021, 372, n71. [Google Scholar] [CrossRef]
- Haddaway, N.R.; Collins, A.M.; Coughlin, D.; Kirk, S. The Role of Google Scholar in Evidence Reviews and Its Applicability to Grey Literature Searching. PLoS ONE 2015, 10, e0138237. [Google Scholar] [CrossRef]
- Burcham, Z.M.; Garneau, N.L.; Comstock, S.S.; Tucker, R.M.; Knight, R.; Metcalf, J.L.; Miranda, A.; Reinhart, B.; Meyers, D.; Woltkamp, D.; et al. Patterns of Oral Microbiota Diversity in Adults and Children: A Crowdsourced Population Study. Sci. Rep. 2020, 10, 2133. [Google Scholar] [CrossRef]
- Sedghi, L.; DiMassa, V.; Harrington, A.; Lynch, S.V.; Kapila, Y.L. The oral microbiome: Role of key organisms and complex networks in oral health and disease. Periodontology 2000 2021, 87, 107–131. [Google Scholar] [CrossRef]
- Gomez, A.; Espinoza, J.L.; Harkins, D.M.; Leong, P.; Saffery, R.; Bockmann, M.; Torralba, M.; Kuelbs, C.; Kodukula, R.; Inman, J.; et al. Host Genetic Control of the Oral Microbiome in Health and Disease. Cell Host Microbe 2017, 22, 269–278.e3. [Google Scholar] [CrossRef]
- Hozo, S.P.; Djulbegovic, B.; Hozo, I. Estimating the mean and variance from the median, range, and the size of a sample. BMC Med. Res. Methodol. 2005, 5, 13. [Google Scholar] [CrossRef]
- Sterne, J.A.C.; Savović, J.; Page, M.J.; Elbers, R.G.; Blencowe, N.S.; Boutron, I.; Cates, C.J.; Cheng, H.Y.; Corbett, M.S.; Eldridge, S.M.; et al. RoB 2: A revised tool for assessing risk of bias in randomised trials. BMJ 2019, 366, l4898. [Google Scholar] [CrossRef] [PubMed]
- Guyatt, G.H.; Oxman, A.D.; Vist, G.E.; Kunz, R.; Falck-Ytter, Y.; Alonso-Coello, P.; Schünemann, H.J. GRADE: An emerging consensus on rating quality of evidence and strength of recommendations. BMJ 2008, 336, 924–926. [Google Scholar] [CrossRef] [PubMed]
- Higgins, J.P.T.; Altman, D.G.; Gøtzsche, P.C.; Jüni, P.; Moher, D.; Oxman, A.D.; Savović, J.; Schulz, K.F.; Weeks, L.; Sterne, J.A.C. The Cochrane Collaboration’s tool for assessing risk of bias in randomised trials. BMJ 2011, 343, d5928. [Google Scholar] [CrossRef] [PubMed]
- Raudenbush, S.W.; Becker, B.J.; Kalaian, H. Modeling multivariate effect sizes. Psychol. Bull. 1988, 103, 111. [Google Scholar] [CrossRef]
- Higgins, J.P.T.; Thompson, S.G.; Deeks, J.J.; Altman, D.G. Measuring inconsistency in meta-analyses. BMJ 2003, 327, 557–560. [Google Scholar] [CrossRef]
- Rosenblad, A. Introduction to Meta-Analysis by Michael Borenstein, Larry V. Hedges, Julian P.T. Higgins, Hannah R. Rothstein. Int. Stat. Rev. 2009, 77, 478–479. [Google Scholar] [CrossRef]
- Belstrøm, D.; Grande, M.A.; Sembler-Møller, M.L.; Kirkby, N.; Cotton, S.L.; Paster, B.J.; Holmstrup, P. Influence of periodontal treatment on subgingival and salivary microbiotas. J. Periodontol. 2018, 89, 531–539. [Google Scholar] [CrossRef]
- Bizzarro, S.; Laine, M.L.; Buijs, M.J.; Brandt, B.W.; Crielaard, W.; Loos, B.G.; Zaura, E. Microbial profiles at baseline and not the use of antibiotics determine the clinical outcome of the treatment of chronic periodontitis. Sci. Rep. 2016, 6, 20205. [Google Scholar] [CrossRef]
- Califf, K.J.; Schwarzberg-Lipson, K.; Garg, N.; Gibbons, S.M.; Caporaso, J.G.; Slots, J.; Cohen, C.; Dorrestein, P.C.; Kelley, S.T. Multi-omics Analysis of Periodontal Pocket Microbial Communities Pre- and Posttreatment. Msystems 2017, 2, e00016-17. [Google Scholar] [CrossRef]
- de Oliveira, A.M.; Lourenço, T.G.B.; Colombo, A.P.V. Impact of systemic probiotics as adjuncts to subgingival instrumentation on the oral-gut microbiota associated with periodontitis: A randomized controlled clinical trial. J. Periodontol. 2021, 93, 31–44. [Google Scholar] [CrossRef] [PubMed]
- Chen, C.; Hemme, C.; Beleno, J.; Shi, Z.J.; Ning, D.; Qin, Y.; Tu, Q.; Jorgensen, M.; He, Z.; Wu, L.; et al. Oral microbiota of periodontal health and disease and their changes after nonsurgical periodontal therapy. ISME J. 2018, 12, 1210–1224. [Google Scholar] [CrossRef]
- Hagenfeld, D.; Koch, R.; Jünemann, S.; Prior, K.; Harks, I.; Eickholz, P.; Hoffmann, T.; Kim, T.S.; Kocher, T.; Meyle, J.; et al. Do we treat our patients or rather periodontal microbes with adjunctive antibiotics in periodontal therapy? A 16S rDNA microbial community analysis. PLoS ONE 2018, 13, e0195534. [Google Scholar] [CrossRef]
- Hagenfeld; Prior, K.; Harks, I.; Jockel-Schneider, Y.; May, T.; Harmsen, D.; Schlagenhauf, U.; Ehmke, B. No differences in microbiome changes between anti-adhesive and antibacterial ingredients in toothpastes during periodontal therapy. J. Periodontal. Res. 2019, 54, 435–443. [Google Scholar] [CrossRef] [PubMed]
- Han, J.; Wang, P.; Ge, S. The microbial community shifts of subgingival plaque in patients with generalized aggressive periodontitis following non-surgical periodontal therapy: A pilot study. Oncotarget 2017, 8, 10609–10619. [Google Scholar] [CrossRef] [PubMed]
- He, T.; Huang, S.; Yue, F.; Wang, L.; Liu, J.; Xu, J. A randomized, controlled comparison of a stannous-containing dentifrice for reducing gingival bleeding and balancing the oral microbiome relative to a positive control. Am. J. Dent. 2021, 34, 222–227. [Google Scholar] [PubMed]
- Hong, I.; Lee, H.G.; Keum, H.L.; Kim, M.J.; Jung, U.W.; Kim, K.; Kim, S.Y.; Park, T.; Kim, H.J.; Kim, J.J.; et al. Clinical and Microbiological Efficacy of Pyrophosphate Containing Toothpaste: A Double-Blinded Placebo-Controlled Randomized Clinical Trial. Microorganisms 2020, 8, 1806. [Google Scholar] [CrossRef]
- Jünemann, S.; Prior, K.; Szczepanowski, R.; Harks, I.; Ehmke, B.; Goesmann, A.; Stoye, J.; Harmsen, D. Bacterial community shift in treated periodontitis patients revealed by ion torrent 16S rRNA gene amplicon sequencing. PLoS ONE 2012, 7, e41606. [Google Scholar] [CrossRef]
- Kruse, A.B.; Maamar, R.; Akakpo, D.L.; Woelber, J.P.; Wittmer, A.; Vach, K.; Ratka-Krüger, P.; Al-Ahmad, A. Effects of subgingival air-polishing with trehalose powder on oral biofilm during periodontal maintenance therapy: A randomized-controlled pilot study. BMC Oral Health 2020, 20, 123. [Google Scholar] [CrossRef]
- Laksmana, T.; Kittichotirat, W.; Huang, Y.; Chen, W.; Jorgensen, M.; Bumgarner, R.; Chen, C. Metagenomic analysis of subgingival microbiota following non-surgical periodontal therapy: A pilot study. Open Dent. J. 2012, 6, 255–261. [Google Scholar] [CrossRef]
- Lu, H.; He, L.; Jin, D.; Zhu, Y.; Meng, H. Effect of adjunctive systemic antibiotics on microbial populations compared with scaling and root planing alone for the treatment of periodontitis: A pilot randomized clinical trial. J. Periodontol. 2021, 93, 570–583. [Google Scholar]
- Lu, H.; Zhao, Y.; Feng, X.; He, L.; Meng, H. Microbiome in maintained periodontitis and its shift over a single maintenance interval of 3 months. J. Clin. Periodontol. 2019, 46, 1094–1104. [Google Scholar]
- Nibali, L.; Sousa, V.; Davrandi, M.; Spratt, D.; Alyahya, Q.; Dopico, J.; Donos, N. Differences in the periodontal microbiome of successfully treated and persistent aggressive periodontitis. J. Clin. Periodontol. 2020, 47, 980–990. [Google Scholar] [CrossRef]
- Queiroz, L.A.; Casarin, R.C.V.; Dabdoub, S.M.; Tatakis, D.N.; Sallum, E.A.; Kumar, P.S. Furcation Therapy With Enamel Matrix Derivative: Effects on the Subgingival Microbiome. J. Periodontol. 2017, 88, 617–625. [Google Scholar] [CrossRef] [PubMed]
- Schwarzberg, K.; Le, R.; Bharti, B.; Lindsay, S.; Casaburi, G.; Salvatore, F.; Saber, M.H.; Alonaizan, F.; Slots, J.; Gottlieb, R.A.; et al. The personal human oral microbiome obscures the effects of treatment on periodontal disease. PLoS ONE 2014, 9, e86708. [Google Scholar] [CrossRef] [PubMed]
- Wang, Y.; Zeng, J.; Yuan, Q.; Luan, Q. Efficacy of (-)-epigallocatechin gallate delivered by a new-type scaler tip during scaling and root planing on chronic periodontitis: A split-mouth, randomized clinical trial. BMC Oral Health 2021, 21, 79. [Google Scholar] [CrossRef] [PubMed]
- Woelber, J.P.; Gärtner, M.; Breuninger, L.; Anderson, A.; König, D.; Hellwig, E.; Al-Ahmad, A.; Vach, K.; Dötsch, A.; Ratka-Krüger, P.; et al. The influence of an anti-inflammatory diet on gingivitis. A randomized controlled trial. J. Clin. Periodontol. 2019, 46, 481–490. [Google Scholar] [CrossRef]
- Yamanaka, W.; Takeshita, T.; Shibata, Y.; Matsuo, K.; Eshima, N.; Yokoyama, T.; Yamashita, Y. Compositional stability of a salivary bacterial population against supragingival microbiota shift following periodontal therapy. PLoS ONE 2012, 7, e42806. [Google Scholar] [CrossRef]
- Minichino, A.; Brondino, N.; Solmi, M.; Del Giovane, C.; Fusar-Poli, P.; Burnet, P.; Cipriani, A.; Lennox, B.R. The gut-microbiome as a target for the treatment of schizophrenia: A systematic review and meta-analysis of randomised controlled trials of add-on strategies. Schizophr. Res. 2021, 234, 58–70. [Google Scholar] [CrossRef]
- Sharpton, S.R.; Maraj, B.; Harding-Theobald, E.; Vittinghoff, E.; Terrault, N.A. Gut microbiome–targeted therapies in nonalcoholic fatty liver disease: A systematic review, meta-analysis, and meta-regression. Am. J. Clin. Nutr. 2019, 110, 139–149. [Google Scholar] [CrossRef]
- Jervøe-Storm, P.M.; Alahdab, H.; Koltzscher, M.; Fimmers, R.; Jepsen, S. Comparison of curet and paper point sampling of subgingival bacteria as analyzed by real-time polymerase chain reaction. J. Periodontol. 2007, 78, 909–917. [Google Scholar] [CrossRef]
- Quince, C.; Walker, A.W.; Simpson, J.T.; Loman, N.J.; Segata, N. Shotgun metagenomics, from sampling to analysis. Nat. Biotechnol. 2017, 35, 833–844. [Google Scholar] [CrossRef]
- Pérez-Chaparro, P.J.; McCulloch, J.A.; Mamizuka, E.M.; Moraes, A.; Faveri, M.; Figueiredo, L.C.; Duarte, P.M.; Feres, M. Do different probing depths exhibit striking differences in microbial profiles? J. Clin. Periodontol. 2018, 45, 26–37. [Google Scholar] [CrossRef] [PubMed]
- Xia, Y.; Sun, J. Hypothesis Testing and Statistical Analysis of Microbiome. Genes Dis. 2017, 4, 138–148. [Google Scholar] [CrossRef] [PubMed]
- Griffen, A.L.; Beall, C.J.; Campbell, J.H.; Firestone, N.D.; Kumar, P.S.; Yang, Z.K.; Podar, M.; Leys, E.J. Distinct and complex bacterial profiles in human periodontitis and health revealed by 16S pyrosequencing. ISME J. 2012, 6, 1176–1185. [Google Scholar] [CrossRef] [PubMed]
- Galimanas, V.; Hall, M.W.; Singh, N.; Lynch, M.D.; Goldberg, M.; Tenenbaum, H.; Cvitkovitch, D.G.; Neufeld, J.D.; Senadheera, D.B. Bacterial community composition of chronic periodontitis and novel oral sampling sites for detecting disease indicators. Microbiome 2014, 2, 32. [Google Scholar] [CrossRef]
- Kirst, M.E.; Li, E.C.; Alfant, B.; Chi, Y.Y.; Walker, C.; Magnusson, I.; Wang, G.P. Dysbiosis and alterations in predicted functions of the subgingival microbiome in chronic periodontitis. Appl. Environ. Microbiol. 2015, 81, 783–793. [Google Scholar] [CrossRef]
- Pfeiffer, F.; Gröber, C.; Blank, M.; Händler, K.; Beyer, M.; Schultze, J.L.; Mayer, G. Systematic evaluation of error rates and causes in short samples in next-generation sequencing. Sci. Rep. 2018, 8, 10950. [Google Scholar] [CrossRef]
- Wang, V.X.; Blades, N.; Ding, J.; Sultana, R.G.P. Estimation of sequencing error rates in short reads. BMC Bioinform. 2012, 13, 185. [Google Scholar]
- Weyrich, L.S.; Duchene, S.; Soubrier, J.; Arriola, L.; Llamas, B.; Breen, J.; Morris, A.G.; Alt, K.W.; Caramelli, D.; Dresely, V.; et al. Neanderthal behaviour, diet, and disease inferred from ancient DNA in dental calculus. Nature 2017, 544, 357–361. [Google Scholar] [CrossRef]
- Weyrich, L.S. The evolutionary history of the human oral microbiota and its implications for modern health. Periodontology 2000 2021, 85, 90–100. [Google Scholar] [CrossRef] [PubMed]
- Keijser, B.J.; Zaura, E.; Huse, S.M.; van der Vossen, J.M.; Schuren, F.H.; Montijn, R.C.; ten Cate, J.M.; Crielaard, W. Pyrosequencing analysis of the oral microflora of healthy adults. J. Dent. Res. 2008, 87, 1016–1020. [Google Scholar] [CrossRef] [PubMed]
- Turnbaugh, P.J.; Ley, R.E.; Hamady, M.; Fraser-Liggett, C.M.; Knight, R.; Gordon, J.I. The human microbiome project. Nature 2007, 449, 804–810. [Google Scholar] [CrossRef] [PubMed]

| First Author and Year Country | Study Design | Disease | Disease Definition | Age | Case (n) | Control (n) | Test Description | Control Description | Site and Plaque Collection Method | Hypervariable Region of 16S rRNA Gene | Follow Up | Outcome |
|---|---|---|---|---|---|---|---|---|---|---|---|---|
| Scaling only | ||||||||||||
| Yamanaka et al., 2012 * [58] Japan | Pre/post-intervention | Periodontitis | N/A | 35–73 | 19 | SRP | Before SRP | Supragingival Sterile curettes | V1–V2 region | Immediately | Periodontal therapy decreased microbial richness and biodiversity in the plaque microbiota. | |
| Schwarzberg et al., 2014 [55] Germany | Pre/post-intervention | Gingivitis, mild to moderate or severe periodontitis | Gingivitis: CAL ≤ 3 mm, PD ≤ 4 mm, BOP > 10%; mild-moderate periodontitis: CAL ≥ 4 mm, PD ≥ 5 mm, BOP ≥ 30%; severe periodontitis: CAL ≥ 6 mm, pocket depths ≥ 7 mm, BOP ≥ 30% | 21–40 | 23 (gingivitis); 12 (mild/mod periodontitis; 1 (severe periodontitis) | 4 | Standard periodontal treatment | N/A | Subgingival plaque Periodontal scaler | V1–V2 region | 6 weeks | Individual differences were observed and the relative abundance of disease related bacteria and health relative bacteria showed variability. |
| Shi et al., 2015 [23] USA | Pre/post-intervention | Chronic periodontitis | N/A | 53 | 17 | SRP | Before SRP | Subgingival plaque Sterile Gracey curettes | Metagenomic shotgun sequencies & 16S rRNA was extracted. | 4–19 weeks | After SRP there was a decrease in alpha diversity, change in composition towards health-associated bacteria, lowered diseased associated functional pathway, and reduction in microbial correlation. | |
| Liu et al., 2018 * [14] China | Pre/post-intervention | AAP 1999 definition for generalized Aggressive Periodontitis | Rapid attachment loss and bone destruction, and possible familial aggregation of disease. | 30.75 ± 3.17 | 12 | SRP | No treatment | Subgingival plaque Filter paper | V3–V4 region | 6 weeks | SRP was effective in reducing alpha diversity, changing bacterial compositional structure, reducing the relative abundance and prevalence of certain bacterial species. | |
| Han et al., 2017 [45] China | Pre/post-intervention | AAP 1999 definition for generalized Aggressive Periodontitis | Rapid attachment loss and bone destruction, and possible familial aggregation of disease. | 28 ± 1.41 | 2 | SRP | No treatment | Subgingival plaque Sterile Gracey curettes | V4 region | 1 month | There was a lower Shannon index and higher Chao1 index post-treatment. Bacteroidetes, Spirochetes, and Fusobacteria were related to pathogenicity while Actinobacteria and Proteobacteria were associated with resolution of clinical symptoms. | |
| Belstrom et al., 2018 [38] Denmark | Pre/post-intervention | AAP 2015 definition for moderate/severe chronic periodontitis | PD ≥ 5 & <7 mm and CAL 3–5 mm/ PD ≥ 7 mm and CAL ≥ 5 mm | 47–75 | 25 | SRP | Before SRP | Subgingival plaque Sterile Gracey curette | V3–V4 region | 12 weeks | After SRP, there was a decrease in the relative abundance of periodontitis-associated genera in the subgingival plaque. There was a decrease in alpha diversity significantly after 2 and 6 weeks. | |
| Chen et al., 2018 [42] USA | Pre/post-intervention | Chronic periodontitis | NA | NA | 19 | SRP | Before SRP | Subgingival plaque Paper point | V4 region | 4 weeks | SRP was effective in decreasing the relative abundances of periodontitis-associated bacteria. | |
| Antibiotics used as adjuncts to SRP | ||||||||||||
| Junemann et al., 2012 [48] Germany | Double-blind, parallel-group, placebo-controlled RCT | Generalized severe chronic periodontitis | More than 38% of sites with pocket probing depths of 6 mm or more | N/A | 2 | 2 | SRP + 500 mg amoxicillin + 400 mg metronidazole, three times daily × 7 days | SRP | Subgingival plaque Paper point | V6 region | 2 months | For both the intervention group, there was an increase in alpha diversity. There was a shift in bacterial composition from Gram-negative Bacteroidetes to Gram-positive bacteria. |
| Laksmana et al., 2012 [50] USA | Pre/post-intervention | AAP definition of Aggressive Periodontitis | Rapid attachment loss and bone destruction, and possible familial aggregation of disease. | N/A | 2 | SRP + 500 mg amoxicillin + 500 mg metronidazole, three times daily × 8 days | N/A | Subgingival plaque Paper point | V4 region | 8 weeks | The subgingival microbiome changed after therapy. After an intervention, there was an increase in the Gram-positive and Gram-negative commensals while a decrease in the bacteria of the Red complex. | |
| Bizzaro et al., 2016 * [39] Netherland | Single blinded RCT | Chronic periodontitis | Proximal attachment loss of ≥3 mm at ≥2 non-adjacent teeth + below-median responders | NA | 9 | 10 | SRP+ 0.12% CHX rinse (2 × day × 28 days) and antibiotics (amoxicillin 375 mg + metronidazole 250 mg, 3 times a day × 7 days) | SRP+ CHX 0.12% only | Subgingival plaque Paper point | V5–V7 region | 12 months | Antibiotic usage after 3 months resulted in significant changes in the subgingival microbiome. SRP+CHX predicted better clinical outcomes. |
| Hagenfeld et al., 2018 * [43] Germany | Double-blind, parallel-group RCT | AAP 1999 definition for moderate/severe chronic periodontitis | 3 mm to <5 mm/_5 mm attachment loss | NA | 42 | 47 | SRP + 50 mg amoxicillin and 400 mg metronidazole | SRP + placebo | Subgingival plaque Paper points | V3–V4 region | 8 weeks | Adjunctive use of antibiotics with SRP significantly reduced the richness, decreased the periodontitis associated genera, and changed the bacterial compositional structure. |
| de Oliveira et al., 2021 * [41] Brazil | Double-blind, placebo- controlled, RCT with two parallel arms | Untreated periodontitis | ≥1 site with PD ≥ 6 mm and sites with PD ≥ 5 mm in different teeth | 24 | 24 | Subgingival instrumentation and probiotics | Subgingival instrumentation only | Subgingival plaque Sterile Gracey curettes | N/A | 1 month | Short-term use of systemic probiotics with subgingival instrumentation did not show any additional clinical or microbiological improvement for the treatment of periodontitis. | |
| Lu et al., 2021 * [51] China | RCT | Severe periodontitis: stage III/IV, grade B/C generalized periodontitis | At least six non-adjacent sites of six teeth with PD ≥ 5 mm and more than 30% of sites with radiographic bone loss > 1/2 of the root | T: 43.57 ± 6.63 C: 42.57 ± 3.29 | 7 | 7 | SRP+ Amoxycillin (550 mg) and metronidazole (200 mg) three times a day for 7 days | SRP only | Subgingival plaque Sterile Gracey curettes | V3 and V4 region | 6 months | The test group showed greater improvement in periodontal health than the control group. The test group showed lower microbial richness and diversity and less abundant Porphyromonas. |
| Chemical agents | ||||||||||||
| Teng et al., 2016 * [18] China | A double-blind randomized controlled trial | Experimental gingivitis | 21 days gingivitis model | 18–53 | 41 | 50 | CPC mouth rinse, two times daily | Water rinse | Supragingival Sterile Gracey curette | V1–V3 region | 3 weeks | The α and β diversity revealed that CPC treatment prevents the acquisition of new taxa that would otherwise accumulate but maintains the original biodiversity of healthy plaques. |
| Califf et al., 2017 [40] USA | Clinical trial | Periodontitis | At least four separate teeth with a pocket depth of 6 mm | 41 | 17 | 17 | 0.25% sodium hypochlorite | Water rinse | Subgingival plaque Sterile Gracey curette | V4–V5 and shotgun was done as well. | 3 months | The high diversity and number of metabolites were both significantly related to periodontal deep pockets. For the effectiveness of treatment metabolic dynamisms were more indicative than shifts in composition in the community. |
| Al-Kamel et al., 2019 * [13] (Prevention study Yemen) (Split into two parts) | Triple blinded, placebo-controlled, parallel-arm RCT | Experimental gingivitis | 21 days gingivitis model | 22.22 ± 1.73 | 10 | 10 | T1:1.25% NAC mouthwash T2: 0.2% CHX mouthwash | Placebo mouthwash | Subgingival plaque Paper point | V1–V3 region | 3 weeks | CHX was more effective in preventing and reversing experimental gingivitis than NAC. There was a non-significant increase in the species richness and alpha diversity compared to baseline for placebo and NAC group while CHX resulted in a decrease in these parameters. |
| Al-Kamel et al., 2019 * [13] (Treatment study) Yemen | 10 | 10 | 1.25% N-acetyl cysteine mouthwash | 0.2% CHX mouthwash | Subgingival plaque Paper point | V1–V3 region | 3 weeks | CHX use was associated with a significant decrease in species richness and alpha diversity while NAC caused no change. | ||||
| Wang et al., 2021 [56] China | Split mouth randomized controlled clinical trial | Generalized chronic periodontitis | CAL loss in >30% of sites | 28–57 | 20 | SRP+ (−)-Epigallocatechin Gallate (EGCG) solution (delivered through scaler tip) | SRP+coolant | Subgingival plaque Paper point | V3–V4 region | 6 months | SRP+EGCG improved the clinical parameters and the relative abundance of Tannerella forsythia compared to SRP alone. | |
| Toothpaste | ||||||||||||
| Hong et al., 2020 [47] Korea | Double-blind placebo controlled RCT | Gingivitis or incipient periodontitis | N/A | T: 37.08 ± 11.08; C: 33.72 ± 11.74 | 40 | 40 | Toothpaste containing pyrophosphate | Toothpaste without pyrophosphate | Supragingival plaque/calculus Swabs | V4–V5 region | 12 weeks | The toothpaste containing pyrophosphate inhibited the dysbiosis of oral microbiome and prevented proliferation of pathogens (Haemophilus, Fusobacterium and Capnocytophaga) and showed significant differences in the α diversity from baseline to 12 weeks. |
| Huang et al., 2016 * [17] China | Double-blind RCT | Moderate gingivitis | At least 10 bleeding sites; mean MGI is from 1.0–2.5 | 33.80 ± 7.86 | 47 | 44 | The brush-plus-rinse group: manual toothbrush and a toothpaste containing 0.321% sodium fluoride and 1.16% stannous chloride and 20 mL rinse with 0.0747% CPC for 30 s after brushing. | Brush twice daily with a manual brush and a 0.243% sodium fluoride toothpaste | Supragingival plaque Sterile Gracey curette | V1–V3 region | 27 days | The brush-plus-rinse group exhibited lower α diversity than the brush-alone group and overall lower detection in taxa after treatment while the β diversity of brush alone group post-treatment showed resemblance to baseline. |
| Hagenfeld et al., 2019 * [44] Germany | Double-blind, two center RCT | Mild to moderate periodontitis | PPD of ≥4 mm in at least four teeth except for third molars | 54.22 | 20 | 21 | Toothpaste containing zinc substituted carbonated hydroxyapatite | Toothpaste with amine fluoride/stannous fluoride | Subgingival plaque Paper point | V4–V6 region | 12 weeks | The toothpaste containing anti-adhesive HA did not induce any changes in the microbial composition compared to anti-adhesive and antimicrobial AmF/SnF2. There were no changes in the alpha diversity. |
| Air polishing | ||||||||||||
| Lu et al., 2019 * [52] China | Clinical trial | Periodontitis patients on maintenance therapy | Maintained subjects that had a stable condition with more than 20 teeth, bop (%) ≤ 25%, PPD ≤ 5 mm | 50.18 ± 12.08 | 17 | 17 | Air polishing | Ultrasonic scaling | Subgingival plaque Sterile Gracey curettes | V3–V4 region | 12 weeks | There was a reduction in the microbial diversity, proportion of periodontitis-associated bacteria, and pathogenic metabolism after the use of ultrasonic (US) and air polishing (AP). Chao1 was significantly reduced at 2 weeks in both US and AP groups but increased significantly from weeks 2 to 8 to week 12. Similarly, the Shannon index decreased after treatment and then increased at week 12. |
| Kruse et al., 2020 * [49] Germany | Single-blinded, randomized controlled split-mouth study | Chronic periodontitis patient undergoing maintenance therapy | 2 single-rooted with PPD = 5 mm and positive BOP or >5 mm with or without positive BOP | 61.4 ± 10.6 | 10 | Air polishing using trehalose powder | Ultrasonic scaling | Subgingival plaque Paper point | NA | 3 months | Air polishing and sonic treatment have a similar effect on the subgingival microbiome. | |
| Other | ||||||||||||
| Queiroz et al., 2017 [54] Brazil | Single blinded RCT | Chronic periodontitis with Class II furcation on molars | Horizontal furcation PD ≥ 4 mm | 53.14 | 13 | 13 | Beta-tricalcium phosphate/hydroxyapatite graft/ EMD+BONE | EMD only | Subgingival plaque Paper point | NA | 6 months | Treatment with EMD alters the dysbiotic subgingival microbiome and decreases the pathogen richness and increases commensal abundance. |
| Woelber et al., 2019 [57] Germany | Single blinded RCT | Gingivitis | Mean GI index ≥ 0.5 | 27.2 (4.7) | 15 | 15 | An anti-inflammatory diet low in processed carbohydrates and animal proteins and rich in omega-3 fatty acids, vitamin c, vitamin d, antioxidants, plant nitrates, and fiber. | Western diet | Subgingival plaque Sterile Gracey curettes | V3–V4 region | 6 weeks | There was no significant difference seen in the subgingival microbiome with both diets. The alpha diversity was slightly higher in the experimental group. |
| Author and Year | Data Analysis | Statistical/Computational Methods | Alpha Diversity | Beta Diversity |
|---|---|---|---|---|
| Lu et al., 2021 [51] | QIIME2 & DADA2 pipelines were used for the generation of ASVs and α (Chao1, Shannon index, and richness) and β (PCoA) diversity were assessed. Taxonomies were assigned using HOMD | Pre- and post-treatment compared using paired t-test or Wilcoxon signed-rank test. The correlation of microbiota was analyzed using the Spearman correlation coefficient and heatmaps were generated. | Decrease in the Chao1, Shannon index, and richness in the test group and an increase in the control group. | PCoA showed dissimilarities among the three-time points (baseline, 3 months, and 6 months) in the two groups. |
| de Oliveira et al., 2021 [41] | OTUs were classified using NeoRefDB database. Shannon index, Bray-Curtis dissimilarity index, and PCoA plot were used. | Baseline and post-treatment were assessed by the Wilcoxon and Mann-Whitney test. Categorical variables were analyzed using Chi-square, McNemar, or Fisher test. | A significant decrease in the α diversity was observed for both the groups but not between therapies. | N/A |
| Wang et al., 2021 [56] | The mean relative abundance was calculated for Red-complex pathogens and HOMD was used for comparisons. | Relative abundances in groups were assessed using the Wilcoxon signed-rank test. | N/A | N/A |
| Hong et al., 2020 [47] | QIIME 2 and DADA2 pipelines were used for ASVs generation. Taxonomy assigned using Greengenes database taxonomy via feature classifier classify-sklearn. | For comparing β diversity ANOSIM was used. To compare α diversity and taxonomies between groups Wilcoxon’s rank-sum test or t-test was conducted. LDA and effect size (LEfSe) analysis was done. Linear regression analysis of specific strains was performed. | The α diversity was reduced for both the test and control groups at 12 weeks. | The PCoA plot showed a significant difference between baseline and 12 weeks. |
| Kruse et al., 2020 [49] | For bacteria identification, BLAST program was used for identifying bacterial sequences of 4 bactrial isolates (Prevotella tannerae, Anaeroglobus geminatus, Actinomyces sp. oral taxon, Filifactor alocis). | Paired t-test was used for temporal changes in bacterial concentration from baseline to post-treatment. | N/A | N/A |
| Al-Kamel et al., 2019 [13] | The MOTHUR (UCHIME) pipeline was used. Taxonomies assigned using SILVA, Greengenes database, Wang’s Bayesian classifier. BLASTN-based taxonomy assignment was used for classifying species levels. The HOMD, HOMD-ext, modified Greengene Gold set, and NCBI’s microbial 16S set were used. USEARCH was used for out cut-off. QIIME was used for the calculation of species richness, coverage, and α and β diversity indices. Subject clustering was done with PCoA based on the Jaccard distance metric. | Within-group differences were observed using Wilcoxon signed-rank test and with other groups using Mann–Whitney U test. LDA and effect size (LEfSe) analysis was conducted. | In the treatment sub study, there was a decrease in the richness and α diversity | The PCoA plots showed variations in the microbiome among the samples. Three major clusters were formed |
| Hagenfeld et al., 2019 [44] | DADA2 and Phyloseq R packages were used for the analysis of α diversity measurement, richness, and the number of observed RSV. The β diversity was measured using the Bray-Curtis distance matrix. | ANCOVA and likelihood ratio test was used. | There were no changes in the α diversity between the two groups. | The PCoA did not change in the test and control groups. |
| Lu et al., 2019 [52] | QIIME was used and OTU was clustered and compared against the HOMD. The α & β diversity was assessed. PCoA was performed using the Bray-Curtis distance. | Wilcoxon signed-rank test was used for comparing α diversity. Microbial differences in pockets were compared with the Mann–Whitney test. Heatmap was generated genera distribution and Spearman correlation was performed for co-occurrence networks. | There was richness, and the Shannon diversity was reduced after treatment with ultrasonic scaling and air polishing showed increased richness. | The PCoA plot revealed a close distribution of microbial communities among the ultrasonic group and air polishing group |
| Woelber et al., 2019 [57] | MOTHUR was used for sequence processing and compared with the SILVA 16S database. The R packages phyloseq and vegan packages were used for microbiome data analysis. The α diversity and richness were assessed. | Kruskal-Wallis test was conducted for comparisons. | The α diversity and richness showed a reduction over time and was overall higher for the experimental group. | The PCA plots showed that the composition of the subgingival microbiome varied between different patients and between the two sampling times of the same patient. |
| Hagenfeld et al., 2018 [43] | The DADA2, DECIPHER, and Phyloseq R packages were used. RSVs were classified according to the SILVA database. The richness, Shannon index, and Pielou index were measured for α diversity, and for β diversity, the Bray-Curtis distance and PCoA plots were measured. The differential abundance RSV was analyzed using DESeq2. | Mann–Whitney U test was used to compare both treatment groups and Wilcoxon signed-rank test was used before and after for each treatment group. | There was no difference in the richness, evenness, and α diversity within the control group, but richness decreased in the treatment group. | Bray-Curtis dissimilarity increased in both groups In the PCoA plot, the antibiotic group showed a clear separation of microbiomes before and after treatment and the placebo group showed no difference. |
| Chen et al., 2018 [42] | The OTU was generated, and the sequences were annotated by the RDP naïve Bayesian 16S classifier. STAMP was used for differential abundance and community analysis. The vegan package and metagenome package in R was used for α and β diversity. | N/A | The α diversity was similar among the test and the control group. | PCoA showed a clear separation of treatment and control groups. |
| Belstom et al., 2018 [38] | BLAST program was used for taxonomic assignment and compared with the HOMD. The relative abundance was calculated as the percentage of DNA reads assigned to each reference. | Relative abundances were compared using the Kruskal-Wallis and Mann-Whitney test with Benjamini Hochberg analyses. Spearman signed-rank test was used to compute the correlation of relative abundance in the samples | The αdiversity decreased after treatment. | N/A |
| Queiroz et al., 2017 [54] | The OTU was assigned by alignment to HOMD using the BLASTn algorithm. QIIME was used for microbial core analysis. | Parametric tests. | The treatment groups resulted in an increase in health-associated bacteria. | N/A |
| Han et al., 2017 [45] | QIIME was used for analysis. OTU were picked and clustered using UPARSE pipeline and RDP classifier and Greengenes database was used for assigning taxonomies. MUSCLE software was used for getting phylogenetic relationships. The Shannon index, Choa1 index, Simpson index, and richness was calculated. Rarefaction curves were generated. The UniFrac PCoA plots and UPGMA analysis were done. | N/A | The α diversity decreased while the richness increased after treatment | PCoA showed that pre-interventional and post-interventional samples were different. |
| Liu et al., 2018 [14] | QIIME and MOTHUR were used for data analysis. OTU was formed by USEARCH, and RDP was used for classifying into taxonomic groups based on the HOMD. PCA and PCoA plots were generated. | The α diversity and the differences in the pre- and post-treatment were compared using the Mann-Whitney U test. ANOSIM was used to compare the intra and inter-group similarities. ANCOVA was used to calculate the differences in the relative abundances. Spearman correlation was used for correlations between OTUs. LDA and effect size (LEfSe) analysis was conducted. | No difference in the Shannon index. | PCoA showed there was a difference in the bacterial composition before and after treatment. |
| Califf et al., 2017 [40] | The OTU counts were picked with UCLUST against the Greengenes database. Faith’s phylogenetic diversity and Choa1 index were assessed. QIIME was used to analyze β diversity the UniFrac distance, PCoA, and Bray-Curtis distance. Shotgun sequencing was done, and human reads were removed with KneadData. The bacterial reads were analyzed using the HUMAnN2 and MetaPhlAn2 pipeline. | Spearman rank correlation was used for correlation and the Mantel test was used. | Higher diversity correlated with periodontal pocket depth. | PCoA showed there was no compositional separation of microbiomes among different groups of disease severity. |
| Bizzarro et al., 2016 [39] | The OTU was randomly subsampled. The data analyses consisted of the Shannon diversity index, PCA, PERMANOVA using the Bray-Curtis similarity measure, and the Bray-Curtis similarity matrix. | Mann–Whitney test was used for assessing differences between groups at genus level and Wilcoxon signed-rank test was used for assessing the effects of time. ANOVA and ANCOVA were used for changes in Shannon diversity Pearson and Spearman were measures of correlation and Bray-Curtis and Kullback-Leibler were used for dissimilarity | The α diversity was similar between the test and control groups and similar within each group. | A significant difference between the treatment and control groups and within a group. |
| Huang et al., 2016 [17] | MOTHUR package was used and assigned sequences were classified using oral CORE reference database. The vegan R package was used for α and β diversity. PCoA and JSD matrix were constructed. | ANCOVA was used for treatment group comparisons. | There was a decrease in the alpha diversity in the treatment group | PCoA showed variation in the treatment group associated with gingival health. |
| Teng et al., 2016 [18] | MOTHUR package for analysis of Shannon index, richness and PCA. | To compare within subjects, the Wilcoxon rank-sum test was used and to compare two groups. Wilcoxon signed-rank test was used and for correlations, Spearman correlation analysis was carried out. FDR corrections were performed. | The α diversity in the treatment group remained stable while it increased in the control group. | The PCA plots showed there was structural segregation of the microbial community between the two groups after treatment |
| Shi et al., 2015 [23] | 16S rRNA sequences were extracted from the shotgun sequencing data and aligned against the SILVA rRNA database, HOMD, and OSU CORE database. The vegan R package was used for rarefaction analysis of sequencing depth. QIIME was used for estimating the Shannon index, weighted UniFrac, & PCoA. | ANOSIM was conducted using MOTHUR for assessing microbiome similarities. Paired-t-test was used in all analyses. Hierarchical clustering was performed on the relative abundance profiles. The Spearman rank correlation was done for the distance measurement. Heat map was generated. | Alpha diversity decreased after the intervention. | PCoA showed a difference in the microbial composition at baseline and post-intervention |
| Schwarzberg et al., 2014 [55] | QIIME was used for data analysis and OTU was clustered using the UCLUST protocol using the Greengenes reference sequence. RDP classifier was used for taxonomic assignment. The relative abundance Streptococcus, Prevotella and Fusobacterium was assessed. The UniFrac based PCoA plots were constructed. | N/A | Increased relative abundance of Fusobacterium was correlated with pocket depths in samples. Individual subjects had different flora after intervention. | No difference in PCoA plot was observed for before and after treatment. |
| Laksmana et al., 2012 [50] | Libcompare and Pyrosequencing pipelines were used from RDP. Results were then compared to HOMD. | The % composition and cumulative % of total reads of species/phylotypes were observed. | N/A | N/A |
| Junemann et al., 2012 [48] | OTU clustering, rarefaction curves, and species richness estimator ACE were assessed using ESPIRIT. GAST pipeline and SILVA rRNA database was used for taxonomic annotation. Shannon and Simpson diversity indices were computed using the vegan R-package. | N/A | Alpha diversity (Shannon index and Simpson index) increased after intervention | N/A |
| Yamanaka et al., 2012 [58] | OTU clustered using UCLUST, & Greengenes database were used. Unifrac calculated by FastUnifrac. OTU, Chao1 index, and ACE index was calculated using the Vegan package in R. | Paired t-test and student t-test were performed to compare the matrices pre-and post-therapy and between individuals. Wilcoxon signed-rank test to compare relative abundances. | After the intervention, there was a reduction in Chao1 and Shannon index. | A significant compositional change was seen after intervention and showed strong distinct clustering. |
Publisher’s Note: MDPI stays neutral with regard to jurisdictional claims in published maps and institutional affiliations. |
© 2022 by the authors. Licensee MDPI, Basel, Switzerland. This article is an open access article distributed under the terms and conditions of the Creative Commons Attribution (CC BY) license (https://creativecommons.org/licenses/by/4.0/).
Share and Cite
Nath, S.; Pulikkotil, S.J.; Weyrich, L.; Zilm, P.; Kapellas, K.; Jamieson, L. Effect of Periodontal Interventions on Characteristics of the Periodontal Microbial Profile: A Systematic Review and Meta-Analysis. Microorganisms 2022, 10, 1582. https://doi.org/10.3390/microorganisms10081582
Nath S, Pulikkotil SJ, Weyrich L, Zilm P, Kapellas K, Jamieson L. Effect of Periodontal Interventions on Characteristics of the Periodontal Microbial Profile: A Systematic Review and Meta-Analysis. Microorganisms. 2022; 10(8):1582. https://doi.org/10.3390/microorganisms10081582
Chicago/Turabian StyleNath, Sonia, Shaju Jacob Pulikkotil, Laura Weyrich, Peter Zilm, Kostas Kapellas, and Lisa Jamieson. 2022. "Effect of Periodontal Interventions on Characteristics of the Periodontal Microbial Profile: A Systematic Review and Meta-Analysis" Microorganisms 10, no. 8: 1582. https://doi.org/10.3390/microorganisms10081582
APA StyleNath, S., Pulikkotil, S. J., Weyrich, L., Zilm, P., Kapellas, K., & Jamieson, L. (2022). Effect of Periodontal Interventions on Characteristics of the Periodontal Microbial Profile: A Systematic Review and Meta-Analysis. Microorganisms, 10(8), 1582. https://doi.org/10.3390/microorganisms10081582