Abstract
Several pathways link type 2 diabetes (T2D) mellitus to the gut microbiome. By modifying the gut microbiota (GM), probiotics may be useful in the treatment of T2D. Lactobacillus plantarum Dad-13 is an indigenous Indonesian probiotic strain that has colonized the digestive tracts of healthy Indonesian adults. Furthermore, the GM of Indonesians is dominated by L. plantarum. The probiotic L. plantarum Dad-13 is likely suitable for Indonesians. This study aimed to assess the effect of the probiotic L. plantarum Dad-13 on metabolic profiles and GM of women with T2D in Yogyakarta, Indonesia. Twenty women from each group of forty T2D patients received either a probiotic or a placebo. The probiotic group consumed 1 g skim milk powder containing 1010 CFU/g L. plantarum daily for 11 weeks. The placebo group received 1 g skim milk powder only daily for 11 weeks. At the start and end of the experiment, anthropometric measures, dietary intake surveys, blood samples, and fecal samples were obtained. The GM analysis of all samples was performed using polymerase chain reaction, and Illumina Novaseq was applied to the selected samples from each group at the beginning and end of the trial. Short-chain fatty acids (SCFAs) were analyzed with gas chromatography. The level of HbA1c in the probiotic group (n:10) significantly decreased from 9.34 ± 2.79% to 8.32 ± 2.04%. However, in comparison with the placebo (n:8), L. plantarum Dad-13 supplementation did not significantly decrease the HbA1c level. No significant change was observed in the fasting blood sugar and total cholesterol levels in either group. The GM analysis showed that L. plantarum Dad-13 supplementation resulted in a considerable increase in the L. plantarum number. No significant changes were observed in the Bifidobacterium and Prevotella populations. In addition, no significant change was observed in the fecal pH and SCFA (e.g., acetic acid, propionate, butyrate, and total SCFA) after supplementation with L. plantarum Dad-13.
1. Introduction
Type 2 diabetes mellitus (T2D) is a metabolic disease characterized by high blood glucose levels resulting from a deficiency in insulin synthesis, insulin resistance, or both. Diabetes and its effects have become a major global health problem. According to the International Diabetes Federation (IDF), around 463 million (9.7%) adult people 20–79 years of age had diabetes in 2019, with the number anticipated to rise to 700 million (10.9%) by 2045 [1].
Dysbiosis, or an imbalance in microbial homeostasis, is produced by alterations in the gut microbiota (GM) and contributes to the development of chronic diseases such as T2D. Dysbiosis of the GM affects glucose metabolism improvement significantly. Patients with T2D have altered intestinal microbiota, with a reduced Bacteroidetes Firmicutes ratio (F/B) and fewer bacteria (e.g., Bifidobacteria); however, increased levels were observed in Gram-negative bacteria that create endotoxins that disrupt the host’s metabolic function [2,3,4,5].
Probiotics may help patients with T2D management by modifying the GM. Probiotics are live bacteria that can alter the intestinal microbiota when taken as a food or supplement. Lactobacillus is the most common probiotic. According to meta-analysis research, treatment with probiotics can lower the HbA1c level, fasting blood glucose (FBS) level, and insulin resistance in T2D patients [6,7].
Lactobacillus plantarum Dad-13 is an indigenous Indonesian probiotic strain that has survived and colonized in the gastrointestinal tracts of healthy Indonesian adults [8,9]. E. coli and non-E. coli coliform bacteria were reduced in Indonesian school-aged children who consumed L. plantarum Dad-13 powder [10]. In the GM of the average Indonesian, L. plantarum is a dominating bacterium [11]. The GM composition changed after the treatment with gummy L. plantarum Dad-13. In addition, the treatment with L. plantarum Dad-13 helped moderately malnourished newborns improve their anthropometry and nutritional health [12]. The body weight and body mass index (BMI) in overweight adults reduced after ingesting the indigenous probiotic powder L. plantarum Dad-13 [13]. Therefore, L. plantarum is most likely a good probiotic for Indonesians. This study aimed to assess the influence of the powder of L. plantarum Dad-13 probiotic on the metabolic profiles and GM of women with T2D in Yogyakarta, Indonesia.
2. Materials and Methods
2.1. Study Design
The research was conducted in 2020 for intervention in public health centers in the Sleman regency, Yogyakarta, Indonesia. This 12-week study employed a randomized double-blind controlled trial research methodology. The COVID-19 pandemic’s restrictions forced a reduction in the intervention time to 11 weeks. For the 11-week study, the probiotic group consumed 1 g skim milk powder containing Lactobacillus plantarum Dad-13 1010 CFU each day, whereas the placebo group diet received 1 g skim milk powder daily.
Food intake, GM composition, and fecal short-chain fatty acids (SCFAs) were the primary outcomes of this study, whereas demographic data, anthropometric data, metabolic indicators, and physical activity were the supplementary results. At the study’s outset, demographic data, such as age, education, employment, income, T2D duration, medicines, and dose, were collected. At the beginning and end of the trial, anthropometric data, 7-day frequency of defecation, stool samples, and blood samples were obtained. The blood samples were used for metabolic indicators analyses, such as HbA1c, FBS, and cholesterol total analysis. By contrast, stool samples were used for the analyses of fecal characteristics (color, consistency, and pH), GM, and SCFAs. A semi-quantitative food frequency questionnaire and the International Physical Activity Questionnaire were used to gather information on food consumption and physical activity during the 4th and 11th weeks. The NutriSurvey 2007 program (http://www.nutrisurvey.de/ (accessed on 2 February 2020)) was used to measure the macronutrient consumption (energy, carbohydrate, protein, fat, fiber, and water).
The FBS, HbA1c, and total cholesterol levels were assessed at Yogyakarta’s Parahita Laboratory. The Biotechnology Laboratory and Waste Management Laboratory in the Faculty of Agricultural Technology, Universitas Gadjah Mada performed the DNA extraction and SCFA analysis. The polymerase chain reaction (PCR) study of the GM was performed at Universitas Gadjah Mada’s Laboratorium Penelitian dan Pengujian Terpadu, and the next-generation sequencing analysis was performed at Novogene Ltd. in Singapore.
2.2. Subject Participants
Subjects were obtained from 1146 women with T2D who visited 13 public health centers in Sleman regency, Yogyakarta, Indonesia. They were screened in accordance with the requirements for inclusion in this study. The inclusion criteria for the T2D patients were as follows: between 20 and 50 years of age, BMI < 30, HbA1c ≥ 6.5%, not pregnant and not breastfeeding, not menopausal, not smoking, not drinking alcohol, not consuming antidiabetic drugs, and not consuming other drugs. The probiotic and placebo groups were formed by random selection of the participants. Using the Excel 2016 formula, RANDBETWEEN (1;40), randomization was carried out by an independent enumerator. Subjects with scores from 1 to 20 were assigned to the probiotic group, and those with scores from 21 to 40 were assigned to the placebo group. Prior to the study’s conclusion, neither the subjects nor the researchers were aware of the product. The exclusion criteria were going through probiotic and/or antibiotic therapy within the treatment period, being pregnant, or withdrawing consent during the study.
2.3. Ethical Approval
As a condition of participation, all subjects had to provide a written informed consent. The Medical and Health Research Ethics Committee, Faculty of Medicine, Public Health, and Nursing, Universitas Gadjah Mada authorized the study protocol, which followed the principles of the 1975 Declaration of Helsinki (Protocol number: KE/FK/1356/EC/2019; Approval date: 18 November 2019).
2.4. Fecal Sample Collection
Before collecting the patient’s stool on day 28 (plus one day), each patient received a fecal kit box, and the procedure was explained. After being instructed to defecate, the volunteer’s fecal matter was placed in fecal tubes. As quickly as feasible, a sample was placed in a fecal box with ice bags and brought to the laboratory. A fecal sample was placed in a second fecal tube with 2 mL RNA (Sigma-Aldrich; R0901; Saint Louis, MO, USA). It was promptly stored at freezing temperature (−40 °C) before being utilized [14,15].
2.5. pH and SCFA Analyzes
A pH meter (pH meter; Spear Eutech, Singapore) was used to determine the fecal pH. Following calibration, the probe was immediately inserted into the fecal sample, and monitoring was performed until a stable reading was established. For SCFA analysis, 0.2 g feces were weighed in a 2 mL microtube and injected with sterile aquabidest water. After 20 min of ultrasonication, the fecal suspension was centrifuged for 10 min (14,000 rpm, 4 °C). The supernatant was centrifuged for a second cycle (14,000 rpm at 4 °C for 10 min). A gas chromatograph with a flame ionization detector and a capillary column (Crossbond polyethylene glycol, 30 m × 0.25 mm × 0.25 m) was used to analyze the final supernatant (Shimadzu, GC-2010 Plus, Kyoto, Japan). With nitrogen as the gas carrier, the temperatures for the sample injection and detection were 250 °C (flow rate: 38.7 mL/min; pressure: 100 kPa).
2.6. DNA Extraction
The extraction of DNA from the fecal sample kicked off the sequencing procedure. A previously modified bead-beating approach was used to extract DNA [15]. After being diluted with RNA (w/v) ten times, the fecal sample was rinsed with 1 mL phosphate-buffered saline. The fecal sample was then violently mixed for 60 s at 4000 rpm with a bead beater with 300 µL Tris-sodium dodecyl sulfate solution and 500 µL Tris-ethylenediaminetetraacetic acid (TE) buffer-saturated phenol (FastPrep-24TM, MP Biomedials, Santa Ana, CA, USA). The recovered supernatant was mixed with 400 µL phenol/chloroform/isoamyl alcohol (25:24:1; v/v) and aggressively mixed for 90 s at 4000 rpm with a bead beater (FastPrep-24TM, MP Biomedials, Santa Ana, CA, USA), followed by centrifugation at 13,000 rpm at 4 °C for 5 min with a bead beater (FastPrep-24TM, MP Biomedials, Santa Ana, CA, USA). Afterward, 25 µL 3 M sodium acetate (pH 5.2) was added to 250 µL supernatant, and the mixture was then incubated for 30 min on ice. A volume of 300 µL isopropanol was added, and the mixture was centrifuged at 13,000 rpm at 4 °C for 5 min. After being hand-agitated and washed with 500 µL cold 70% ethanol, the DNA pellet was centrifuged at 4 °C for 5 min at 13,000 rpm. The final DNA pellet was air dried, suspended in 20 µL TE buffer (pH 8.0), and kept at −30 °C until required [14].
2.7. Real-Time Quantitative PCR (qPCR) Analysis
The real-time qPCR technique was utilized for the microbiota analysis step, which also involved DNA dilution from the findings of DNA isolation, the creation of a PCR master mix, reading, the creation of standard curves, and determining the total number of bacteria [16]. The concentration of bacterial DNA was increased to 20 ng/µL for L. plantarum, Bifidobacterium, and Prevotella. The PCR master mix was prepared using a mixture of 5 µL Eva Green, 0.5 µL × 1000 nM forward primer and reverse primer, 1 µL sample DNA, and 3 µL nuclease-free water. Bio-Rad CFX-96 was used for real-time PCR. The analysis program Bio-Rad CFX Manager Software 3.0 was used to determine the outcomes of bacterial DNA quantification and multiplication. The calculation of the number of cells was carried out using a standard curve based on the DNA concentration of L. plantarum Dad-13. The total amounts of L. plantarum, Bifidobacterium, and Prevotella were revealed in the study. Table 1 displays the DNA base sequences of the employed primers.

Table 1.
Specific primers used in the study.
2.8. Sequencing Data Processing
The forward primer CCTAYGGGRBGCASCAG and the reverse primer GGACTACNNGGGTATCTAAT were used to amplify the 16S rRNA gene’s V3 and V4 sections. PCR amplification of targeted regions was performed by using specific primers connecting with barcodes. The PCR products with proper size were selected by 2% agarose gel electrophoresis. The same amount of PCR products from each sample was pooled, end-repaired, A-tailed, and further ligated with Illumina adapters. Libraries were sequenced on a paired-end Illumina platform to generate 250 bp paired-end raw reads. The library was checked with Qubit and real-time PCR for quantification and bioanalyzer for size distribution detection. Quantified libraries were pooled and sequenced on Illumina platforms (The NEB-Next® UltraTM DNA Library Prep Kit for Illumina, San Diego, CA, USA), according to effective library concentration and data amount required.
2.9. Bioinformatic Analysis
Based on their special barcodes, samples were assigned to paired-end reads, which were reduced by deleting the barcode and primer sequences. Paired-end reads were combined using FLASH (V1.2.7) (http://ccb.jhu.edu/software/FLASH/ (accessed on 4 February 2021)), and the splicing sequences were known as raw tags when at least a portion of the reads overlapped with the read produced from the opposing end of the identical DNA fragment [18].
To obtain the high-quality clean tags, we conducted quality filtering of the raw tags using precise filtering parameters and the QIIME (V1.7.0) quality-controlled methodology (http://qiime.org/scripts/split_libraries_fastq.html (accessed on 4 February 2021)) [19,20]. The tags were compared with the gold database, which can be found at SILVA138 database http://www.arb-silva.de/ (accessed on 4 February 2021), to find chimera sequences using the UCHIME Algorithm (UCHIME Algorithm, http://www.drive5.com/usearch/manual/uchime_algo.html (accessed on 4 February 2021)). The chimeric sequences were subsequently eliminated. The most successful tags were finally acquired [21].
We assessed the sequence with the Uparse software (Uparse v7.0.1001, http://drive5.com/uparse/ (accessed on 4 February 2021)) using all functional tags. OTUs were allocated to sequences that were 97% identical. For each OTU, a sample sequence was evaluated for further annotation [22]. The SILVA Data-SSUrRNA database (http://www.arb-silva.de/ (accessed on 4 February 2021)) was utilized to perform species annotation for each sample sequence using the Mothur program at each taxonomic rank: kingdom, phylum, class, order, family, genus, and species (threshold: 0.81) [23,24]. MUSCLE (version 3.8.31, available at http://www.drive5.com/muscle/ (accessed on 4 February 2021)) can efficiently compare a large number of sequences to determine the evolutionary relationship between all OTU representative sequences [25]. The OTU abundance data were normalized using a sequence number standard that corresponded to the sample with the fewest sequences. The complexity of biodiversity was analyzed using the alpha diversity indicators (Chao1, observed species, Simpson, and Shannon). Furthermore, species complexity was assessed using beta diversity indices (unweighted and weighted unifrac). All these tests were carried out using QIIME (V1.7.0).
2.10. Statistical Analysis
The SPSS 17 for windows was used for statistical analysis. Data are shown as the mean ± standard deviation (SD). If the data were normal, an independent t-test was used to compare the groups, and if the data were not normal, a non-parametric Mann–Whitney test was employed. Meanwhile, a paired t-test was used to examine the differences within groups (before–after intervention) if the data were normal, and the Wilcoxon test was applied if the data were not normal.
3. Results
3.1. Baseline Characteristics
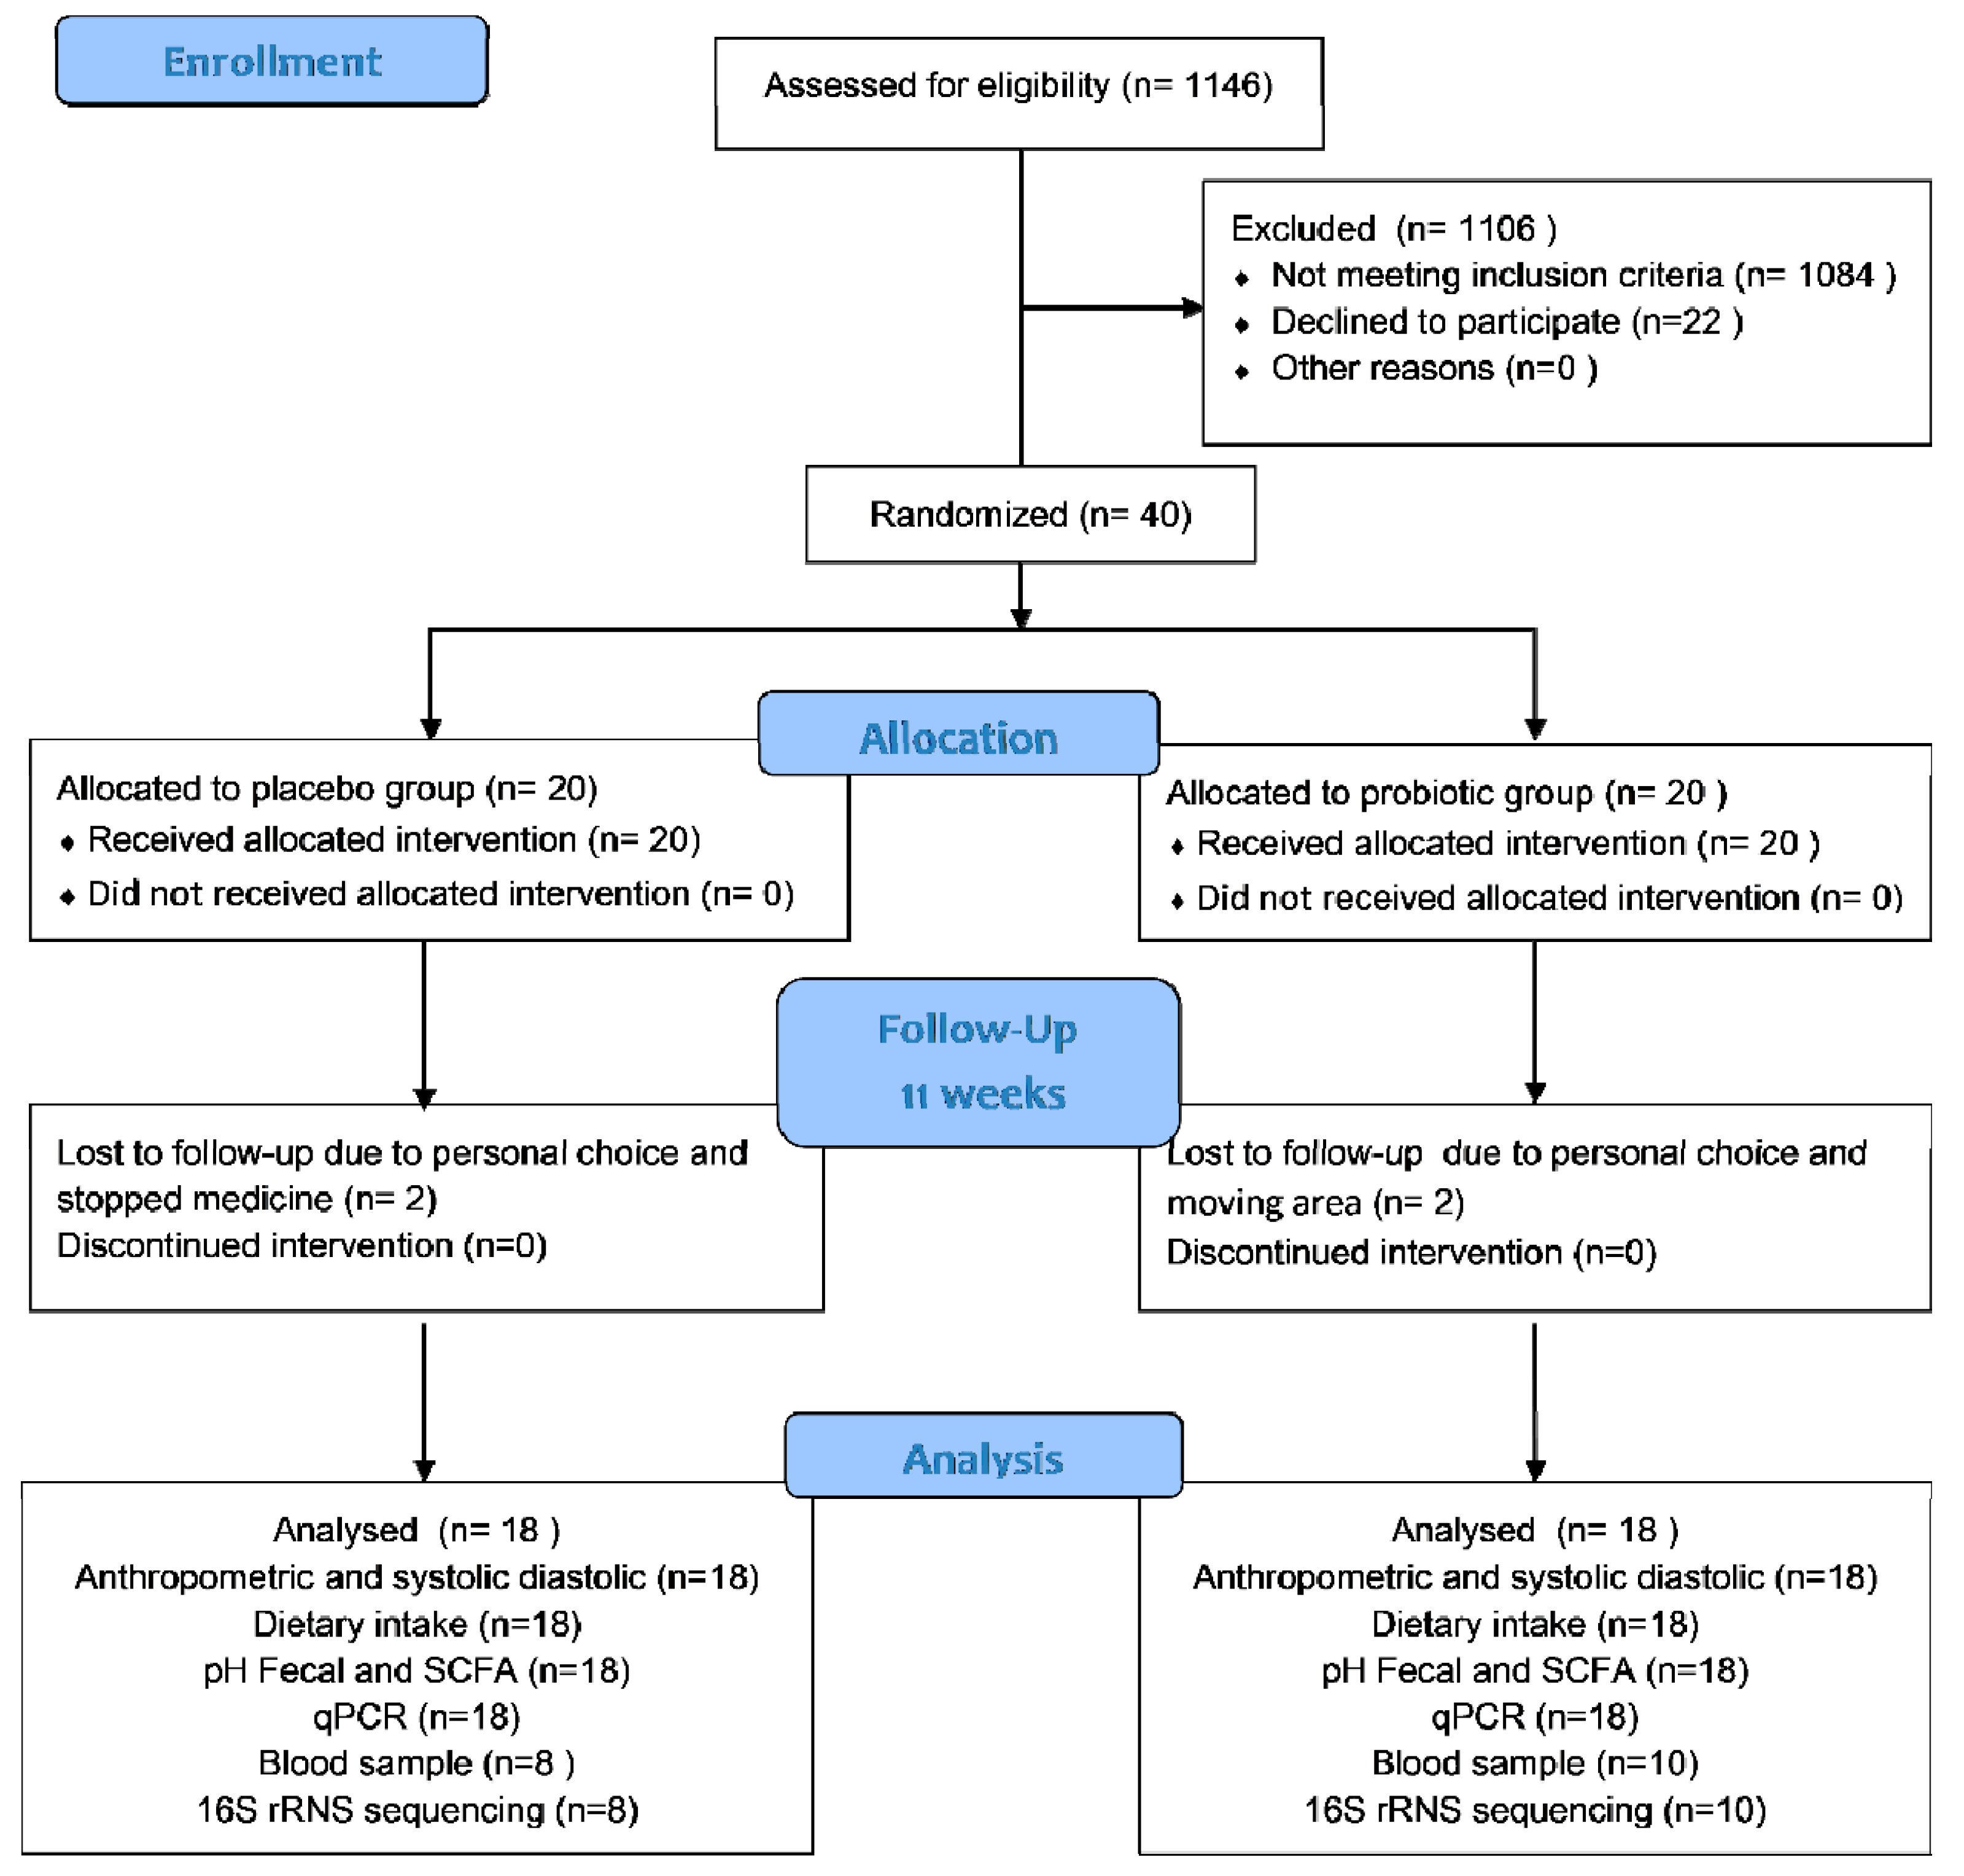
In this trial, 40 T2D women were enrolled; 20 were placed in the probiotic group and 20 in the placebo group. However, for each group, only 18 participants completed the trial. Two subjects from the placebo group were excluded because they declined to participate and had stopped consuming medicine. Meanwhile, two subjects from the probiotic group were excluded because they were moving away from the area and declined to participate further. Figure 1 shows the participant flow in accordance with CONSORT. All subjects received more than 87.0% product with a comparable compliance rate (placebo: 92.28% vs. probiotics: 91.85%). The probiotics and placebo were well-tolerated and generally accepted by the participants. During the study period, the participants reported no adverse effects. However, at the end of this study, only 18 subjects (8 subjects of the placebo and 10 subjects of the probiotic group) were permitted to provide their blood samples due to the COVID-19 pandemic.

Figure 1.
Participant flow according to CONSORT.
Table 2 presents the baseline characteristics, anthropometric, and metabolic profiles of the subjects. Age, anthropometric measurements, and metabolic profiles at baseline did not differ significantly across the groups.
Table 2.
Characteristic of study subjects at baseline.
3.2. Anthropometric and Blood Pressure before and after Intervention
Table 3 shows the anthropometric and blood pressure of both groups before and after the intervention. No significant change was observed in the weight, BMI, waist circumferences, hip circumferences, and systolic and diastolic pressures of placebo and probiotic groups.
Table 3.
Anthropometric and blood pressure before and after intervention in both groups.
3.3. Fecal Characteristics and Defecation Frequency
Table 4 shows the fecal characteristics, including the pH, color, and consistency, and defecation frequency in both groups before and after the probiotic intervention. Four scales were used to indicate the color (1: yellow, 2: brownish-yellow, 3: brown; 4: green). The fecal consistency was identified with the Bristol chart. Following the administration of probiotic L. plantarum Dad-13, the frequency of defecation increased in the probiotic group. Before and after the intervention, the pH in the placebo group was 6.21 ± 0.61 and 6.08 ± 0.42, respectively. The pH level in the probiotic group was 6.28 ± 0.39 before and 6.21 ± 0.37 after the intervention.
Table 4.
Fecal characteristics and defecation frequency.
3.4. SCFAs
Table 5 displays the concentrations of SCFA in the probiotic and placebo groups. In addition, neither group’s SCFA levels changed significantly (p > 0.05) as a result of the intervention. Similarly, the SCFA content of T2D individuals was unaffected by the administration of L. plantarum Dad-13 in this investigation.
Table 5.
SCFAs of feces.
3.5. Dietary Intake and Physical Activity
Table 6 displays the pre- and postintervention nutritional consumption and physical activity of the two groups. Both groups’ consumption of macronutrients, fiber, and water did not change significantly after the intervention. The physical activity in both groups also showed no significant change.
Table 6.
Dietary intake and physical activity before and after intervention between groups.
3.6. Specific Bacteria Analyzed by PCR
L. plantarum, Bifidobacterium, and Prevotella were selected as the bacteria of interest, and qPCR analysis was used to calculate their populations (Table 7). L. plantarum was quantified to assess its gastrointestinal tract resistance.
Table 7.
Specific bacteria analyzed by PCR.
A significant increment in the number of L. plantarum was observed in the probiotic group, but a significant decrement was detected in the placebo group. However, no appreciable variations were noticed in the proportions of Prevotella and Bifidobacterium in either group.
3.7. Metabolic Profiles before and after the Intervention
Table 8 displays the metabolic characteristics of both groups. In the probiotic group, the FBS level dropped considerably. However, the HbA1c changes did not differ substantially between groups compared with the placebo group. Meanwhile, the FBS and total cholesterol did not change after administration of the probiotic.
Table 8.
Metabolic profiles before and after intervention in both groups.
3.8. GM Taxonomics between Groups
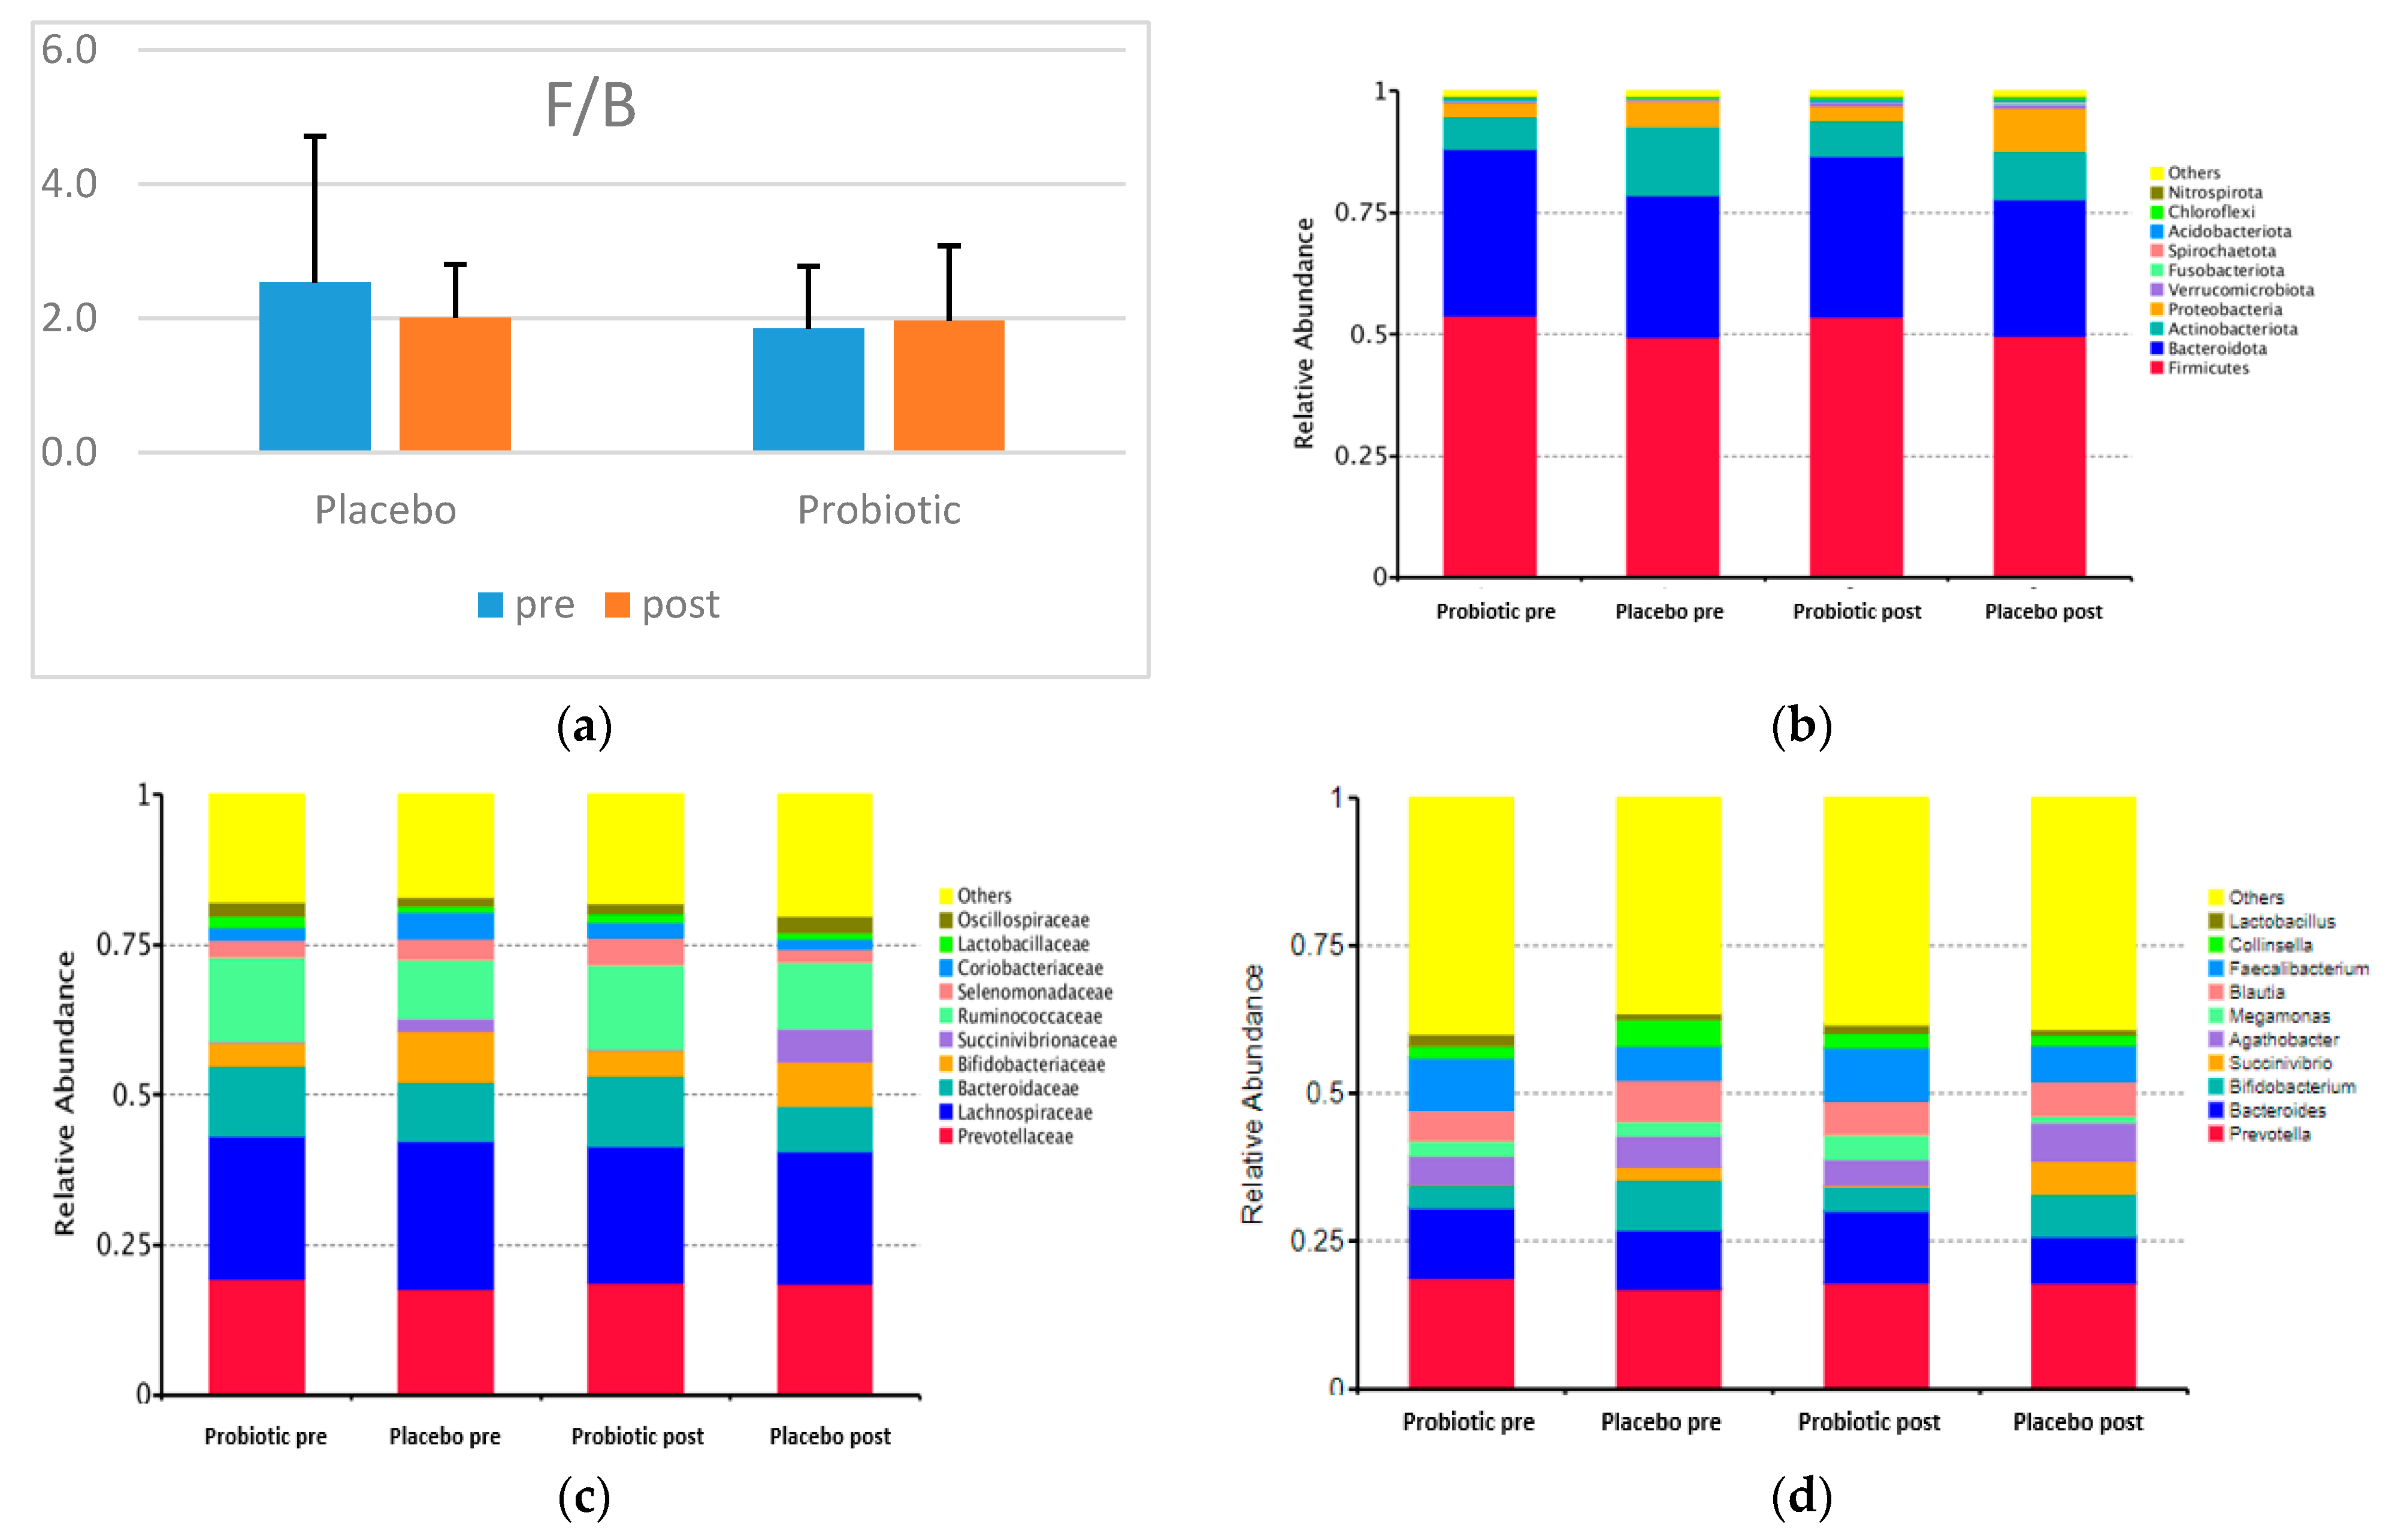
Figure 2 shows the F/B and the taxonomy (top 10 relative abundance) of each group. In both categories, Firmicutes, Bacteroidetes, Actinobacteria, and Proteobacteria dominated. A small proportion of the phyla Verrucomicrobiota, Fusobacteriota, Spirochaetota, Acidobacteriota, Chloroflexi, and Nitrospirota appeared in both groups.

Figure 2.
F/B and the top 10 relative abundances of GM composition between groups (a) F/B; (b) the top 10 relative abundances at the phylum level; (c) the top 10 relative abundances at the family level; (d) the top 10 relative abundances at the genus level.
The placebo and probiotics have no statistically significant effect at the phylum, family, and genus levels. Concerning the two dominant phyla in the two groups, the relative abundance of Firmicutes decreased, and that of Bacteroidetes decreased dramatically in the probiotic group. Nevertheless, the F/B in the probiotic group increased, and that of the placebo group decreased after the intervention (Figure 2).
The most dominant families in both groups were Prevotellaceae, Bacteroidaceae (Phylum Bacteroidetes), Bifidobacteriaceae, Coriobacteriaceae (Phylum Actinobacteria), Succinivibrionaceae (Phylum Proteobacteria), Lachnospiracea, Ruminococcaceae, Selenomonadaceae, Lactobacillaceae, and Oscillospiraceae (Phylum Firmicutes).
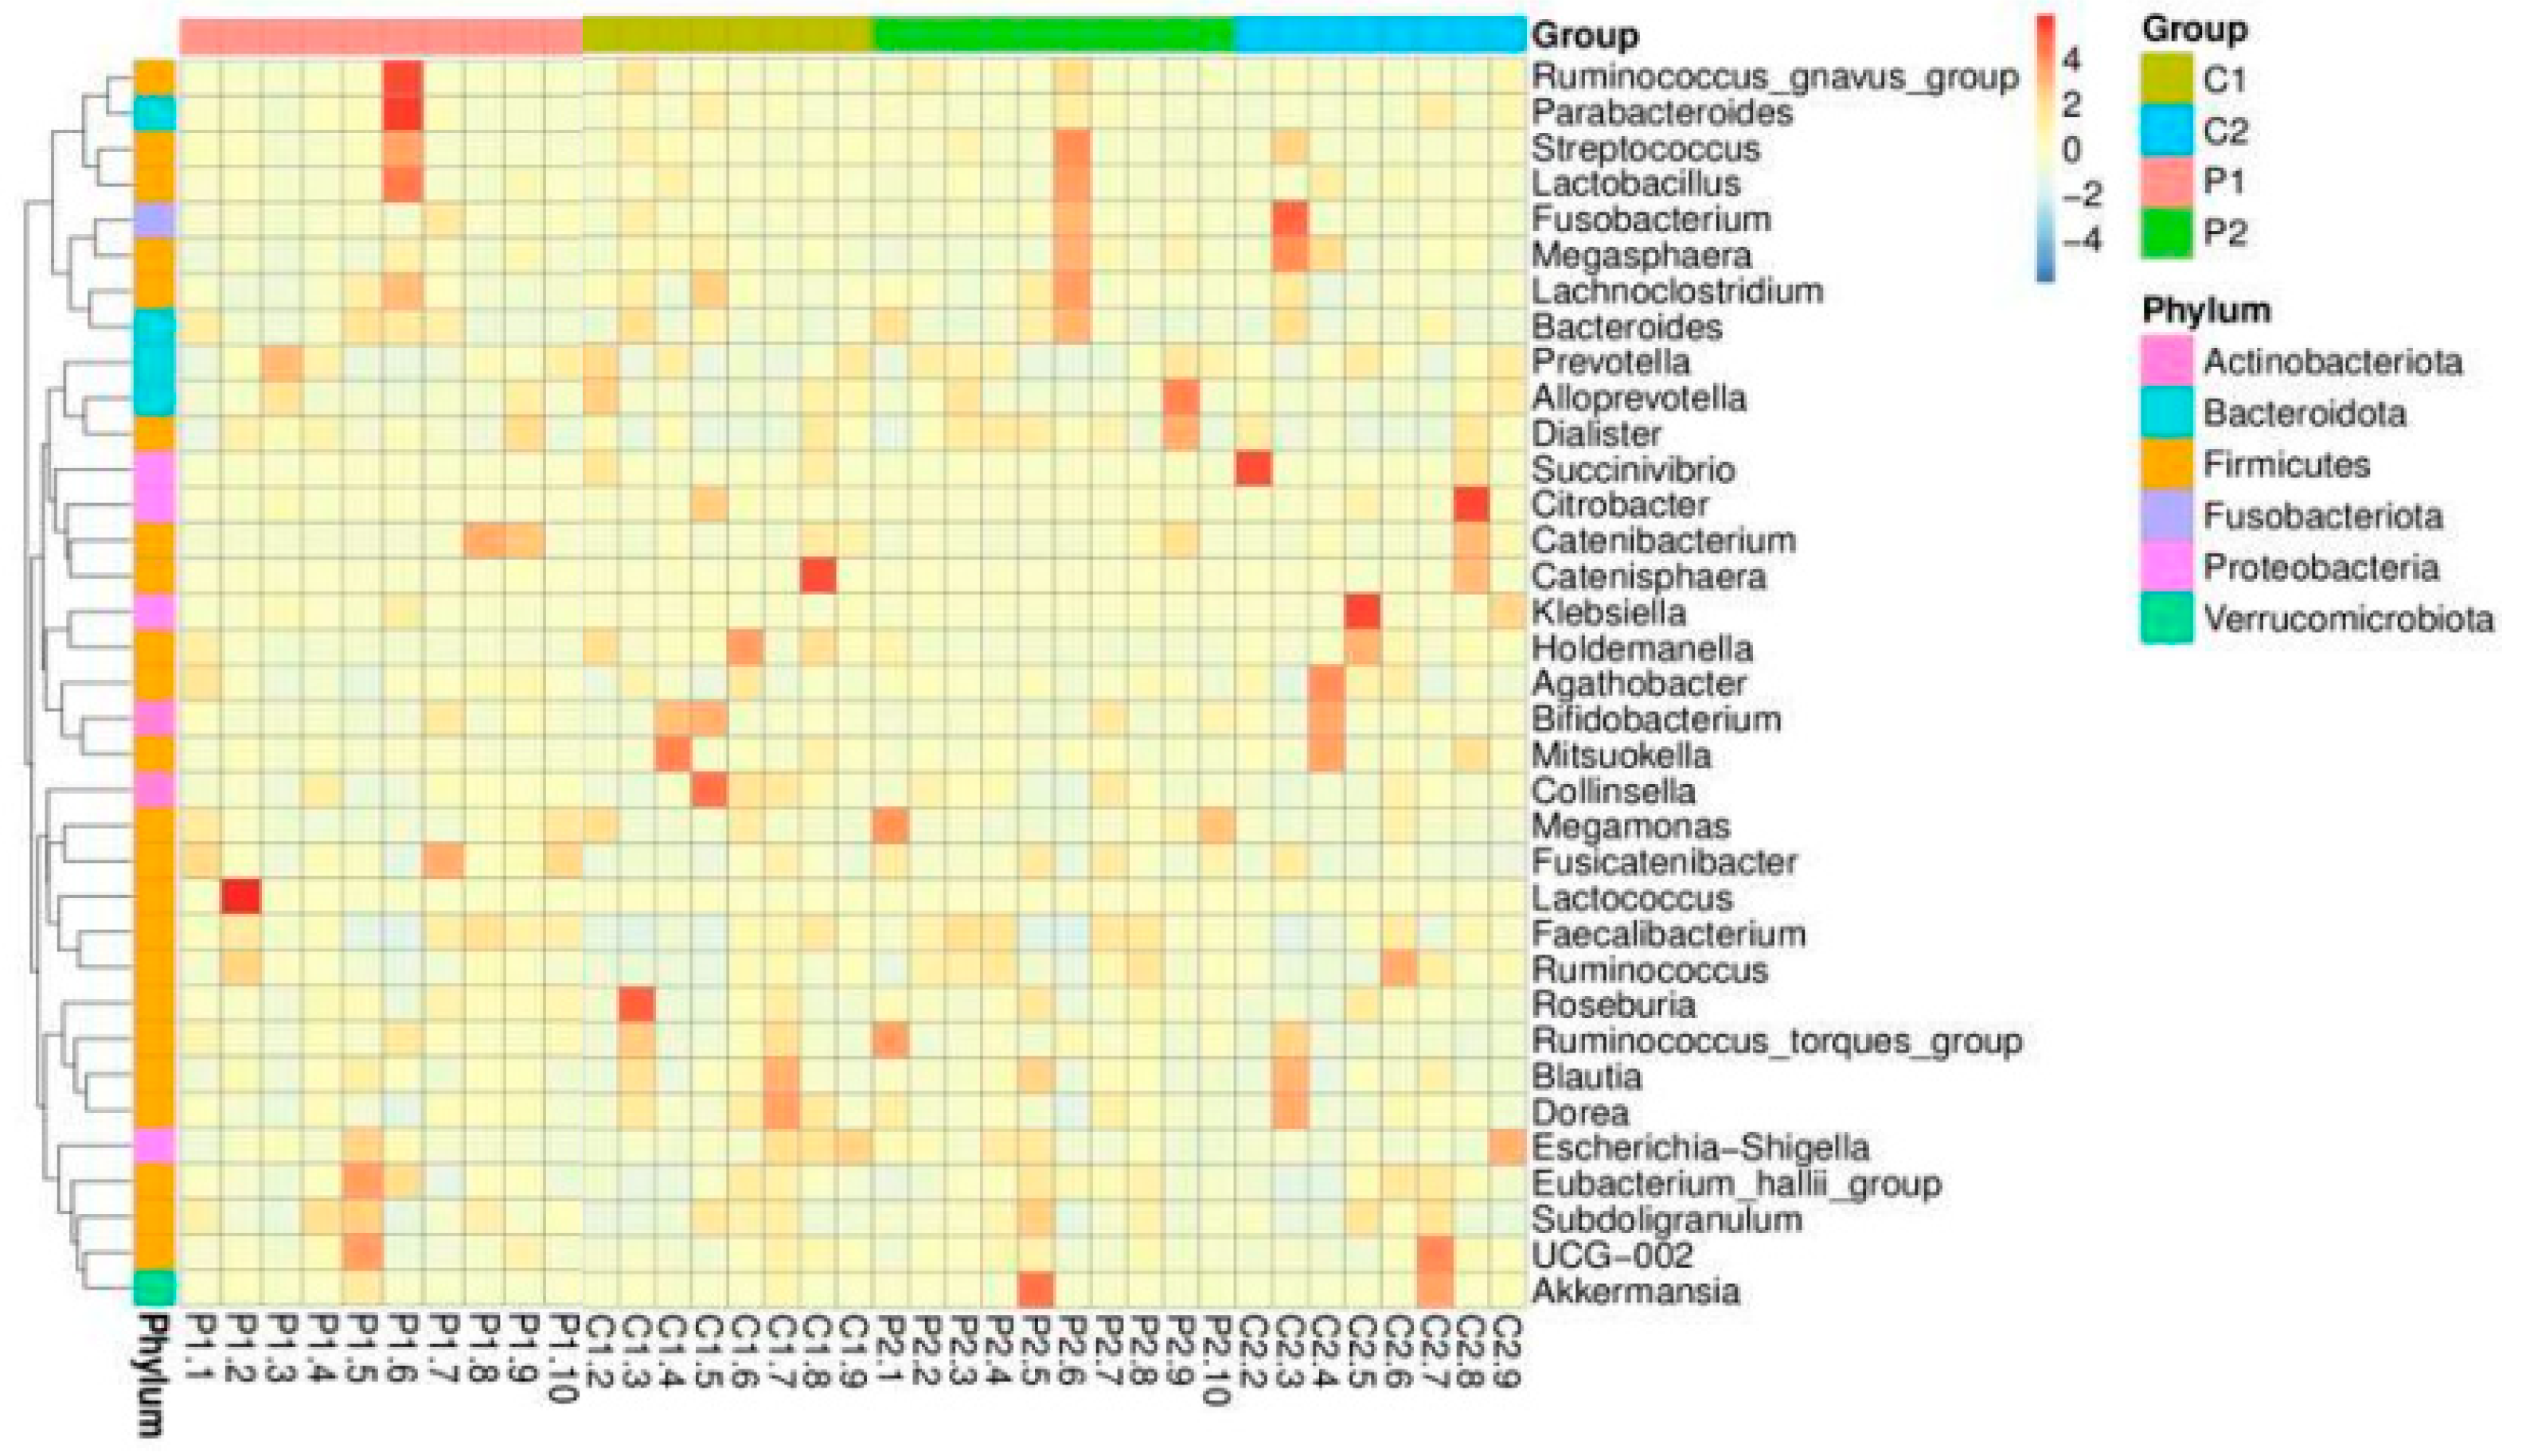
The top 10 relatively abundant genera in both groups were Prevotella, Bacteroides (Phylum Bacteroidetes), Bifidobacterium (Phylum Actinobacteria), Succinivibrio (Phylum Proteobacteria), Agathobacter, Megamonas, Blautia, Faecalibacterium, Collinsella, and Lactobacillus (Phylum Firmicutes). In both groups after the intervention, the abundance of Prevotella decreased, whereas those of Succinivibrio and Faecalibacterium increased. However, the abundance levels of Bacteroides, Bifidobacterium, Megamonas, Blautia, and Collinsella increased in the probiotic group but decreased in the placebo group. Meanwhile, Agathobacter and Lactobacillus were reduced in the probiotic group but increased in abundance in the placebo group. Not all genera were altered in response to probiotic use, according to a heatmap showing the top 35 relative abundances at the genus level for the placebo and probiotic groups (Figure 3).

Figure 3.
Heatmap of the top 35 relative abundances of each subject and group at the genus level.
3.9. GM Diversity and Composition
As illustrated in Figure 4a–d, the alpha diversity reflects the richness of the GM, as reflected by the observed species, Chao1, Simpson, and Shannon indices.
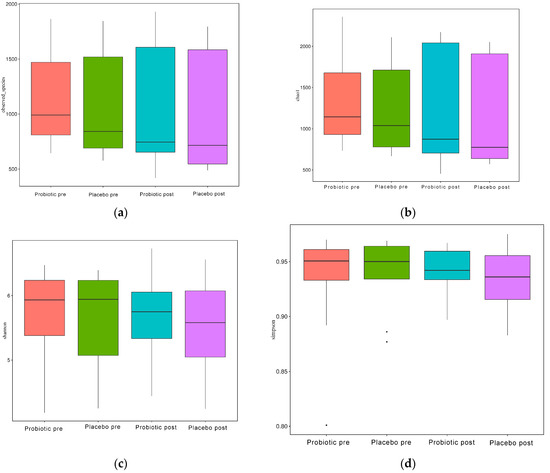
Figure 4.
Alpha diversity boxplot index. (a) Observed species, (b) Chao1, (c) Shannon, and (d) Simpson.
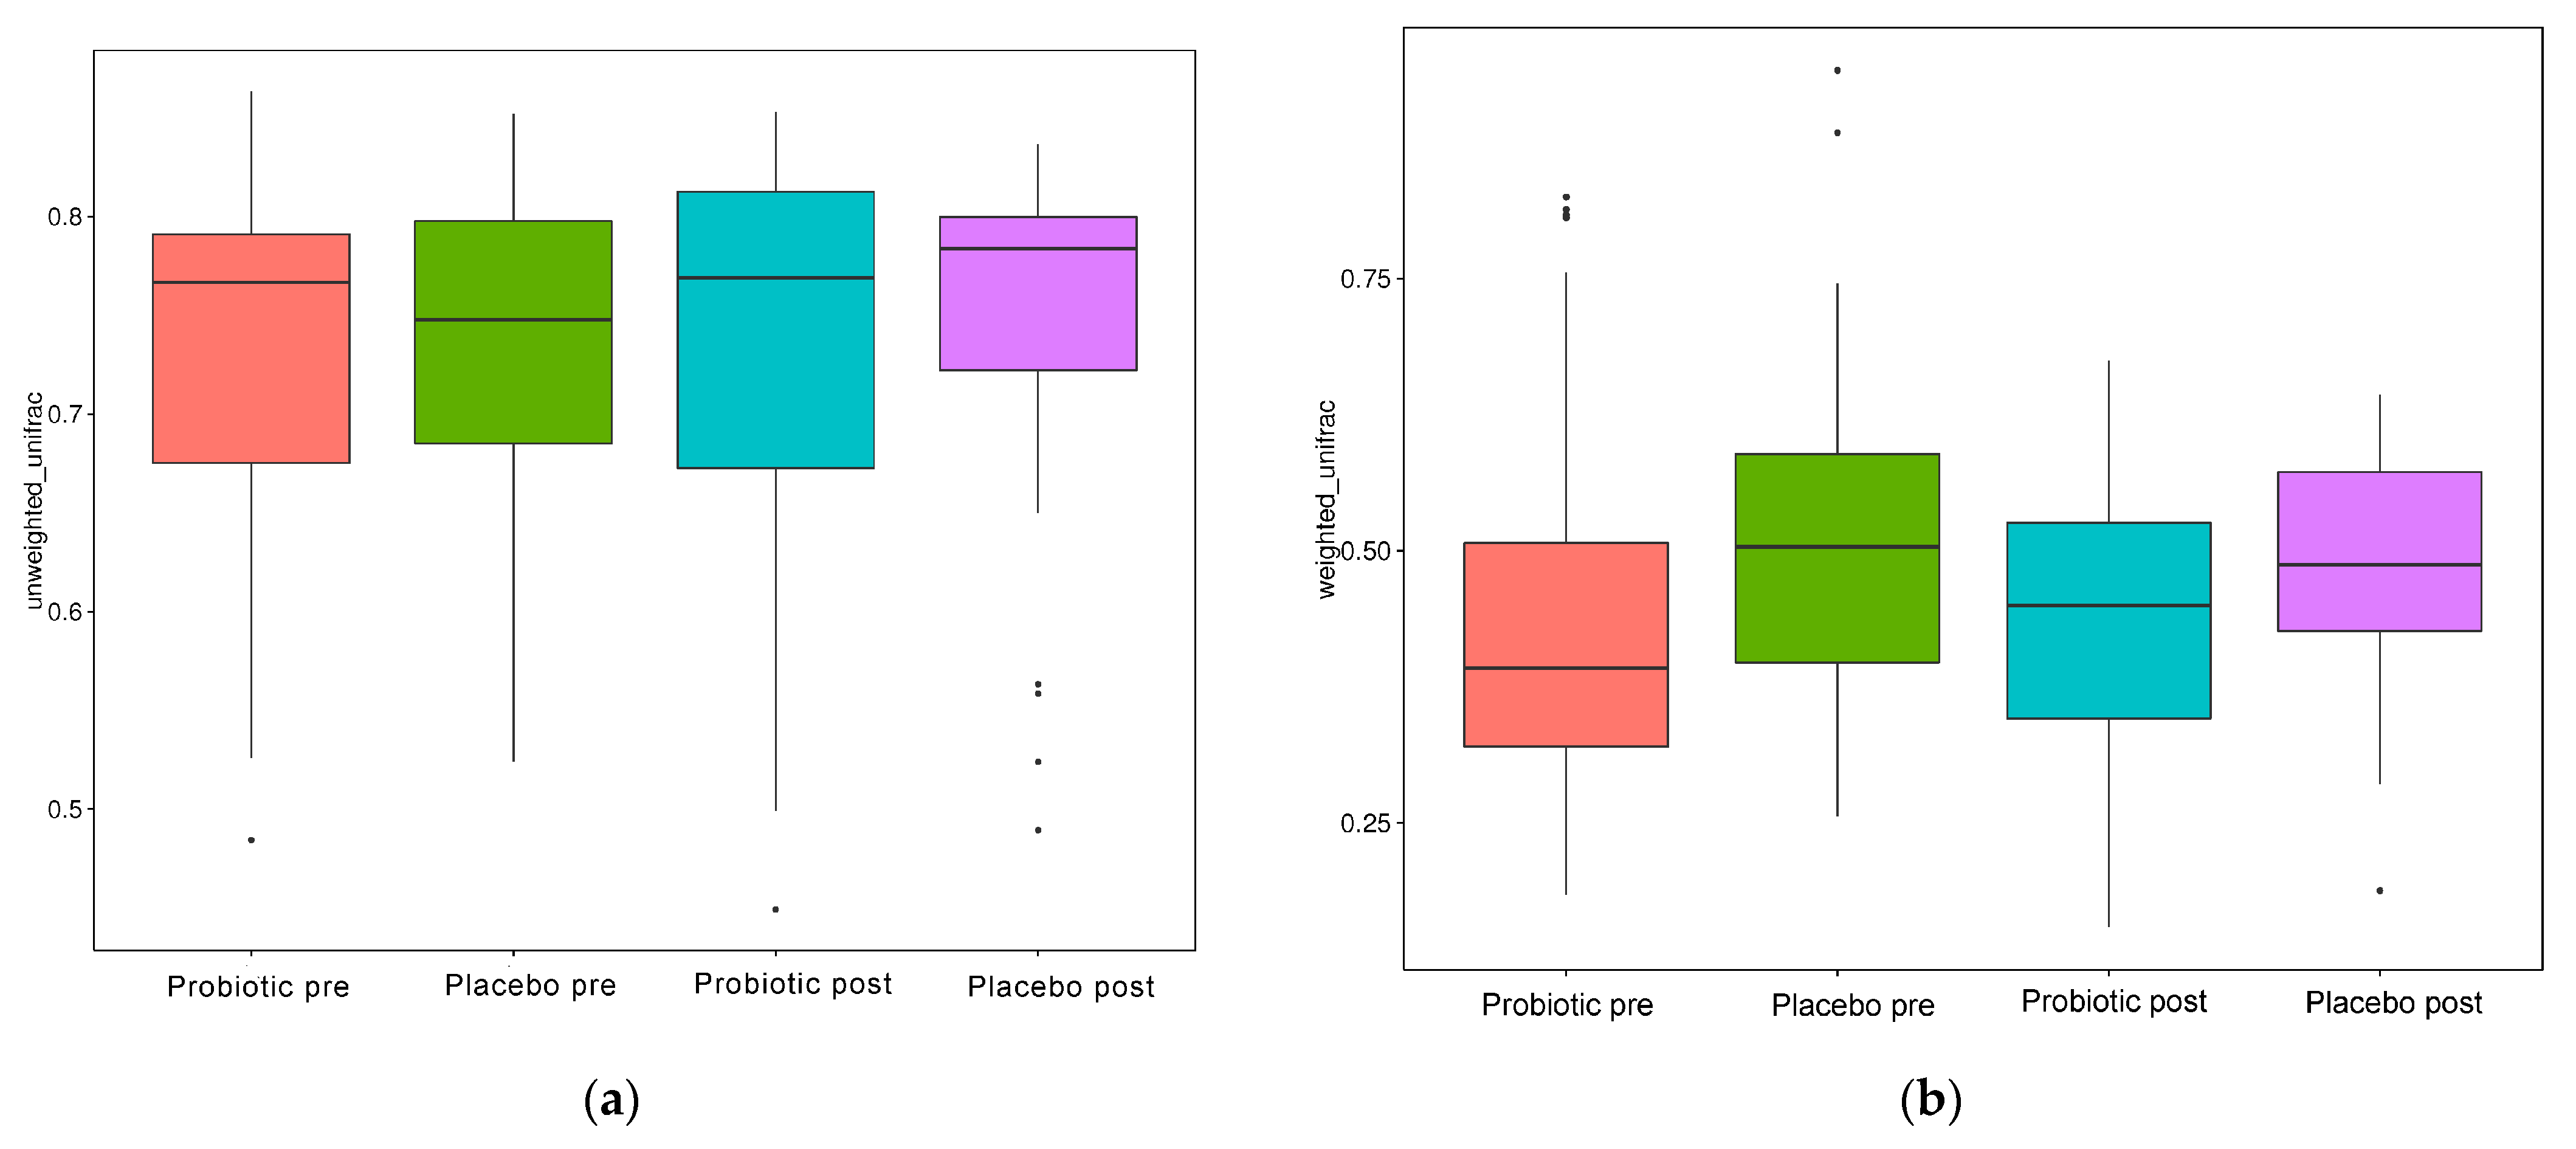
When evaluated using the Wilcoxon and Tukey tests, all the indices had no significant changes in the alpha diversity (p > 0.05). Beta diversity also reflects the variations in the GM, and it is determined using weighted and unweighted unifrac (Figure 5a,b). The unweighted unifrac was derived using the OTU phylogenetic connection, whereas the weighted unifrac was generated using the OTU abundance. After 11 weeks of dosing, no discernible difference was observed between the probiotic and placebo groups in beta diversity measurements (Figure 4a,b). Thus, probiotic intervention did not affect the composition and relative abundance of gut microbial communities in both groups, as determined by the Wilcoxon and Tukey tests (p > 0.05).
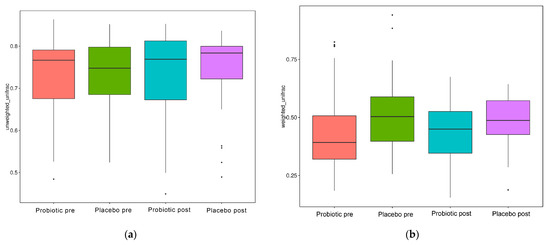
Figure 5.
Beta diversity index box plot. (a) Unweighted and (b) weighted unifrac.
3.10. Correlation of Metabolic Profiles with SCFA, GM (Genus Level), and Food Intake
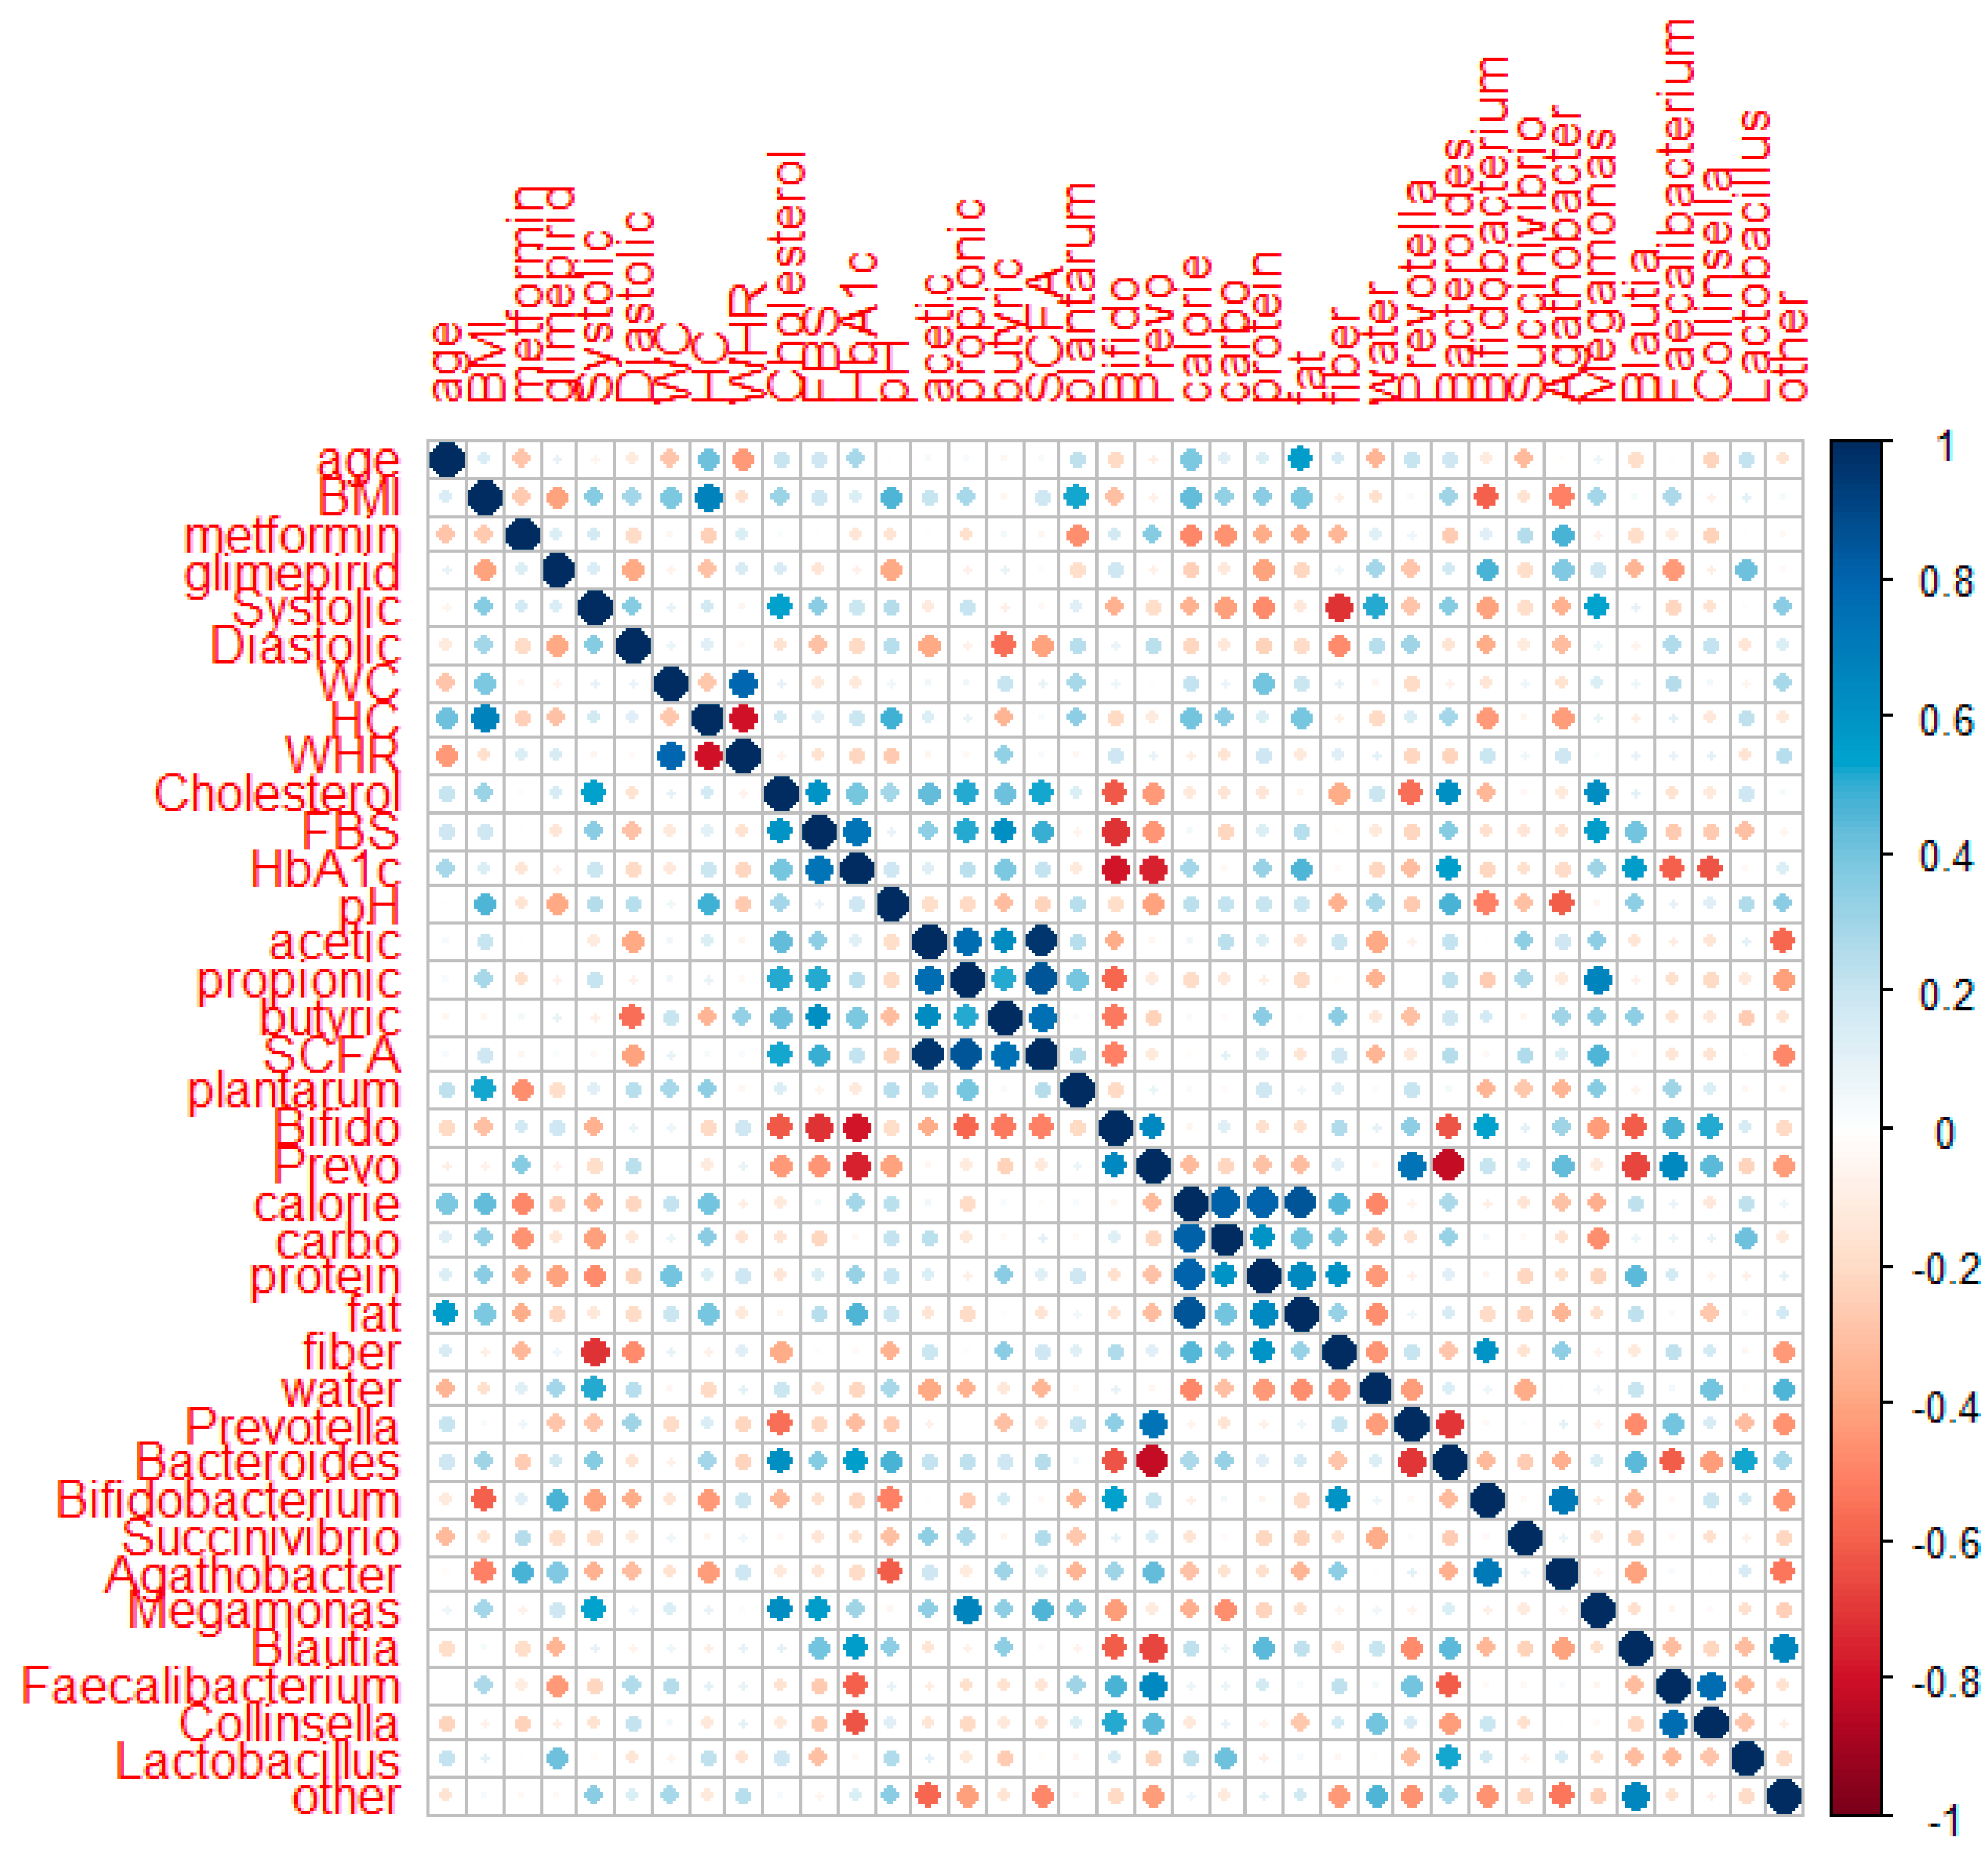
Spearman’s correlation analysis was applied to 18 subjects (8 subjects in the placebo group and 10 subjects in the probiotic group) who completed data collection for their metabolic profiles, SCFA, GM (genus level), and food intake after intervention. Figure 6 shows the correlation of the two parameters using corrplot.
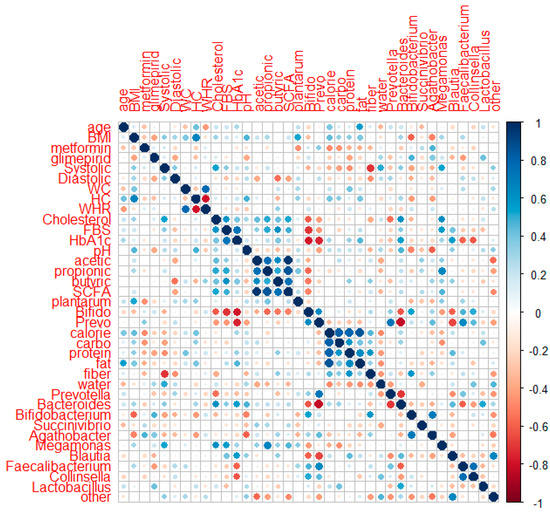
Figure 6.
Corrplot of correlation between metabolic profiles, SCFA, GM at the genus level, and food intake in the placebo and probiotic groups after probiotic intervention.
HbA1c had a negative association with the quantitative numbers of Bifidobacterium (r: −0.669, p: 0.002) and Prevotella quantitative number (r: −0.566, p: 0.014) and relative abundances of Succinivibrio (r: −0.491, p: 0.038), Faecalibacterium (r: −0.658, p: 0.003), and Collinsela (r: −0.640, p: 0.004). HbA1c had a slightly positive association with body weight (r: 0.406, p: 0.095) and systolic blood pressure (r: 0.443, p: 0.066) but a slightly negative link with the relative abundances of Bifidobacterium and Bacteroides (r: −0.425, p: 0.079; r: −0.427, p: 0.077, respectively). FBS revealed a small positive relationship with systolic blood pressure (r: 0.428, p: 0.076). The total cholesterol had a positive correlation with systolic blood pressure (r: 0.577, p: 0.012). Meanwhile, the amount of Bifidobacterium (r: −0.433, p: 0.073) and fiber consumption had a slightly negative connection (r: −0.464, p: 0.053). Systolic blood pressure had a favorable relationship with Megamonas (r: 0.515, p: 0.029) and water (r: 0.497, p: 0.036) but a negative relationship with carbohydrate and fiber intake (r: −0.534, p: 0.023; r: −0.569, p: 0.014). Systolic blood pressure had a slightly positive relationship with body weight (r: 0.432, p: 0.073), BMI (r: 0.419, p: 0.084), and Bacteroides (r: 0.450, p: 0.061) but a slightly negative relationship with the Bifidobacterium number (r: −0.464, p: 0.053). Diastolic pressure had a negative correlation with the total SCFA (r: −0.507, p: 0.032), whereas acetic acid and butyric acid had a slightly negative correlation (r: −0.438, p: 0.069; r: −0.451, p: 0.060, respectively).
Positive associations were observed between acetic acid and propionic acid (r: 0.606, p: 0.008), butyric acid (r: 0.639, p: 0.004), and total SCFA (r: 0.928, p: 0.000). Propionic acid demonstrated a negative correlation with the quantity of Bifidobacterium and the relative abundance of other genera (r: −0.604, p: 0.004; r: −0.476 p: 0.046). Propionic acid also demonstrated a marginally positive association with the number of L. plantarum (r: 0.46, p: 0.052) and a marginally negative correlation with water consumption (r: −0.404, p: 0.097). Butyric acid had a minor association with protein consumption (r: 0.420, p: 0.083). The connection between total SCFA and the abundance of other genera was negative (r: −0.523, p: 0.026). Fecal pH correlated positively with Bacteroides (r: 0.527, p: 0.025) and marginally negatively with Agathobacter (r: −0.422, p: 0.081). Calories, carbohydrates, and protein intake had a negative correlation with Megamonas (r: −0.633, p: 0.005; r: −0.706, p: 0.001; and r: −0.548, p: 0.018, respectively). Meanwhile, fat had a slightly negative correlation with Agathobacter (r: −0.461, p: 0.054).
4. Discussion
The probiotic L. plantarum Dad-13 lowered significantly the HbA1c levels in the probiotic group in this study. Owing to concerns about COVID-19 transmission, not all responders were able to have their blood samples obtained. In the meantime, the HbA1c levels in the placebo group fell slightly but not significantly. However, the FBS and total cholesterol did not change significantly in the probiotic and placebo groups. This finding is consistent with a meta-analysis research which revealed that probiotics significantly reduced HbA1c levels but not FBS nor lipid profiles [26]. Another meta-analysis of several clinical studies revealed that probiotics may effectively lower fasting insulin, hemoglobin A1c, and FBG while enhancing the effectiveness of homeostatic model assessment of insulin resistance [6].
In this study, however, probiotic consumption did not alter the alpha (Figure 4) and beta diversities (Figure 5). The probiotics modulated some beneficial bacteria that are implicated in glucose metabolism. HbA1c had a negative connection with the quantitative numbers of Bifidobacterium (r: −0.669, p: 0.002) and the quantitative numbers of Prevotella (r: −0.566, p: 0.014) and relative abundances of Succinivibrio (r: −0.491, p: 0.038), Faecalibacterium (r: −0.658, p: 0.003), and Collinsella (r: −0.640, p: 0.004). HbA1c had a slightly positive association with body weight (r: 0.406, p: 0.095) and systolic blood pressure (r: 0.443, p: 0.066) but a slightly negative link with relative Bifidobacterium and Bacteroides abundance (r: −0.425, p: 0.079; r: −0.427, p: 0.077, respectively) (Figure 6).
Bifidobacterium has been linked negatively to T2D in the majority of studies [2,27]. The synthesis of acetate and lactate during carbohydrate fermentation, in which organic acids can be transformed into butyrate by other colon bacteria through cross-feeding interactions, is a significant Bifidobacterium function that supports gut homeostasis and host health [28]. This result is in line with that of another study that observed a reduction in Succinivibrio and Faecalibacterium among diabetic individuals compared with healthy controls [29]. Salamon [30] also observed that Faecalibacterium and Collinsella had a negative correlation with HbA1c. A prior study of Indonesian women showed that Faecalibacterium and Prevotella dominated in the non-T2D group [31]. Prevotella and Succinivibrio are high-polysaccharide-fermenting bacteria [32]. In five human case-control investigations, Faecalibacterium prausnitzii exhibited a negative association with T2D [27]. Faecalibacterium prausnitzii is one of the anaerobic bacteria that enables the frequent observation of butyrate in healthy human guts. By inhibiting histone deacetylase 1, which is specifically targeted by butyrate, the interleukin (IL)-6/signal transducer and activator of transcription 3/IL-17 pathway may be suppressed, which reduces inflammation and eventually enhances insulin sensitivity [26]. Meanwhile, Bacteroides is positively associated with the disease in some cases [33], whereas some reports suggest a negative association [3].
The F/B in the probiotic group increased, and that in the placebo group decreased after the intervention. Probiotics improved the dysbiosis in T2D patients because the F/B, which confirms dysbiosis in T2D individuals, decreased significantly. A prior study showed that T2D patients had a considerably greater F/B than non-T2D patients [30,31]. Previous research revealed that probiotics Lactobacilli and Bifidobacteria can specifically alter the intestinal microbiota (increase and reduce the levels of good and bad bacteria, respectively) and modulate metabolites, such as SCFA, trimethylamine N-oxide, bile acids, and indole propionic acids, which are linked to the regulation of glucose metabolism [34] and host immune response and play a beneficial role in the treatment of T2D [35].
The SCFAs are produced by intestinal gut bacteria via the fermentation of complex carbohydrates. These products may play a role in metabolic and energy homeostasis either directly or indirectly [36]. Numerous studies have shown that SCFAs influence gene expression, proliferation, and differentiation and act as substrates for gluconeogenesis and lipogenesis. The pharmacological effects of SCFAs on G protein-coupled receptors include the modulation of glucagon-like peptide 1, which is linked to improved insulin production and decreased blood glucose levels [36,37]. Acetic, propionic, and butyric acid concentrations and the total SCFA levels were not substantially different between the placebo and probiotic groups, but the probiotic group’s SCFA levels showed an increase.
After the intervention, neither group’s macronutrient, fiber, nor water intake changed significantly. In both groups, the only protein relative intake was in the range of World Health Organization (WHO) recommendations (10% to 15%). Meanwhile, the relative carbohydrate intake was lower (55% to 75%), and the fat relative ratio was higher than WHO recommendations (15–30%). Calories, carbohydrates, and protein intake had a negative correlation with Megamonas (r: −0.633, p: 0.005; r: −0.706, p: 0.001; and r: −0.548, p: 0.018, respectively). Meanwhile, fat had a slightly negative correlation with Agathobacter (r: −0.461, p: 0.054). Megamonas is a member of the Firmicutes and produces acetic, propionic, and lactic acids after fermenting different types of carbohydrates. Megamonas is important for obtaining organic nutrients. Healthy Yao nationals in China have low levels of Megamonas in their intestines, and this condition is connected to the unique healthy dietary practices of the ethnic group [38,39]. Gram-positive, anaerobic bacteria belonging to the Lachnospiraceae family are referred to as Agathobacter species. Butyrate, acetate, hydrogen, and lactate are the primary fermentation byproducts [40]. Healthy and high-fiber foods, such rice, cassava, tofu, and tempeh, were assessed as the main sources of calories, carbs, and protein in this study.
The consumption of probiotic powder L. plantarum Dad-13 did not show significant changes in weight, BMI, waist circumference, and hip circumference. This finding contrasts with that of a prior study, which found a significant decrease (p < 0.05) in the body weight and BMI of the overweight subjects after 90 days of L. plantarum Dad-13 ingestion, especially in the female subjects [13]. Compared with the placebo group, high consumption of L. casei for two months effectively reduced weight, BMI, and waist circumference in diabetic individuals [41]. However, a meta-analysis of 17 trials showed that probiotics did not change the BMI [42].
The systolic and diastolic blood pressures of T2D patients did not change after the consumption of the L. plantarum Dad-13 powder. The meta-analysis of 14 trials revealed that systolic and diastolic blood pressures decreased significantly [42]. However, the meta-analysis of five studies revealed that neither the usage of a single species probiotic nor the use of co-supplements resulted in a significant decrease in systolic blood pressure. A noticeable decrease in the systolic pressure was observed in multiple species of probiotics [35].
The L. plantarum Dad-13 treatment increased the probiotic group’s frequency of defecation. Based on the rise in L. plantarum concentration in the probiotic group, L. plantarum Dad-13 may survive in the digestive tract. However, no appreciable variations were noticed in the proportions of Prevotella and Bifidobacterium in either group. A limitation of this study was its small sample size. Confounding factors, such as the type and dosage of diabetes medication, might have also affected the results.
5. Conclusions
In conclusions, an 11-week intervention with L. plantarum Dad-13 powder improved the HbA1c level in the probiotic group. Probiotics may modulate some beneficial bacteria that promote metabolites, including SCFA alignment with the increment in total SCFA, acetic, propionic, and butyric acids.
Author Contributions
N.R.: investigation, formal analysis, and writing—original draft. A.M. and M.J.: methodology and writing—review and editing. E.S.R.: conceptualization, supervision, and writing—review and editing. All authors have read and agreed to the published version of the manuscript.
Funding
This study was supported financially by the Ministry of Research and Technology (No. 7290/UN1/DITLIT/DIT-LIT/PT/2021), Grant for Dissertation of Doctorate Candidate (No. 27/E1/KPT/2020), and the Ministry of Education, Culture, Research and Technology of the Republic of Indonesia through the University Center of Excellence for Research and Application on Integrated Probiotic Industry, Universitas Gadjah Mada, Yogyakarta, Indonesia with grant number of 278/E5/PG.02.00.PT/2022 and contract number of 6648/UN1/DITLIT/DIT-LIT/PT/2021.
Institutional Review Board Statement
The study was conducted in accordance with the guidelines of the Declaration of Helsinki and approved by the Ethics Committee of the Faculty of Medicine, Public Health, and Nursing, Universitas Gadjah Mada (protocol code: KE/FK/1356/EC/2019; Approval date: 18 November 2019).
Informed Consent Statement
The participants signed an informed consent and assent form before the study.
Data Availability Statement
The data presented in this study are available on request from the corresponding author. The data are not publicly available due to privacy protection.
Acknowledgments
The authors would like to thank the Sleman Public Health Office for the permission to conduct the research and their guidance. The authors would also like to thank the study participants.
Conflicts of Interest
The authors declare no conflict of interest.
References
- Saeedi, P.; Petersohn, I.; Salpea, P.; Malanda, B.; Karuranga, S.; Unwin, N.; Colagiuri, S.; Guariguata, L.; Motala, A.A.; Ogurtsova, K.; et al. Global and regional diabetes prevalence estimates for 2019 and projections for 2030 and 2045: Results from the International Diabetes Federation Diabetes Atlas, 9th edition. Diabetes Res. Clin. Pract. 2019, 157, 107843. [Google Scholar] [CrossRef] [PubMed]
- Al-Jameel, S.S. Association of diabetes and microbiota: An update. Saudi J. Biol. Sci. 2021, 28, 4446–4454. [Google Scholar] [CrossRef]
- Yamaguchi, Y.; Adachi, K.; Sugiyama, T.; Shimozato, A.; Ebi, M.; Ogasawara, N.; Funaki, Y.; Goto, C.; Sasaki, M.; Kasugai, K. Association of intestinal microbiota with metabolic markers and dietary habits in patients with type 2 diabetes. Digestion 2016, 94, 66–72. [Google Scholar] [CrossRef]
- Qin, J.; Li, Y.; Cai, Z.; Li, S.; Zhu, J.; Zhang, F.; Liang, S.; Zhang, W.; Guan, Y.; Shen, D.; et al. A metagenome-wide association study of gut microbiota in type 2 diabetes. Nature 2012, 490, 55–60. [Google Scholar] [CrossRef] [PubMed]
- Zhang, L.; Chu, J.; Hao, W.; Zhang, J.; Li, H.; Yang, C.; Yang, J.; Chen, X.; Wang, H. Gut microbiota and type 2 diabetes mellitus: Association, mechanism, and translational applications. Mediat. Inflamm. 2021, 2021, 5110276. [Google Scholar] [CrossRef] [PubMed]
- Tao, Y.W.; Gu, Y.L.; Mao, X.Q.; Zhang, L.; Pei, Y.F. Effects of probiotics on type II diabetes mellitus: A meta-analysis. J. Transl. Med. 2020, 18, 30. [Google Scholar] [CrossRef]
- Ruan, Y.; Sun, J.; He, J.; Chen, F.; Chen, R.; Chen, H. Effect of probiotics on glycemic control: A systematic review and meta-analysis of randomized, controlled trials. PLoS ONE 2015, 10, e0132121. [Google Scholar] [CrossRef]
- Rahayu, E.S.; Yogeswara, A.; Mariyatun, M.; Windiarti, L.; Utami, T.; Watanabe, K. Molecular characteristics of indigenous probiotic strains from Indonesia. Int. J. Probiotics Prebiotics 2016, 11, 109–116. [Google Scholar]
- Rahayu, E.S.; Cahyanto, M.N.; Sarwoko, M.A.; Haryono, P.; Windiarti, L.; Sutriyanto, J.; Kandarina, I.; Nurfiani, S.; Zulaichah, E.; Utami, T. Effect of consumption of fermented milk indigenous probiotic Lactobacillus plantarum Dad-13 on the fecal microbiota of healthy Indonesian volunteers. Int. J. Probiotics Prebiotics 2016, 11, 91–98. [Google Scholar]
- Banin, M.M.; Utami, T.; Cahyanto, M.N.; Widada, J.; Rahayu, E.S. Effects of consumption of probiotic powder containing Lactobacillus plantarum Dad-13 on fecal bacterial population in school-age children in Indonesia. Int. J. Probiotics Prebiotics 2019, 14, 1–8. [Google Scholar]
- Rahayu, E.S.; Utami, T.; Mariyatun, M.; Hasan, P.N.; Kamil, R.Z.; Setyawan, R.H.; Pamungkaningtyas, F.H.; Harahap, I.A.; Wiryohanjoyo, D.V.; Pramesi, P.C.; et al. Gut microbiota profile in healthy Indonesians. World J. Gastroenterol. 2019, 25, 1478–1491. [Google Scholar] [CrossRef] [PubMed]
- Kamil, R.Z.; Murdiati, A.; Juffrie, M.; Rahayu, E.S. Gut microbiota modulation of moderate undernutrition in infants through gummy Lactobacillus plantarum Dad-13 consumption: A randomized double-blind controlled trial. Nutrients 2022, 14, 1049. [Google Scholar] [CrossRef] [PubMed]
- Rahayu, E.S.; Mariyatun, M.; Manurung, N.E.P.; Hasan, P.N.; Therdtatha, P.; Mishima, R.; Komalasari, H.; Mahfuzah, N.A.; Pamungkaningtyas, F.H.; Yoga, W.K.; et al. Effect of probiotic Lactobacillus plantarum Dad-13 powder consumption on the gut microbiota and intestinal health of overweight adults. World J. Gastroenterol. 2021, 126, 107–128. [Google Scholar] [CrossRef]
- Kamil, R.Z.; Murdiati, A.; Juffrie, M.; Nakayama, J.; Rahayu, E.S. Gut microbiota and short-chain fatty acid profile between normal and moderate malnutrition children in Yogyakarta, Indonesia. Microorganisms 2021, 9, 127. [Google Scholar] [CrossRef] [PubMed]
- Nakayama, J.; Watanabe, K.; Jiang, J.; Matsuda, K.; Chao, S.-H.; Haryono, P.; La-Ongkham, O.; Sarwoko, M.-A.; Sujaya, I.N.; Zhao, L.; et al. Diversity in gut bacterial community of school-age children in Asia. Sci. Rep. 2015, 5, 8397. [Google Scholar] [CrossRef]
- Matsuda, K.; Tsuji, H.; Asahara, T.; Matsumoto, K.; Takada, T.; Nomoto, K. Establishment of an analytical system for the human fecal microbiota, based on reverse transcription-quantitative PCR targeting of multicopy rRNA molecules. Appl. Environ. Microbiol. 2009, 75, 1961–1969. [Google Scholar] [CrossRef]
- Matsuki, T.; Watanabe, K.; Fujimoto, J.; Miyamoto, Y.; Takada, T.; Matsumoto, K.; Oyaizu, H.; Tanaka, R. Development of 16S rRNA-gene-targeted group-specific primers for the detection and identification of predominant bacteria in human feces. Appl. Environ. Microbiol. 2002, 68, 5445–5451. [Google Scholar] [CrossRef]
- Bokulich, N.A.; Subramanian, S.; Faith, J.J.; Gevers, D.; Gordon, J.I.; Knight, R.; Mills, D.A.; Caporaso, J.G. Quality-filtering vastly improves diversity estimates from illumina amplicon sequencing. Nat. Methods 2013, 10, 57–59. [Google Scholar] [CrossRef]
- Caporaso, J.G.; Kuczynski, J.; Stombaugh, J.; Bittinger, K.; Bushman, F.D.; Costello, E.K.; Fierer, N.; Gonzalez Peña, A.; Goodrich, J.K.; Gordon, J.I.; et al. QIIME allows analysis of high-throughput community sequencing data. Nat. Methods 2011, 7, 335–336. [Google Scholar] [CrossRef]
- Edgar, R.C.; Haas, B.J.; Clemente, J.C.; Quince, C.; Knight, R. UCHIME improves sensitivity and speed of chimera detection. Bioinformatics 2011, 27, 2194–2200. [Google Scholar] [CrossRef]
- Haas, B.J.; Gevers, D.; Earl, A.M.; Feldgarden, M.; Ward, D.V.; Giannoukos, G.; Ciulla, D.; Tabbaa, D.; Highlander, S.K.; Sodergren, E.; et al. Chimeric 16S rRNA sequence formation and detection in Sanger and 454-pyrosequenced PCR amplicons. Genome Res. 2011, 21, 494–504. [Google Scholar] [CrossRef] [PubMed]
- Wang, Q.; Garrity, G.M.; Tiedje, J.M.; Cole, J.R. Naïve Bayesian classifier for rapid assignment of rRNA sequences into the new bacterial taxonomy. Appl. Environ. Microbiol. 2007, 73, 5261–5267. [Google Scholar] [CrossRef] [PubMed]
- Edgar, R.C. MUSCLE: Multiple sequence alignment with high accuracy and high throughput. Nucleic Acids Res. 2004, 32, 1792–1797. [Google Scholar] [CrossRef] [PubMed] [Green Version]
- Quast, C.; Pruesse, E.; Yilmaz, P.; Gerken, J.; Schweer, T.; Yarza, P.; Peplies, J.; Glöckner, F.O. The SILVA ribosomal RNA gene database project: Improved data processing and web-based tools. Nucleic Acids Res. 2013, 41, 590–596. [Google Scholar] [CrossRef]
- White, J.R.; Nagarajan, N.; Pop, M. Statistical methods for detecting differentially abundant features in clinical metagenomic samples. PLoS Comput. Biol. 2009, 5, e1000352. [Google Scholar] [CrossRef]
- Zhou, L.; Zhang, M.; Wang, Y.; Dorfman, R.G.; Liu, H.; Yu, T.; Chen, X.; Tang, D.; Xu, L.; Yin, Y.; et al. Faecalibacterium prausnitzii produces butyrate to maintain Th17/Treg balance and to ameliorate colorectal colitis by inhibiting histone deacetylase 1. Inflamm. Bowel Dis. 2018, 24, 1926–1940. [Google Scholar] [CrossRef]
- Gurung, M.; Li, Z.; You, H.; Rodrigues, R.; Jump, D.B.; Morgun, A.; Shulzhenko, N. Role of gut microbiota in type 2 diabetes pathophysiology. EBioMedicine 2020, 51, 102590. [Google Scholar] [CrossRef]
- Rivière, A.; Selak, M.; Lantin, D.; Leroy, F.; De Vuyst, L. Bifidobacteria and butyrate-producing colon bacteria: Importance and strategies for their stimulation in the human gut. Front. Microbiol. 2016, 7, 979. [Google Scholar] [CrossRef]
- Almugadam, B.S.; Liu, Y.; Chen, S.-M.; Wang, C.-H.; Shao, C.-Y.; Ren, B.-W.; Tang, L.; Hatziagelaki, E. Alterations of gut microbiota in type 2 diabetes individuals and the confounding effect of antidiabetic agents. J. Diabetes Res. 2020, 2020, 7253978. [Google Scholar] [CrossRef]
- Salamon, D.; Sroka-Oleksiak, A.; Kapusta, P.; Szopa, M.; Mrozińska, S.; Ludwig-Słomczyńska, A.H.; Wołkow, P.P.; Bulanda, M.; Klupa, T.; Małecki, M.T.; et al. Characteristics of gut microbiota in adult patients with type 1 and type 2 diabetes based on next-generation sequencing of the 16S rRNA gene fragment. Pol. Arch. Intern. Med. 2018, 128, 336–343. [Google Scholar] [CrossRef]
- Rustanti, N.; Murdiati, A.; Juffrie, M.; Sutriswati, E.S. Comparison of food habits and gut microbiota in type 2 diabetes and non-diabetic women in Yogyakarta, Indonesia. 2022; 1–18, submitted. [Google Scholar]
- Alou, M.T.; Lagier, J.; Raoult, D. Diet influence on the gut microbiota and dysbiosis related to nutritional disorders. Hum. Microbiome J. 2016, 1, 3–11. [Google Scholar] [CrossRef]
- Murphy, R.; Tsai, P.; Jüllig, M.; Liu, A.; Plank, L.; Booth, M. Differential changes in gut microbiota after gastric bypass and sleeve gastrectomy bariatric surgery vary according to diabetes remission. Obes. Surg. 2017, 27, 917–925. [Google Scholar] [CrossRef] [PubMed]
- Sircana, A.; Framarin, L.; Leone, N.; Berrutti, M.; Castellino, F.; Parente, R.; De Michieli, F.; Paschetta, E.; Musso, G. Altered gut microbiota in type 2 diabetes: Just a coincidence? Curr. Diabetes Rep. 2018, 18, 98. [Google Scholar] [CrossRef] [PubMed]
- Liang, T.; Wu, L.; Xi, Y.; Li, Y.; Xie, X.; Fan, C.; Yang, L.; Yang, S.; Chen, X.; Zhang, J.; et al. Probiotics supplementation improves hyperglycemia, hypercholesterolemia, and hypertension in type 2 diabetes mellitus: An update of meta-analysis. Crit. Rev. Food Sci. Nutr. 2021, 61, 670–688. [Google Scholar] [CrossRef]
- He, J.; Zhang, P.; Shen, L.; Niu, L.; Tan, Y.; Chen, L.; Zhao, Y.; Bai, L.; Hao, X.; Li, X.; et al. Short-chain fatty acids and their association with signalling pathways in inflammation, glucose and lipid metabolism. Int. J. Mol. Sci. 2020, 21, 6356. [Google Scholar] [CrossRef]
- Kim, M.H.; Kang, S.G.; Park, J.H.; Yanagisawa, M.; Kim, C.H. Short-chain fatty acids activate GPR41 and GPR43 on intestinal epithelial cells to promote inflammatory responses in mice. Gastroenterology 2013, 145, 396–406. [Google Scholar] [CrossRef]
- Nuli, R.; Cai, J.; Kadeer, A.; Zhang, Y.; Mohemaiti, P. Integrative analysis toward different glucose tolerance-related gut microbiota and diet. Front. Endocrinol. 2019, 10, 295. [Google Scholar] [CrossRef]
- Liao, M.; Xie, Y.; Mao, Y.; Lu, Z.; Tan, A.; Wu, C.; Zhang, Z.; Chen, Y.; Li, T.; Ye, Y.; et al. Comparative analyses of fecal microbiota in Chinese isolated Yao population, minority Zhuang and rural Han by 16sRNA sequencing. Sci. Rep. 2018, 8, 1142. [Google Scholar] [CrossRef]
- Hua, X.; Zhu, J.; Yang, T.; Guo, M.; Li, Q.; Chen, J.; Li, T. The gut microbiota and associated metabolites are altered in sleep disorder of children with autism spectrum disorders. Front. Psychiatry 2020, 11, 855. [Google Scholar] [CrossRef]
- Khalili, L.; Alipour, B.; Jafarabadi, M.A.; Hassanalilou, T.; Abbasi, M.M. Probiotic assisted weight management as a main factor for glycemic control in patients with type 2 diabetes: A randomized controlled trial. Diabetol. Metab. Syndr. 2019, 11, 5. [Google Scholar] [CrossRef]
- Kocsis, T.; Molnár, B.; Németh, D.; Hegyi, P.; Szakács, Z.; Bálint, A.; Garami, A.; Soós, A.; Márta, K.; Solymár, M. Probiotics have beneficial metabolic effects in patients with type 2 diabetes mellitus: A meta-analysis of randomized clinical trials. Sci. Rep. 2020, 10, 11787. [Google Scholar] [CrossRef]

Publisher’s Note: MDPI stays neutral with regard to jurisdictional claims in published maps and institutional affiliations. |
© 2022 by the authors. Licensee MDPI, Basel, Switzerland. This article is an open access article distributed under the terms and conditions of the Creative Commons Attribution (CC BY) license (https://creativecommons.org/licenses/by/4.0/).