Abstract
Solid-state fermentation is known to improve plant-based feed nutritional quality; however, the association between microbes and metabolite production in fermented feed remains unclear. We inoculated corn–soybean–wheat bran (CSW) meal feed with Bacillus licheniformis Y5-39, Bacillus subtilis B-1, and lactic acid bacteria RSG-1. Then, 16S rDNA sequencing and untargeted metabolomic profiling were applied to investigate changes in the microflora and metabolites, respectively, and their integrated correlations during fermentation were assessed. The results indicated that trichloroacetic acid soluble protein levels showed a sharp increase, while glycinin and β-conglycinin levels showed a sharp decrease in the fermented feed, as confirmed by sodium dodecyl sulfate–polyacrylamide gel electrophoresis. Pediococcus, Enterococcus, and Lactobacillus were predominant in the fermented feed. Overall, 699 significantly different metabolites were identified before and after fermentation. Arginine and proline, cysteine and methionine, and phenylalanine and tryptophan metabolism were the key pathways, with arginine and proline metabolism being the most important pathway in the fermentation process. By analyzing the correlation between the microbiota and metabolite production, lysyl–valine and lysyl–proline levels were found to be positively correlated with Enterococcus and Lactobacillus abundance. However, Pediococcus was positively correlated with some metabolites contributing to nutritional status and immune function. According to our data, Pediococcus, Enterococcus, and Lactobacillus mainly participate in protein degradation, amino acid metabolism, and lactic acid production in fermented feed. Our results provide new insights into the dynamic changes in metabolism that occurred during the solid-state fermentation of corn–soybean meal feed using compound strains and should facilitate the optimization of fermentation production efficiency and feed quality.
1. Introduction
Corn–soybean–wheat bran (CSW) meal feed, which is widely used for animal feed, contains diverse antinutritional factors, such as soybean antigenic proteins (glycinin and β-conglycinin), soybean trypsin inhibitor, and oligosaccharides. These are known to interfere with the bioavailability of nutrients in animals, specifically young animals [1]. Soybean antigenic proteins in the diets of young animals provoke a transient hypersensitivity related to an abnormal morphology of the small intestine; these changes induce malabsorption syndrome, growth depression, and diarrhea [2]. Fermentation is an effective method of reducing antinutritional factor levels and increasing feed nutritional value and digestibility [3,4,5]. The nutritional characteristics of fermented feed are predominantly related to microbial abundance. Fermenting microbes, such as Bacillus subtilis and Enterococcus faecalis, can degrade glycinin and β-conglycinin in soybean and consequently improve corn–SBM feed peptides and amino acids. Wang et al. (2022) showed that phenylalanine metabolism is the most important pathway in the fermentation of corn–soybean by Bacillus subtilis [6]. Lactic acid bacteria produce organic acids, improve feed palatability, and lengthen feed shelf-life [7]. Zhao et al. (2021) [8] reported that during fermentation, levels of saccharides, amino acids, and nucleosides decreased, while bioactive molecules in barley were released and metabolites were accumulated by Lactobacillus plantarum dy-1. It has been widely reported that fermented feed can improve the growth and immune function of young animals and decrease the incidence of diarrhea [9,10,11].
Microbes and their metabolites in fermented feed majorly determine the quality of the final feed [6,12]. At present, high-throughput sequencing and “omics” technologies represent reliable tools for comprehensive analyses of microbial communities and for determining the metabolite profile of fermented feed [13,14]. Wang et al. (2022) [6] inoculated B. subtilis and E. faecalis into corn and defatted soybean to achieve a two-stage solid-state fermentation (SSF) and performed 16S sequencing and liquid chromatography (LC)–tandem mass spectrometry (MS/MS) to assess the dynamics of the microbiota, metabolites, and their integrated correlations during fermentation; different metabolites were identified before and after fermentation, and protein degradation, amino acid synthesis, and carbohydrate metabolism were the main metabolic pathways. In SSF, the metabolic actions of diverse microorganisms, including fungi and bacteria, evidently play a key role in determining the quality of the final feed [15]. However, the influencing mechanism of composite microbial fermentation on the special quality of CSW feed remains unclear. Li et al. (2018) [16] performed shotgun metagenomic and metabolomic analyses to report significant variations in the composition of microbiota, collective functional genes, and flavor compounds during SSF. Such methods seem to be effective to decipher the influence of the total microbial community and microbial secondary metabolites on nutrient composition and the bioavailability of fermented feed as they can highlight not only the structure of total microbial communities but also the metabolic potential and functional profiles of microbial communities. Considering that fermenting microbes are a key impacting factor, in this study we inoculated B. licheniformis Y5-39, B. subtilis B-1, and RSG-1 into CSW feed and performed SSF. Further, 16S rDNA sequencing and untargeted metabolomic profiling were conducted to determine changes in the microflora and metabolites, respectively, and to assess their integrated correlations during fermentation. Our findings should enhance our understanding of how to improve the quality of fermented CSW feed.
2. Material and Methods
2.1. Experimental Design and Sampling
B. subtilis B-1 (CGMCC no. 22064), B. licheniformis Y5-39 (CGMCC no. 22062) [17], and RSG-1 (CGMCC no. 22061) were isolated from the intestine of healthy sheep for Escherichia coli growth inhibition by the College of Life Sciences, Hebei Agricultural University (Baoding, China) and stored at the China General Microbiological Culture Collection Center (CGMCC, Beijing, China).
B. subtilis B-1 and B. licheniformis Y5-39 were cultured in nutrient liquid media (0.3% beef extract, 0.5% NaCl, 1% peptone, pH 7.2–7.3) at 37 °C for 24 h and lactic acid bacteria RSG-1 was cultured in de Man, Rogosa, and Sharpe broth at 37 °C for 18 h prior to fermentation. To achieve the best fermentation performance, B. subtilis B-1 (1.0 × 10⁸ CFU/mL), B. licheniformis Y5-39 (1.0 × 10⁸ CFU/mL), and lactic acid bacteria RSG-1 (1.0 × 10⁸ CFU/mL) were mixed in a volume ratio of 1:4:1 [18]. Approximately 150 g of the substrate comprised 60% corn, 25% soybean, and 15% wheat bran. The fermented group was inoculated with 10% compound microbial agents, and sterile water was added to achieve a 45% moisture content. The unfermented group was not inoculated with compound microbial agents. All procedures remained the same for the unfermented and fermented feed, except that sterile media (nutrient broth/de Man, Rogosa, and Sharpe broth) were added to the unfermented feed instead of bacteria. The wet mixture was then transferred to a plastic fermentation bottle (200 mL) and fermented at 37 °C for 14 days.
2.2. Measurement of Nutritional Content
Moist fermented and unfermented feed (n = 6) were collected on day 14 to determine the count of microorganisms and levels of microbial metabolites, and the remaining samples were dried at 65 °C for 48 h, crushed, and subjected to physicochemical analyses. Dried samples were used to analyze crude protein (CP) levels, as recommended by the AOAC International guidelines (2005). Trichloroacetic acid soluble protein (TCA-SP) levels in the fermented and unfermented feed were measured as previously described by Ovissipour et al. (2009) [19], and glycinin and β-conglycinin levels in the fermented and unfermented feed were measured using an indirect competitive ELISA kit (Longkefangzhou Bio-Engineering Technology Co., Ltd., Beijing, China). The pH was measured using a pH meter (PSH-3D, Mettler Toledo, Switzerland) as described by Shi et al. (2017) [20]. Lactic acid content was determined using a lactic acid enzymology assay kit (Nanjing Jiancheng Bio Co., Nanjing, China) as per the manufacturer’s instructions.
2.3. Sodium Dodecyl Sulfate–Polyacrylamide Gel Electrophoresis (SDS-PAGE) and LC–MS/MS
Soluble proteins were extracted from the unfermented and fermented feed samples as previously described [21,22], with minor modifications. Protein extracts (0.05 g/mL) were dissolved in Tris-HCl buffer (1.5 M, pH 8.8), mixed with a loading buffer (4:1, v/v), and then heated for 10 min in boiling water. A 10-μL aliquot of this mixture was then loaded onto an SDS-PAGE gel (12% separating gel and 5% stacking gel, Bis-Tris). The operating voltage of the stacking and separating gels was 80 V and 133 V, respectively. A protein ladder (10–180 kDa) was used as a size marker. After electrophoresis, gels were stained with Coomassie Brilliant Blue R-250 for 40 min and de-stained overnight in 7% acetic acid.
Protein bands (<25 kDa) were excised. LC–MS/MS was performed to parse soybean proteins and peptides. Briefly, after in-gel digestion by trypsin, 5 μL of the total peptides were separated and analyzed with a nano-UPLC (EASY-nLC1200) coupled to a Q Exactive HFX Orbitrap instrument with a nano-electrospray ion source.
2.4. 16S rDNA Sequencing
Microbial DNA was extracted from the fermented and unfermented feed samples using the HiPure soil DNA kit (Magen, Guangzhou, China), as per the manufacturer’s instructions. DNA concentration and purity were determined by NanoDrop 2000 (Thermo Fisher Scientific, Waltham, MA, USA). The universal primers 338F (5′-ACTCCTACGGGAGGCAGCA-3′) and 806R (5′-GGACTACNNGGGTATCTAAT-3′) were used to amplify the V3–V4 region of the bacterial 16S rDNA gene. Both the forward and reverse 16S primers were tailed with sample-specific Illumina index sequences to allow for deep sequencing. A Phusion® High-Fidelity PCR Master Mix and a GC Buffer kit (New England Biolabs, Ipswich, MA, USA) were used to amplify the bacterial 16S rDNA gene by PCR (cycling conditions: 95 °C for 5 min, followed by 30 cycles at 95 °C for 1 min, 60 °C for 1 min, 72 °C for 1 min, and a final extension at 72 °C for 7 min). Subsequently, amplicons were subjected to electrophoresis on 2% agarose gels, purified with Agencourt AMPure XP Beads (Beckman Coulter, Bria, CA, USA), and then finally quantified using the Qubit dsDNA HS assay kit and Qubit 4.0 Fluorometer (Invitrogen, Thermo Fisher Scientific, Waltham, MA, USA). Purified amplicons were pooled in equimolar ratios and paired-end sequenced (PE250) on Illumina Novaseq 6000 as per standard protocols. Raw reads can be obtained by contacting the corresponding authors.
High-quality clean reads were obtained as follows: raw reads were processed by Trimmomatic v0.33, and clean reads were obtained after primer sequences were identified and removed by Cutadapt 1.9.1. Chimeric sequences were detected and removed with UCHIME v4.2 to obtain clean reads. Overall, 478,508 clean reads were obtained, with >79,751 clean reads for each sample. Filtered sequences were clustered into operational taxonomic units of ≥97% similarity using the USEARCH pipeline [23]. Representative sequences were then categorized into organisms via a naive Bayesian model with an RDP classifier on the basis of the SILVA v132 database [24,25]. Principal coordinate analysis (PCoA) was performed based on the Bray–Curtis distance metric [26], and to estimate α-diversity, the number of observed species and the indices of Chao1 (species richness) and Shannon and Simpson (diversity) were calculated. Linear discriminant analysis (LDA) (threshold > 4.0) and LDA effect size (LEfSe) analysis [27] were applied to identify species with significant differences in microbial succession after CSW feed fermentation. PICRUSt2 [28] was used to predict the function of composition of samples and to speculate on functional gene composition and differences between the groups.
2.5. Untargeted Metabolomics
A 50 mg feed sample was thawed on ice and metabolites were extracted with 1000 μL of extract solution (methanol: acetonitrile: water = 2:2:1, with 20% 2-chloro-L-phenylalanine as the internal standard), as previously reported [29]. Quality control samples were prepared by mixing equal aliquots of supernatants from all samples. LC–MS/MS was performed on an UHPLC–MS/MS system (UPLC, Waters Acquity I-Class PLUS, Milford, MA, USA) involving a high-resolution mass spectrometer (Waters Xevo G2-XS QTOF, Milford, MA, USA) and column (1.8 μm, 2.1 × 100 mm, Waters Acquity UPLC HSS T3, Milford, MA, USA). Quadrupole time-of-flight mass spectrometer was operated in both positive and negative ion modes. MassLynx v4.2 was used to collect high-resolution MS data, which were converted to the mzXML format. Subsequently, data were imported into Progenesis QI for peak extraction, peak alignment, and other data processing operations based on the Progenesis QI online METLIN database and Biomark’s self-built library for identification; at the same time, theoretical fragment identification was performed [30].
After normalizing the original peak area information with the total peak area, multivariate pattern recognition analysis was performed using principal component analysis (PCoA) and orthogonal projection to latent structures discriminant analysis (OPLS-DA) using the R platform to reduce the dimensionality of the multidimensional dataset and understand global metabolic changes between the fermented and unfermented feed samples. The fitting validity and predictive ability of the selected OPLS-DA model were assessed by the parameters R2Y and Q2Y, respectively. A fold change > 1, variable importance in projection score > 1.0, and p < 0.05 were used as the criteria to identify differential metabolites between pairwise comparison groups. To interpret the biological significance of metabolites, metabolic pathway analyses were performed by an online analysis platform in MetaboAnalyst 5.0 (http://www.metaboanalyst.ca/; accessed on 19 August 2022). Further, Kyoto Encyclopedia of Genes and Genomes (KEGG) pathway enrichment analysis was performed to annotate metabolites by matching the exact molecular mass data (m/z) of the samples to those from the database.
2.6. Correlation Analysis
The LEfSe method was applied to select the main differentially abundant genera between different samples, and KEGG pathway enrichment analysis was performed to identify significantly altered metabolic pathways. Spearman’s rank correlation coefficient was calculated with R v3.6.3 to evaluate the relationship among metabolites and microbiota.
2.7. Statistical Analysis
Values represent mean ± SD (n = 3 for microbial analysis, n = 6 for chemical and metabolic analyses). Data were analyzed with SPSS 22.0 (IBM Corp, Armonk, NY, USA). Statical differences between fermented and unfermented feed samples were determined by Student’s t-test and one-way ANOVA. LC–MS/MS data were analyzed using Proteome Discoverer (v2.4.0.305) and the built-in Sequest HT search engine. The p-values of metabolomics and microbiome data were corrected using Welch’s test and the Benjamini–Hochberg false discovery rate. A p-value of <0.05 indicated statistically significant differences.
3. Results
3.1. Chemical Composition of Fermented Feed
Table 1 showed the chemical composition of unfermented and fermented CSW samples. In comparison with unfermented feed, CP and TCA-SP levels were significantly higher in the fermented mixed feed (p < 0.05); in contrast, glycinin and β-conglycinin contents (p < 0.05) were markedly lower in the fermented mixed feed. Moreover, fermented CSW had an approximately thirty-fold increase in lactic acid content (p < 0.05), and pH levels decreased to 3.4.

Table 1.
Changes in the content of various compound classes in unfermented and fermented feed samples.
3.2. Soybean Antigenic Protein Degradation
SDS-PAGE patterns of extracted soybean proteins from unfermented and fermented feed samples are shown in Supplementary Figure S1. Unfermented feed samples showed the presence of multiple protein bands in the range of 35–80 kDa. Soybean antigenic protein subunits, including the α′, α, and β subunits of β-conglycinin, and the acidic and basic subunits of glycinin were separated. Fermentation with B. licheniformis Y5-39, B. subtilis B-1, and lactic acid bacteria RSG-1 significantly affected the characteristics of proteins in mixed CSW. The α′ and α subunits of β-conglycinin and the acidic subunit of glycinin in CSW feed were almost completely degraded after SSF. In the fermented feed, the number of small peptides (<25 kDa) was higher; however, there was little effect on the β subunits of β-conglycinin. Using LC–MS/MS, the differences in proteins and peptides in CSW after fermentation were determined, as shown in Table 2.
Table 2.
Proteins and peptides of extracted proteins in fermented feed.
3.3. Microbial Diversity Analysis of Fermented Feed
The composition of the microbial community between unfermented and fermented feed samples is shown in Figure 1. The Chao1 (species richness) and Shannon (diversity) indices were used to measure α-diversity. The Chao1 index decreased while Shannon index increased in the fermented feed after SSF by compound strains; however, no significantly different changes were present between the fermented and unfermented groups (Figure 1a). This result indicated that species richness did not show any statistically significant differences between unfermented and fermented feed samples (Figure 1b). Comparing the β-diversity of microbial communities provides insights into their composition and highlights the distance or dissimilarity between each sample. Based on the Bray–Curtis distance metric and weighted UniFrac similarity method, we found that microbial β-diversity was different at different time points as the structures of microbial communities were separated into two distinct clusters (Figure 1c). The predominant bacteria changed from uncultured_bacterium_f_Enterobacteriaceae (5.81%), Pantoea (2.39%), and uncultured_bacterium_f_Muribaculaceae (1.25%) in the unfermented feed to Pediococcus (39.51%), Enterococcus (34.95%), and Lactobacillus (2.12%) in the fermented feed (Figure 1e). Pediococcus (p = 0.000), Lactobacillus (p = 0.0005), Enterococcus (p = 0.0055), and Blautia (p = 0.0253) were significantly more abundant in the fermented feed; however, the abundance of uncultured_bacterium_f_Enterobacteriaceae (p = 0.0018), Enterorhabdus (p = 0.0023), and uncultured_bacterium_f_Muribaculaceae (p = 0.0104) was lower in the fermented feed (Figure 1e). LEfSe analyses indicated that the unfermented and fermented feed samples contained significantly different bacteria, from the order to the genus level (LDA threshold > 4.0) (Figure 1d). The abundance of Lactobacillales, Enterococcus, and Pedicoccus was significantly higher in the fermented feed, whereas Pantoea, uncultured_bacterium_o_Chloroplast, Protebacteria, and Cyanobacteria were predominantly present in the unfermented feed (Figure 1d).
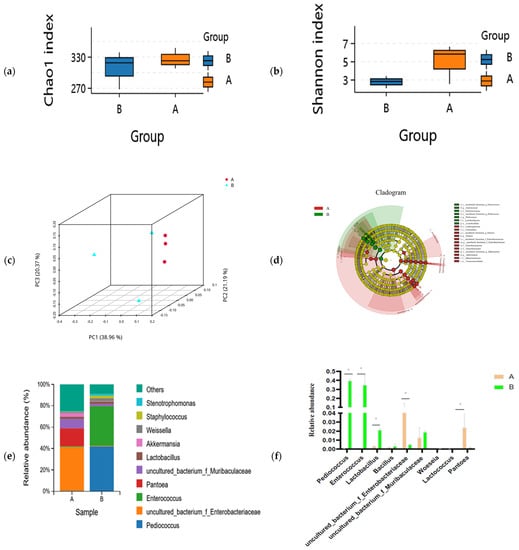
Figure 1.
Differences in microbial community in unfermented (A) and fermented (B) feed samples. (a) Chao1 and (b) Simpson indices for unfermented (A) and fermented (B) feed samples. (c) Principal coordinate analysis profile of bacterial diversity in unfermented (A) and fermented (B) feed samples. (d) Cladogram plot of significant genera based on LEfSe analysis (LDA threshold > 4.0). (e) Genus-level composition of microbial community in unfermented (A) and fermented (B) feed samples. (f) Relative abundance of key genus in unfermented (A) and fermented (B) feed samples, graph with “*” are different (p < 0.05).
The functional potential of microbial communities was predicted in the fermented and unfermented feed samples using PICRUSt2. KEGG pathway enrichment analyses revealed 30 significant pathways in the fermented feed. Moreover, five significantly different KEGG pathways were present in the fermented feed samples, namely peptidoglycan biosynthesis, carbon metabolism, pyruvate metabolism, pentose phosphate pathway, and glycolysis/gluconeogenesis; of these, peptidoglycan biosynthesis was the most significant pathway (Figure 2). In the unfermented feed, the most significant pathways were photosynthesis; oxidative phosphorylation; porphyrin and chlorophyl metabolism; alanine, aspartate and glutamate metabolism; and methane metabolism.
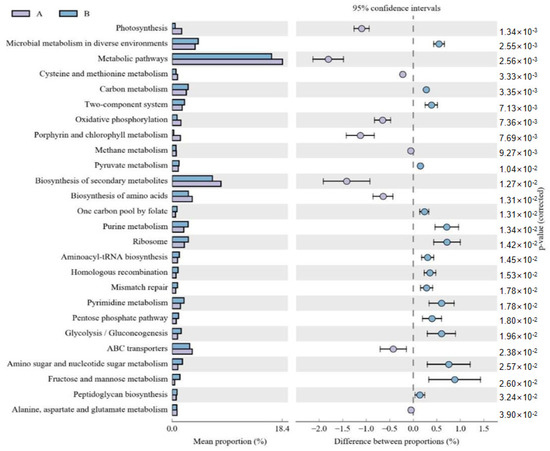
Figure 2.
Comparison of functional pathways predicted by PICRUSt2 in unfermented (A) and fermented feed (B) samples. The extended error bar method in STAMP showing relative difference pathway in comparisons involving one hypervariable dataset and other datasets using Welch’s t-test (two-sided).
3.4. Cluster Analysis of Metabolomics Data
To investigate metabolic changes in the fermented feed, fermented and unfermented feed samples were analyzed by LC–MS/MS-based untargeted metabolomics, which led to the identification of 699 metabolites (both positive and negative ion modes). We then performed PCA to assess variations between samples and to identify trends of distribution as well as discrete points. PCA revealed significant differences between the fermented and unfermented feed samples (Figure 3a,c). In particular, our OPLS-DA model revealed metabolic profile differences between the fermented and unfermented feed samples (Figure 3b,d), suggesting that fermentation leads to significant biochemical changes in the fermented feed. Moreover, the R2Y value of the OPLS-DA models was 1.000 and the Q2Y value was 0.995 in the positive ionization modes (Figure 3b) and the R2Y value was 0.997 and Q2Y value were 0.955 in the negative ionization modes (Figure 3d), highlighting that the models showed high reliability and good predictive capabilities. These results indicated that the model was robust and could be used to explore changes in metabolite levels over time in the fermented CSW feed.
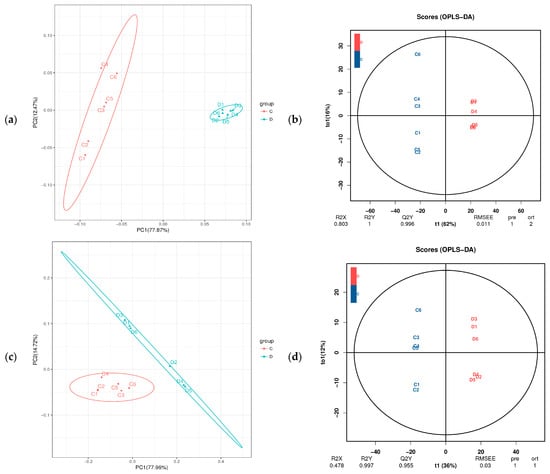
Figure 3.
PCoA and OPLS-DA plot based on fermented feed metabolites. C: unfermented feed; D: fermented feed (a) PCoA and (b) OPLS-DA plot of metabolites in the positive ionization mode between unfermented and fermented feed samples. (c) PCoA and (d) OPLS-DA plot of metabolites in the negative ionization mode between unfermented and fermented feed samples.
3.5. Identification and Analysis of Differential Metabolites
Based on variable importance in the projection score > 1.0 and fold change >1 or <0.5 with p < 0.05, we identified 699 significantly different metabolites between the fermented and unfermented feed samples, of which, 299 were down- and 400 were upregulated in the fermented feed samples (Figure 4). These metabolites were mainly involved in arginine and proline metabolism, cysteine and methionine metabolism, phenylalanine metabolism, tryptophan metabolism, and protein digestion and absorption; the top 20 KEGG pathways were retained (Figure 5). Partly important metabolites were showed as major compounds contributing to the discrimination of the fermented samples after different fermentation periods, including amino acids and their derivatives, organic acids, and sugars and their derivatives (Table 3). The top 10 up- and downregulated metabolites are shown in Figure 6. Some amino acids (lysyl–valine, phenylalanyl–arginine, and Ile–Ala–Arg), organic acids (pyridoxamine-5′-phosphate and orotidylic acid), and immune-response-related metabolites (12-oxo-LTB4) were significantly upregulated in the fermented feed.
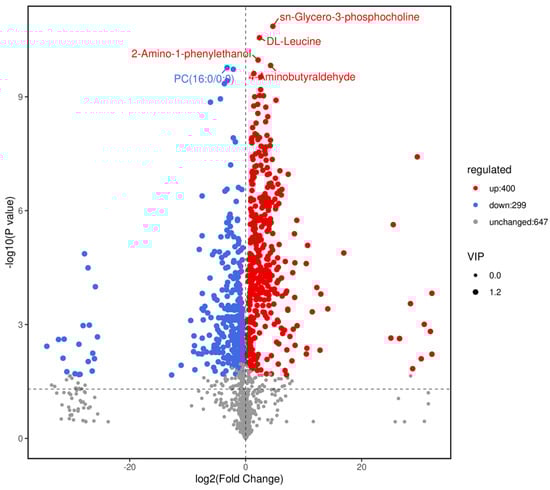
Figure 4.
Volcano plot of differential metabolites (positive + negative ions). Fold changes (log2) are plotted on the abscissa and p-values (−log10) on the ordinate. Data points corresponding to non-differential metabolites (NoDiff), upregulated metabolites (UP), and downregulated metabolites (DW) are shown as grey, red, and blue circles, respectively. Circle size represents variable importance in projection score for corresponding metabolites.
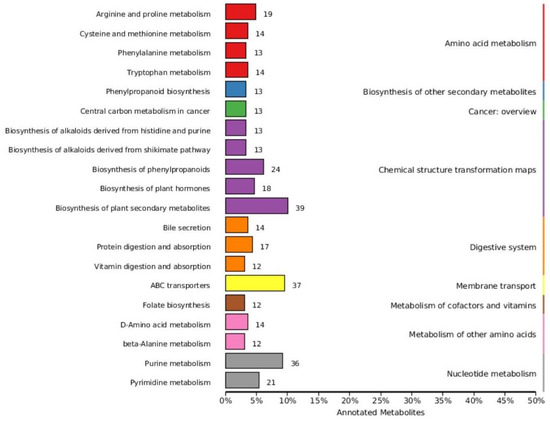
Figure 5.
Classification map of KEGG differential metabolic pathways.
Table 3.
The comparison of important metabolites between unfermented and fermented feed samples.
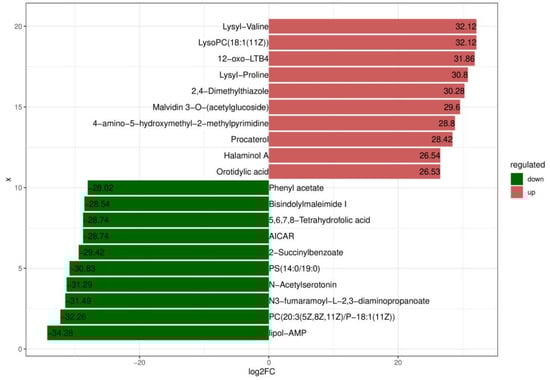
Figure 6.
Top 10 up- and downregulated metabolites.
3.6. Correlation among Significantly Different Microbiota, Nutritional Indices, and Metabolites
To further study the effects of changes in bacteria, nutritional indices, and metabolites, we performed correlation analyses. Pediococcus, Lactobacillus, and Enterococcus, the abundance of which was higher in the fermented feed, showed a positive correlation with nutritional indices. Furthermore, Pediococcus, Lactobacillus, and Enterococcus were positively correlated with lactic acid, TCA-SP, and CP and negatively correlated with pH, β-conglycinin, and glycinin (Figure 7). Correlation analyses were also performed with the relative abundance of metabolites in the fermented and unfermented feed (Figure 7). In general, Pediococcus was positively correlated with 4-amino-5-hydroxymethyl-2-methylpyrimidine and malvidin 3-O-(acetylglucoside), which contribute to the nutritional value and immune function of metabolites. Further, Enterococcus was positively correlated with procaterol, orotidylic acid, and 4-amino-5-hydroxymethyl-2-methylpyrimidine, and Lactobacillus was positively correlated with lactic acid, lysyl–valine, malvidin 3-O-(acetlyglucoside), 12-oxo-LTB4, 4-amino-5-hydroxymethyl-2-methylpyrimidine, and procaterol orotidylic acid. The abundance of uncultured_bacterium_f_Enterobacteriaceae and uncultured_bacterium_f_Muribaculaceae was significantly decreased in the fermented feed, while they were the dominant bacteria in the unfermented feed. A positive correlation was observed between uncultured_bacterium_f_Enterobacteriaceae and daidzin, phenyl acetate, N3-fumaramoyl-L-2,3-diaminopropanoate, and PS (14:0/19:0). Collectively, these data indicated that depending on the microbial strains, metabolites affect the quality of fermented feed, possibly due to ecological changes in the microbiota.
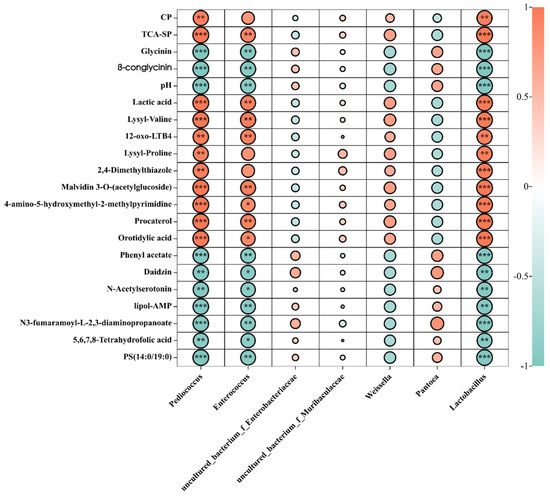
Figure 7.
Relationships among the dominant microbiota and the first 20 metabolites in unfermented and fermented feed samples. Graph with “*” was correlation (p < 0.05); “**” was significantly correlation 0.01 < p < 0.05; “***” was extremely significant correlation (p < 0.01).
4. Discussion
4.1. Chemical Composition of Fermented Feed and Antigen Protein Degradation
Considering the potential health benefits of microbial fermented feed for animals, its development and application have gained attention in recent times. Fermented soybean and corn–SBM-based foods are popular in animal production as they markedly contribute to animal growth. Fermentation is widely known to reduce antinutritional factor levels, produce diverse enzymes, and improve the nutritional status of substrates [31,32,33,34]. These results were consistent with changes in nutrient levels; β-conglycinin and the glycinin content showed a sharp decrease, indicative of the degradation of large-molecular-weight antigenic proteins into small peptides that contribute to higher levels of CP and TCA-SP in the fermented feed. Fermented CSW showed increased amounts of CP and TCA-SP in this present study, consistent with previous research on FSBM [35], TCA-SP consists of small peptides with 2–20 residues, which significantly increased, consistent with the degradation of β-conglycinin and glycinin in fermented soybeans. In our research, SDS-PAGE and LC–MS/MS showed significant degradation in β-conglycinin and glycinin. There were peptides and unique peptides (protein sequence coverage > 20%) largely from glycinin and β-conglycinin subunits, indicating that many amino acid residues were hidden to increase the possibility of masking epitopes, reducing fermented feed allergenicity [36]. Previous studies have shown that TCA-SP increased 4.6-fold, and β-conglycinin and glycinin decreased after 24 h of fermentation by Bacillus subtilis BS12, with high protease activity [37]. Glycinin and β-conglycinin are the feed allergens that are believed to be responsible for provoking transient hypersensitivity and inflammation in younger animals [38]. The low content of glycinin and β-conglycinin in fermented feed contributed to a higher feed intake of piglets [3], which resulted in better average daily weight gain. High lactic acid levels related to pH value decreased in the fermentation process.
4.2. Microbial Diversity and Data Cluster Analysis of Fermented Feed
We adopted a multi-omics approach to evaluate the association between microflora and metabolite production during the SSF of corn–SBM feed using compound strains. Pediococcus, Enterococcus, and Lactobacillus were predominant in the fermented corn–SBM feed, and amino acid metabolism was the main pathway; however, other pathways, including arginine and proline metabolism, cysteine and methionine metabolism, phenylalanine metabolism, and tryptophan metabolism were also significantly enriched during fermentation. Correlation analysis suggested a strong association between Pediococcus, Enterococcus, and Lactobacillus and amino acid metabolism, indicating that fermentation contributed to the nutritional value of the substrates.
The fermented feed samples showed no significant changes in α-diversity. In contrast, β-diversity was altered in the fermented feed samples, indicating that the SSF of corn–SBM feed was associated with changes in the microbial community structure and composition. Although SSF induced significant changes in the bacterial population, negligible changes were observed in the overall level of bacterial diversity. McGarvey et al. (2013) [39] reported similar results when they observed significant changes in the bacterial population structure during the ensiling of alfalfa and it’s subsequent exposure to air. Such findings suggest that significant changes in bacterial populations cannot lead to altered diversity indices, but changes in the level of some taxonomic groups can be offset by opposite changes in other groups.
In this study, microbial analyses revealed that SSF led to changes in microbial communities, which seemed to be the core reason for alterations in metabolite profiles [12]. A previous study found Bacillus and Enterococcus to be the predominant bacteria in the anaerobic stage [6]. We observed that the predominant bacteria changed from uncultured_bacterium_f_Enterobacteriaceae, Pantoea and uncultured_bacterium_f_Muribaculaceae in the unfermented feed to Pediococcus, Enterococcus and Lactobacillus in the fermented feed. Enterococcus and Lactobacillus are members of the Firmicutes phylum, and Pediococcus is a member of the Lactobacillus genus, which is known to contribute to quickly improving lactic acid quantities at the early stage of silage and rapidly reduce pH [40]. Firmicutes evidently not only secrete hydrolases (protease, lipase, and amylase) but also produce bacteriocins [41,42], which might contribute to an increase in metabolic end-product levels [43].
4.3. Identification and Analysis of Differential Metabolites
Our data indicated that amino acid, carbohydrate, and lipid metabolism were predominant during the fermentation process. Further, fermentation increased levels of organic acids, polysaccharides, dipeptides, and tripeptides, as well as decreasing the sugars, lipids, and carbohydrates; this finding corresponds to the results of a previous study on fermented corn and soybean [6].
The nutritional value of proteins is highly correlated with their amino acid composition; this is particularly applicable to essential amino acids in the diet of animals. Fermentation can improve the levels of amino compounds, including phenylalanyl–asparagine, serine and isoleucyl–histidine, as previously reported by Wang et al. (2022). Lysine, phenylalanine, isoleucine, and valine are essential amino acids in animal feed. Lysyl–valine, Ile–Ala–Arg, phenylalanyl–isoleucine, and glutamyl–valine levels were due to the incomplete breakdown products of protein digestion and catabolism, and these levels showed a significant increase in the fermented feed in this study; this result was consistent with that of a previous study [6]. Moreover, d-Serine is a unique endogenous substance that can improve the secretion of growth hormone; it appears to increase the N-methyl-d-aspartate-type glutamate receptor expression and increase the plasma GH levels [44]. Amino acid composition is widely known to contribute to the characteristic taste and flavor of fermented products [45], for example, serine affects sweetness, and phenylalanine, tyrosine, isoleucine, and valine contribute to a bitter taste [33]. Glutamic acid and its salts are the principal agents that impart a delicious flavor to fermented soybean products [46]. Levels of aromatic amino acids (phenylalanine, tryptophan, and tyrosine), which are vital components of protein synthesis and are found upstream of some growth hormones and secondary metabolites, were significantly increased in the fermented feed [47]. In this study, the increase in these amino acid levels in the fermented feed was probably related to methionine released from soybean proteins [48]. Furthermore, lysine degradation pathways, protein digestion and absorption pathways, and aromatic compound degradation pathways were significantly enriched after fermentation, which seems to be related to the synergistic activity of hydrolases of B. subtilis or fungi in the fermented feed [49,50]. However, we found that arginine and proline metabolism, cysteine and methionine metabolism, phenylalanine metabolism, and tryptophan metabolism were predominant, which led to an increase in amino acid levels in the fermented CSW feed. Phenylamine metabolism is closely related to the flavor substances produced in the fermentation procession. Phenylalanine can be converted into cinnamic acid by phenylalanine ammonia lyase, and cinnamate 4-hydroxylase continues to convert cinnamic acid into various aromaticity organic acids [51].
The level of isocitric acid, an important intermediate compound of the Krebs cycle, was significantly decreased upon fermentation. In addition, intermediate products (linolenic acid) in the aerobic decomposition of lipids were significantly increased, indicating that anaerobic fermentation plays a decisive role during the later phase of fermentation [52]. Organic acid (acetic acid) and fatty acid (propionic acid, hexanoic acid, nonanoic acid, isovaleric acid, and 3-hydroxyisobutyric acid) levels showed an improvement and were correlated with an increase in lactic acid levels and a decrease in pH in the fermented CSW feed. These products mainly serve as antibacterial elements in the fermented feed [53] as they inhibit the growth of pathogenic bacteria and reduce diarrhea in livestock, including piglets [54]. Daidzin and 6-O-acetyldaidzin, which are natural organic compounds in soybean and soybean-based products, are poorly absorbed with a low bioavailability in the gut [55]. A decrease in daidzin and 6-O-acetyldaidzin levels indicates that fermentation improves β-glucosidase activity, increasing isoflavone bioavailability and facilitating protein digestion [56]. However, levels of 4-hydroxycinnamic acid, which plays a role in the preventive effects against free radicals causing lesions and injuries, showed a significantly increasing trend in a previous study [57]. Notably, a sharp increase in the levels of 12-oxo-LTB4, PGG2, and 15-HPETE were observed in the fermented feed; they clear oxygen free radicals or inactivate oxygen free radicals the through cyclooxygenase and lipoxidase pathways of peroxidase, exerting anti-inflammatory activity [58]. Phenylacetaldehyde is a typical fragrant compound. Furthermore, 4-Amino-5-hydroxymethyl-2-methylpyrimidine is the precursor for thiamin synthesis; in a previous study, thiamin was synthesized by 4-amino-5-hydroxymethyl-2-methylpyrimidine in B. subtilis [59]. Malvidin 3-O-(acetylglucoside) is an anthocyanin, a type of flavonoid, and it is currently recognized as an important nutrient and natural antioxidant with high efficiency in scavenging free radicals [60]. Phenylacetaldehyde levels showed a considerable increase, which verifies that fermentation contributes to improving the nutritional value of CSW feed. Furthermore, fermentation caused a significant reduction in the content of stachyose, raffinose, glucosan, and maltopentaose; however, there was an increase in the content of β-D-galactose and uridine diphosphate glucose. This result is partly consistent with the fermentation profile of Saccharomyces cerevisiae reported by Sun et al. (2017) [50]. During SSF, sugars supply energy for rapid cell growth and division and bacterial cells rapidly proliferate. Stachyose changes the microbial population and bacterial enzyme activity in the intestine [61], which reportedly leads to diarrhea in piglets and also a poor growth rate [62]. We found that α-oligosaccharide (stachyose and raffinose) levels were lower in the fermented feed; α-oligosaccharides may be used by fermented strains to produce short-chain fatty acids (acetic acid, propionic acid, and butyric acid), which provide nutrition to intestinal cells and promote the growth and reproduction of probiotics in the intestine.
4.4. Correlation among Significantly Different Microbiota, Nutritional Indices, and Metabolites
The quality and metabolite composition of fermented feed are affected by the activities of microorganisms. B. subtilis, as the predominant fermentative bacteria, contributes to feed flavor and degrades large-molecular-weight components into smaller ones in fermented feed [63]. Zhang et al. (2018) evaluated the effects of SBM fermented with B. subtilis BS12 on the growth performance and small intestinal immune status of piglets and found that 92.36% of glycinin and 88.44% of β-conglycinin were eliminated [3]. B. licheniformis belongs to the Firmicutes phylum and showed strong protease and amylase activities; the significant degradation of glycinin and β-conglycinin was also demonstrated in the fermented feed [47]. As per previous studies, the α and α′ subunits of β-conglycinin are the preferred substrates for the majority of lactic acid bacteria, and they increase the level of total free amino acids and principally hydrolyze essential and flavor precursor amino acids [48]. We observed that glycinin and β-conglycinin levels in the fermented feed showed a significant decrease and TCA-SP levels showed a sharp increase. Protein hydrolysates are physiologically better than intact proteins because their intestinal absorption is evidently more effective [64].
Enterococcus and Lactobacillus play key roles in immune function by downregulating the expression of proinflammatory genes and upregulating that of anti-inflammatory genes in the feed of beef steers fed supplemental fermentation products of S. cerevisiae, E. lactis, B. licheniformis, and B. subtilis [65]. Moreover, Enterococcus and Lactobacillus reportedly improve proteolysis, increase the synthesis of aromatic compounds, and degrade carbohydrates, enhancing the taste and flavor of fermented feed [6]. Lactic acid levels are associated with a higher relative abundance of Pediococcus [62], which validates that SSF increases lactic acid levels in fermented feed. In fermented feed, lysyl–valine and lysyl–proline levels were found to be positively correlated with Enterococcus and Lactobacillus abundance. These results indicate that protein degradation and amino acid synthesis are mainly involved in fermentation by compound strains, with Pediococcus, Enterococcus, and Lactobacillus playing a key role in CSW feed fermentation.
5. Conclusions
Solid-state fermentation with Bacillus licheniformis Y5-39, Bacillus subtilis B-1, and lactic acid bacteria RSG-1 reduced soybean antigenic proteins (glycinin and β-conglycinin), daidzin, and 6-O-acetyldaidzin in CSW mixed feed and increased the TCA-SP and CP content. Furthermore, Pediococcus, Enterococcus, and Lactobacillus were determined as the functional core microorganisms for amino acid metabolism and lactic acid production in the fermented feed. Furthermore, arginine and proline metabolism, cysteine and methionine metabolism, phenylalanine metabolism, and tryptophan metabolism were significantly enriched in the fermented feed. These results are pivotal to obtain high-quality and safe fermented products, as well as to screen suitable fermentation agents.
Supplementary Materials
The following supporting information can be downloaded at: https://www.mdpi.com/article/10.3390/microorganisms11051319/s1, Figure S1: Distribution of peptides in unfermented and fermented feed.
Author Contributions
Y.L. (Yue Li), Y.G. and Y.Z. conceived the project and designed the experiments. Y.L. (Yue Li), Q.H., Y.W. and C.D. analyzed the nutritional value, 16S rRNA sequencing data, and metabolic data and wrote the manuscript. Y.D., X.G. and Y.L. (Yueqin Liu), helped to review, revise and approve the manuscript. All authors have read and agreed to the published version of the manuscript.
Funding
Yunxia Guo: Natural Science Foundation of Hebei Province of China (C2022204174); Yunxia Guo and Qinghong Hao: Key R & D projects of Hebei Province of China (21322907D and 21322910D); Yingjie Zhang and Yueqin Liu: China Agriculture Research System of (CARS-38) and (CARS-40-21).
Data Availability Statement
Raw data for the figures are available upon reasonable request from the corresponding author.
Conflicts of Interest
The authors declare no conflict of interest.
References
- Yang, A.S.; Zuo, L.L.; Cheng, Y.F.; Wu, Z.H.; Li, X.; Tong, P.; Chen, H.B. Degradation of major allergens and allergenicity reduction of soybean meal through solid-state fermentation with microorganisms. Food Funct. 2018, 9, 1899–1909. [Google Scholar] [CrossRef]
- Wang, T.; Qin, G.X.; Sun, Z.W.; Zhao, Y. Advances of research on glycinin and β-conglycinin: A review of two major soybean allergenic proteins. Crit. Rev. Food Sci. 2014, 54, 850–862. [Google Scholar] [CrossRef]
- Zhang, S.T.; Wang, C.F.; Sun, Y.; Wang, G.; Chen, H.; Li, D.; Yu, X.X.; Chen, G. Xylanase and fermented polysaccharide of Hericium caputmedusae reduce pathogenic infection of broilers by improving antioxidant and anti-Inflammatory properties. Oxidative Med. Cell. Longev. 2018, 2018, 4296985. [Google Scholar] [CrossRef]
- Oh, N.S.; Joung, J.Y.; Lee, J.Y.; Song, J.G.; Oh, S.; Kim, Y.; Kim, H.W.; Kim, S.H. Glycated milk protein fermented with Lactobacillus rhamnosus ameliorates the cognitive health of mice under mild-stress condition. Gut Microbes. 2020, 11, 1643–1661. [Google Scholar] [CrossRef]
- Ding, Y.W.; Guo, Y.X.; Wang, H.Y.; Yang, C.H.; Tian, X.Z.; Xu, Y.H.; Duan, C.H.; Yan, H.; Ji, S.K.; Liu, Y.Q.; et al. Effects of compound probiotic fermented feed on nutrient apparent digestibility, serum hormone contents, fecal microbial flora and digestive enzyme activities of lambs. Chin. J. Anim. Nutr. 2022, 34, 7945–7959. [Google Scholar]
- Wang, C.; Wei, S.Y.; Jin, M.L.; Liu, B.J.; Yue, M.; Wang, Y.Z. Integrated microbiomic and metabolomic dynamics of fermented corn and soybean by-product mixed substrate. Front. Nutr. 2022, 9, 831243. [Google Scholar] [CrossRef]
- Rathod, N.B.; Phadke, G.G.; Tabanelli, G.; Mane, A.; Ranveer, R.C.; Pagarkar, A. Recent advances in bio-preservatives impacts of Lactic acid bacteria and their metabolites on aquatic food products. Food Biosci. 2021, 44, 1041440. [Google Scholar] [CrossRef]
- Zhao, Y.S.; Wu, C.; Zhu, Y.; Zhou, C.G.; Xiong, Z.Y.; Eweys, A.S.; Zhou, H.B.; Dong, Y.; Xiao, X. Metabolomics strategy for revealing the components in fermented barley extracts with Lactobacillus plantarum dy-1. Food Res. Int. 2021, 139, 109808. [Google Scholar] [CrossRef]
- Liu, Y.L.; Feng, J.; Wang, Y.M.; Lv, J.; Li, J.H.; Guo, L.J.; Min, Y.N. Fermented corn–soybean meal mixed feed modulates intestinal morphology, barrier functions and cecal microbiota in laying Hens. Animals 2021, 11, 3059. [Google Scholar] [CrossRef]
- Adeyemi, J.A.; Harmon, D.L.; Compart, D.M.P.; Ogunade, I.M. Effects of a blend of Saccharomyces cerevisiae-based direct-fed microbial and fermentation products in the diet of newly weaned beef steers: Growth performance, whole-blood immune gene expression, serum biochemistry, and plasma metabolome. J. Anim. Sci. 2019, 11, 4657–4667. [Google Scholar] [CrossRef]
- Ding, Y.W.; Guo, Y.X.; Wang, H.Y.; Liu, Y.Q.; Zhang, Y.J.; Wang, Y.; Xi, Y.J.; Duan, C.H. Effects of compound probiotic fermented feed on growth performance, blood routine indexes and serum immunity and antioxidant indexes of nursing lambs. Chin. J. Anim. Nutr. 2023, 35, 1–12. [Google Scholar]
- Kumar, V.; Ahluwalia, V.; Saran, S.; Kumar, J.; Patel, A.K.; Singhania, R.R. Recent developments on solid-state fermentation for production of microbial secondary metabolites: Challenges and solutions. Bioresour. Technol. 2020, 323, 124566. [Google Scholar] [CrossRef] [PubMed]
- Yun, J.M.; Zhao, F.Q.; Zhang, W.W.; Yan, H.J.; Zhao, F.Y.; Ai, D.Y. Monitoring the microbial community succession and diversity of Liangzhou fumigated vinegar during solid-state fermentation with next-generation sequencing. Ann. Microbiol. 2019, 69, 279–289. [Google Scholar] [CrossRef]
- Beaumont, M.; Paës, C.; Mussard, E.; Knudsen, C.; Cauquil, L.; Aymard, P.; Barilly, C.; Gabinaud, B.; Zemb, O.; Fourre, S.; et al. Gut microbiota derived metabolites contribute to intestinal barrier maturation at the suckling-to-weaning transition. Gut Microbes. 2020, 11, 1268–1286. [Google Scholar] [CrossRef]
- Qiao, H.X.; Zhang, L.H.; Zhang, X.J.; Song, Y.Z.; Bian, C.Z. Metabolomics analysis of fermented astragalus by Lactobacillus plantarum based on LC-MS metabolomics. China Anim. Husb. Vet. Med. 2021, 48, 3283–3292. [Google Scholar] [CrossRef]
- Li, Z.Y.; Feng, C.X.; Luo, X.G.; Yao, H.L.; Zhang, D.H.; Zhang, T.C. Revealing the influence of microbiota on the quality of Pu-erh tea during fermentation process by shotgun metagenomic and metabolomic analysis. Food Microbiol. 2018, 76, 405–415. [Google Scholar] [CrossRef]
- Guo, Y.X.; Hao, Q.H.; Zhu, B.C. Screening and identification of the probiotics strain Y5-39 showing antidysenteriae effects form sheep. Acta Agric. Boreali-Sin. 2010, 25, 206–210. [Google Scholar]
- Ding, Y.W.; Liu, Y.; Xu, Y.H.; Wang, Y.L.; Wang, H.Y.; Hao, Q.H.; Duan, C.H.; Guo, Y.X.; Ji, S.K.; Yan, H.; et al. Quality evaluation and antimicrobial activity analysis of full price corn-soybean meal feed fermented with compound probiotics. Acta Ecol. Anim. Domest. 2022, 43, 19–24. [Google Scholar]
- Ovissipour, M.; Abedian, A.; Motamedzadegan, A.; Rasco, B.; Safari, R.; Shahiri, H. The effect of enzymatic hydrolysis time and temperature on the properties of protein hydrolysates from Persian sturgeon (Acipenser persicus) viscera. Food Chem. 2009, 115, 238–242. [Google Scholar] [CrossRef]
- Shi, C.Y.; Zhang, Y.; Lu, Z.Q.; Wang, Y.Z. Solid-state fermentation of corn-soybean meal mixed feed with Bacillus subtilis and Enterococcus faecium for degrading antinutritional factors and enhancing nutritional value. J. Anim. Sci. Biotechnol. 2017, 8, 925–933. [Google Scholar] [CrossRef]
- Faurobert, M. Application of two-dimensional gel electrophoresis to Prunus armeniaca leaf and bark tissues. Electrophoresis 1997, 18, 170–173. [Google Scholar] [CrossRef] [PubMed]
- Hu, J.Q.; Liu, Y.; An, G.J.; Zhang, J.S.; Zhao, X.W.; Zhang, P.Q.; Wang, Z.C. Charateristics of molecular composition and its anti-nutrition of β-conglycinin during flavorzyme proteolysis. Food Biosci. 2021, 42, 101039. [Google Scholar] [CrossRef]
- Edgar, R.C. UPARSE: Highly accurate OTU sequences from microbial amplicon reads. Nat. Methods 2013, 10, 996–998. [Google Scholar] [CrossRef] [PubMed]
- Pruesse, E.; Quast, C.; Knittel, K.; Fuchs, B.M.; Ludwig, W.; Peplies, J. SILVA: A comprehensive online resource for quality checked and aligned riboso mal RNA sequence data compatible with ARB. Nucleic Acids Res. 2007, 35, 7188–7196. [Google Scholar] [CrossRef]
- Wang, Q.; Garrity, G.M.; Tiedje, J.M.; Cole, J.R. Naive Bayesian classifier for rapid assignment of rRNA sequences into the new bacterial taxonomy. Appl. Environ. Microb. 2007, 73, 5261. [Google Scholar] [CrossRef]
- Gower, J.C. Some distance properties of latent root and vector methods used in multivariate analysis. Biometrika 1966, 53, 325–338. [Google Scholar] [CrossRef]
- Segata, N.; Izard, J.; Waldron, L.; Gevers, D.; Miropolsky, L.; Garrett, W.S.; Huttenhower, C. Metagenomic biomarker discovery and explanation. Genome Biol. 2011, 12, R60. [Google Scholar] [CrossRef]
- Donovan, H.P.; Gene, W.T. STAMP: Statistical analysis of taxonomic and functional profiles. Bioinformatics 2014, 30, 3123–3124. [Google Scholar] [CrossRef]
- Yu, C.N.; Luo, X.J.; Zhan, X.R.; Hao, J.; Zhang, L.; Yb, L.S.; Shen, C.J.; Dong, M. Comparative metabolomics reveals the metabolic variations between two endangered Taxus species (T. fuana and T. yunnanensis) in the Himalayas. BMC Plant Biol. 2018, 18, 197. [Google Scholar] [CrossRef]
- Wang, J.L.; Zhang, T.; Shen, X.T.; Liu, J.; Zhao, D.L.; Sun, Y.W.; Wang, L.; Liu, Y.J.; Gong, X.Y.; Liu, Y.X.; et al. Serum metabolomics for early diagnosis of esophageal squamous cell carcinoma by UHPLC-QTOF/MS. Metabolomics 2016, 12, 116. [Google Scholar] [CrossRef]
- Shi, C.; Zhang, Y.; Yin, Y.; Wang, C.; Lu, Z.; Wang, F.; Feng, J.; Wang, Y. Amino acid and phosphorus digestibility of fermented corn-soybean meal mixed feed with Baxillus subtilis and Enterococcus faecium fed to pigs. J. Anim. Sci. 2017, 95, 3996–4004. [Google Scholar] [CrossRef]
- Luo, Y.Q.; Hu, Q.; Lu, Y.; Zhang, F.F.; Ma, G.J.; Liu, J.C.; Zhang, W.J. Studies on nutrient composition of cotton meal fermented by Bacillus subtilis-1 Saccharomyces cerevisiae and their compound bacteria. China Anim. Husb. Vet. Med. 2020, 47, 452–459. [Google Scholar] [CrossRef]
- Hao, Y.N.; Wang, Z.G.; He, R.; Ju, X.R.; Yuan, J. Quality improvement of rapeseed meal based on static-state fermented with mixed microorganisms. Sci. Agric. Sin. 2020, 53, 2066–2077. [Google Scholar]
- Guo, M.M.; Cao, X.; Zhang, K.; Yang, Y.X.; Wang, X.L.; Chen, Y.L. Effects and metabolites of soybean meal fermented by compound microbes. Chin. J. Anim. Nutr. 2022, 34, 1–13. [Google Scholar]
- Feng, J.; Liu, X.; Xu, Z.; Lu, Y.; Liu, Y. Effect of fermented soybean meal on intestinal morphology and digestive enzyme activities in weaned piglets. Dig. Dis. Sci. 2007, 52, 1845–1850. [Google Scholar] [CrossRef]
- Pi, X.W.; Sun, Y.X.; Guo, X.; Chen, Q.S.; Cheng, J.J.; Guo, M.R. Effects of thermal sterilization on the allergenicity of soybeans. LWT-Food Sci. Technol. 2022, 154, 112678. [Google Scholar] [CrossRef]
- Zhang, Y.; Shi, C.Y.; Wang, C.; Lu, Z.Q.; Wang, F.Q.; Feng, J.; Wang, Y.Z. Effect of soybean meal fermented with Bacillus subtillis BS12 on growth performance and small intestinal immune status of piglets. Food Agr. Immunol. 2018, 29, 133–146. [Google Scholar] [CrossRef]
- Wu, J.J.; Cao, C.M.; Meng, T.T.; Zhang, Y.; Xu, S.L.; Feng, S.B.; Li, Y.; Wang, X.C. Induction of immune responses and allergic reactions in piglets by injecting glycinin. Ital. J. Anim. Sci. 2016, 15, 166–173. [Google Scholar] [CrossRef]
- McGarvey, J.A.; Franco, R.B.; Palumbo, J.D.; Hnasko, R.; Stanker, L.; Mitloehner, F.M. Bacterial population dynamics during the ensiling of Medicago sativa (alfalfa) and subsequent exposure to air. J. Appl. Microbiol. 2013, 114, 1661–1670. [Google Scholar] [CrossRef]
- Ni, K.K.; Wang, F.F.; Zhu, B.G.; Yang, J.X.; Zhou, G.A.; Pan, Y.; Tao, Y.; Zhong, J. Effects of Lactic acid bacteria and molasses additives on the microbial community and fermentation quality of soybean silage. Bioresour. Technol. 2017, 238, 706–715. [Google Scholar] [CrossRef]
- Nagao, F.; Nakayama, M.; Muto, T.; Okumura, K. Effects of a fermented milk drink containing Lactobacillus casei strain Shirota on the immune system in healthy human subjects. Biosci. Biotech. Bioch. 2000, 64, 2706–2708. [Google Scholar] [CrossRef]
- Romero, J.J.; Zhao, Y.; Balseca-Paredes, M.A.; Tiezzi, F.; Gutierrez-Rodriguez, E.; Castillo, M.S. Laboratory silo type and inoculation effects on nutritional composition, fermentation, and bacterial and fungal communities of oat silage. J. Dairy Sci. 2017, 100, 1812–1828. [Google Scholar] [CrossRef] [PubMed]
- Alcon-Giner, C.; Dalby, M.J.; Caim, S.; Ketskemety, J.; Shaw, A.; Sim, K.; Lawson, M.A.E.; Kiu, R.; Leclaire, C.; Chalklen, L.; et al. Microbiota supplementation with Bifidobacterium and Lactobacillus modifies the preterm infant gut microbiota and metabolome: An observational study. Cell Rep. Med. 2020, 1, 100077. [Google Scholar] [CrossRef] [PubMed]
- Nishikawa, T. Analysis of free d-Serine in mammals and its biological relevance. J. Chromatogr. B 2011, 879, 3169–3183. [Google Scholar] [CrossRef] [PubMed]
- Zhao, C.J.; Schieber, A.; Gänzle, M.G. Formation of taste-active amino acids, amino acid derivatives and peptides in food fermentations-A review. Food Res. Int. 2016, 89, 39–47. [Google Scholar] [CrossRef]
- Fukushima, D. Fermented vegetable protein and related foods of Japan and China. Food Rev. Int. 1995, 1, 149–209. [Google Scholar] [CrossRef]
- Yang, H.; Qu, Y.Z.; Li, J.T.; Liu, X.Q.; Wu, R.N.; Wu, J.R. Improvement of the protein quality and degradation of allergens in soybean meal by combination fermentation and enzymatic hydrolysis. LWT-Food Sci. Technol. 2020, 128, 109442. [Google Scholar] [CrossRef]
- Aguirre, L.; Garro, M.S.; Giori, G.S.D. Enzymatic hydrolysis of soybean protein using lactic acid bacteria. Food Chem. 2008, 111, 976–982. [Google Scholar] [CrossRef]
- Parrado, J.; Rodriguez-Morgado, B.; Tejada, M.; Hernandez, T.; Garcia, C. Proteomic analysis of enzyme production by Bacillus licheniformis using different feather wastes as the sole fermentation media. Enzyme Microb. Tech. 2014, 57, 1–7. [Google Scholar] [CrossRef]
- Sun, J.; Yu, X.J.; Wang, W.; Zhu, Y.G.; Jiang, J.; Wang, Z. Metabolome analysis of Saccharomyces cerevisiae in different culture patterns and growth phases. J. Zhejiang Univ. Technol. 2017, 45, 654–659. [Google Scholar]
- Liu, X.Y.; Zhu, Q.; Yang, F.; Zhang, J.; Zhang, Q.L.; Li, J.H.; Wang, L. Proteomics reveals the effect of phenylalanine metabolism on the flavor of Daqu. Food Sci. Technol. 2021, 46, 1–6. [Google Scholar]
- Frick, O.; Wittmann, C. Characterization of the metabolic shift between oxidative and fermentative growth in Saccharomyces cerevisiae by comparative 13C flux analysis. Microb. Cell Factories 2005, 4, 30. [Google Scholar] [CrossRef] [PubMed]
- Lu, C.B.; Mao, Y.; Li, G.H.; Zhao, Y.Y.; Deng, Y. Analysis and identification of main antibacterial metabolites secreted by Lactobacillus plantarum DY6. Microbiology 2019, 46, 2258–2271. [Google Scholar] [CrossRef]
- Canibe, N.; Jensen, B.B. Fermented liquid feed and fermented grain to piglets-effect on gastrointestinal ecology and growth performance. Livest. Sci. 2007, 108, 198–201. [Google Scholar] [CrossRef]
- Chang, Y.C.; Nair, M.G. Metabolism of daidzein and genistein by intestinal bacteria. J. Nat. Prod. 1995, 58, 1892–1896. [Google Scholar] [CrossRef]
- Pyo, Y.H.; Lee, T.C.; Lee, Y.C. Enrichment of bioactive isoflavones in soymik fermented with β-glucosidase-producing lactic acid bacteria. Food Res. Int. 2005, 38, 551–559. [Google Scholar] [CrossRef]
- Jin, X.L.; Yang, R.T.; Shang, Y.J.; Dai, F.; Qian, Y.P.; Cheng, L.X.; Zhou, B.; Liu, Z.L. Oxidative coupling of cinnamic acid derivatives and their radical scavenging activities. Chin. Sci. Bull. 2010, 55, 2885–2890. [Google Scholar] [CrossRef]
- Cai, Y.W.; Liu, J.H.; Ma, N. Research status of arachidonic acid-targeted metabonomics in inflammation. Chin. J. Clin. Pharmacol. 2021, 37, 2721–2724. [Google Scholar] [CrossRef]
- Walter, B.W.; Bacher, A. Biosynthesis of thiamin in Bacillus subtilis isolation of mutants accumulating 4-Amino-5-hydroxymethyl-2-methylpyrimidine phosphate. J. Gen. Microbiol. 1977, 103, 350–366. [Google Scholar] [CrossRef]
- Mateus, N.; Freitas, V.D. Evolution and stability of anthocyanin-derived pigments during port wine aging. J. Agric. Food Chem. 2001, 49, 5217–5222. [Google Scholar] [CrossRef]
- Gottschalk, G. Regulation of bacterial metabolism. In Bacterial Metabolism; Springer: New York, NY, USA, 1988; pp. 178–207. [Google Scholar]
- Becker, D.E.; Terrill, S.W. Various carbohydrates in a semipurified diet for the growing pig. Arch. Biochem. Biophys. 1954, 50, 399–403. [Google Scholar] [CrossRef] [PubMed]
- Shi, H.H.; Yang, E.D.; Yang, H.Y.; Huang, X.L.; Zheng, M.X.; Chen, X.Y.; Zhang, J.J. Dynamic changes in the chemical composition and metabolite profiles of drumstick (Moringa oleifera Lam.) leaf flour during fermentation. LWT-Food Sci. Technol. 2022, 155, 112973. [Google Scholar] [CrossRef]
- Ziegler, F.; Nitenberg, G.; Coudray-Lucas, C.; Lasser, P.; Giboudeau, J.; Cynober, L. Pharmacokinetic assessment of an oligopeptide-based enteral formula in abdominal surgery patients. Am. J. Clin. Nutr. 1998, 67, 124–128. [Google Scholar] [CrossRef] [PubMed]
- Idowu, M.D.; Taiwo, G.; Cervantes, A.P.; Bowdridge, S.A.; Ogunade, I.M. Effects of a multicomponent microbial feed additive containing prebiotics and probiotics on health, immune status, metabolism, and performance of newly weaned beef steers during a 35-d receiving period. Transl. Anim. Sci. 2022, 6, 1–11. [Google Scholar] [CrossRef] [PubMed]


Disclaimer/Publisher’s Note: The statements, opinions and data contained in all publications are solely those of the individual author(s) and contributor(s) and not of MDPI and/or the editor(s). MDPI and/or the editor(s) disclaim responsibility for any injury to people or property resulting from any ideas, methods, instructions or products referred to in the content. |
© 2023 by the authors. Licensee MDPI, Basel, Switzerland. This article is an open access article distributed under the terms and conditions of the Creative Commons Attribution (CC BY) license (https://creativecommons.org/licenses/by/4.0/).