
Symbiotic Variations among Wheat Genotypes and Detection of Quantitative Trait Loci for Molecular Interaction with Auxin-Producing Azospirillum PGPR

Abstract
:1. Introduction
2. Materials and Methods
2.1. Plant Material and Bacterial Strains
2.2. Inoculation and Plant Growth Conditions in the Screening Experiment
2.3. Root Sampling and GUS Assays
2.4. Greenhouse Soil Experiment
2.5. Genotyping Data
2.6. Genome Wide Association Study
2.7. Statistics
3. Results
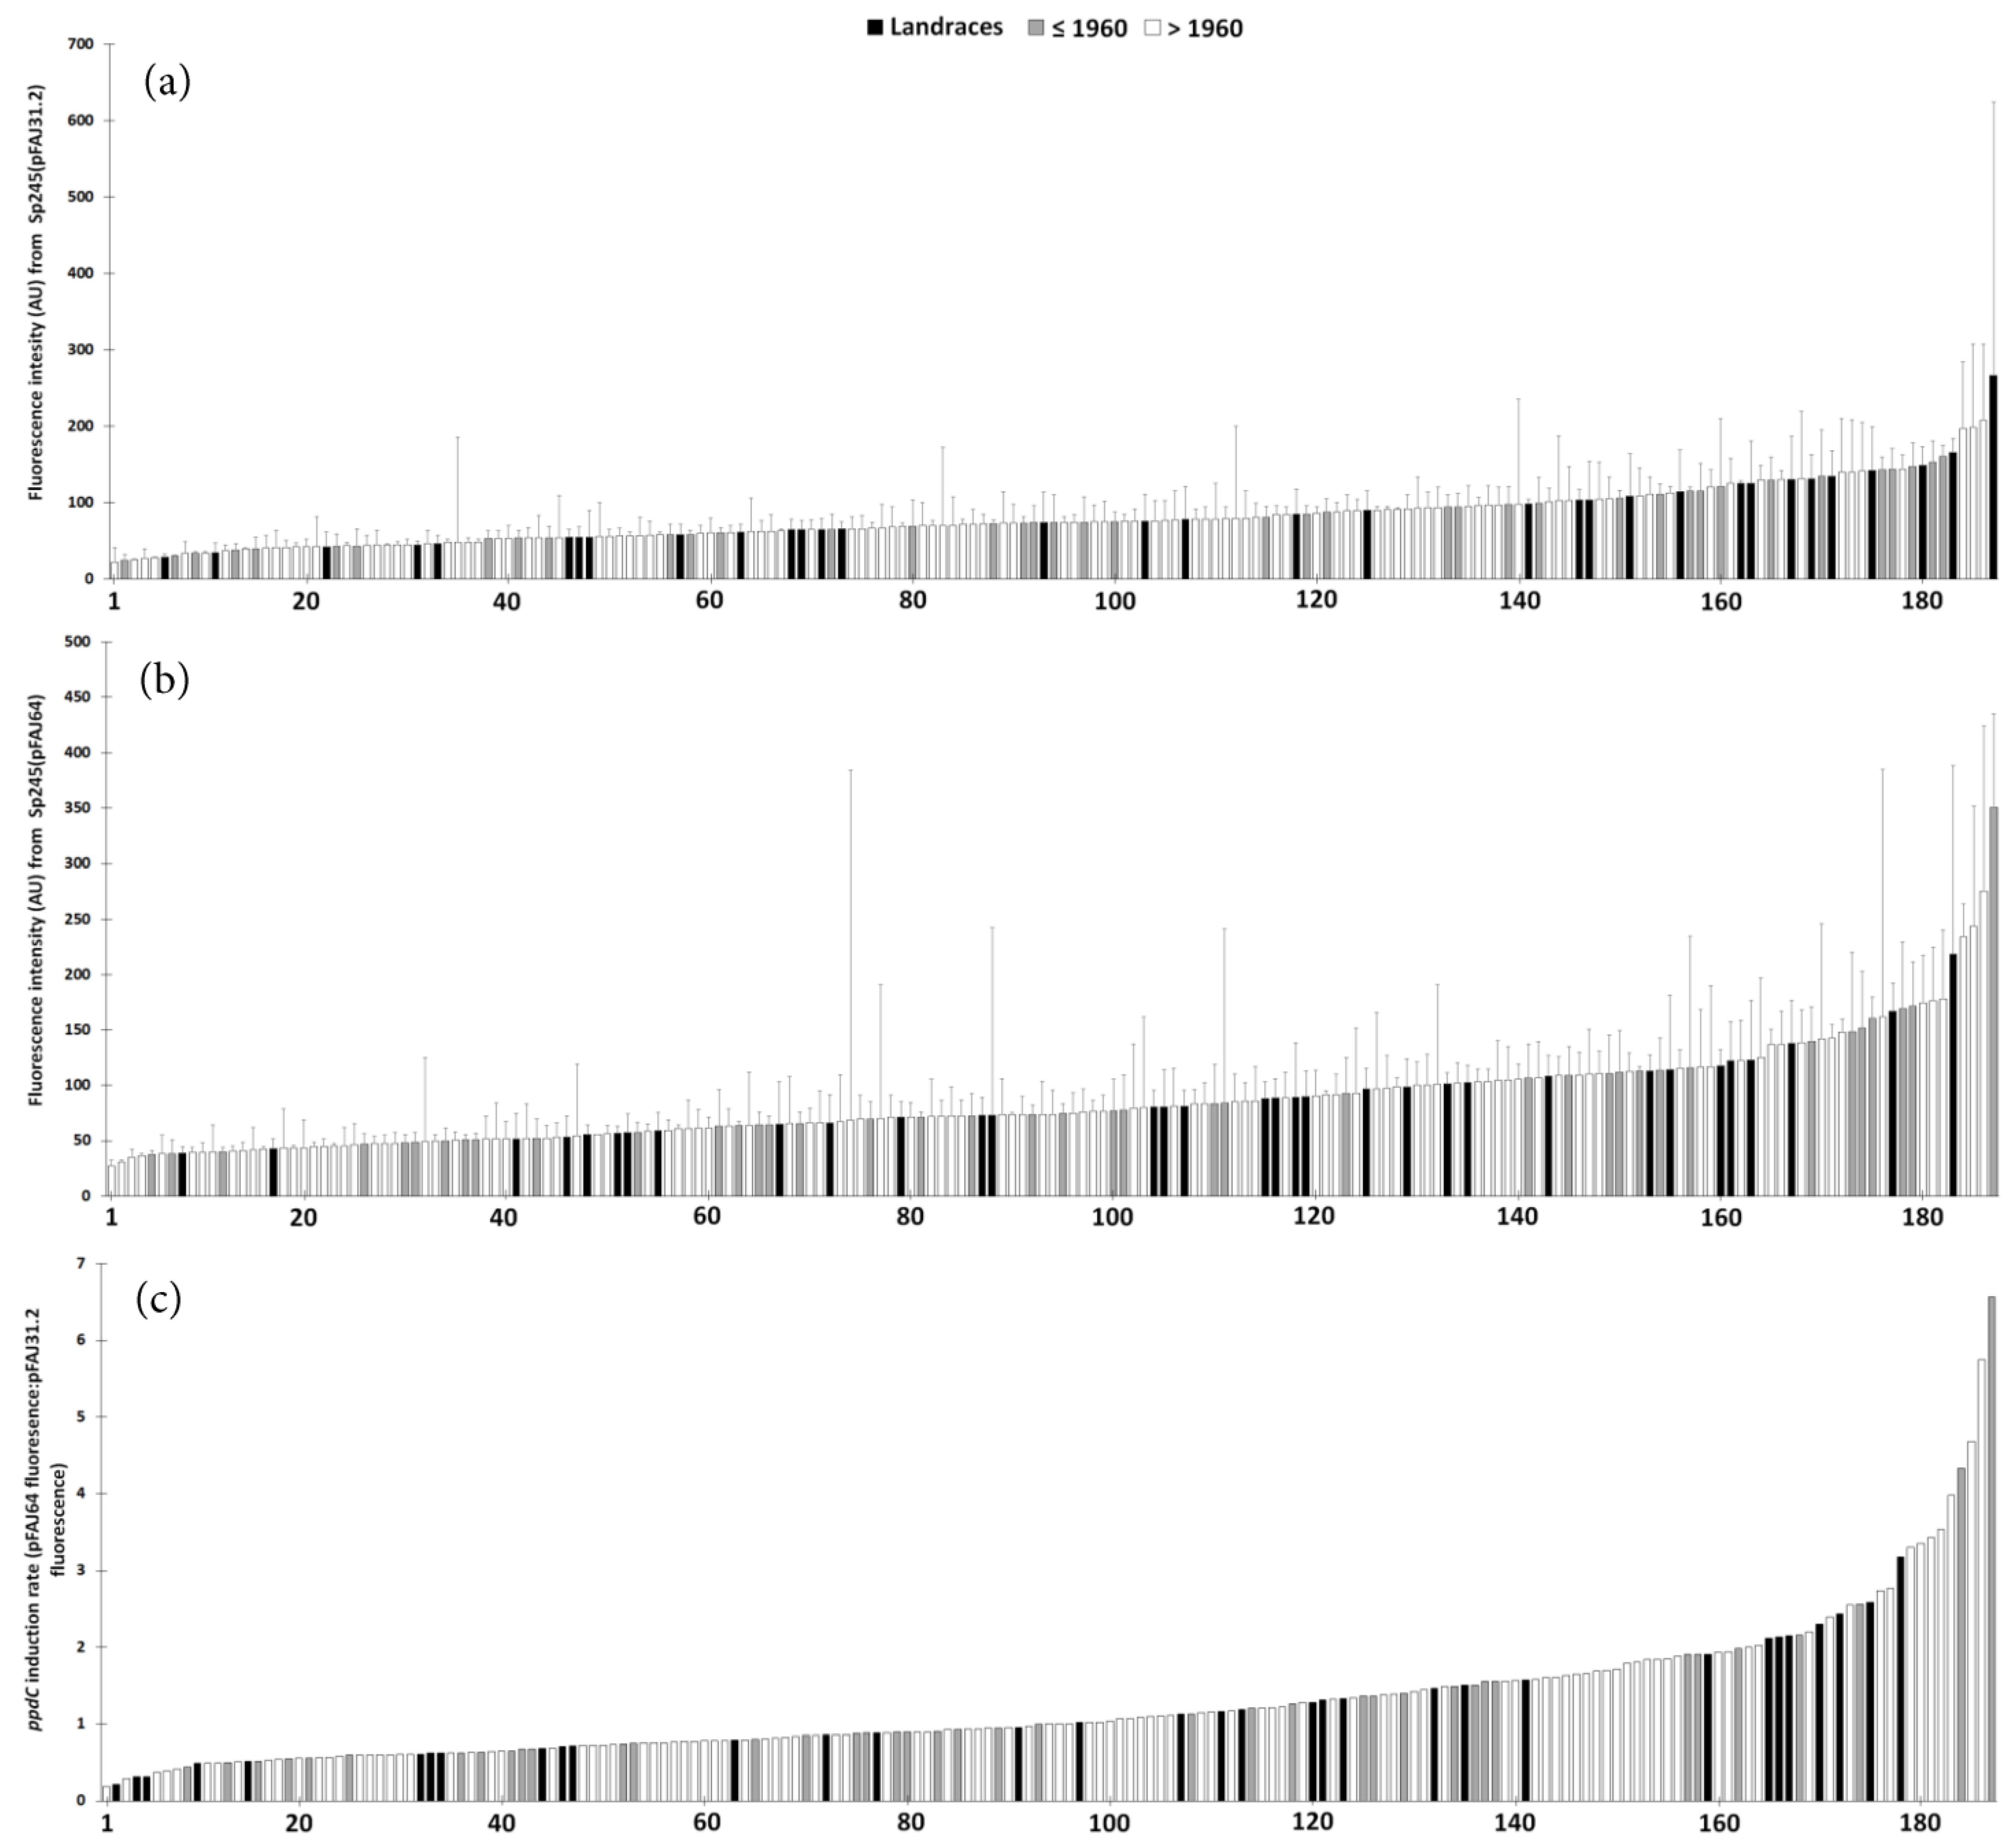
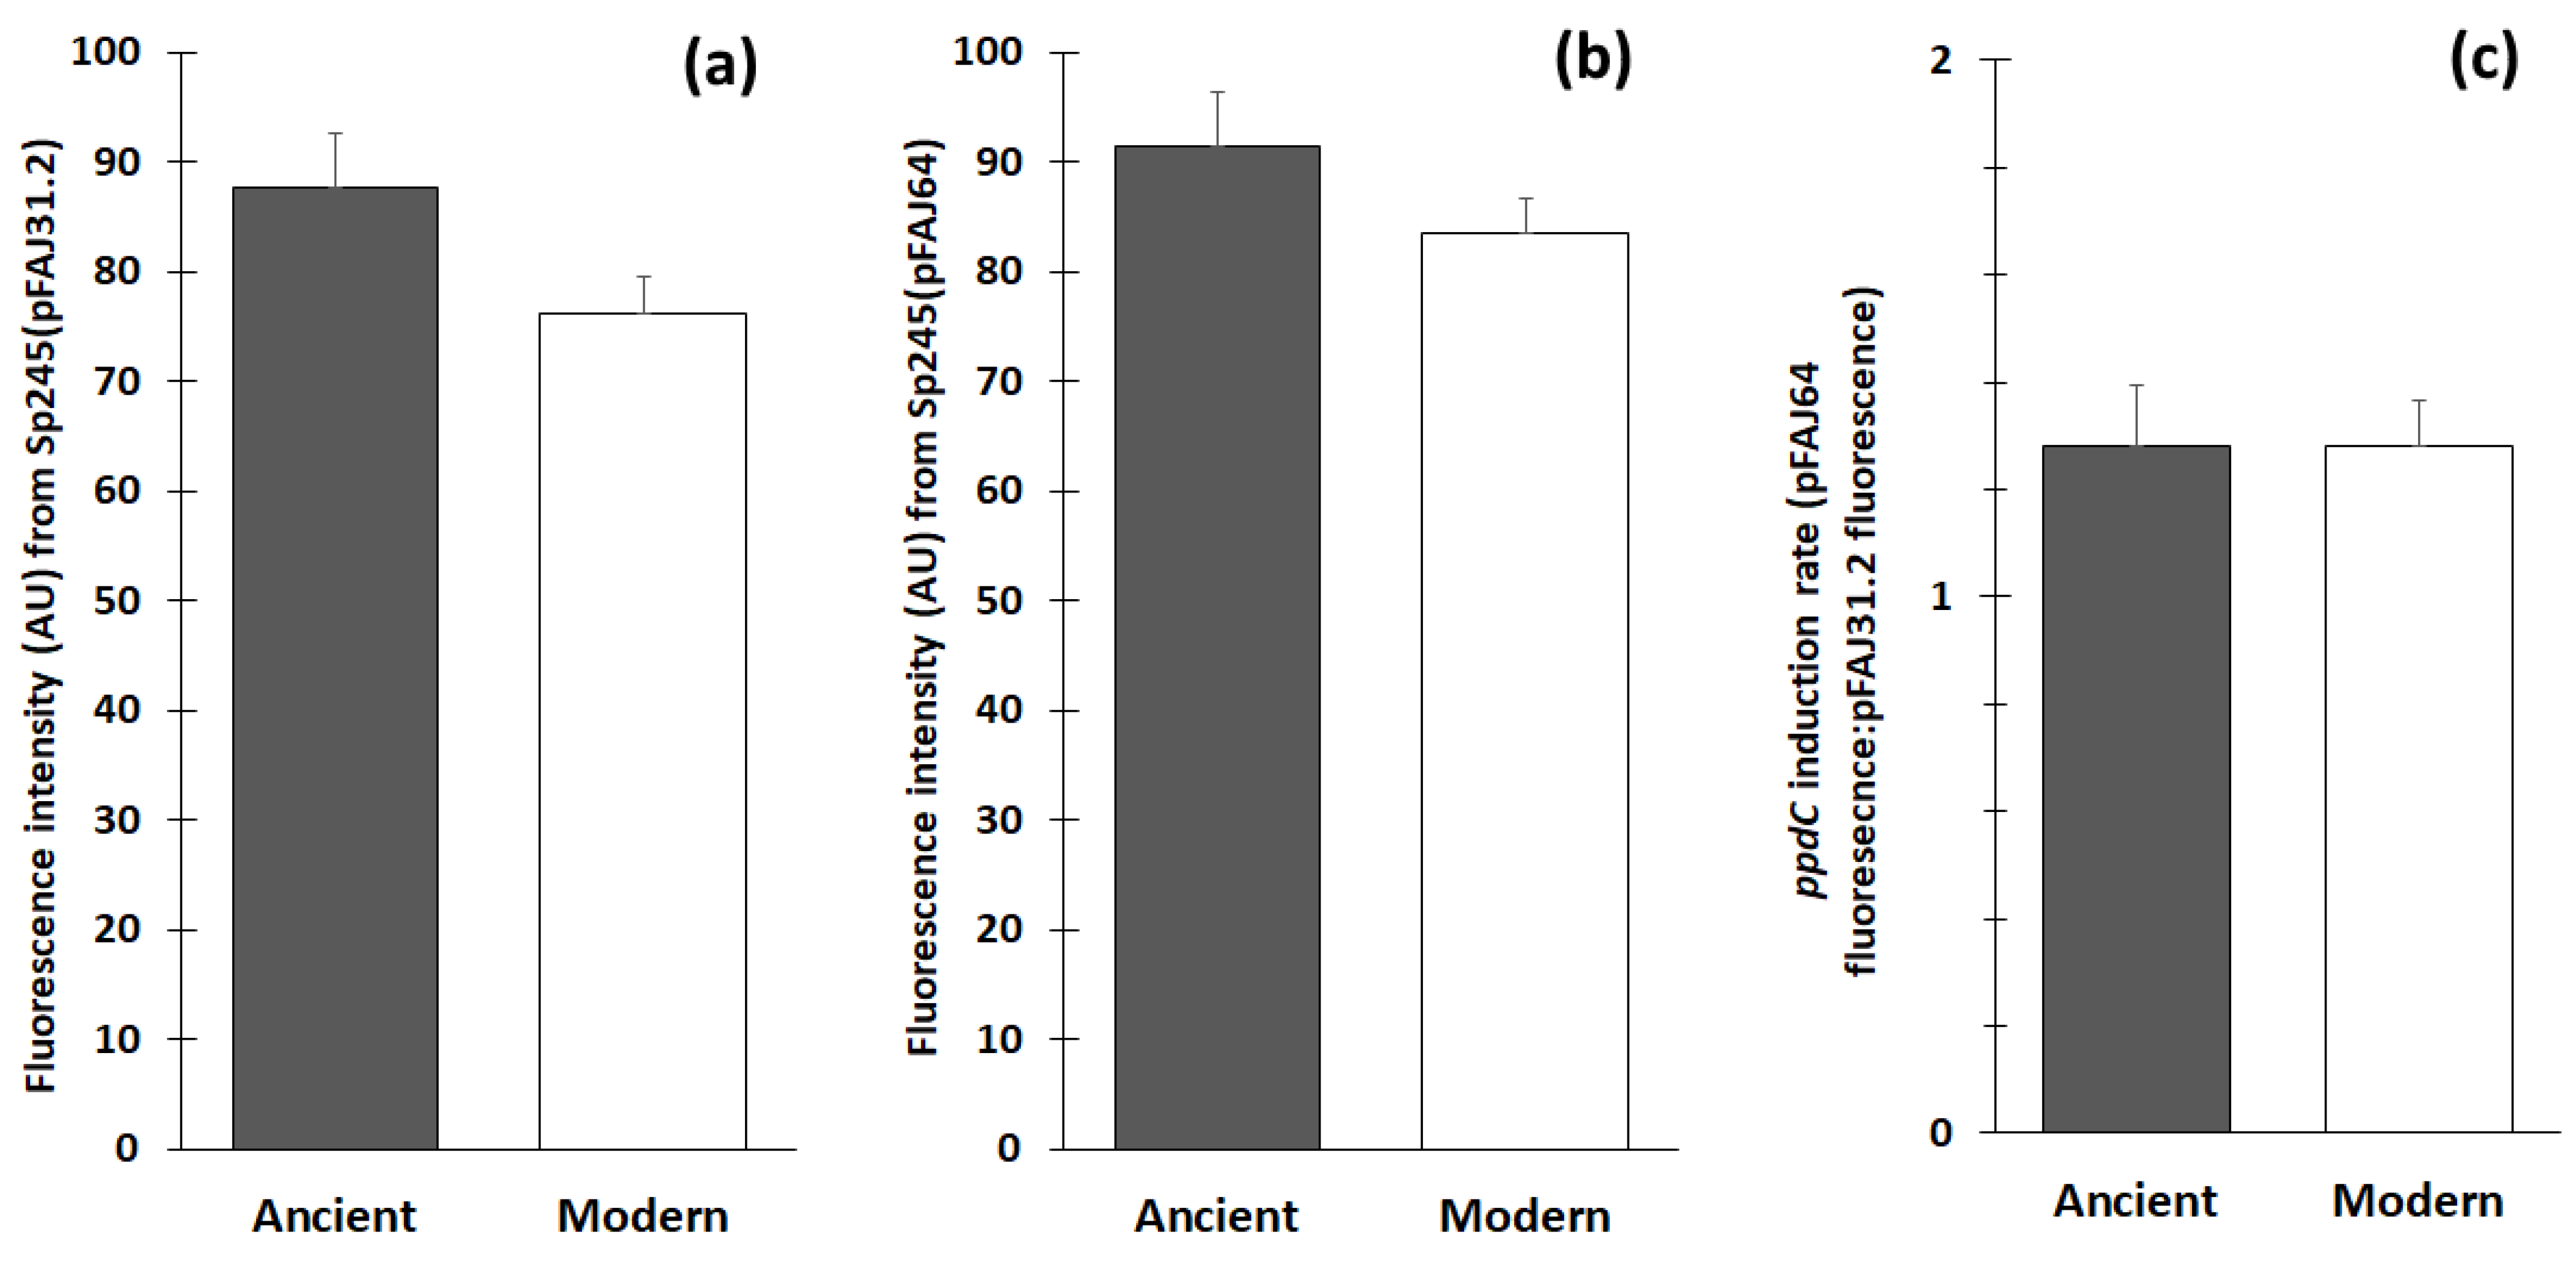
3.1. Sp245 Colonization of Wheat in the Screening Experiment
3.2. ppdC Expression on Wheat in the Screening Experiment
3.3. Impact of Stress on Wheat Genotypes of Different Interaction Abilities
3.4. Stimulation Effects of A. baldaniorum Sp245 on Wheat Genotypes of Different Interaction Abilities
3.5. Wheat Stimulation by A. baldaniorum Sp245 vs. Pseudomonas ogarae F113
3.6. Genome-Wide Association Study with A. baldaniorum Sp245 Data
4. Discussion
5. Conclusions
Supplementary Materials
Author Contributions
Funding
Data Availability Statement
Acknowledgments
Conflicts of Interest
References
- Almario, J.; Muller, D.; Défago, G.; Moënne-Loccoz, Y. Rhizosphere ecology and phytoprotection in soils naturally suppressive to Thielaviopsis black root rot of tobacco. Environ. Microbiol. 2014, 16, 1949–1960. [Google Scholar] [CrossRef] [Green Version]
- Verbon, E.H.; Liberman, L.M. Beneficial microbes affect endogenous mechanisms controlling root development. Trends Plant Sci. 2016, 21, 218–229. [Google Scholar] [CrossRef] [Green Version]
- Prigent-Combaret, C.; Blaha, D.; Pothier, J.F.; Vial, L.; Poirier, M.A.; Wisniewski-Dyé, F.; Moënne-Loccoz, Y. Physical organization and phylogenetic analysis of acdR as leucine-responsive regulator of the 1-aminocyclopropane-1-carboxylate deaminase gene acdS in phytobeneficial Azospirillum lipoferum 4B and other Proteobacteria. FEMS Microbiol. Ecol. 2008, 65, 202–219. [Google Scholar] [CrossRef] [Green Version]
- Vacheron, J.; Desbrosses, G.; Bouffaud, M.-L.; Touraine, B.; Moënne-Loccoz, Y.; Muller, D.; Legendre, L.; Wisniewski-Dyé, F.; Prigent-Combaret, C. Plant growth-promoting rhizobacteria and root system functioning. Front. Plant Sci. 2013, 4, 356. [Google Scholar] [CrossRef] [PubMed] [Green Version]
- Rosier, A.; Medeiros, F.H.; Bais, H.P. Defining plant growth promoting rhizobacteria molecular and biochemical networks in beneficial plant-microbe interactions. Plant Soil 2018, 428, 35–55. [Google Scholar] [CrossRef] [Green Version]
- Bruto, M.; Prigent-Combaret, C.; Muller, D.; Moënne-Loccoz, Y. Analysis of genes contributing to plant-beneficial functions in plant growth-promoting rhizobacteria and related Proteobacteria. Sci. Rep. 2014, 4, 6261. [Google Scholar] [CrossRef] [Green Version]
- Olanrewaju, O.S.; Glick, B.R.; Babalola, O.O. Mechanisms of action of plant growth promoting bacteria. World J. Microbiol. Biotechnol. 2017, 33, 197. [Google Scholar] [CrossRef] [Green Version]
- Neiverth, A.; Delai, S.; Garcia, D.M.; Saatkamp, K.; de Souza, E.M.; de Oliveira Pedrosa, O.; Guimarães, V.F.; dos Santos, M.F.; Vendruscolo, E.C.G.; da Costa, A.C.T. Performance of different wheat genotypes inoculated with the plant growth promoting bacterium Herbaspirillum seropedicae. Eur. J. Soil Biol. 2014, 64, 1–5. [Google Scholar] [CrossRef]
- Kazi, N.; Deaker, R.; Wilson, N.; Muhammad, K.; Trethowan, R. The response of wheat genotypes to inoculation with Azospirillum brasilense in the field. Field Crops Res. 2016, 196, 368–378. [Google Scholar] [CrossRef]
- Vacheron, J.; Combes-Meynet, E.; Walker, V.; Gouesnard, B.; Muller, D.; Moënne-Loccoz, Y.; Prigent-Combaret, C. Expression on roots and contribution to maize phytostimulation of 1-aminocyclopropane-1-decarboxylate deaminase gene acdS in Pseudomonas fluorescens F113. Plant Soil 2016, 407, 187–202. [Google Scholar] [CrossRef]
- Furlan, F.; Saatkamp, K.; Volpiano, C.G.; De Assis Franco, F.; Dos Santos, M.F.; Vendruscolo, E.C.G.; Guimarães, V.F.; Da Costa, A.C.T. Plant growth-promoting bacteria effect in withstanding drought in wheat cultivars. Sci. Agrar. 2017, 18, 104–113. [Google Scholar] [CrossRef] [Green Version]
- Vande Broek, A.; Michiels, J.; Goll, V.; Vanderleyden, J. Spatial-temporal colonization patterns of Azospirillum brasilense on the wheat root surface and expression of the bacterial nifH gene during association. Mol. Plant-Microbe Interact. 1993, 6, 592–600. [Google Scholar] [CrossRef]
- Notz, R.; Maurhofer, M.; Schnider-Keel, U.; Duffy, B.; Haas, D.; Défago, G. Biotic factors affecting expression of the 2,4-diacetylphloroglucinol biosynthesis gene phlA in Pseudomonas fluorescens biocontrol strain CHA0 in the rhizosphere. Phytopathology 2001, 91, 873–881. [Google Scholar] [CrossRef] [PubMed] [Green Version]
- Ramos, H.J.O.; Roncato-Maccari, L.D.B.; Souza, E.M.; Soares-Ramos, J.R.L.; Hungria, M.; Pedrosa, F.O. Monitoring Azospirillum-wheat interactions using the gfp and gusA genes constitutively expressed from a new broad-host range vector. J. Biotechnol. 2002, 97, 243–252. [Google Scholar] [CrossRef]
- Spaepen, S.; Vanderleyden, J.; Remans, R. Indole-3-acetic acid in microbial and microorganism-plant signaling. FEMS Microbiol. Rev. 2007, 31, 425–448. [Google Scholar] [CrossRef] [Green Version]
- de Werra, P.; Huser, A.; Tabacchi, R.; Keel, C.; Maurhofer, M. Plant-and microbe-derived compounds affect the expression of genes encoding antifungal compounds in a pseudomonad with biocontrol activity. Appl. Environ. Microbiol. 2011, 77, 2807–2812. [Google Scholar] [CrossRef] [Green Version]
- Germida, J.J.; Siciliano, S.D. Taxonomic diversity of bacteria associated with the roots of modern, recent and ancient wheat cultivars. Biol. Fertil. Soils 2001, 33, 410–415. [Google Scholar]
- Micallef, S.A.; Shiaris, M.P.; Colón-Carmona, A. Influence of Arabidopsis thaliana accessions on rhizobacterial communities and natural variation in root exudates. J. Exp. Bot. 2009, 60, 1729–1742. [Google Scholar] [CrossRef] [Green Version]
- Bouffaud, M.L.; Poirier, M.A.; Muller, D.; Moënne-Loccoz, Y. Root microbiome relates to plant host evolution in maize and other Poaceae. Environ. Microbiol. 2014, 16, 2804–2814. [Google Scholar] [CrossRef] [PubMed]
- Bouffaud, M.L.; Renoud, S.; Dubost, A.; Moënne-Loccoz, Y.; Muller, D. 1-Aminocyclopropane-1-carboxylate deaminase producers associated to maize and other Poaceae species. Microbiome 2018, 6, 114. [Google Scholar] [CrossRef] [PubMed] [Green Version]
- Szoboszlay, M.; Lambers, J.; Chappell, J.; Kupper, J.V.; Moe, L.A.; McNear, D.H. Comparison of root system architecture and rhizosphere microbial communities of Balsas teosinte and domesticated corn cultivars. Soil Biol. Biochem. 2015, 80, 34–44. [Google Scholar] [CrossRef]
- Stromberger, M.E.; Abduelafez, I.; Byrne, P.; Canela, M.M.; Elamari, A.A.; Manter, D.K.; Weir, T. Genotype-specific enrichment of 1-aminocyclopropane-1-carboxylic acid deaminase-positive bacteria in winter wheat rhizospheres. Soil Sci. Soc. Am. J. 2017, 81, 796–805. [Google Scholar] [CrossRef] [Green Version]
- Knauth, S.; Hurek, T.; Brar, D.; Reinhold-Hurek, B. Influence of different Oryza cultivars on expression of nifH gene pools in roots of rice. Environ. Microbiol. 2005, 7, 1725–1733. [Google Scholar] [CrossRef] [PubMed]
- Bouffaud, M.L.; Renoud, S.; Moënne-Loccoz, Y.; Muller, D. Is plant evolutionary history impacting recruitment of diazotrophs and nifH expression in the rhizosphere? Sci. Rep. 2016, 6, 1–9. [Google Scholar] [CrossRef] [Green Version]
- Salamini, F.; Özkan, H.; Brandolini, A.; Schäfer-Pregl, R.; Martin, W. Genetics and geography of wild cereal domestication in the near east. Nat. Rev. Genet. 2002, 3, 429–441. [Google Scholar] [CrossRef]
- Peng, J.H.; Sun, D.; Nevo, E. Domestication evolution, genetics and genomics in wheat. Mol. Breed. 2011, 28, 281–301. [Google Scholar] [CrossRef]
- Berkman, P.J.; Visendi, P.; Lee, H.C.; Stiller, J.; Manoli, S.; Lorenc, M.T.; Lai, K.; Batley, J.; Fleury, D.; Šimková, H.; et al. Dispersion and domestication shaped the genome of bread wheat. Plant Biotechnol. J. 2013, 11, 564–571. [Google Scholar] [CrossRef] [Green Version]
- Beleggia, R.; Rau, D.; Laido, G.; Platani, C.; Nigro, F.; Fragasso, M.; De Vita, P.; Scossa, F.; Fernie, A.R.; Nikoloski, Z.; et al. Evolutionary metabolomics reveals domestication-associated changes in tetraploid wheat kernels. Mol. Biol. Evol. 2016, 33, 1740–1753. [Google Scholar] [CrossRef] [PubMed] [Green Version]
- Brancourt-Hulmel, M.; Doussinault, G.; Lecomte, C.; Bérard, P.; Le Buanec, B.; Trottet, M. Genetic improvement of agronomic traits of winter wheat cultivars released in France from 1946 to 1992. Crop Sci. 2003, 43, 37–45. [Google Scholar] [CrossRef]
- Bonnin, I.; Bonneuil, C.; Goffaux, R.; Montalent, P.; Goldringer, I. Explaining the decrease in the genetic diversity of wheat in France over the 20th century. Agric. Ecosyst. Environ. 2014, 195, 183–192. [Google Scholar] [CrossRef]
- Baranski, M.R. Wide adaptation of Green Revolution wheat: International roots and the Indian context of a new plant breeding ideal, 1960–1970. Stud. Hist. Philos. Sci. C Stud. Hist. Philos. Biol. Biomed. Sci. 2015, 50, 41–50. [Google Scholar] [CrossRef] [PubMed]
- Shaposhnikov, A.; Morgounov, A.; Akin, B.; Makarova, N.; Belimov, A.; Tikhonovich, I. Comparative characteristics of root systems and root exudation of synthetic, landrace and modern wheat varieties. Agric. Biol. 2016, 51, 68–78. [Google Scholar]
- Iannucci, A.; Fragasso, M.; Beleggia, R.; Nigro, F.; Papa, R. Evolution of the crop rhizosphere: Impact of domestication on root exudates in tetraploid wheat (Triticum turgidum L.). Front. Plant Sci. 2017, 8, 2124. [Google Scholar] [CrossRef] [Green Version]
- Gotti, R.; Amadesi, E.; Fiori, J.; Bosi, S.; Bregola, V.; Marotti, I.; Dinelli, G. Differentiation of modern and ancient varieties of common wheat by quantitative capillary electrophoretic profile of phenolic acids. J. Chromatogr. A 2018, 1532, 208–215. [Google Scholar] [CrossRef]
- Junaidi, J.; Kallenbach, C.M.; Byrne, P.F.; Fonte, S.J. Root traits and root biomass allocation impact how wheat genotypes respond to organic amendments and earthworms. PLoS ONE 2018, 13, e0200646. [Google Scholar] [CrossRef] [Green Version]
- Beyer, S.; Daba, S.; Tyagi, P.; Bockelman, H.; Brown-Guedira, G. Loci and candidate genes controlling root traits in wheat seedlings—A wheat root GWAS. Funct. Integr. Genom. 2018, 19, 91–107. [Google Scholar] [CrossRef]
- Muranty, H.; Pavoine, M.T.; Doussinault, G.; Barloy, D. Origin of powdery mildew resistance factors in RE714, a wheat breeding line obtained from two interspecific crosses. Plant Breed. 2010, 129, 465–471. [Google Scholar] [CrossRef]
- Ambrozková, M.; Dedryver, F.; Dumalasová, V.; Hanzalová, A.; Bartos, P. Determination of the cluster of wheat rust resistance genes Yr17, Lr37 and Sr38 by a molecular marker. Plant Protect. Sci. 2002, 38, 41–45. [Google Scholar] [CrossRef] [Green Version]
- Dumalasová, V.; Palicová, J.; Hanzalová, A.; Bížová, I.; Leišová-Svobodová, L. Eyespot resistance gene Pch1 and methods of study of its effectiveness in wheat cultivars. Czech J. Genet. Plant Breed. 2015, 51, 166–173. [Google Scholar] [CrossRef] [Green Version]
- Engelhard, M.; Hurek, T.; Reinhold-Hurek, B. Preferential occurrence of diazotrophic endophytes, Azoarcus spp., in wild rice species and land races of Oryza sativa in comparison with modern races. Environ. Microbiol. 2000, 2, 131–141. [Google Scholar] [CrossRef]
- Leff, J.W.; Lynch, R.C.; Kane, N.C.; Fierer, N. Plant domestication and the assembly of bacterial and fungal communities associated with strains of the common sunflower, Helianthus annuus. New Phytol. 2017, 214, 412–423. [Google Scholar] [CrossRef]
- Johnston-Monje, D.; Mousa, W.K.; Lazarovits, G.; Raizada, M.N. Impact of swapping soils on the endophytic bacterial communities of pre-domesticated, ancient and modern maize. BMC Plant Biol. 2014, 14, 233. [Google Scholar] [CrossRef] [Green Version]
- Bulgarelli, D.; Garrido-Oter, R.; Münch, P.C.; Weiman, A.; Dröge, J.; Pan, Y.; McHardy, A.C.; Schulze-Lefert, P. Structure and function of the bacterial root microbiota in wild and domesticated barley. Cell Host Microbe 2015, 17, 392–403. [Google Scholar] [CrossRef] [Green Version]
- Valente, J.; Gerin, F.; Le Gouis, J.; Moënne-Loccoz, Y.; Prigent-Combaret, C. Ancient wheat varieties have a higher ability to interact with plant growth-promoting rhizobacteria. Plant Cell Environ. 2019, 43, 246–260. [Google Scholar] [CrossRef]
- Fedi, S.; Tola, E.; Moënne-Loccoz, Y.; Dowling, D.N.; Smith, L.M.; O’Gara, F. Evidence for signaling between the phytopathogenic fungus Pythium ultimum and Pseudomonas fluorescens F113: P. ultimum represses the expression of genes in P. fluorescens F113, resulting in altered ecological fitness. Appl. Environ. Microbiol. 1997, 63, 4261–4266. [Google Scholar] [CrossRef] [Green Version]
- Couillerot, O.; Combes-Meynet, E.; Pothier, J.F.; Bellvert, F.; Challita, E.; Poirier, M.A.; Rohr, R.; Comte, G.; Moënne-Loccoz, Y.; Prigent-Combaret, C. The role of the antimicrobial compound 2,4-diacetylphloroglucinol in the impact of biocontrol Pseudomonas fluorescens F113 on Azospirillum brasilense phytostimulators. Microbiology 2011, 157, 1694–1705. [Google Scholar] [CrossRef] [PubMed] [Green Version]
- Vande Broek, A.; Lambrecht, M.; Eggermont, K.; Vanderleyden, J. Auxins upregulate expression of the indole-3-pyruvate decarboxylase gene in Azospirillum brasilense. J. Bacteriol. 1999, 181, 1338–1342. [Google Scholar] [CrossRef] [Green Version]
- Spaepen, S.; Dobbelaere, S.; Croonenborghs, A.; Vanderleyden, J. Effects of Azospirillum brasilense indole-3-acetic acid production on inoculated wheat plants. Plant Soil 2008, 312, 15–23. [Google Scholar] [CrossRef]
- Cassán, F.; Vanderleyden, J.; Spaepen, S. Physiological and agronomical aspects of phytohormone production by model plant-growth-promoting rhizobacteria (PGPR) belonging to the genus Azospirillum. J. Plant Growth Regul. 2014, 33, 440–459. [Google Scholar] [CrossRef]
- Rivera, D.; Mora, V.; Lopez, G.; Rosas, S.; Spaepen, S.; Vanderleyden, J.; Cassán, F. New insights into indole-3-acetic acid metabolism in Azospirillum brasilense. J. Appl. Microbiol. 2018, 125, 1774–1785. [Google Scholar] [CrossRef] [PubMed]
- Pagnussat, L.A.; Maroniche, G.; Curatti, L.; Creus, C. Auxin-dependent alleviation of oxidative stress and growth promotion of Scenedesmus obliquus C1S by Azospirillum brasilense. Algal Res. 2020, 47, 101839. [Google Scholar] [CrossRef]
- Gruet, C.; Oudot, A.; Abrouk, D.; Moënne-Loccoz, Y.; Muller, D. Rhizophere analysis of auxin producers harboring the phenylpyruvate decarboxylase pathway. Appl. Soil Ecol. 2022, 173, 104363. [Google Scholar] [CrossRef]
- Carrillo-Flores, E.; Arreola-Rivera, J.; Pazos-Solís, D.M.; Bocanegra-Mondragón, M.; Fierro-Romero, G.; Mellado-Rojas, M.E.; Beltrán-Peña, E. Participation of auxin transport in the early response of the Arabidopsis root system to inoculation with Azospirillum brasilense. Phyton 2022, 91, 2383. [Google Scholar] [CrossRef]
- Meier, M.A.; Xu, G.; Lopez-Guerrero, M.G.; Li, G.; Smith, C.; Sigmon, B.; Herr, J.R.; Alfano, J.R.; Ge, Y.; Schnable, J.C.; et al. Association analyses of host genetics, root-colonizing microbes, and plant phenotypes under different nitrogen conditions in maize. eLife 2022, 11, e75790. [Google Scholar] [CrossRef]
- Wang, Y.; Wang, X.; Sun, S.; Jin, C.; Su, J.; Wei, J.; Luo, X.; Wen, J.; Wei, T.; Sahu, S.K.; et al. GWAS, MWAS and mGWAS provide insights into precision agriculture based on genotype-dependent microbial effects in foxtail millet. Nat. Comm. 2022, 13, 5913. [Google Scholar] [CrossRef] [PubMed]
- Cormier, F.; Le Gouis, J.; Dubreuil, P.; Lafarge, S.; Praud, S. A genome-wide identification of chromosomal regions determining nitrogen use efficiency components in wheat (Triticum aestivum L.). Theor. Appl. Genet. 2014, 127, 2679–2693. [Google Scholar] [CrossRef]
- Kollers, S.; Rodemann, B.; Ling, J.; Korzun, V.; Ebmeyer, E.; Argillier, O.; Hinze, M.; Plieske, J.; Kulosa, D.; Ganal, M.W.; et al. Whole genome association mapping of Fusarium head blight resistance in European winter wheat (Triticum aestivum L.). PLoS ONE 2013, 8, e57500. [Google Scholar] [CrossRef] [Green Version]
- Lehnert, H.; Serfling, A.; Enders, M.; Friedt, W.; Ordon, F. Genetics of mycorrhizal symbiosis in winter wheat (Triticum aestivum). New Phytol. 2017, 215, 779–791. [Google Scholar] [CrossRef] [Green Version]
- Lehnert, H.; Serfling, A.; Friedt, W.; Ordon, F. Genome-wide association studies reveal genomic regions associated with the response of wheat (Triticum aestivum L.) to mycorrhizae under drought stress conditions. Front. Plant Sci. 2018, 9, 1728. [Google Scholar] [CrossRef] [Green Version]
- De Vita, P.; Avio, L.; Sbrana, C.; Laidò, G.; Marone, D.; Mastrangelo, A.M.; Cattivelli, L.; Giovannetti, M. Genetic markers associated to arbuscular mycorrhizal colonization in durum wheat. Sci. Rep. 2018, 8, 1–12. [Google Scholar] [CrossRef] [Green Version]
- Wintermans, P.C.; Bakker, P.A.; Pieterse, C.M. Natural genetic variation in Arabidopsis for responsiveness to plant growth-promoting rhizobacteria. Plant Mol. Biol. 2016, 90, 623–634. [Google Scholar] [CrossRef] [Green Version]
- Plucani do Amaral, F.; Wang, J.; Williams, J.; Tuleski, T.R.; Joshi, T.; Ferreira, M.A.; Stacey, G. Mapping genetic variation in Arabidopsis in response to plant growth-promoting bacterium Azoarcus olearius DQS-4T. Microorganisms 2023, 11, 331. [Google Scholar] [CrossRef]
- Vidotti, M.S.; Lyra, D.H.; Morosini, J.S.; Granato, Í.S.C.; Quecine, M.C.; Azevedo, J.L.D.; Fritsche-Neto, R. Additive and heterozygous (dis)advantage GWAS models reveal candidate genes involved in the genotypic variation of maize hybrids to Azospirillum brasilense. PLoS ONE 2019, 14, e0222788. [Google Scholar] [CrossRef] [Green Version]
- Borojevic, K.; Borojevic, K. The transfer and history of ‘‘Reduced Height Genes’’ (Rht) in wheat from Japan to Europe. J. Hered. 2005, 96, 455–459. [Google Scholar] [CrossRef] [Green Version]
- Nelson, L.M.; Knowles, R. Effect of oxygen and nitrate on nitrogen fixation and denitrification by Azospirillum brasilense grown in continuous culture. Can. J. Microbiol. 1978, 24, 1395–1403. [Google Scholar] [CrossRef]
- Pothier, J.F.; Wisniewski-Dyé, F.; Weiss-Gayet, M.; Moënne-Loccoz, Y.; Prigent-Combaret, C. Promoter-trap identification of wheat seed extract-induced genes in the plant-growth-promoting rhizobacterium Azospirillum brasilense Sp245. Microbiology 2007, 153, 3608–3622. [Google Scholar] [CrossRef] [Green Version]
- Jefferson, R.A. Assaying chimeric genes in plants: The GUS gene fusion system. Plant Mol. Biol. Rep. 1987, 5, 387–405. [Google Scholar] [CrossRef]
- Rimbert, H.; Darrier, B.; Navarro, J.; Kitt, J.; Choulet, F.; Leveugle, M.; Duarte, J.; Rivière, N.; Eversole, K.; Le Gouis, J.; et al. High throughput SNP discovery and genotyping in hexaploid wheat. PLoS ONE 2018, 13, e0186329. [Google Scholar] [CrossRef] [Green Version]
- Didion, J.P.; Yang, H.; Sheppard, K.; Fu, C.P.; McMillan, L.; De Villena, F.P.M.; Churchill, G.A. Discovery of novel variants in genotyping arrays improves genotype retention and reduces ascertainment bias. BMC Genom. 2012, 13, 34. [Google Scholar] [CrossRef] [Green Version]
- Browning, B.L.; Browning, S.R. Genotype imputation with millions of reference samples. Am. J. Hum. Genet. 2016, 98, 116–126. [Google Scholar] [CrossRef] [Green Version]
- Appels, R.; Eversole, K.; Feuillet, C.; Keller, B.; Rogers, J.; Pozniak, C.J.; Choulet, F.; Distelfeld, A.; Poland, J.; Ronen, G.; et al. Shifting the limits in wheat research and breeding using a fully annotated reference genome. Science 2018, 361, eaar7191. [Google Scholar]
- Aulchenko, Y.S.; Ripke, S.; Isaacs, A.; van Duijn, C.M. GenABEL: An R library for genome-wide association analysis. Bioinformatics 2007, 23, 1294–1296. [Google Scholar] [CrossRef] [Green Version]
- Thompson, E.; Shaw, R. Pedigree analysis for quantitative traits: Variance components without matrix inversion. Biometrics 1990, 46, 399–413. [Google Scholar] [CrossRef] [Green Version]
- Chen, W.M.; Abecasis, G.R. Family-based association tests for genomewide association scans. Am. J. Hum. Genet. 2007, 81, 913–926. [Google Scholar] [CrossRef] [PubMed] [Green Version]
- Rincent, R.; Moreau, L.; Monod, H.; Kuhn, E.; Melchinger, A.E.; Malvar, R.A.; Moreno-Gonzalez, J.; Nicolas, S.; Madur, D.; Combes, V.; et al. Recovering power in association mapping panels with variable levels of linkage disequilibrium. Genetics 2014, 197, 375–387. [Google Scholar] [CrossRef] [Green Version]
- VanRaden, P. Efficient methods to compute genomic predictions. J. Dairy Sci. 2008, 91, 4414–4423. [Google Scholar] [CrossRef] [Green Version]
- Li, J.; Ji, L. Adjusting multiple testing in multilocus analyses using the eigenvalues of a correlation matrix. Heredity 2005, 95, 221–227. [Google Scholar] [CrossRef] [PubMed] [Green Version]
- Rengel, Z. Root exudation and microflora populations in rhizosphere. Plant Soil 1997, 196, 255–260. [Google Scholar] [CrossRef]
- Daneshbakhsn, B.; Khoshgoftarmanesh, A.H.; Shariatmadari, H.; Cakmak, I. Phytosiderophore release by wheat genotypes differing in zinc deficiency tolerance grown with Zn-free nutrient solution as affected by salinity. J. Plant Physiol. 2013, 170, 41–46. [Google Scholar] [CrossRef] [PubMed]
- Brazelton, J.N.; Pfeufer, E.E.; Sweat, T.A.; McSpadden Gardener, B.B.; Coenen, C. 2,4-diacetylphloroglucinol alters plant root development. Mol. Plant-Microbe Interact. 2008, 21, 1349–1358. [Google Scholar] [CrossRef] [Green Version]
- Jain, D.K.; Patriquin, D.G. Root hair deformation, bacterial attachment, and plant growth in wheat-Azospirillum associations. Appl. Environ. Microbiol. 1984, 48, 1208–1213. [Google Scholar] [CrossRef] [Green Version]
- Drogue, B.; Doré, H.; Borland, S.; Wisniewski-Dyé, F.; Prigent-Combaret, C. Which specificity in cooperation between phytostimulating rhizobacteria and plants? Res. Microbiol. 2012, 163, 500–510. [Google Scholar] [CrossRef]
- Drogue, B.; Sanguin, H.; Borland, S.; Prigent-Combaret, C.; Wisniewski-Dyé, F. Genome wide profiling of Azospirillum lipoferum 4B gene expression during interaction with rice roots. FEMS Microbiol. Ecol. 2014, 87, 543–555. [Google Scholar] [CrossRef] [Green Version]
- Drogue, B.; Sanguin, H.; Chamam, A.; Mozar, M.; Llauro, C.; Panaud, O.; Prigent-Combaret, C.; Picault, N.; Wisniewski-Dyé, F. Plant root transcriptome profiling reveals a strain-dependent response during Azospirillum-rice cooperation. Front. Plant Sci. 2014, 5, 607. [Google Scholar] [CrossRef] [Green Version]
- Chamam, A.; Wisniewski-Dyé, F.; Comte, G.; Bertrand, C.; Prigent-Combaret, C. Differential responses of Oryza sativa secondary metabolism to biotic interactions with cooperative, commensal and phytopathogenic bacteria. Planta 2015, 242, 1439–1452. [Google Scholar] [CrossRef]
- Zeffa, D.M.; Perini, L.J.; Silva, M.B.; de Sousa, N.V.; Scapim, C.A.; Oliveira, A.L.M.D. Azospirillum brasilense promotes increases in growth and nitrogen use efficiency of maize genotypes. PLoS ONE 2019, 14, e0215332. [Google Scholar] [CrossRef] [PubMed] [Green Version]
- Barbosa, J.Z.; de Almeida Roberto, L.; Hungria, M.; Corrêa, R.S.; Magri, E.; Correia, T.D. Meta-analysis of maize responses to Azospirillum brasilense inoculation in Brazil: Benefits and lessons to improve inoculation efficiency. Appl. Soil Ecol. 2022, 170, 104276. [Google Scholar] [CrossRef]
- Díaz De León, J.L.; Castellanos, T.; Ling, J.; Rojas-Hernández, A.; Röder, M.S. Quantitative trait loci underlying the adhesion of Azospirillum brasilense cells to wheat roots. Euphytica 2015, 204, 81–90. [Google Scholar] [CrossRef]
- Balfourier, F.; Roussel, V.; Strelchenko, P.; Exbrayat-Vinson, F.; Sourdille, P.; Boutet, G.; Koenig, J.; Ravel, C.; Mitrofanova, O.; Beckert, M. A worldwide bread wheat core collection arrayed in a 384-well plate. Theor. Appl. Genet. 2007, 114, 1265–1275. [Google Scholar] [CrossRef] [PubMed]


| Ancient | Modern | |
|---|---|---|
| Root colonization by Sp245 | ||
| 25 best genotypes | 20.5% a † | 8.8% b |
| 50 best genotypes | 38.4% a | 19.3% b |
| 50 worst genotypes | 24.7% | 28.1% |
| 25 worst genotypes | 13.7% | 13.2% |
| ppdC expression in Sp245 | ||
| 25 best genotypes | 15.1% | 12.3% |
| 50 best genotypes | 31.5% | 23.8% |
| 50 worst genotypes | 20.6% | 30.7% |
| 25 worst genotypes | 6.8% a | 17.5% b |
| Landraces | Old Varieties (≤1960) | Modern Genotypes (>1960) | |
|---|---|---|---|
| A Genotypes most colonized by Sp245 and/or F113 | |||
| All 86 genotypes | 23/23 (100%) | 21/21 (100%) | 42/42 (100%) |
| 36 genotypes most colonized by Sp245 only | 11/23 (47.8%) | 7/21 (33.3%) | 18/42 (47.6%) |
| 36 genotypes most colonized by F113 only | 9/23 (39.1%) | 7/21 (33.3%) | 20/42 (42.9%) |
| 14 genotypes most colonized by Sp245 and F113 | 3/23 (13.0%) ab † | 7/21 (33.3%) b | 4/42 (9.5%) a |
| Genotypes least colonized by Sp245 and/or F113 | |||
| All 85 genotypes | 14/14 (100%) | 17/17 (100%) | 54/54 (100%) |
| 35 genotypes least colonized by Sp245 only | 8/14 (57.1%) | 8/17 (47.1%) | 19/54 (35.2%) |
| 35 genotypes least colonized by F113 only | 6/14 (42.9%) | 7/17 (41.2%) | 22/54 (40.7%) |
| 15 genotypes least colonized by Sp245 and F113 | 0/14 (0%) a | 2/17 (11.8%) ab | 13/54 (24.1%) b |
| B Genotypes showing the highest ppdC and/or phl expression in root-colonizing PGPR | |||
| All 88 genotypes | 18/18 (100%) | 24/24 (100%) | 46/46 (100%) |
| 38 genotypes with high ppdC expression only | 7/18 (38.9%) | 7/24 (29.2%) | 24/46 (52.2%) |
| 38 genotypes with high phl expression only | 9/18 (50.0%) | 10/24 (41.7%) | 19/46 (41.3%) |
| 12 genotypes with high ppdC and phl expression | 2/18 (11.1%) ab † | 7/24 (29.2%) b | 3/46 (6.5%) a |
| Genotypes showing the lowest ppdC and/or phl expression in root-colonizing PGPR | |||
| All 87 genotypes | 14/14 (100%) | 16/16 (100%) | 57/57 (100%) |
| 37 genotypes with low ppdC expression only | 4/14 (28.6%) | 6/16 (37.5%) | 27/57 (47.4%) |
| 37 genotypes with low phl expression only | 9/14 (64.2%) a | 4/16 (25.0%) b | 24/57 (42.1%) ab |
| 13 genotypes with low ppdC and phl expression | 1/14 (7.1%) a | 6/16 (37.5%) b | 6/57 (10.5%) a |
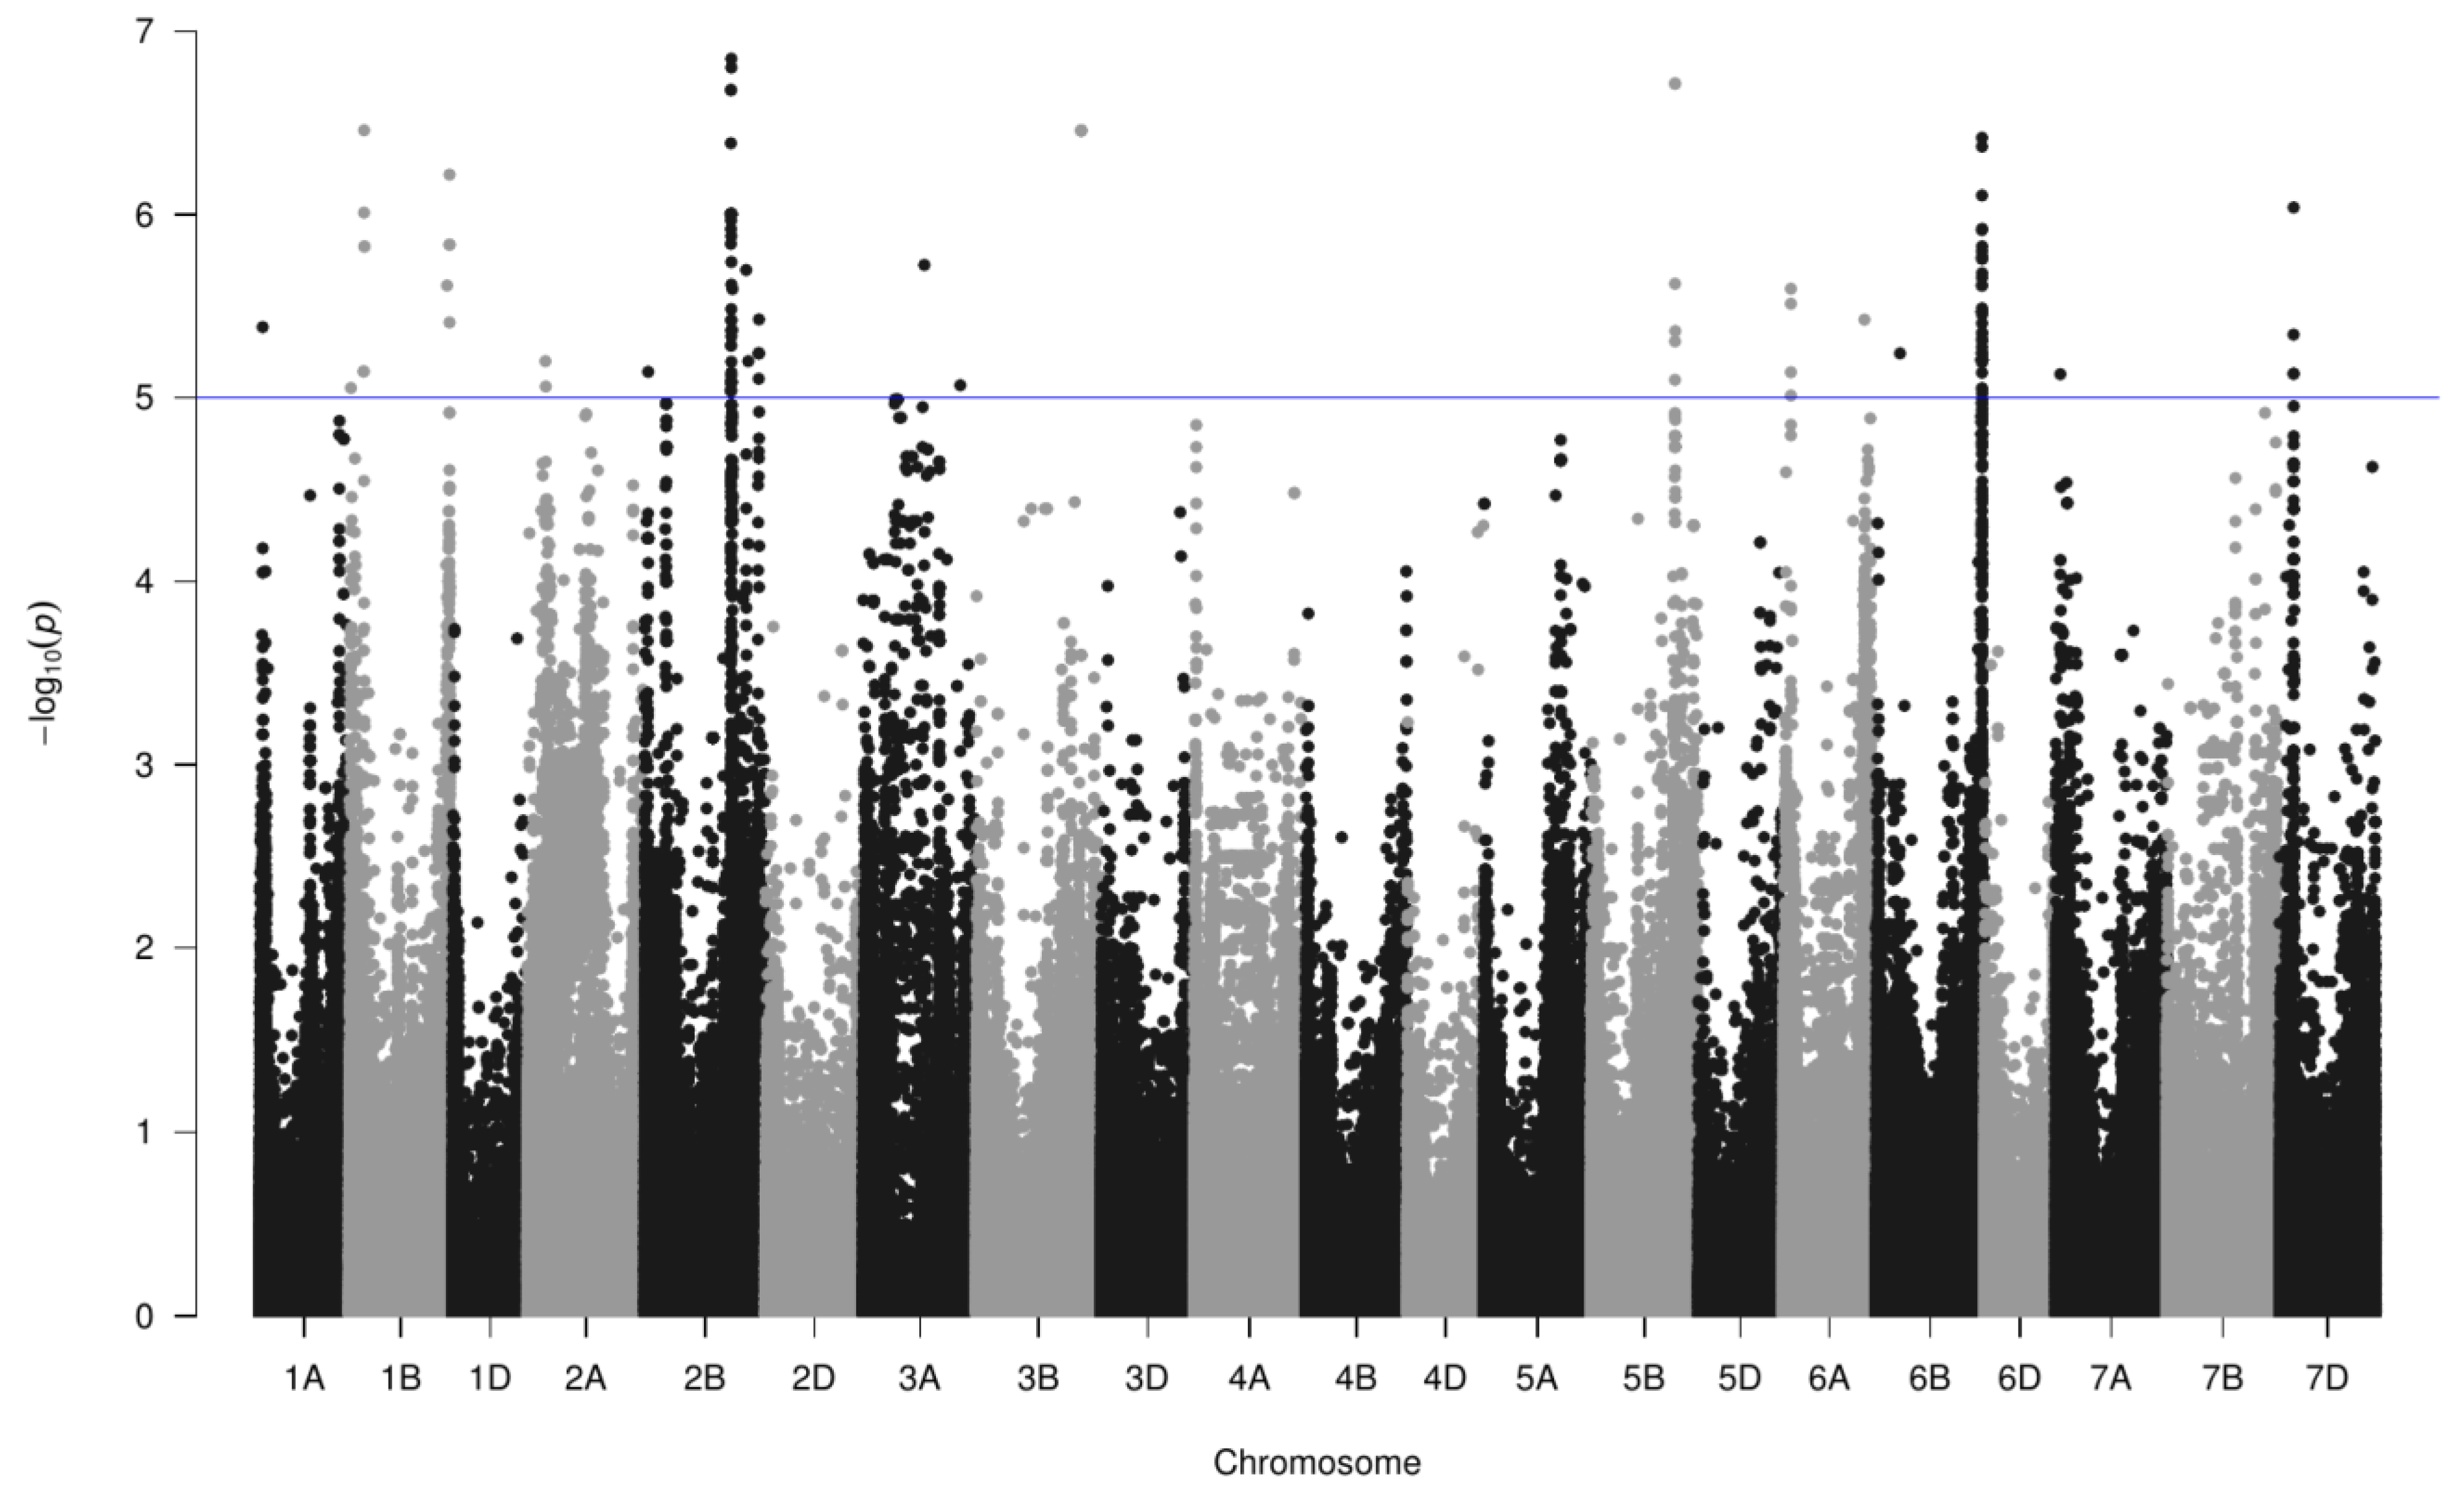
| Region | Chromosome | Nber Markers | −log10(P) | End (bp) | Start (bp) | PGPR Trait |
|---|---|---|---|---|---|---|
| 1 | 1A | 1 | 5.4 | 20,415,992 | 20,415,992 | Induction |
| 2 | 1B | 1 | 5.0 | 12,806,570 | 12,806,570 | Expression |
| 3 | 1B | 6 | 6.5 | 97,489,862 | 102,671,353 | Expression |
| 4 | 1B | 1 | 5.6 | 651,548,215 | 651,548,215 | Expression |
| 5 | 1B | 4 | 6.2 | 668,109,643 | 668,126,415 | Expression |
| 6 | 2A | 2 | 5.2 | 120,681,877 | 123,202,999 | Expression |
| 7 | 2B | 1 | 5.1 | 23,006,356 | 23,006,356 | Expression |
| 8 | 2B | 60 | 6.8 | 572,314,013 | 582,645,061 | Expression |
| 9 | 2B | 1 | 5.7 | 674,029,409 | 674,029,409 | Induction |
| 10 | 2B | 1 | 5.2 | 688,374,113 | 688,374,113 | Expression |
| 11 | 2B | 4 | 5.2 | 757,386,253 | 758,556,708 | Induction |
| 12 | 2B | 1 | 5.4 | 759,178,940 | 759,178,940 | Induction |
| 13 | 3A | 1 | 5.7 | 405,321,848 | 405,321,848 | Expression |
| 14 | 3A | 1 | 5.1 | 644,202,467 | 644,202,467 | Expression |
| 15 | 3B | 5 | 6.5 | 697,067,059 | 697,467,601 | Induction |
| 16 | 5B | 6 | 6.7 | 560,451,114 | 562,280,657 | Expression, Induction |
| 17 | 6A | 4 | 5.6 | 51,947,725 | 51,992,351 | Expression, Induction |
| 18 | 6A | 1 | 5.4 | 540,840,475 | 540,840,475 | Induction |
| 19 | 6B | 62 | 6.4 | 703,207,585 | 705,314,997 | Expression, Induction |
| 20 | 6B | 1 | 5.2 | 159,410,401 | 159,410,401 | Induction |
| 21 | 7A | 1 | 5.1 | 30,092,884 | 30,092,884 | Expression |
| 22 | 7D | 4 | 6.0 | 93,078,495 | 93,605,114 | Expression |
Disclaimer/Publisher’s Note: The statements, opinions and data contained in all publications are solely those of the individual author(s) and contributor(s) and not of MDPI and/or the editor(s). MDPI and/or the editor(s) disclaim responsibility for any injury to people or property resulting from any ideas, methods, instructions or products referred to in the content. |
© 2023 by the authors. Licensee MDPI, Basel, Switzerland. This article is an open access article distributed under the terms and conditions of the Creative Commons Attribution (CC BY) license (https://creativecommons.org/licenses/by/4.0/).
Share and Cite
Valente, J.; Gerin, F.; Mini, A.; Richard, R.; Le Gouis, J.; Prigent-Combaret, C.; Moënne-Loccoz, Y. Symbiotic Variations among Wheat Genotypes and Detection of Quantitative Trait Loci for Molecular Interaction with Auxin-Producing Azospirillum PGPR. Microorganisms 2023, 11, 1615. https://doi.org/10.3390/microorganisms11061615
Valente J, Gerin F, Mini A, Richard R, Le Gouis J, Prigent-Combaret C, Moënne-Loccoz Y. Symbiotic Variations among Wheat Genotypes and Detection of Quantitative Trait Loci for Molecular Interaction with Auxin-Producing Azospirillum PGPR. Microorganisms. 2023; 11(6):1615. https://doi.org/10.3390/microorganisms11061615
Chicago/Turabian StyleValente, Jordan, Florence Gerin, Agathe Mini, Rohan Richard, Jacques Le Gouis, Claire Prigent-Combaret, and Yvan Moënne-Loccoz. 2023. "Symbiotic Variations among Wheat Genotypes and Detection of Quantitative Trait Loci for Molecular Interaction with Auxin-Producing Azospirillum PGPR" Microorganisms 11, no. 6: 1615. https://doi.org/10.3390/microorganisms11061615