Article

Strong Opponent of Walnut Anthracnose—Bacillus velezensis and Its Transcriptome Analysis

College of Forestry, Sichuan Agricultural University, Yaan 625000, China
*
Author to whom correspondence should be addressed.
Microorganisms 2023, 11(8), 1885; https://doi.org/10.3390/microorganisms11081885
Submission received: 21 June 2023 / Revised: 23 July 2023 / Accepted: 24 July 2023 / Published: 26 July 2023
(This article belongs to the Section Plant Microbe Interactions)

Abstract

:
Walnut is a significant economic tree species worldwide. Walnut anthracnose, caused by the pathogen Colletotrichum gloeosporioides, greatly reduces walnut production and economic benefits. Our study showed that Bacillus velezensis effectively halted the growth of C. gloeosporioides, inducing noticeable abnormalities such as hyphal breakage and distortion, thereby curtailing the pathogen’s virulence. A 50–100 times dilution of B. velezensis fermentation broth, applied every two to three days, served as an efficient protective layer for walnut leaves and fruits against C. gloeosporioides infection. Transcriptomic analysis of B. velezensis unveiled its dynamic response against C. gloeosporioides. On the second day, B. velezensis upregulated a significant number of differentially expressed genes related to the synthesis of metabolic products, amino acid biosynthesis, and motility. On the fourth day, continuous synthesis of metabolic products and amino acids, along with differential expression of spore-related genes, was observed. By the sixth day, the focus shifted towards environmental adaptation and carbon source utilization. Throughout the process, B. velezensis likely employed strategies such as the release of metabolic products, increased chemotaxis, and nutrient competition to exert its antagonistic effect on C. gloeosporioides. Fluorescence quantitative results showed that 15 primer pairs were up-regulated and 15 were down-regulated, with a 100% similarity rate to transcriptome sequencing results, confirming their authenticity. These findings provided a foundation for the widespread application of B. velezensis as a biocontrol agent in agriculture and forestry.

1. Introduction

Walnut, a deciduous tree species, holds significant economic value, with extensive applications in food, pharmaceuticals, cosmetics, and other industries [1,2]. Major walnut-producing countries across the globe include the United States, Iran, Turkey, China, Mexico, Ukraine, France, Italy, Spain, and Chile [3,4,5]. China, in particular, stands as one of the world’s largest walnut cultivators, with a rich history of walnut farming that dates back thousands of years [6]. However, the walnut industry faces significant economic losses due to various diseases, particularly anthracnose, which is caused by the pathogen Colletotrichum gloeosporioides (C. gloeosporioides). This disease, characterized by its rapid onset and swift transmission, can lead to fruit rot, leaf wilt, branch death, and in severe cases, plant death [7,8]. The current primary management strategy is chemical control [9], yet this approach has several drawbacks, including environmental pollution [10], pathogen resistance [11,12], and risks to non-target organisms [13,14]. Consequently, the exploration of environmentally friendly and efficient solutions such as Bacillus velezensis (B. velezensis) is crucial. B. velezensis, a member of the Bacillus genus, is renowned for its broad-spectrum antimicrobial properties, ability to produce bioactive substances, and adaptability to various environments [15,16,17,18]. For instance, B. velezensis 1B-23 and 1D-12 combat bacterial canker in tomatoes by producing surface proteins A, B, and C, while B. velezensis Bv-21 prevents citrus ulcer disease with an ethyl acetate extract [19,20]. Another strain, CC09, mitigates wheat diseases caused by dwarf bacteria and sorghum double spore via the secretion of antagonistic metabolic products [21]. The applications of B. velezensis extend beyond pathogen control. As reported by Nanjani et al., B. velezensis K1 not only combats the fungal pathogen Alternaria brunsii but also serves as a biofertilizer, aiding plants deficient in iron and phosphate [22]. Additionally, Wei et al. demonstrated that B. velezensis YW17 could control ginseng root rot disease by both producing antifungal substances and regulating the root and rhizosphere microbial communities [23].
In recent years, transcriptomic studies on Bacillus have led to significant discoveries in biocontrol, offering new insights into its application for biological defense mechanisms [24,25,26]. B. velezensis has been found to induce plant immunity through specific signaling pathways and modulate the expression of key genes to enhance its survival and resistance against fungal pathogens. For instance, it has been shown to elicit plant immunity via the intricate interplay between the ethylene (ET), jasmonic acid (JA), and salicylic acid (SA) signaling pathways and the brassinosteroid biosynthesis pathway [27,28,29]. Moreover, B. velezensis strains, when co-cultivated with pathogenic fungi such as Fusarium graminearum, have been found to upregulate genes related to sporulation and phosphate stress, while downregulating those associated with secondary metabolism, biofilm formation, and the tricarboxylic acid cycle [30]. A study by Pandin et al. showed upregulation of certain genes, including surfactin (srfAA) and fengycin (fenA), when B. velezensis was confronted with fungal pathogens in compost [31]. Furthermore, B. velezensis has been demonstrated to enhance plant resistance to specific pests via unique chemical pathways. For instance, B. velezensis YC7010 can trigger systemic resistance in rice seedlings against Nilaparvata lugens Stål via SA and JA-dependent pathways [32]. Transcriptomics technology has further substantiated B. velezensis’s capability to produce metabolic byproducts that suppress the growth of specific pathogens. A study by Li et al. showed that the crude extract of B. velezensis fermentation broth significantly induced differential gene expression in pathogens, affecting various biological processes [33]. Moreover, Zhang et al.’s study clarified the mechanism by which lipopeptides produced by B. velezensis GS-1 inhibit the growth of Magnaporthe oryzae [34]. Despite significant advancements in the field of transcriptome analysis, a substantial knowledge gap remains, particularly in the study of bacterial transcriptomes. Current research predominantly focuses on fungal transcriptomes, leaving studies on bacteria, especially those involving interactions between B. velezensis and C. gloeosporioides, relatively underexplored [35]. In this study, we established an interaction system to examine the control exerted by B. velezensis on C. gloeosporioides at various time points (2, 4, and 6 days) on a petri dish and its impact on virulence. At the same time, we analyzed the transcriptome information and differentially expressed gene enrichment of B. velezensis at these time points. Additionally, we conducted leaf control experiments to study the control effects of B. velezensis on C. gloeosporioides at different concentrations and frequencies. The goal of this research is to identify key genes related to antagonism through transcriptome analysis, in order to further investigate the biocontrol mechanism of B. velezensis against C. gloeosporioides. Through this study, we evaluated the protective effect of B. velezensis on walnut leaves and fruits, providing beneficial strategies for walnut cultivation, and laying a foundation for the development and application of biological control agents.

2. Materials and Methods

2.1. Tested Fungal, Bacteria and PLANT Materials

C. gloeosporioides and B. velezensis was provided by Forest Protection Laboratory, Forestry College of Sichuan Agricultural University. B. velezensis was isolated from the soil under walnut trees at the Chongzhou base of Sichuan Agricultural University, Chengdu City, Sichuan Province (longitude and latitude: 103.65169, 30.56266, altitude: 534 m). The walnut leaves were obtained from three-year-old walnut trees planted in Chengdu Academy of Agricultural and Forestry Sciences, Sichuan Province (longitude and latitude: 104.07275, 30.57899, altitude: 534 m). The walnut leaves for the experiment were carefully selected from branches of the same age and position on the tree, ensuring almost identical size and shape. The leaves were healthy, without any disease spots. The walnut fruits were collected from the same location, Chongzhou base of Sichuan Agricultural University, and they were of similar size, with intact peels and no signs of pests or diseases.

2.2. Effect of B. velezensis on Pathogenicity of C. gloeosporioides

An interaction system between B. velezensis and C. gloeosporioides was established using the plate confrontation method. A 4.0 mm diameter fungal cake of C. gloeosporioides was inoculated at the center of the PDA medium, while the B. velezensis strain was inoculated at four equidistant points 25.00 mm from the center. A control plate with only B. velezensis was also prepared. Each set had three replicates, cultured at 28 °C, and each set was observed on days 2, 4, and 6. On day 6, the mycelium of C. gloeosporioides in both the treatment and control groups was examined and photographed using an Olympus BX43 microscope (Olympus BX43, Tokyo, Japan).
C. gloeosporioides mycelium, after interacting with B. velezensis for 2, 4, and 6 days, was punched from the edge and inoculated onto walnut leaves (D2_T, D4_T, and D6_T groups). Mycelium not confronting B. velezensis for 2, 4, and 6 days was used as a blank control (D2_W, D4_W, and D6_W groups). Three replicates were cultured at 25 °C. Prior to inoculation, the leaves were washed with sterile water and disinfected with 70% ethanol spray. On the 12th day post-inoculation, the lesion area of the walnut leaves and the relative inhibition rate of B. velezensis against C. gloeosporioides were measured and calculated.
I ( % ) = ( C     T ) C × 100
I: inhibition rate; C: the leaf spot area of negative control (cm2); T: the leaf spot area of treatment (cm2).

2.3. Control Effect of B. velezensis against C. gloeosporioides on Detached Leaves and Fruits

C. gloeosporioides was cultured on PDA solid medium at 28 °C for 4 days. Healthy walnut leaves of the same age, position on the branch, and similar size were selected for biocontrol experiments. Prior to the inoculation trials, the walnut leaves were washed with sterile water and disinfected with 70% ethanol spray. Each walnut leaf was inoculated with 2 C. gloeosporioides cakes, which were obtained by punching the edge of the 4-day-old culture on PDA medium. The single colony of B. velezensis was inoculated in LB liquid medium and cultured at 28 °C, 180 rpm for 24 h. Subsequently, the B. velezensis fermentation broth was diluted with sterile water until an OD600 of 1.0 (106 Colony Forming Unit/mL) was reached. Starting from the high concentration, seven concentration gradients were set: 1, 10, 50, 100, 300, 600, and 1200 times. The treatment groups were named as T_1, T_10, T_50, T_100, T_300, T_600, and T_1200. The inoculated walnut leaves were sprayed once every 48 h, and the control group was sprayed with the same amount of LB liquid medium, with 3 replicates in each group. The detailed processing methods are shown in Table S1 (provided in Supplementary Materials). After 14 days of continuous treatment, the control effect of B. velezensis on walnut anthracnose was observed and recorded on the 15th day.
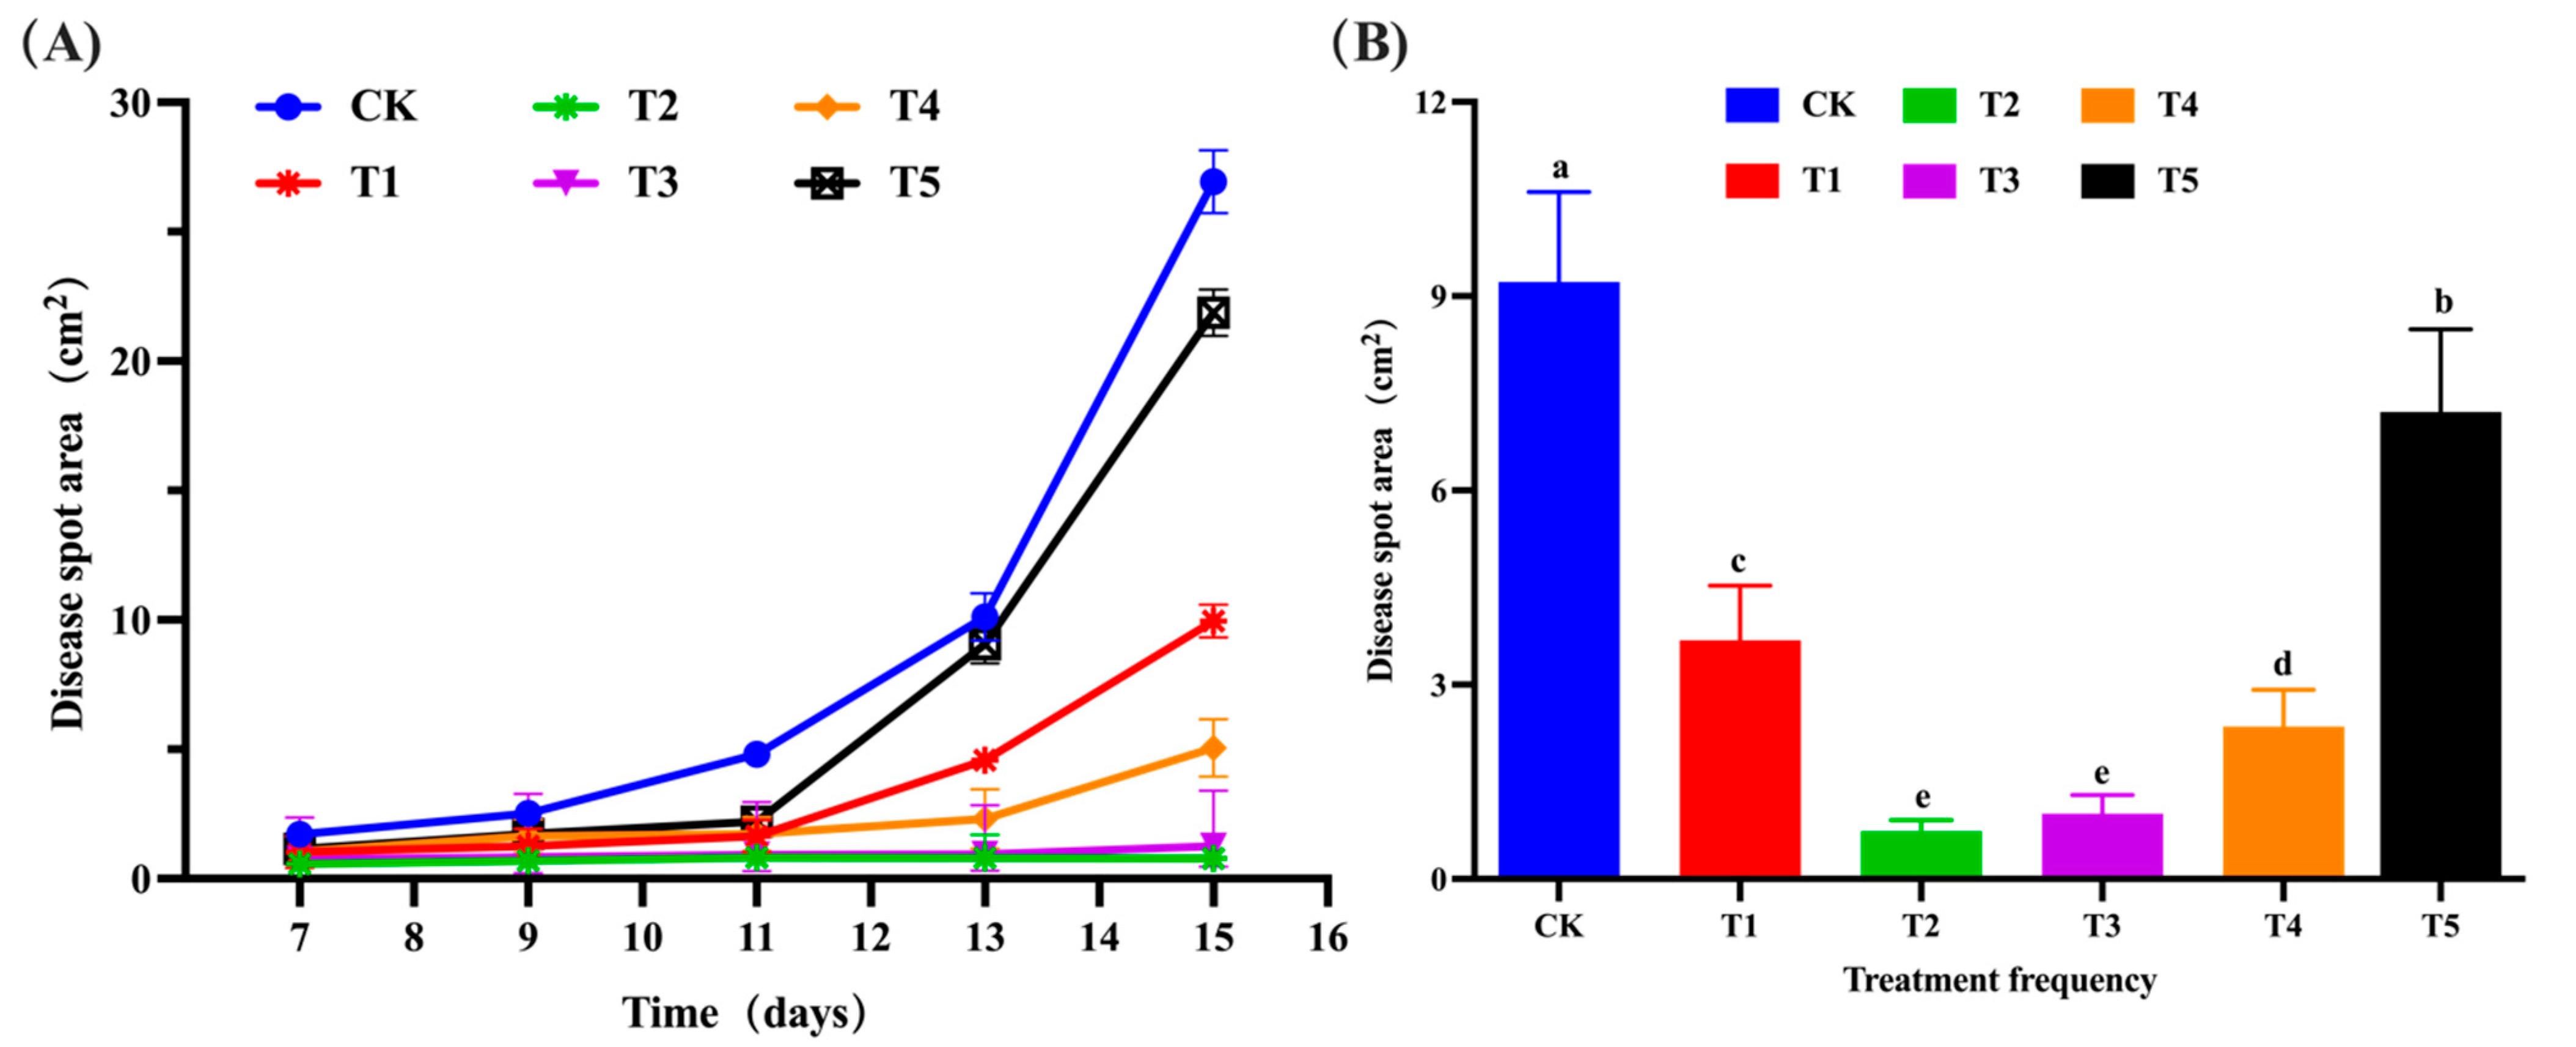
After determining the optimal control concentration, the experiment was conducted using 5 spray frequencies: every 1 day (namely T1 group), 2 days (namely T2 group), 3 days (namely T3 group), 4 days (namely T4 group), and 5 days (namely T5 group). The CK group was sprayed daily with LB liquid medium as a control. The leaves were sprayed at the same time each day, using the best spray concentration (50 times). In between treatment sprays, all groups received LB liquid medium. The detailed processing methods are shown in Table S2 (provided in Supplementary Materials). Each group had 3 replicates, and the experiment lasted for 15 days, with leaf lesion area changes observed and recorded.
C. gloeosporioides was cultured on PDA solid medium at 28 °C for 4 days, and the edge of the mycelium was punched out. The punched fungus cakes were inoculated onto walnut fruit surfaces. For the experiment, walnut fruits were sourced from the same walnut tree, ensuring that they were nearly identical in size and free of any disease or lesions. Treatment and control groups were established, with the treatment group receiving the optimal control concentration (50 times) and frequency (every 2 days) of fermentation broth, while the control group was sprayed with LB liquid medium at the same frequency. Each group had three replicates. Over an 18-day observation period, the changes in walnut lesions were monitored and recorded.

2.4. Transcriptional Analysis of B. velezensis

In method 2.2, the interaction system between B. velezensis and C. gloeosporioides was established, with three replicates per group. B. velezensis strains interacting with C. gloeosporioides for 2, 4, and 6 days were collected (namely D2_D, D4_D, and D6_D groups), while non-interacting strains served as controls (namely D2_CK, D4_CK, and D6_CK groups). Under aseptic conditions, a sterile inoculating loop was used to transfer B. velezensis colonies into nuclease-free centrifuge tubes containing PBS buffer. The samples were stored at −80 °C for transcriptome sequencing.

2.4.1. RNA Extraction, Library Preparation and Sequencing

RNA was isolated using the TianGen DP430 Bacterial RNA Kit (TianGen, BeiJing, China) according to the manufacturer’s instructions. RNA degradation and contamination was monitored on 1% agarose gels. RNA integrity was assessed using the RNA Nano 6000 Assay Kit of the Bioanalyzer 2100 system (Agilent Technologies, Santa Clara, CA, USA). Total RNA was used as input material for the RNA sample preparations. For prokaryotic samples, mRNA was purified from total RNA using probes to remove rRNA. Fragmentation was carried out using divalent cations under elevated temperature in First Strand Synthesis Reaction Buffer (5×). First strand cDNA was synthesized using random hexamer primer and M-MuLV Reverse Transcriptase, then RNaseH was used to degrade the RNA. In the DNA polymerase I system, dUTP was used to replace the dNTP of dTTP as the raw material to synthesize the second strand of cDNA. The remaining overhangs were converted into blunt ends via exonuclease/polymerase activities. After adenylation of 3′ ends of DNA fragments, the adaptors with hairpin loop structure were ligated to prepare for hybridization. Then, USER Enzyme was used to degrade the second strand of cDNA containing U. In order to select cDNA fragments preferentially of 370~420 bp in length, the library fragments were purified with AMPure XP system (Beckman Coulter, Beverly, TX, USA). Then, PCR was performed with Phusion High-Fidelity DNA polymerase, Universal PCR primers and Index (X) Primer. Finally, PCR products were purified (AMPure XP system) and library quality was assessed on the Agilent Bioanalyzer 2100 system. The clustering of the index-coded samples was performed on a cBot Cluster Generation System using TruSeq PE Cluster Kit v3-cBot-HS (Illumia, San Diego, CA, USA) according to the manufacturer’s instructions. After cluster generation, the library preparations were sequenced on an Illumina Novaseq platform and 150 bp paired-end reads were generated.

2.4.2. Quality Control and Data Analysis

Raw data (raw reads) of the fastq format were firstly processed through in-house perl scripts. In this step, clean data (clean reads) were obtained by removing reads containing adapter, reads containing N base, and low quality reads from raw data. At the same time, Q20, Q30, and GC content, the clean data were calculated. All the downstream analyses were based on the clean data with high quality. The reference genome and annotation files were downloaded from publicly available data submitted to NCBI (https://ftp.ncbi.nlm.nih.gov/genomes/all/GCF/002/117/165/GCF_002117165.1_ASM211716v1/, accessed on 2 May 2017. The assembly number was GCF_002117165.1.). Both building index of reference genome and aligning clean reads to reference genome were used Bowtie2-2.2.3.

2.4.3. Quantitative and Differential Expression Analysis of Gene Expression

HTSeq v0.6.1 was used to count the reads numbers mapped to each gene. Then, the FPKM of each gene was calculated based on the length of the gene and the reads count mapped to the gene. Differential expression analysis of three groups (three biological replicates per condition) was performed using the DESeq R package (1.18.0). DESeq provide statistical routines for determining differential expression indigital gene expression data using a model based on the negative binomial distribution. The resulting p-values were adjusted using the Benjamini and Hochberg’s approach for controlling the false discovery rate. Genes with an adjusted p-value < 0.05 found by DESeq were assigned as differentially expressed. Gene Ontology (GO) enrichment analysis of differentially expressed genes (DEGs) was implemented by the GOseq R package, in which gene length bias was corrected. GO terms with corrected p-value less than 0.05 were considered significantly enriched by differential expressed genes. The Kyoto Encyclopedia of Genes and Genomes (KEGG) is a database resource for understanding high-level functions and utilities of the biological system, such as the cell, the organism, and the ecosystem, from molecular-level information, especially large-scale molecular datasets generated by genome sequencing and other high-throughput experimental technologies (http://www.genome.jp/kegg/, accessed on 5 March 2021). We used KOBAS 3.0 software to test the statistical enrichment of differential expression genes in KEGG pathways. The DEGs were subjected to protein–protein interaction (PPI) analysis using the STRING database, which provides known and predicted PPI information. The gene names were input into the STRING protein interaction analysis platform, and multiple proteins were selected. The species was specified as B. amyloliquefaciens to obtain the PPI network of protein interactions. The confidence level was set to 0.9, and data were obtained after excluding invalid proteins that did not interact with other proteins. The resulting data was imported into Cytoscape 3.6.0, and the network analyzer function was used to calculate the degree of interaction for each protein. Based on the three highest degree values, the core targets were identified, and node size was determined by the degree value. Finally, a PPI network diagram was constructed.

2.4.4. Quantitative Real-Time PCR

Thirty differentially expressed transcripts identified by RNA-Seq analysis were selected for gene expression analysis using quantitative real-time PCR (qRT-PCR). The sequences of the primers used are listed in Table S3 (provided in Supplementary Materials). Each treatment group (D2_DvsD2_CK, D4_DvsD4_CK, and D6_DvsD6_CK) included ten candidate genes. Glyceraldehyde-3-phosphate dehydrogenase (GAPDH), a widely recognized housekeeping gene, was selected as the reference gene. Its ubiquitous and stable expression in cells ensures a dependable baseline for comparing the expression levels of other target genes. The target gene expression was normalized to GAPDH [36]. The transcriptional levels of the different genes were investigated and compared using the 2−ΔΔCt method [37].

3. Results

3.1. Effect of B. velezensis on Mycelial Growth and Pathogenicity of C. gloeosporioides

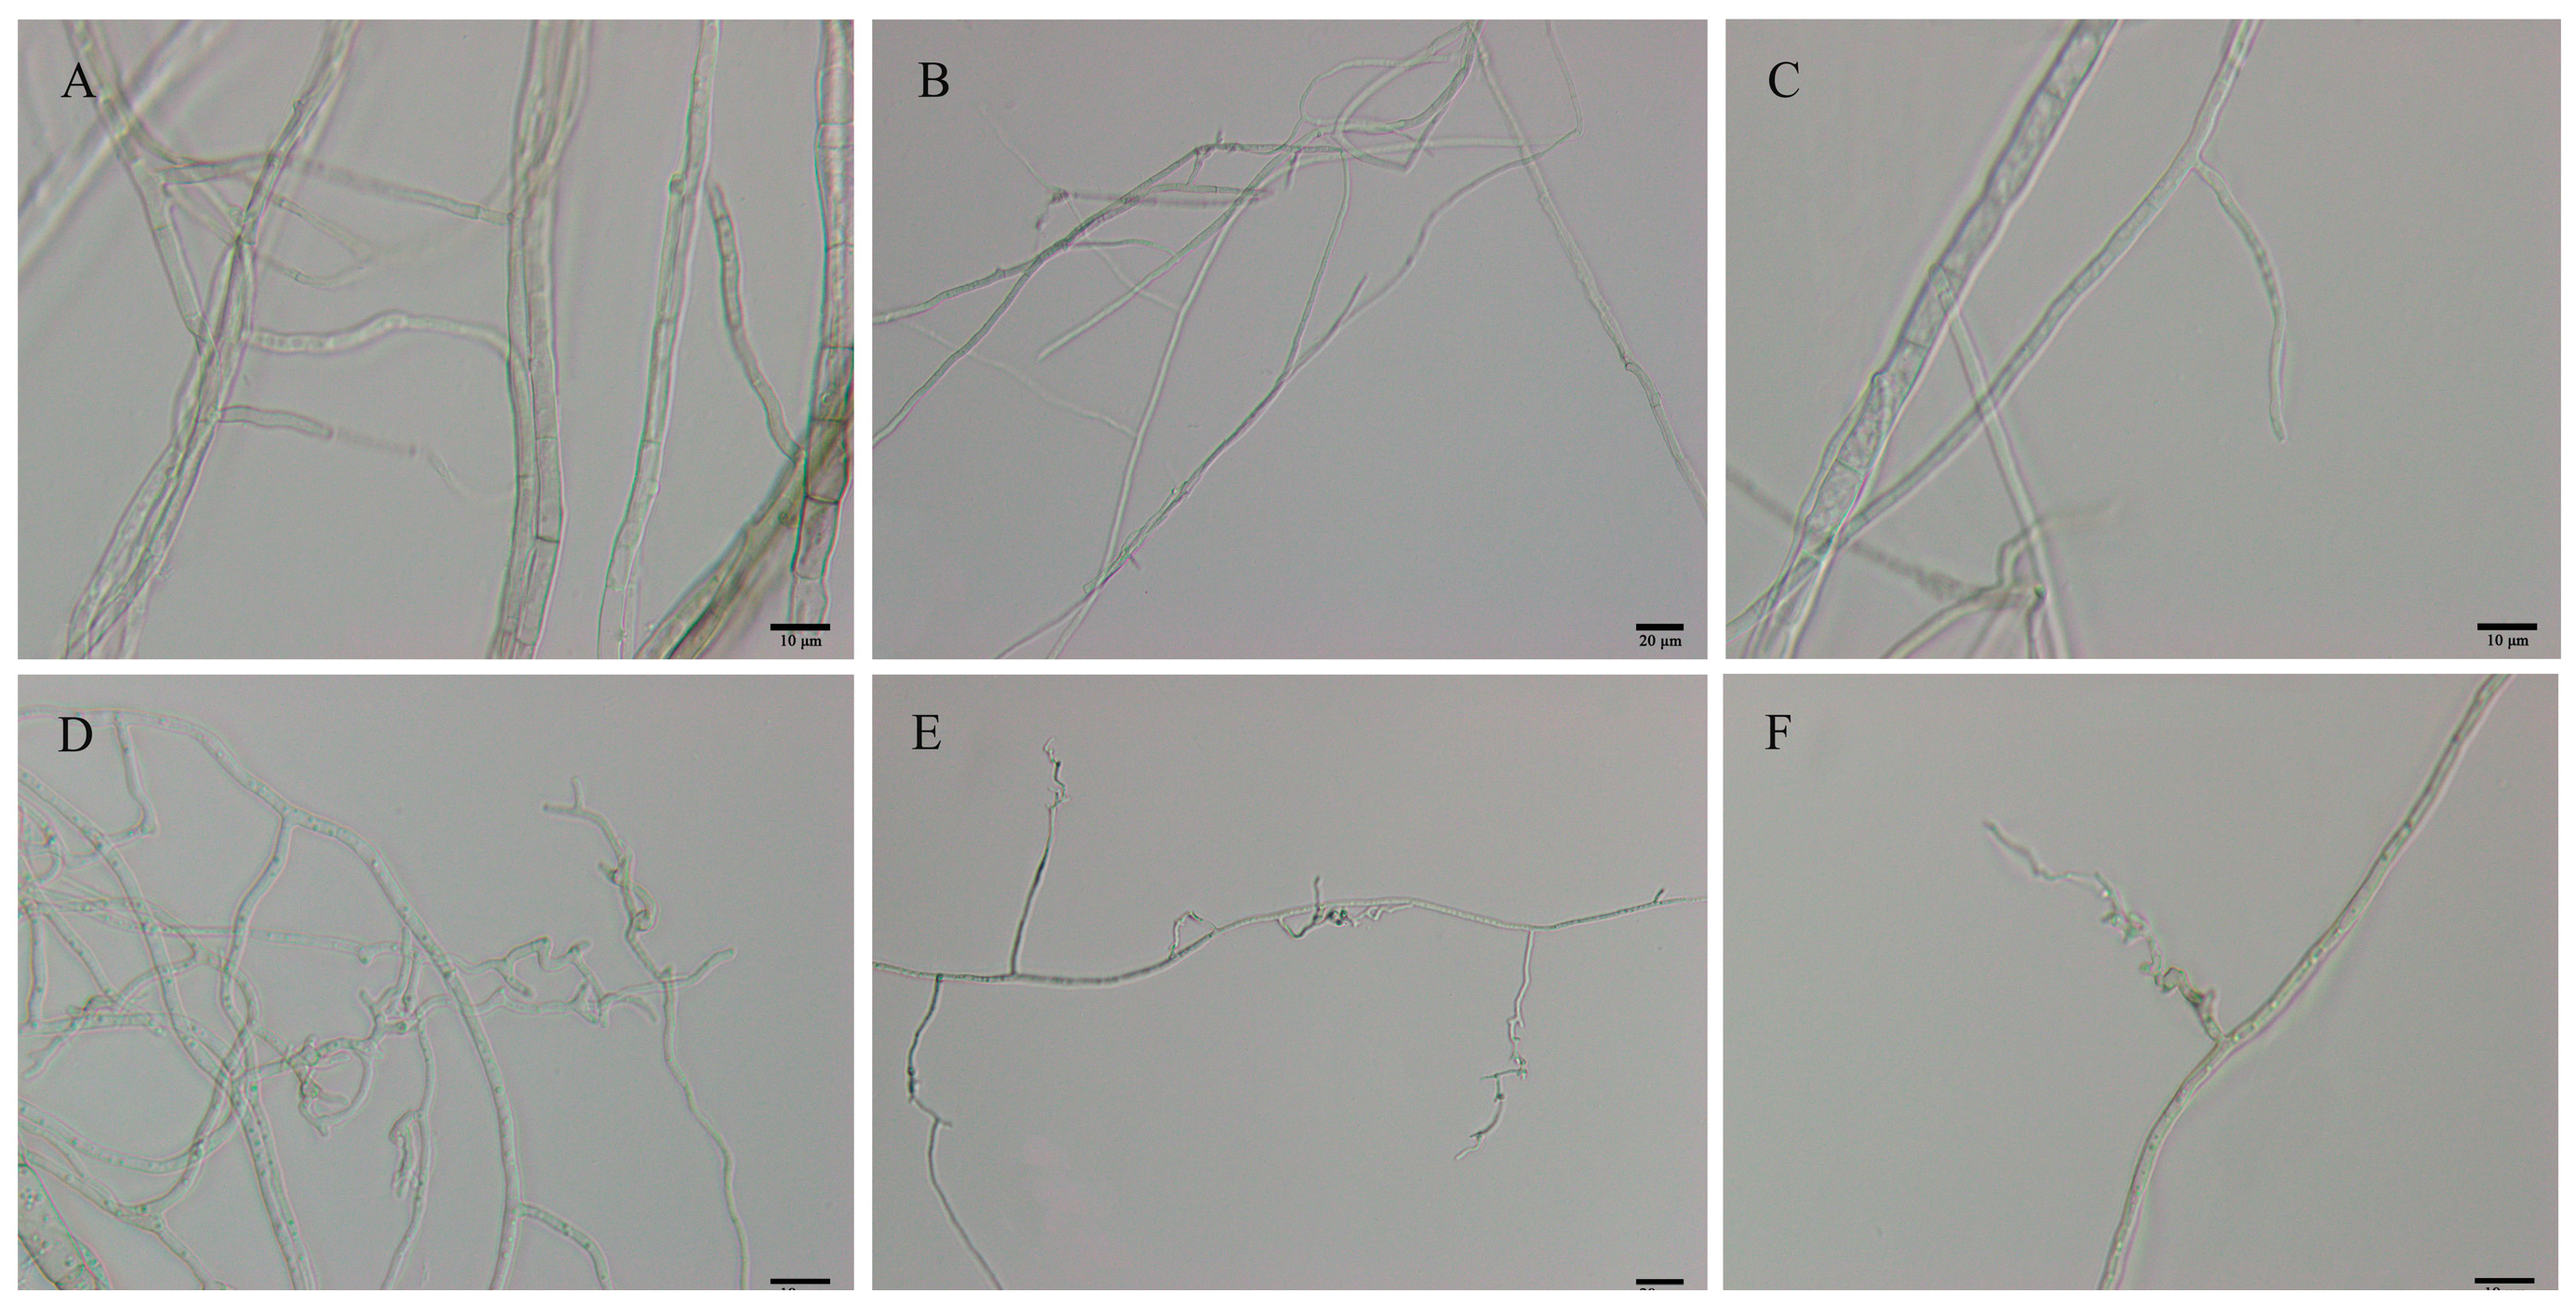
Figure 1 effectively demonstrates the inhibitory effect of B. velezensis treatment on C. gloeosporioides growth over 2, 4, and 6 days. The treated mycelia consistently appeared smaller and more constrained compared to the untreated mycelia, which exhibited more extensive and circular growth patterns. By day 6, the untreated mycelia occupied the entire PDA medium (Figure 1G), while the treated mycelia maintained a diamond shape and remained distant from B. velezensis colonies (Figure 1I). The morphological characteristics of C. gloeosporioides mycelium observed on day 6 (Figure 2) further emphasized the differences between the control and treated groups, showcasing distinct variations in hyphal morphology. The control group hyphae were straight and thick, whereas the treated group hyphae displayed elongated, swollen, and twisted characteristics, with the majority of mycelial branches exhibiting twisted growth patterns. At the same time, it could also be observed that the shape of B. velezensis in the treatment group was smaller than that in the control group (Figure 1). We hypothesized that this might have been because B. velezensis sacrificed a portion of its nutritional growth to produce more antimicrobial substances, in an effort to counteract the infection of C. gloeosporioides.
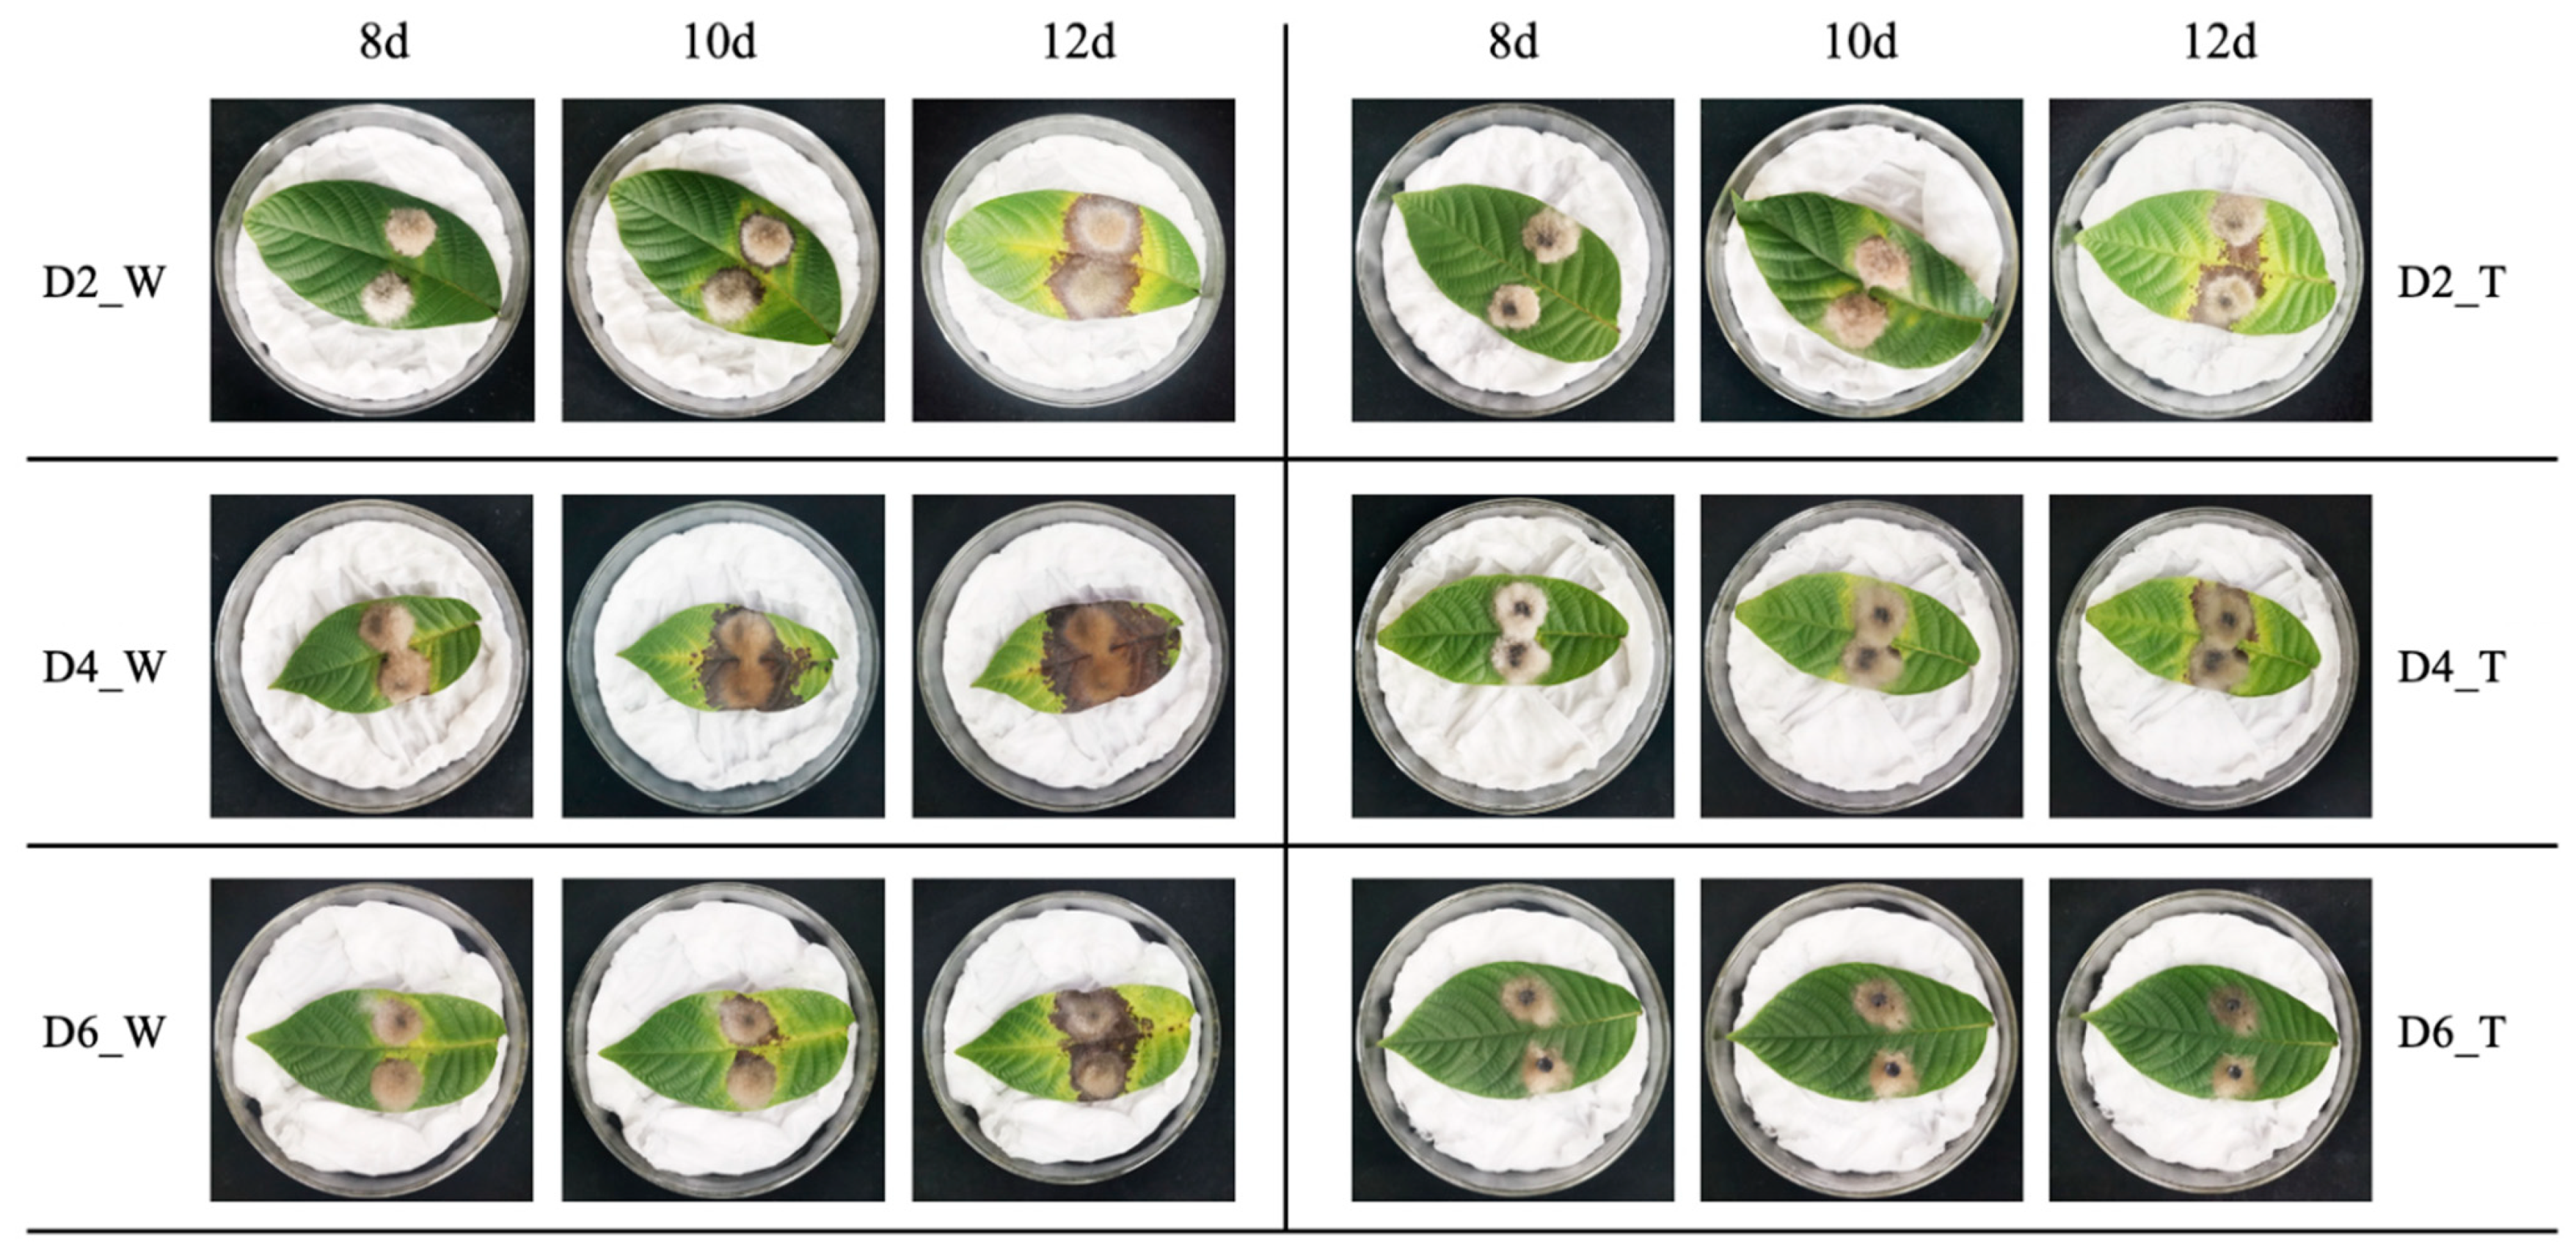
Edge hyphae of C. gloeosporioides from both the control and treatment groups were utilized to infect walnut leaves on days 2, 4, and 6. As shown in Figure 3, a consistent observation across the control groups (D2_W, D4_W, D6_W) was the complete envelopment of the fungus cakes by C. gloeosporioides. The hyphae of C. gloeosporioides in these groups appeared to be profuse and robust, resulting in heightened leaf yellowing and a more extensive disease spot areas on the walnut leaves. Conversely, in the treatment groups (D2_T, D4_T, and D6_T), the amount of C. gloeosporioides hyphae was noticeably less than in the control group, and the hyphae did not fully cover the fungus cakes. Moreover, the hyphae appeared clustered and less spread out, possibly due to morphological abnormalities that obstruct their growth and expansion following confrontation culture. Consequently, the ability of C. gloeosporioides to infect leaves was diminished, resulting in significantly smaller disease areas in the treatment groups (D2_T, D4_T, and D6_T). The data analysis from Figure 4A further substantiated these findings, indicating that at each time point, the control groups consistently had larger disease spot areas compared to the treatment groups (p < 0.05). This suggested that the infectivity of C. gloeosporioides was significantly reduced following treatment with B. velezensis. Our analysis indicated that the inhibitory effect of B. velezensis on C. gloeosporioides was most potent after six days of exposure, followed by two days (Figure 4B). Although the inhibition rate at four days was relatively the weakest, it was still statistically significant compared to the blank control (p < 0.05). These findings demonstrated that B. velezensis could significantly reduce the infectivity of C. gloeosporioides, thereby achieving the goal of protecting the host.

3.2. Control Effect of B. velezensis on Detached Leaves and Fruits of Walnut

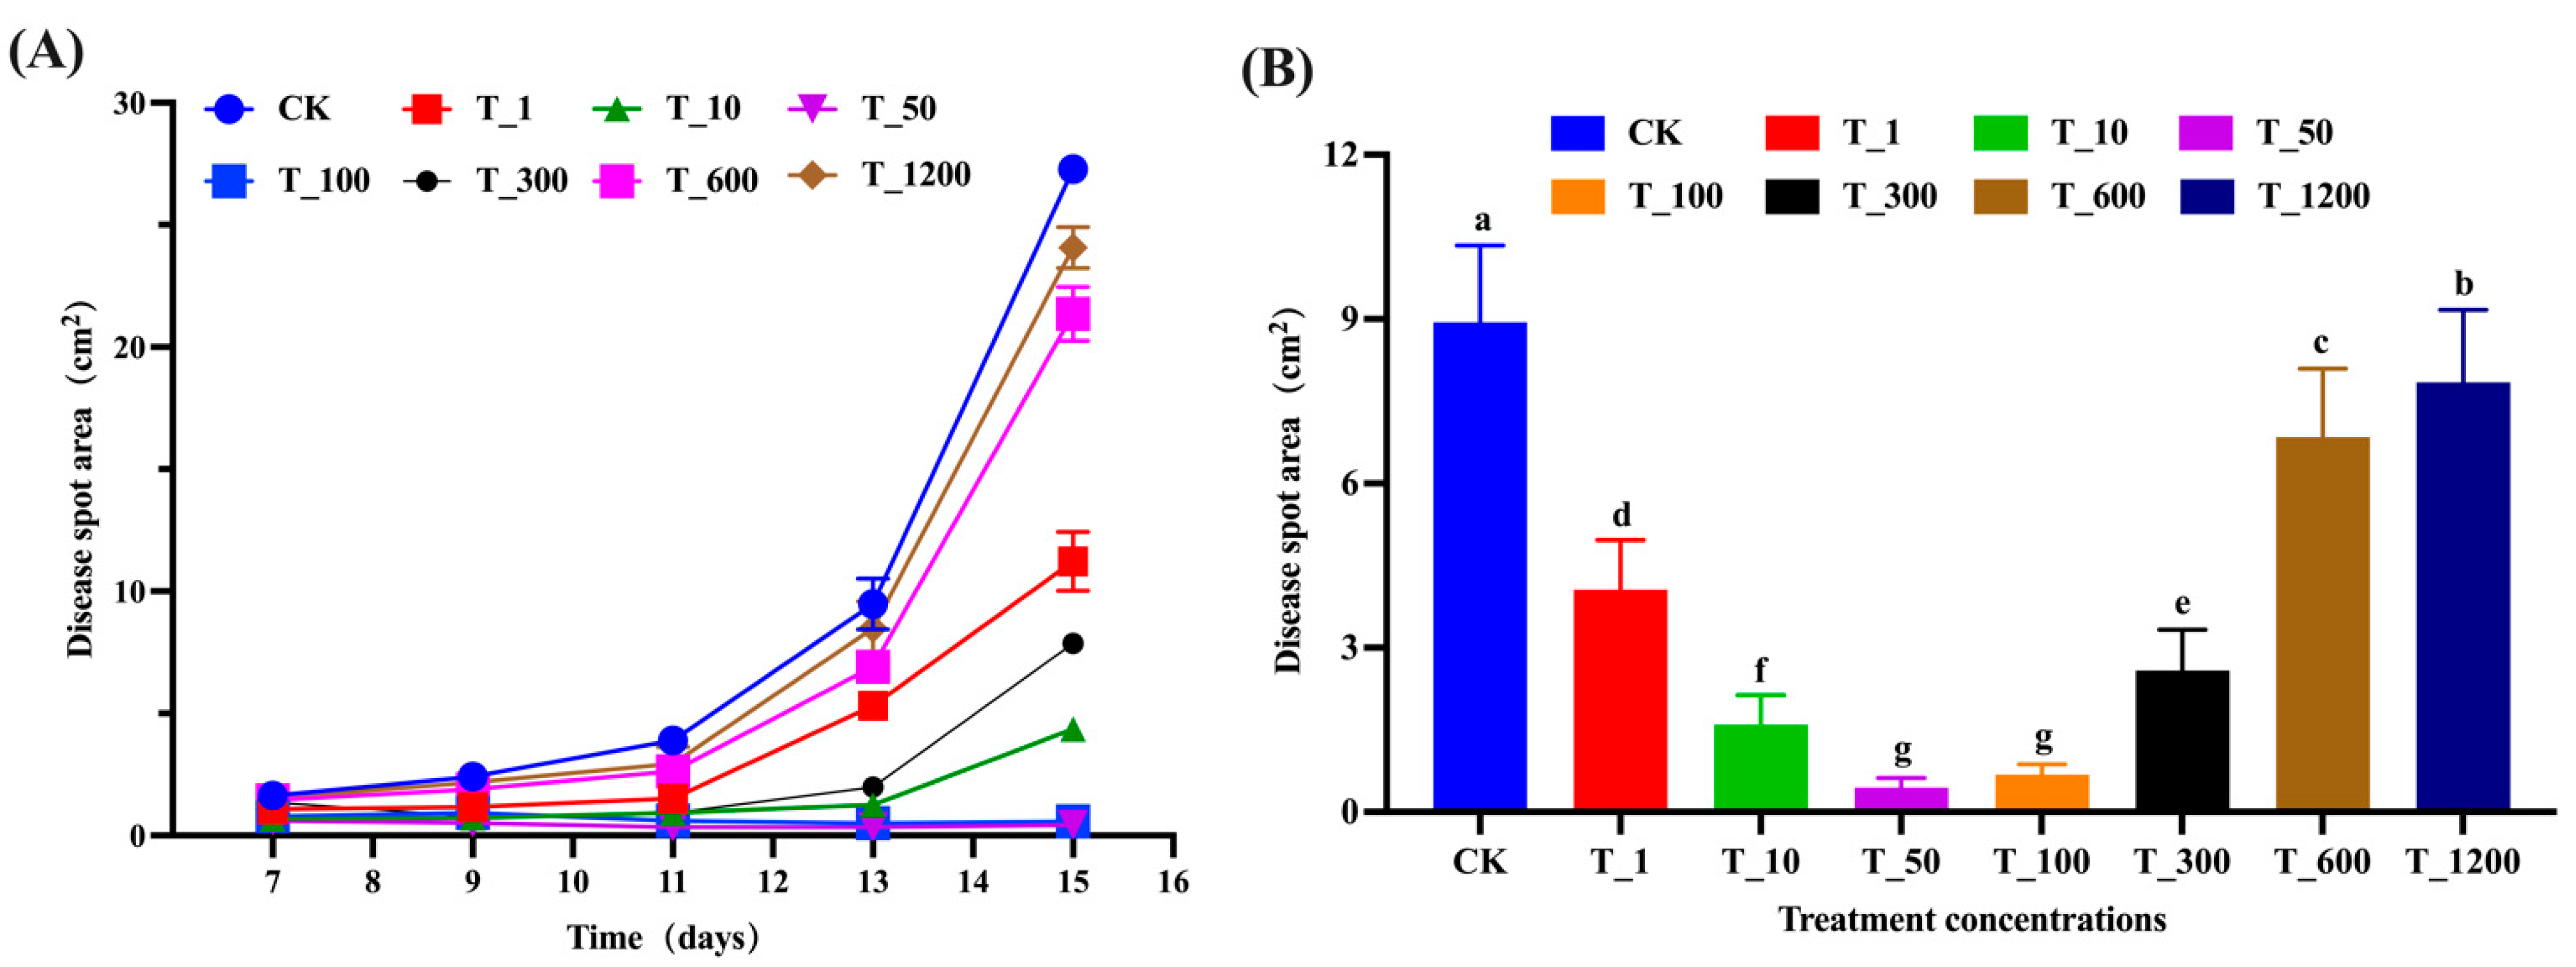
The effects of spraying different concentrations of B. velezensis fermentation broth on inhibiting walnut anthracnose infection caused by C. gloeosporioides were examined. Seven concentration gradients were used: 1, 10, 50, 100, 300, 600, and 1200 times. The treatment groups were labeled as T_1, T_10, T_50, T_100, T_300, T_600, and T_1200, with CK serving as the control. The results indicate that infection with the C.gloeosporioides manifested as gradual fading of green and yellow coloration around the walnut leaves, forming nearly circular black spots by the 7th or 9th day. Over time, lesions expanded, and in some cases, eventually covered the entire leaf (Figure 5). The Levene homogeneity test confirmed that the data met the precondition of homogeneity of variance, permitting the use of repeated measures ANOVA to examine the significance of lesion area change trends. Since the data failed the sphericity test (p < 0.05), the multivariate test results were utilized as a basis. According to these results, the time point effect was significant (F (4,13) = 577.243, p < 0.05), indicating notable changes in lesion area over time. The interaction effect of time point and concentration was also significant (F (7,16) = 455.141, p < 0.05), implying that these factors influenced one another. As shown in Figure 6A, the lesion area in each group continued to expand over time, with the rate of expansion increasing as time went on. According to the results (Figure 6B), the T_50 and T_100 groups showed the most effective control, with significantly lower average lesion areas of 0.449 cm2 and 0.68 cm2, respectively (p < 0.05). In contrast, the control group had the highest average lesion area of 8.938 cm2. The T_1 group exhibited some control effect, reducing the lesion area by 54.576% compared to the CK group, but higher concentrations hindered optimal control. Interestingly, as the fermentation fluid concentration decreased from T_1 to T_10, T_50, and T_100, the control effectiveness improved. However, a turning point was observed at the T_300 group, where control effectiveness started to decline. Further reduction in fermentation fluid concentration resulted in increased lesion areas. The T_600 and T_1200 groups had the highest concentrations and showed the weakest control effect, but still achieved significant reduction in lesion areas compared to the CK group (p < 0.05), with reductions of 23.395% and 12.251%, respectively. In summary, the T_50 and T_100 groups demonstrated the best control, followed by T_10, T_300, and T_1. While the T_600 and T_1200 groups had the weakest control effect, some level of disease prevention was still observed.
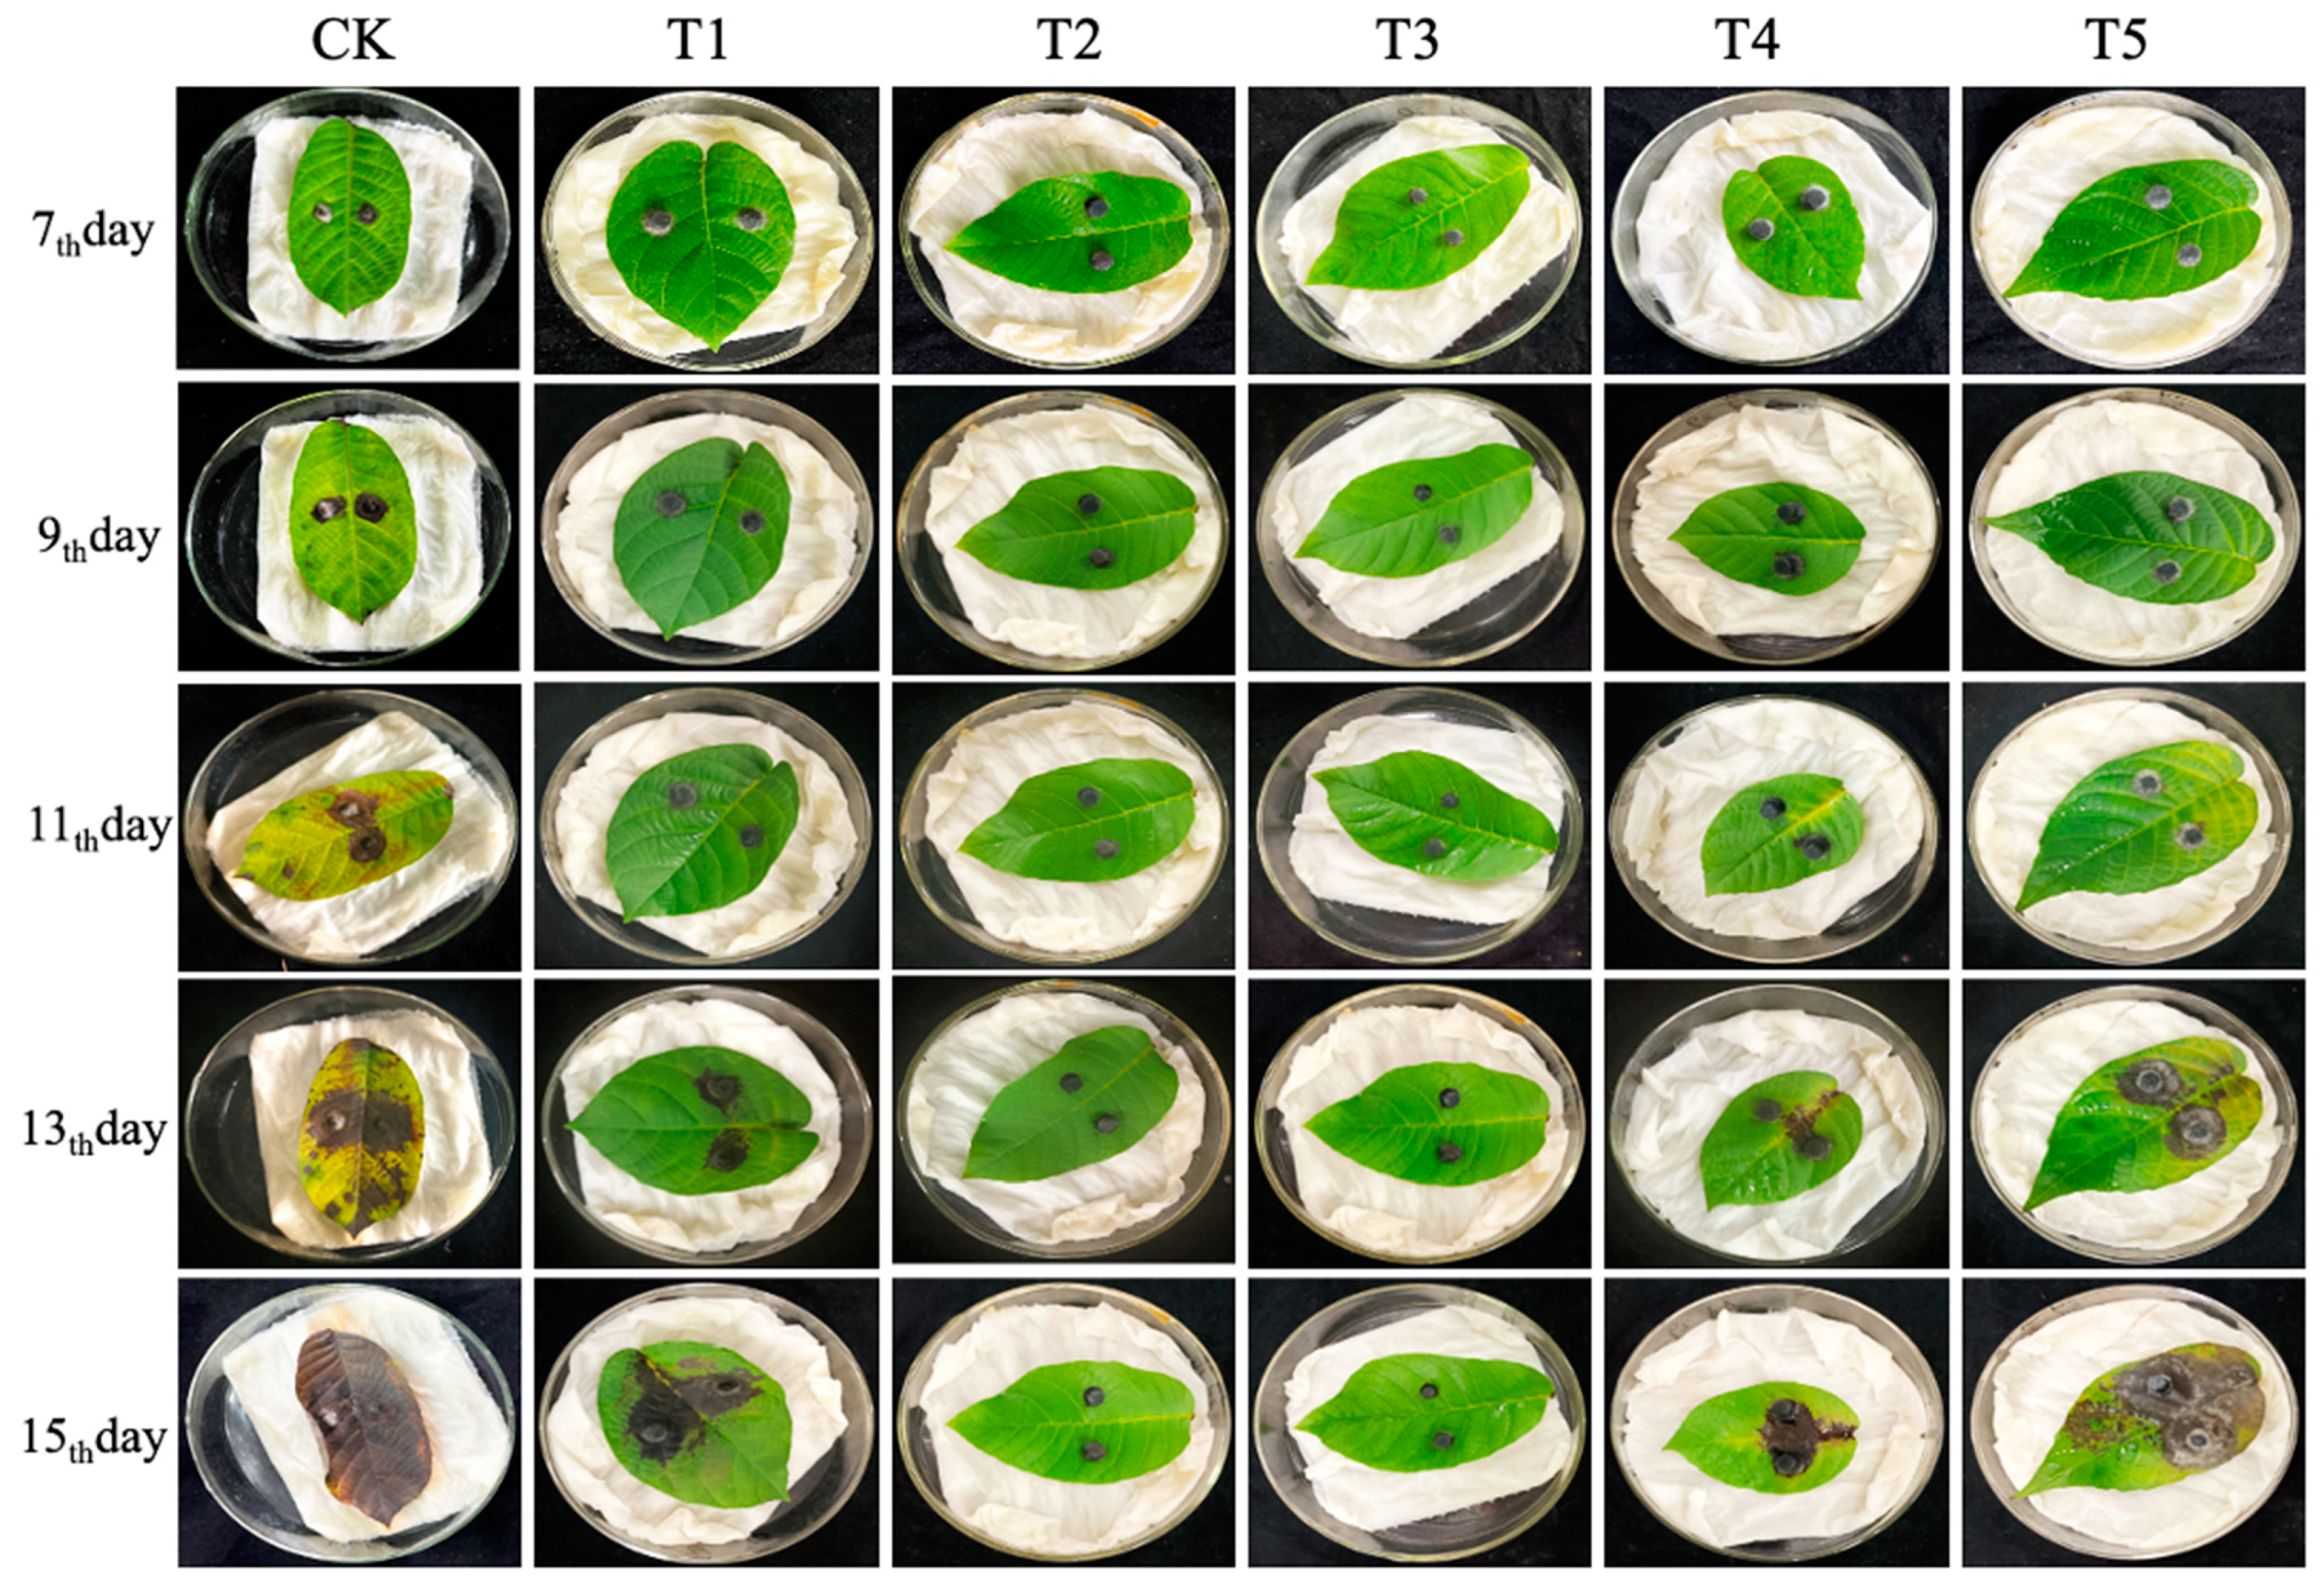
After inoculation with C. gloeosporioides, different frequencies of B. velezensis spray were tested on walnut leaves, with five gradients: T1, T2, T3, T4, and T5, representing spraying every 1 day, 2 days, 3 days, 4 days, and 5 days, respectively. The CK group served as a blank control, and each treatment had three replicates. Figure 7 clearly demonstrated that spraying walnut leaves with the same concentration of B. velezensis fermentation broth at different frequencies significantly impacted the infection degree of C. gloeosporioides on walnut leaves and controlled the expansion rate of the walnut leaf lesion area. The most pronounced effect was observed in the CK group, which exhibited the fastest chlorosis yellowing and lesion expansion rate. In contrast, the T2 and T3 groups showed minimal yellowing and significantly smaller lesion expansion. Further measurement and statistical analysis of the lesion areas were performed using repeated measures ANOVA. The lesion area data passed the Levene homogeneity test, meeting the precondition of homogeneity of variance. Since the data did not pass the sphericity test (p < 0.05), multivariate test results were employed. According to the multivariable results, the time point effect of Roy’s largest root was significant (F (4,9) = 507.519, p < 0.05), indicating notable changes in leaf lesion area over time. The interaction effect of the time point and treatment concentration of Roy’s largest root was also significant (F (5,12) = 524.656, p < 0.05), suggesting an interaction effect between these factors. As shown in Figure 8A, the damage area in the CK group began to expand after 7 days, while the damage areas in the T5, T1, and T4 treatment groups significantly increased after 11 days. This indicated that B. velezensis treatment could delay the expansion speed and onset time of walnut leaf lesions. According to the repeated analysis method estimating boundary value results (Figure 8B), the T2 and T3 groups demonstrated the most effective control, showing the least yellowing and significantly smaller lesion areas of only 0.737 cm2 and 1.008 cm2, respectively. In contrast, the T5 group had the weakest control effect. However, compared to the CK group, the T5 group still exhibited a significant control effect, with a reduction in lesion area by 21.867% (p < 0.05). Overall, the T1, T2, T3, T4, and T5 groups all effectively delayed lesion expansion and mitigated further infection of walnut leaves by C. gloeosporioides.
An in vitro control effect experiment was conducted on healthy, disease-free walnut fruits. As illustrated in Figure 9, C. gloeosporioides strongly infects walnuts in the control group. Over time, the walnut surface formed dark brown spots around the fungus cake, and the epidermis became rotten and depressed. Conversely, no obvious lesion formation occurred on the walnut fruit surface after spraying with B. velezensis. The results indicate that B. velezensis fermentation broth can effectively prevent C. gloeosporioides infection on walnut fruit.

3.3. Transcriptome Results

3.3.1. Sequencing Data Statistics

The transcriptome data of the B. velezensis has been reserved in the NCBI’s Sequence Read Archive (SRA) database under the accession number PRJNA742867. All experiments were implemented in triplicate, and the experimental data were expressed as the means ± SD. In total, 138,383,924 clean reads were obtained, and the percentage of Q30 bases in each sample was more than 93.28%. The percentage of GC content was in a range of 46.98–54.86%. The transcriptome sequencing results met the quality requirements of subsequent assembly analysis and the samples had high quality and high expression. The sequencing data of samples are shown in Table S4 (provided in Supplementary Materials).

3.3.2. Analysis of Gene Expression

The differential gene expression analysis was conducted among the D2_D, D4_D, and D6_D groups compared to their respective control groups (D2_CK, D4_CK, and D6_CK). Figure 10 illustrates the differences in expression levels between the samples. The numbers of DEGs were relatively similar between the D4_DvsD4_CK and D6_DvsD6_CK groups. Among the three groups, the D4_DvsD4_CK group exhibited the fewest up-regulated genes, while the D6_DvsD6_CK group had the most up-regulated genes. Conversely, the D2_DvsD2_CK group had the largest number of DEGs when compared to the other two groups. This finding suggests that B. velezensis displayed antibacterial activity against C. gloeosporioides from day 2 onwards, despite the considerable distance between the two strains on the substrate.

3.3.3. Gene Annotation Results

The unigene sequences of B. velezensis obtained under different treatment conditions were analyzed using GO and KEGG databases (Figure 11). The GO analysis classified the unigenes into biological processes (BP), cellular components (CC), and molecular functions (MF), with DEGs predominantly enriched in BP and MF. Distinct patterns of enrichment were observed across the comparison groups D2_DvsD2_CK, D4_DvsD4_CK, and D6_DvsD6_CK, indicating B. velezensis activates various genes at different stages to cope with C. gloeosporioides infection. In the D2_DvsD2_CK group, DEGs were significantly enriched in locomotion, non-membrane-bounded organelle, and organelle functions. This suggests that B. velezensis may modify its cellular structure and motility at this stage to counteract the attack of C. gloeosporioides. Particularly in the D2_DvsD2_CK group, the highest number of enriched DEGs were observed, indicating that B. velezensis stimulates numerous genes during this phase to respond to C. gloeosporioides infection. The D4_DvsD4_CK group showed DEGs primarily enriched in CC and MF, with significant enrichment in the aromatic amino acid family metabolic process. This indicates that B. velezensis might enhance the synthesis of aromatic amino acids at this stage, which play a crucial role in producing antimicrobial compounds and inhibiting the growth of C. gloeosporioides. In the D6_DvsD6_CK group, DEGs were predominantly enriched in BP and MF, with significant enrichment in pathways related to carbohydrate transport and metabolism. This suggests that B. velezensis may adjust these processes at this stage to resist C. gloeosporioides infection, while phosphorylated proteins may play a key role in regulating these processes.
The KEGG functional enrichment analysis identified the top 20 most significantly enriched pathways for each comparison group. Amino acid biosynthesis pathways were consistently enriched in both the D2_DvsD2_CK and D4_DvsD4_CK groups, suggesting that B. velezensis may enhance its production of essential amino acids under these conditions, potentially contributing to the synthesis of antimicrobial peptides or other secondary metabolites with antifungal properties. Energy metabolism pathways, including TCA cycle, and glycolysis/gluconeogenesis, were significantly enriched in both the D2_DvsD2_CK and D6_DvsD6_CK groups. This observation implies that B. velezensis may increase its energy production and metabolic activity under these conditions, enabling a more robust response against C. gloeosporioides infection. Phenylalanine, tyrosine, and tryptophan biosynthesis, and propanoate metabolism pathways were enriched in both the D4_DvsD4_CK and D6_DvsD6_CK groups. These pathways are involved in the synthesis of aromatic amino acids and organic acids, which may play a role in the production of antimicrobial compounds or altering the local environment to inhibit the growth of C. gloeosporioides.

3.3.4. PPI Network Analysis and qRT-PCR Verification

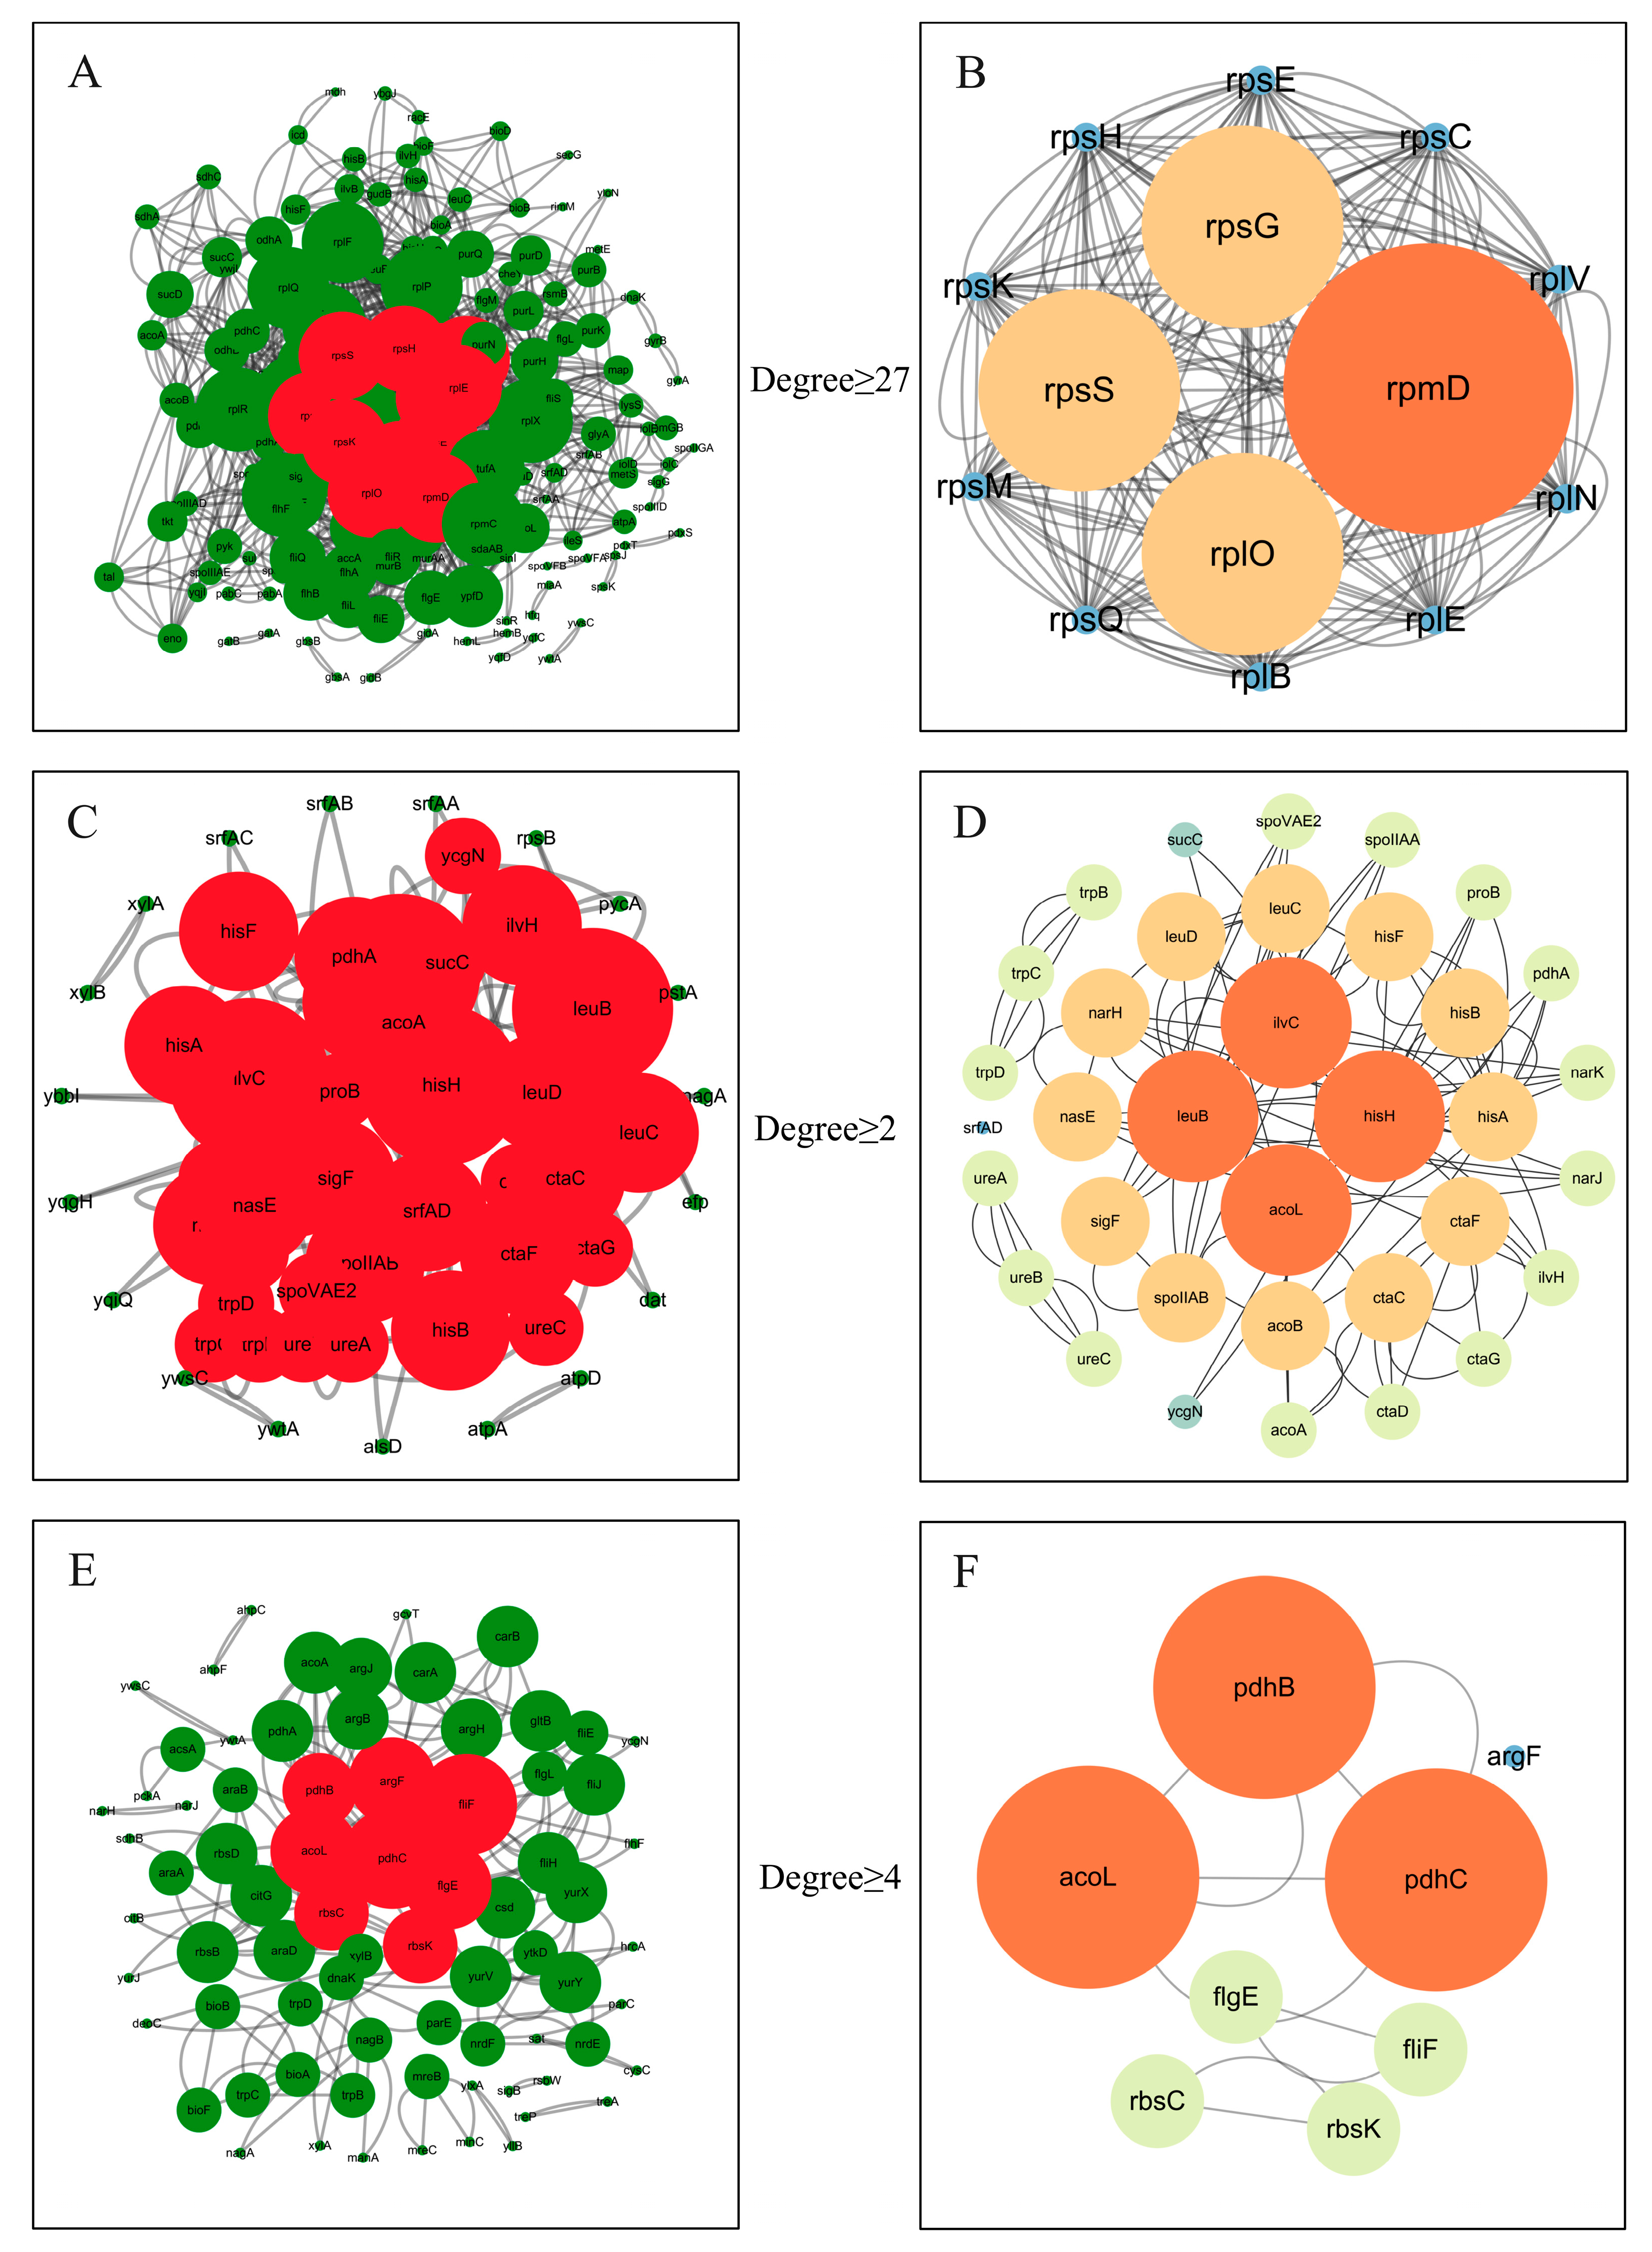
The PPI network analysis of DEGs in B. velezensis across various stages and groups revealed key gene interactions involved in biocontrol mechanisms (Figure 12). In the early stage (D2_DvsD2_CK group), the PPI network consisted of 159 nodes and 1276 edges. Core genes such as rpmD, rpsG, and rplB were significantly enriched in pathways such as ribosome, biosynthesis of secondary metabolites, biosynthesis of amino acids, biosynthesis of cofactors, flagellar assembly, carbon metabolism, microbial metabolism in diverse environments, and biotin metabolism. Notably, ribosome, biosynthesis of secondary metabolites, and flagellar assembly showed the highest gene enrichments. This suggests that B. velezensis likely produces antimicrobial secondary metabolites, enhances flagellar assembly and motility, and boosts protein synthesis capacity. In the mid-stage (D4_DvsD4_CK group), the PPI network had 54 nodes and 112 edges. The core genes, including acoL, hisH, and ilvC, among others, were significantly enriched in pathways such as biosynthesis of secondary metabolites, biosynthesis of amino acids, histidine metabolism, and valine, leucine, and isoleucine biosynthesis. This indicates that B. velezensis continues to exhibit antimicrobial effects against C. gloeosporioides by enhancing the synthesis of secondary metabolites, amino acids, and specific metabolic pathways (e.g., histidine metabolism and branched-chain amino acid biosynthesis), effectively inhibiting the growth of the C. gloeosporioides. In the late-stage (D6_DvsD6_CK group), the PPI network contained 74 nodes and 160 edges. Core genes such as pdhC, fliF, and acoL were significantly enriched in pathways such as biosynthesis of secondary metabolites, biosynthesis of amino acids, flagellar assembly, microbial metabolism in diverse environments, arginine biosynthesis, and ABC transporters. The two pathways, biosynthesis of secondary metabolites and biosynthesis of amino acids, indicate that B. velezensis is still involved in synthesizing and releasing antimicrobial-related substances. Additionally, microbial metabolism in diverse environments suggests that B. velezensis might adjust its metabolic pathways to adapt to different environmental conditions while enhancing its antimicrobial efficacy during competition with C. gloeosporioides. Overall, B. velezensis adopts a multifaceted strategy to enhance its biological control capabilities across the three stages. By bolstering the synthesis of secondary metabolites, amino acids, improving motility, and nutrient utilization, it effectively inhibits the growth of C. gloeosporioides.
The qRT-PCR verification of 30 randomly selected genes demonstrated a 100% consistency rate with transcriptome sequencing results (Figure 13), confirming the reliability of the data for further investigation of B. velezensis’ key pathways and differentially expressed genes.

4. Discussion

This study aimed to investigate the potential of B. velezensis as a biocontrol agent against C. gloeosporioides, which causes anthracnose disease in various crops, including walnut [38,39,40]. The effects of B. velezensis on C. gloeosporioides were investigated through the process of confrontation culture on PDA medium. The results demonstrated that B. velezensis caused breakage, enlargement, and twisting of the mycelium of C. gloeosporioides, effectively inhibiting its growth. These findings were consistent with previous research on Bacillus species [41,42]. Furthermore, Huang et al. [43] showed that B. velezensis HYEB5-6 exerts significant antifungal activity against C. gloeosporioides by regulating proteases and glucanases, which inhibits the germination of C. gloeosporioides conidia, suppresses hyphal growth, and impairs conidiogenesis.
Moreover, we explored the preventive effects of B. velezensis fermentation broth, at varying concentrations and frequencies, against C. gloeosporioides on walnut leaves. The experiment revealed that the growth of C. gloeosporioides on walnut leaves and fruits could be effectively prevented by applying the fermentation broth diluted 50 to 100 times and sprayed once every two to three days. Contrary to initial expectations, a higher concentration of the broth resulted in a reduced preventive effect. This observation aligns with the concept of hormesis, wherein a substance exhibits a stimulating effect at low doses and an inhibitory effect at high doses [44,45]. When we applied this optimal concentration and frequency to the walnut fruit experiment, the results showed excellent protection of the walnut fruit, with C. gloeosporioides failing to infect the walnut fruit. This implies that effective control of C. gloeosporioides, and hence, protection of the host, can be achieved by managing the concentration and frequency properly. Therefore, we believe that applying this method to other agricultural and forestry crops should also yield favorable results against anthracnose disease caused by C. gloeosporioides.
During the initial response stage (D2_DvsD2_CK), B. velezensis demonstrated significant antibacterial effects against C. gloeosporioides in a confrontational culture on PDA medium. This resulted in the inhibition of C. gloeosporioides’ hyphal growth, restricting its overall development [46,47]. Moreover, when subjected to leaf infiltration, C. gloeosporioides showed a remarkable decrease in infectivity after interacting with B. velezensis. At the transcriptional level, B. velezensis exhibited the highest number of differentially expressed genes during this stage, indicating a strategic adjustment of its metabolic activity to enhance its overall antimicrobial capabilities. The most significantly enriched KEGG pathways and PPI core genes were associated with biosynthesis of secondary metabolites, biosynthesis of amino acids, ribosome, flagellar assembly, and carbon metabolism. At this stage, B. velezensis and C. gloeosporioides were observed to be relatively distant on the PDA medium. The significant enrichment of the flagellar assembly pathway suggested that flagella might play a crucial role in B. velezensis’ antibacterial activity, potentially being involved in its positioning, motility, and environmental sensing. Bacillus species typically achieve chemotaxis through flagellar movement, leading to the hypothesis that B. velezensis sensed the presence of C. gloeosporioides through its flagella. Previous studies have shown that Bacillus species possess strong mobility, enabling them to rapidly colonize plant surfaces, form extensive biofilms, and occupy essential spatial niches, thereby monopolizing resources [48,49]. Similarly, research by Bacon et al. [50] demonstrated that Bacillus subtilis efficiently establishes colonization and reproduces in maize, gaining an advantage in spatial niches, and effectively reducing the abundance of the pathogenic fungus Fusarium moniliforme. It is well known that many species of the Bacillus genus possess the ability to synthesize diverse secondary metabolites, including volatile organic compounds, non-ribosomal peptides, and antimicrobial proteins [51,52,53]. Additionally, considering the relatively distant proximity between B. velezensis and C. gloeosporioides, it is possible that B. velezensis exerted its antifungal effect through volatile organic compounds (VOCs) against C. gloeosporioides [54]. Yuan et al. [55] discovered that Bacillus amyloliquefaciens NJN-6 produces 36 VOCs, completely inhibiting the mycelial growth and conidial germination of Fusarium oxysporum f. sp. cubense, the causal agent of banana wilt disease, when treated with 200 µg of benzothiazole phenol, 2,3,6-trimethylphenol, 2-nonanone, or 2-undecanone. B. velezensis’ antifungal strategy is often multifaceted. The significant enrichment of the biosynthesis of secondary metabolites, biosynthesis of amino acids, and ribosome pathways in B. velezensis further supported its modulation of metabolic pathways to synthesize antimicrobial proteins and metabolites, thereby suppressing further invasion and growth of C. gloeosporioides [42].
During the intermediate stage (D4_DvsD4_CK), B. velezensis continued to exhibit significant antifungal effects against C. gloeosporioides, resulting in the inhibition of its normal growth and adopting a rhomboid-shaped morphology on PDA medium. Leaf inoculation experiments also indicated that B. velezensis significantly reduced the infectivity and toxicity of C. gloeosporioides. Transcriptome analysis revealed that during this stage, the most significantly enriched metabolic pathways based on KEGG functional annotation and PPI core gene enrichment were Biosynthesis of secondary metabolites, Biosynthesis of amino acids, Microbial metabolism in diverse environments, and ABC transporters. These findings suggest that B. velezensis further adjusted its metabolic pathways to enhance the production and transportation of metabolites, aiming to counteract C. gloeosporioides infection. As is known, Bacillus species can produce surfactants such as surfactin and iturin [56,57,58,59]. Interestingly, in the transcriptomic data, the srfAD genes crucial for surfactant synthesis in B. velezensis were found to be downregulated, indicating the capability of B. velezensis to synthesize surfactants and regulate this metabolic pathway in response to C. gloeosporioides infection [60,61,62,63]. In contrast, Caroline et al. [31] reported an up-regulation of the srfA gene during antimicrobial processes in Bacillus species. Despite the differential gene expression, both findings emphasize the ability of B. velezensis to precisely regulate the expression of srfAD and other related genes to synthesize surfactants and control this metabolic pathway in response to the infection caused by the pathogen. The significant enrichment of biosynthesis of secondary metabolites, biosynthesis of amino acids, and ABC transporters further corroborates the continuous antifungal effect of B. velezensis against C. gloeosporioides at the molecular level. Notably, at the same stage, genes involved in the initiation and regulation of spore formation, such as spore IIAA and spore IIAB, were found to be upregulated [64]. The production of spores is crucial for the survival of Bacillus under adverse conditions [65,66]. In addition to the significant enrichment of Microbial metabolism in diverse environments, this suggests B. velezensis’ adaptive changes and metabolic adjustments in response to the challenges posed by C. gloeosporioides. The activation of these genes implies that B. velezensis might form spores to enhance its resistance and adaptability against the anthracnose pathogen. These spores can remain dormant and viable for an extended period, enabling B. velezensis to withstand unfavorable conditions and survive longer than the pathogen, ensuring its survival and continued antimicrobial activity when conditions become favorable [67].
In the late phase (D6_DvsD6_CK group), B. velezensis continued to antagonize C. gloeosporioides on PDA medium, resulting in the continued rhomboid-shaped growth of C. gloeosporioides. Leaf infection assays indicated that after six days of confrontation, C. gloeosporioides exhibited the lowest infection ability at three time points. This suggests that after six days of continuous confrontation, a significant portion of Colletotrichum gloeosporioides hyphae were distorted, leading to a substantial reduction in its virulence. Transcriptome analysis revealed that the most significantly enriched metabolic pathways based on KEGG functional enrichment and PPI core gene enrichment were: microbial metabolism in diverse environments, carbon metabolism, biosynthesis of secondary metabolites, biosynthesis of amino acids, and flagellar assembly. Notably, the most significant enrichment shifted from biosynthesis of secondary metabolites to microbial metabolism in diverse environments and carbon metabolism. Moreover, transcriptome analysis revealed differential expression of the rbsK and rbsC genes, which play a significant role in enhancing B. velezensis’ efficient utilization of environmental nutrients [68]. This indicates a significant shift in the strategy of B. velezensis during this stage, with a focus on environmental adaptation, including the enhancement of carbon metabolism pathways for more efficient utilization of available carbon sources. Additionally, the enrichment of the flagellar assembly pathway, along with differential expression of core genes such as fliF and flgE, resulted in increased B. velezensis motility, which is crucial for flagellar assembly [69,70,71]. According to the theory proposed by Tohru [72], this increased motility enables B. velezensis to better perceive and respond to environmental cues, navigating towards favorable survival conditions. In summary, B. velezensis adjusted its gene expression to enhance motility, carbohydrate utilization efficiency, and energy production. These adaptations enable B. velezensis to improve its colonization ability, effectively compete with Colletotrichum gloeosporioides, and outcompete other microorganisms in the environment. This dynamic response equips B. velezensis to withstand the challenges posed by C. gloeosporioides and ensures its survival and success within the microbial community.
Our study bolstered evidence for B. velezensis as potent biocontrol agents against C. gloeosporioides, encouraging further agricultural research and applications. Future research was suggested to prioritize functional studies, such as gene knockout or overexpression experiments, to validate the identified key genes and pathways and unravel the complex regulatory networks involved in biocontrol. Additionally, researchers were recommended to explore comprehensive management strategies for tree diseases such as anthracnose by combining B. velezensis with other biological control agents or chemical reagents, aiming to achieve efficient control.

5. Conclusions

This study highlighted B. velezensis’ potential as an effective biocontrol agent against the growth and virulence of C. gloeosporioides. We showed that a well-tuned spray of B. velezensis fermentation broth could serve as a protective shield for walnut leaves and fruits, reducing the risk of walnut anthracnose spread. Through transcriptome analysis, we discovered that B. velezensis employs multiple synergistic mechanisms to comprehensively control plant pathogens. For instance, it enhances the synthesis of metabolic products, improves flagellar assembly and chemotaxis, and enhances nutrient utilization capabilities, leading to a successful inhibition of C. gloeosporioides. Further investigations are required to precisely identify the biocontrol role of these crucial genes.

Supplementary Materials

The following supporting information can be downloaded at: https://www.mdpi.com/article/10.3390/microorganisms11081885/s1, Table S1: Methods for treating detached walnut leaves with different concentrations of B. velezensis fermentation liquid; Table S2: Methods for treating detached walnut leaves with different frequency of B. velezensis fermentation liquid; Table S3: Thirty Candidate validation genes for qRT-PCR; Table S4: Quality evaluation of sequencing datas.

Author Contributions

Conceptualization, L.W.; methodology, L.W. and T.Z.; software, L.W.; validation, T.Z. and L.W.; investigation, L.W.; writing—original draft preparation, L.W.; writing—review and editing, L.W. and T.Z. All authors have read and agreed to the published version of the manuscript.

Funding

Yaan city key research and development project funding.

Data Availability Statement

The data from this study are openly available in the NCBI’s Sequence Read Archive (SRA) database under the accession number PRJNA742867. You can access the data at https://www.ncbi.nlm.nih.gov/bioproject/?term=PRJNA742867 (accessed on 1 July 2021).

Conflicts of Interest

The authors declare no conflict of interest.

References

  1. Guney, M.; Kafkas, S.; Keles, S.; Zarifikhosroshahi, M.; Gundesli, M.A.; Ercisli, S.; Necas, T.; Bujdoso, G. Genetic diversity among some walnut (Juglans regia L.) genotypes by SSR markers. Sustainability 2021, 13, 6830. [Google Scholar] [CrossRef]
  2. Claudia, S.G.; Ciudad, C.J.; Noe, V.; Maria, I.P. Health benefits of walnut polyphenols: An exploration beyond their lipid profile. Crit. Rev. Food Sci. 2017, 57, 3373–3383. [Google Scholar] [CrossRef] [Green Version]
  3. Holasou, H.A.; Jalaly, H.M.; Mohammadi, R.; Panahi, B. Genetic diversity and structure of superior spring frost tolerant genotypes of Persian walnut (Juglans regia L.) in East Azerbaijan province of Iran, characterized using inter simple sequence repeat (ISSR) markers. Genet. Resour. Crop Evol. 2023, 70, 539–548. [Google Scholar] [CrossRef]
  4. Pardaev, G.Y.; Normamatov, R. Economic and nutritional values of walnut: The main reason for development of walnut in Uzbekistan. J. Nuts 2021, 12, 103–112. [Google Scholar] [CrossRef]
  5. Daniele, D.L.; José, F.C.D.; Cyrielle, M.; Morgane, C.; Djiby, K.; Michel, G.; Agnes, V.; Patrice, N.; Sabrina, S.; Gaetan, L.F.; et al. Combined metabarcoding and multi-locus approach for genetic characterization of Colletotrichum species associated with common walnut (Juglans regia) anthracnose in France. Sci. Rep. 2018, 8, 10765. [Google Scholar] [CrossRef] [Green Version]
  6. Han, H.W.; Woeste, K.E.; Hu, Y.F.; Liang, D.; Liu, Q.; Zhao, P.; Liu, J.C. Genetic diversity and population structure of common walnut (Juglans regia) in China based on EST-SSRs and the nuclear gene phenylalanine ammonialyase (PAL). Tree Genet. Genomes 2016, 12, 111. [Google Scholar] [CrossRef]
  7. Xu, X.W.; Xu, X.H.; Liu, X.; Chen, J.Y.; Wang, Y.X. Reserach progress of walnut anthracnose. Hubei Agric. Sci. 2020, 1, 16–19. (In Chinese) [Google Scholar] [CrossRef]
  8. Fang, H.C.; Liu, X.; Dong, Y.H.; Feng, S.; Zhou, R.; Wang, C.X.; Ma, X.M.; Liu, J.N.; Yang, K.Q. Transcriptome and proteome analysis of walnut (Juglans regia L.) fruit in response to infection by Colletotrichum gloeosporioides. BMC Plant Biol. 2021, 21, 249. [Google Scholar] [CrossRef]
  9. Zhu, Y.; Yin, Y.; Yang, K.; Li, J.; Sang, Y.; Long, H.; Shu, F. Construction of a highdensity genetic map using specifc length amplifed fragment markers and identifcation of a quantitative trait locus for anthracnose resistance in walnut (Juglans regia L.). BMC Genom. 2015, 16, 614. [Google Scholar] [CrossRef] [Green Version]
  10. Jiao, C.; Chen, L.; Sun, C.; Jiang, Y.; Zhai, L.M.; Liu, H.B.; Shen, Z.Y. Evaluating national ecological risk of agricultural pesticides from 2004 to 2017 in China. Environ. Pollut. 2020, 259, 112778. [Google Scholar] [CrossRef]
  11. Wei, L.L.; Zheng, H.H.; Zhang, P.C.; Chen, W.C.; Zheng, J.Q.; Chen, C.J.; Cao, A.B. Molecular and biochemical characterization of Colletotrichum gloeosporioides isolates resistant to azoxystrobin from grape in China. Plant Pathol. 2021, 70, 1300–1309. [Google Scholar] [CrossRef]
  12. Chechi, A.; Stahlecker, J.; Dowling, M.; Schnabel, G. Diversity in species composition and fungicide resistance profiles in Colletotrichum isolates from apples. Pestic. Biochem. Phys. 2019, 158, 18–24. [Google Scholar] [CrossRef]
  13. Tai, H.K.; Zhang, F.; Xiao, C.; Tang, R.; Liu, Z.; Bai, S.X.; Wang, Z.Y. Toxicity of chemical pesticides commonly used in maize to Trichogramma ostriniae (Hymenoptera: Trichogrammatidae), an egg parasitoid of Asian corn borer. Ecotoxicol. Environ. Saf. 2022, 241, 113802. [Google Scholar] [CrossRef]
  14. Lata, R.; Komal, T.; Neha, K.; Neelam, S.; Sukhbir, S.; Ajmer, S.G.; Arun, L.S.; Jyotsna, K. An extensive review on the consequences of chemical pesticides on human health and environment. J. Clean. Prod. 2021, 283, 124657. [Google Scholar] [CrossRef]
  15. Pacifico, M.G.; Eckstein, B.; Bettiol, W. Screening of Bacillus for the development of bioprotectants for the control of Fusarium oxysporum f. sp. vasinfectum and meloidogye incognita. Biol. Control 2021, 164, 104764. [Google Scholar] [CrossRef]
  16. Liu, Y.; Teng, K.; Wang, T.; Dong, E.; Zhang, M.; Tao, Y.; Zhong, J. Antimicrobial Bacillus velezensis HC6: Production of three kinds of lipopeptides and biocontrol potential in maize. J. Appl. Microbiol. 2020, 128, 242–254. [Google Scholar] [CrossRef] [PubMed] [Green Version]
  17. Zhang, R.S.; Wang, F.G.; Qi, Z.Q.; Qiao, J.Q.; Du, Y.; Yu, J.J.; Yu, M.N.; Liang, D.; Song, T.Q.; Yan, P.X.; et al. Iturins produced by Bacillus velezensis Jt84 play a key role in the biocontrol of rice blast disease. Biol. Control 2022, 174, 105001. [Google Scholar] [CrossRef]
  18. Jin, P.F.; Wang, H.N.; Tan, Z.; Xuan, Z.; Dahar, G.Y.; Li, Q.X.; Miao, W.G.; Liu, W.B. Antifungal mechanism of bacillomycin D from Bacillus velezensis HN-2 against Colletotrichum gloeosporioides Penz. Pestic. Biochem. Phys. 2020, 163, 102–107. [Google Scholar] [CrossRef]
  19. Laird, M.; Piccoli, D.; Weselowski, B.; McDowell, T.; Renaud, J.; MacDonald, J.; Yuan, Z.C. Surfactin-producing Bacillus velezensis 1B-23 and Bacillus sp. 1D-12 protect tomato against bacterial canker caused by Clavibacter michiganensis subsp. Michiganensis. J. Plant Pathol. 2020, 2, 451–458. [Google Scholar] [CrossRef]
  20. Rabbee, M.F.; Islam, N.; Baek, K.H. Biocontrol of citrus bacterial canker caused by Xanthomonas citri subsp. citri by Bacillus velezensis. Saudi J. Biol. Sci. 2022, 29, 2363–2371. [Google Scholar] [CrossRef] [PubMed]
  21. Kang, X.; Zhang, W.; Cai, X.; Zhu, T.; Xue, Y.; Liu, C. Bacillus velezensis CC09: A potential ‘Vaccine’ for controlling wheat diseases. Mol. Plant-Microbe Interact. 2018, 31, 623–632. [Google Scholar] [CrossRef] [Green Version]
  22. Sandhya, N.; Riteshri, S.; Dhiraj, P.; Hareshkumar, K. Genome analysis uncovers the prolific antagonistic and plant growth-prmoting potential of endophyte Bacillus velezensis K1. Gene 2022, 836, 146671. [Google Scholar] [CrossRef]
  23. Wei, J.B.; Zhao, J.; Suo, M.; Wu, H.; Zhao, M.; Yang, H.Y. Biocontrol mechanisms of Bacillus velezensis against Fusarium oxysporum from Panax ginseng. Biol. Control 2023, 182, 105222. [Google Scholar] [CrossRef]
  24. Jia, H.L.; Huang, S.W.; Cheng, S.; Zhang, X.W.; Chen, X.; Zhang, Y.S.; Wang, J.; Wu, L.F. Novel mechanisms of selenite reduction in Bacillus subtilis 168: Confirmation of multiple-pathway mediated remediation based on transcriptome analysis. J. Hazard. Mater. 2022, 433, 128834. [Google Scholar] [CrossRef]
  25. Meng, F.Q.; Zhu, X.Y.; Nie, T.; Lu, F.X.; Bie, X.M.; Lu, Y.J.; Trouth, F.; Lu, Z.X. Enhanced expression of pullulanase in Bacillus subtilis by new strong promoters mined from transcriptome data, both alone and in combination. Front. Microbiol. 2018, 9, 2635. [Google Scholar] [CrossRef] [Green Version]
  26. Jiang, C.H.; Yao, X.F.; Mi, D.D.; Li, Z.J.; Yang, B.Y.; Zheng, Y.; Qi, Y.J.; Guo, J.H. Comparative transcriptome analysis reveals the biocontrol mechanism of Bacillus velezensis F21 Against Fusarium wilt on watermelon. Front. Microbiol. 2019, 10, 652. [Google Scholar] [CrossRef]
  27. Ryu, C.M.; Farag, M.A.; Hu, C.H.; Reddy, M.S.; Kloepper, J.W.; Paré, P.W. Bacterial volatiles induce systemic resistance in Arabidopsis. Plant Physiol. 2004, 134, 1017–1026. [Google Scholar] [CrossRef] [Green Version]
  28. Yan, Z.N.; Reddy, M.S.; Ryu, C.M.; McInroy, J.A.; Wilson, M.; Kloepper, J.W. Induced systemic protection against tomato late blight elicited by plant growth-promoting rhizobacteria. Phytopathology 2002, 92, 1329–1333. [Google Scholar] [CrossRef] [Green Version]
  29. Liu, R.H.; Li, J.Y.; Zhang, F.R.; Zheng, D.; Chang, Y.L.; Xu, L.S.; Huang, L.L. Biocontrol activity of Bacillus velezensis D4 against apple Valsa canker. Biol. Control 2021, 163, 104760. [Google Scholar] [CrossRef]
  30. Liang, N.; Charron, J.B.; Jabaji, S. Comparative transcriptome analysis reveals the biocontrol mechanism of Bacillus velezensis E68 against Fusarium graminearum DAOMC 180378, the causal agent of Fusarium head blight. PLoS ONE 2023, 18, e0277983. [Google Scholar] [CrossRef]
  31. Caroline, P.; Maud, D.; Camille, M.; Dominique, L.C.; Stéphane, A.; Romain, B. Biofilm formation and synthesis of antimicrobial compounds by the biocontrol agent Bacillus velezensis QST713 in an Agaricus bisporus compost micromodel. Appl. Environ. Microbiol. 2019, 85, e00327-19. [Google Scholar] [CrossRef] [Green Version]
  32. Harun-Or-Rashid, M.; Kim, H.J.; Yeom, S.I.; Yu, H.A.; Manir, M.M.; Moon, S.S.; Kang, Y.J.; Chung, Y.R. Bacillus velezensis YC7010 enhances plant defenses against brown planthopper through transcriptomic and metabolic changes in rice. Front. Plant Sci. 2018, 9, 1904. [Google Scholar] [CrossRef] [PubMed] [Green Version]
  33. Li, S.; Xiao, Q.L.; Yang, H.J.; Huang, J.G.; Li, Y. Characterization of a new Bacillus velezensis as a powerful biocontrol agent against tomato gray mold. Pest. Biochem. Physiol. 2022, 187, 105199. [Google Scholar] [CrossRef] [PubMed]
  34. Zhang, Y.H.; Zhao, M.X.; Chen, W.; Yu, H.L.; Jia, W.T.; Pan, H.Y.; Zhang, X.H. Multi-Omics Techniques for Analysis Antifungal Mechanisms of Lipopeptides Produced by Bacillus velezensis GS-1 against Magnaporthe oryzae In Vitro. Int. J. Mol. Sci. 2022, 23, 3762. [Google Scholar] [CrossRef]
  35. Wang, Q.H.; Ji, Y.P.; Qu, Y.Y.; Qi, Y.K.; Li, D.W.; Liu, Z.Y.; Wu, X.Q. The response strategies of Colletotrichum gloeosporioides s.s. due to the stress caused by biological control agent amyloliquefaciens deciphered by transcriptome analyses. Biol. Control 2020, 150, 104372. [Google Scholar] [CrossRef]
  36. Sun, L.L. Study on the Effect of Temperature Stress on the Flavor Metabolism of Bacillus Amyloliquefaciens JP-1 Based on Transcriptomics; Guizhou University: Guiyang, China, 2020; (In Chinese). [Google Scholar] [CrossRef]
  37. Livak, K.J.; Schmittgen, T.D. Analysis of relative gene expression data using real-time quantitative PCR and the 2−ΔΔCT method. Methods 2001, 25, 402–408. [Google Scholar] [CrossRef]
  38. Yeimmy, P.R.; Chiara, R.; Carlos, D.G.T.; Clemencia, C.L. Green management of postharvest anthracnose caused by Colletotrichum gloeosporioides. J. Fungi 2023, 9, 623. [Google Scholar] [CrossRef]
  39. Wang, Y.; Xu, W.T.; Lu, R.S.; Chen, M.; Liu, J.; Sun, X.Q.; Zhang, Y.M. Genome sequence resource for Colletotrichum gloeosporioides, an important pathogenic fungus causing anthracnose of Dioscorea alata. Plant Dis. 2023, 107, 893–895. [Google Scholar] [CrossRef]
  40. Zakaria, L. Diversity of Colletotrichum species associated with anthracnose disease in tropical fruit crops—A review. Agriculture 2021, 11, 297. [Google Scholar] [CrossRef]
  41. Huang, H.Y.; Wu, Z.Q.; Tian, C.M.; Liang, Y.M.; You, C.J.; Chen, L. Identification and characterization of the endophytic bacterium Bacillus atrophaeus XW2, antagonistic towards Colletotrichum gloeosporioides. Ann. Microbiol. 2015, 65, 1361–1371. [Google Scholar] [CrossRef]
  42. Zhang, T.F.; Wen, G.Q.; Song, B.; Chen, Z.Y.; Jiang, S.J. Transcriptome profiling reveals the underlying mechanism of grape post-harvest pathogen Penicillium olsonii against the metabolites of Bacillus velezensis. Front. Microbiol. 2023, 13, 1019800. [Google Scholar] [CrossRef]
  43. Huang, L.; Li, Q.C.; Hou, Y.; Li, G.Q.; Yang, J.Y.; Li, D.W.; Ye, J.R. Bacillus velezensis strain HYEB5-6 as a potential biocontrol agent against anthracnose on Euonymus japonicus. Biocontrol. Sci. Technol. 2017, 27, 636–653. [Google Scholar] [CrossRef]
  44. Ge, H.L.; Zhou, M.; Lv, D.Z.; Wang, M.Y.; Xie, D.F.; Yang, X.F.; Dong, C.Z.; Li, S.H.; Lin, P. Novel segmented concentration addition method to predict mixture hormesis of chlortetracycline hydrochloride and oxytetracycline hydrochloride to aliivibrio fischeri. Int. J. Mol. Sci. 2020, 21, 481. [Google Scholar] [CrossRef] [PubMed] [Green Version]
  45. Ayyanath, M.M.; Cutler, G.C.; Scott-Dupree, C.D.; Sibley, P.K. Transgenerational shifts in reproduction hormesis in green peach aphid exposed to low concentrations of imidacloprid. PLoS ONE 2013, 8, e74532. [Google Scholar] [CrossRef]
  46. Ashwini, N.; Srividya, S. Potentiality of Bacillus subtilis as biocontrol agent for management of anthracnose disease of chilli caused by Colletotrichum gloeosporioides OGC1. 3 Biotech 2014, 4, 127–136. [Google Scholar] [CrossRef] [Green Version]
  47. Chet, I.; Ordentlich, A.; Shapira, R.; Oppenheim, A. Mechanism of biocontrol of soil borne plant pathogens by rhizobacteria. Plant Soil 1990, 129, 85–92. [Google Scholar] [CrossRef]
  48. Majed, R.; Faille, C.; Kallassy, M.; Gohar, M. Bacillus cereus biofilms-same, only different. Front. Microbiol. 2016, 7, 1054. [Google Scholar] [CrossRef] [Green Version]
  49. Chaban, B.; Hughes, H.V.; Beeby, M. The flagellum in bacterial pathogens: For motility and a whole lot more. Semin. Cell Dev. Biol. 2015, 46, 91–103. [Google Scholar] [CrossRef] [Green Version]
  50. Bacon, C.W.; Hinton, D.M. Endophytic and biological control potential of Bacillus mojavensis and related species. Biol. Control 2002, 23, 274–284. [Google Scholar] [CrossRef] [Green Version]
  51. Liu, X.Y.; Ren, B.; Chen, M.; Wang, H.B.; Kokare, C.R.; Zhou, X.L.; Wang, J.D.; Dai, H.Q.; Song, F.H.; Liu, M.; et al. Production and characterization of a group of bioemulsifiers from the marine Bacillus velezensis strain H3. Appl. Microbiol. Biotechnol. 2010, 87, 1881–1893. [Google Scholar] [CrossRef]
  52. Gao, X.Y.; Liu, Y.; Miao, L.L.; Li, E.W.; Sun, G.X.; Liu, Y.; Liu, Z.P. Characterization and mechanism of anti-Aeromonas salmonicida activity of a marine probiotic strain, Bacillus velezensis V4. Appl. Microbiol. Biotechnol. 2017, 101, 3759–3768. [Google Scholar] [CrossRef]
  53. Li, B.; Li, Q.; Xu, Z.H.; Zhang, N.; Shen, Q.R.; Zhang, R.F. Responses of beneficial Bacillus amyloliquefaciens SQR9 to different soilborne fungal pathogens through the alteration of antifungal compounds production. Front. Microbiol. 2014, 5, 636. [Google Scholar] [CrossRef] [PubMed] [Green Version]
  54. Raza, W.; Ling, N.; Zhang, R.F.; Huang, Q.W.; Xu, Y.C.; Shen, Q.R. Success evaluation of the biological control of Fusarium wilts of cucumber, banana, and tomato since 2000 and future research strategies. Crit. Rev. Biotechnol. 2017, 37, 202–212. [Google Scholar] [CrossRef] [PubMed]
  55. Yuan, J.; Raza, W.; Shen, Q.R.; Huang, Q.W. Antifungal activity of Bacillus amyloliquefaciens NJN-6 volatile compounds against Fusarium oxysporum f. sp. cubense. Appl. Environ. Microbiol. 2012, 78, 5942–5944. [Google Scholar] [CrossRef] [Green Version]
  56. Deng, Q.; Wang, R.D.; Sun, D.F.; Sun, L.J.; Wang, Y.L.; Pu, Y.H.; Fang, Z.J.; Xu, D.F.; Liu, Y.; Ye, R.Y.; et al. Complete genome of Bacillus velezensis CMT-6 and comparative genome analysis reveals lipopeptide diversity. Biochem. Genet. 2020, 58, 1–15. [Google Scholar] [CrossRef]
  57. Théatre, A.; Hoste, A.C.R.; Rigolet, A.; Benneceur, I.; Bechet, M.; Ongena, M.; Deleu, M.; Jacques, P. Bacillus sp.: A Remarkable Source of Bioactive Lipopeptides. Adv. Biochem. Eng. Biot. 2022, 181, 123–179. [Google Scholar] [CrossRef]
  58. Xu, W.F. Study on the Biological Control Effects and Mechanisms of Mulberry Endophytic Bacillus Subtilis 7PJ-16 against Mulberry Fruit Sclerotiniosis; Southwest University Chongqing: Chongqing, China, 2020. (In Chinese) [Google Scholar]
  59. Yuan, P.H.; Lyu, X.Q.; Liu, Y.F.; Li, J.H.; Liu, L.; Du, G.C. Regulation of plasma membrane homeostasis to increase the accumulation of menaquinone-4 in Bacillus subtilis. Food Ferment. Ind. 2021, 47, 1–7. (In Chinese) [Google Scholar] [CrossRef]
  60. Douwe, V.S.; Giuliano, G.; Paola, C.; Francesca, D.F.; Sebo, W.; Gérard, V.; Guido, G. Characterization of the srfA locus of Bacillus subtilis: Only the valine-activating domain of srfA is involved in the establishment of genetic competence. Mol. Microbiol. 1993, 8, 833–841. [Google Scholar] [CrossRef]
  61. Mujtaba, A.S.A.; Sayyed, R.Z.; Mir, M.I.; Khan, M.Y.; Bee, H.; Alkhanani, M.F.; Shafiul, H.; Rahman, M.A.T.A.; Péter, P. Induction of systemic resistance in Maize and antibiofilm activity of surfactin from Bacillus velezensis MS20. Front. Microbiol. 2022, 13, 879739. [Google Scholar] [CrossRef]
  62. Duarte, I.O.; Hissa, D.C.; Quintela, B.C.S.F.; Rabelo, M.C.; Oliveira, F.A.S.; Lima, N.C.B.; Melo, V.M.M. Genomic analysis of surfactant-producing Bacillus vallismortis TIM68: First glimpse at species pangenome and prediction of new plipastatin-like lipopeptide. Appl. Biochem. Biotechnol. 2023, 195, 753–771. [Google Scholar] [CrossRef]
  63. Nakano, M.M.; Marahiel, M.A.; Zuber, P. Identification of a genetic locus required for biosynthesis of the lipopeptide antibiotic surfactin in Bacillus subtilis. J. Bacteriol. 1988, 170, 5662–5668. [Google Scholar] [CrossRef] [Green Version]
  64. Joanna, C.; Iain, D.C.; Michael, D.Y. NMR studies of the interactions of SpoIIAA with its partner proteins that regulate sporulation in Bacillus subtilis. J. Mol. Biol. 2001, 314, 359–364. [Google Scholar] [CrossRef]
  65. Zhao, Z.M.; Xi, J.T.; Xu, J.F.; Ma, L.T.; Zhao, J. Enhancement of Bacillus subtilis growth and sporulation by two-stage solid-state fermentation strategy. Processes 2019, 7, 644. [Google Scholar] [CrossRef] [Green Version]
  66. Nicholson, W.L.; Munakata, N.; Horneck, G.; Melosh, H.J.; Setlow, P. Resistance of Bacillus endospores to extreme terrestrial and extraterrestrial environments. Microbiol. Mol. Biol. Rev. 2000, 64, 548–572. [Google Scholar] [CrossRef] [Green Version]
  67. Setlow, P. Spores of Bacillus subtilis: Their resistance to and killing by radiation, heat and chemicals. J. Appl. Microbiol. 2006, 101, 514–525. [Google Scholar] [CrossRef]
  68. Mojardín, L.; Salas, M. Global transcriptional analysis of virus-host interactions between phage ϕ29 and Bacillus subtilis. J. Virol. 2016, 90, 9293–9304. [Google Scholar] [CrossRef] [Green Version]
  69. Ueno, T.; Oosawa, K.; Aizawa, S.I. M ring, S ring and proximal rod of the flagellar basal body of Salmonella typhimurium are composed of subunits of a single protein, FliF. J. Mol. Biol. 1992, 227, 672–677. [Google Scholar] [CrossRef]
  70. Morimoto, Y.V.; Ito, M.; Hiraoka, K.D.; Che, Y.S.; Bai, F.; Kami-ike, N.; Namba, K.; Minamino, T. Assembly and stoichiometry of FliF and FlhA in Salmonella flagellar basal body. Mol. Microbiol. 2014, 91, 1214–1226. [Google Scholar] [CrossRef]
  71. You, Y.; Ye, F.; Mao, W.; Yang, H.; Lai, J.J.; Deng, S. An overview of the structure and function of the flagellar hook FlgE protein. World J. Microbiol. Biotechnol. 2023, 39, 126. [Google Scholar] [CrossRef]
  72. Tohru, M.; Miki, K.; Keiichi, N. Directional switching mechanism of the bacterial flagellar motor. Comput. Struct. Biotechnol. J. 2019, 17, 1075–1081. [Google Scholar] [CrossRef]
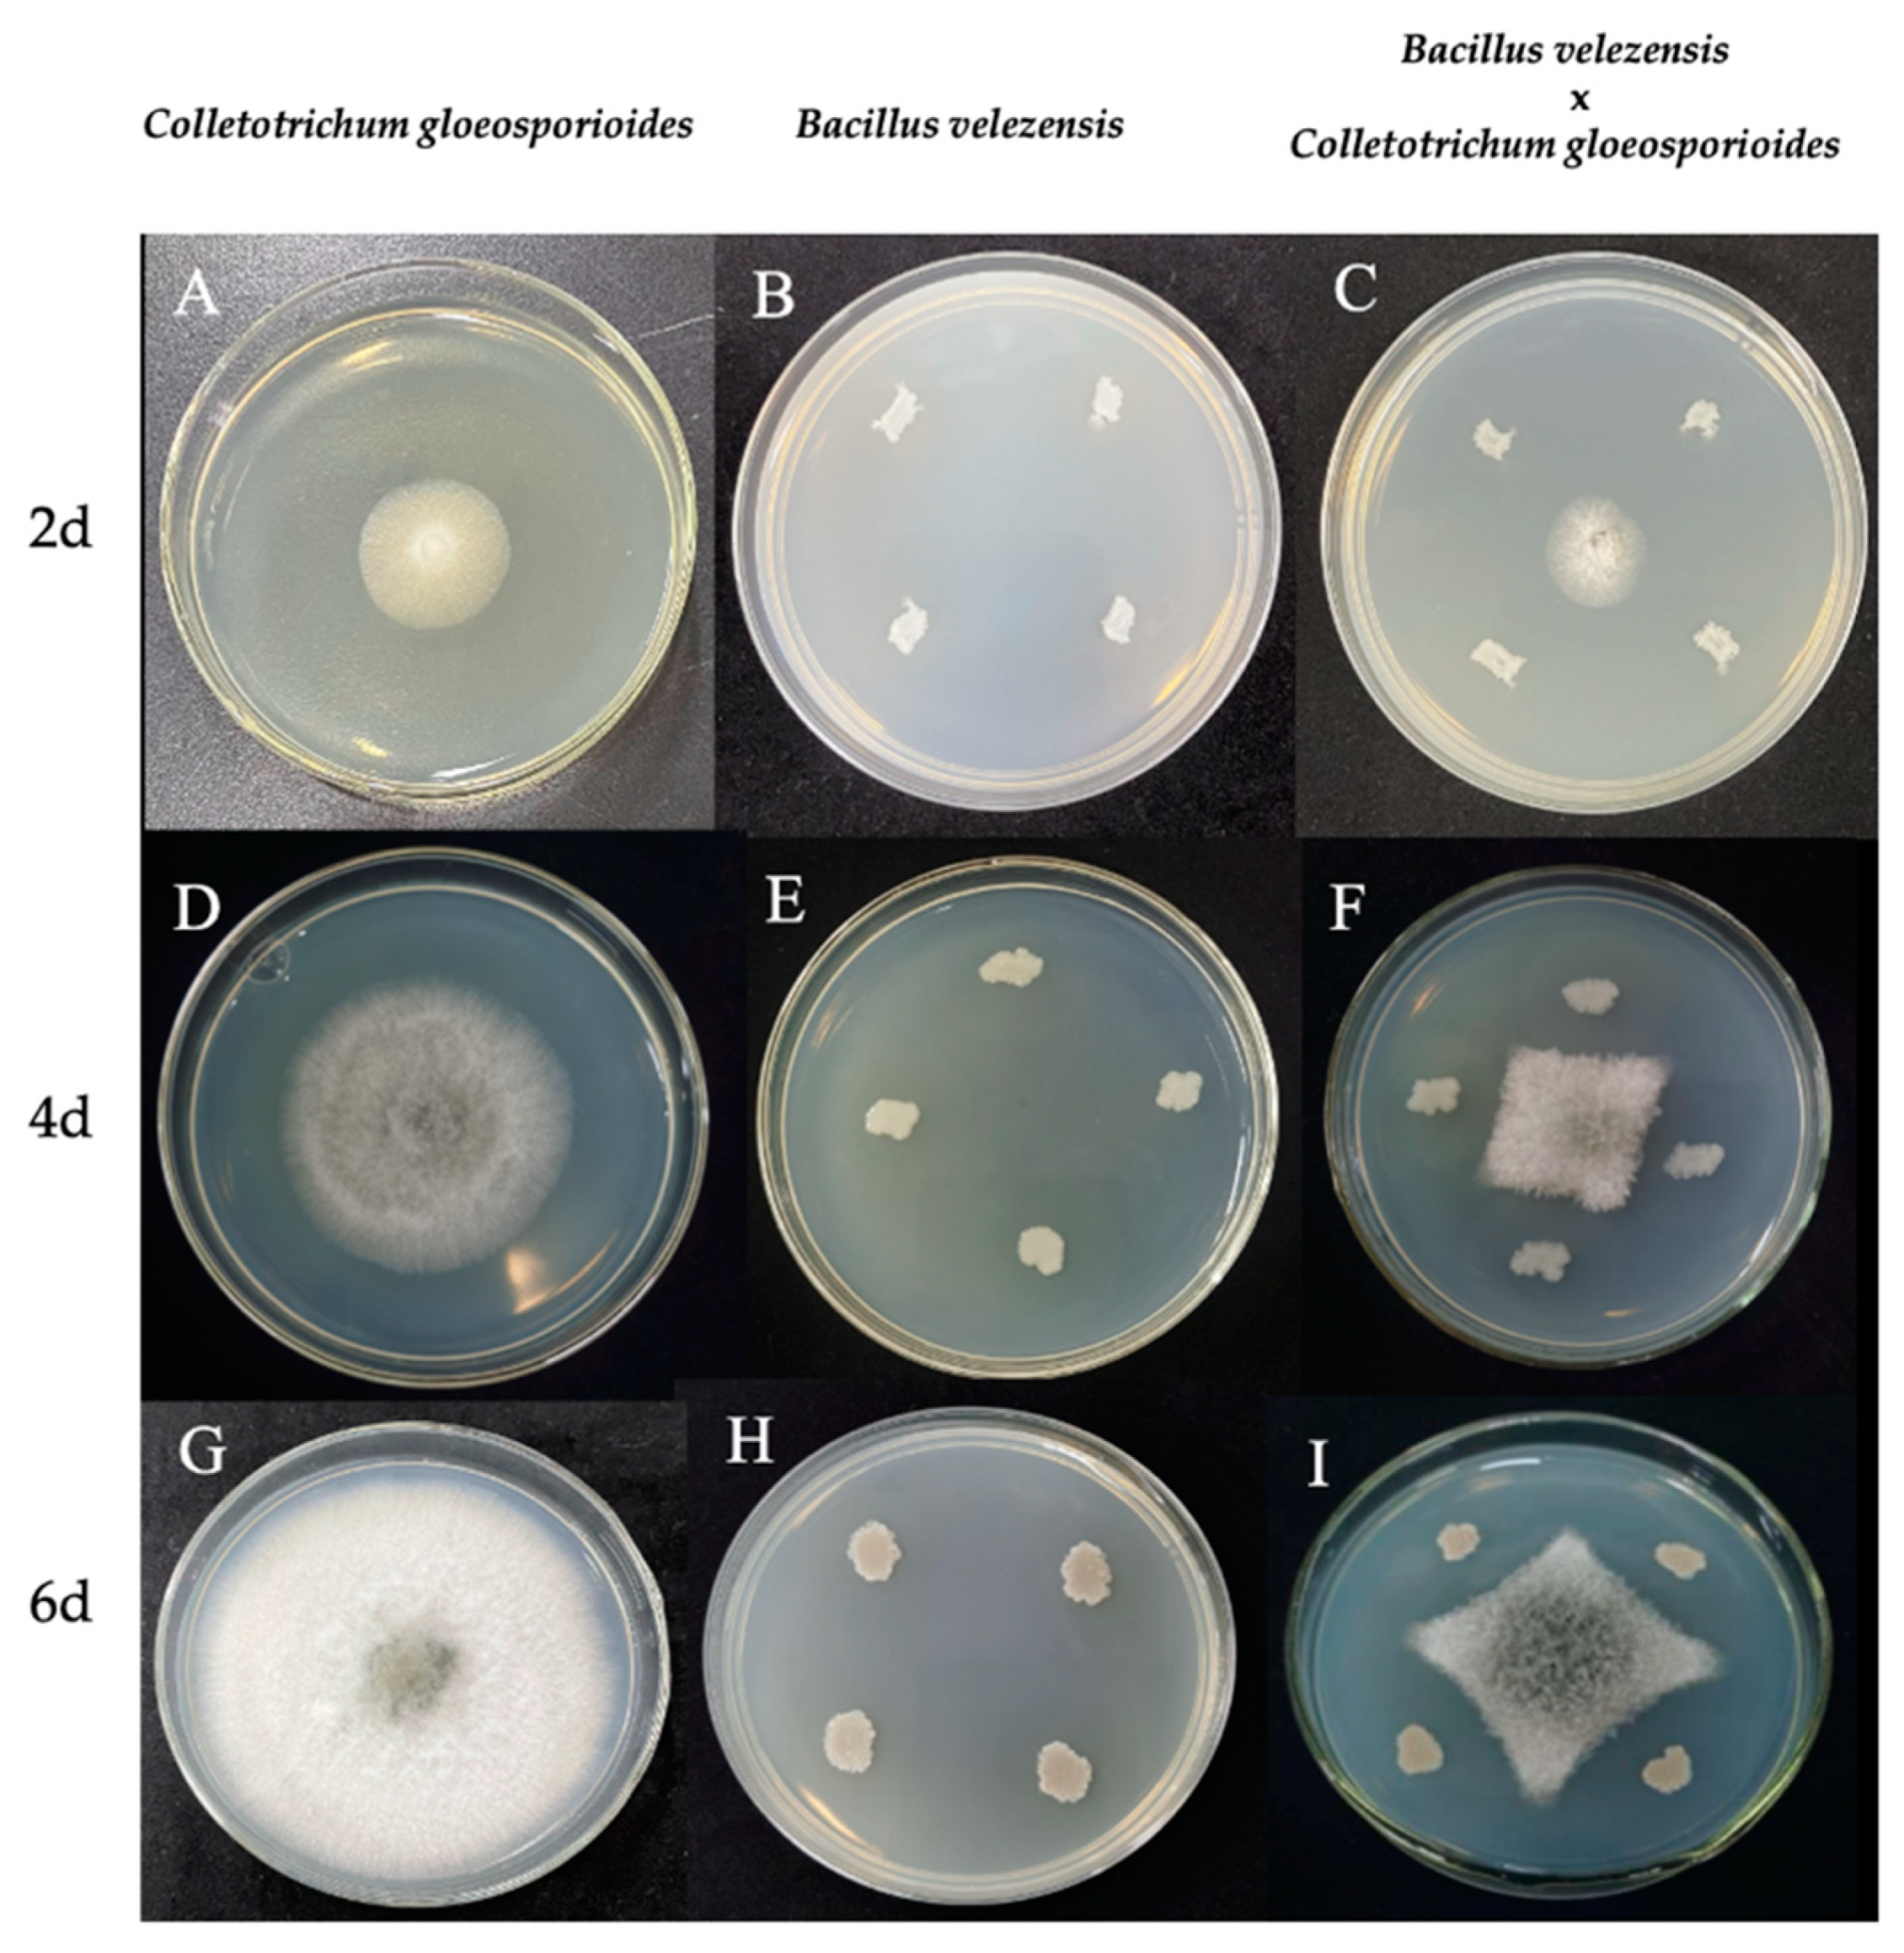
Figure 1. The mycelial morphology of C. gloeosporioides and B. velezensis on PDA medium after 2, 4, and 6 days of culture. (A,D,G) C. gloeosporioides cultured alone. (B,E,H) B. velezensis cultured alone. (C,F,I) Confrontation culture of C. gloeosporioides and B. velezensis strain. (AC) Cultured on the second day. (DF) Cultured on the fourth day. (GI) Cultured on the sixth day.
Microorganisms 11 01885 g001
Figure 2. Morphological characteristics of C. gloeosporioides mycelium. (AC) C. gloeosporioides mycelial morphology on PDA medium alone, 6 days after inoculation; (DF) C. gloeosporioides mycelial morphology co-cultured with B. velezensis on PDA medium, 6 days after inoculation. Scale bars: (A,C,D,F) = 10 μm; (B,E) = 20 μm.
Microorganisms 11 01885 g002
Figure 3. Changes in the infectivity of C. gloeosporioides on walnut leaves after co-cultivation with B. velezensis for different durations. D2_W, D4_W, and D6_W represented the infection of C. gloeosporioides on walnut leaves cultured alone for 2, 4, and 6 days, respectively. D2_T, D4_T, and D6_T represent the infection of walnut leaves by C. gloeosporioides after co-culturing with B. velezensis for 2, 4, and 6 days, respectively. 8d, 10d and 12d represent the infection results of leaves on the 8th, 10th, and 12th day, respectively. Each treatment and control had three replicates.
Microorganisms 11 01885 g003
Figure 4. Lesion area and inhibition rate. (A) Lesion areas of leaves in three control and three treatment groups measured on the 12th day after infection; (B) Inhibition rate results calculated from the lesion areas measured on the 12th day. Data were analyzed using a one-way ANOVA test for comparison between groups, revealing a statistically significant difference between the groups (p < 0.05). Bars above columns represent standard errors. Different letters indicate significant differences between the treatments (p < 0.05).
Microorganisms 11 01885 g004
Figure 5. Changes of disease spots in walnut leaves from the 7th to the 15th day after control with different concentrations of fermentation broth. Note: Seven concentration gradients of B. velezensis spray were used: 1, 10, 50, 100, 300, 600, and 1200 times. The treatment groups were labeled T_1, T_10, T_50, T_100, T_300, T_600, and T_1200, with CK as the control. The vertical sequence represents the co-cultivation time: 7th, 9th, 11th, 13th, and 15th day. Each treatment and control had three replicates.
Microorganisms 11 01885 g005
Figure 6. The effect of spraying B. velezensis fermentation broth at different concentrations on the size of disease spots on walnut leaves. (A) The lesion area of walnut leaves in different treatment groups at different time points. The data were from five sampling times and eight treatments. The values on the figure were the average of three replicates; (B) The data are the mean values of different concentration treatment groups at five time points, different letters in panel (B) denote significant differences between treatments based on repeated-measures ANOVA (p < 0.05). Seven concentration gradients of B. velezensis spray were used: 1, 10, 50, 100, 300, 600, and 1200 times. The treatment groups were labeled T_1, T_10, T_50, T_100, T_300, T_600, and T_1200, with CK as the control. The vertical sequence represents the co-cultivation time: 7th, 9th, 11th, 13th, and 15th day. Each treatment and control had three replicates.
Microorganisms 11 01885 g006
Figure 7. Impact of treatment frequency on the lesion area of walnut leaves. Note: B. velezensis spray frequency was set at five gradients: T1, T2, T3, T4, and T5, representing spraying every 1 day, 2 days, 3 days, 4 days, and 5 days, respectively. The vertical sequence represents the co-cultivation time: 7th, 9th, 11th, 13th, and 15th day. Each treatment and control had three replicates.
Microorganisms 11 01885 g007
Figure 8. The effect of spraying B. velezensis fermentation broth at different frequencies on the size of disease spots on walnut leaves. (A) Lesion area of walnut leaves in different treatment groups at various time points and frequencies. Data were obtained from five samplings and six treatments. The values in the figure represent the average of three replicates; (B) The data display the mean values of different concentration treatment groups at 5 time points. In Panel (B), different letters indicate significant differences between treatments based on repeated measures analysis of variance (p < 0.05).
Microorganisms 11 01885 g008
Figure 9. Control effect of B. velezensis on C. gloeosporioides in walnut fruit. (AC) the control group; (DF) the treatment group; (A,D) photographed on the 14th day; (B,E) photographed on the 16th day; (C,F) photographed on the 18th day.
Microorganisms 11 01885 g009
Figure 10. Volcano plot of DEGs in compared groups. (A) D2_DvsD2_CK group; (B) D4_DvsD4_CK group; (C) D6_DvsD6_CK group. Note: D2_DvsD2_CK, D4_DvsD4_CK, and D6_DvsD6_CK groups represent the comparisons between B. velezensis cultured alone for 2, 4, and 6 days, respectively, and B. velezensis co-cultured (confrontation with C. gloeosporioides) for the same duration. DEGs were selected based on the criteria of p < 0.05 and |log2FoldChange| > 0. The X-axis (log2FoldChange) indicates the fold change in gene expression, and the Y-axis (−log10(p-value)) represents the significance level of gene expression differences among the groups. Red dots indicate upregulated genes, green dots indicate downregulated genes, and blue dots represent genes with no significant expression changes.
Microorganisms 11 01885 g010
Figure 11. Histogram of GO functional enrichment analysis and bubble chart of KEGG pathway enrichment analysis of DEGs in compared groups. Note: (AD) Histogram of GO functional enrichment analysis of DEGs in compared groups; (A) Functional classification of overall DEGs; (B) D2_DvsD2_CK group; (C) D4_DvsD4_CK group; (D) D6_DvsD6_CK group. In graphs (AD), the x-axis represents GO Terms, and the y-axis represents the significance level of GO Term enrichment, represented as −log10(padj). Different colors denote distinct functional categories: red for biological processes, green for cellular components, and blue for molecular functions. (EG) Bubble chart of KEGG pathway enrichment analysis of DEGs in compared groups; (E) D2_DvsD2_CK group; (F) D4_DvsD4_CK group; (G) D6_DvsD6_CK group. The bubble chart shows the top 20 significantly enriched KEGG pathways. The x-axis represents the ratio of differentially expressed genes annotated to each pathway to the total differentially expressed genes. The y-axis represents the KEGG pathways, with bubble size indicating the number of annotated genes. Larger circles denote more enriched differentially expressed genes. The color gradient (red to purple) represents the enrichment significance.
Microorganisms 11 01885 g011
Figure 12. PPI network diagram results. (A,B) D2 Dvs D2 CK group; (C,D) D4 DvsD4 CK group; (E,F) D6 DvsD6 CK group.
Microorganisms 11 01885 g012
Figure 13. Histogram of relative expression of DEGs by qRT-PCR and transcriptome analysis. (A) D2 DvsD2 CK group; (B) D2_DvsD2 CK group; (C) D2 DvsD2 CK group.
Microorganisms 11 01885 g013
Disclaimer/Publisher’s Note: The statements, opinions and data contained in all publications are solely those of the individual author(s) and contributor(s) and not of MDPI and/or the editor(s). MDPI and/or the editor(s) disclaim responsibility for any injury to people or property resulting from any ideas, methods, instructions or products referred to in the content.