Abstract
Recently, an association between dysbiosis of the gut microbiota (GMB) and the development of several diseases, such as Alzheimer’s disease (AD), has been proposed. Dysbiosis involves changes in microbial diversity influenced by environmental factors, like diet or lifestyle. In this study, we investigated the role of GMB parameters in Spanish AD patients, assessing the impact of adherence to the Mediterranean lifestyle (ML), as well as to characterize these parameters in relation to neuropsychological, neuropsychiatric, emotional, and functionality parameters. A case–control study was conducted to investigate the association between the composition of the GMB and cognitive, emotional, neuropsychiatric, and functionality status in Spanish AD patients, along with a shotgun metagenomics approach. Richness and alpha-diversity were significantly lower in the AD group compared to the controls. PERMANOVA and ANOSIM tests of Bray–Curtis dissimilarity, Aitchison distance, and Jaccard similarity did not showed significant differences in beta-diversity between the two groups. Moreover, associations between various phyla of the AD group and orientation performance, food consumption, and activities of daily living were identified. Dysbiosis observed in Spanish AD patients is characterized by reductions in richness and alpha-diversity, alongside alterations in GMB composition, which may be linked to adherence to the ML and cognitive and functionality symptoms.
1. Introduction
The World Health Organization (WHO) defines Alzheimer’s disease (AD) as a neurodegenerative disorder characterized by a progressive impairment of cognitive function [1]. Currently, the etiological mechanism of AD has not yet been fully elucidated. However, studies report evidence of a specific neuropathological profile [2] formed by the deposition in extracellular plaques of amyloid-β (Aβ) protein and intraneuronal neurofibrillary tangles of tau protein (NFTs) [3]. AD accounts for around 50% to 75% of the total number of cases of dementia [4]. Increasing life expectancy is leading to an aging population, increasing the prevalence of very serious age-related pathologies such as AD among the elderly. In Europe, the prevalence of AD is 0.97% among people aged 65–74 years, 7.66% among people aged 75–84 years, and 22.53% among people over 85 years old [5].
Recent studies have elucidated the crucial role of gut microbiota (GMB) in the pathogenesis of various diseases [6]. GMB are the microorganisms (bacteria, archaea, fungi, and viruses) inhabiting the digestive tract, being the major location of microbes in the human body (10 to 100 trillion) [7]. Emerging evidence suggests that GMB may significantly contribute to dementia pathogenesis [7,8,9] by modulating host-brain function via a recently discovered microbiota–gut–brain axis [10]. Regarding specifically the pathogenesis of AD, intestinal dysbiosis (an alteration in the normal commensal intestinal microbiome with an increase in pathogenic microbes) may lead to an increase in the permeability of the gut and blood–brain barriers, triggering the activation of immune responses and leading to an increased level of oxidative stress. This process facilitates the development of characteristic features of AD, including Aβ aggregation, oxidative stress, neuroinflammation, and insulin resistance [11]. A recent systematic review and meta-analysis showed a significant reduction in species diversity richness within the human AD gut microbiome [12]. This study revealed region-specific variations in the abundance of Bacteroides, which is among the most abundant groups of bacteria found in the human intestine, with higher levels observed in US cohorts compared to Chinese cohorts [12]. These inter-study disparities underscore the impact of diverse environmental factors on GMB composition, including aspects like ethnicity, demographics, lifestyle, and diet [13]. Notwithstanding, the existence of a distinctive GMB composition characteristic of AD remains to be determined, as well as whether the observed GMB alterations act as precursors, contributing to the initiation or progression of the disease, or if they are the result of its pathological processes.
Most risk factors associated with a higher susceptibility to AD, including age, gender, genetics, and family history, cannot be changed or eliminated. However, epidemiologic research has revealed the existence of potential modifiable risk—and protective factors—for AD and related dementias. Recently, The Lancet Commission on Dementia Prevention, Intervention and Care suggested that tackling modifiable risk factors such as low educational attainment in early life, mid-life hypertension, mid-life obesity, hearing loss, traumatic brain injury, excessive alcohol consumption, smoking, depression, physical inactivity, social isolation, diabetes mellitus, and air pollution could potentially prevent or delay up to 40% of dementia cases [14]. Most of these factors have been linked to GMB alterations [15], and several GMB-modulation strategies, such as diet and lifestyle choices, could currently serve as a crucial foundation for developing strategies to prevent or treat AD [12]. In fact, both are strongly related to GMB, being potentially modifiable [16]. One of the main factors influencing GMB throughout life is the diet [17]. In relation to this, the Mediterranean diet (MD) is a prime example of how healthy dietary patterns can be beneficial for gut health [18]. The MD, which is characterized by its richness in plant-based foods, healthy fats, ingestion of minimally processed foods, important consumption of fish, moderate intake of dairy products, and moderate consumption of wine, has been associated with reduced AD hallmarks (Aβ and NFTs) [19] and AD risk [20]. Indeed, the significance of the MD might transcend into a broader Mediterranean lifestyle (ML), which encompasses additional healthy lifestyle behaviors such as sociability, sleep, rest, and conviviality [21], all of which have also been related to the maintenance of a healthy aging brain [22]. These factors have also demonstrated the capacity to influence the composition and functionality of the GMB [23].
To the best of our knowledge, the GMB composition related to AD has not been previously investigated considering the particularities of the ML, especially in relation to the MD. In the present study, we hypothesized that AD patients with adherence to the ML will present differences in the studied microbiological parameters (richness, alpha-diversity, and beta-diversity) in comparison from those described in other countries with different diets and lifestyles. A case–control study was hereby performed to investigate the association between the composition of the GMB of the selected population, employing a shotgun metagenomics approach with neuropsychological, neuropsychiatric, and functionality tests.
2. Materials and Methods
2.1. Study Design
The current investigation has complied with the Declaration of Helsinki, and it was approved by the Ethics Research Committee (CEIm) of the Pere Virgili Institute for Health Research (IISPV, Ref. CEIM: 183/2020). This study is also included on the ClinicalTrials.gov website (ID: NCT05943925). Informed consent was obtained from all patients and their families before participating in the study.
2.2. Participants
Twenty-five AD patients and twenty-five age- and sex-matched healthy controls (HCs) were enrolled by recruiting centers from Tarragona County (Catalonia, Spain) from May 2021 to December 2022. This sample size was expected to be enough to detect differences in gut microbiota with sequencing techniques [9]. The participant centers included Verge de la Cinta Hospital, Xarxa Santa Tecla Hospital, Joan XXIII Hospital, and Lerín Neurocognitive Institute. Inclusion criteria for the AD group were as follows (CCs): (1) AD diagnosed by neurology service following NIA-AA 2011 criteria, (2) aged between 60 and 85 years old, and (3) Global Deterioration Scale Fast (GDS-FAST) of 4 or 5 [24]. Inclusion criteria for the control group were the following: (1) healthy individuals, and (2) between 60 and 85 years old. Exclusion criteria for both groups were the following: (1) diagnosis of or comorbidity with other neurological diseases, (2) use of antibiotics or corticosteroids in the previous 6 months before enrolling in the study, (3) immunosuppressor or immunostimulant treatment in the previous 6 months before providing the stool sample, (4) illnesses of the GI tract, (5) consuming large doses of commercial probiotics (greater than or equal to 108 cfu per organisms per day), and (6) illiteracy.
The recruitment centers selected potential candidates among their regular patients. Those candidates and their families who agreed to participate in the study signed their informed consent, being provided with the stool collection kit, and were scheduled for assessments within a maximum period of one week (see below).
2.3. Fecal Sample Collection and DNA Isolation
Fecal samples were collected at home with the Stool Nucleic Acid Collection and Preservation System kit (Norgen Biotek Corporation, Thorold, ON, Canada) three days before the interview. Participants stored the collection kits at room temperature—or in the refrigerator—and brought them on the day of the interview. Aliquots (~500 mg) were placed into Eppendorf tubes, frozen, and stored at −80 °C. One aliquot per participant was analyzed by the Centre for Omic Sciences (COS, Reus, Spain). DNA was extracted using the Fast Stool DNA Mini Kit (Qiagen, Germany) with a previous lysis of the sample (200 ± 30 mg) in 100–200 μL nuclease-free water at 95 °C, according to the kit instructions. The final DNA concentration and purification were determined by a Qubit 4.0 fluorometer and Qubit dsDNA HS Assay Kit (Thermo Fisher Scientific, Waltham, MA, USA).
2.4. Shotgun Metagenomics and Quality Control
Gut microbiome was analyzed by COS using a shotgun metagenomic approach. DNA was extracted from samples using the DNA Prep with Tagmentation kit according to the manufacturer’s protocol (Illumina, San Diego, CA, USA, catalog no. 20018705). Sequencing library concentration was determined by Qubit 4.0 fluorometer and Qubit dsDNA HS Assay Kit (Thermo Fisher Scientific, Waltham, MA, USA). In addition, sequencing library length was checked by Agilent TapeStation and Agilent High Sensitivity DNA kit (Agilent Technologies, Santa Clara, CA, USA). Sequencing libraries with concentration below 750 pM and any length out of 400–600 bp range were discarded. Final sequencing libraries were mixed at 750 bp and sequenced using the NextSeq 2000 sequencing system (Illumina, San Diego, CA, USA) as 2 × 150 bp paired-end reads. Samples below 7.5 million reads were discarded. Shotgun metagenomic reads were profiled for microbial species relative abundances by mapping them to several databases with Kraken2 [24]. Unidentified reads were discarded.
2.5. Exploratory Assessment
All participants were interviewed for approximately 1.5 h at the recruiting centers. During the interview, the following parameters were recorded: (1) demographic characteristics, such as age, laterality, sex, nationality, profession, years of education, civil status, and cohabitants at home; (2) the presence of risk factors, such as family history of AD, deafness, hypertension, dyslipidemia, diabetes mellitus, obesity, stroke, toxics exposure, smoking habits, and alcohol consumption; and (3) use of medication and/or supplements. Additionally, patients and their families also completed the Mediterranean Style Index test (MEDLIFE), a 28-item self-report diet questionnaire about how the patient follows the MD and Mediterranean habits [21].
2.6. Cognitive Functions and Emotional, Neuropsychiatric, and Functionality Assessment
Cognitive functions were evaluated by trained researchers. They included the following tests in order of administration: (1) cognitive area, which includes Temporary, Spatial and Personal Orientation from the Barcelona Test II (TO-BTII) [25], a comprehensive neuropsychological battery used to evaluate cognitive functions, which is widely used in Spanish-speaking populations, Mini Mental State Examination (MMSE) [26], Memory Impairment Screen (MIS) [27], Digit Span from the Barcelona Test II (DS) [25], Free and Cued Selective Reminding Test (FCSRT) [28], Trail Making Test A (TMT A) and B (TMT B) [29], Clock Drawing Test with Cacho et al. [30] correction (CDT) [31], the Copy of Simple and Semi-complex Construction Praxis subtest of the Barcelona Test II (CCPS-BTII) [25], Frontal Assessment Battery (FAB) [32], Cognitive Reserve Scale (CRS) [33], the C-form shortened version of the Boston Naming Test [34,35], and Categorial Evocation Fluency from the Barcelona Test II (CEF) [25]; (2) emotional area, which includes the Goldberg Anxiety and Depression Scale (GOLDBERG) [36] and the Life Events Questionnaire, adapted from the PREDIMED-PLUS study (LEQ) [37]; (3) neuropsychiatric area, which includes the neuropsychiatric symptomatology test from the BTII (NPBTII2 and NPEBTII) [25]; and (4) functionality, which includes The Daily Life Activities test from the BTII (ADL) [25]. A detailed description of the tests can be found in Supplementary Table S1.
2.7. Statistical Analysis
The statistical analysis was performed using the RStudio program. Continuous and categorical variables are expressed as mean and standard deviation, or as frequency and proportion (percentage), respectively. Normality and homogeneity were analyzed with Shapiro–Wilk and Levene tests. In turn, variables were compared between AD and HC using a two-sample t-test for normally distributed measures, or the Mann–Whitney U test for non-normally distributed measures. Relative abundance comparisons at the phylum, order, class, family, genus, and species levels were performed on normalized data employing non-parametric tests to detect differentially abundant features between the AD and HC groups. Richness (Chao1) and alpha-diversity (Shannon Index) metrics were calculated at the OTU level by performing rarefaction with 10 iterations of random subsampling to 1.788 reads (the lowest single-participant number of sequences) from each participant. In turn, independent two-sample t-tests for normally distributed measures or Mann–Whitney U tests for non-normally distributed measures in R were used. Beta-diversity metrics were computed using normalized OTU-level data in R, and included Bray–Curtis dissimilarity, Aitchison distance, and Jaccard similarity. To detect statistically significant differences in beta-diversity metrics between groups, a permutational multivariate analysis of variance (PERMANOVA) and analysis of similarity (ANOSIM) in the vegan package were used. The associations between GMB and cognitive, emotional, neuropsychiatric and functionality tests, as well as lifestyle factors for the AD group, were assessed using linear models with the Maaslin2 package. These associations included both richness and alpha-diversity, and relative abundance values at the phylum level. The default parameters of Maaslin2 were employed, with the addition of a minimum detection value and prevalence (0.2/100 and 50/100, respectively), in order to obtain more robust results. Significance for all tests was set at p-value < 0.05. To minimize false positives, a false discovery rate (FDR) correction (q-value < 0.1) was applied using the Benjamani–Hochberg method [38].
3. Results
3.1. Cohort Characteristics
Fifty participants met the eligibility criteria. They were classified as 25 individuals in the HC group and 25 individuals in the AD group. None of the groups differed in age, sex, or years of education (Table 1). The AD group did not show significant differences in Body Mass Index (BMI), smoking habits, alcohol consumption, or adherence to the MD compared to the HC group.

Table 1.
Cohort characteristics by group.
3.2. Cognitive Functions and Emotional, Neuropsychiatric, and Functionality Assessment
The cognitive functions and emotional, neuropsychiatric, and functional characteristics of the participants in the current study are shown in Table 2 and Table 3. Overall, the AD group exhibited significantly lower scores in the cognitive area, specifically in orientation, memory, attention, working memory, construction praxis, naming, fluency, and executive functions, compared to the HC group. These results indicate poorer performance in these areas by the AD group. In addition, significant differences were detected—compared to the HC group—in neuropsychiatric symptoms assessed by the NPBTII and NPEBTII tests, as well as in functionality, basic and instrumental activities of daily life, assessed using ADL test. Higher scores in these assessments correspond to greater impairment. Finally, no significant differences were observed between the two groups related to lifestyle, assessed with the LEQ test, or in the emotional area, assessed with the Goldberg Scale.
Table 2.
Cognitive and emotional characteristics by group.
Table 3.
Neuropsychological and functionality characteristics by group.
3.3. Alpha- and Beta-Diversity
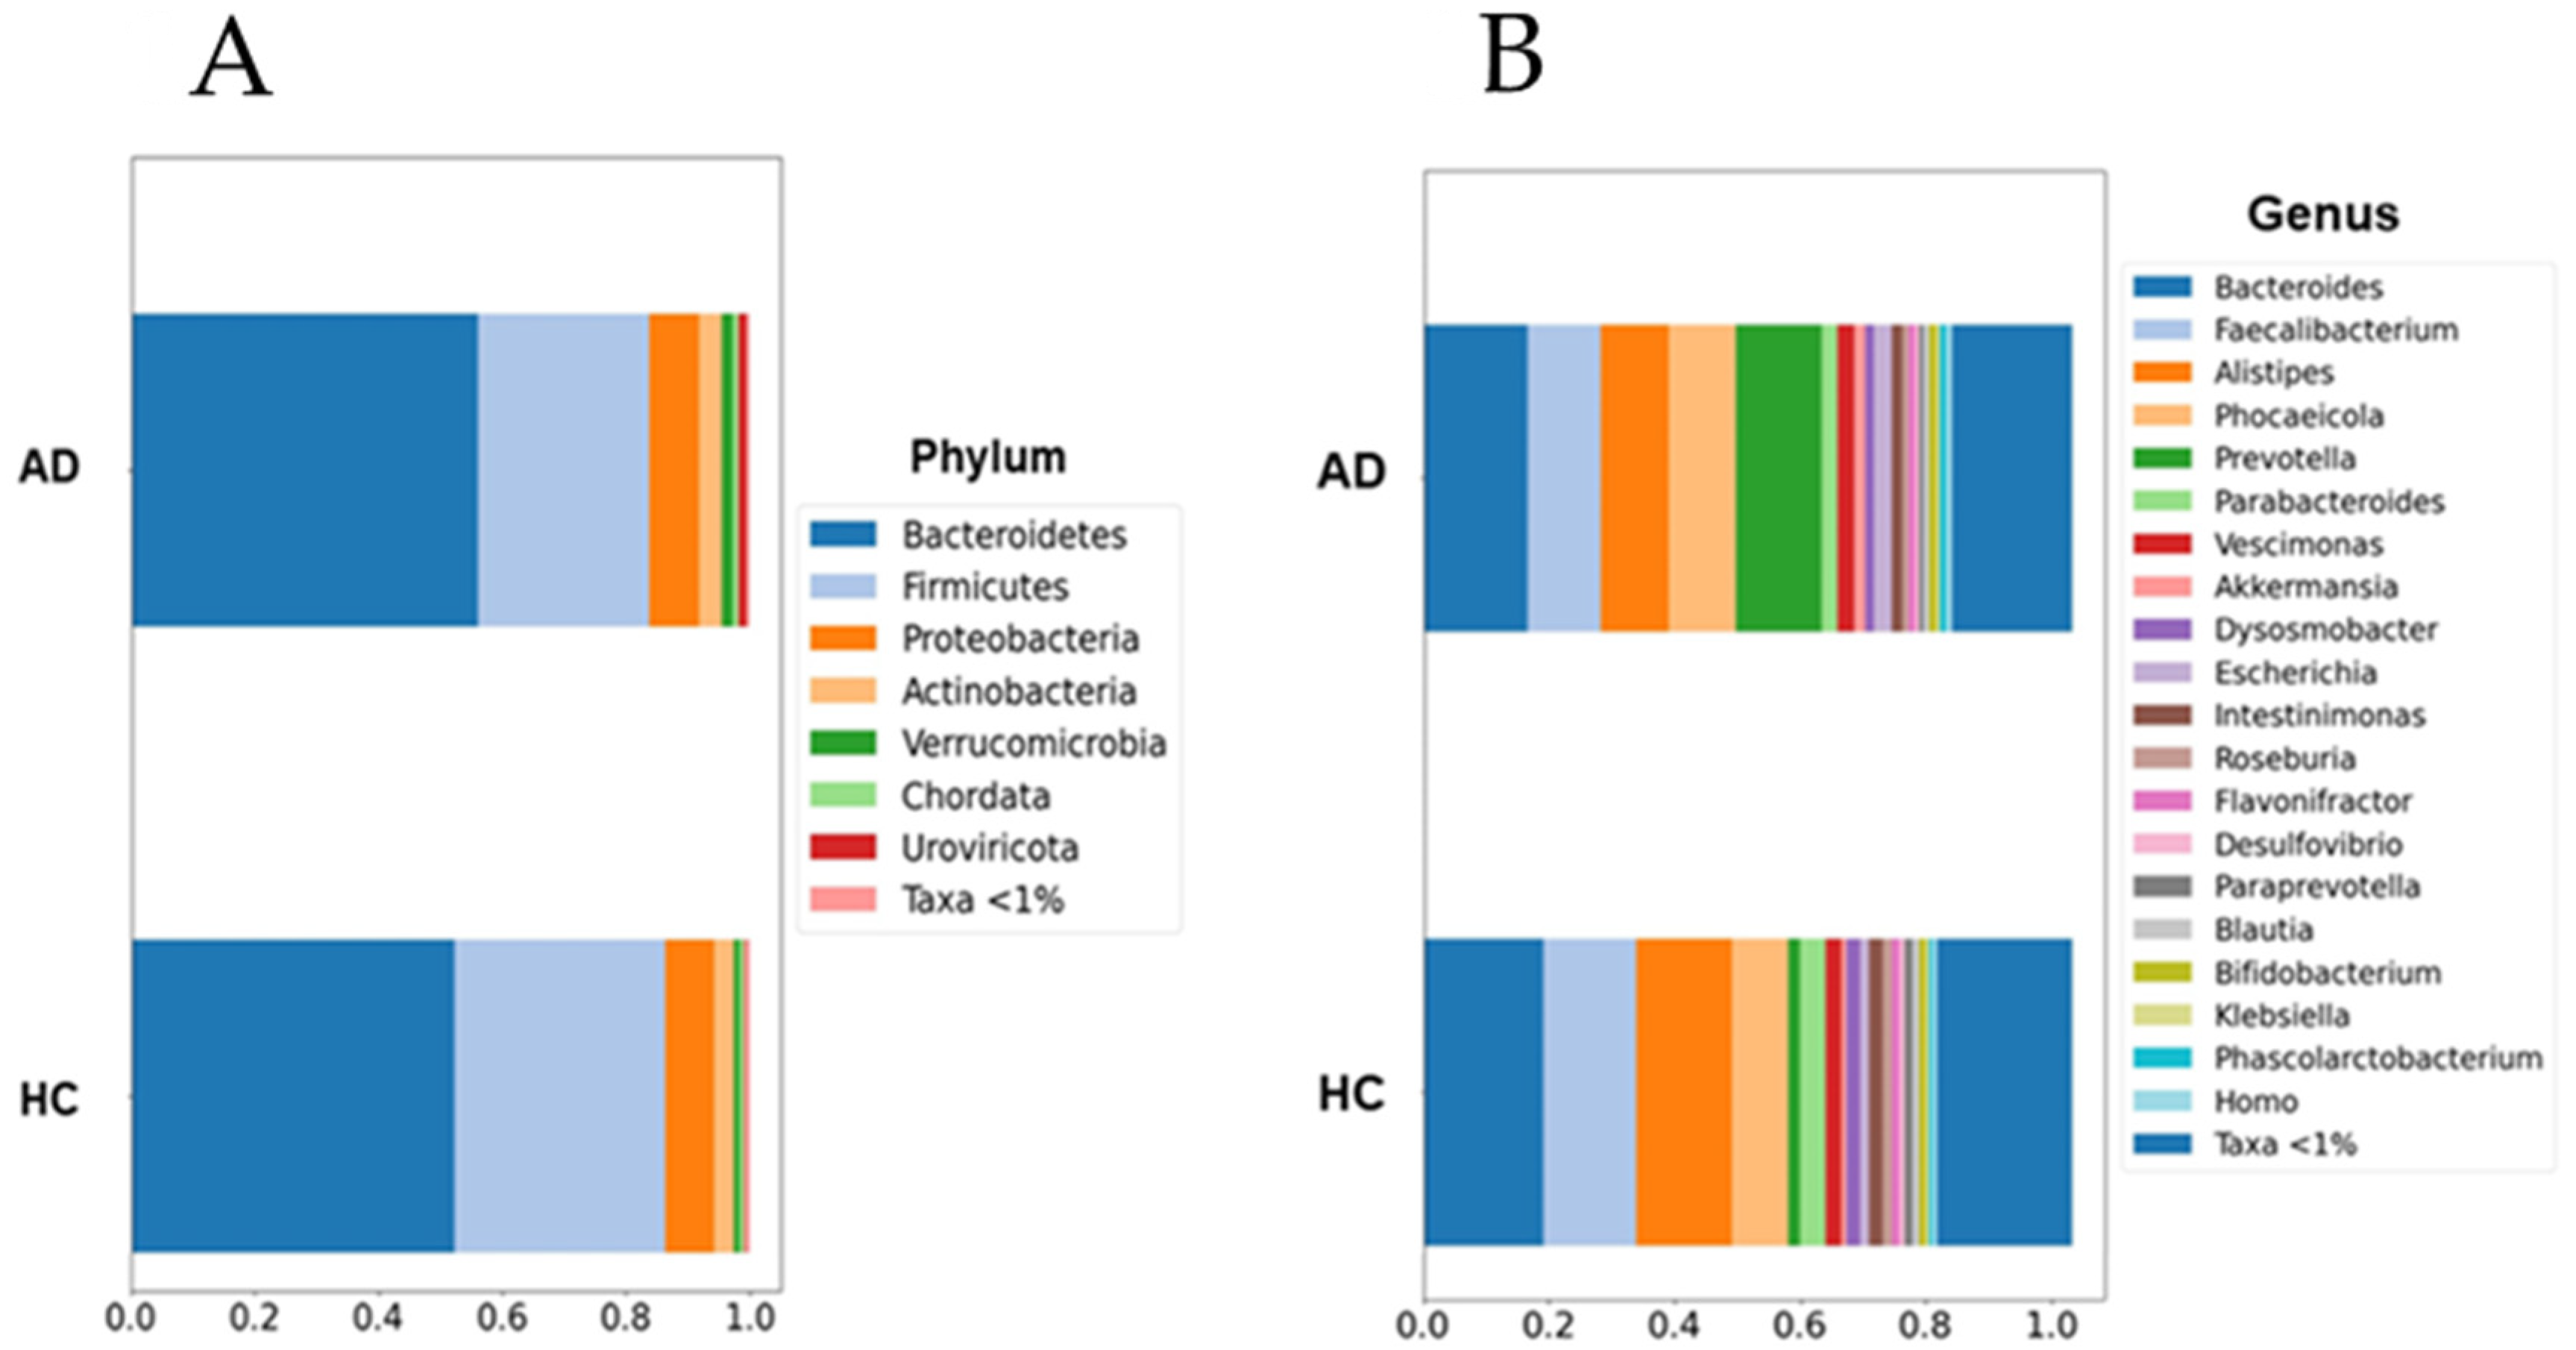
Although the current results suggest an increase in the abundance of the Prevotella and Escherichia genera within the AD group, this increase was not statistically significant when multiple non-parametric pairwise test were conducted (Figure 1). No significant differences were found across any of the other taxonomic ranks. However, richness (Chao1, p = 0.003) and alpha-diversity (Shannon Index, p < 0.001) were significantly lower in the AD group compared to the HC group (Figure 2). Furthermore, the PERMANOVA and ANOSIM tests of Bray–Curtis dissimilarity, Aitchison distance, and Jaccard distance did not show significant differences in beta-diversity between the two groups.

Figure 1.
Barplots of microbial abundances at the phylum (A) and genus (B) levels. No significant differences were detected between groups. AD: Alzheimer’s disease; HC: healthy controls. Data are presented as percentages (0 to 1) of the mean relative abundances for each group.
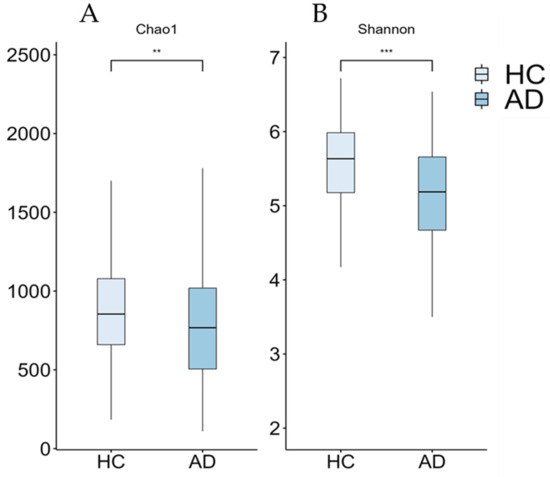
Figure 2.
Boxplots of alpha-diversity measures (Chao1 (A) and Shannon (B) indices) from our cohort. Significant differences between groups are indicated by asterisks (** ≤0.01, *** ≤0.001). AD: Alzheimer’s disease; HC: healthy controls.
3.4. Diversity Measures and AD Cognitive Assessment
There were no associations between richness or alpha-diversity measures and cognitive functions.
3.5. Bacterial Phylum Abundance and AD Cognitive Assessment
The correlation between bacterial abundance at the phylum level and Mediterranean lifestyle, as well as the cognitive and functionality tests, is presented in Table 4 and Table 5. Only AD patients following the methodology applied in a previous study by Nuzum, Szymlek-Gay [39] were included. The linear models derived from Maaslin2 unveiled associations of 28 distinct phyla with orientation, activities of daily life (both basic and instrumental), and adherence to the MD, particularly in relation to food consumption.
Table 4.
Association between Mediterranean lifestyle and relative microbial abundance in Alzheimer’s disease group.
Table 5.
Association between cognitive assessment and relative microbial abundance in Alzheimer’s disease group.
4. Discussion
4.1. Cognitive Alterations
The cognitive decline that defines AD has been extensively studied for many years. This deterioration has been observed not only at the cognitive level, but also in the emotional, neuropsychiatric, and functional domains of patients affected by the disease [40,41,42]. If we focus on the cognitive domain, the AD patients of the present investigation exhibited deficiencies in orientation, memory, attention, working memory, construction praxis, naming, fluency, and executive functions compared to the HC group. These results are consistent with findings previously reported by other authors [41,43]. Furthermore, the AD group scored higher on tests on neuropsychiatric symptoms. This aligns with the scientific literature, indicating that AD patients tend to show more neuropsychiatric symptoms, including anxiety, depression, agitation, apathy, or sleep disturbances, due to the proliferation of amyloid plaques and phosphorylated tau protein, and the reduction in the hippocampal volume [42,44,45]. Regarding the assessment of functionality, the higher scores obtained by patients in the AD group indicate a higher degree of dependence in basic and instrumental activities of daily life. These findings were expected, considering that our patients were recruited with GDS4-5 scores, at a stage at which they required assistance from family members—or caregiving services—to adequately perform some of these tasks [46].
Finally, no significant differences between groups were found in relation to the emotional domain. Several studies have reported clear differences in this area [47,48]. These changes result from structural alterations in the brain, cognitive decline itself, and associated metabolic disruptions [49,50]. Anxiety is more prevalent in the early stages of AD, while depression becomes a more prominent feature in the later stages of the disease [41]. In the present study, emotionality was assessed using the Goldberg Scale [36] by asking the patients themselves. Additionally, the Neuropsychiatric Symptomatology from Barcelona Test II (NPBTII) [25] asked family members—or caregivers—about symptoms, and two of the items in this test asked about the patient’s anxiety and depression. The lack of significant differences observed in the Goldberg Scale could be attributed to the loss of insight often experienced by AD patients. As the disease progresses, many patients struggle to accurately assess their own emotional state, which can lead to a discrepancy between their self-reported answers and their actual condition. This limitation introduces a potential bias in the results, considering that the patients’ responses may not reflect their true emotional state, or being aligned with the observations made by their relatives or caregivers [51].
4.2. Alpha- and Beta-Diversity Differences among Groups
Regarding alpha-diversity indices, reductions in Chao1 and Shannon indices were observed in the AD group. The loss of alpha-diversity in AD patients is a consistent finding in most previous studies [9]. Table 6 summarizes the studies reviewed on the microbiota of AD and MCI patients compared with the current results. Vogt and Kerby [9] reported this phenomenon in the American population, obtaining the same reduction in the mentioned indices, as well as in Simpson and Inverse Simpson indices. Additionally, studies conducted in the Asian population showed the same trend [52,53,54]. Controversially, Saji and Miida [8] reported an increase in the Shannon Index and Simpson Index in Japanese AD patients, attributed to differences in diet and lifestyle.
The reduction in alpha-diversity has also been reported in other clinical conditions that are considered risk factors for the development of AD, such as obesity or diabetes [55,56]. Changes in microbial diversity may promote—through the gut–brain axis—the onset of inflammatory processes characteristic of these diseases [11].
However, alpha-diversity values vary among studies and diseases, leading some authors to question their utility to establish reliable diagnoses. The systematic review conducted by Plassais and Gbikpi-Benissan [57] highlighted this heterogeneity of results in studies involving Parkinson’s disease and Multiple Sclerosis patients. These authors did not find associations between richness and alpha-diversity values and the development of these neurodegenerative diseases (Parkinson’s disease and Multiple Sclerosis). Some limitations of that review included geographical differences in the analyzed populations, as well as variability in the alpha-diversity indices used in different studies. Nevertheless, their conclusions point to the need for standardizing analysis methods and accurately describing whether these indices are useful for diagnosing these diseases.
Table 6.
Summary of Alzheimer’s disease studies with their most relevant goals compared with our results.
Table 6.
Summary of Alzheimer’s disease studies with their most relevant goals compared with our results.
| Reference | Number of Samples | Methods | Country | Results |
|---|---|---|---|---|
| This study | 25 AD 25 HC | Shotgun metagenomics | Spain | ↓ alpha-diversity (Chao1 and Shannon indices) Distinct microbial communities of AD compared with HC |
| Vogt et al., 2017 [9] | 25 AD 25 HC | 16S rRNA | United States | ↓ alpha-diversity (Chao1, Shannon, Simpson, and Inverse Simpson indices) ↓ Firmicutes and Bifidobacterium ↑ Bacteroidetes |
| Haran et al., 2019 [54] | 108 elders | Shotgun metagenomics | United States | ↓ butyrate-producing taxa ↑ proinflammatory taxa |
| Saji, Niida et al., 2019 [8] | 34 AD 94 HC | t-RFLP | Japan | ↑ alpha-diversity (Shannon and Simpson indices) ↓ Bacteroides |
| Ueda et al., 2019 [50] | 7 AD 15 MCI 21 HC | 16S rRNA Shotgun metagenomics | Japan | ↓ F. prausnitzii in MCI Abundances of this bacteria correlated with worse cognitive function |
| Guo et al., 2021 [48] | 18 AD 20 MCI 18 HC | 16S rRNA | China | Distinct microbial communities of AD compared with MCI and HC ↓ Bacteroides, Lachnospira, and Ruminiclostridium ↑ Prevotella Abundances correlated with worse cognitive function. |
| Liu et al., 2019 [49] | 33 AD 32 MCI 32 HC | 16S rRNA | China | Distinct microbial communities of AD compared with MCI and HC |
| Duan et al., 2021 [57] | 18 MCI | 16S rRNA | China | ↓ Firmicutes ↑ Bacteroidetes |
| Pan et al., 2021 [55] | 22 MCI 26 HC | 16S rRNA | China | Distinct microbial communities of MCI compared with HC |
↓: Decreases. ↑: Increases.
In the case of beta-diversity measures, no differences were observed between the AD group and the HC group. This lack of differences in the composition of the GMB differs from those described in AD [58]. Guo and Peng [52] emphasized beta-diversity changes in patients with AD and mild cognitive impairment (MCI), a prodromal state of the disease. Specifically, Pan and Li [59] were able to discriminate MCI patients and HC individuals into clusters, but they did not find differences in alpha-diversity measures. Therefore, changes in the community structures of the GMB may play a more relevant role than mere overall diversity loss.
Finally, no relationships were found between the different diversity indices and the studied variables. Some authors have emphasized that changes in the composition of the GMB are related to the concentrations of Aβ and Tau proteins, but not with neurodegeneration biomarkers [60]. This could indicate that although neurodegeneration does not occur as a direct consequence of changes in the GMB, these changes do play a role in the development of AD. Further studies, possibly involving early-stage AD or MCI patients, are clearly necessary to determine the effect of changes in the GMB on the development of AD.
4.3. Relation between Microbial Phylum Abundance and AD Cognitive Assessment
In the present study, differences in phylum-level abundance between the AD group and the HC group were investigated, but no significant results were obtained. Despite this, we have observed some trends similar to those described in previous studies, such as a reduction in Firmicutes and Bacteroides and an increase in Bacteroidetes [60]. The decrease in Firmicutes and Bifidobacterium and the increase in Bacteroidetes have been reported in both American and Chinese AD patients [9,61]. Additionally, the same changes have been observed in conditions considered risk factors for AD, such as diabetes and obesity [55,56]. Bacteroidetes has been associated with inflammatory processes, while Firmicutes and Bifidobacterium tend to be associated with anti-inflammatory processes, highlighting the importance of these processes in the development of AD [9,62]. In the current investigation, the abundance of Bifidobacterium remained stable in both groups. Interestingly, in a study conducted in Japanese AD patients, a reduction in Bacteroides was found [8]. The same research group emphasized the role of Bacteroides as a protective agent against cognitive deficits [63]. This genus belongs to the Bacteroidetes, but it is known for its anti-inflammatory properties. Our sample shows a slight decrease in Bacteroides, without reaching statistical significance. The discrepancies between the results could be explained by differences in diet and lifestyle across different regions/countries. The dietary pattern of the Western diet is characterized by a high consumption of saturated fats and carbohydrates, unlike the MD, which is characterized by an abundance of plant-based foods and healthy fats [64,65].
Other observations included the non-significant increase in Escherichia in the AD group. Cattaneo and Cattane [62] described a significant increase in this genus, highlighting that its higher abundance favored the development of inflammatory processes in Italian AD patients. Similar results were also obtained in Thai AD patients [66]. Moreover, fragments of E. coli were found in the brains of AD patients, co-localizing with amyloid plaques, suggesting that it could be promoting amyloidosis through an inflammatory state [67].
Furthermore, linear models conducted in RStudio resulted in associations of different phyla with three groups of variables: orientation, adherence to the MD (specifically in food consumption), and activities of daily life (see Table 7). In the case of adherence to the MD, a negative correlation was found with Proteobacteria levels. This Gram-negative bacterial phylum has been associated with various inflammatory diseases. Thus, the higher adherence to the MD would be acting as a protective factor against these inflammatory processes [65,68]. On the other hand, we found non-significant low levels of Firmicutes in AD patients, positively correlated with reductions in instrumental activities of daily life. The reduction in Firmicutes has been reported in AD studies [9,61]. Controversially, in a study with PD, elevated levels of Firmicutes were found, associated with indicators of inflammation and immune system dysregulation [69]. Therefore, their role in AD requires further investigations.
Table 7.
Summary of the significant associations observed in the present study between microbial phyla, adherence to the Mediterranean lifestyle, and neurocognitive outcomes.
4.4. Strengths and Limitations
The strengths of the present study include the combination of a metagenomic methodology along with a comprehensive neuropsychological battery of tests, which allow a thorough characterization of our patients, facilitating the identification of associations between symptomatology and changes in the microbiota. However, our study also has also several limitations. The number of patients was relatively low and confined to our geographic region. Consequently, caution must be exercised when extrapolating the current results. Characterizing dietary patterns would require more specific targeted tests in order to control their effects on intestinal microbial populations. Finally, to the best of our knowledge, there are no normative data available for the adult population regarding the MEDLIFE questionnaire. This lack of data makes it difficult to determine whether the sample is representative of the general Spanish population.
5. Conclusions
The current investigation has shown that richness and alpha-diversity are decreased in Spanish AD patients. Additionally, discrete relationships were found between various phyla and orientation, activities of daily life, and adherence to the MD. To the best of our knowledge, this is the first study aimed at proposing a multidisciplinary approach considering microbiological, psychological, and lifestyle parameters. Further investigations conducted in other countries with a Mediterranean lifestyle are required to confirm the results of the present study.
Supplementary Materials
The following supporting information can be downloaded at https://www.mdpi.com/article/10.3390/microorganisms12102046/s1, Table S1: Description of the tests/scales used in the study.
Author Contributions
Methodology: M.T., M.M., D.M. and L.H. Investigation: D.M., N.C., C.C., E.F.-F., M.P., J.Z., A.M., L.C. and J.M.G.-d.-E. Supervision: M.T. and M.M. Writing—original draft: D.M. and C.C. Formal analysis: D.M. and L.H. Writing—review and editing: M.T., M.M., N.C., C.C., E.F.-F., M.P., A.M., J.Z., L.C., J.M.G.-d.-E., P.V. and J.L.D. All authors have read and agreed to the published version of the manuscript.
Funding
This research was supported by the Spanish “Ministerio de Ciencia e Innovación and Agencia Estatal de Investigación” through the project DEM-BIOTA (PID2019-103888RB-I00) and the Agència de Gestió d’Ajuts Universitaris i de Recerca through the pre-doctoral grant (FI_B00314) funded by AGAUR.
Data Availability Statement
Dataset available on request from the authors.
Acknowledgments
This study is part of the DEM-BIOTA Project (PID2019-103888RB-I00). The authors thank the collaboration of the volunteers and healthcare staff from the participating hospitals. Without them, this type of study would not have been possible. We would also thank the Centre for Omic Sciences (COS), Mixed Unit of Rovira i Virgili University, and Eurecat, considered a Singular Scientific and Technical Infrastructure (ICTS), for the metagenomic analysis of the samples studied.
Conflicts of Interest
The authors declare no conflicts of interest.
References
- WHO. The ICD-10 Classification of Mental and Behavioural Disorders: Clinical Descriptions and Diagnostic Guidelines; World Health Organization: Geneva, Switzerland, 1992. [Google Scholar]
- Jack, C.R., Jr.; Bennett, D.A.; Blennow, K.; Carrillo, M.C.; Dunn, B.; Haeberlein, S.B.; Holtzman, D.M.; Jagust, W.; Jessen, F.; Karlawish, J.; et al. NIA-AA Research Framework: Toward a biological definition of Alzheimer’s disease. Alzheimer’s Dement 2018, 14, 535–562. [Google Scholar] [CrossRef]
- Duyckaerts, C.; Delatour, B.; Potier, M.-C. Classification and basic pathology of Alzheimer disease. Acta Neuropathol. 2009, 118, 5–36. [Google Scholar] [CrossRef]
- Prince, M.; Wimo, A.; Guerchet, M.; Ali, G.-C.; Wu, Y.-T.; Prina, M. World Alzheimer Report 2015. The Global Impact of Dementia: An analysis of Prevalence, Incidence, Cost and Trends; Alzheimer’s Disease International: London, UK, 2015. [Google Scholar]
- Niu, H.; Álvarez-Álvarez, I.; Guillén-Grima, F.; Aguinaga-Ontoso, I. Prevalence and incidence of Alzheimer’s disease in Europe: A meta-analysis. Neurologia 2017, 32, 523–532. [Google Scholar] [CrossRef]
- Valdes, A.M.; Walter, J.; Segal, E. Role of the gut microbiota in nutrition and health. Br. Med. J. 2018, 361, k2179. [Google Scholar] [CrossRef]
- Alkasir, R.; Li, J.; Li, X.D.; Jin, M.; Zhu, B.L. Human gut microbiota: The links with dementia development. Protein Cell 2017, 8, 90–102. [Google Scholar] [CrossRef]
- Saji, N.; Niida, S.; Murotani, K.; Hisada, T.; Tsuduki, T.; Sugimoto, T.; Kimura, A.; Toba, K.; Sakurai, T. Analysis of the relationship between the gut microbiome and dementia: A cross-sectional study conducted in Japan. Sci. Rep. 2019, 9, 1008. [Google Scholar] [CrossRef]
- Vogt, N.M.; Kerby, R.L.; Dill-McFarland, K.A.; Harding, S.J.; Merluzzi, A.P.; Johnson, S.C.; Carlsson, C.M.; Asthana, S.; Zetterberg, H.; Blennow, K.; et al. Gut microbiome alterations in Alzheimer’s disease. Sci. Rep. 2017, 7, 13537. [Google Scholar] [CrossRef]
- Solas, M.; Milagro, F.I.; Ramírez, M.J. Inflammation and gut-brain axis link obesity to cognitive dysfunction: Plausible pharmacological interventions. Curr. Opin. Pharmacol. 2017, 37, 87–92. [Google Scholar] [CrossRef]
- Liu, S.; Gao, J.; Zhu, M. Gut microbiota and dysbiosis in Alzheimer’s disease: Implications for pathogenesis and treatment. Mol. Neurobiol. 2020, 57, 5026–5043. [Google Scholar] [CrossRef]
- Jemimah, S.; Chabib, C.M.M.; Hadjileontiadis, L. Gut microbiome dysbiosis in Alzheimer’s disease and mild cognitive impairment: A systematic review and meta-analysis. PLoS ONE 2023, 18, 285346. [Google Scholar] [CrossRef]
- Tasnim, N.; Abulizi, N.; Pither, J. Linking the gut microbial ecosystem with the environment: Does gut health depend on where we live? Front. Microbiol. 2017, 8, 1935. [Google Scholar] [CrossRef]
- Livingston, G.; Huntley, J.; Sommerlad, A. Dementia prevention, intervention, and care: 2020 report of the Lancet Commission. Lancet 2020, 396, 413–446. [Google Scholar] [CrossRef]
- Cabrera, C.P.V.; Torrente, M. Modifiable risk factors for dementia: The role of gut microbiota. Curr. Alzheimer Res. 2021, 18, 993–1009. [Google Scholar] [CrossRef]
- Ellouze, I.; Sheffler, J.; Nagpal, R. Dietary patterns and Alzheimer’s disease: An updated review linking nutrition to neuroscience. Nutrients 2023, 15, 3204. [Google Scholar] [CrossRef]
- Rinninella, E.; Tohumcu, E.; Raoul, P. The role of diet in shaping human gut microbiota. Best Pract. Res. Clin. Gastroenterol. 2023, 62, 101828. [Google Scholar] [CrossRef]
- Barber, T.M.; Kabisch, S.; Pfeiffer, A.F. The Effects of the Mediterranean Diet on Health and Gut Microbiota. Nutrients 2023, 15, 2150. [Google Scholar] [CrossRef]
- Agarwal, P.; Leurgans, S.E.; Agrawal, S. Association of Mediterranean-DASH Intervention for Neurodegenerative Delay and Mediterranean diets with Alzheimer disease pathology. Neurology 2023, 100, 2259–2268. [Google Scholar] [CrossRef]
- Van den Brink, A.C.; Brouwer-Brolsma, E.M.; Berendsen, A.A.M.; van de Rest, O. The Mediterranean, Dietary Approaches to Stop Hypertension (DASH), and Mediterranean-DASH Intervention for Neurodegenerative Delay (MIND) Diets Are Associated with Less Cognitive Decline and a Lower Risk of Alzheimer’s Disease—A Review. Adv. Nutr. 2019, 10, 1040–1065. [Google Scholar] [CrossRef]
- Sotos-Prieto, M.; Santos-Beneit, G.; Bodega, P. Validation of a questionnaire to measure overall Mediterranean lifestyle habits for research application: The MEDiterranean LIFEstyle index (MEDLIFE). Nutr. Hosp. 2015, 32, 1153. [Google Scholar]
- Anastasiou, C.A.; Yannakoulia, M.; Kontogianni, M.D. Mediterranean lifestyle in relation to cognitive health: Results from the HELIAD study. Nutrients 2018, 10, 1557. [Google Scholar] [CrossRef]
- Karl, J.P.; Hatch, A.M.; Arcidiacono, S.M. Effects of psychological, environmental and physical stressors on the gut microbiota. Front. Microbiol. 2018, 9, 2013. [Google Scholar] [CrossRef]
- Wood, D.E.; Lu, J.; Langmead, B. Improved metagenomic analysis with Kraken 2. Genome Biol. 2019, 20, 257. [Google Scholar] [CrossRef]
- Peña-Casanova, J. Teoría e Interpretación: Normalidad, Semiología y Patolología Neuropsicológicas; Test-Barcelona Services SL: Barcelona, Spain, 2019. [Google Scholar]
- Folstein, M.F.; McHugh, P.R. “Mini-mental state”: A practical method for grading the cognitive state of patients for the clinician. J. Psychiatr. Res. 1975, 12, 189–198. [Google Scholar] [CrossRef]
- Buschke, H.; Kuslansky, G.; Katz, M. Screening for dementia with the memory impairment screen. Neurology 1999, 52, 231. [Google Scholar] [CrossRef]
- Buschke, H. Cued recall in amnesia. J. Clin. Exp. Neuropsychol. 1984, 6, 433–440. [Google Scholar] [CrossRef]
- Reitan, R.M. Validity of the Trail Making Test as an indicator of organic brain damage. Percept. Mot. Skills. 1958, 8, 271–276. [Google Scholar] [CrossRef]
- Cacho, J.; García-García, R.; Arcaya, J.; Vicente, J.L.; Lantada, N. A proposal for application and scoring of the Clock Drawing Test in Alzheimer’s disease. Rev. Neurol. 1999, 28, 648–655. [Google Scholar]
- Shulman, K.I. Clock-drawing: Is it the ideal cognitive screening test? Int. J. Geriatr. Psychiatry 2000, 15, 548–561. [Google Scholar] [CrossRef]
- Dubois, B.; Slachevsky, A.; Litvan, I. The FAB: A frontal assessment battery at bedside. Neurology 2000, 55, 1621–1626. [Google Scholar] [CrossRef]
- León-Estrada, I.; García-García, J.; Roldán-Tapia, L. Escala de reserva cognitiva: Ajuste del modelo teórico y baremación. Rev. Neurol. 2017, 64, 7–16. [Google Scholar] [CrossRef]
- Casals-Coll, M.; Sánchez-Benavides, G.; Meza-Cavazos, S. Spanish Multicenter Normative Studies (NEURONORMA Project): Normative Data and Equivalence of Four BNT Short-Form Versions. Arch. Clin. Neuropsychol. 2013, 29, 60–74. [Google Scholar] [CrossRef]
- Kaplan, E.; Goodglass, H.; Weintraub, S. Boston Naming Test (2nd(BNT-2); Pro-Ed: Austin, TX, USA, 2001. [Google Scholar]
- Goldberg, D.; Bridges, K.; Duncan-Jones, P. Detecting anxiety and depression in general medical settings. Br. Med. J. 1988, 297, 897. [Google Scholar] [CrossRef]
- Soldevila-Domenech, N.; Forcano, L.; Vintro-Alcaraz, C. Interplay between cognition and weight reduction in individuals following a Mediterranean Diet: Three-year follow-up of the PREDIMED-Plus trial. Clin. Nutr. 2021, 40, 5221–5237. [Google Scholar] [CrossRef]
- Benjamini, Y.; Hochberg, Y. Controlling the false discovery rate: A practical and powerful approach to multiple testing. J. R. Stat. Soc. Ser. B 1995, 57, 289–300. [Google Scholar] [CrossRef]
- Nuzum, N.D.; Szymlek-Gay, E.A.; Loke, S. Differences in the gut microbiome across typical ageing and in Parkinson’s disease. Neuropharmacology 2023, 235, 109566. [Google Scholar] [CrossRef]
- Botto, R.; Callai, N.; Cermelli, A. Anxiety and depression in Alzheimer’s disease: A systematic review of pathogenetic mechanisms and relation to cognitive decline. Neurol. Sci. 2022, 43, 4107–4124. [Google Scholar] [CrossRef]
- Schwertner, E.; Pereira, J.B.; Xu, H. Behavioral and psychological symptoms of dementia in different dementia disorders: A large-scale study of 10,000 individuals. J. Alzheimer’s Dis. 2022, 87, 1307–1318. [Google Scholar] [CrossRef]
- Seixas-Lima, B.; Binns, M.; Black, S.E.; Fischer, C.; Freedman, M.; Kumar, S.; Lahiri, D.; Roncero, C.T.; Strother, S.; Tang-Wai, D.F.; et al. Relationships between neuropsychiatric symptoms and cognitive profiles in Alzheimer’s disease and related syndromes. Int. J. Geriatr. Psychiatry 2023, 38, e5960. [Google Scholar] [CrossRef]
- Rouch, I.; Padovan, C.; Boublay, N. Association between executive function and the evolution of behavioral disorders in Alzheimer’s disease. Int. J. Geriatr. Psychiatry 2020, 35, 1043–1050. [Google Scholar] [CrossRef]
- Banning, L.C.; Ramakers, I.H.; Köhler, S. The association between biomarkers and neuropsychiatric symptoms across the Alzheimer’s disease spectrum. Am. J. Geriatr. Psychiatry 2020, 28, 735–744. [Google Scholar] [CrossRef]
- Devanand, D.P.; Lee, S.; Huey, E.D. Associations between neuropsychiatric symptoms and neuropathological diagnoses of Alzheimer disease and related dementias. JAMA Psychiatry 2022, 79, 359–367. [Google Scholar] [CrossRef] [PubMed]
- Clemmensen, F.K.; Hoffmann, K.; Siersma, V. The role of physical and cognitive function in performance of activities of daily living in patients with mild-to-moderate Alzheimer’s disease—A cross-sectional study. BMC Geriatr. 2020, 20, 513. [Google Scholar] [CrossRef]
- Baillon, S.; Gasper, A.; Wilson-Morkeh, F. Prevalence and severity of neuropsychiatric symptoms in early-versus late-onset Alzheimer’s disease. Am. J. Alzheimer’s Dis. Other Dement. 2019, 34, 433–438. [Google Scholar] [CrossRef]
- Kaiser, N.C.; Liang, L.-J.; Melrose, R.J. Differences in anxiety among patients with early-versus late-onset Alzheimer’s disease. J. Neuropsychiatry Clin. Neurosci. 2014, 26, 73–80. [Google Scholar] [CrossRef]
- Banning, L.C.; Ramakers, I.H.; Rosenberg, P.B. Alzheimer’s disease biomarkers as predictors of trajectories of depression and apathy in cognitively normal individuals, mild cognitive impairment, and Alzheimer’s disease dementia. Int. J. Geriatr. Psychiatry 2021, 36, 224–234. [Google Scholar] [CrossRef] [PubMed]
- Lebedeva, A.; Westman, E.; Lebedev, A.V. Structural brain changes associated with depressive symptoms in the elderly with Alzheimer’s disease. J. Neurol. Neurosurg. Psychiatry 2014, 85, 930–935. [Google Scholar] [CrossRef]
- Azocar, I.; Livingston, G.; Huntley, J. The Association Between Impaired Awareness and Depression, Anxiety, and Apathy in Mild to Moderate Alzheimer’s Disease: A Systematic Review. Front. Psychiatry 2021, 12, 633081. [Google Scholar] [CrossRef]
- Guo, M.; Peng, J.; Huang, X. Gut microbiome features of Chinese patients newly diagnosed with Alzheimer’s disease or mild cognitive impairment. J. Alzheimer’s Dis. 2021, 80, 299–310. [Google Scholar] [CrossRef]
- Liu, P.; Wu, L.; Peng, G. Altered microbiomes distinguish Alzheimer’s disease from amnestic mild cognitive impairment and health in a Chinese cohort. Brain Behav. Immun. 2019, 80, 633–643. [Google Scholar] [CrossRef]
- Ueda, A.; Shinkai, S.; Shiroma, H. Identification of Faecalibacterium prausnitzii strains for gut microbiome-based intervention in Alzheimer’s-type dementia. Cell Rep. Med. 2021, 2, 100398. [Google Scholar] [CrossRef]
- Zhang, Y.; Lu, S.; Yang, Y. The diversity of gut microbiota in type 2 diabetes with or without cognitive impairment. Aging Clin. Exp. Res. 2021, 33, 589–601. [Google Scholar] [CrossRef] [PubMed]
- Sergeev, I.N.; Aljutaily, T.; Walton, G. Effects of synbiotic supplement on human gut microbiota, body composition and weight loss in obesity. Nutrients 2020, 12, 222. [Google Scholar] [CrossRef]
- Plassais, J.; Gbikpi-Benissan, G.; Figarol, M. Gut microbiome alpha-diversity is not a marker of Parkinson’s disease and multiple sclerosis. Brain Commun. 2021, 3, 113. [Google Scholar] [CrossRef] [PubMed]
- Haran, J.P.; Bhattarai, S.K.; Foley, S.E. Alzheimer’s disease microbiome is associated with dysregulation of the anti-inflammatory P-glycoprotein pathway. mBio 2019, 10, e00632-19. [Google Scholar] [CrossRef]
- Pan, Q.; Li, Y.-Q.; Guo, K. Elderly patients with mild cognitive impairment exhibit altered gut microbiota profiles. J. Immunol. Res. 2021, 2021, 5578958. [Google Scholar] [CrossRef]
- Ferreiro, A.L.; Choi, J.; Ryou, J. Gut microbiome composition may be an indicator of preclinical Alzheimer’s disease. Sci. Transl. Med. 2023, 15, eabo2984. [Google Scholar] [CrossRef]
- Duan, M.; Liu, F.; Fu, H. Preoperative microbiomes and intestinal barrier function can differentiate prodromal Alzheimer’s disease from normal neurocognition in elderly patients scheduled to undergo orthopedic surgery. Front. Cell Infect. Microbiol. 2021, 11, 592842. [Google Scholar] [CrossRef]
- Cattaneo, A.; Cattane, N.; Galluzzi, S. Association of brain amyloidosis with pro-inflammatory gut bacterial taxa and peripheral inflammation markers in cognitively impaired elderly. Neurobiol. Aging 2016, 49, 60–68. [Google Scholar] [CrossRef]
- Saji, N.; Murotani, K.; Hisada, T. The relationship between the gut microbiome and mild cognitive impairment in patients without dementia: A cross-sectional study conducted in Japan. Sci. Rep. 2019, 9, 19227. [Google Scholar]
- Hoscheidt, S.; Sanderlin, A.H.; Baker, L.D. Mediterranean and Western diet effects on Alzheimer’s disease biomarkers, cerebral perfusion, and cognition in mid-life: A randomized trial. Alzheimer’s Dement. 2022, 18, 457–468. [Google Scholar] [CrossRef]
- Power, R.; Prado-Cabrero, A.; Mulcahy, R. The role of nutrition for the aging population: Implications for cognition and Alzheimer’s disease. Annu. Rev. Food Sci. Technol. 2019, 10, 619–639. [Google Scholar] [CrossRef]
- Wanapaisan, P.; Chuansangeam, M.; Nopnipa, S. Association between gut microbiota with mild cognitive impairment and Alzheimer’s disease in a Thai population. Neurodegener. Dis. 2022, 22, 43–54. [Google Scholar] [CrossRef]
- Li, B.; He, Y.; Ma, J. Mild cognitive impairment has similar alterations as Alzheimer’s disease in gut microbiota. Alzheimer’s Dement. 2019, 15, 1357–1366. [Google Scholar] [CrossRef]
- Bradley, P.H.; Pollard, K.S. Proteobacteria explain significant functional variability in the human gut microbiome. Microbiome 2017, 5, 36. [Google Scholar] [CrossRef]
- Li, Z.; Lu, G.; Li, Z. Altered actinobacteria and firmicutes phylum associated epitopes in patients with parkinson’s disease. Front. Immunol. 2021, 12, 632482. [Google Scholar] [CrossRef]

Disclaimer/Publisher’s Note: The statements, opinions and data contained in all publications are solely those of the individual author(s) and contributor(s) and not of MDPI and/or the editor(s). MDPI and/or the editor(s) disclaim responsibility for any injury to people or property resulting from any ideas, methods, instructions or products referred to in the content. |
© 2024 by the authors. Licensee MDPI, Basel, Switzerland. This article is an open access article distributed under the terms and conditions of the Creative Commons Attribution (CC BY) license (https://creativecommons.org/licenses/by/4.0/).