Article

Influence of Early Life Factors on the Breast Milk and Fecal Microbiota of Mother–Newborn Dyads

by
Emmanuel Cervantes-Monroy
1,2,
Imelda C. Zarzoza-Mendoza
1,
Samuel Canizales-Quinteros
3,4,
Sofia Morán-Ramos
3,4,5,
Judith Villa-Morales
1,
Blanca E. López-Contreras
3,4,
Fairt V. Carmona-Sierra
6 and
Maricela Rodríguez-Cruz
1,*
1
Laboratorio de Nutrición Molecular, Unidad de Investigación Médica en Nutrición, Hospital de Pediatría, Centro Médico Nacional Siglo XXI, Instituto Mexicano del Seguro Social (IMSS), Ciudad de México 06720, Mexico
2
Posgrado en Ciencias Biológicas, Universidad Nacional Autónoma de México (UNAM), Unidad de Posgrado, Edificio D, 1° Piso. Circuito de Posgrados, Ciudad Universitaria, Ciudad de México 04510, Mexico
3
Unidad de Genómica de Poblaciones Aplicada a la Salud, Departamento de Biología, Facultad de Química, Universidad Nacional Autónoma de México, Ciudad de México 04510, Mexico
4
Instituto Nacional de Medicina Genómica (INMEGEN), Ciudad de México 14610, Mexico
5
Departamento de Alimentos y Biotecnología, Facultad de Química, Universidad Nacional Autónoma de Mexico, Ciudad de México 04510, Mexico
6
Unidad de Medicina Familiar Number 4, Instituto Mexicano del Seguro Social (IMSS), Ciudad de México 06720, Mexico
*
Author to whom correspondence should be addressed.
Microorganisms 2024, 12(11), 2142; https://doi.org/10.3390/microorganisms12112142
Submission received: 9 July 2024 / Revised: 5 August 2024 / Accepted: 12 August 2024 / Published: 25 October 2024
(This article belongs to the Section Microbiomes)

Abstract

:
Maternal gut and breast milk (BM) are key in vertically transmission bacteria to infants, shaping their gut microbiota in early life. Although the establishment of early gut microbiota is known, the role of the combined influence of maternal factors and newborn characteristics is not explored. In this study, we aimed to assess the influence of maternal BMI and total body fat, age, delivery mode, and newborn sex on the diversity and composition of the BM and gut microbiota (GM) in mother–newborn dyads. In this cross-sectional study, of the 986 pregnant women candidates, 53 participated, and, finally, 40 mother–newborn dyads exclusively breastfeeding at 20–28 days postpartum were included. Metataxonomic profiling of DNA extracted from BM and fecal samples was conducted using 16S rRNA sequencing. Globally, the findings offer valuable insights that excessive adiposity, age, and C-section delivery influence a lower abundance of specific taxa in the BM, maternal gut, and gut of newborns. Also, the simultaneous analysis of maternal factors and newborn characteristics shows that maternal age and newborn sex explain an important variation in the microbiota composition. These results add to the understanding of the intricate interplay between maternal factors and the microbial communities that influence early-life gut and BM microbiota.

1. Introduction

The neonatal period is a crucial stage for the establishment of the gut microbiota (GM), which plays a key role in short- and long-term health outcomes [1]. The first significant exposure to microbiota occurs during birth when a neonate ingests native microorganisms from the maternal vagina and gut [2,3]. Subsequent exposure to breast milk (BM) provides additional bacteria diversity, possibly from several sources, including the maternal skin, newborn oral cavity, or maternal gut via the entero-mammary pathway [4,5]. While previous studies have investigated the influence of factors like maternal nutritional status and delivery mode on GM and BM microbiota diversity [6], evidence remains limited for others like maternal age and newborn sex.
Obesity has been associated with GM imbalance, which could be passed to the BM microbiota composition [7,8,9]. As a result, newborns born to mothers with obesity may inherit a microbiota that is different, with reduced diversity, decreased Bifidobacterium abundance, and increased Staphylococcus abundance, predisposing them to childhood obesity [10].
New evidence indicates that the age of a mother can influence the composition of the gut microbiota during pregnancy. Women over 35 years old tend to have higher levels of Prevotella bivia and opportunistic microorganism, compared to younger women [11]. Furthermore, BM from women over 30 years old tends to display greater microbiota diversity than BM from younger women [12,13]. The method of delivery mode also impacts maternal gut [14] and BM microbiota [15,16]. Additionally, the delivery mode has a well-known impact on the gut microbiota of newborns, with infants born via C-section showing a microbiota profile like that of their mother’s skin microbiota [17].
Recent evidence suggests that sexual dimorphism plays a role in BM microbiota composition and neonatal GM. It has been observed that BM intended for male neonates has lower diversity and a higher abundance of Streptococcus bacteria [17,18]. Similarly, male neonates tend to have less diverse GM and higher abundance of bacteria from the Streptococcaceae family [19].
Despite the existing findings, our knowledge about these factors primarily comes from individual studies, with limited information on the effects of maternal age and newborn sex. Considering the complex interaction of these factors, it is important to evaluate them together. Therefore, the aim of the present study is to assess how maternal BMI, total body fat, age, delivery mode, and newborn sex collectively influence the diversity and composition of GM and BM microbiota in mother–newborn dyads. By understanding these relationships, this study aims to provide valuable insights into the factors that determine the composition of maternal and newborn gut microbiota and breast milk microbiota.

2. Materials and Methods

2.1. Study Design and Population

This cross-sectional study recruited pregnant women from the Instituto Mexicano del Seguro Social (IMSS). Inclusion criteria comprised women aged 18 to 35 years, first-time mothers without chronic diseases, and those experiencing uncomplicated pregnancy. Newborns included were at term delivery (≥37 weeks gestation), weighed ≥2500 g at birth, and were exclusively breastfed. Participants with mastitis symptoms, newborns with clinical conditions, and those using mixed feeding, antibiotic treatment within 15 days before sample collection, or probiotic supplementation during the sampled period were excluded. The study was conducted in accordance with the Declaration of Helsinki, and the National Commission for Scientific Research of IMSS (R-2017-785-055) approved this study. Written informed consent was obtained from each participant prior to sample collection. The flowchart detailing participants’ eligibility assessment and sample analysis is detailed in Figure 1.
Forty participants were stratified based on primarily (1) maternal body index (BMI) at 20–28 days postpartum (20–28DPP) categorized as normal weight vs. overweight/obesity per World Health Organization guidelines [20] and total body fat mass grouped as adequate body fat (<30%) vs. excessive body fat (≥30%). Other clinical variables were also used, like (2) maternal age (young (≤30) vs. mature (>30 years)), (3) delivery mode (vaginal vs. C-section), and (4) newborn sex (female vs. male). The maternal age categories were chosen because currently, there are increasing numbers of women who delay childbearing, and around the world, the mean age of women at the birth of their first child has crossed the 30-years threshold [21,22].

2.2. Procedures

During the home visit, the mother’s body weight and body composition were assessed by bioelectrical impedance using a scale (BC-585F FitScan, TANITA, Arlington Heights, IL, USA) as described elsewhere [23]. Pregestational BMI was calculated using the self-reported body weight (kg) divided by the height (m) squared. The BMI at 20–28DPP was obtained using the body weight measured during the visit. The weight gain during pregnancy was calculated based on the self-reported last gestational weight. Newborn body weight and length measurements were performed supine, without clothes and diapers, using an electronic baby scale and an infantometer (Seca 334, Mobile digital baby scale, Hamburg, Germany) on a flat, solid, and even surface, as recommended by WHO guidelines. The body weight gain from birth (WGFB) and length gain from birth (LGFB) were calculated as the difference between the day of birth and 20–28 postnatal days (20–28PND) data. Finally, the head circumference was assessed using an ergonomic circumference measuring tape (Seca 201) placed around the most prominent area of the forehead, above the eyebrows and ears, and behind the occipital protuberance. All measurements were performed in triplicate.
A home visit was scheduled between 20 and 28DPP, during which participants completed a questionnaire providing demographic data. BM was expressed under aseptic conditions using an electric breast pump (Medela Lactina 0162011, Medela, McHenry, IL, USA), with nipple and areola cleaning with a 0.5% chlorhexidine solution (Famicare, Laboratorio Boniquet de México, Naucalpan Estado de México, México) before expression. The BM samples from both breasts were collected in sterile glass bottles after mixing; a 15 mL aliquot was transferred into a sterile conical tube (Axygen Scientific, Union City, CA, USA) and stored at 4 °C for transportation. Fecal samples were self-collected by participants using an OMNIgene Gut kit (DNAgenotek, Ottawa, ON, Canada) and stored at ambient temperature. At the laboratory, both BM and fecal samples were frozen at −80 °C until microbiota composition analysis.
During the home visit, trained clinical personnel conducted anthropometric measurements of the mother and newborn, as detailed in the Supplementary Material.

2.3. 16S rRNA Gene Sequencing and Data Processing

DNA extraction from BM and fecal samples was followed by amplification of the V4 region of the bacterial 16S rRNA gene and sequencing on the Illumina MySeq 2 × 250-bp platform.

2.3.1. DNA Extraction from Fecal and BM Samples

For DNA isolation from fecal samples (0.2 g) and BM (3 mL), the commercial PowerFecal kit (QIAamp® Power Fecal® DNA, QIAGEN, Germantown, MD, USA) was used following the manufacturer’s instructions, including a mechanical disruption by FastPrep (MP Biomedicals; Solon, OH, USA). The DNA was eluted in a final volume of 100 µL and stored at −70 °C for further analysis. For BM DNA extraction, the samples (3 mL) were thawed to 5 °C and centrifuged at 20,000× g for 20 min at 4 °C (Allegra X-22, Beckman Coulter Co., Brea, CA, USA). After that, the fat layer was removed, and the supernatant was discarded. Finally, according to the manufacturer’s protocol, the genomic DNA was isolated from the pellet using the aforesaid commercial kit. The purified DNA was eluted in a final volume of 50 µL and stored at −70 °C for further analysis. The extracted genomic DNA concentration from fecal and BM samples was measured by spectrophotometry (Nanodrop 2000c, Thermo Scientific, Wilmington, DE, USA). The A260/280 ratio was used as a parameter of DNA purity.

2.3.2. PCR Amplification and 16S rRNA Sequencing

The metataxonomic profiling of the fecal and BM microbiota was carried out by the 16S ribosomal RNA (16S rRNA) gene sequencing technique described by López-Contreras et al. [24]. The hypervariable region 4 (V4) was amplified using the oligonucleotides recommended by the Earth Microbiome Project (515F-806R). Briefly, the first PCR amplification was performed with 100 ng of DNA using Platinum TM Taq DNA Polymerase (Invitrogen TM, Thermo Scientific, Carlsbad, CA, USA) under the following PCR conditions: 94 °C for 3 min, 30 cycles of 94 °C for 30 s, 50 °C for 30 s, and 68 °C for 1.5 min, and, finally, 68 °C for 5 min. The DNA integrity was verified by agarose gel electrophoresis (2%). The amplicons were purified through the Agencourt AMPure XP beads (Beckman Coulter, Fullerton, CA, USA) using the Agilent Bravo Automated Liquid Handling Platform (Agilent Technologies, Santa Clara, CA, USA). A second PCR was performed to attach the Illumina sequencing adapters to the amplicons with the following conditions: 94 °C for 2 min, five cycles of 94 °C for 30 s, 60 °C for 30 s, and 68 °C for 1.5 min, and, finally, 68 °C for 5 min. The amplicons were purified, and the libraries’ quantity was assessed using a Qubit® dsDNA HS assay kit on the Qubit 2.0 fluorometer (Life Technologies, ThermoFisher Scientific, Carlsbad, CA, USA). The final library size and concentration were determined by an Agilent D1000 ScreenTape for 4200 TapeStation System (Agilent Technologies, Waldbronn, Germany) and a Qubit 2.0 fluorometer, respectively. Finally, the amplicons were pooled in equimolar ratios and sequenced using the Illumina Miseq 2 × 250-bp platform at the core unit of Instituto Nacional de Medicina Genómica. Negative controls included sterile DNA-free water for fecal and BM DNA extraction and sequencing library preparation. A mock community was used as a positive control (Zymo Research Corp, Irvine, CA, USA).

2.3.3. Bioinformatic Analyses

The raw sequences underwent quality control analysis using the FASTQC (version 0.11.9 [25] tool. Then, the reads were processed and analyzed through the QIIME2 pipeline (version 2020.6 [26]). The sequences were demultiplexed, and DADA2 [27] was used for trimming and filtering to remove sequencing errors in chimeric and or singleton reads, obtaining the amplicon sequence variants (ASVs). The ASVs were referenced against the SILVA 138 database (version 123 [28]) for the 99% sequence similarity taxonomic assignment. Afterward, the metadata, ASV, and taxonomic tables were imported into R software (version 4.1.2 [29]) through the Qiime2R package (version 0.99.6 [30]). The diversity, structure, and taxonomic composition analysis were conducted in Rstudio (version 1.4.1717 [31]) using the phyloseq (version 1.38.0 [32]) and microbiome (version 1.16.0 [33]) packages. Other packages, such as Tidyverse (version 1.3.1 [34]) and Vegan (version 2.6-2 [35]), were also used. A phylogenetic tree was created using the Ape package (version 5.6-2 [36]). The Decontam package (version 1.14.0 [37]) used the prevalence method to detect and remove environment or reagent contaminant sequences. Moreover, quality filtering was applied, excluding all samples with less than 5000 reads, ASVs without reads, and those belonging to domains other than Bacteria and Archaea. Core microbiota, which refers to microbial taxa occurring above a particular occupancy frequency threshold, is typically defined using a prevalence threshold ranging from 30% to 95% [38]. This study used a prevalence threshold of 70% to identify the core microbiota from maternal and newborn fecal and BM samples. The alpha diversity (within-sample diversity) was estimated with the Chao (richness) and Shannon (diversity) metrics, rarefying the sequences to 5000 reads. The unweighted and weighted UniFrac distances were calculated, and a principal coordinate analysis (PCoA) was performed to assess the dissimilarity in microbiota community structure (β diversity) between samples. A differential abundance test was conducted, employing the linear discriminant analysis (LDA) effect size (LefSe [39]) tool to identify genus-level differences between groups based on maternal nutrition status and age, delivery mode, and newborn sex.

2.4. Statistical Analysis

Statistical analysis was performed using R software (version 4.1.2 [29] in the RStudio environment (version 1.4.1717 [31]). The Gaussian distribution of anthropometric parameters and alpha diversity were computed using the Shapiro–Wilk test. Alpha diversity between groups was compared using parametric T-test or nonparametric Mann–Whitney U-test. Significant differences in beta diversity between groups were determined by permutational multivariate analysis of variance (PERMANOVA) with 1000 permutations. Variation of community structure explained by the maternal and newborn characteristics was depicted using the Vegan package envfit function. According to Lefse analysis, genera with an LDA score above a threshold of 2.0 were considered differentially abundant. Statistical significance was set at a p < 0.05.
Eleven participants in each group of normal weight or overweight/obesity were estimated to provide 80% study power to identify a difference of 11.2% of abundance in Firmicutes with an assumption of a standard deviation (SD) of 9.2% with an α-value = 0.05 according to the paper of Verdam et al. [40]. However, we decided to augment the sample size and included more lactating women to reach almost twice the calculated sample size and to explore the data analysis.

3. Results

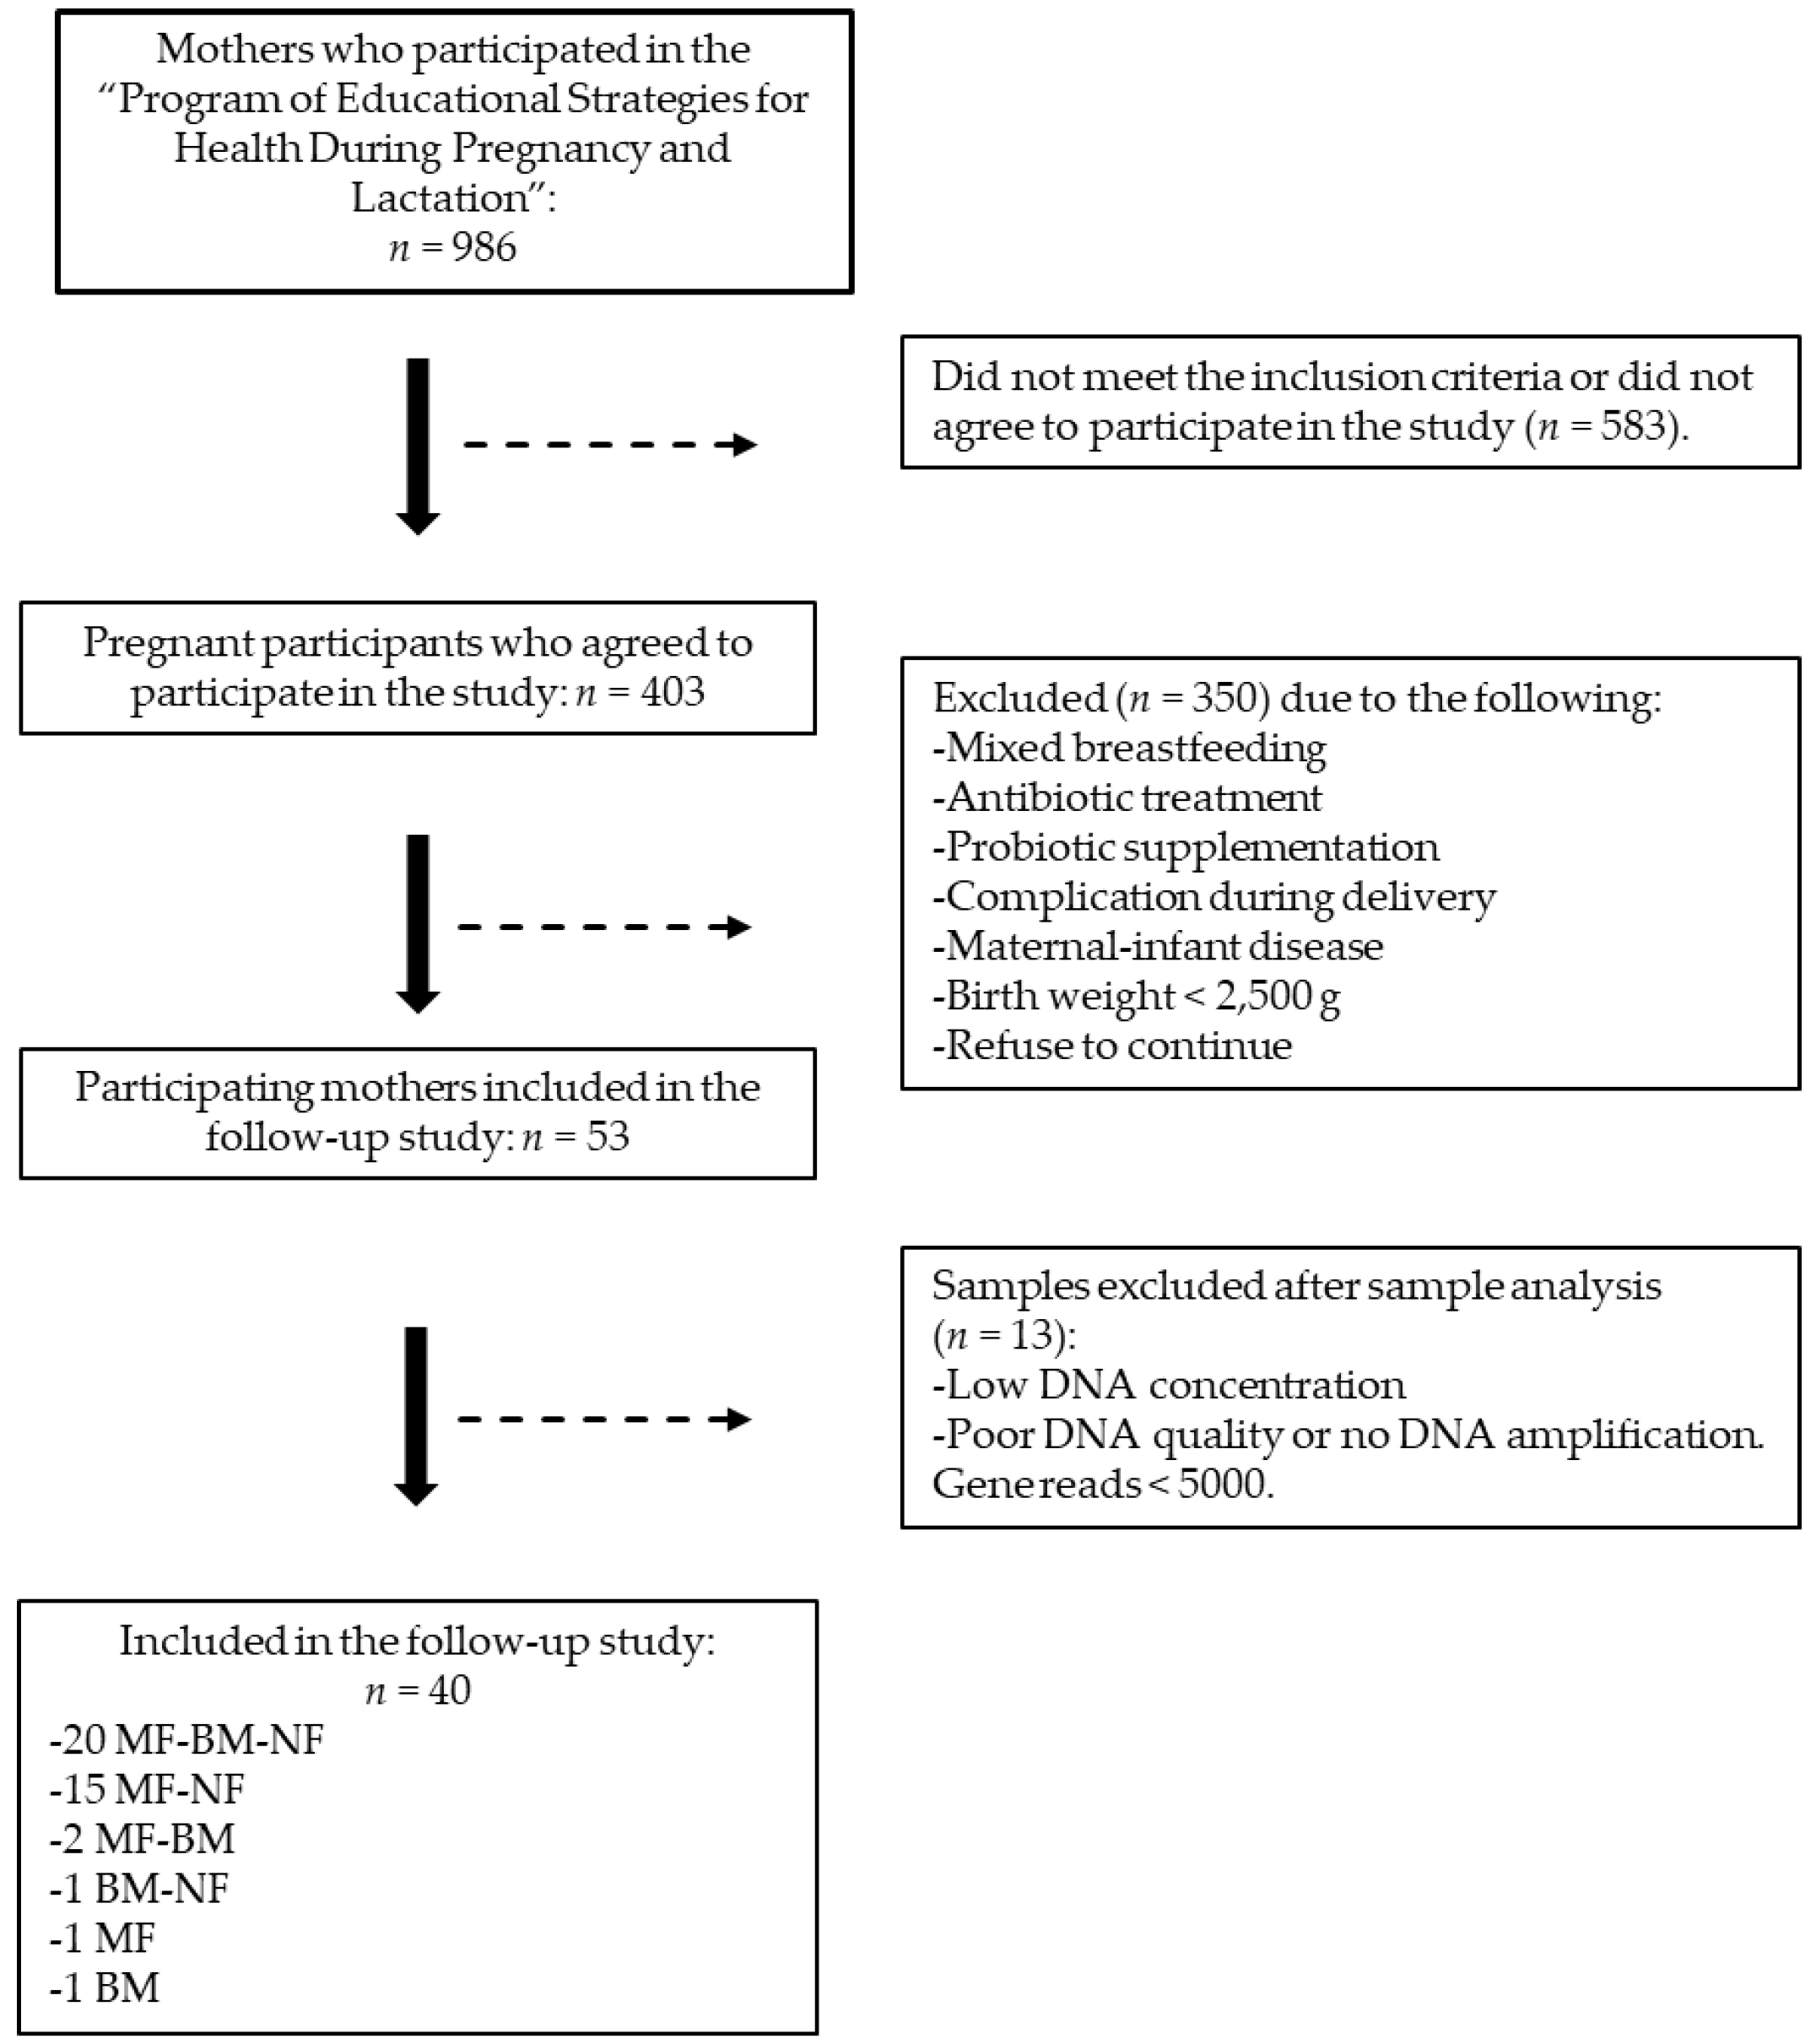
3.1. Flowchart of the Participants

A total of 986 pregnant women participated in the Program of Educational Strategies for Health during Pregnancy and Lactation between November 2018 and March 2020, of which 40.87% decided to participate (Figure 1). During the telephone follow-up and home visit at 20–28DPP, 86.85% of the candidates were excluded due to failing to meet the inclusion criteria or refusing to continue their participation. Finally, fifty-three mother–newborn dyads were enrolled in the study. However, 13 dyads were excluded due to technical issues with the maternal fecal, BM, or newborn fecal samples. These samples comprised 20 mother fecal–BM–newborn fecal triads, 15 mother fecal–newborn fecal pairs, two mother fecal–BM pairs, one BM–newborn fecal pair, one mother fecal sample, and one BM sample for data analysis.

3.2. Demographic Characteristics

Table 1 summarizes the demographic characteristics of the participants. The median age at enrollment was 29.6 years, with a mean pregnancy body weight gain of 10.51 kg. According to BMI, over half of the participants were classified as overweight or obese before pregnancy and at 20–28DPP. However, considering total body fat, a larger proportion (72%) of women exhibited excessive body fat at 20–28DPP. Vaginal delivery occurred in approximately 53% of the mothers, with female newborns accounting for 45% of the total sample.

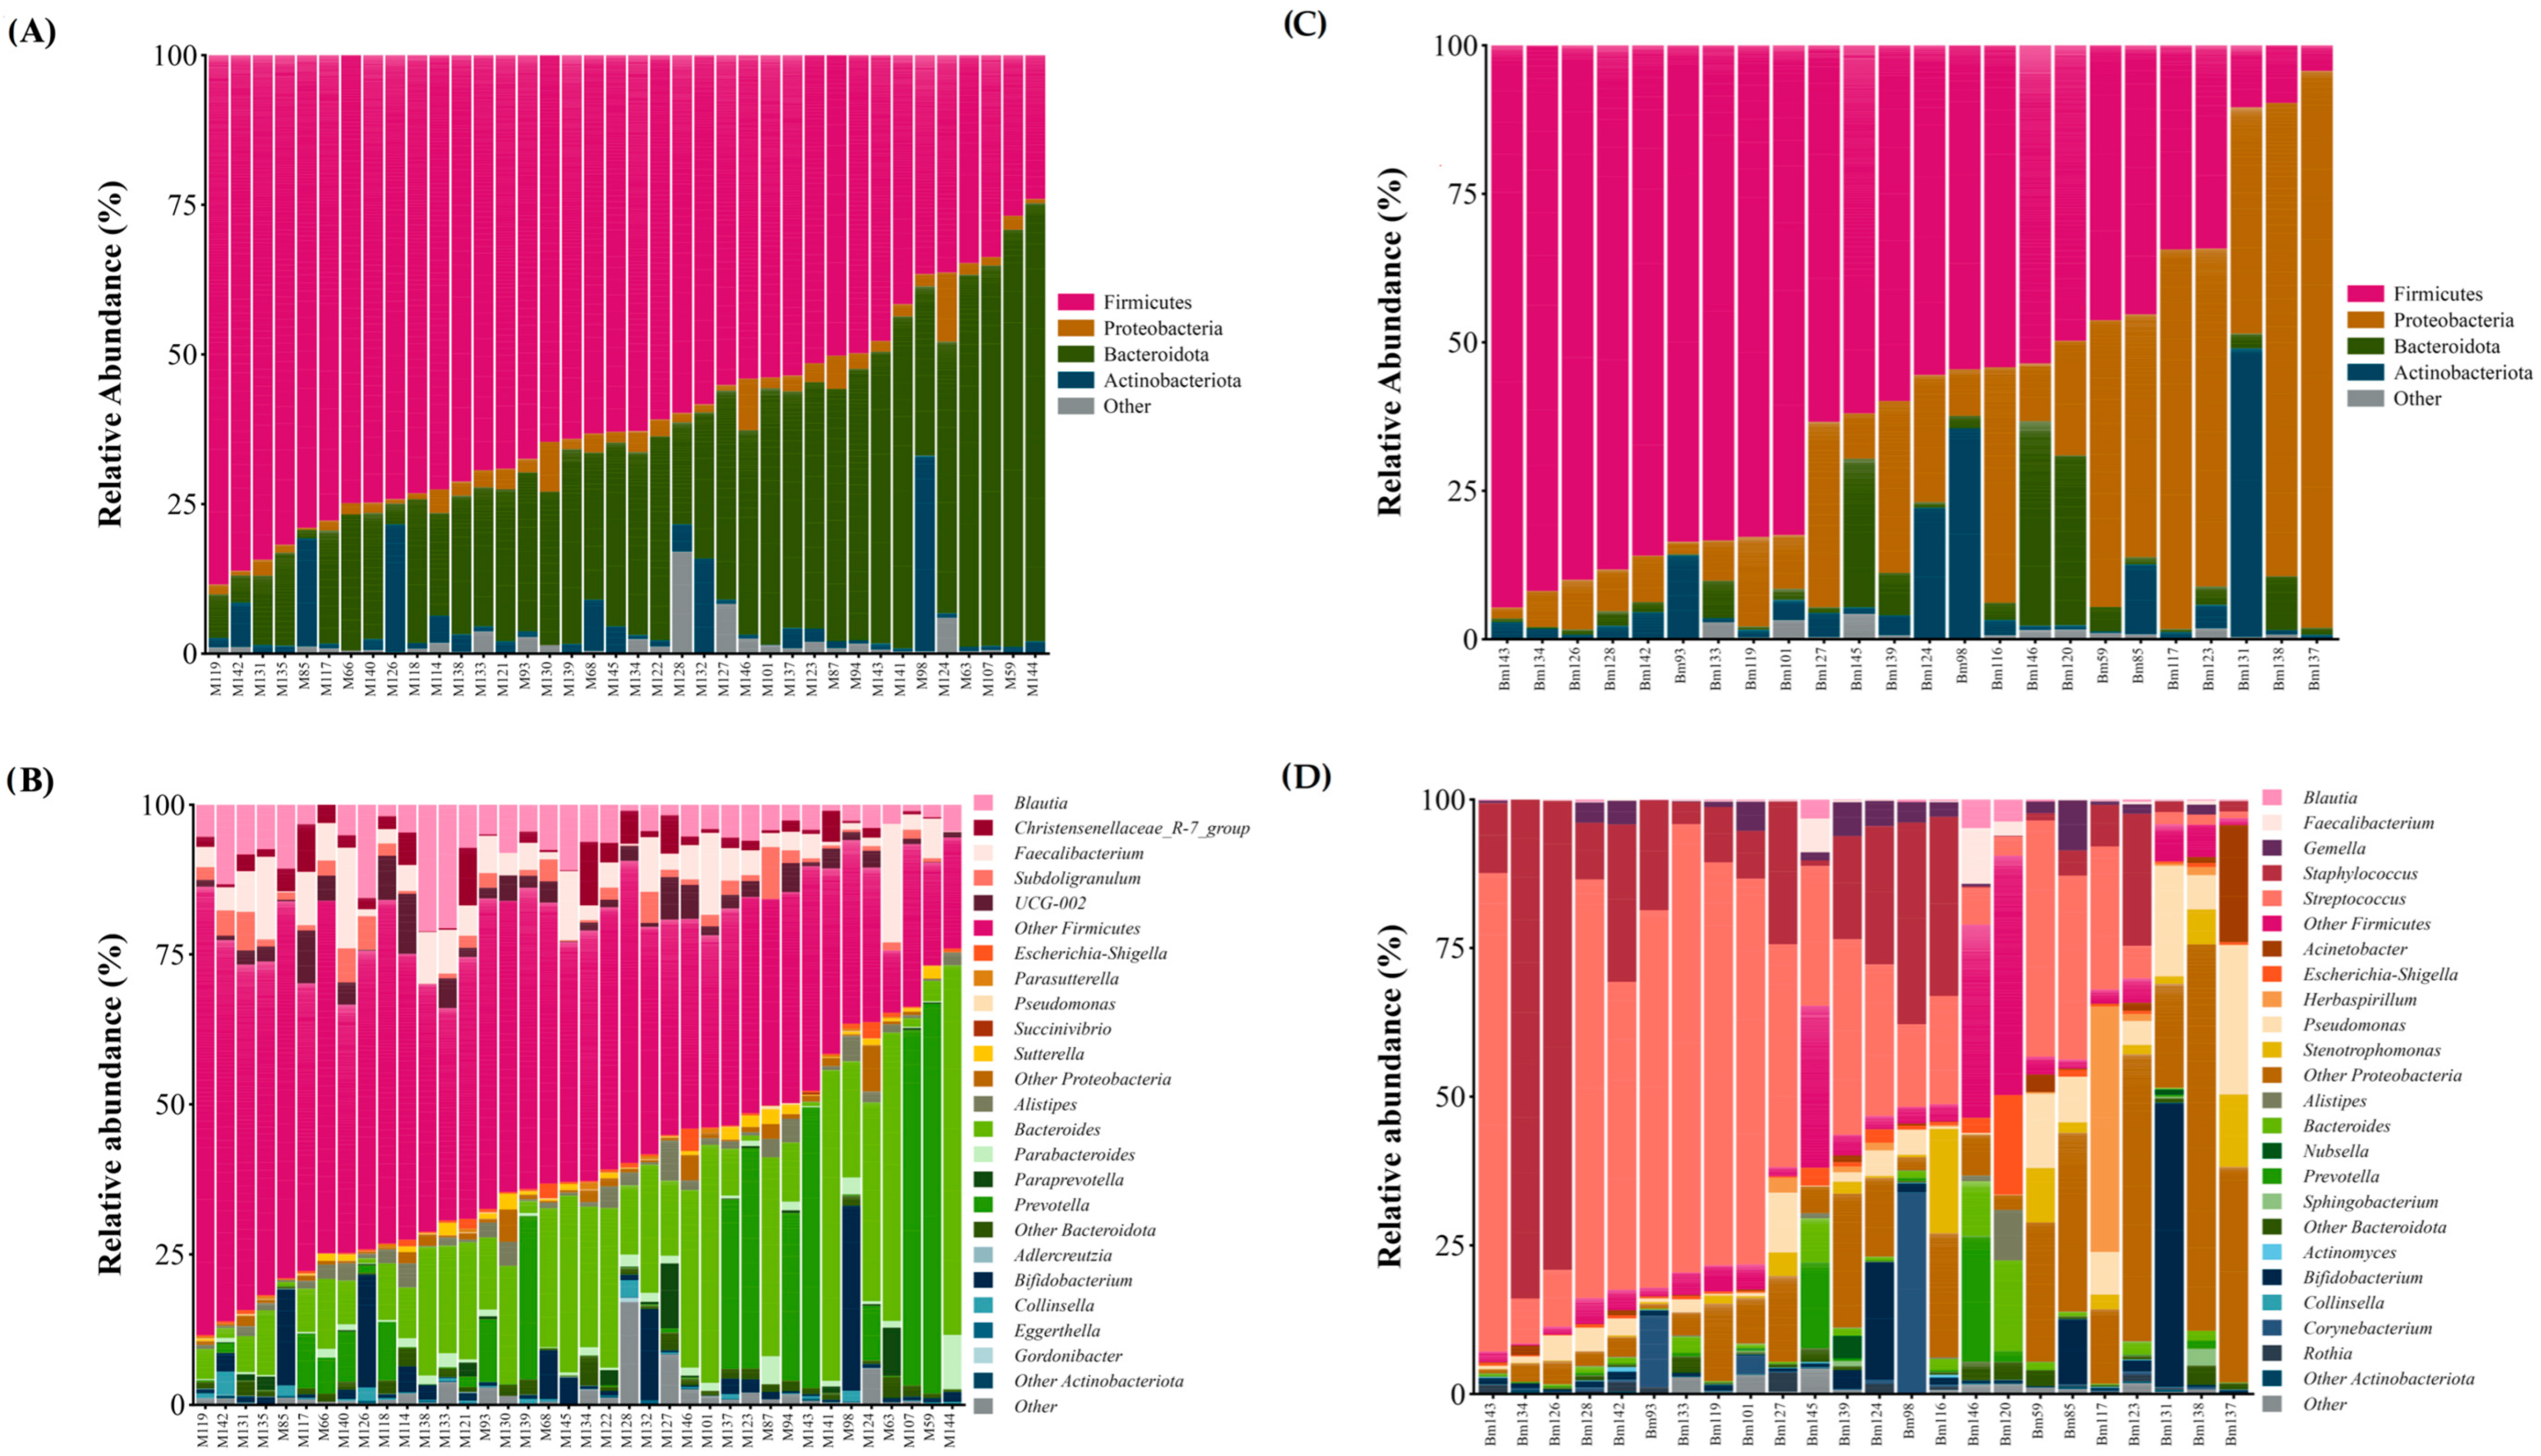
3.3. Microbial Composition

The maternal gut microbiota comprised 15 distinct phyla, with Firmicutes and Bacteroidota accounting for 91.7% of the reads; minor phyla included Actinobacteriota, Proteobacteria, and Verrucomicrobiota, among others (Figure 2A and Supplementary Table S1). Out of the 304 genera detected, those belonging to the Firmicutes phylum were most prevalent (Figure 2B and Supplementary Table S2). The maternal GM core included genera such as Blautia, Bacteroides, Faecalibacterium, Dorea, Anaerostipes, Fusicatenibacter, Bifidobacterium, Parabacteroides, Coprococcus, and Escherichia-Shigella.
The BM microbiota comprised 23 phyla, with Firmicutes dominant, followed by Proteobacteria, Actinobacteriota, and Bacteroidota (Figure 2C and Supplementary Table S3). Among the 402 genera that comprised the BM microbiota (Figure 2D and Supplementary Table S4), the most abundant were Streptococcus and Staphylococcus, both belonging to the Firmicutes phylum. The BM core included Streptococcus, Staphylococcus, Escherichia-Shigella, Bifidobacterium, and Gemella.
The newborn GM was primarily made up of the phyla Proteobacteria, Actinobacteriota, Firmicutes, and Bacteroidota, comprising 99.95% of the composition (Figure 2E and Supplementary Table S5). The most abundant genera were Bifidobacterium, Escherichia-Shigella, Pseudomonas, and notably other genera from the Proteobacteria phylum, with abundances under 1%, but collectively comprising 18.26% of the total composition (Figure 2F and Supplementary Table S6). The neonatal GM core detected consisted of Bifidobacterium, Escherichia-Shigella, Streptococcus, and Staphylococcus.

3.4. Factors Influencing Mother–Newborn Gut and BM Microbiota Composition

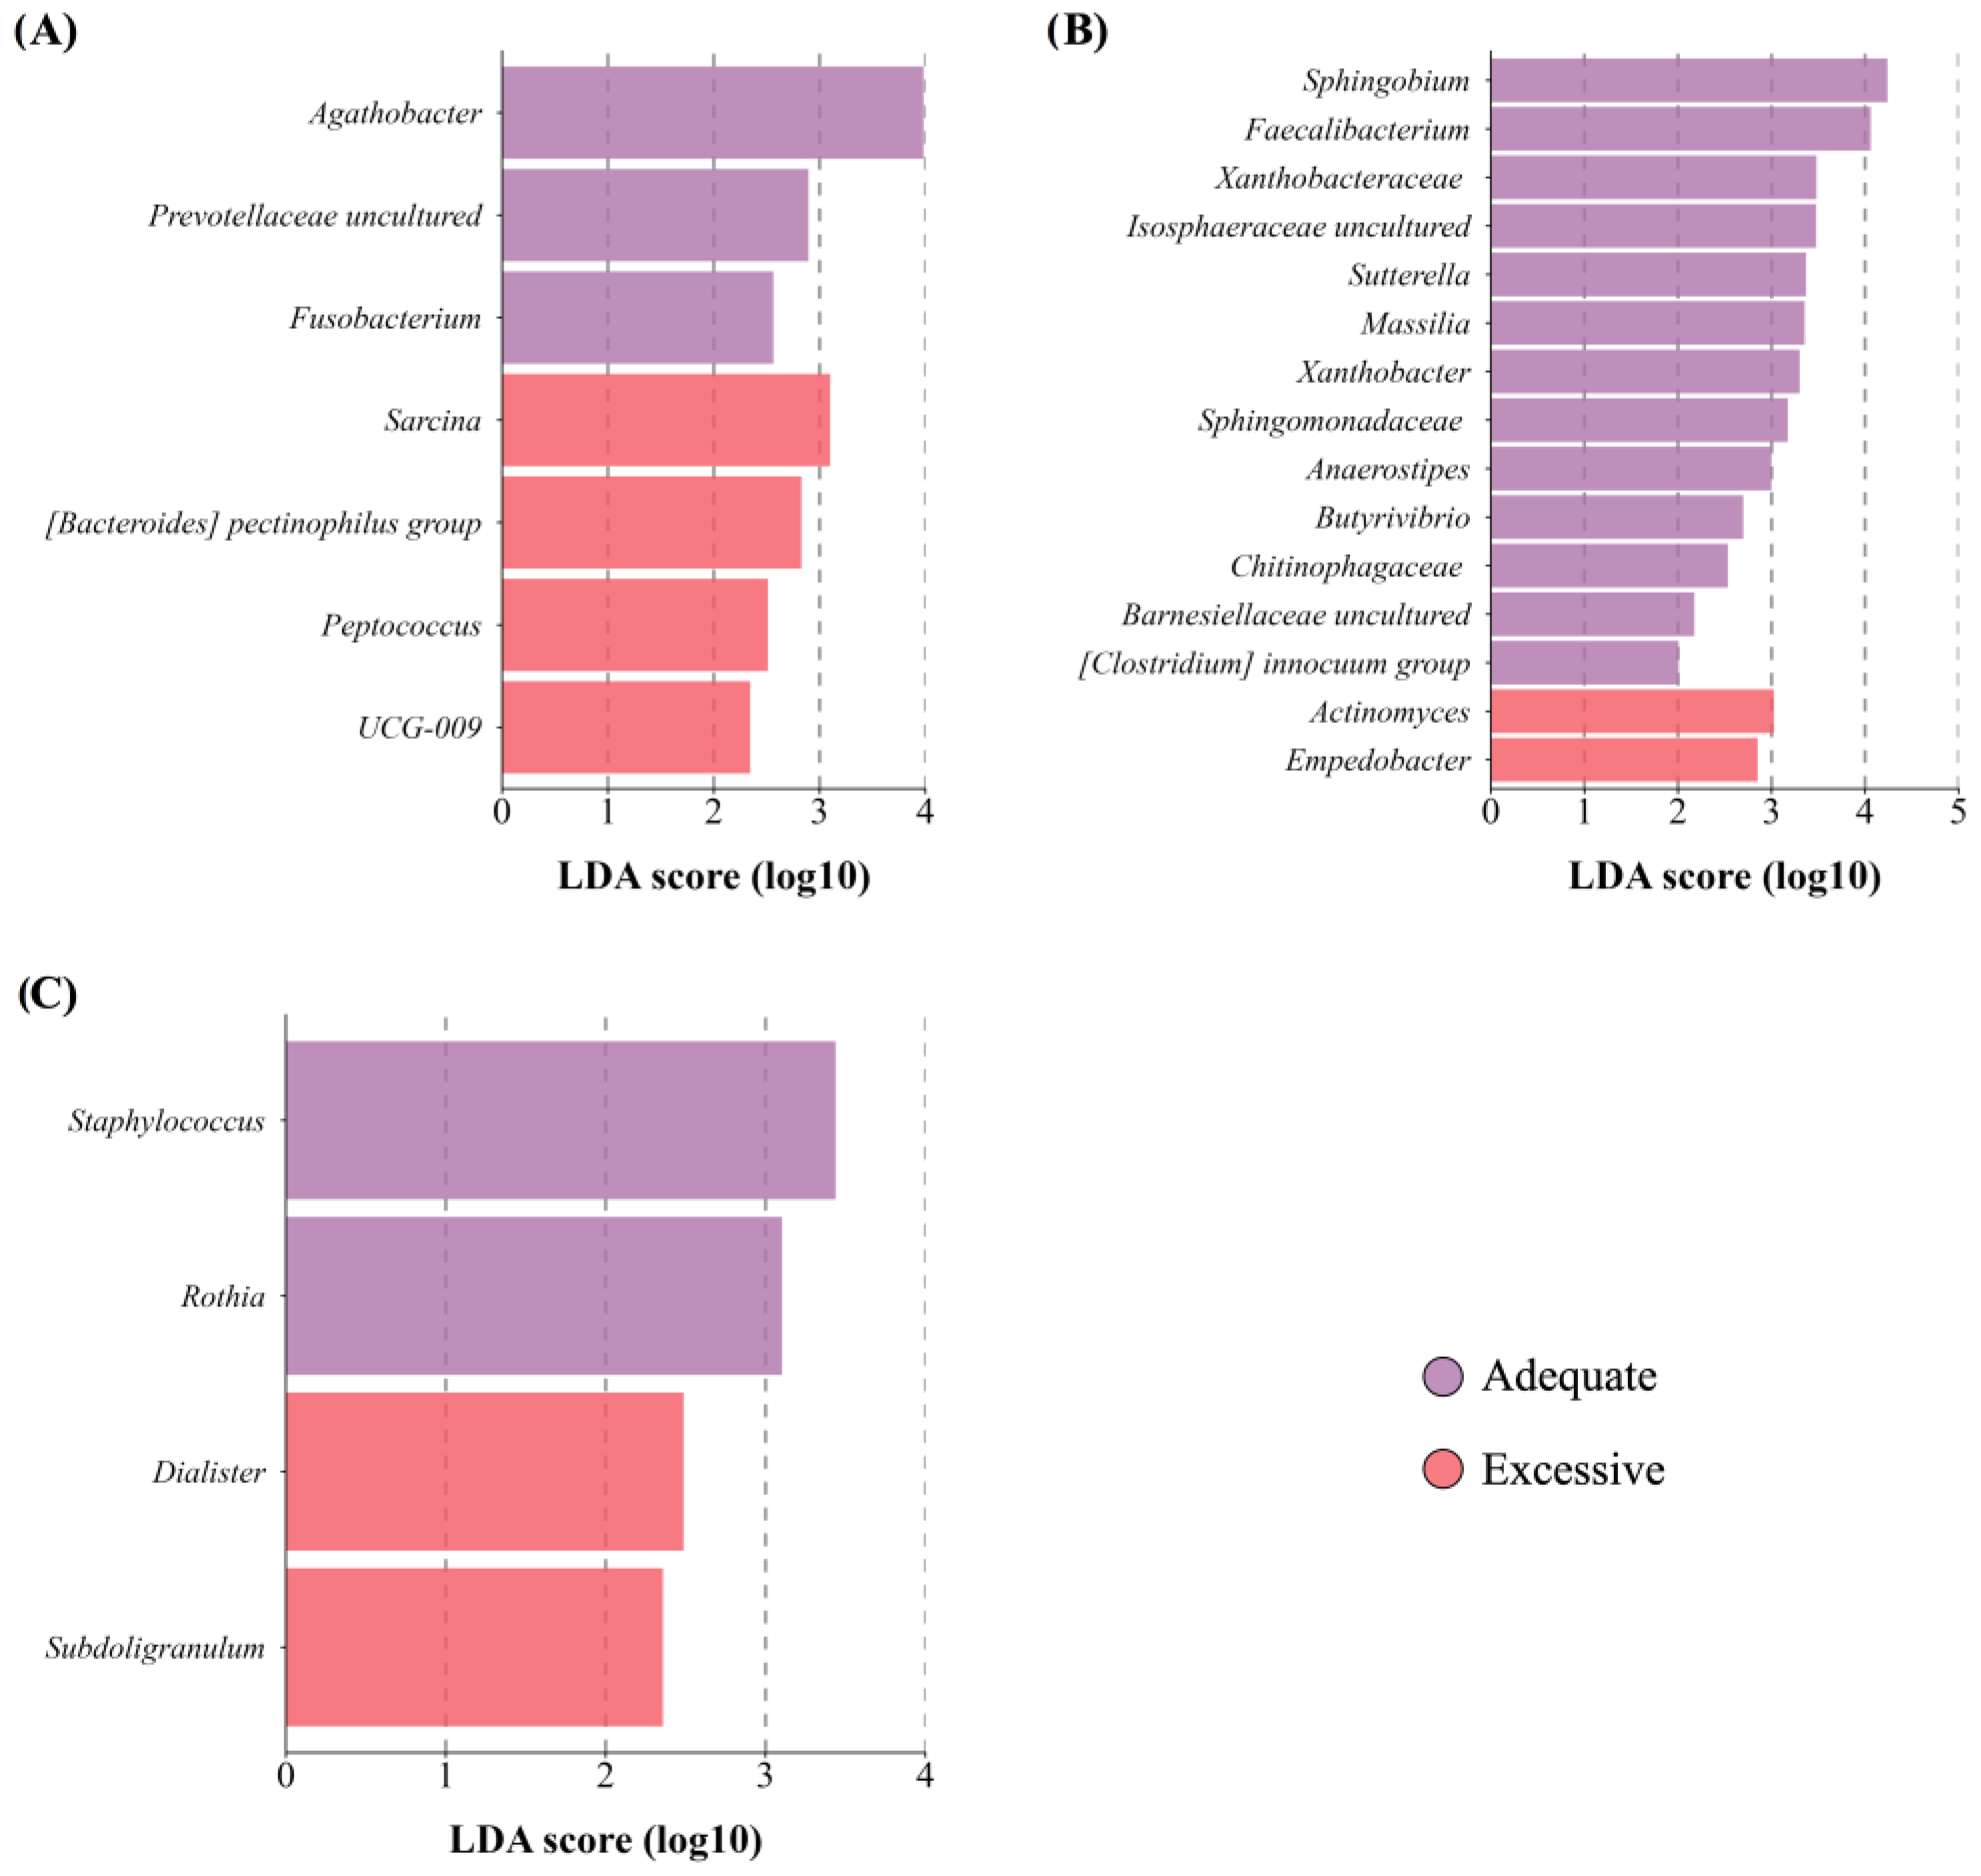
3.4.1. Maternal BMI and Total Body Fat

Maternal BMI did not significantly affect the richness and diversity of the mothers’ and newborns’ GM and BM microbiota. Nevertheless, mothers GM with excessive adiposity had a lower abundance of certain genera, such as Fusobacterium, along with a higher abundance of bacteria belonging to the Firmicutes phylum (Figure 3A). Moreover, BM microbiota from mothers with excessive adiposity (Figure 3B) displayed a lower abundance of specific genera belonging to the Proteobacterium phylum, accompanied by a diminished abundance of fatty-acid-producing bacteria like Faecalibacterium, Anaerostipes, and Butyrivibrio. Furthermore, we notice that newborns born to mothers with excessive adiposity (Figure 3C) showed a lower abundance of core member Staphylococcus.

3.4.2. Maternal Age

No differences in the richness and diversity of maternal GM and BM microbiota were found. However, a significant clustering in maternal GM was noted using the weighted UniFrac distance (R2 = 0.09, p = 0.01). Mature women exhibited a distinct microbial profile with enrichment of core member Bacteroides and other genera belonging to Bacteroidota phylum, while younger women showed enrichment of certain genera from the Firmicutes phylum, including Clostridium sensu stricto 1 and Roseburia, among others (Figure 4A). Subtle changes in BM microbiota were observed, with a higher abundance of minority genera like lactic acid bacteria Leuconostoc and the archaeal Methanobrevibacter in BM from mature women (Figure 4B). Notably, newborns GM from mature mothers showed lower richness (p = 0.01) and a trend towards lower diversity (p = 0.06) compared to neonates from younger women. Although no distinction between beta diversity was observed, the GM of newborns from mature women displayed a lack of enrichment in any taxa and instead had a decreased abundance of Bacteroidales order, including the prevalent genus Bacteroides, compared to those from younger mothers (Figure 4C).

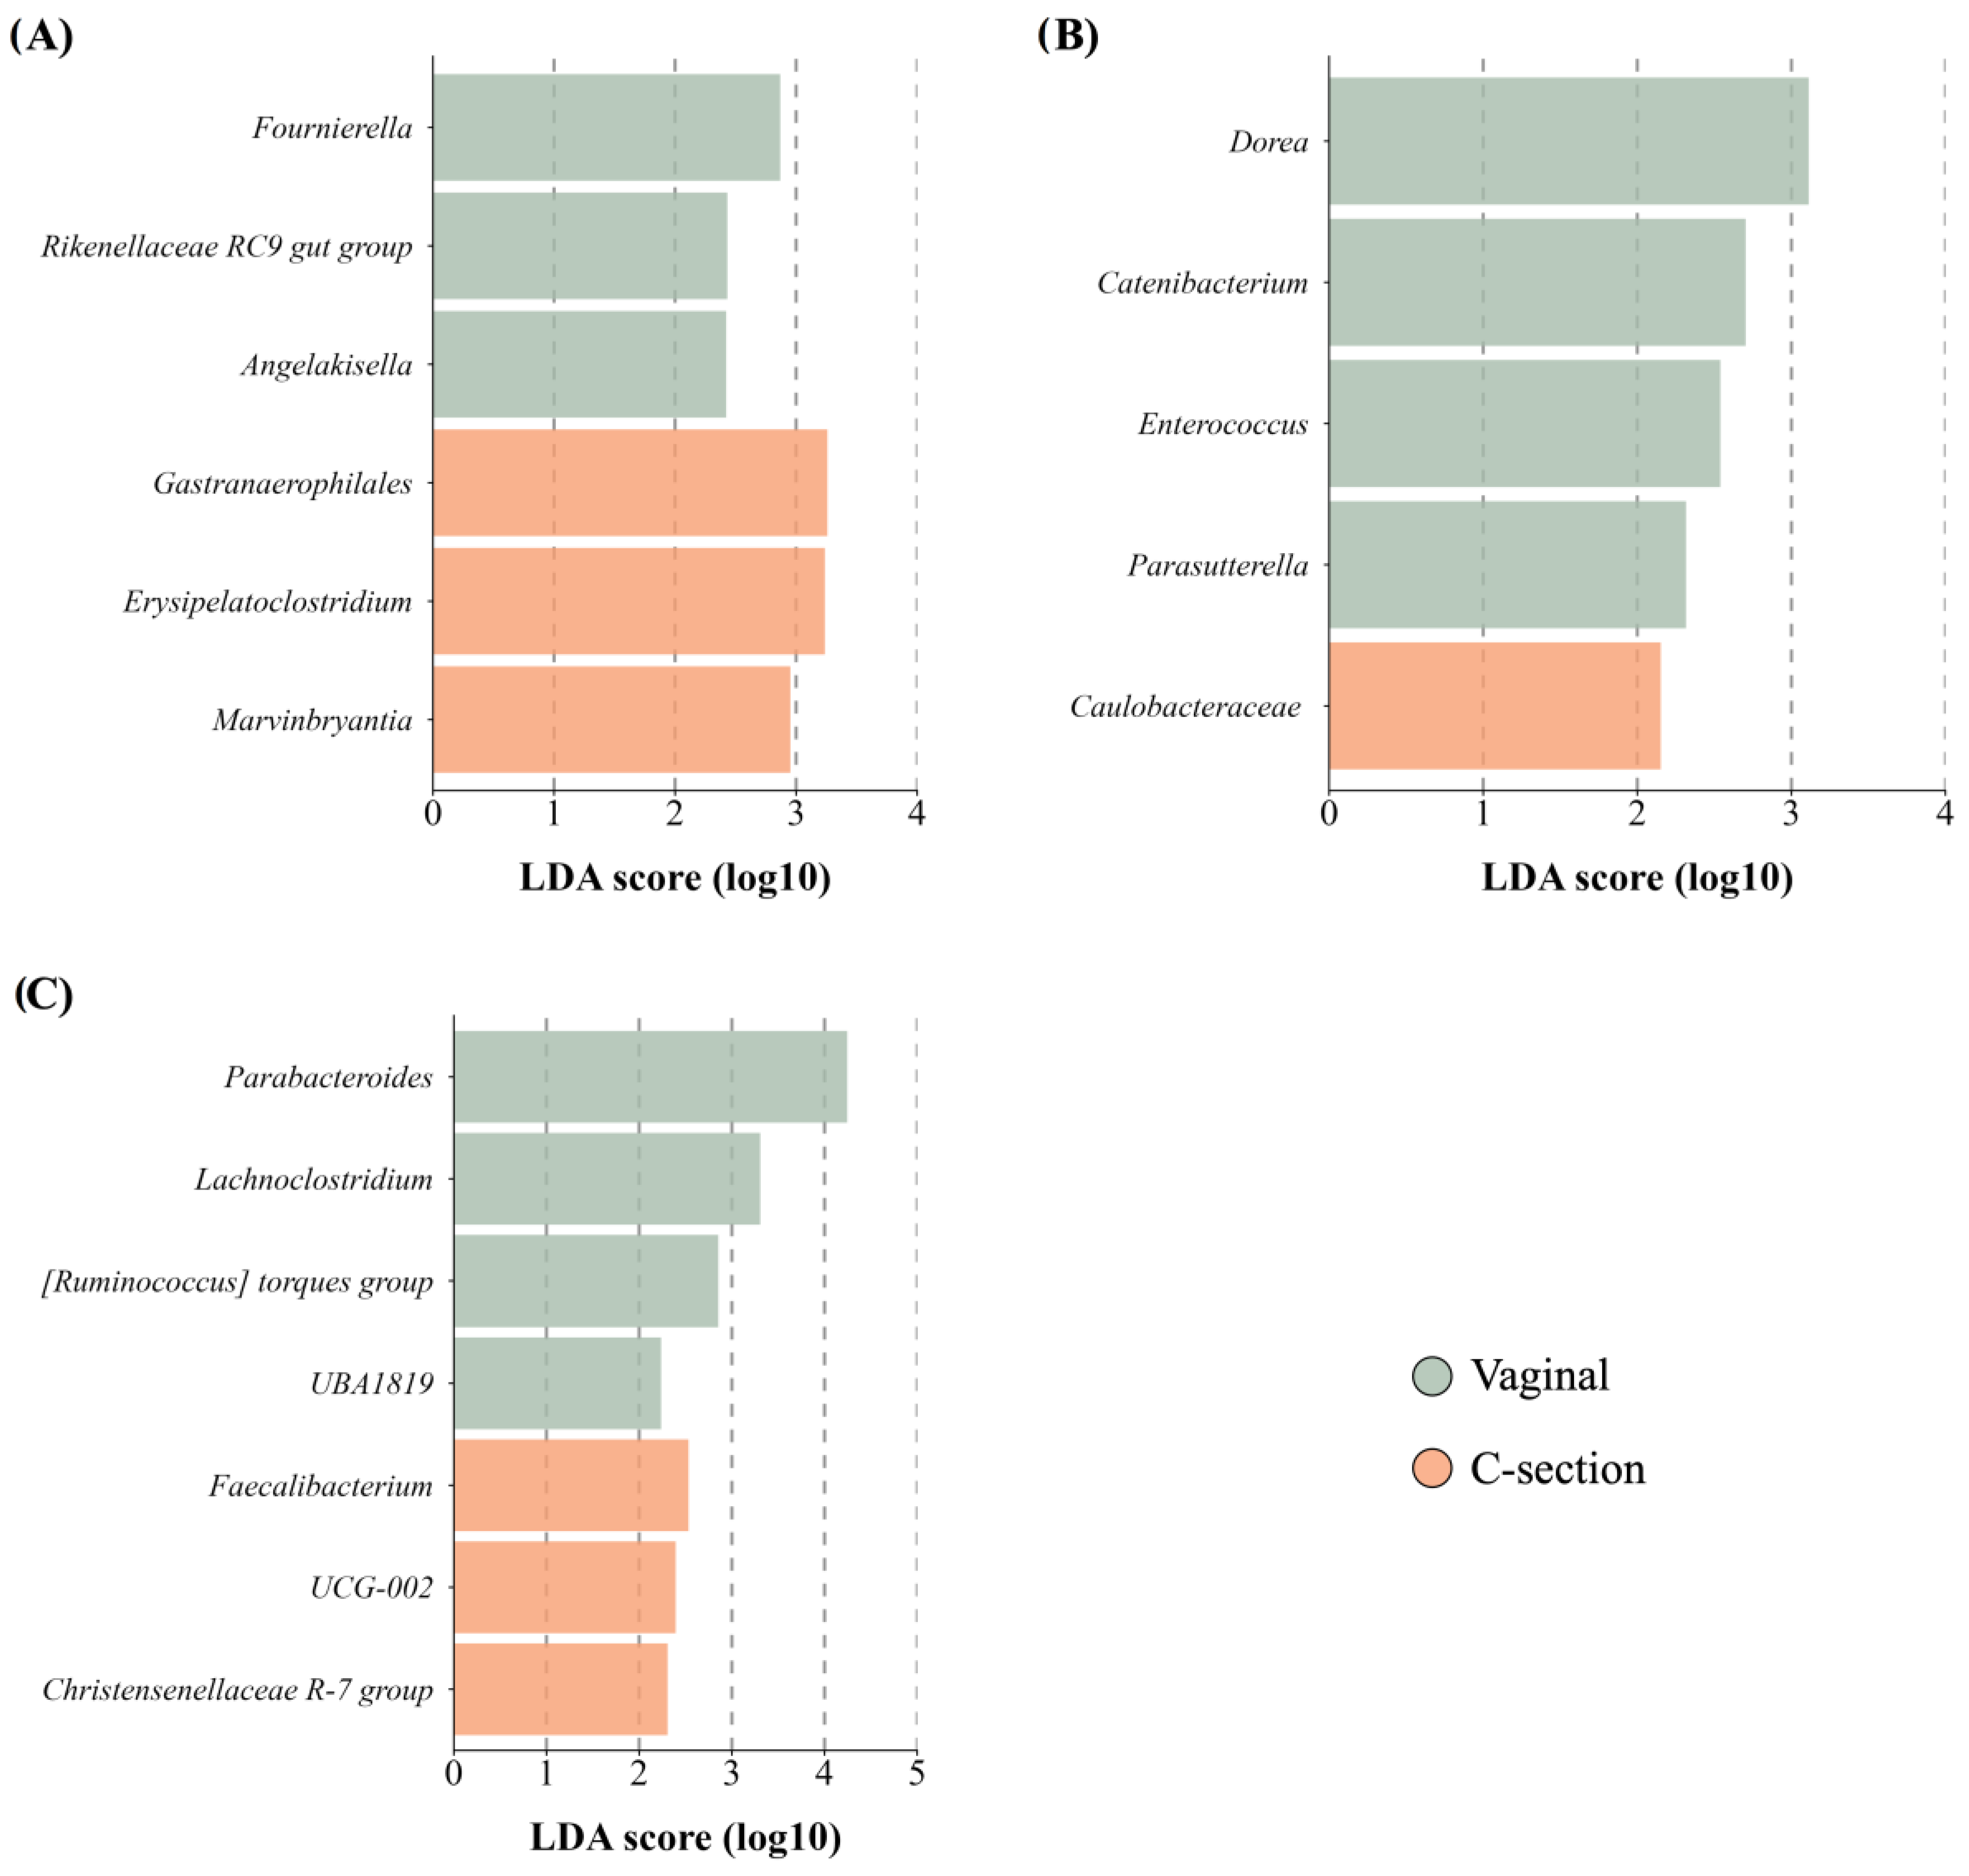
3.4.3. Delivery Mode

While delivery mode did not affect the richness, diversity, or overall structure of the maternal GM and BM microbiota, women who had undergone cesarean delivery were associated with specific alterations in maternal and BM microbiota composition. Women who underwent C-section exhibited a lower abundance in genera from the Ruminococcaceae family, accompanied by an enrichment observed in a minor genus such as Erysipelatoclostridium compared to those women with vaginal delivery (Figure 5A). In addition, BM from women with C-section delivery showed a reduced abundance of the minority genera belonging to the Firmicutes (Figure 5B). Regarding newborn’s GM, while delivery mode did not affect richness, it influenced diversity (p < 0.01) and the community structure (unweighted UniFrac: R2 = 0.04, p = 0.01 and weighted UniFrac: R2 = 0.08, p < 0.01). While GM of C-section newborns indicated higher abundances of bacteria from order Oscillospirales, those born vaginally exhibited a higher abundance of bacteria from the Lachnospiraceae family (Figure 5C).

3.4.4. Newborn Sex

Newborn sex did no impact alpha diversity of maternal gut, BM, or newborn gut microbiota. However, differential analysis revealed distinct microbial profiles. The maternal GM of female newborns displayed higher abundance in different minority genera, such as Stenotrophomonas and Paludicola (Figure 6A). In BM samples from mothers with male newborns, there was an enrichment in the core member Bifidobacterium (Figure 6B), among others. Finally, we identified differences in composition between females and males in their gut microbiota (Figure 6C).

3.5. Exploring the Impact of Maternal and Neonatal Factors on GM and BM Microbiota

Multivariate analysis revealed significant associations between maternal and neonatal factors and the composition of gut and BM microbiota. Maternal age emerged as a key determinant, contributing to 20.9% (p = 0.022) and 14.4% (p = 0.075) of the variation in maternal GM community, as demonstrated by unweighted and weighted UniFrac analyses, respectively (Table 2). Furthermore, maternal age explained 19.4% (p = 0.038) of the total variation in neonatal gut microbiota structure as determined by unweighted UniFrac distance; delivery mode also contributed to 16.3% of the variability but did not reach statistical significance (p = 0.060). Notably, the newborn sex accounted for 29.3% of the variation in the BM microbiota community (p = 0.028).

4. Discussion

Our findings align with previous evidence linking the mother’s total body adiposity and delivery mode to changes in the GM composition in both mothers and newborns, as well as BM. Furthermore, our study highlights the impact of maternal age and newborn sex on the GM of mother–newborn dyads and BM, respectively. These findings represent a significant advancement in our understanding of how various factors influence microbiota in the maternal–infant context, providing new perspectives for future research.
Our study aligns with previous research, revealing that maternal GM reflects typical adult composition [41], and sheds light on postpartum women’s GM, a less explored area [42]. Notably, differences in lactating and nonlactating women’s GM imply persistent post-pregnancy effects [43,44]. Our findings suggest a potential GM imbalance persisting between 20 and 28 days postpartum, possibly aiding microbial translocation to mammary glands [45,46]. The wide variety of genera within the Firmicutes phylum, particularly during lactation, may support maternal gut health via immune stimulation and reduced inflammation through short-chain fatty acids (SCFAs) and lactate production [47,48]. While the lactating women’s GM core remains unclear, certain genera identified are common in healthy adults [49] and may influence gamma-aminobutyric acid production [50], linked to postpartum depression risk reduction [51].
In our study, despite variations in abundance among BM samples from participants, identified taxa are in line with the findings of most studies [15]. Our findings support the notion that breastfeeding provides more than just nutrition; it serves as a natural reservoir of bacterial signatures that are beneficial for newborns’ gastrointestinal and immune system development [52,53].
In neonates, the GM displayed bacterial signatures indicative of early life [54]. Given that the Proteobacteria phylum includes a wide variety of Gram negative potential pathogenic bacteria [55], their presence in the neonatal GM may reflect an evolutionary strategy aimed at stimulating the immune system, increasing its tolerance, and preventing the overgrowth of gut pathogens [56]. In addition, we observed that Bifidobacterium was notably represented alongside bacteria from the Enterobacteriaceae family. This family can create anaerobic conditions [57], allowing the settlement of strictly anaerobic bacteria like Bifidobacterium, Clostridia, and Bacteroides [1]. Bifidobacterium, as a core member in newborn GM, plays a vital role in metabolizing milk oligosaccharides and promoting the maturation of the gastrointestinal and immune system [58].
Our findings demonstrated evidence of the interplay between perinatal factors and the microbiota profiles of gut mothers, BM, and gut newborns. For instance, women with excessive body fat showed alterations in the abundance of several bacterial genera, primarily belonging to the Firmicutes phylum. These changes could potentially influence the host’s energy balance [59] and contribute to a persistent dysbiotic state, with implications for the intergenerational transmission of obesity [60]. Furthermore, women with obesity exhibited a lower abundance of Fusobacterium in the GM, which contradicts its association with obesity and unhealthy metabolism [61,62]. Considering that the GM during pregnancy resembles that of individuals with obesity or diabetes [63], this supports our hypothesis that maternal GM changes could persist until 28 days after childbirth. Additionally, in light of this, the Fusobacterium includes Gram-negative opportunistic anaerobic bacteria [64] that are part of the endogenous microbiota of the oral cavity [65], and that maternal oral microbiota undergo changes during pregnancy, including an increase in the presence of pathogenic bacteria in the oral cavity [66,67]. The lower abundance of Fusobacterium in the GM of women with obesity suggests the possibility of an alteration in the oro–intestinal microbiota axis, as both mutually influence each other through microbial transmission [68]. However, further studies are needed to confirm this hypothesis. It is relevant to mention that although the identified taxa represent a minority, it would be interesting to evaluate whether changes in composition due to nutritional status have the potential to modify the functionality of the maternal GM during lactation. Our findings support the limited impact of BMI and total body fat on BM microbiota, as indicated by a recent review [69]. However, our observation of a reduced abundance of certain bacteria within the Proteobacteria phylum, along with decreased levels of SCFAs-producing bacteria exhibited by the BM from women with excessive body fat, are particularly relevant. This reduction may potentially affect the establishment of the newborn GM, particularly in infants born to mothers with obesity, thereby elevating the risk of inflammatory diseases during childhood, such as atopy or childhood overweight, as suggested in the literature [70,71,72,73,74]. When studying the neonatal microbiota, we consistently observed that maternal BMI did not influence diversity and structure, but total body fat did influence the abundance of different taxa, particularly affecting the core member Staphylococcus. The decreased abundance of Staphylococcus in newborns born to women with elevated adiposity may appear contradictory to previous studies associating Staphylococcus, specifically S. aureus, with obesity [10,75,76,77]. However, these discrepancies could be attributed to the diverse species within the Staphylococcus genus, such as S. epidermidis, which is vertically transmitted from mother to newborn through BM [53,78]. Given that Staphylococcus is part of both the core microbiota of BM and newborn gut, we suggest further investigation using more specific approaches.
According to maternal age, we observed differences in the gut microbiota between younger and older mothers, which also extended to the gut microbiota of their newborns. Maternal GM exhibited distinct clustering patterns, with an enrichment of genera within the Bacteroidota phylum among mature women. Surprisingly, offspring born to mature women not only displayed a lower richness but also showed a decreased abundance of Bacteroides, contrary to expectations based on maternal profiles. This reduction was evident among other members within the Bacteroidales order, which play crucial roles in immune system development [79,80]. We observe subtle differences in BM, suggesting the possibility that maternal age may influence neonatal gut microbiota independently of BM microbiota. However, we acknowledge studies that have found differences in terms of age [9,12,13]. These distinctions in BM microbiota could be due to several factors, including changes in the mammary gland over a woman’s lifespan [9,81], alongside methodological variations. Therefore, it would be interesting to evaluate whether these changes are due to intrinsic aging processes linked with progressive loss of intestinal and immune homeostasis [82] or factors associated with age such as modifications in diet, social environment, medication use, and decreased physical activity [83,84].
In relation to delivery mode, we noted a decrease in the abundance of certain obligate anaerobes, such as members of the Ruminococcaceae family, in women who underwent C-sections, consistent with previous findings [14]. This alteration could be attributed to abdominal trauma resulting from the C-section procedure, potentially affecting the maternal gut microenvironment, and leading to a reduction in the abundance of anaerobic bacteria. Moreover, disparities were noted between BM samples from women who had vaginal deliveries and those who underwent cesarean sections, with the latter exhibiting lower levels of anaerobic bacteria. Therefore, alterations in the maternal gut environment may influence the composition of less prevalent microbiota members found in BM. While these changes in the gut and BM microbiota may be imperceptible, they undoubtedly impact the neonatal GM. Cesarean section is recognized as a factor capable of disrupting the establishment and development of the GM [17,85]. Our study identified distinct patterns in the abundance of SCFA-producing bacteria, with a lower abundance of Lachnospiraceae bacteria in the gut microbiota of neonates delivered by cesarean section, consistent with existing evidence [85]. The altered profile caused by C-section may disrupt microbial community ecology during establishment [86], along with functional repertoires involved in metabolic and immune responses [85,87]. However, the long-term effects of C-sections in our study population need to be assessed, considering the increasing use of elective C-sections. It is crucial to determine whether observed differences are specifically linked to C-sections or related factors such as antibiotic treatment, medications, or exposure to controlled environments [88]. The majority (57.9%) of participants in our study were unaware of the specific type of antibiotic that they were prescribed. Among those who provided information, cefalosporin was the most frequently (26.3%) mentioned antibiotic. Due to the wide range of antibiotic types and limited data, we were unable to conduct a robust statistical analysis of the antibiotics’ impact on the composition of the microbiota. As per the clinical practice guidelines of our country, prophylactic antibiotics are commonly administered during cesarean sections, with cefalosporin being one of the most frequently used due to its broad spectrum and low bacterial resistance.
According to newborn sex, the multivariate analysis allowed us to propose that neonatal sex explains a portion of the variation in the microbiota composition from BM. For instance, BM from women with males showed enrichment in Bifidobacterium, a keystone genus involved in GM establishment. This finding supports the hypothesis that BM may be sex-specific and provide additional protection to male newborns in response to “male disadvantage” [89,90], although the underlying mechanism remains unknown. Furthermore, we observed a higher abundance of Stenotrophomonas, an efficient estrogen degrader, and Pladulicolla, a genus belonging to the Ruminoccoccacea family, positively associated with systemic nonovarian estrogen, and related to the ability to metabolize steroids [91,92], in samples from women who had females. Moreover, we identified differential composition between females and males, possibly due to changes related to sex hormones, although these became more evident after puberty [93].
Our study presents the following points to be highlighted and certain limitations. We are among the pioneering studies to conduct a comprehensive assessment of several factors, including maternal BMI and total body fat, age, delivery mode, and newborn sex, and their influence on the diversity and composition of both maternal and newborn gut and BM microbiota simultaneously. We meticulously controlled for variables such as newborns’ gestational age, parity, lactation stage, and feeding mode during our analysis, albeit resulting in the exclusion of a considerable number of mother–newborn dyads. To enhance accuracy, we incorporated total adiposity measurements alongside BMI, recognizing the limitations of BMI as a sole indicator. We also implemented rigorous procedures to ensure the robustness of our methodology. Thorough cleaning and emptying of both breasts were conducted to minimize potential biases in sampling, and stringent quality control measures were applied, including the use of negative controls throughout the sample extraction, library preparation, and sequencing processes to identify and eliminate contaminant reads.
However, limitations include the use of 16S rRNA sequencing, which may introduce technical biases, and the exclusion of other potential microbial niches. Additionally, the sample size is limited, warranting caution in interpretation, and highlighting the need for larger cohorts to validate and expand upon our findings.

5. Conclusions

Overall, we provided valuable insights into the determinants of both maternal and newborn gut microbiota as well as BM microbiota composition; mainly, we contributed new evidence highlighting the influence of maternal age and newborn sex. Maternal BMI and total body fat, age, delivery mode, and newborn sex were found to have significant associations with microbial profiles. These findings contribute to understanding the complex interplay between maternal factors and the microbial communities that shape early-life gut and BM microbiota. However, further research is essential to fully elucidate the mechanisms underlying these associations and their long-term implications for interventions or therapeutic strategies targeting maternal and neonatal microbiome. Specifically, future studies should incorporate longitudinal designs and employ more comprehensive characterization of microbial species to unravel the related health outcomes.

Supplementary Materials

The following supporting information can be downloaded at: https://www.mdpi.com/article/10.3390/microorganisms12112142/s1, Tables S1: Maternal gut microbiota composition at phylum level; Table S2: Maternal gut microbiota composition at genus level stratified by phylum; Table S3: Breast milk microbiota composition at phylum level; Table S4: Breast milk microbiota composition at genus level stratified by phylum; Table S5: Newborn gut microbiota composition at phylum level; Table S6: Newborn gut microbiota composition at genus level stratified by phylum.

Author Contributions

Conceptualization, M.R.-C.; methodology, E.C.-M., I.C.Z.-M., J.V.-M., F.V.C.-S. and B.E.L.-C.; software, E.C.-M. and S.M.-R.; validation, S.M.-R., B.E.L.-C. and S.C.-Q.; formal analysis, M.R.-C., S.M.-R. and S.C.-Q.; investigation, E.C.-M., I.C.Z.-M., J.V.-M. and F.V.C.-S.; resources, M.R.-C. and S.C.-Q.; data curation, E.C.-M. and S.M.-R.; writing—original draft preparation, E.C.-M. and M.R.-C.; writing—review and editing, E.C.-M., I.C.Z.-M., S.C.-Q., S.M.-R., J.V.-M., B.E.L.-C., F.V.C.-S. and M.R.-C.; supervision, M.R.-C., S.M.-R. and S.C.-Q.; project administration and funding acquisition, M.R.-C. All authors have read and agreed to the published version of the manuscript.

Funding

This research was funded by Consejo Nacional de Humanidades, Ciencias y Tecnologías (CONAHCYT); grant number: SALUD-2017-289661.

Data Availability Statement

Raw data supporting the findings of the present research will be made available by the authors upon request.

Acknowledgments

We are grateful to the mothers and their babies who participated in this study and the medical staff from Family Medicine Units 4, 10, and 28 of the Instituto Mexicano del Seguro Social, Mexico City, Mexico, for supporting the recruitment of participants for this research. In addition, we want to thank Juan M. Rodríguez from the Complutense University of Madrid for reviewing the final manuscript. This work fulfills part of the requirements to obtain the Ph.D. degree of E.C.-M. at the Programa de Doctorado en Ciencias Biológicas at UNAM, whose scholarship was supported by CONAHCYT (No. 737879).

Conflicts of Interest

The authors declare no conflicts of interest.

References

  1. Ghosh, T.S.; Shanahan, F.; O’Toole, P.W. The gut microbiome as a modulator of healthy aging. Nat. Rev. Gastroenterol. Hepatol. 2022, 19, 565–584. [Google Scholar] [CrossRef]
  2. Bäckhed, F.; Roswall, J.; Peng, Y.; Feng, Q.; Jia, H.; Kovatcheva-Datchary, P.; Li, Y.; Xia, Y.; Xie, H.; Zhong, H.; et al. Dynamics and stabilization of the human gut microbiome during the first year of life. Cell Host Microbe 2015, 17, 690–703. [Google Scholar] [CrossRef] [PubMed]
  3. Walker, W.A. The importance of appropriate initial bacterial colonization of the intestine in newborn, child, and adult health. Pediatr. Res. 2017, 82, 387–395. [Google Scholar] [CrossRef]
  4. Moossavi, S.; Azad, M.B. Origins of human milk microbiota: New evidence and arising questions. Gut Microbes 2020, 12, 1667722. [Google Scholar] [CrossRef]
  5. Fernández, L.; Pannaraj, P.S.; Rautava, S.; Rodríguez, J.M. The Microbiota of the human mammary ecosystem. Front. Cell Infect. Microbiol. 2020, 10, 586667. [Google Scholar] [CrossRef] [PubMed]
  6. Hasan, N.; Yang, H. Factors affecting the composition of the gut microbiota, and its modulation. PeerJ 2019, 7, e7502. [Google Scholar] [CrossRef] [PubMed]
  7. Cabrera-Rubio, R.; Collado, M.C.; Laitinen, K.; Salminen, S.; Isolauri, E.; Mira, A. The human milk microbiome changes over lactation and is shaped by maternal weight and mode of delivery. Am. J. Clin. Nutr. 2012, 96, 544–551. [Google Scholar] [CrossRef]
  8. Davé, V.; Street, K.; Francis, S.; Bradman, A.; Riley, L.; Eskenazi, B.; Holland, N. Bacterial microbiome of breast milk and child saliva from low-income Mexican-American women and children. Pediatr. Res. 2016, 79, 846–854. [Google Scholar] [CrossRef]
  9. López-Leyva, L.; González, E.; Li, C.; Ajeeb, T.; Solomons, N.W.; Agellon, L.B.; E Scott, M.; Koski, K.G. Human milk microbiota in an indigenous population is associated with maternal factors, stage of lactation, and breastfeeding practices. Curr. Dev. Nutr. 2021, 5, nzab013. [Google Scholar] [CrossRef]
  10. Dreisbach, C.; Prescott, S.; Alhusen, J. Influence of maternal prepregnancy obesity and excessive gestational weight gain on maternal and child gastrointestinal microbiome composition: A Systematic Review. Biol. Res. Nurs. 2020, 22, 114–125. [Google Scholar] [CrossRef]
  11. Huang, Y.; Li, D.; Cai, W.; Zhu, H.; Shane, M.I.; Liao, C.; Pan, S. Distribution of vaginal and gut microbiome in advanced maternal age. Front. Cell. Infect. Microbiol. 2022, 12, 819802. [Google Scholar] [CrossRef]
  12. Ojo-Okunola, A.; Claassen-Weitz, S.; Mwaikono, K.S.; Gardner-Lubbe, S.; Stein, D.J.; Zar, H.J.; Nicol, M.P.; du Toit, E. Influence of socio-economic and psychosocial profiles on the human breast milk bacteriome of south African women. Nutrients 2019, 11, 1390. [Google Scholar] [CrossRef] [PubMed]
  13. Cortés-Macías, E.; Selma-Royo, M.; Martínez-Costa, C.; Collado, M.C. Breastfeeding practices influence the breast milk microbiota depending on pre-gestational maternal BMI and weight gain over pregnancy. Nutrients 2021, 13, 1518. [Google Scholar] [CrossRef] [PubMed]
  14. Selma-Royo, M.; García-Mantrana, I.; Calatayud, M.; Parra-Llorca, A.; Martínez-Costa, C.; Collado, M.C. Maternal microbiota, cortisol concentration, and post-partum weight recovery are dependent on mode of delivery. Nutrients 2020, 12, 1779. [Google Scholar] [CrossRef] [PubMed]
  15. Zimmermann, P.; Curtis, N. Breast milk microbiota: A review of the factors that influence composition. J. Infect. 2020, 81, 17–47. [Google Scholar] [CrossRef]
  16. Moossavi, S.; Sepehri, S.; Robertson, B.; Bode, L.; Goruk, S.; Field, C.J.; Lix, L.M.; de Souza, R.J.; Becker, A.B.; Mandhane, P.J.; et al. Composition and variation of the human milk microbiota are influenced by maternal and early-life factors. Cell Host Microbe 2019, 25, 324–335. [Google Scholar] [CrossRef]
  17. Zhang, C.; Li, L.; Jin, B.; Xu, X.; Zuo, X.; Li, Y.; Li, Z. The effects of delivery mode on the gut microbiota and health: State of Art. Front. Microbiol. 2021, 12, 4084. [Google Scholar] [CrossRef]
  18. Williams, J.E.; Carrothers, J.M.; Lackey, K.A.; Beatty, N.F.; York, M.A.; Brooker, S.L.; Shafii, B.; Price, W.J.; Settles, M.L.; A McGuire, M.; et al. Human milk microbial community structure is relatively stable and related to variations in macronutrient and micronutrient intakes in healthy lactating women. J. Nutr. 2017, 147, 1739–1748. [Google Scholar] [CrossRef]
  19. Chen, J.; Li, H.; Hird, S.M.; Chen, M.H.; Xu, W.; Maas, K.; Cong, X. Sex differences in gut microbial development of preterm infant twins in early life: A longitudinal analysis. Front. Cell. Infect. Microbiol. 2021, 11, 671074. [Google Scholar] [CrossRef]
  20. Shah, N.R.; Braverman, E.R. Measuring adiposity in patients: The utility of body mass index (BMI), percent body fat, and leptin. PLoS ONE 2012, 7, e3308. [Google Scholar] [CrossRef]
  21. Hausman Kedem, M.; Mandel, D.; Domani, K.A.; Mimouni, F.B.; Shay, V.; Maron, R.; Dollberg, S.; Herman, L.; Lubetzky, R. The effect of advanced maternal age upon human milk fat content. Breastfeed. Med. 2013, 8, 116–119. [Google Scholar] [CrossRef] [PubMed]
  22. Lubetzky, R.; Sever, O.; Mimouni, F.B.; Mandel, D. Human milk macronutrients content: Effect of advanced maternal age. Breastfeed. Med. 2015, 10, 433–436. [Google Scholar] [CrossRef] [PubMed]
  23. Badillo-Suárez, P.A.; Rodríguez-Cruz, M.; Bernabe-García, M.; Villa-Morales, J.; Iglesias-Rodríguez, R.; Canizales-Quinteros, S.; Carmona-Sierra, F.V. Influence of maternal body fat on insulin levels, insulin-like growth factor-1, and obestatin. J. Hum. Lact. 2022, 38, 619–632. [Google Scholar] [CrossRef]
  24. López-Contreras, B.E.; Morán-Ramos, S.; Villarruel-Vázquez, R.; Macías-Kauffer, L.; Villamil-Ramírez, H.; León-Mimila, P.; Vega-Badillo, J.; Sánchez-Muñoz, F.; Llanos-Moreno, L.E.; Canizalez-Román, A.; et al. Composition of gut microbiota in obese and normal-weight Mexican school-age children and its association with metabolic traits. Pediatr. Obes. 2017, 13, 381–388. [Google Scholar] [CrossRef]
  25. Andrews, S. FastQC. 2015. Available online: https://qubeshub.org/resources/fastqc (accessed on 3 December 2022).
  26. Bolyen, E.; Rideout, J.R.; Dillon, M.R.; Bokulich, N.A.; Abnet, X.X.; Al-Ghalith, G.A.; Caporaso, J.G. Reproducible, interactive, scalable and extensible microbiome data science using QIIME2. Nat. Biotechnol. 2019, 37, 852–857. [Google Scholar] [CrossRef] [PubMed]
  27. Callahan, B.J.; McMurdie, P.J.; Rosen, M.J.; Han, A.W.; Johnson, A.J.A.; Holmes, S.P. DADA2: High-resolution sample inference from Illumina amplicon data. Nat. Methods 2016, 13, 581–583. [Google Scholar] [CrossRef] [PubMed]
  28. Yilmaz, P.; Parfrey, L.W.; Yarza, P.; Gerken, J.; Pruesse, E.; Quast, C.; Glöckner, F.O. The SILVA and “all-species Living Tree Project (LTP)” taxonomic frameworks. Nucleic Acids Res. 2014, 42, D643–D648. [Google Scholar] [CrossRef]
  29. R Core Team. R: A Language and Environment for Statistical Computing; R Foundation for Statistical Computing: Vienna, Austria, 2021. [Google Scholar]
  30. Bisanz, J.E. qiime2R. Importing QIIME2 Artifacts and Associated Data into R Sessions. Version 0.99. 2018, Volume 13. Available online: https://github.com/jbisanz/qiime2R (accessed on 3 December 2022).
  31. RStudio Team. RStudio: Integrated Development Environment for R; RStudio PBC: Boston, MA, USA, 2022. [Google Scholar]
  32. McMurdie, P.J.; Holmes, S. Phyloseq: An R package for reproducible interactive analysis and graphics of microbiome census data. PLoS ONE 2013, 8, e61217. [Google Scholar] [CrossRef]
  33. Lahti, L.; Shetty, S. Introduction to the Microbiome R Package. Available online: https://microbiome.github.io/tutorials/ (accessed on 3 December 2022).
  34. Wickham, H.; Averick, M.; Bryan, J.; Chang, W.; McGowan, L.; François, R.; Grolemund, G.; Hayes, A.; Henry, L.; Hester, J.; et al. Welcome to the tidyverse. J. Open Source Softw. 2019, 4, 1686. [Google Scholar] [CrossRef]
  35. Oksanen, J.; Blanchet, F.G.; Friendly, M.; Kindt, R.; Legendre, P.; McGlinn, D.; Minchin, P.R. Vegan: Community Ecology Package. R Package Version 2.5-6. Available online: https://github.com/vegandevs/vegan (accessed on 3 December 2022).
  36. Paradis, E.; Schliep, K. Ape 5.0: An environment for modern phylogenetics and evolutionary analyses in R. Bioinformatics 2019, 35, 526–528. [Google Scholar] [CrossRef]
  37. Davis, N.M.; Proctor, D.M.; Holmes, S.P.; Relman, D.A.; Callahan, B.J. Simple statistical identification and removal of contaminant sequences in marker-gene and metagenomics data. Microbiome 2018, 6, 226. [Google Scholar] [CrossRef] [PubMed]
  38. Risely, A. Applying the core microbiome to understand host–microbe systems. J. Anim. Ecol. 2020, 89, 1549–1558. [Google Scholar] [CrossRef]
  39. Segata, N.; Izard, J.; Waldron, L.; Gevers, D.; Miropolsky, L.; Garrett, W.S.; Huttenhower, C. Metagenomic biomarker discovery and explanation. Genome Biol. 2011, 12, R60. [Google Scholar] [CrossRef] [PubMed]
  40. Verdam, F.J.; Fuentes, S.; de Jonge, C.; Zoetendal, E.G.; Erbil, R.; Greve, J.W.; Buurman, W.A.; de Vos, W.M.; Rensen, S.S. Human intestinal microbiota composition is associated with local and systemic inflammation in obesity. Obesity 2013, 21, E607–E615. [Google Scholar] [CrossRef] [PubMed]
  41. Rinninella, E.; Raoul, P.; Cintoni, M.; Franceschi, F.; Miggiano, G.A.D.; Gasbarrini, A.; Mele, M.C. What is the healthy gut microbiota composition? A changing ecosystem across age, environment, diet, and diseases. Microorganisms 2019, 7, 14. [Google Scholar] [CrossRef]
  42. Carrothers, J.M.; York, M.A.; Brooker, S.L.; Lackey, K.A.; Williams, J.E.; Shafii, B.; Price, W.J.; Settles, M.L.; A McGuire, M.; McGuire, M.K. Fecal microbial community structure is stable over time and related to variation in macronutrient and micronutrient intakes in lactating women1-3. J. Nutr. 2015, 145, 2379–2388. [Google Scholar] [CrossRef]
  43. Haddad, E.N.; Ferro, L.E.; Russell, K.E.B.; Sugino, K.Y.; Kerver, J.M.; Comstock, S.S. Fecal bacterial communities differ by lactation status in post-partum women and their infants. J. Hum. Lact. 2022, 38, 270–280. [Google Scholar] [CrossRef]
  44. Weerasuriya, W.; Saunders, J.E.; Markel, L.; Ho, T.T.; Xu, K.; Lemas, D.J.; Groer, M.W.; Louis-Jacques, A.F. Maternal gut microbiota in the post-partum Period: A Systematic review. Eur. J. Obstet. Gynecol. Reprod. Biol. 2023, 285, 130–147. [Google Scholar] [CrossRef]
  45. Guo, M.; Cao, X.; Zhang, K.; Pan, M.; Wu, Y.; Langda, S.; Yang, Y.; Chen, Y.; Gui, B.; Ma, B. 16S rRNA gene sequencing revealed changes in gut microbiota composition during pregnancy and lactation in mice model. Vet. Sci. 2022, 9, 169. [Google Scholar] [CrossRef]
  46. Rodríguez, J.M. The origin of human milk bacteria: Is there a bacterial entero-mammary pathway during late pregnancy and lactation? Adv. Nutr. 2014, 5, 779–784. [Google Scholar] [CrossRef]
  47. Franco-Esquivias, A.P.; Peña, C.G.; Torres-Lozano, C.; Vaca-Paniagua, F.; Díaz-Velásquez, C.; Ortega-Cisneros, M.; Quintero-Ramos, A. Gut microbiota in Mexican patients with common variable immunodeficiency. Gac. Med. Mex. 2019, 155, 447–452. [Google Scholar] [CrossRef] [PubMed]
  48. Takada, T.; Kurakawa, T.; Tsuji, H.; Nomoto, K. Fusicatenibacter saccharivorans gen. nov., sp. nov., isolated from human faeces. Int. J. Syst. Evol. Microbiol. 2013, 63, 3691–3696. [Google Scholar] [CrossRef] [PubMed]
  49. Piquer-Esteban, S.; Ruiz-Ruiz, S.; Arnau, V.; Diaz, W.; Moya, A. Exploring the universal healthy human gut microbiota around the World. Comput. Struct. Biotechnol. J. 2022, 20, 421–433. [Google Scholar] [CrossRef]
  50. Strandwitz, P.; Kim, K.H.; Terekhova, D.; Liu, J.K.; Sharma, A.; Levering, J.; McDonald, D.; Dietrich, D.; Ramadhar, T.R.; Lekbua, A.; et al. GABA Modulating Bacteria of the Human Gut Microbiota. Nat. Microbiol. 2019, 4, 396–403. [Google Scholar] [CrossRef] [PubMed]
  51. Edinoff, A.N.; Odisho, A.S.; Lewis, K.; Kaskas, A.; Hunt, G.; Cornett, E.M.; Urits, I. Brexanolone, a GABAA modulator, in the treatment of post-partum depression in adults: A comprehensive review. Front. Psychiatry 2021, 2, 699740. [Google Scholar]
  52. Civardi, E.; Garofoli, F.; Tzialla, C.; Paolillo, P.; Bollani, L.; Stronati, M. Microorganisms in human milk: Lights and shadows. J. Matern-Fetal Neonatal Med. 2013, 26 (Suppl. S2), 30–34. [Google Scholar] [CrossRef]
  53. Lyons, K.E.; Ryan, C.A.; Dempsey, E.M.; Ross, R.P.; Stanton, C. Breast milk, a source of beneficial microbes and associated benefits for infant health. Nutrients 2020, 12, 1039. [Google Scholar] [CrossRef]
  54. Lugli, G.A.; Mancabelli, L.; Milani, C.; Fontana, F.; Tarracchini, C.; Alessandri, G.; van Sinderen, D.; Turroni, F.; Ventura, M. Comprehensive insights from composition to functional microbe-based biodiversity of the infant human gut microbiota. NPJ Biofilms Microbiomes 2023, 9, 25. [Google Scholar] [CrossRef]
  55. Rizzatti, G.; Lopetuso, L.R.; Gibiino, G.; Binda, C.; Gasbarrini, A. Proteobacteria: A common factor in human diseases. Biomed. Res. Int. 2017, 2017, 9351507. [Google Scholar] [CrossRef]
  56. Camacho-Morales, A.; Caba, M.; García-Juárez, M.; Caba-Flores, M.D.; Viveros-Contreras, R.; Martínez-Valenzuela, C. Breastfeeding contributes to physiological immune programming in the newborn. Front. Pediatr. 2021, 9, 744104. [Google Scholar] [CrossRef]
  57. Litvak, Y.; Mon, K.K.Z.; Nguyen, H.; Chanthavixay, G.; Liou, M.; Velazquez, E.M.; Kutter, L.; Alcantara, M.A.; Byndloss, M.X.; Tiffany, C.R.; et al. Commensal enterobacteriaceae protect against Salmonella colonization through oxygen competition. Cell Host Microbe 2019, 25, 128–139. [Google Scholar] [CrossRef] [PubMed]
  58. Stuivenberg, G.A.; Burton, J.P.; Bron, P.A.; Reid, G. Why are bifidobacteria important for infants? Microorganisms 2022, 10, 278. [Google Scholar] [CrossRef]
  59. Zsálig, D.; Berta, A.; Tóth, V.; Szabó, Z.; Simon, K.; Figler, M.; Pusztafalvi, H.; Polyák, É. A review of the relationship between gut microbiome and obesity. Appl. Sci. 2023, 13, 610. [Google Scholar] [CrossRef]
  60. Tang, M.; Marroquin, E. The role of the gut microbiome in the intergenerational transmission of the obesity phenotype: A narrative review. Front. Med. 2022, 9, 1057424. [Google Scholar] [CrossRef] [PubMed]
  61. Crovesy, L.; Masterson, D.; Rosado, E.L. Profile of the gut microbiota of adults with obesity: A systematic review. Eur. J. Clin. Nutr. 2020, 74, 1251–1262. [Google Scholar] [CrossRef]
  62. Kim, M.H.; Yun, K.E.; Kim, J.; Park, E.; Chang, Y.; Ryu, S.; Kim, H.-L.; Kim, H.-N. Gut microbiota and metabolic health among overweight and obese individuals. Sci. Rep. 2020, 10, 19417. [Google Scholar] [CrossRef]
  63. Liu, Z.Z.; Sun, J.H.; Wang, W.J. Gut microbiota in gastrointestinal diseases during pregnancy. World J. Clin. Cases 2022, 10, 2976–2989. [Google Scholar] [CrossRef]
  64. James Booth, S. Fusobacterium Infections. In Reference Module in Biomedical Sciences; Elsevier: Amsterdam, The Netherlands, 2014. [Google Scholar]
  65. Mark, J.L.; Rossetti, B.J.; Rieken, C.W.; Dewhirst, F.E.; Borisy, G.G. Biogeography of a human oral microbiome at the micron scale. Proc. Natl. Acad. Sci. USA 2016, 113, E791–E800. [Google Scholar]
  66. Balan, P.; Chong, Y.S.; Umashankar, S.; Swarup, S.; Loke, W.M.; Lopez, V.; Seneviratne, C.J. Keystone Species in Pregnancy Gingivitis: A snapshot of oral microbiome during pregnancy and post-partum period. Front. Microbiol. 2018, 9, 2360. [Google Scholar] [CrossRef]
  67. Dessí, A.; Bosco, A.; Pintus, R.; Orrú, G.; Fanos, V. Fusobacterium nucleatum and alteration of the oral microbiome: From pregnancy to SARS-COV-2 infection. Eur. Rev. Med. Pharmacol. Sci. 2021, 25, 4579–4596. [Google Scholar]
  68. Park, S.Y.; Hwang, B.O.; Lim, M.; Ok, S.H.; Lee, S.K.; Chun, K.S.; Park, K.-K.; Hu, Y.; Chung, W.-Y.; Song, N.-Y. Oral–gut microbiome axis in gastrointestinal disease and cancer. Cancers 2021, 13, 2124. [Google Scholar] [CrossRef] [PubMed]
  69. Daiy, K.; Harries, V.; Nyhan, K.; Marcinkowska, U.M. Maternal weight status and the composition of the human milk microbiome: A scoping review. PLoS ONE 2022, 17, e0274950. [Google Scholar] [CrossRef] [PubMed]
  70. Jian, C.; Carpén, N.; Helve, O.; De Vos, W.M.; Korpela, K.; Salonen, A. Early-life gut microbiota and its connection to metabolic health in children: Perspective on ecological drivers and need for quantitative approach. eBioMedicine 2021, 69, 103475. [Google Scholar] [CrossRef]
  71. Gilley, S.P.; Ruebel, M.L.; Sims, C.; Zhong, Y.; Turner, D.; Lan, R.S.; Pack, L.M.; Piccolo, B.D.; Chintapalli, S.V.; Abraham, A.; et al. Associations between maternal obesity and offspring gut microbiome in the first year of life. Pediatr. Obes. 2022, 17, e12921. [Google Scholar] [CrossRef] [PubMed]
  72. Stinson, L.F.; Gay, M.C.L.; Koleva, P.T.; Eggesbø, M.; Johnson, C.C.; Wegienka, G.; du Toit, E.; Shimojo, N.; Munblit, D.; Campbell, D.E.; et al. Human milk from atopic mothers has lower levels of short chain fatty acids. Front. Immunol. 2020, 11, 1427. [Google Scholar] [CrossRef] [PubMed]
  73. Toscano, M.; De Grandi, R.; Grossi, E.; Drago, L. Role of the human breast milk-associated microbiota on the newborns’ immune system: A mini review. Front. Microbiol. 2017, 8, 2100. [Google Scholar] [CrossRef]
  74. Wang, L.C.; Huang, Y.M.; Lu, C.; Chiang, B.; Shen, Y.; Huang, H.; Lee, C.; Su, N.; Lin, B. Lower caprylate and acetate levels in the breast milk is associated with atopic dermatitis in infancy. Pediatr. Allergy Immunol. 2022, 33, e13744. [Google Scholar] [CrossRef]
  75. Collado, M.C.; Isolauri, E.; Laitinen, K.; Salminen, S. Distinct composition of gut microbiota during pregnancy in overweight and normal-weight women. Am. J. Clin. Nutr. 2008, 88, 894–899. [Google Scholar] [CrossRef]
  76. Kalliomäki, M.; Collado, M.C.; Salminen, S.; Isolauri, E. Early differences in fecal microbiota composition in children may predict overweight. Am. J. Clin. Nutr. 2008, 87, 534–538. [Google Scholar] [CrossRef]
  77. Santacruz, A.; Collado, M.C.; García-Valdés, L.; Segura, M.T.; Martín-Lagos, J.A.; Anjos, T.; Martí-Romero, M.; Lopez, R.M.; Florido, J.; Campoy, C.; et al. Gut microbiota composition is associated with body weight, weight gain and biochemical parameters in pregnant women. Br. J. Nutr. 2010, 104, 83–92. [Google Scholar] [CrossRef]
  78. Jost, T.; Lacroix, C.; Braegger, C.P.; Rochat, F.; Chassard, C. Vertical mother–neonate transfer of maternal gut bacteria via breastfeeding. Environ. Microbiol. 2014, 16, 2891–2904. [Google Scholar] [CrossRef] [PubMed]
  79. Kuhn, K.A.; Schulz, H.M.; Regner, E.H.; Severs, E.L.; Hendrickson, J.D.; Mehta, G.; Whitney, A.K.; Ir, D.; Ohri, N.; E Robertson, C.; et al. Bacteroidales recruit IL-6-producing intraepithelial lymphocytes in the colon to promote barrier integrity. Mucosal Immunol. 2018, 11, 357–368. [Google Scholar] [CrossRef] [PubMed]
  80. Roelofs, K.G.; Coyne, M.J.; Gentyala, R.R.; Chatzidaki-Livanis, M.; Comstock, L.E. Bacteroidales secreted antimicrobial proteins target surface molecules necessary for gut colonization and mediate competition in vivo. mBio 2016, 7, 10–1128. [Google Scholar] [CrossRef] [PubMed]
  81. Ginger, M.R.; Rosen, J.M. Pregnancy-induced changes in cell-fate in the mammary gland. Breast Cancer Res. 2003, 5, 192. [Google Scholar] [CrossRef]
  82. Walrath, T.; Dyamenahalli, K.U.; Hulsebus, H.J.; McCullough, R.L.; Idrovo, J.P.; Boe, D.M.; Kovacs, E.J. Age-related changes in intestinal immunity and the microbiome. J. Leukoc. Biol. 2021, 109, 1045–1061. [Google Scholar] [CrossRef]
  83. Bosco, N.; Noti, M. The aging gut microbiome and its impact on host immunity. Genes Immun. 2021, 22, 289–303. [Google Scholar] [CrossRef]
  84. Sepp, E.; Smidt, I.; Rööp, T.; Štšepetova, J.; Kõljalg, S.; Mikelsaar, M.; Mändar, R. Comparative analysis of gut microbiota in centenarians and young people: Impact of eating habits and childhood living environment. Front. Cell Infect. Microbiol. 2022, 12, 851404. [Google Scholar] [CrossRef]
  85. Kim, G.; Bae, J.; Kim, M.J.; Kwon, H.; Park, G.; Kim, S.-J.; Choe, Y.H.; Kim, J.; Park, S.-H.; Choe, B.-H.; et al. Delayed establishment of gut microbiota in infants delivered by cesarean section. Front. Microbiol. 2020, 11, 2099. [Google Scholar] [CrossRef]
  86. Sprockett, D.; Fukami, T.; Relman, D.A. Role of priority effects in the early-life assembly of the gut microbiota. Nat. Rev. Gastroenterol. Hepatol. 2018, 15, 197–205. [Google Scholar] [CrossRef]
  87. Busi, S.B.; De Nies, L.; Habier, J.; Wampach, L.; Fritz, J.V.; Heintz-Buschart, A.; May, P.; Halder, R.; de Beaufort, C.; Wilmes, P. Persistence of birth mode-dependent effects on gut microbiome composition, immune system stimulation and antimicrobial resistance during the first year of life. ISME Commun. 2021, 1, 8. [Google Scholar] [CrossRef]
  88. Yao, Y.; Cai, X.; Fei, W.; Ren, F.; Wang, F.; Luan, X.; Chen, F.; Zheng, C. Regulating gut microbiome: Therapeutic strategy for rheumatoid arthritis during pregnancy and lactation. Front. Pharmacol. 2020, 11, 594042. [Google Scholar] [CrossRef]
  89. Ramiro-Cortijo, D.; Gila-Diaz, A.; Herranz Carrillo, G.; Cañas, S.; Gil-Ramírez, A.; Ruvira, S.; Martin-Cabrejas, M.A.; Arribas, S.M. Influence of neonatal sex on breast milk protein and antioxidant content in Spanish women in the first month of lactation. Antioxidants 2022, 11, 1472. [Google Scholar] [CrossRef] [PubMed]
  90. Galante, L.; Milan, A.M.; Reynolds, C.M.; Cameron-Smith, D.; Vickers, M.H.; Pundir, S. Sex-specific human milk composition: The role of infant sex in determining early life nutrition. Nutrients 2018, 10, 1194. [Google Scholar] [CrossRef]
  91. Flores, R.; Shi, J.; Fuhrman, B.; Xu, X.; Veenstra, T.D.; Gail, M.H.; Gajer, P.; Ravel, J.; Goedert, J.J. Fecal microbial determinants of fecal and systemic estrogens and estrogen metabolites: A cross-sectional study. J. Transl. Med. 2012, 10, 253. [Google Scholar] [CrossRef]
  92. Chiang, Y.R.; Wei, S.T.S.; Wang, P.H.; Wu, P.H.; Yu, C.P. Microbial degradation of steroid sex hormones: Implications for environmental and ecological studies. Microb. Biotechnol. 2020, 13, 926–949. [Google Scholar] [CrossRef] [PubMed]
  93. Santos-Marcos, J.A.; Mora-Ortiz, M.; Tena-Sempere, M.; Lopez-Miranda, J.; Camargo, A. Interaction between gut microbiota and sex hormones and their relation to sexual dimorphism in metabolic diseases. Biol. Sex Differ. 2023, 14, 4. [Google Scholar] [CrossRef] [PubMed]
Figure 1. Flowchart of the participants and sample analysis. BM: breast milk, MF: mother feces, NF: newborn feces.
Microorganisms 12 02142 g001
Figure 2. Microbiota composition from the maternal gut at the phylum level (A) and at the genus level (B), from BM at the phylum level (C) and at the genus level (D), and from the newborn gut at the phylum level (E) and genus level (F). Relative abundance bar plot of each sample at the phylum or genus levels. The vertical axis represents the relative abundance, and the horizontal axis is the sample code of the participant. M: mother; Bm: breast milk; Nb: newborn. Genera belonging to the Firmicutes are shown in pink color, Proteobacteria in orange color, Bacteroidota in green color, Actinobacteria in blue, and other distinct genera color are shown in gray color. The newborn GM was primarily made up of the phyla Proteobacteria, Actinomicrobiota, Firmicutes, and Bacteroidota, comprising 99.95% of the composition (Figure 2E and Supplementary Table S5). The most abundant genera were Bifidobacterium, Escherichia-Shigella, Pseudomonas, and notably other genera from the Proteobacteria phylum, with abundances under 1%, but collectively comprising 18.26% of the total composition (Figure 2F and Supplementary Table S6). The neonatal GM core detected consisted of Bifidobacterium, Escherichia-Shigella, Streptococcus, and Staphylococcus.
Microorganisms 12 02142 g002aMicroorganisms 12 02142 g002b
Figure 3. Taxon difference between adequate and excessive maternal total body fat groups. Linear discriminant analysis effect size of maternal fecal (A), breast milk (B), and newborn fecal (C) samples according to maternal total body fat. Pink color bars represent differentially abundant taxa in the adequate adiposity group, while purple color bars represent differentially abundant taxa in the excessive maternal adiposity group. Taxa with significant differences and a minimum linear discriminant analysis (LDA) score of 2.0 are shown.
Microorganisms 12 02142 g003
Figure 4. Taxon difference between young and mature age groups. Linear discriminant analysis effect size of maternal fecal (A), BM (B), and newborn fecal (C) samples according to maternal age. Light green bars represent differentially abundant taxa in the young age group, while dark green bars represent differentially abundant taxa in the mature age group. Taxa with significant differences and a minimum linear discriminant analysis (LDA) score of 2.0 are shown.
Microorganisms 12 02142 g004
Figure 5. Taxon difference between vaginal and C-section delivery mode groups. Linear discriminant analysis effect size of maternal fecal (A), BM (B), and newborn fecal (C) samples according to delivery mode. Green color bars represent differentially abundant taxa in the vaginal delivery group, while orange bars represent differentially abundant taxa in the C-section delivery group. Taxa with significant differences and a minimum linear discriminant analysis (LDA) score of 2.0 are shown.
Microorganisms 12 02142 g005
Figure 6. Taxon difference between female and male newborn sex groups. Linear discriminant analysis effect size of maternal fecal (A), BM (B), and newborn fecal (C) samples according to delivery mode. Pink color bars represent differentially abundant taxa in the female newborn sex group, while orange color bars represent differentially abundant taxa in the male newborn sex group. Taxa with significant differences and a minimum linear discriminant analysis (LDA) score of 2.0 are shown.
Microorganisms 12 02142 g006
Table 1. Demographic characteristics of the mother–newborn dyad participants.
CharacteristicsMean ± SD or Median (Minimum–Maximum)
Maternal
Age (y)29.60 (19–35)
Height (m)1.59 ± 0.06
Body weight (kg)
  Pregestational63.74 ± 10.51
  20–28PPD64.75 ± 10.64
  Last gestational74.25 ± 10.39
  Gain during pregnancy10.51 ± 4.59
BMI (kg/m2)
  Pregestational25.3 ± 3.99
  20–28PPD25.71 ± 4.07
Total body fat (%)33.03 ± 6.44
Delivery mode (V/C, %)53%/47%
Newborn
Gestational age (weeks)39.3 ± 1.08
Length (cm)
  At birth50 (48–53)
  At 20–28PND52.32 ± 1.79
  Gain at 20 20–28PND2.27 ± 1.67
Body weight (kg)
  At birth3.07 ± 0.33
  At 20–28PND3.81 ± 0.46
  Gain at 20–28PND 10.74 ± 0.47
Head circumference (cm)36.55 ± 1.01
Newborn sex F/M (%)45/55
Data were analyzed and expressed as mean ± standard deviation for normally distributed data or median (minimum–maximum) for non-normal distribution data, as appropriate. BMI: body mass index; C: cesarean; F: female; M: male; PND: postnatal day; PPD: postpartum day; SD: standard deviation; V: vaginal; N = 40. 1 Gain at 20–28PND = At 20–28PND—at birth.
Table 2. Envfit analysis on the maternal gut, BM, and newborn GM structure according to UniFrac and weighted UniFrac distances associated with mother–newborn characteristics.
R2p-Value
Mother Gut
Unweighted UniFrac
  Age, y0.2090.022
  Total body fat, %0.0040.944
  Delivery mode0.0100.830
  Sex0.0210.707
Weighted UniFrac
  Age, y0.1440.075
  Total body fat, %0.0020.971
  Delivery mode0.0330.593
  Sex0.0410.499
Breast milk
Unweighted UniFrac
  Age, y0.0300.719
  Total body fat, %0.0160.850
  Delivery mode0.1630.173
  Sex0.1390.230
Weighted UniFrac
  Age, y0.0860.378
  Total body fat, %0.0490.623
  Delivery mode0.0590.530
  Sex0.2930.028
Newborn gut
Unweighted UniFrac
  Age, y0.1940.038
  Total body fat, %0.0040.945
  Delivery mode0.1630.060
  Sex0.0190.743
Weighted UniFrac
  Age, y0.0480.465
  Total body fat, %0.0180.740
  Delivery mode0.0840.231
  Sex0.0300.614
The model was constructed based on PCoA ordination using UniFrac distance for community richness and weighted UniFrac for community abundance. The R2 represents the proportion of variance explained by ordination. p-values are based on 999 random permutations; significant values are in boldface.
Disclaimer/Publisher’s Note: The statements, opinions and data contained in all publications are solely those of the individual author(s) and contributor(s) and not of MDPI and/or the editor(s). MDPI and/or the editor(s) disclaim responsibility for any injury to people or property resulting from any ideas, methods, instructions or products referred to in the content.

