Article

A Point Mutation in Cassette Relieves the Repression Regulation of CcpA Resulting in an Increase in the Degradation of 2,3-Butanediol in Lactococcus lactis

1
School of Life Science, Shanxi University, Taiyuan 030006, China
2
State Key Laboratory of Coordination Chemistry, Chemistry and Biomedicine Innovation Center, School of Chemistry and Chemical Engineering, Nanjing University, Nanjing 210023, China
3
The Key Laboratory of Molecular Microbiology and Technology, Ministry of Education, College of Life Sciences, Nankai University, Tianjin 300071, China
*
Author to whom correspondence should be addressed.
Microorganisms 2024, 12(4), 773; https://doi.org/10.3390/microorganisms12040773
Submission received: 7 March 2024 / Revised: 8 April 2024 / Accepted: 9 April 2024 / Published: 11 April 2024
(This article belongs to the Section Food Microbiology)

Abstract

:
In lactic acid bacteria, the global transcriptional regulator CcpA regulates carbon metabolism by repressing and activating the central carbon metabolism pathway, thus decreasing or increasing the yield of certain metabolites to maximize carbon flow. However, there are no reports on the deregulation of the inhibitory effects of CcpA on the metabolism of secondary metabolites. In this study, we identified a single-base mutant strain of Lactococcus lactis N8-2 that is capable of metabolizing 2,3-butanediol. It has been established that CcpA dissociates from the catabolite responsive element (cre) site due to a mutation, leading to the activation of derepression and expression of the 2,3-butanediol dehydrogenase gene cluster (butB and butA). Transcriptome analysis and quantitative polymerase chain reaction (Q-PCR) results showed significant upregulation of transcription of butB and butA compared to the unmutated strain. Furthermore, micro-scale thermophoresis experiments confirmed that CcpA did not bind to the mutated cre. Furthermore, in a bacterial two-plasmid fluorescent hybridization system, it was similarly confirmed that the dissociation of CcpA from cre eliminated the repressive effect of CcpA on downstream genes. Finally, we investigated the differing catalytic capacities of the 2,3-butanediol dehydrogenase gene cluster in L. lactis N8-1 and L. lactis N8-2 for 2,3-butanediol. This led to increased expression of butB and butA, which were deregulated by CcpA repression. This is the first report on the elimination of the deterrent effect of CcpA in lactic acid bacteria, which changes the direction of enzymatic catalysis and alters the direction of carbon metabolism. This provides new perspectives and strategies for metabolizing 2,3-butanediol using bacteria in synthetic biology.

1. Introduction

Lactococcus lactis is a group of Gram-positive bacteria with wide applications in the food industry and genetic engineering for producing recombinant proteins [1]. It has a crucial role in the dairy and health industries. Lactococcus lactis is generally regarded as a safe (GRAS) microorganism [1,2,3]. Lactococcus lactis N8 is a nisin Z producer isolated from milk in Finland, and the knowledge gained from fundamental research on this nisin production strain has been exploited for a wide variety of biotechnological applications. Because of the impressive nisin yield, research on this strain has focused on its nisin synthetic gene cluster and on increasing the production of nisin [4,5]. By analyzing phage and gene island fragments in the genome, the deletion of these fragments reduces the metabolic burden of the strain and increases the production of some substances [6]. To this end, we designed experiments to construct chassis cells by systematic cumulative deletion of prophages and transposons and some putative proteins of unknown function from the genome of the target strain L. lactis N8 [3] and obtained the L. lactis N8-1 [6] and L. lactis N8-2 deleted strains.
In L. lactis, a range of transcriptional regulatory mechanisms have been preliminarily studied. The global transcriptional regulator CcpA, a DNA-binding protein belonging to the Lacl/GalR family of transcriptional regulators [7], acts by binding to cre located near the promoter to repress or enhance transcription of the downstream operon [8,9]. CcpA, a regulator of genes associated with energy and nitrogen metabolism in bacteria (>300 in Bacillus subtilis, ≥237 in Lactococcus lactis) [8], acts by binding to 16-nucleotide DNA target sites known as cre and conducts carbon catabolite activation (CCA) and repression (CCR) processes. CcpA, which represses the transcription of genes within the tricarboxylic acid (TCA) cycle and secondary carbon source catabolism, is revealed in Gram-positive bacteria as a regulatory mechanism of carbon metabolism [10]. While the role of CcpA as a repressor of genes involved in the utilization of secondary carbon sources is well established, CcpA is also required for activation of carbon excretion pathways, including those for the production of acetate, acetoin, and glycogen, during growth in glucose [11,12,13]. The role of CcpA in regulating carbon metabolism and facing the stress response has been demonstrated in a variety of lactic acid bacteria, such as Lactobacillus plantarum [14], Lactobacillus casei [15,16], and Lactococcus lactis [17,18].
There is a wide range of 2,3-butanediol applications in the chemical, cosmetic, food, agriculture, and pharmaceutical industries, while 2,3-butanediol derivatives can also be used as fuel additives, polymers, and synthetic rubber [19]. 2,3-butanediol is a functional C4 compound with various industrial applications [20]. In bacteria, in addition to providing energy for cell growth, glucose metabolism produces a large number of secondary metabolites. Acetoin and 2.3-butanediol have a wide range of applications as secondary metabolites in microbial synthesis. Many microorganisms, such as Klebsiella pneumoniae, Bacillus velezensis, Enterobacter aerogenes, Saccharomyces cerevisiae, Serratia marcescens, Corynebacterium glutamicum, and Lactococcus lactis, have been used to efficiently produce 2,3-butanediol [21,22,23,24,25,26]. In L. lactis, 2,3-butanediol dehydrogenase acts as a bi-directional enzyme, allowing the interconversion of acetoin and 2,3-butanediol in organisms [27]. This conversion occurs under the conditions of NADH and NAD+ as coenzymes. However, little attention has been paid to 2,3-butanediol as a carbon source in central carbon metabolism for degradation.
In this study, we identified a mutant strain that could utilize 2,3-butanediol and increase its metabolism. We experimentally verified that the global transcriptional regulator CcpA deregulates the inhibitory effect of 2,3-butanediol dehydrogenase transcription by L. lactis N8-2. Furthermore, we elucidated the regulatory mechanism of CcpA in the metabolism of the secondary metabolite 2,3-butanediol by L. lactis N8-2. These findings offer new insights and a biological foundation for the role of the global transcription factor CcpA in regulating the central carbon metabolism of Lactococcus lactis by altering carbon flow.

2. Methods

2.1. Bacterial Strains, Plasmids, and Culture Conditions

All the strains and plasmids used in this study are described in Table 1. All the primers used are in Table 2. The growth medium employed for L. lactis N8-1 and L. lactis N8-2 was GM17, which consisted of an M17 medium supplemented with 0.5% glucose. Without agitation were incubated at 30 °C. E. coli DH5α and E. coli BL21 (DE3) strains were employed for clone screening and expression of recombinant proteins, respectively. Luria-Bertani (LB) medium, comprising 1% tryptone, 0.5% yeast extract, and 1% NaCl, was used as the growth medium. E. coli cultures were grown under shaking conditions at 200 rpm/min and a temperature of 37 °C, whereas BL21 (DE3) cultures were grown at a lower temperature of 16 °C to facilitate heterologous expression of recombinant proteins. GM17 and LB solid media were supplemented with 2.5% (w/v) agar powder. Clone screening was carried out using the pEASY-T1 cloning vector, which contains the LacZ gene and enables white/blue color screening in plate media containing IPTG (50 mg/mL) and X-gal (20 mg/mL). The pETm3c vector was used to express the recombinant proteins. The pLEB124 vector was used as an overexpression vector in Lactococcus lactis, serving as a reporter vector in this study. pRSF-Dute and pACYC-eGFP plasmids were specifically engineered to enable the simultaneous expression of two target open reading frames. These plasmids were then co-transformed into E. coli BL21 (DE3) cells for double hybridization. To facilitate plasmid selection, the concentrations of ampicillin, kanamycin, erythromycin, and chloramphenicol used in E. coli were uniformly established at 50 µg/mL. The concentration of erythromycin in Lactococcus lactis was found to be 5 µg/mL.

2.2. Biolog Phenotype Microarray Metabolic Profiling

Biolog phenotype microarray microplates, which contain a tetrazolium dye that changes color because of substrate metabolism, provide a metabolic fingerprint of the microorganism [29,30]. The Phenotype microarray system (Hayward, CA, USA) was used to assess the metabolic activity of L. lactis N8-1 and L. lactis N8-2 strains using the GP2 and Gen III MicroPlate™ (Biolog Inc., Hayward, CA, USA). All experimental procedures and protocols were meticulously performed according to the manufacturer’s instructions [29]. L. lactis N8-1 and L. lactis N8-2 strains were introduced into GM17 liquid medium and cultivated until they reached the mid-exponential phase (OD595 = 0.6). Afterward, the bacterial solution was evenly distributed on a GM17 plate lacking resistance, and a solitary colony was selected using a sterile swab. The colonies were then inoculated into an inoculum solution. A final dilution in 20 mL of IF-C fluid (Biolog Inc., Hayward, CA, USA) was used to acquire a homogenous cell suspension without clumps [29]. The turbidity of the bacterial solution was subsequently adjusted to a 20% T value. Following this, the bacterial solution was inoculated into a microplate, and 150 μL was added to each well. The enzyme marker was set to detect a wavelength of OD595 nm, and the plate was incubated at a temperature of 30 °C for 18 h. Data were recorded at intervals of 6 h, and the average color change was determined by calculating the absorbance data [30]. The absorbance value of each well in the plate represents the utilization of a unique carbon source, expressed as [C-R] [31], where C and R, respectively denote the absorbance per well (measured as optical density), the absorbance of the control wells in the plate, and the number of substrates used for statistical analysis.

2.3. Real-Time Fluorescence Quantitative PCR

L. lactis N8-1 and L. lactis N8-2 were cultivated in GM17 medium for 6 h. The cultures were then diluted to obtain comparable cell densities. Total RNA was extracted, which was followed by reverse transcription into first-strand cDNA using the RevertAid First Strand cDNA Synthesis Kit (TransGen, Beijing, China). The gene transcription levels of tufA, butA, and butB were evaluated using RT-qPCR. The tufA [32] gene was selected as the housekeeping gene, and the comparative CT(2−ΔΔCT) method was used for data analysis. Transcriptions with a fold change > 2 were considered statistically significant.

2.4. L. lactis N8-2 Genome Complete Map Sequencing

We performed a comprehensive mapping and sequencing analysis of the entire genome of L. lactis N8-2, including complete splicing and assembly. The obtained sequencing results were compared with the whole-genome sequence of L. lactis N8 (GCA_014884605.1), available at https://www.ncbi.nlm.nih.gov/assembly/GCF_014884605.1 (accessed on 1 June 2023). This comparison enabled the identification and sorting of differential sites and sequences in L. lactis N8-2. To refine the screening process, the whole-genome sequence of L. lactis N8-2 was further validated by PCR amplification and sequencing of the amplified fragments. This approach resulted in a more accurate whole-genome sequence for L. lactis N8-2.

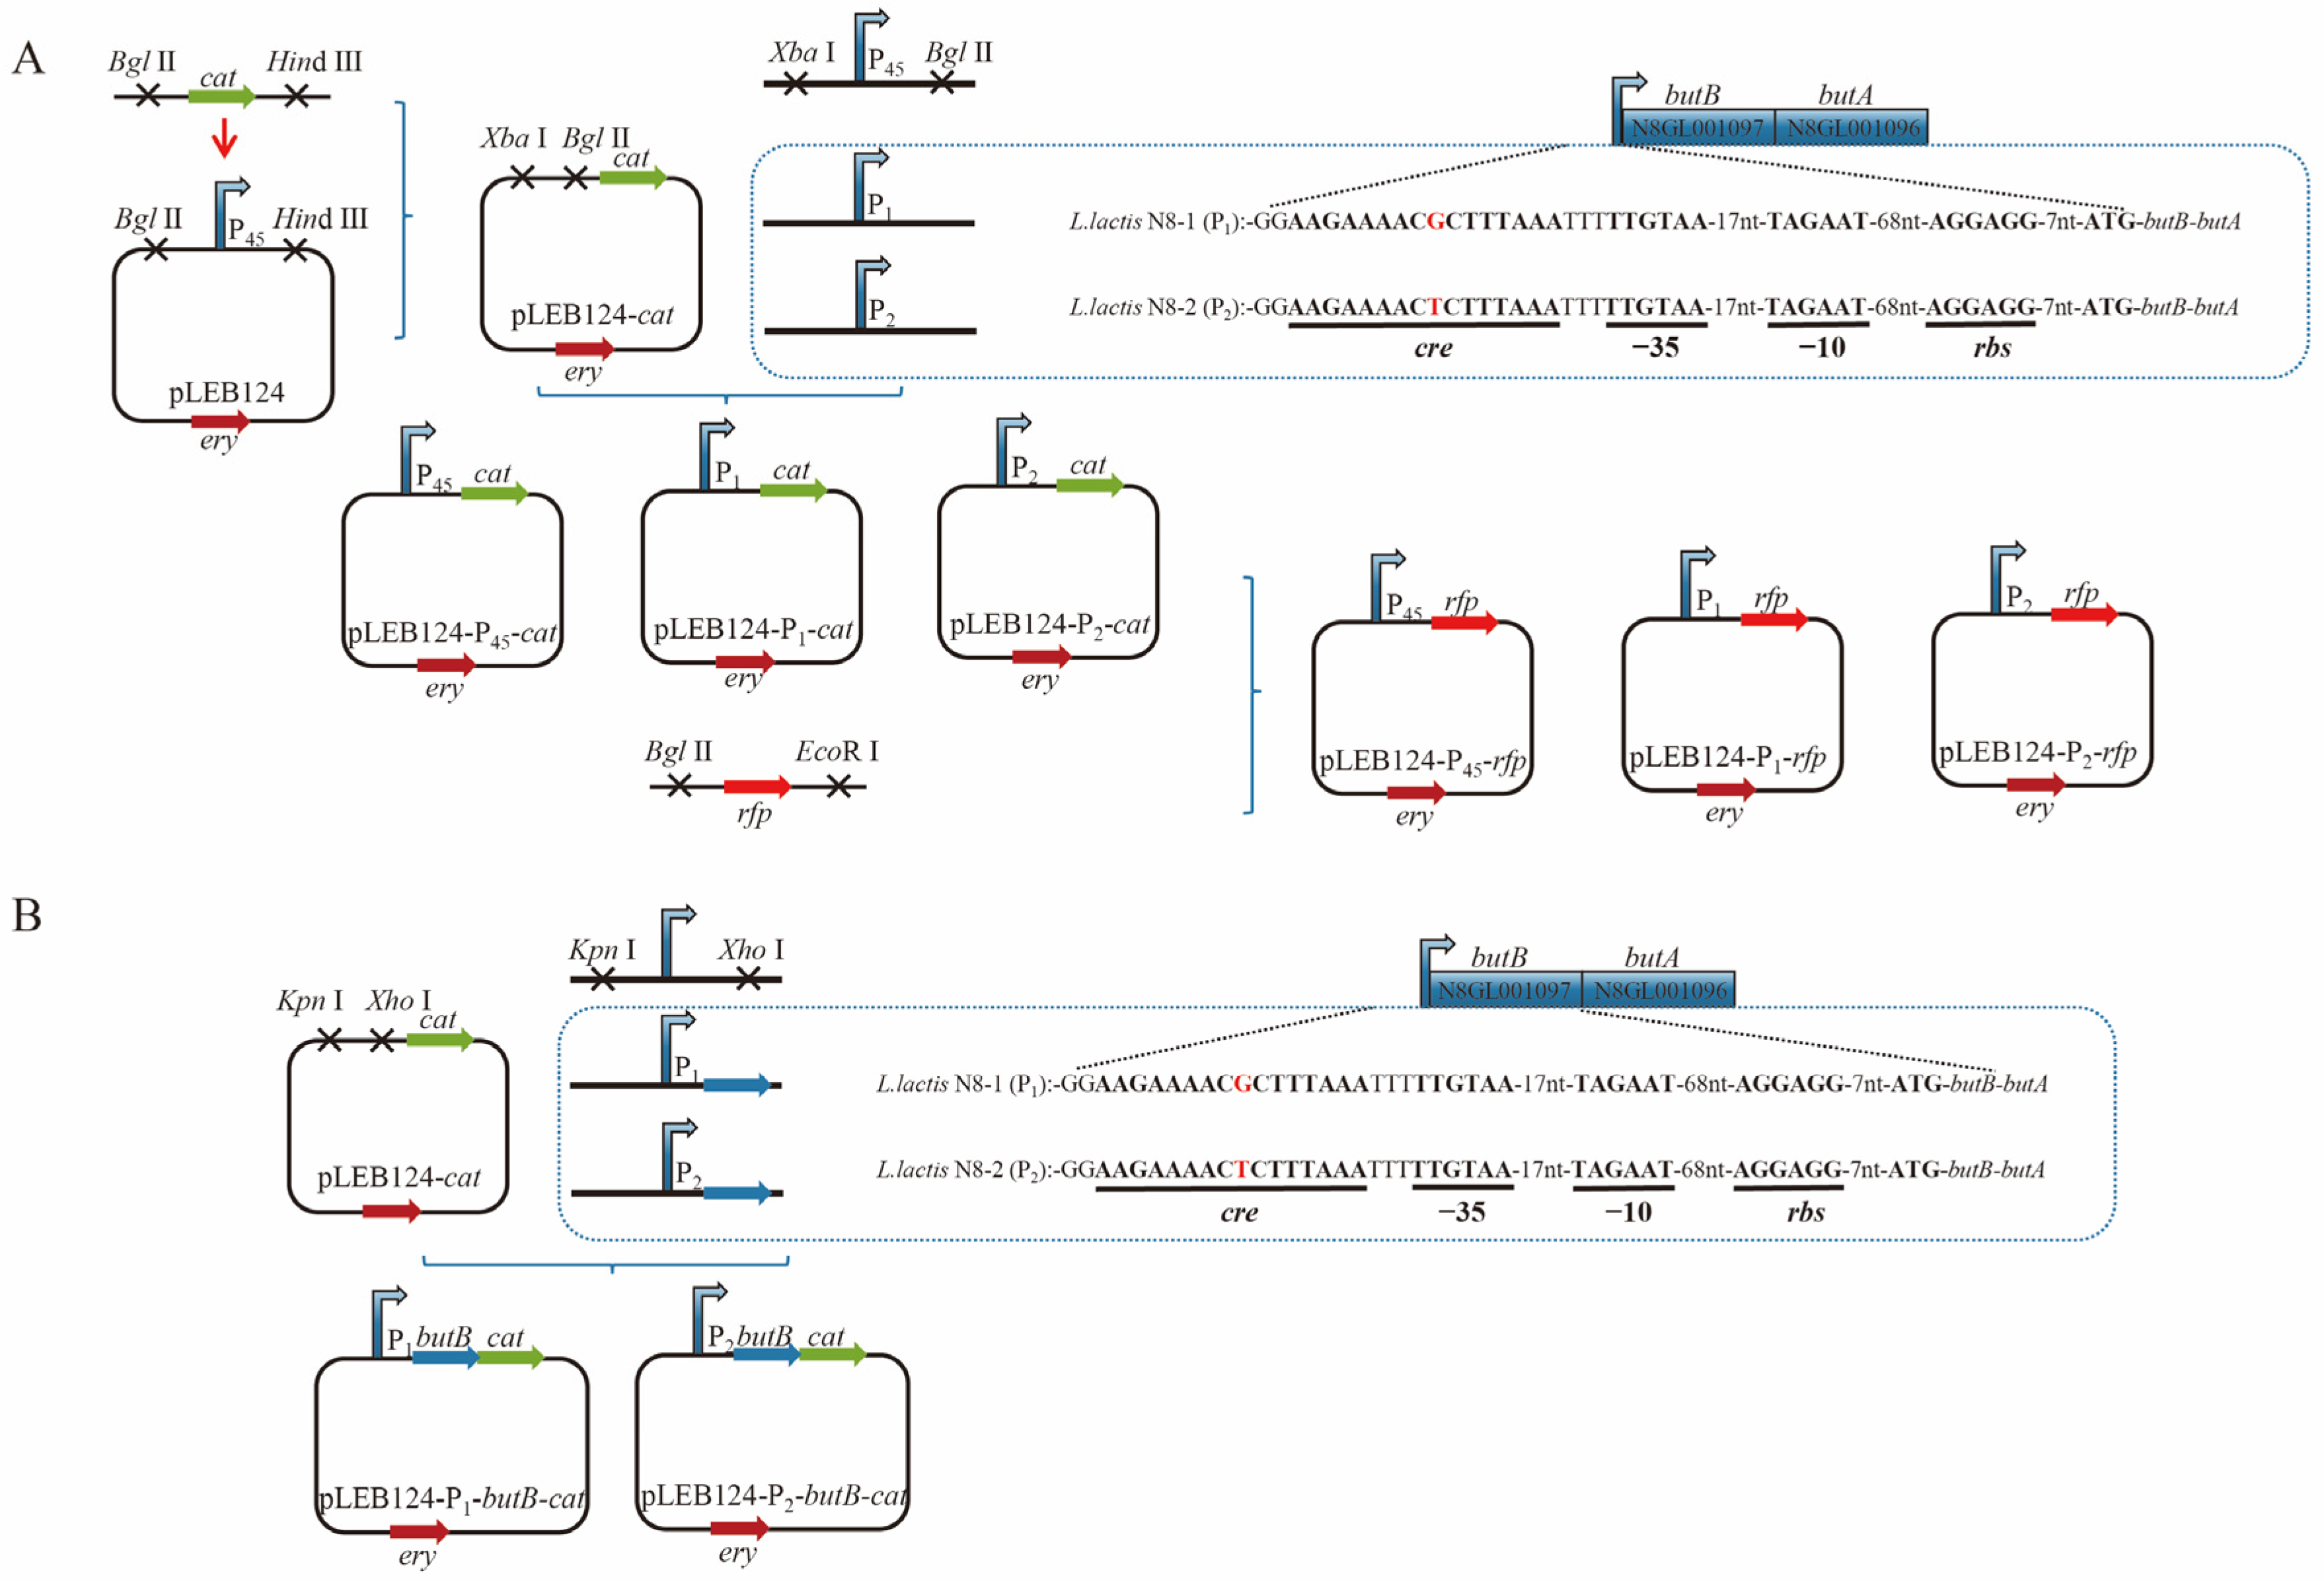
2.5. Detection of Promoter Activity Using Cat as a Reporter Gene

Subsequent experiments were performed using L. lactis N8-1 as the control strain, because L. lactis N8-2 is a phage-like fragment knockout based on L. lactis N8-1, and the PbutBA promoter sequence preceding the butBA gene cluster in L. lactis N8-1 was confirmed to be free of point mutations by PCR sequencing. The laboratory reporter gene for chloramphenicol resistance, cat, was selected, and the expression vector pLEB124 was used. The genomes of L. lactis N8-1 and N8-2 were used as templates to amplify the original and point-mutated PbutBA promoter sequences, designated as P1 and P2, respectively, using PbutBA-F/R primers. Afterward, an expression plasmid was constructed by linking different promoters using plasmid pLEB124 as a template. Concurrently, plasmid pLEB124 was employed as a template to amplify the P45 [33] promoter using the P45-F/R primer. This led to the acquisition of the P45 promoter, which was subsequently used to construct expression plasmids with various promoters. To validate the constructs, the recombinant plasmids pLEB124-P1-cat, pLEB124-P2-cat, and pLEB124-P45-cat were obtained and individually subjected to sequencing. Afterward, the recombinant constructs were introduced into L. lactis N8-1 and L. lactis N8-2 competent cells, which resulted in the generation of the respective strains N8-1-P45-cat, N8-1-P1-cat, N8-1-P2-cat, N8-2-P45-cat, N8-2-P1-cat, and N8-2-P2-cat.
The strains obtained in the previous step were activated and transferred a second time. Cells were cultured until such time as they reached the logarithmic phase. The bacterial solution was diluted 50 times to serve as a seed solution for detection. This was followed by the preparation of a chloramphenicol-resistant LB medium with a 150 μg/mL concentration. Next, 100 μL of diluted bacterial solution was added to each well of a 96-well cell culture plate containing chloramphenicol-resistant LB medium. For each sample, three replicates were performed, and the samples were incubated at a constant temperature of 30 °C for 10 h. The P45 promoter was used as a positive control to determine the MIC of chloramphenicol against the bacterial strains. The expression capacity of each promoter was characterized by detecting its respective tolerance to chloramphenicol and conducting a more accurate quantitative analysis of promoter expression capacity.

2.6. Detection of Promoter Activity Using Red Fluorescent Protein as a Reporter Gene

The sequence of red fluorescent proteins (rfps) was obtained by performing rfp-clone-F/R cloning using plasmid pNZ8048-rfp as a template. Afterward, plasmids pLEB124-P45-rfp, pLEB124-P1-rfp, and pLEB124-P2-rfp were constructed by recombination to replace the cat gene in the pLEB124-P45-cat, pLEB124-P1-cat, and pLEB124-P2-cat plasmids, respectively. The newly constructed plasmids were sequenced and individually verified.
The same transformation method was employed to introduce plasmids pLEB124-P45-rfp, pLEB124-P1-rfp, and pLEB124-P2-rfp into the competent cells of L. lactis N8-1 and L. lactis N8-2. Consequently, strains N8-1-P45-rfp, N8-1-P1-rfp, N8-1-P2-rfp, N8-2-P45-rfp, N8-2-P1-rfp, and N8-2-P2-rfp were obtained. The culture was transferred to a 96-well cell culture plate in the logarithmic phase. The plates were then incubated under light-protected conditions. The fluorescence intensity of the strains was measured using ELISA after incubation for 14 h and 20 h. The parameter settings for ELISA were excitation light at 587 nm and scattering light at 610 nm. The fluorescence values obtained from each strain were used to precisely measure the promoter expression.

2.7. Analysis of the Functional Region Responsible for Initiating Transcription and Structural Characteristics of the butBA Gene Cluster

The genomes of L. lactis N8-1 and L. lactis N8-2 were used as templates for this study. The PbutBA-butB sequence, comprising the complete PbutBA and butB genes, was cloned using PbutBA-butB-F/R primers. Additionally, the pLEB124-P1-butB-cat and pLEB124-P2-butB-cat plasmids were constructed. Afterward, these plasmids were introduced into competent cells of L. lactis N8-1 and L. lactis N8-2 through electrotransformation. This process generated N8-1-P1-butB-cat, N8-1-P2-butB-cat, N8-2-P1-butB-cat, and N8-2-P2-butB-cat strains. Resistance to chloramphenicol was assessed for each strain.

2.8. Preparation of a Fluorescent Probe DNA

The probes used in the MST technique comprised 5’ cy5-labeled DNA fragments. In contrast, the target fragments were obtained through two rounds of PCR amplification. In the initial amplification process, the L. lactis N8-1 and L. lactis N8-2 genomes were used as templates. PCR amplification was performed using primers with 16-bp cy5 primer sequence homology arms. The resulting amplified products were recovered by agarose gel electrophoresis after identification. Afterward, these products were constructed using pEASY-T and screened for positive clones using the white/blue color screening method. The plasmids obtained through correct sequencing were named pEASY-N8-1-cre, pEASY-N8-2-cre, and pEASY-N8-16s. In the second amplification step, the three recombinant plasmids were used as templates, with cy5 fluorescent primers acting as primers. After agarose gel electrophoresis, the PCR reaction solution was purified and recovered, leading to the formation of N8-1-cre, N8-2-cre, and N8-16s samples. These samples were then stored at −20 °C for backup. In the subsequent stages, it is essential to shield the entire procedure from exposure to light.

2.9. Construction of Recombinant Plasmids and Subsequent Induction of Expression for Purification of the CcpA Protein

Initially, genome information for L. lactis N8 was obtained from the NCBI website. The sequence information of the catabolite control protein A (CcpA) (Sequence ID: CP059049.1) was downloaded, and a primer design was conducted using the pETm3c vector using SnapGene software (version 6.2.0). After correct sequencing and screening of positive clones, the recombinant plasmid was chemically transformed into E. coli BL21 (DE3) competent cells. The plates were then subjected to overnight incubation at 37 °C, and single colonies were selected and cultured in 5-mL tubes. The expansion culture was conducted using a 1% inoculum. The culture was grown at 37 °C until the optical density at 600 nm (OD600) reached 0.6. Subsequently, 0.5 mM isopropyl-β-d-thiogalactopyranoside (IPTG) was added for induction for another 12 h at 16 °C. The organisms were collected by centrifugation (10,000× g for 15 min at 4 °C) during the crushing process. The cells were then collected and resuspended in a PB buffer solution (20 mM NaH2PO4, 20 mM Na2HPO4, and 500 mM NaCl, pH 7.4).
The pellet was resuspended in 10 mL of PB-40 buffer (20 mM NaH2PO4, 20 mM Na2HPO4, and 40 mM imidazole, pH 7.4). The cells were then disrupted by sonication. Cellular debris was eliminated by centrifugation (10,000× g for 15 min at 4 °C). The resulting supernatant was then filtered using a 0.22-μm membrane and loaded onto a nickel column chromatography system at 4 °C for complete binding. Afterward, heterogeneous proteins were eluted using PB-40 buffer. The target proteins were eluted using PB buffer supplemented with 0.3 M imidazole. Subsequent to elution, the proteins of interest were desalted using dextran Sephadex G-75 and collected. Finally, the target proteins were stored at −80 °C.

2.10. Micro-Scale Thermophoresis (MST)

We determined the binding of CcpA proteins to N8-1-cre, N8-2-cre, and N8-16s DNA fragments and also examined the affinity constants for protein CcpA target DNA binding. The N8-1-cre, N8-2-cre, and N8-16s DNA fragments labeled with the cy5 probe were initially scanned for fluorescence excitation using the PRETEST program (NanoTemper, Munich, Germany) of the micro-thermophilic kinematic instrument. This step was performed to ensure that the fluorescence intensity was within the range of 200–1000 nm. Sixteen PCR tubes were prepared for each experiment. In tubes 2 to 16, 10 μL of DNA samples at a concentration of 375 nM were added. A total of 20 μL of CcpA protein was added to the first tube at a concentration of 15 µM CcpA, and 10 μL transferred to the second tube. This two-fold dilution method was repeated for each subsequent tube, resulting in the sequential dilution of the target protein into 16 gradients. Specific quantities of the protein and DNA mixture were extracted using a capillary pipette and then deposited onto a stationary plate designed for capillary pipettes to measure the change in fluorescence distribution upon heating as a function of the concentration of the DNA-protein complex. Since the migration of individual molecules is different from that of ligand-bound molecules, the change in fluorescence distribution was used to determine the ratio of free proteins to proteins bound to the DNA. The collected data were then saved and analyzed.

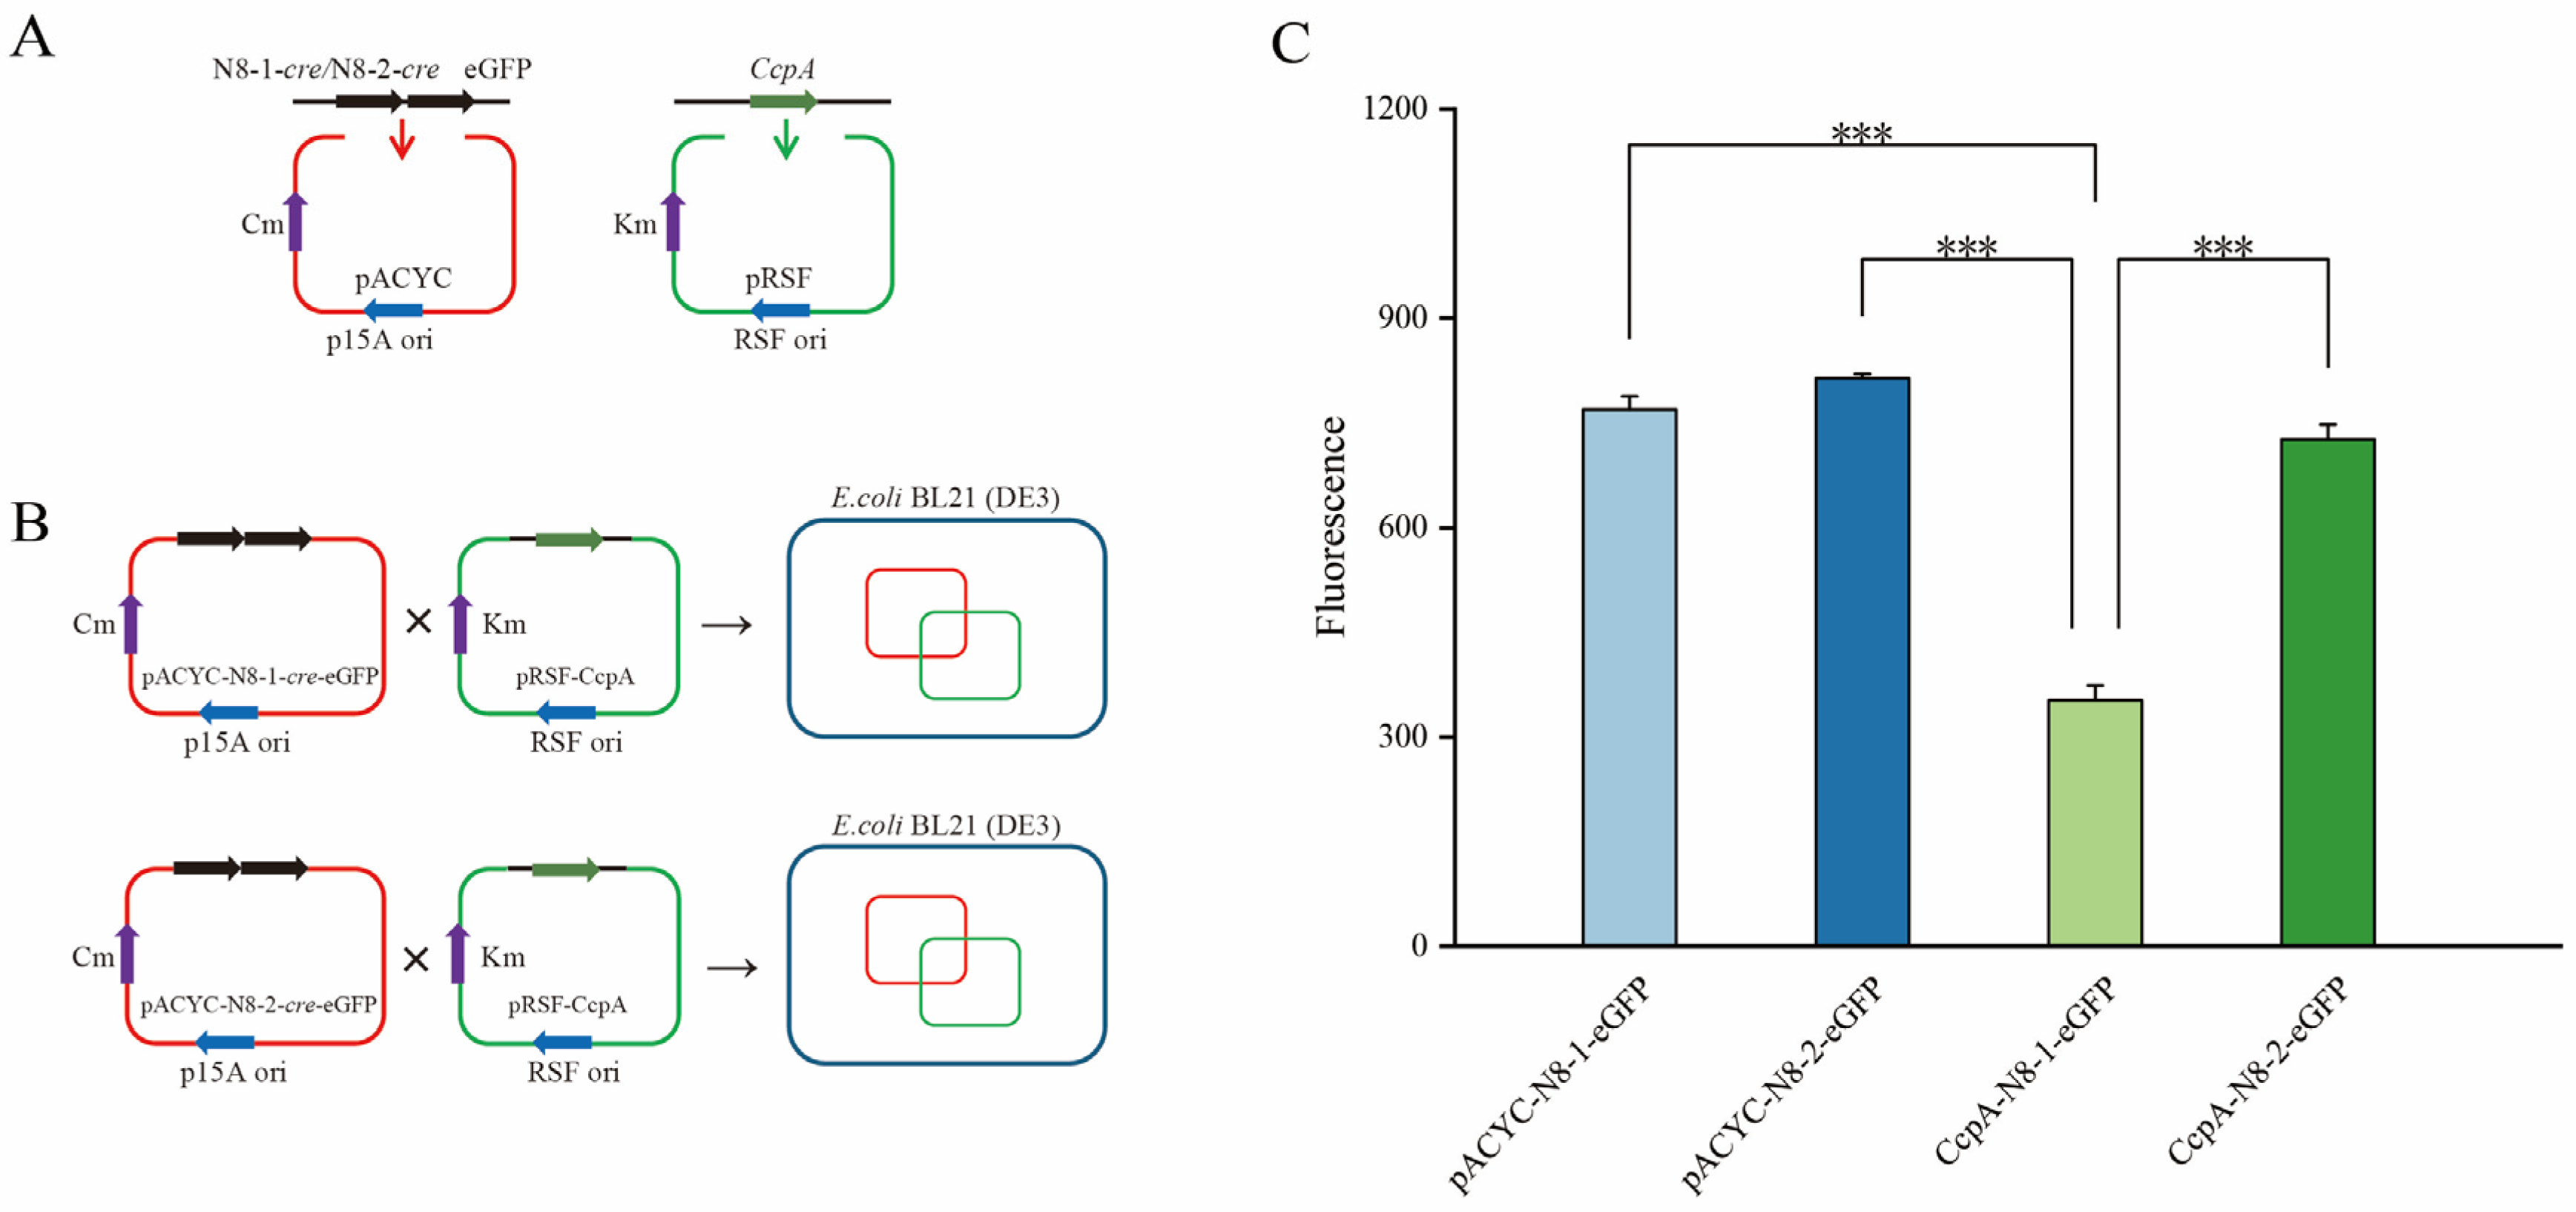
2.11. Construction of a Bacterial Two-Plasmid Fluorescence Hybridization System

N8-1-cre and N8-2-cre DNA sequences were inserted at the N-terminus of the enhanced green fluorescent protein (eGFP) gene in the pACYC-eGFP vector, leading to the creation of pACYC-N8-1-cre-eGFP and pACYC-N8-2-cre-eGFP constructs. Furthermore, CcpA was inserted into the pRSF-Duet vector, resulting in the creation of the pRSF-CcpA construct. After validating the correct sequencing, the pRSF-CcpA, pACYC-N8-1-cre-eGFP, and pACYC-N8-2-cre-eGFP constructs were introduced into E. coli BL21(DE3) competent cells by electroporation at a voltage of 2.5 kV. The transformed bacterial cells were then plated on LB solid medium containing 50 μg/mL chloramphenicol and 50 μg/mL kanamycin and incubated overnight at 37 °C. Single colonies were selected for colony PCR validation, and plasmids confirmed to have the correct sequences were labeled as CcpA-N8-1-cre-eGFP and CcpA-N8-2-cre-eGFP. These plasmids were stored at −20 °C.

2.12. Determination of Growth Trends and Fluorescence Values in a Two-Plasmid Fluorescent Hybridization Assay

The four strains were activated in LB medium. The culture was grown at 37 °C until the optical density at 600 nm (OD600) was 0.6. Afterward, 0.5 mM IPTG was added for induction for another 12 h at 16 °C. The bacterial liquid was collected by centrifugation (9000× g, 4 °C, 3 min) and washed twice with PBS. The OD600 value was measured, and the samples were adjusted until the OD values were the same. Finally, the fluorescence intensity of the samples was determined using a fluorescence spectrophotometer at an excitation wavelength of 480 nm and an emission wavelength of 520 nm.

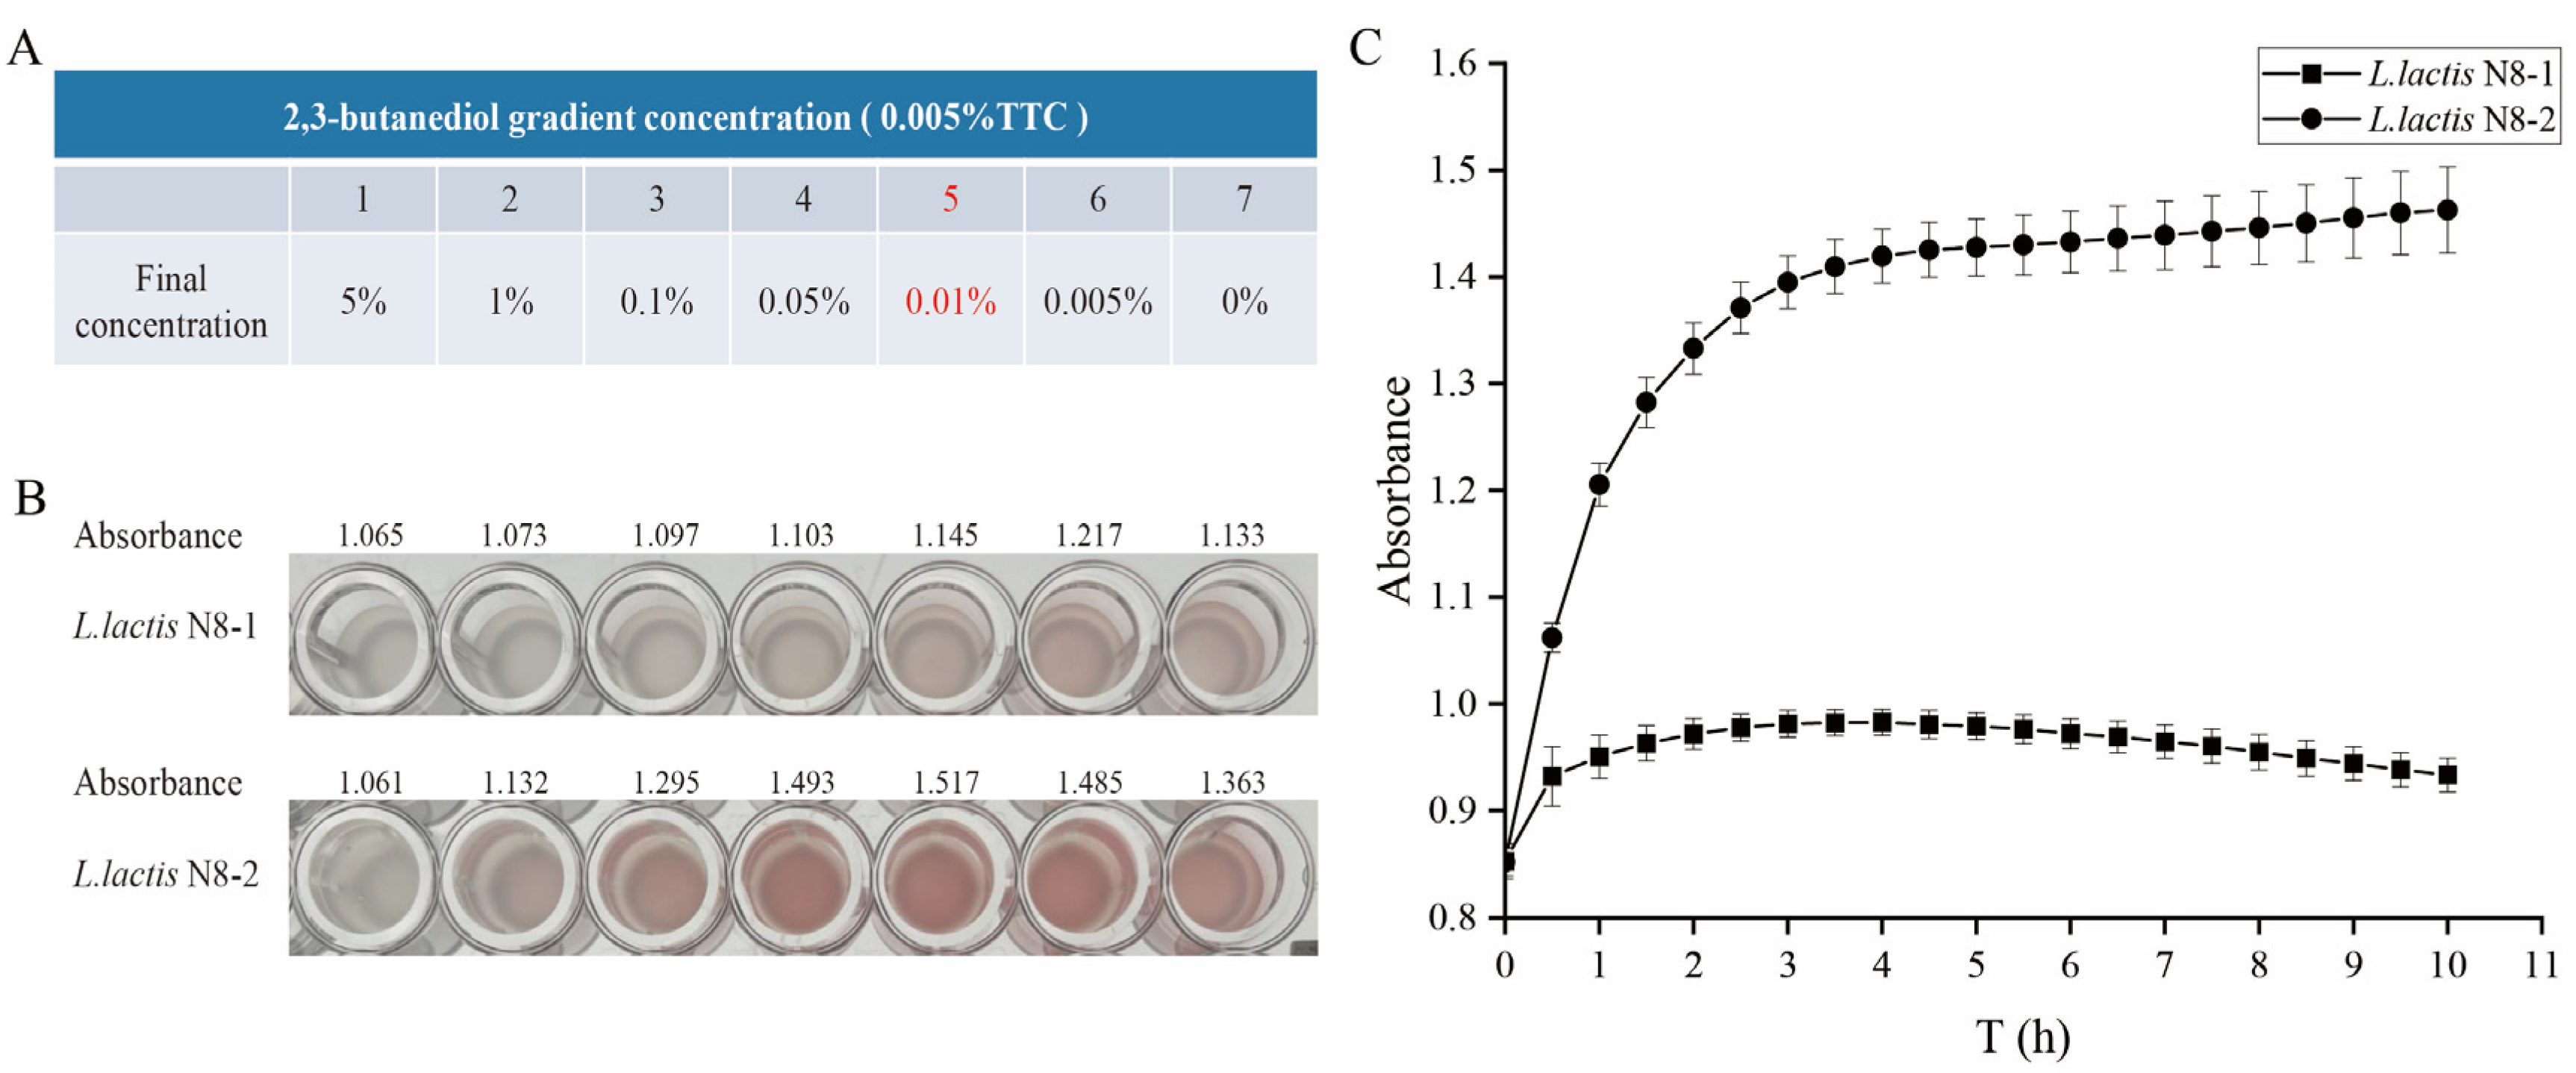
2.13. Determination of the Metabolism of 2,3-Butanediol at Different Concentrations

2,3,5-triphenyl-2H-tetrazolium chloride (TTC) is a commonly used stain for the detection of plant seeds [34] and microbial viability [35]. TTC is utilized to evaluate the capacity of bacteria to metabolize carbon sources by measuring their metabolic viability. The assay depends on the reduction of TTC, a colorless water-soluble compound, to insoluble TPF (triphenylformazan) by oxidoreductases and dehydrogenases [34]. The darker the color, the greater the ability to utilize the carbon source. It is well established that excessive amounts of 2,3-butanediol and TTC can have inhibitory effects on cells. Therefore, in this study, we established a gradient of final concentrations of 2,3-butanediol (5%, 1%, 0.1%, 0.05%, 0.01%, 0.005%, and 0%) and a fixed concentration of 0.005% TTC as the substrate. We then measured the activity of 2,3-butanediol dehydrogenase in the L. lactis N8-2 and L. lactis N8-1 strains. It is necessary to first centrifuge the strains during the logarithmic phase (6 h) to collect the bacterial precipitate. Subsequently, the bacteria were washed twice with IF-C and resuspended. The OD595 value was determined. Following this, the OD values of each sample of L. lactis N8-1 and L. lactis N8-2 strains should be adjusted to the same value. The next step involved inoculating the wells of 96-well plates with TTC and varying concentrations of 2,3-butanediol. The plates were incubated at 30 °C for 30 min, after which the results were observed and recorded by photographs.

2.14. Determination of the Metabolism of 2,3-Butanediol at Optimal Concentrations

The concentration of 2,3-butanediol was adjusted to 0.05%, the concentration of TTC was adjusted to 0.005%, and the other incubation conditions were the same as those described in Section 2.13. The incubation temperature was set at 30 °C, the detection wavelength was set at OD595 nm, and detection was performed continuously for 10 h. The metabolism of the L. lactis N8-1 and L. lactis N8-2 strains was recorded over the course of 10 h.

2.15. Statistical Analysis

The data obtained are reported as the mean ± standard deviation (SD). The difference between the two groups was compared by a t-test with p < 0.05 considered significant. Statistical analyses of the data were performed using Origin 64 software (version 2024SR1).

3. Results and Discussion

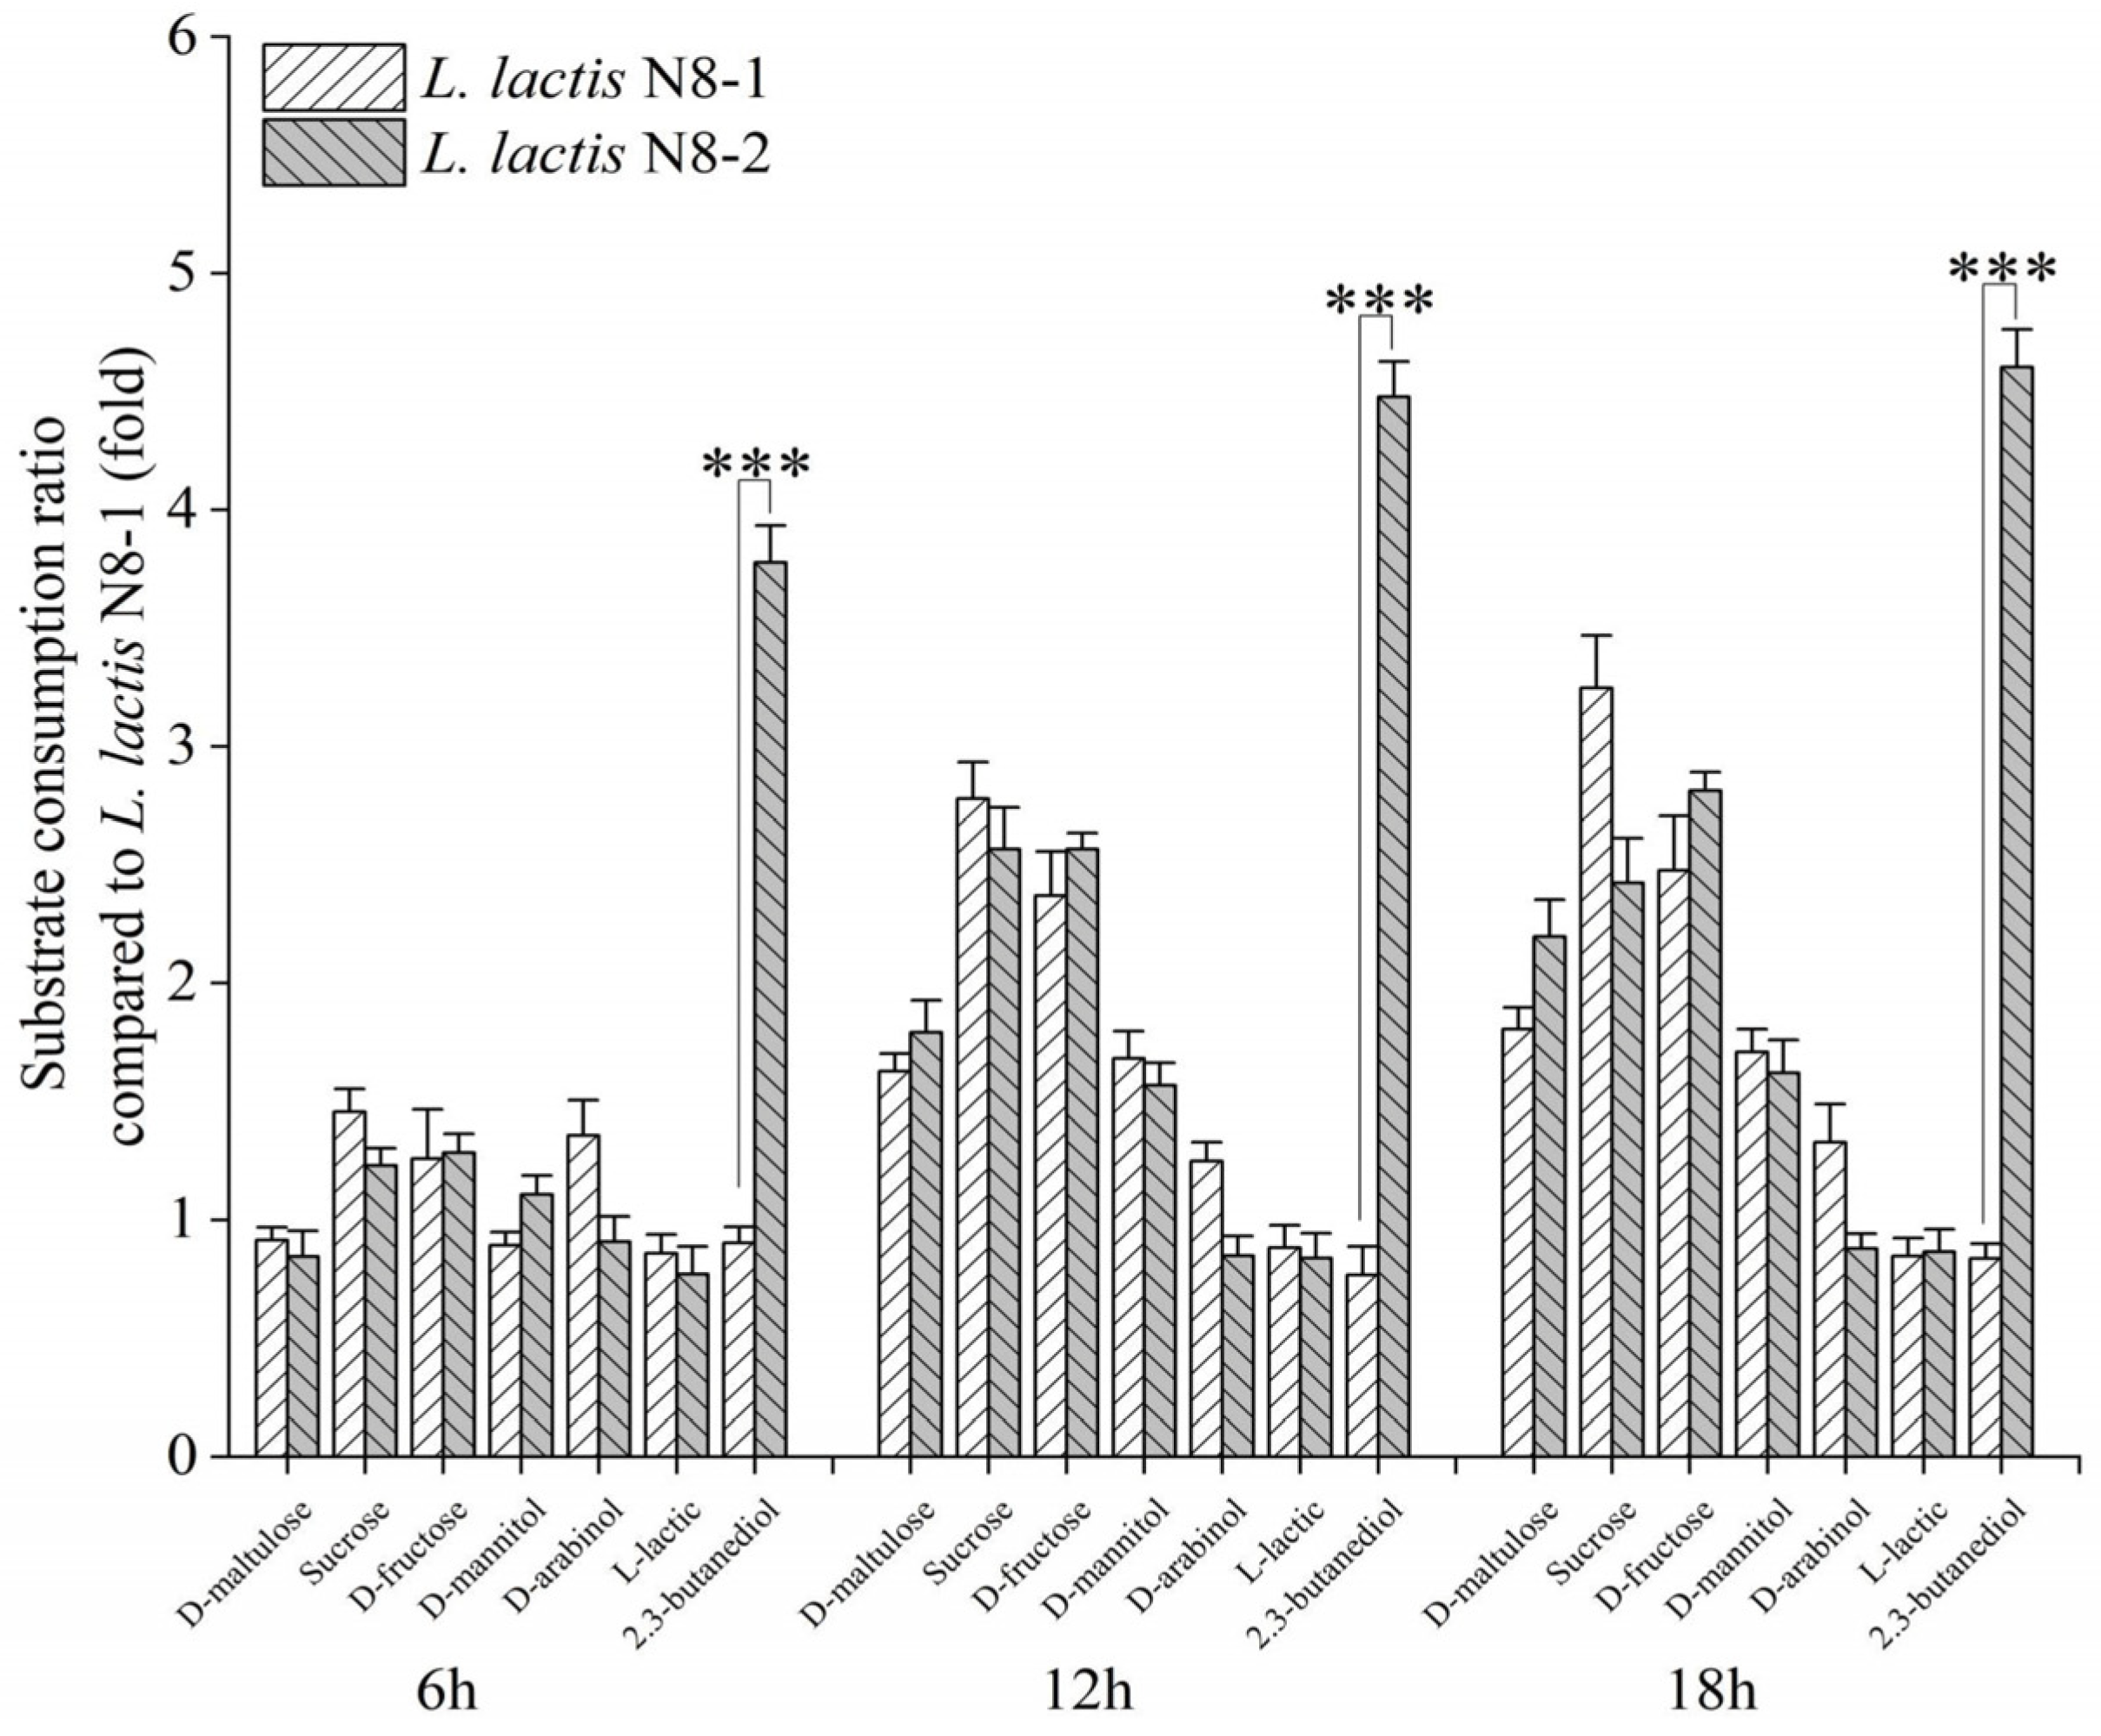
3.1. Microarray Analysis of Mutants’ Phenotypes

To gain a comprehensive understanding of the strain background of these large fragment deletion strains, we employed a Biolog phenotypic microarray system. We investigated the metabolic capabilities of the deletion strains L. lactis N8-1 and L. lactis N8-2 using various carbon sources. We examined the utilization of multiple sugars, acids, and alcohols as carbon sources and collected data at 6 h, 12 h, and 18 h time points (Figure 1). In the metabolic processes involving D-maltose, sucrose, and D-fructose as carbon sources, the utilization of L. lactis N8-2 exhibited different levels of increase at 12 h and 18 h as opposed to the sixth hour. However, this trend was not statistically significant when compared with L. lactis N8-1. Correspondingly, in the metabolism of mannitol and D-arabinol, although some increase was observed in the later stages, the difference in utilization between the L. lactis N8-2 and L. lactis N8-1 strains was not found to be significant. Interestingly, L. lactis N8-2 demonstrated a substantial increase of approximately 3.7-fold, 4.4-fold, and 4.6-fold at 6 h, 12 h, and 18 h, respectively, compared to L. lactis N8-1 when 2,3-butanediol was used as the carbon source. The Biolog method is an approach used to measure the diversity of microbial metabolic functions based on the metabolic response patterns induced by different substrates. Tsigkrimani et al. [29] successfully identified lactic acid bacteria in ripened Feta and Kefalograviera cheeses by using Gen III plates combined with other molecular techniques. In another study, Connor et al. [36] tested for differences in carbon sources among three bacterial strains using PM1 assay plates. They detected significant differences in 34 carbon sources and identified multiple genes related to carbon metabolism.

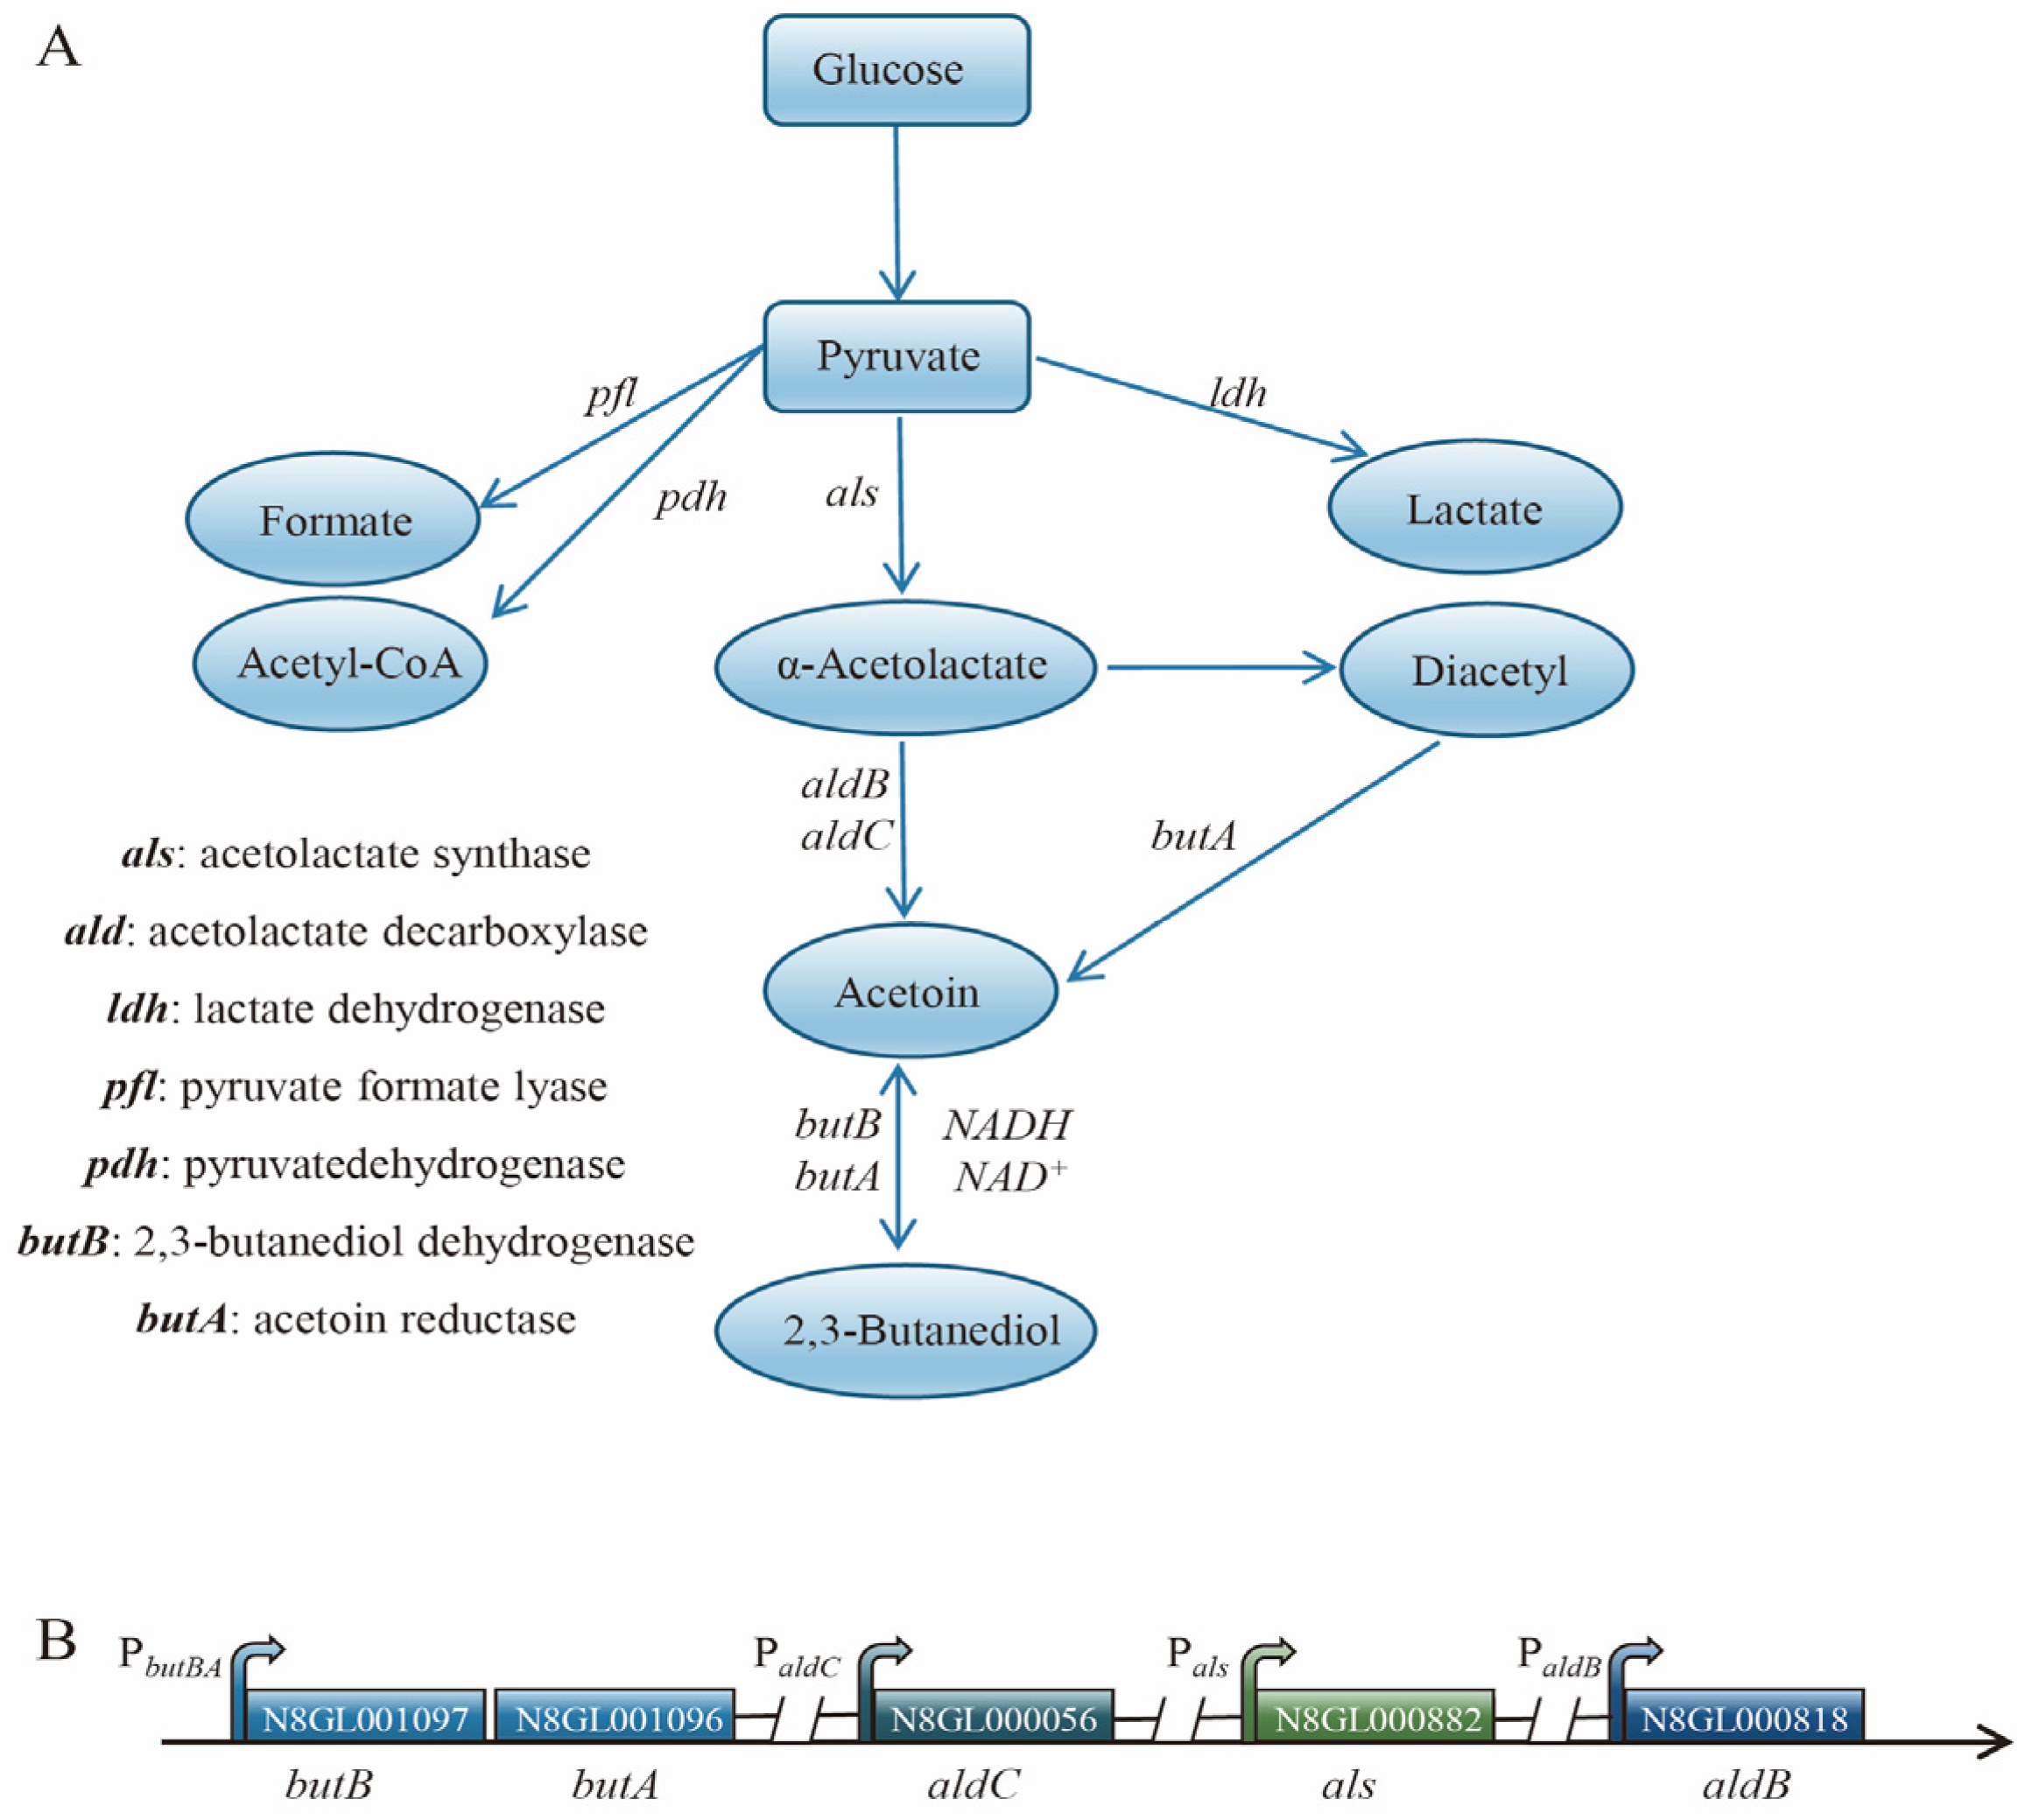
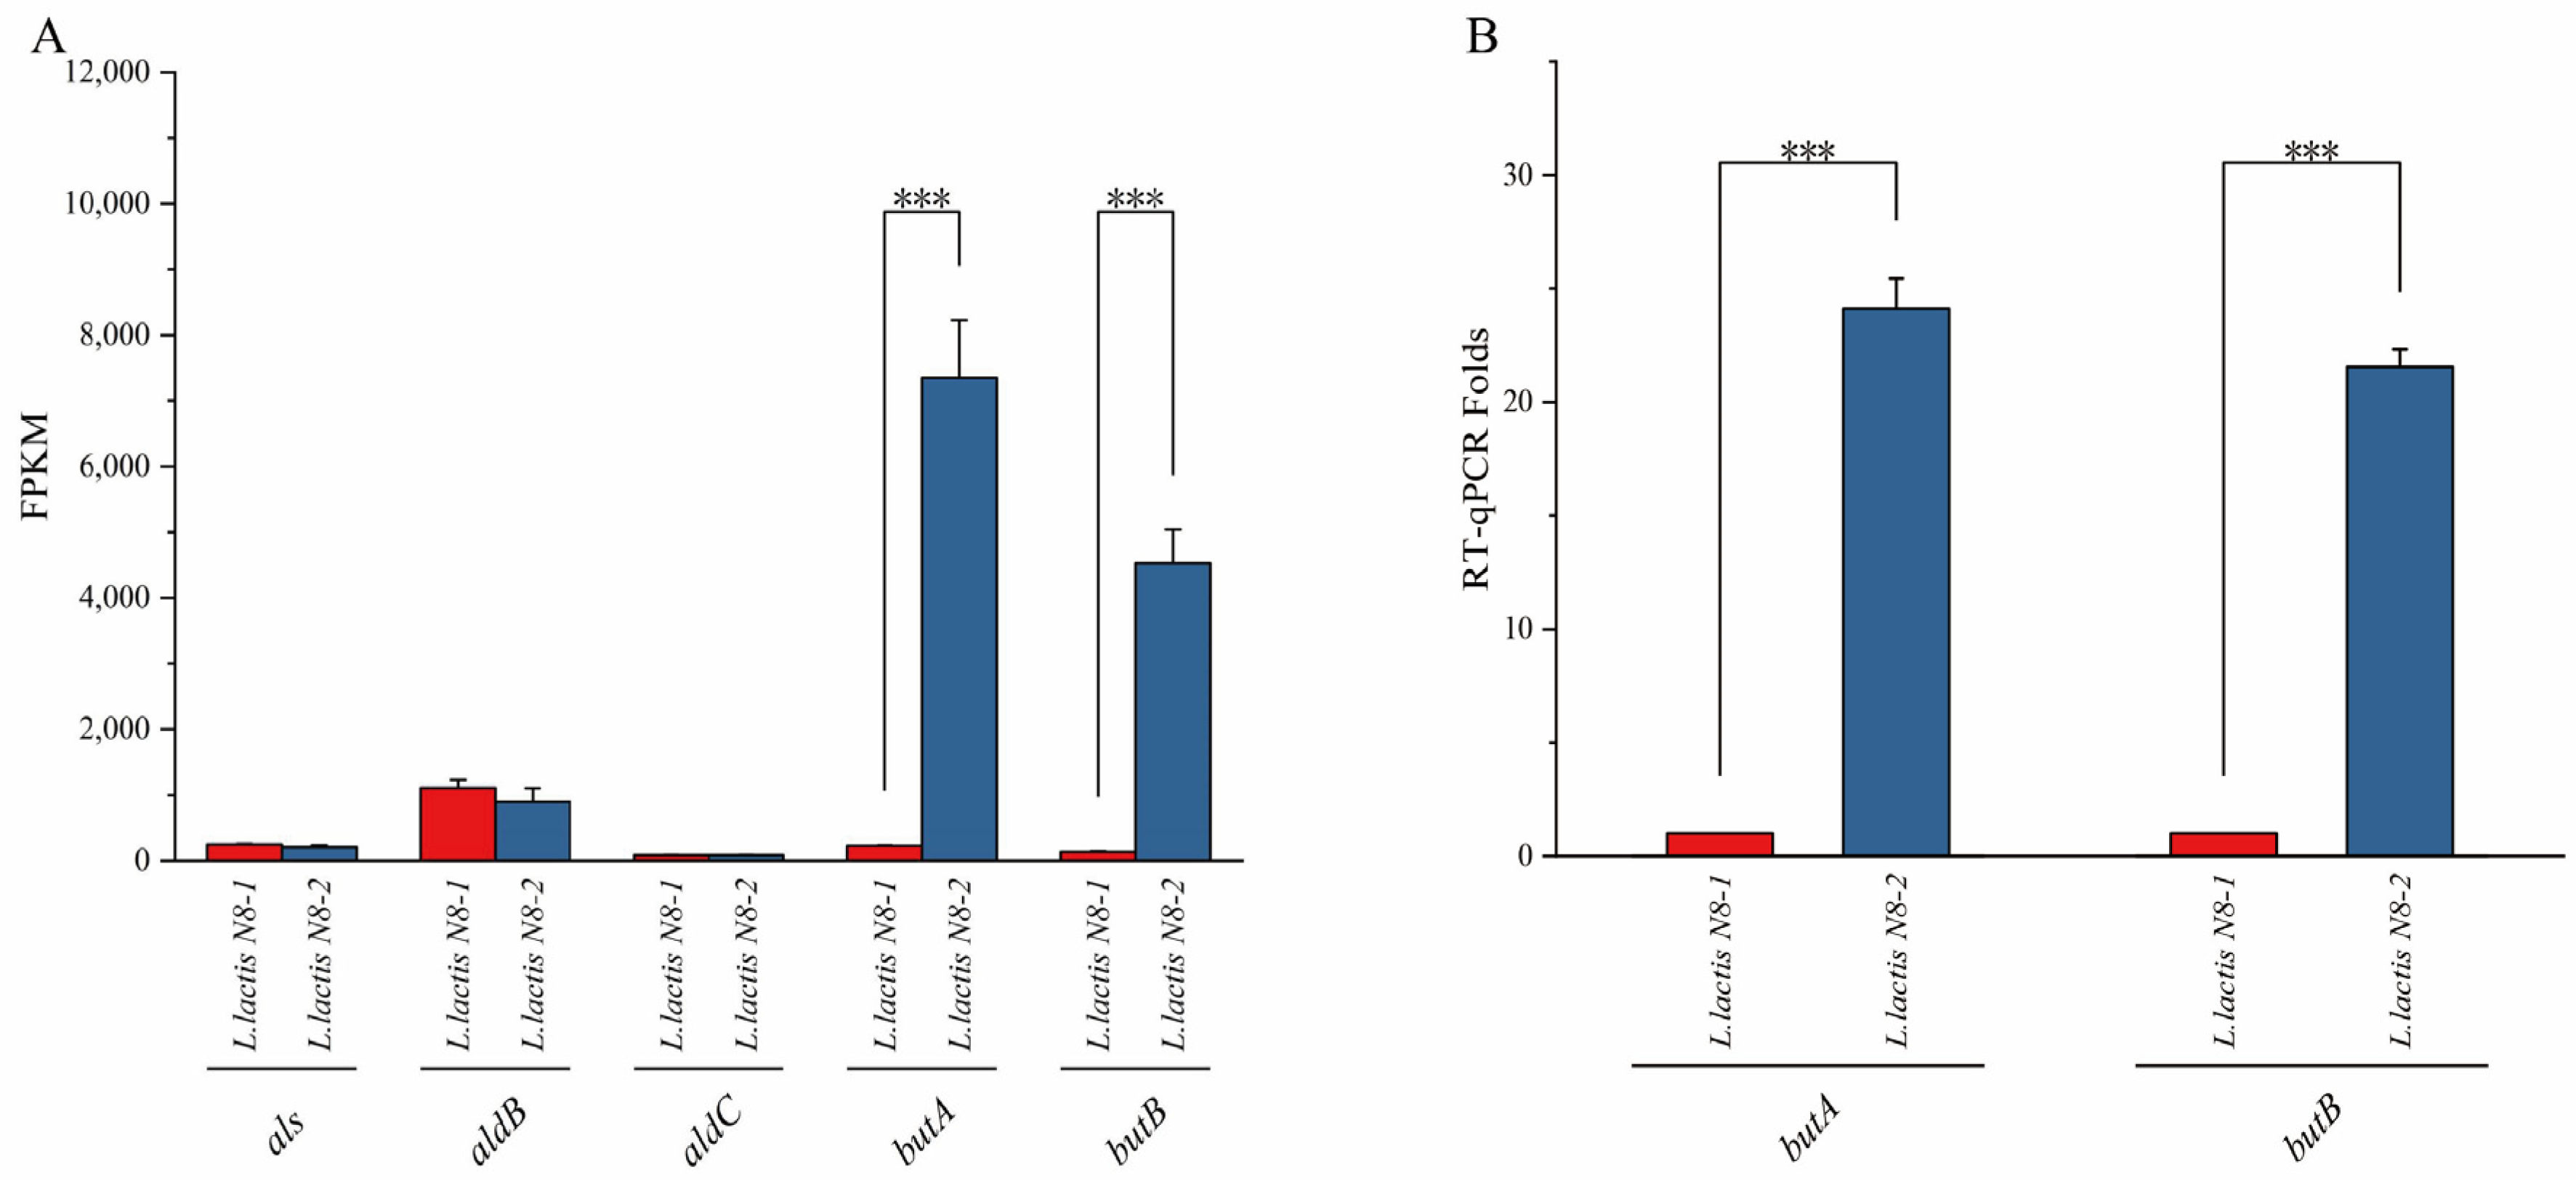
3.2. Analysis of the Metabolic Pathways of 2,3-Butanediol and the Identification of Differentially Expressed Genes in L. lactis N8

In Biolog phenotyping, it was observed that L. lactis N8-2 exhibits a notably heightened ability to metabolize 2,3-butanediol. In collaboration with the Lactococcus lactis subsp. lactis IL1403 (KEGG GENOME: Lactococcus lactis subsp. lactis IL1403) metabolic pathway of Lactococcus lactis IL1403, we conducted a gene count for the 2,3-butanediol metabolic pathway in L. lactis N8-2 (Figure 2A). Each gene within this pathway plays a distinct role in the synthesis of 2,3-butanediol. First, glucose undergoes glycolysis to produce pyruvate. Pyruvate is then converted into formic acid, acetyl coenzyme A, and lactate by the pfl, pdh, and ldh enzymes, respectively. Additionally, pyruvate is transformed into α-acetyl lactate by the α-acetyl lactate synthetase enzyme encoded by the als gene. Afterward, α-acetyl lactate is further converted into acetoin by acetylacetate decarboxylase enzymes encoded by the aldB and aldC genes. At the same time, diacetyl can also be catalyzed by butA to produce acetoin. Acetoin is then utilized in the synthesis of 2,3-butanediol with the assistance of acetoin reductase/2,3-butanediol dehydrogenase encoded by the 2,3-butanediol dehydrogenase gene cluster. In this study, we explored the role of acetoin reductase/2,3-butanediol dehydrogenase in catalyzing the metabolic pathway for the generation of acetoin from 2.3-butanediol.
The biosynthesis of 2,3-butanediol in L. lactis N8 is enabled by a set of five crucial genes (Figure 2B). These genes differ from those found in the typical 2,3-butanediol-producing strains, Klebsiella sp., and Bacillus sp., because the key genes responsible for 2,3-butanediol synthesis are organized in a cohesive regulatory structure that is uniformly controlled by the relevant genes [37]. Nevertheless, in L. lactis N8, these genes are located in different regions of the genome, except butB and butA, which are transcribed together under the same promoter, PbutBA. The remaining three genes formed separate transcription units that were regulated by their respective promoters (Figure 2B).
According to transcriptome sequencing analysis, in L. lactis N8-2, which exhibited enhanced utilization of 2,3-butanediol, the expression levels of butA and butB were approximately 32-fold and 33-fold higher, respectively, than those in L. lactis N8-1 (Figure 3A). Additionally, the transcript abundance of butA and butB in L. lactis N8-2 showed increases of approximately 24-fold and 21-fold, respectively (Figure 3B), which were slightly lower than the 30-fold difference observed in the transcriptome assay. However, the overall trend was consistent. Based on these findings, it can be concluded that the enhanced expression of the butBA gene in the deletion strains was primarily due to genomic alterations that occurred during the construction of L. lactis N8-2. Moreover, the protein encoded by this gene exhibited bi-directional catalytic activity, which, along with the characterization of its function, showed that the heightened expression of butBA was the primary factor contributing to the enhanced utilization capacity of 2,3-butanediol in the metabolic outcomes observed in the Biolog phenotype microarray analysis of the L. lactis N8-2 strain. We aimed to investigate the regulatory mechanisms of butBA in L. lactis N8-2.

3.3. Whole-Genome Complete Map Sequencing of L. lactis N8-2

To explore the factors contributing to the elevated expression of butBA in transcriptome experiments and Q-PCR results and to gain a more comprehensive understanding of the background of this strain, we conducted whole-genome sequencing of L. lactis N8-2. Our analysis of the complete genome sequence of L. lactis N8-2 revealed a single-base mutation located −46 upstream of PbutBA, specifically a change from guanine to thymine, resulting in a substitution from G to T (Figure 4A). To evaluate the promoter’s expression capability following a point mutation, we initially chose appropriate reporter genes to construct plasmids and subsequently analyzed their respective expression abilities.

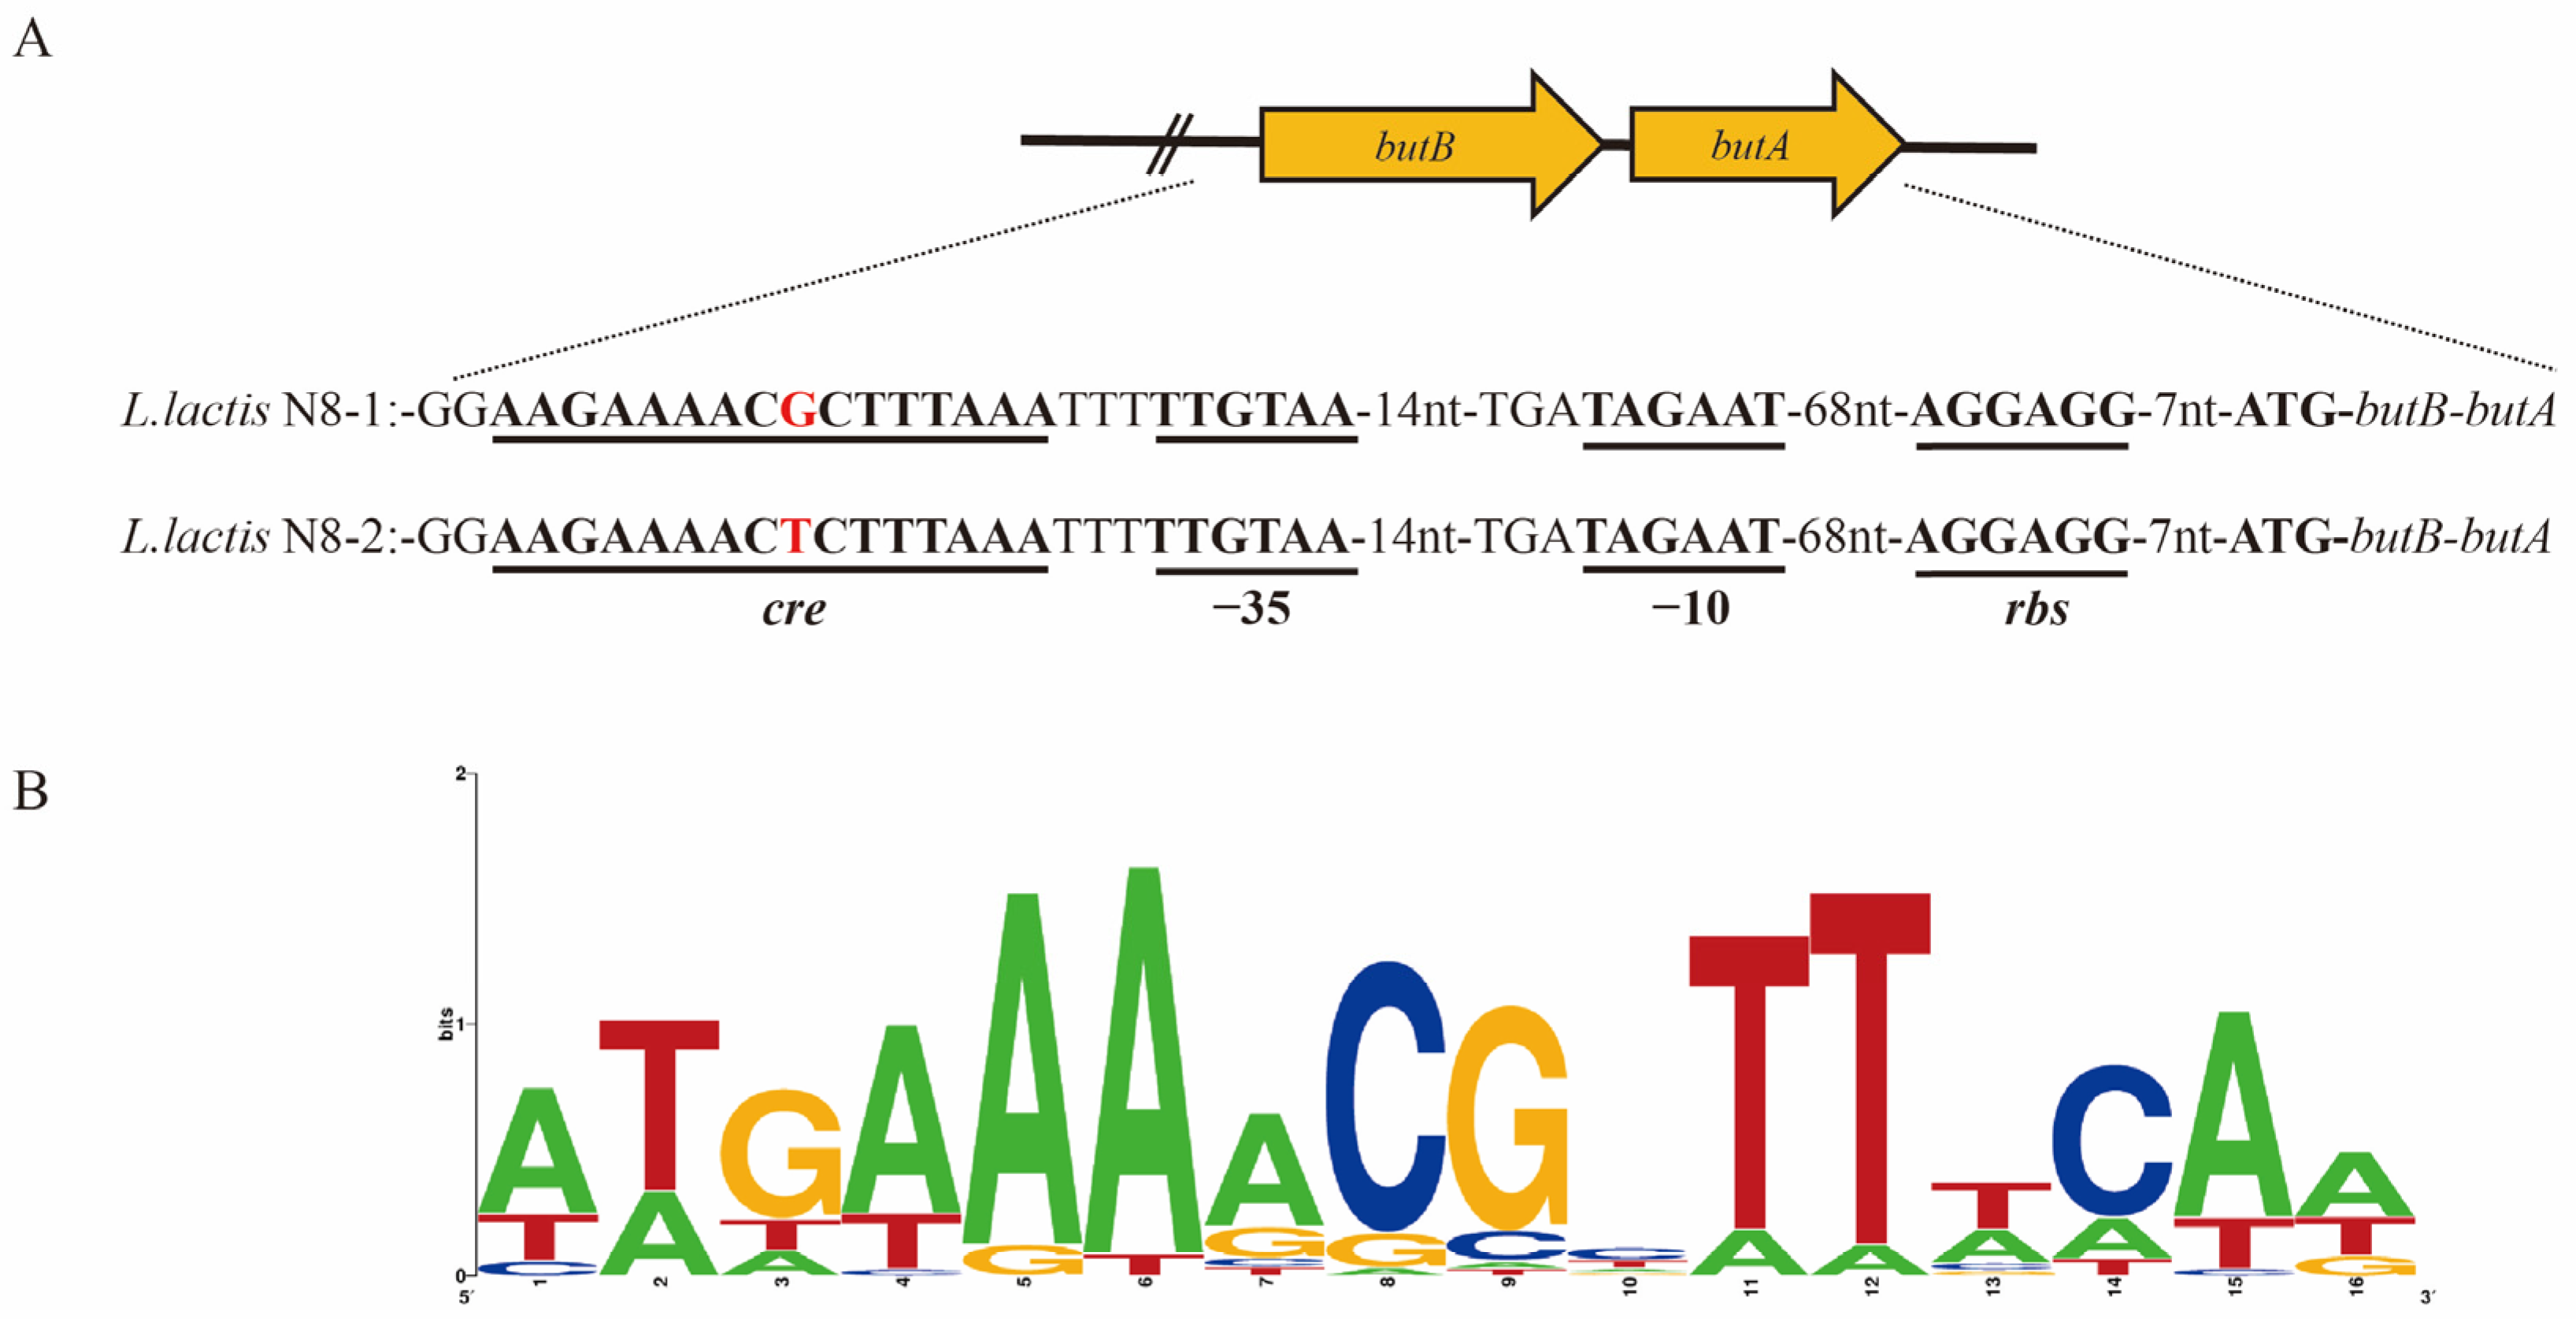
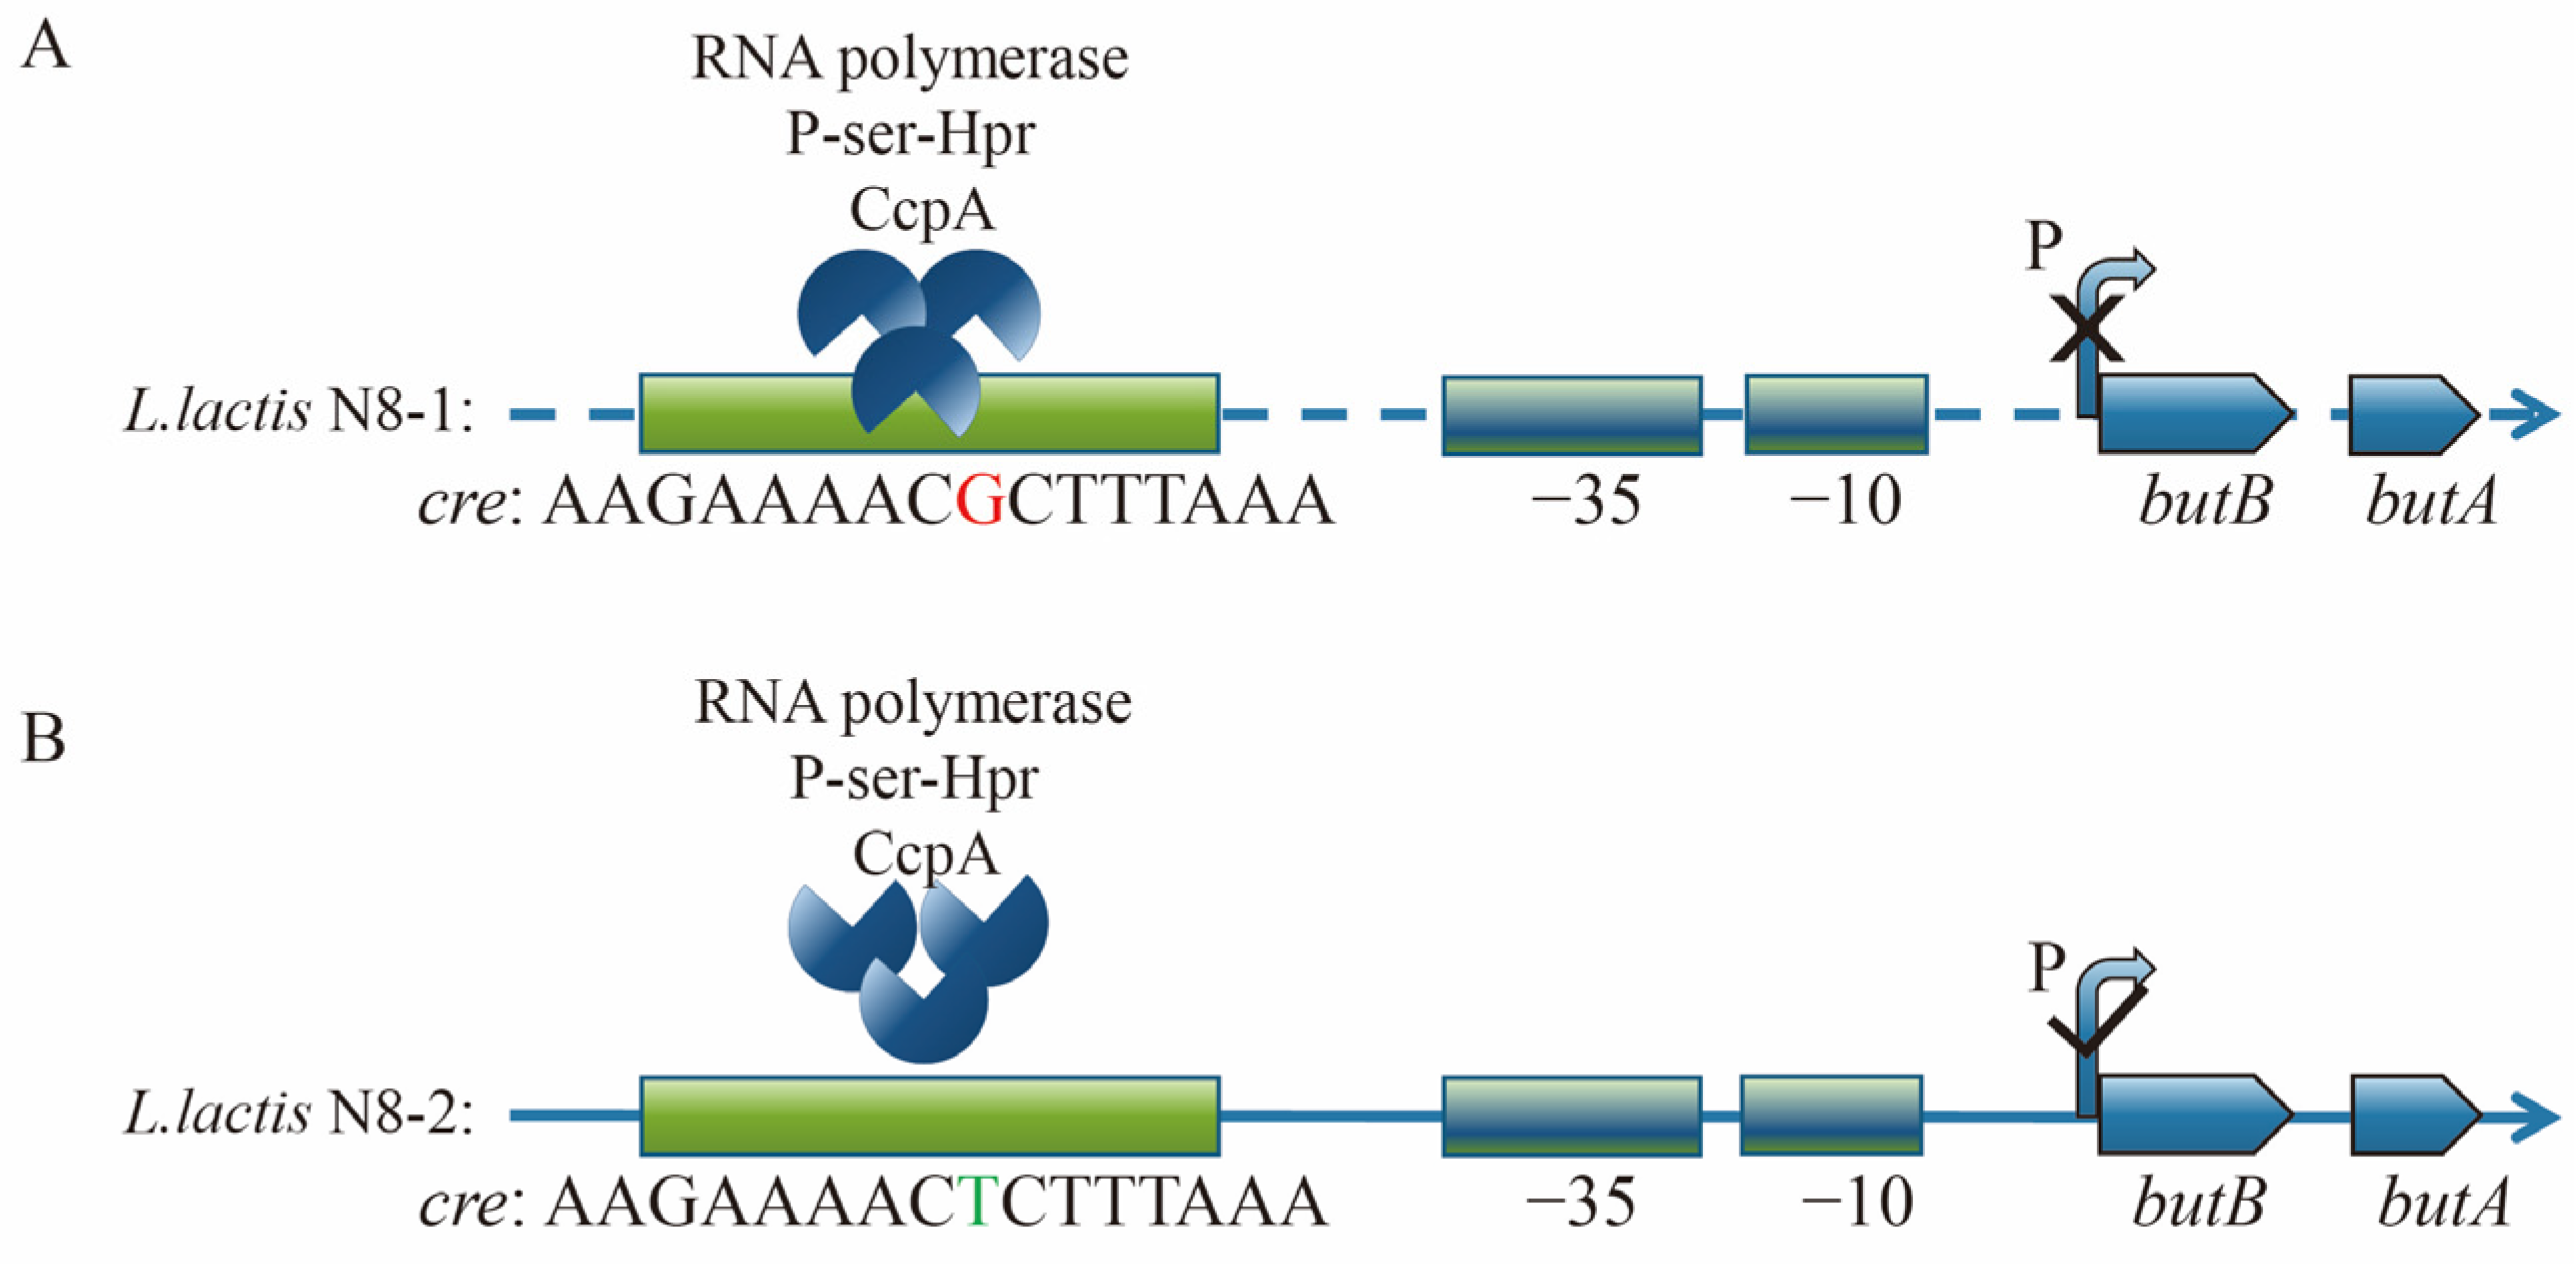
3.4. Analysis of the Promoter Region of the butBA Gene in L. lactis N8

We combined the roles of promoters in bacteria and then explored the promoter of 2,3-butanediol dehydrogenase in L. lactis N8. In 2008, Nieves et al. analyzed the butBA gene cluster of Lactococcus lactis IL1403 [27]. The study revealed that the two genes within the cluster, butB and butA, were transcribed from the same promoter, known as PbutBA. However, the expression of these genes was weak. The promoter region −10 of PbutBA was found to have a TAGAAT sequence, which differs from the regular promoter sequence TATAAT [38]. Furthermore, the spacing between the −10 and −35 regions was observed to be 14 bp, which deviates from the conventional strong promoter spacing of 16–19 bp. Based on these findings, it was concluded that the promoter of the butBA gene cluster could only function as a weak promoter.

3.5. Preliminary Testing of the Impact of Point Mutations on Promoter Activity

Based on the results of sequencing and analyses of the promoter structure, it has been determined that PbutBA contains intact −10, −35, and rbs sequences. To validate the expression ability of the promoter, we selected the chloramphenicol (cat) and red fluorescent protein (rfp) reporter genes. In this study, we used the genomes of L. lactis N8-1, L. lactis N8-2, and pLEB124 as templates for our experiments. We successfully obtained the recombinant plasmids pLEB124-P1-cat, pLEB124-P2-cat, and pLEB124-P45-cat. Furthermore, the chloramphenicol reporter gene was substituted with rfp to acquire the recombinant plasmids pLEB124-P1-rfp, pLEB124-P2-rfp, and pLEB124-P45-rfp (Figure 5A).
The minimum inhibitory concentration (MIC) of the N8-1-P45-cat, N8-1-P1-cat, N8-1-P2-cat, N8-2-P45-cat, N8-2-P1-cat, and N8-2-P2-cat strains was tested against 150 μg/mL chloramphenicol. The results indicated that, with the exception of the positive control (pLEB124-P45-cat), no significant changes in tolerance were observed (Table 3). Furthermore, in the fluorescence intensity assays conducted on strains N8-1-P1-rfp, N8-1-P2-rfp, N8-2-P1-rfp, and N8-2-P2-rfp, no significant difference in fluorescence intensity was observed.

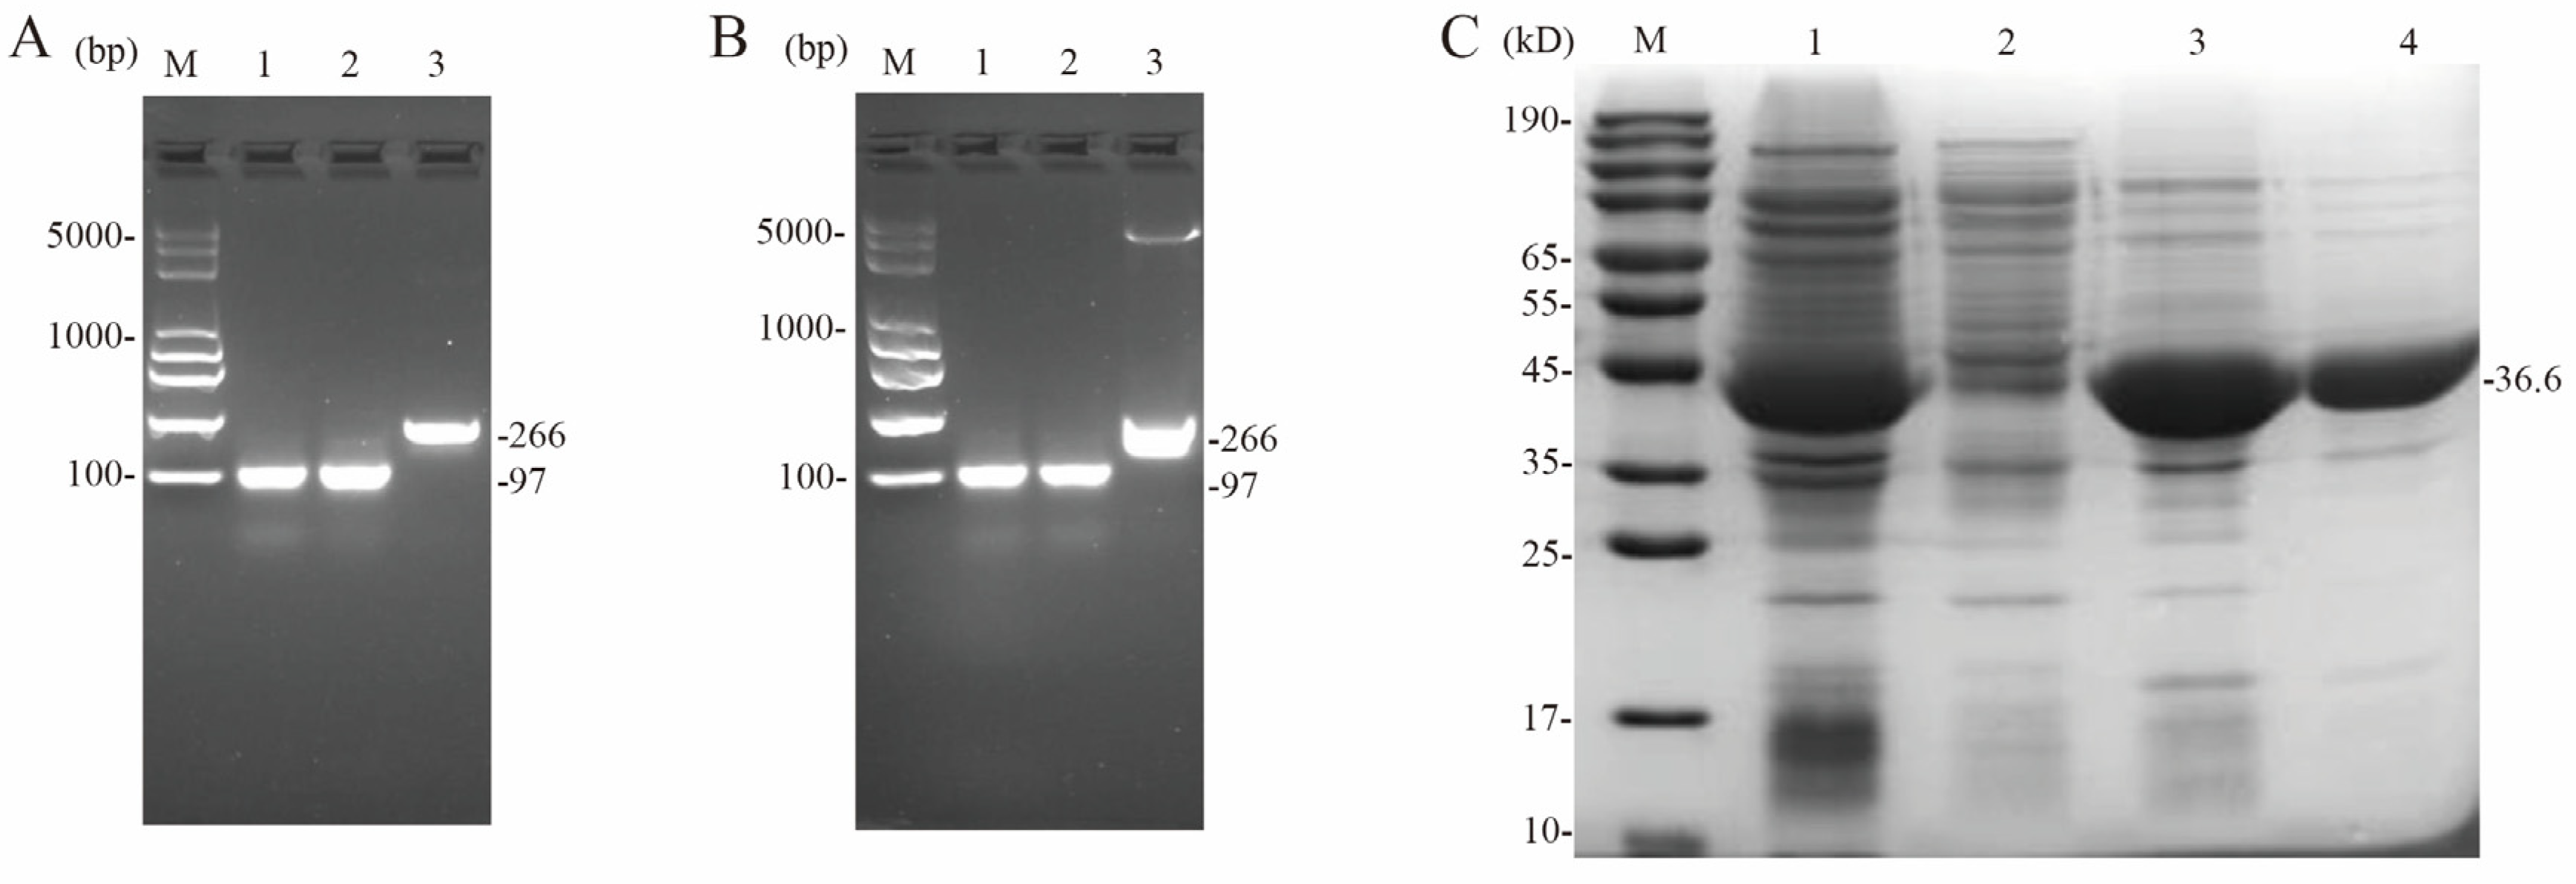
3.6. Structural Analysis of the Transcriptionally Active Functional Region of the butBA Gene Cluster

Through previous promoter validation studies, we could not determine the cause of the increased expression of the butBA gene. Therefore, we tested the expression ability of the PbutBA promoter by linking the complete butB gene post-transcription. pLEB124-P1-butB-cat and pLEB124-P2-butB-cat were constructed following the methods described in Figure 5B. N8-1-P1-butB-cat, N8-1-P2-butB-cat, N8-2-P1-butB-cat, and N8-2-P2-butB-cat were analyzed for chloramphenicol tolerance assays, as shown in Table 4. The strain harboring plasmid pLEB124-P2-butB-cat, which carries a mutated promoter, exhibited 11-fold higher tolerance to chloramphenicol than the strain with the unmutated promoter. This observation implies that a point mutation in the PbutBA promoter significantly affects its transcriptional expression. It can be inferred that this mutation is located within the binding site of an unidentified transcriptional repressor in L. lactis N8-2.

3.7. Mechanistic Analysis and Exploration of butBA Promoter Point Mutation Resulting in Enhanced Expression of Its Gene Cluster

In the above experiment, we comprehensively analyzed and verified the underlying cause of elevated expression of the butBA gene cluster in L. lactis N8-1 and L. lactis N8-2 strains. We identified a single-base mutation at position −46 in the PbutBA promoter of L. lactis N8-2, specifically a mutation from guanine to thymine, as the factor responsible for this observed phenotype. Additionally, our sequencing results indicated no alterations in the −35 region, −10 region, or spacer region between the two. Previous experiments have established that the primary factor contributing to the increased transcriptional ability of the PbutBA promoter is the occurrence of point mutations. RegPrecise (http://regprecise.lbl.gov, accessed on 1 September 2021) is a web resource for the collection, visualization, and analysis of transcriptional regulons reconstructed by comparative genomics [39]. By consulting this database, we find that regulation of butB and butA by the global transcriptional regulator CcpA in Lactococcus lactis IL1403 has been included in this website. The binding motifs of CcpA for both butB and butA were identified with a score of 4.9, and the binding sequence was determined to be AAGAAAACGCTTTAAA (Figure 4B). Notably, this sequence is identical to the cre target site of the CcpA protein in L. lactis N8.
A literature review revealed that the homologous region of 16 bp in the PbutBA promoter shares an identical sequence with cre, which serves as the target site for the CcpA protein. The CcpA protein is known to regulate carbon metabolism in Lactococcus lactis [40]. In a study, Aldert L. Zomer et al. [40] noted significant changes in the transcription of numerous genes related to carbon source metabolism after the deletion of CcpA proteins in Lactococcus lactis MG1363. In particular, a 3- to 5-fold increase in butBA gene cluster transcription was observed. Conversely, our findings demonstrate a much higher transcription initiation ability following a single-base mutation in the PbutBA promoter in L. lactis N8-2.

3.8. Preparation of Fluorescent Probes and Purification of CcpA Proteins

The genomes of L. lactis N8-1 and N8-2 were used as templates for this study. PCR amplification was performed using primers containing homology arm sequences of the 16 bp cy5 primer sequence to obtain the target fragments N8-1-cre (97 bp), N8-2-cre (97 bp), and N8-16s (266 bp) (Figure 6A). The ligation vector pEASY-T1 was used to generate pEASY-N8-1-cre, pEASY-N8-2-cre, and pEASY-N8-16s recombinant vectors through white/blue screening. Each of the three recombinant plasmids served as a template for subsequent PCR amplification using the cy5 fluorescent primer (Figure 6B). Following the heterologous expression of pETm3c-CcpA, protein purification was conducted, and the eluted target proteins were desalted using dextran gel G-75. SDS-PAGE results were collected for further analysis (Figure 6C).

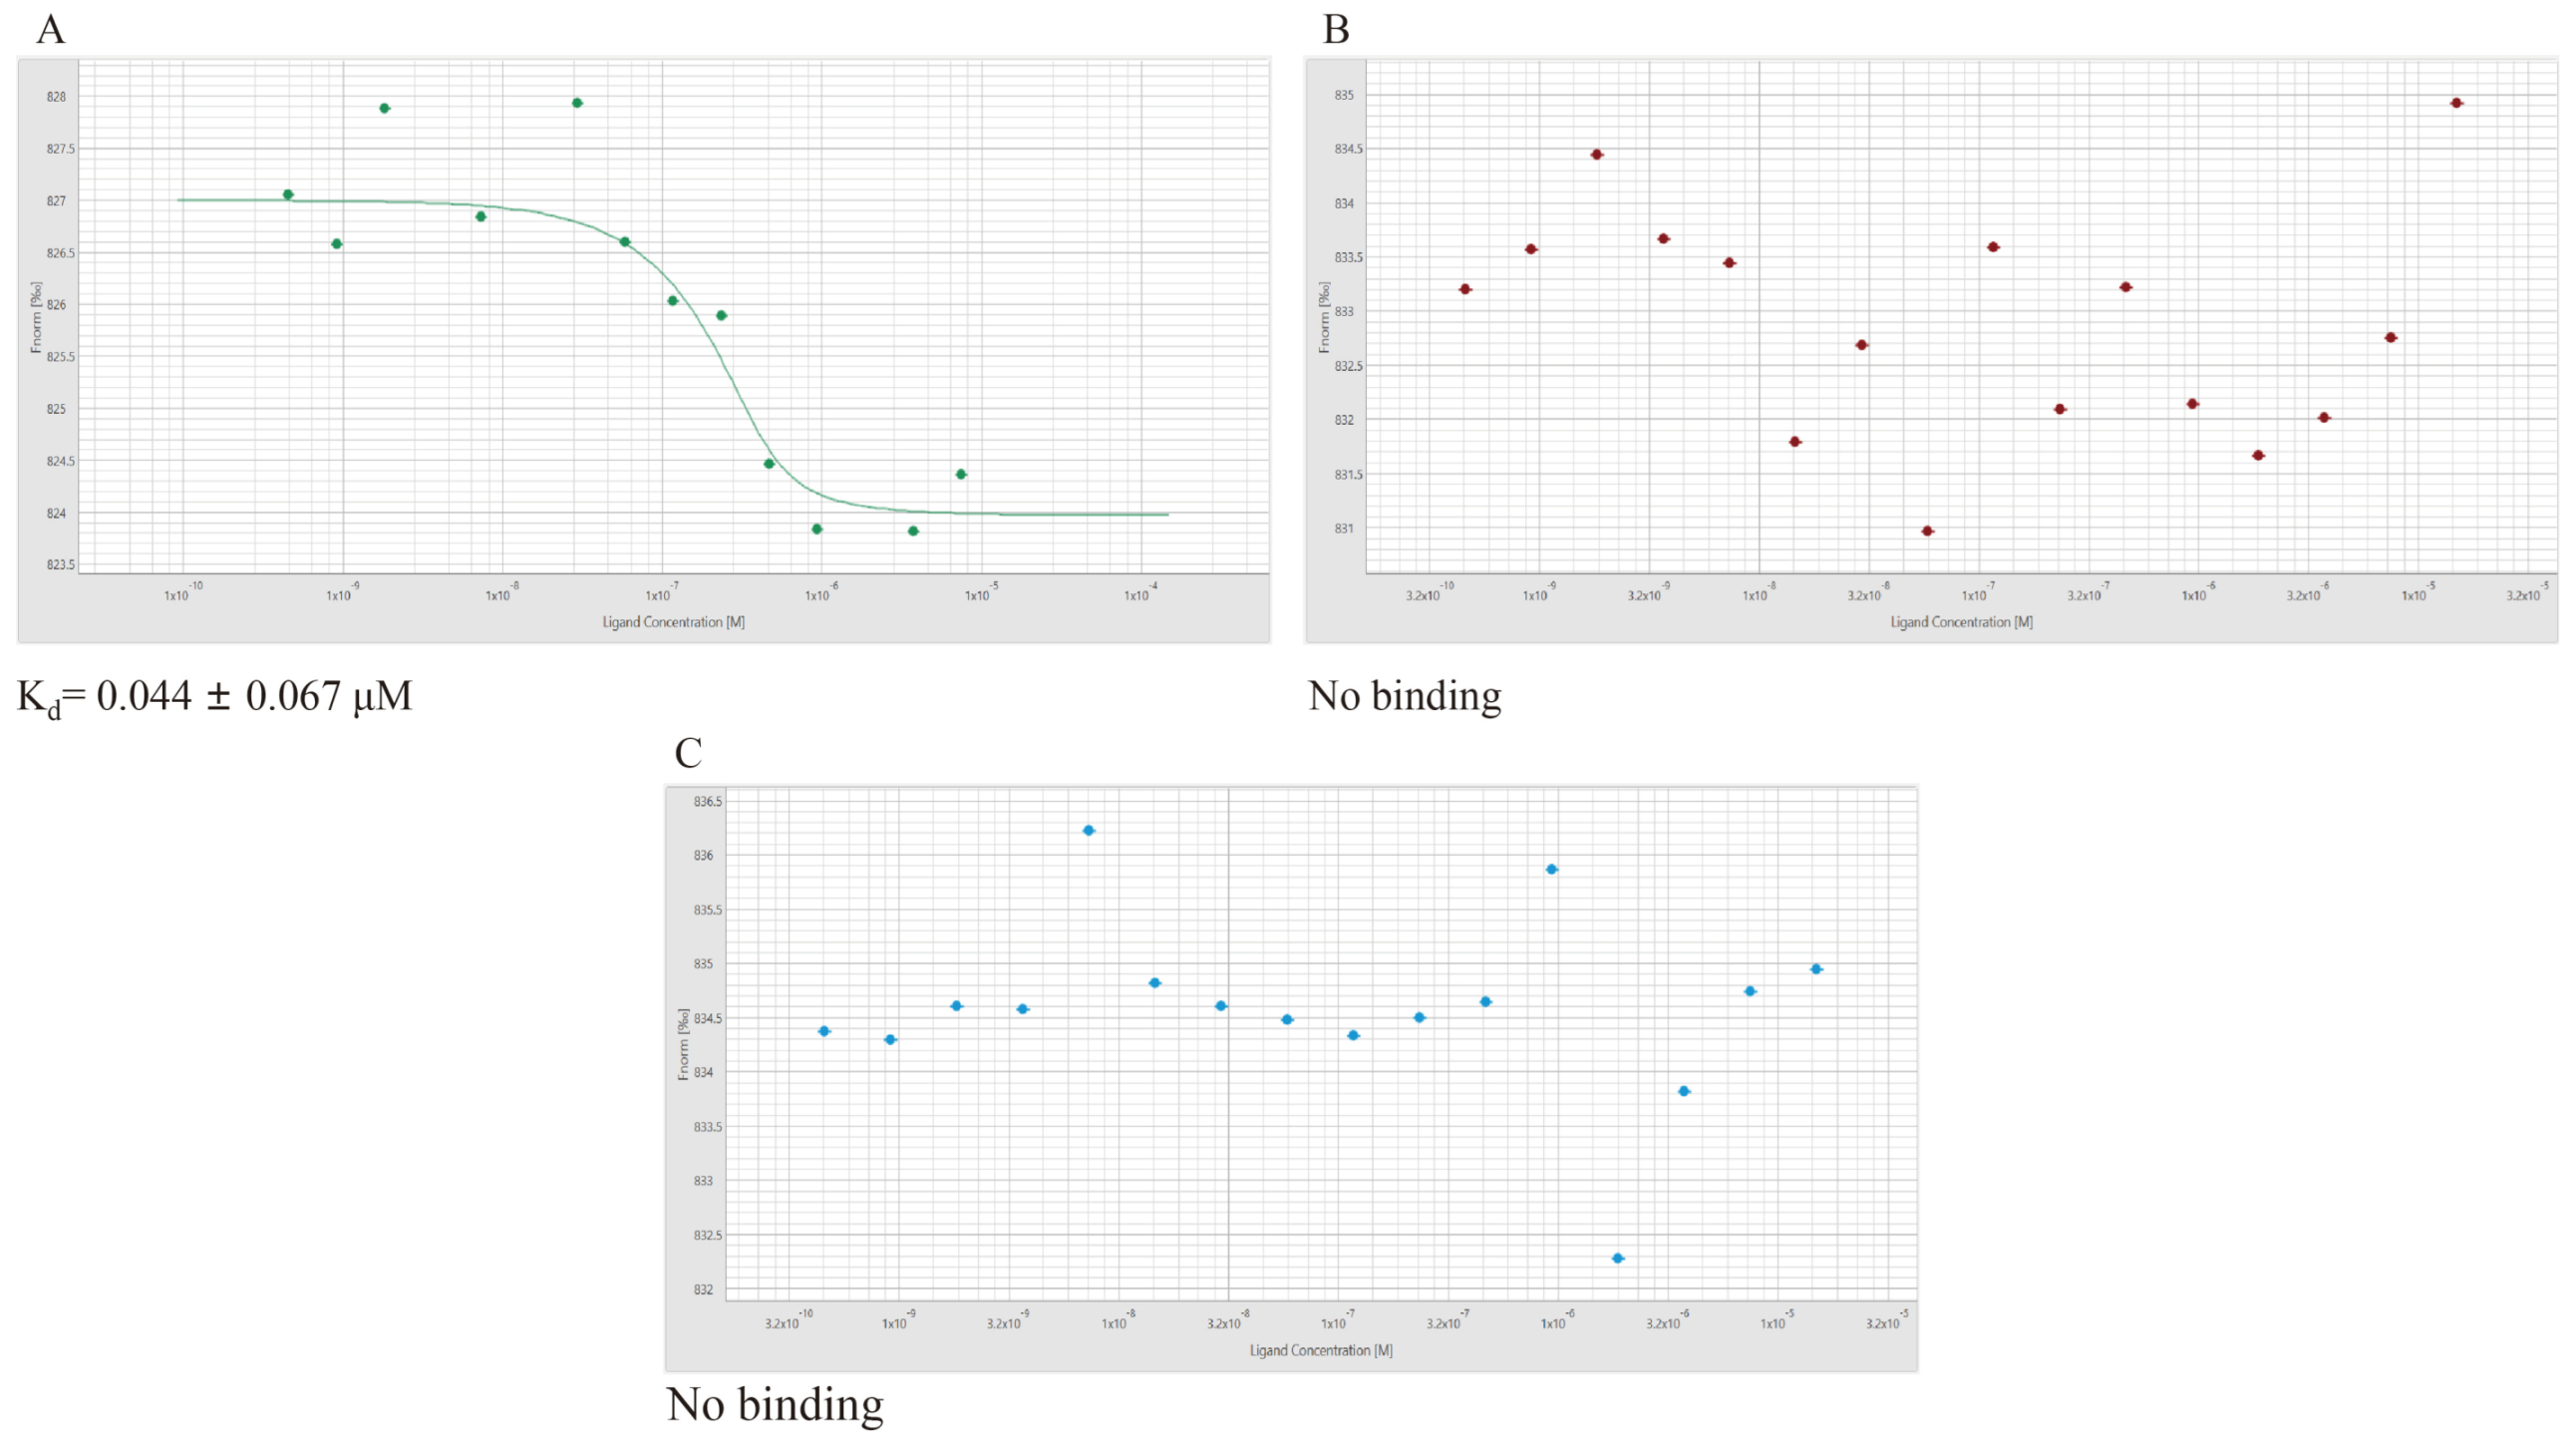
3.9. Micro-Scale Thermophoresis (MST)

To determine the KD value of the apparent kinetic constant for the binding of the CcpA protein to the nucleic acid molecules N8-1-cre, N8-2-cre, and N8-16s and to investigate the binding of CcpA to N8-1-cre and N8-2-cre, with N8-16s as a control, we compared the binding kinetic curves and affinity constants. This was performed by monitoring the distribution of fluorescent signals and measuring the molecular distribution in the temperature gradient field. MST experiments were performed to determine the apparent kinetic constant KD for protein binding to nucleic acid molecules. The concentration-stationary phase utilized Cy5 probe-labeled DNA, whereas the target protein was gradient-diluted using a 2-fold dilution method. The resulting binding kinetic curves of CcpA and the target DNA were analyzed. Finally, we obtained binding kinetic curves and affinity constants. The binding of the target protein to N8-1-cre can be accurately represented by an “S-shaped” curve, indicating a strong binding trend between the two. The measured affinity constant Kd was 0.044 ± 0.067 μM (Figure 7A). Nevertheless, when the binding motif (cre) was mutated, the binding of the global transcriptional regulator CcpA to N8-2-cre was disorganized and scattered. In this case, an “S-shaped” curve could not be fitted, suggesting the absence of a binding trend between the target protein and mutated motif. Consequently, the affinity constant cannot be determined (Figure 7B). At the same time, the interaction between CcpA and the 16s DNA showed a disordered scattering pattern, which made it impossible to measure the affinity constant (Figure 7C). When there is a clear binding trend between the binding protein and the target DNA, the results exhibit an “S-shaped” curve [41]. Conversely, in the absence of a binding trend between the binding protein and the target DNA, the results appear as scattered dots. The MST assay showed that a mutation in the binding motif resulted in the loss of CcpA-binding capability and its subsequent inability to interact with the binding motif. The DNA-binding properties of CcpA are key to its global function, which includes the utilization of two separable DNA-binding modules, the HTHLH motifs and the hinge helices. When the cre motif is changed, the binding of CcpA to cre is also changed. The binding curves were randomly scattered, signifying that the mutation caused CcpA, which is the regulator of the 2.3-butanediol dehydrogenase gene cluster in L. lactis N8-2, to detach from cre and lose its role in regulating the gene cluster. This resulted in the activation of the expression of downstream genes.

3.10. Construction of a Bacterial System for Fluorescent Hybridization Using Two Plasmids

To study the in vivo binding of CcpA to the cre site, we generated target validation strains by constructing N8-1-cre and N8-2-cre DNA sequences at the N-terminus of the eGFP gene in the pACYC-eGFP vector. Moreover, the CcpA gene was constructed using the pRSF-Duet vector (Figure 8A). Electrotransformation of pRSF-CcpA with pACYC-N8-1-cre-eGFP and pACYC-N8-2-cre-eGFP was performed in E. coli BL21(DE3) competent cells (Figure 8B).

3.11. Determination of Growth Trends and Fluorescence Values in Two-Hybrid Plasmid Strains

To provide further evidence of CcpA binding and dissociation from the cre site in vivo, we used a fluorescent reporter system to visualize the fluorescent strains. (Figure 8C). The fluorescence values of the strains carrying only the N8-1-cre-eGFP and N8-2-cre-eGFP plasmids were similar. However, when CcpA was present, the expression of green fluorescent protein in the CcpA-N8-1-cre-eGFP hybrid strain was significantly reduced. In contrast, there was no significant change in the intensity of green fluorescent protein expression in the CcpA-N8-2-cre-eGFP strain initiated by N8-2-cre. Therefore, it can be concluded that CcpA did not bind to cre. As a result, downstream eGFP gene transcription was not affected, and there was no significant change in green fluorescent protein expression. The results presented above indicate that the mutation of guanine to thymine at the eighth position in the cre sequence 5′-AAGAAAACGCTTTAAA-3′ is crucial for the alleviation of the transcriptional repression of downstream genes by CcpA.

3.12. A Comparative Analysis of the Metabolic Responses of L. lactis N8-2 and L. lactis N8-1 to Varying Concentrations of 2,3-Butanediol

According to the findings from the Biolog phenotype microarray analysis, it was observed that the utilization rate of L. lactis N8-2 could be enhanced four times compared to that of L. lactis N8-1 when 2,3-butanediol was employed as the carbon source. To compare the catalytic activity of 2,3-butanediol by 2,3-butanediol dehydrogenase in L. lactis N8-1 and L. lactis N8-2, and thus the utilization of the substrate by both strains, an investigation was conducted to determine the optimal concentration of 2,3-butanediol metabolized by L. lactis N8-2 in the presence of 2,3,5-triphenyl-2H-tetrazolium chloride (TTC) as an indicator. Tetrazolium salts, which are colorless compounds, become colored when reduced to form formazans. They are used as indicators in prokaryotic cells to detect dehydrogenase activity in metabolism [42]. The reduced form of TTC has a distinctive color that enables the accurate and easy detection of enzyme metabolism. The metabolic viability of the strains was assessed. The gradient concentrations of 2.3-butanediol are shown in Figure 9A. Based on the results shown in Figure 9B, the most significant change in color was observed at a substrate concentration of 0.01%, indicating that L. lactis N8-2 exhibited the highest metabolic rate at this concentration. According to the results, 2,3-butanediol dehydrogenase was more catalytically active in metabolizing 2,3-butanediol in L. lactis N8-2 than in L. lactis N8-1. This is because, in the point mutant strain L. lactis N8-2, the mutation of cre causes dissociation of CcpA and cre. Subsequently, in the regulation of central carbon metabolism, the global transcriptional regulator CcpA deregulates the repression of the 2,3-butanediol dehydrogenase gene cluster and activates its expression.
To provide a clearer understanding of the variations in the utilization of 2,3-butanediol by the two strains, we analyzed the absorbance over the initial ten-hour period at concentrations of 0.005% TTC and 0.01% 2,3-butanediol. As depicted in Figure 9C, the catalytic activity of the L. lactis N8-2 metabolism exhibited a continuous increase, indicating the high catalytic activity of 2,3-butanediol dehydrogenase after derepression of CcpA inhibition. In contrast, L. lactis N8-1 is regulated by inhibition of CcpA, resulting in a very low metabolic capacity when 2.3-butanediol is used as a carbon source.
Bacterial transcription factors are typically composed of a regulatory domain and a DNA-binding domain. The DNA-binding domain binds to the bacterial promoter region or transcriptional region, either repressing or activating transcription [43]. Studies have shown that the global transcriptional regulators CodY and CcpA in Staphylococcus aureus play key roles in central carbon metabolism, virulence gene expression, biofilm formation, and the preferential use of fast-acting carbon sources [44]. Positive and negative regulation of the transcription of CcpA-regulated genes involves the binding of CcpA to acting cre [45]. The expression of genes associated with pyruvate metabolism is enhanced by CcpA inactivation in Lactobacillus delbrueckii subsp. Bulgaricus [10].
Metabolic engineering of transcription factors has proven to be an effective strategy to increase the yield of target products [46,47,48]. Nevertheless, other carbon sources can also be metabolized by altering the direction of transcription factor regulation through molecular biology. CcpA is associated with the serine-phosphorylated form of the phosphocarrier protein HPr (P-ser-HPr), which binds to cre and is typically found near the promoter. This interaction can either repress or enhance the transcription of downstream operons [8]. Based on the regulatory mechanism of CcpA, coupled with the results obtained from our experimental validation, we mapped the regulation of the 2,3-butanediol dehydrogenase gene cluster by CcpA in L. lactis N8 (Figure 10). In L. lactis N8-1, the cre gene is not mutated, and CcpA can bind to cre with the help of P-ser-HPr and RNA polymerase. This binding causes a negative regulatory effect on downstream genes, leading to repression of the transcriptional expression of the 2,3-butanediol dehydrogenase gene cluster (Figure 10A). In L. lactis N8-2, the CcpA protein no longer binds to the cre site due to a mutation (Figure 10B). Consequently, downstream genes are activated, functioning as a switch to release repression and enable high expression of the 2,3-butanediol dehydrogenase gene cluster. This activation provides scope for the utilization of 2,3-butanediol. The 2,3-butanediol dehydrogenase, which was liberated from the suppression of CcpA carbon metabolism in L. lactis N8-2, exhibited a more robust catalytic capability. It is crucial to culture and grow bacteria in the laboratory, and point mutations in the genome during bacterial replication can occasionally result in unforeseen phenotypic effects. While most previous reports in the literature have focused on the effects of deleting the CcpA gene on bacterial physiological metabolism, our study focuses on the regulation of downstream genes through mutation of the DNA-binding structural domain.
To conclude, the present study found that mutations in cre deregulate the negative regulatory effect of the global transcriptional regulator CcpA on the 2,3-butanediol dehydrogenase gene cluster. This reveals a critical role for CcpA in the regulation of central carbon metabolism and provides biological evidence for the bacterial enhancement of the catalytic potency of 2,3-butanediol dehydrogenase.

Author Contributions

X.X., F.L. (Fengming Liu), H.X. and M.Q. designed the experiments. X.X., Y.D. and H.Y. constructed strains. X.X., F.L. (Fulu Liu) and W.Q. performed the experiments and analyzed the data. X.X. and F.L. (Fulu Liu) wrote the manuscript. All authors have read and agreed to the published version of the manuscript.

Funding

This work was supported by the National Natural Science Foundation of China (No. 31770102).

Data Availability Statement

Data are contained within the article.

Conflicts of Interest

The authors declare no conflicts of interest.

Abbreviations

crecatabolite responsive element
CcpACarbon catabolite protein A
catchloramphenicol
rfpred fluorescent protein
MSTMicro-scale thermophoresis
TTC2,3,5-triphenyl-2H-tetrazolium chloride

References

  1. Song, A.A.-L.; In, L.L.A.; Lim, S.H.E.; Rahim, R.A. A review on Lactococcus lactis: From food to factory. Microbial Cell Factories 2017, 16, 55. [Google Scholar] [CrossRef]
  2. Campos, G.M.; Americo, M.F.; Freitas, A.d.S.; Barroso, F.A.L.; Dutra, J.d.C.F.; Quaresma, L.S.; Cordeiro, B.F.; Laguna, J.G.; de Jesus, L.C.L.; Fontes, A.M.; et al. Lactococcus lactis as an Interleukin Delivery System for Prophylaxis and Treatment of Inflammatory and Autoimmune Diseases. Probiotics Antimicrob. Proteins 2023, 16, 352–366. [Google Scholar] [CrossRef]
  3. Qiao, W.; Liu, F.; Wan, X.; Qiao, Y.; Li, R.; Wu, Z.; Saris, P.E.J.; Xu, H.; Qiao, M. Genomic Features and Construction of Streamlined Genome Chassis of Nisin Z Producer Lactococcus lactis N8. Microorganisms 2022, 10, 47. [Google Scholar] [CrossRef]
  4. Qiao, M.Q.; Saris, P.E.J. Evidence for a role of NisT in transport of the lantibiotic nisin produced by Lactococcus lactis N8. FEMS Microbiol. Lett. 1996, 144, 89–93. [Google Scholar] [CrossRef] [PubMed]
  5. Simsek, O.; Saris, P.E.J. Cycle changing the medium results in increased nisin productivity per cell in Lactococcus lactis. Biotechnol. Lett. 2009, 31, 415–421. [Google Scholar] [CrossRef]
  6. Qiao, W.; Qiao, Y.; Liu, F.; Zhang, Y.; Li, R.; Wu, Z.; Xu, H.; Saris, P.E.J.; Qiao, M. Engineering Lactococcus lactis as a multi-stress tolerant biosynthetic chassis by deleting the prophage-related fragment. Microb. Cell Factories 2020, 19, 225. [Google Scholar] [CrossRef] [PubMed]
  7. Mazzeo, M.F.; Cacace, G.; Peluso, A.; Zotta, T.; Muscariello, L.; Vastano, V.; Parente, E.; Siciliano, R.A. Effect of inactivation of ccpA and aerobic growth in Lactobacillus plantarum: A proteomic perspective. J. Proteom. 2012, 75, 4050–4061. [Google Scholar] [CrossRef] [PubMed]
  8. Li, C.; Sun, J.W.; Zhang, G.F.; Liu, L.B. Effect of the absence of the CcpA gene on growth, metabolic production, and stress tolerance in Lactobacillus delbrueckii ssp. bulgaricus. J. Dairy Sci. 2016, 99, 104–111. [Google Scholar] [CrossRef] [PubMed]
  9. Zotta, T.; Ricciardi, A.; Guidone, A.; Sacco, M.; Muscariello, L.; Mazzeo, M.F.; Cacace, G.; Parente, E. Inactivation of ccpA and aeration affect growth, metabolite production and stress tolerance in Lactobacillus plantarum WCFS1. Int. J. Food Microbiol. 2012, 155, 51–59. [Google Scholar] [CrossRef] [PubMed]
  10. Zhang, G.; Liu, L.; Li, C. Effects of ccpA gene deficiency in Lactobacillus delbrueckii subsp. bulgaricus under aerobic conditions as assessed by proteomic analysis. Microb. Cell Factories 2020, 19, 9. [Google Scholar] [CrossRef]
  11. Presecan-Siedel, E.; Galinier, A.; Longin, R.; Deutscher, J.; Danchin, A.; Glaser, P.; Martin-Verstraete, I. Catabolite regulation of the pta gene as part of carbon flow pathways in Bacillus subtilis. J. Bacteriol. 1999, 181, 6889–6897. [Google Scholar] [CrossRef] [PubMed]
  12. Turinsky, A.J.; Moir-Blais, T.R.; Grundy, F.J.; Henkin, T.M. Bacillus subtilis ccpA gene mutants specifically defective in activation of acetoin biosynthesis. J. Bacteriol. 2000, 182, 5611–5614. [Google Scholar] [CrossRef]
  13. Peng, Q.; Zhao, X.; Wen, J.; Huang, M.; Zhang, J.; Song, F. Transcription in the acetoin catabolic pathway is regulated by AcoR and CcpA in Bacillus thuringiensis. Microbiol. Res. 2020, 235, 126438. [Google Scholar] [CrossRef]
  14. Chen, C.; Wang, L.; Lu, Y.; Yu, H.; Than, H. Comparative Transcriptional Analysis of Lactobacillus plantarum and Its ccpA-Knockout Mutant Under Galactooligosaccharides and Glucose Conditions. Front. Microbiol. 2019, 10, 1584. [Google Scholar] [CrossRef] [PubMed]
  15. Catone, M.V.; Palomino, M.M.; Legisa, D.M.; Fina Martin, J.; Monedero Garcia, V.; Ruzal, S.M.; Allievi, M.C. Lactic acid production using cheese whey based medium in a stirred tank reactor by a ccpA mutant of Lacticaseibacillus casei. World J. Microbiol. Biotechnol. 2021, 37, 61. [Google Scholar] [CrossRef] [PubMed]
  16. Monedero, V.; Maze, A.; Boel, G.; Zuniga, M.; Beaufils, S.; Hartke, A.; Deutscher, J. The phosphotransferase system of Lactobacillus casei: Regulation of carbon metabolism and connection to cold shock response. J. Mol. Microbiol. Biotechnol. 2007, 12, 20–32. [Google Scholar] [CrossRef] [PubMed]
  17. Price, C.E.; dos Santos, F.B.; Hesseling, A.; Uusitalo, J.J.; Bachmann, H.; Benavente, V.; Goel, A.; Berkhout, J.; Bruggeman, F.J.; Marrink, S.-J.; et al. Adaption to glucose limitation is modulated by the pleotropic regulator CcpA, independent of selection pressure strength. BMC Evol. Biol. 2019, 19, 15. [Google Scholar] [CrossRef] [PubMed]
  18. Aleksandrzak-Piekarczyk, T.; Polak, J.; Jezierska, B.; Renault, P.; Bardowski, J. Genetic characterization of the CcpA-dependent, cellobiose-specific PTS system comprising CelB, PtcB and PtcA that transports lactose in Lactococcus lactis IL1403. Int. J. Food Microbiol. 2011, 145, 186–194. [Google Scholar] [CrossRef]
  19. Maina, S.; Prabhu, A.A.; Vivek, N.; Vlysidis, A.; Koutinas, A.; Kumar, V. Prospects on bio-based 2,3-butanediol and acetoin production: Recent progress and advances. Biotechnol. Adv. 2022, 54, 107783. [Google Scholar] [CrossRef]
  20. Lee, Y.-G.; Bae, J.-M.; Kim, S.-J. Enantiopure meso-2,3-butanediol production by metabolically engineered Saccharomyces cerevisiae expressing 2,3-butanediol dehydrogenase from Klebsiella oxytoca. J. Biotechnol. 2022, 354, 1–9. [Google Scholar] [CrossRef]
  21. Kim, B.; Park, A.R.; Song, C.W.; Song, H.; Kim, J.-C. Biological Control Efficacy and Action Mechanism of Klebsiella pneumoniae JCK-2201 Producing Meso-2,3-Butanediol Against Tomato Bacterial Wilt. Front. Microbiol. 2022, 13, 914589. [Google Scholar] [CrossRef] [PubMed]
  22. Petrova, P.; Petlichka, S.; Petrov, K. New Bacillus spp. with potential for 2,3-butanediol production from biomass. J. Biosci. Bioeng. 2020, 130, 20–28. [Google Scholar] [CrossRef] [PubMed]
  23. Lu, P.; Gao, T.; Bai, R.; Yang, J.; Xu, Y.; Chu, W.; Jiang, K.; Zhang, J.; Xu, F.; Zhao, H. Regulation of carbon flux and NADH/NAD plus supply to enhance 2,3-buta-nediol production in Enterobacter aerogenes. J. Biotechnol. 2022, 358, 67–75. [Google Scholar] [CrossRef] [PubMed]
  24. Zhang, C.; Zhou, X.; Tong, T.; Ge, J. Acetic acid acting as a signaling molecule in the quorum sensing system increases 2,3-butanediol production in Saccharomyces cerevisiae. Prep. Biochem. Biotechnol. 2022, 52, 487–497. [Google Scholar] [CrossRef] [PubMed]
  25. Shi, L.; Gao, S.; Yu, Y.; Yang, H. Microbial production of 2,3-butanediol by a newly-isolated strain of Serratia marcescens. Biotechnol. Lett. 2014, 36, 969–973. [Google Scholar] [CrossRef] [PubMed]
  26. Kandasamy, V.; Liu, J.; Dantoft, S.H.; Solem, C.; Jensen, P.R. Synthesis of (3R)-acetoin and 2,3-butanediol isomers by metabolically engineered Lactococcus lactis. Sci. Rep. 2016, 6, 36769. [Google Scholar] [CrossRef]
  27. Garcia-Quintans, N.; Repizo, G.; Martin, M.; Magni, C.; Lopez, P. Activation of the diacetyl/acetoin pathway in Lactococcus lactis subsp lactis bv. diacetylactis CRL264 by acidic growth. Appl. Environ. Microbiol. 2008, 74, 1988–1996. [Google Scholar] [CrossRef]
  28. Qiao, M.Q.; Immonen, T.; Koponen, O.; Saris, P.E.J. The Cellular Location and Effect on Nisin Immunity of the Nisi Protein from Lactococcus-Lactis N8 Expressed in Escherichia-Coli and L-Lactis. FEMS Microbiol. Lett. 1995, 131, 75–80. [Google Scholar] [CrossRef]
  29. Tsigkrimani, M.; Bakogianni, M.; Paramithiotis, S.; Bosnea, L.; Pappa, E.; Drosinos, E.H.; Skandamis, P.N.; Mataragas, M. Microbial Ecology of Artisanal Feta and Kefalograviera Cheeses, Part I: Bacterial Community and Its Functional Characteristics with Focus on Lactic Acid Bacteria as Determined by Culture-Dependent Methods and Phenotype Microarrays. Microorganisms 2022, 10, 161. [Google Scholar] [CrossRef] [PubMed]
  30. Preston-Mafham, J.; Boddy, L.; Randerson, P.F. Analysis of microbial community functional diversity using sole-carbon-source utilisation profiles—A critique. FEMS Microbiol. Ecol. 2002, 42, 1–14. [Google Scholar] [CrossRef]
  31. Garland, J.L.; Mills, A.L. Classification and Characterization of Heterotrophic Microbial Communities on the Basis of Patterns of Community-Level Sole-Carbon-Source Utilization. Appl. Environ. Microbiol. 1991, 57, 2351–2359. [Google Scholar] [CrossRef] [PubMed]
  32. Castro, R.; Neves, A.R.; Fonseca, L.L.; Pool, W.A.; Kok, J.; Kuipers, O.P.; Santos, H. Characterization of the individual glucose uptake systems of Lactococcus lactis: Mannose-PTS, cellobiose-PTS and the novel GlcU permease. Mol. Microbiol. 2009, 71, 795–806. [Google Scholar] [CrossRef] [PubMed]
  33. Sibakov, M.; Koivula, T.; Vonwright, A.; Palva, I. Secretion of Tem Beta-Lactamase with Signal Sequences Isolated from the Chromosome of Lactococcus-Lactis Subsp Lactis. Appl. Environ. Microbiol. 1991, 57, 341–348. [Google Scholar] [CrossRef]
  34. Del Egido, L.L.; Navarro-Miro, D.; Martinez-Heredia, V.; Toorop, P.E.; Iannetta, P.P.M. A Spectrophotometric Assay for Robust Viability Testing of Seed Batches Using 2,3,5-Triphenyl Tetrazolium Chloride: Using Hordeum vulgare L. as a Model. Front. Plant Sci. 2017, 8, 747. [Google Scholar] [CrossRef] [PubMed]
  35. Sierra-Zapata, L.; Alvarez, J.C.; Romero-Tabarez, M.; Silby, M.W.; Traxler, M.F.; Behie, S.W.; Pessotti, R.d.C.; Villegas-Escobar, V. Inducible Antibacterial Activity in the Bacillales by Triphenyl Tetrazolium Chloride. Sci. Rep. 2020, 10, 5563. [Google Scholar] [CrossRef]
  36. Connor, C.H.; Zucoloto, A.Z.; Munnoch, J.T.; Yu, I.-L.; Corander, J.; Hoskisson, P.A.; McDonald, B.; McNally, A. Multidrug-resistant E. coli encoding high genetic diversity in carbohydrate metabolism genes displace commensal E. coli from the intestinal tract. PLoS Biol. 2023, 21, e3002329. [Google Scholar] [CrossRef] [PubMed]
  37. Yang, T.H.; Rathnasingh, C.; Lee, H.J.; Seung, D. Identification of acetoin reductases involved in 2,3-butanediol pathway in Klebsiella oxytoca. J. Biotechnol. 2014, 172, 59–66. [Google Scholar] [CrossRef] [PubMed]
  38. Feklistov, A.; Barinova, N.; Sevostyanova, A.; Heyduk, E.; Bass, I.; Vvedenskaya, I.; Kuznedelov, K.; Merkiene, E.; Stavrovskaya, E.; Klimasauskas, S.; et al. A basal promoter element recognized by free RNA polymerase σ subunit determines promoter recognition by RNA polymerase holoenzyme. Mol. Cell 2006, 23, 97–107. [Google Scholar] [CrossRef]
  39. Novichkov, P.S.; Kazakov, A.E.; Ravcheev, D.A.; Leyn, S.A.; Kovaleva, G.Y.; Sutormin, R.A.; Kazanov, M.D.; Riehl, W.; Arkin, A.P.; Dubchak, I.; et al. RegPrecise 3.0-A resource for genome-scale exploration of transcriptional regulation in bacteria. BMC Genom. 2013, 14, 745. [Google Scholar] [CrossRef]
  40. Zomer, A.L.; Buist, G.; Larsen, R.; Kok, J.; Kuipers, O.P. Time-resolved determination of the CcpA regulon of Lactococcus lactis subsp cremoris MG1363. J. Bacteriol. 2007, 189, 1366–1381. [Google Scholar] [CrossRef] [PubMed]
  41. Zhang, H.; Song, T.; Qin, C.; Xu, H.; Qiao, M. A Novel Non-Coding RNA CsiR Regulates the Ciprofloxacin Resistance in Proteus vulgaris by Interacting with emrB mRNA. Int. J. Mol. Sci. 2021, 22, 10627. [Google Scholar] [CrossRef]
  42. Tachon, S.; Michelon, D.; Chambellon, E.; Cantonnet, M.; Mezange, C.; Henno, L.; Cachon, R.; Yvon, M. Experimental conditions affect the site of tetrazolium violet reduction in the electron transport chain of Lactococcus lactis. Microbiology 2009, 155, 2941–2948. [Google Scholar] [CrossRef] [PubMed]
  43. Browning, D.F.; Butala, M.; Busby, S.J.W. Bacterial Transcription Factors: Regulation by Pick “N” Mix. J. Mol. Biol. 2019, 431, 4067–4077. [Google Scholar] [CrossRef] [PubMed]
  44. Bulock, L.L.; Ahn, J.; Shinde, D.; Pandey, S.; Sarmiento, C.; Thomas, V.C.; Guda, C.; Bayles, K.W.; Sadykov, M.R. Interplay of CodY and CcpA in Regulating Central Metabolism and Biofilm Formation in Staphylococcus aureus. J. Bacteriol. 2022, 204, e0061721. [Google Scholar] [CrossRef] [PubMed]
  45. Seidel, G.; Diel, M.; Fuchsbauer, N.; Hillen, W. Quantitative interdependence of coeffectors, CcpA and cre in carbon catabolite regulation of Bacillus subtilis. FEBS J. 2005, 272, 2566–2577. [Google Scholar] [CrossRef] [PubMed]
  46. Lanza, A.M.; Alper, H.S. Global strain engineering by mutant transcription factors. Methods Mol. Biol. 2011, 765, 253–274. [Google Scholar] [CrossRef]
  47. Lin, Z.; Zhang, Y.; Wang, J. Engineering of transcriptional regulators enhances microbial stress tolerance. Biotechnol. Adv. 2013, 31, 986–991. [Google Scholar] [CrossRef]
  48. Cai, D.; Zhu, J.; Zhu, S.; Lu, Y.; Zhang, B.; Lu, K.; Ma, J.; Ma, X.; Chen, S. Metabolic Engineering of Main Transcription Factors in Carbon, Nitrogen, and Phosphorus Metabolisms for Enhanced Production of Bacitracin in Bacillus licheniformis. ACS Synth. Biol. 2019, 8, 866–875. [Google Scholar] [CrossRef] [PubMed]
Figure 1. Detection of the metabolic capabilities of L. lactis N8-1 and L. lactis N8-2 genome-deleted chassis strains toward various carbon sources. *** p < 0.001 (significant difference between the mutant and control).
Microorganisms 12 00773 g001
Figure 2. Metabolic pathway of 2,3-butanediol in L. lactis N8 and statistical analysis of associated genes. (A) 2,3-butanediol metabolic pathway and the functions of related genes. (B) Localization and transcriptional unit analysis of key genes implicated in the metabolism of 2,3-butanediol.
Microorganisms 12 00773 g002
Figure 3. (A) Transcriptome sequencing analysis of genes associated with the metabolic pathway of 2,3-butanediol in L. lactis N8-1 and L. lactis N8-2. (B) Transcriptional alterations in the metabolic pathway of 2,3-butanediol in L. lactis N8-1 and L. lactis N8-2. *** p < 0.001 (significant difference between the mutant and control).
Microorganisms 12 00773 g003
Figure 4. Identification of a single mutant base in L. lactis N8-2 and binding motifs of CcpA-regulated genes in Lactococcus lactis IL1403. (A) Results of sequence difference comparison between L. lactis N8-2 whole genome sequencing and L. lactis N8-1 upstream of the 2,3-butanediol dehydrogenase gene promoter. (B) Base sequences of all binding sites regulated by CcpA transcription factors in Lactococcus lactis IL1403 were accessed in the RegPrecise web resource.
Microorganisms 12 00773 g004
Figure 5. Validation of P1, P2, and P45 promoter viability in the pLEB124 vector using cat and rfp as reporter genes. (A) Verification of the viability of the butBA gene promoters P1 and P2 in L. lactis N8-1 and L. lactis N8-2 using cat and rfp as reporter genes in the pLEB124 vector, while setting the P45 promoter as a positive control. (B) Validation of the viability of the P1-butB and P2-butB promoters linked to the butB gene using cat as a reporter gene in pLEB124.
Microorganisms 12 00773 g005
Figure 6. Preparation of DNA probes with CcpA protein in MST experiments. (A) L. lactis N8-1 and L. lactis N8-2 were used as templates for the first amplification with primers carrying the Cy5 sequence target. Lane M: DNA Marker; lane 1: N8-1-cre (97 bp); lane 2: N8-2-cre (97 bp); lane 3: N8-16s (266 bp); (B) Secondary amplification with pEASY-N8-1-cre, pEASY-N8-2-cre, and pEASY-N8-16s as template amplification. M: DNA Marker; lane 1: N8-1-cre (97 bp); lane 2: N8-2-cre (97 bp); lane 3: N8-16s (266 bp); (C) Purification outcomes of target proteins through the heterologous expression of pETm3c-CcpA. Lane M: Protein Marker; lane 1: whole bacterial proteins collected after cell fragmentation; lane 2: elution of uncolumnized proteins; lane 3 and lane 4: target proteins collected after 0.3 M imidazole elution.
Microorganisms 12 00773 g006
Figure 7. (A) The binding of the CcpA protein to fluorescently labeled N8-1-cre was analyzed using micro-scale thermophoresis (MST). Changes in the thermophoretic signal resulted in binding affinities of 0.044 ± 0.067 μM. (B) Measurement of the interaction between the CcpA protein and fluorescently labeled N8-2-cre using MST showed no binding under the tested conditions. (C) Measurement of the interaction between the CcpA protein and fluorescently labeled N8-16s using MST showed no binding under the tested conditions.
Microorganisms 12 00773 g007
Figure 8. Construction of a two-plasmid fluorescent hybridization system in Escherichia coli BL21(DE3). (A) Construction of pACYC-N8-1-cre-eGFP, pACYC-N8-2-cre-eGFP, and pRSF-CcpA plasmids. (B) Plasmids were combined with E. coli BL21 (DE3) cells. (C) Determination of fluorescence values for the four bacterial strains. *** p < 0.001 (significant difference between the mutant and control).
Microorganisms 12 00773 g008
Figure 9. Assay of the ability of L. lactis N8-1 and L. lactis N8-2 to metabolize 2,3-butanediol. (A) Setting up a gradient concentration of 2,3-butanediol (5%, 1%, 0.1%, 0.05%, 0.01%, 0.005%, and 0%) and the final concentration of 0.005% TTC (The red mark of 0.01% is the optimal concentration). (B) Color response of L. lactis N8-1 and L. lactis N8-2 to metabolize 2,3-butanediol. (C) Detection of L. lactis N8-1 and L. lactis N8-2 metabolism at optimal 2,3-butanediol concentrations.
Microorganisms 12 00773 g009
Figure 10. Schematic representation of the mechanism whereby CcpA regulates the 2,3-butanediol dehydrogenase gene cluster in L. lactis N8-1 and L. lactis N8-2. (A) Schematic representation of transcriptional regulation of the 2,3-butanediol dehydrogenase gene cluster downstream of CcpA-binding cre repression in L. lactis N8-1. (B) Schematic representation of the inhibitory regulatory effect of CcpA dissociation and cre loss on the downstream 2,3-butanediol dehydrogenase gene cluster in L. lactis N8-2.
Microorganisms 12 00773 g010
Table 1. Bacterial strains and plasmids utilized in this study.
Strains or Plasmids Relevant Descriptions Reference
Strains
L. lactis N8 Wild-type (WT) Nisin Z producer[28]
L. lactis N8-1The first DNA region L1 deletion in L. lactis N8[6]
L. lactis N8-2The L2 deletion in L. lactis N8-1Lab stork
E. coli DH5αCloning host; F-φ80 lacZΔM15
endA1 recA1 endA1 hsdR17 (rK-mK+) supE44 thi-1 gyrA 96 relA1 Δ(lacZYA-argF)U169 deoR λ-
Lab stork
BL21(DE3)F-ompT hsdSB(rB-m-) gal dcm (DE3)Lab stork
N8-1-P45-catEmr, L. lactis N8-1 derivative containing
pLEB124-P45-cat
This study
N8-1-P1-catEmr, L. lactis N8-1 derivative containing
pLEB124-P1-cat
This study
N8-1-P2-catEmr, L. lactis N8-1 derivative containing
pLEB124-P2-cat
This study
N8-2-P45-catEmr, L. lactis N8-2 derivative containing
pLEB124-P45-cat
This study
N8-2-P1-catEmr, L. lactis N8-2 derivative containing
pLEB124-P1-cat
This study
N8-2-P2-catEmr, L. lactis N8-2 derivative containing
pLEB124-P2-cat
This study
N8-1-P45-rfpEmr, L. lactis N8-1 derivative containing
pLEB124-P45-rfp
This study
N8-1-P1-rfpEmr, L. lactis N8-1 derivative containing
pLEB124-P1-rfp
This study
N8-1-P2-rfpEmr, L. lactis N8-1 derivative containing
pLEB124-P2-rfp
This study
N8-2-P45-rfpEmr, L. lactis N8-2 derivative containing
pLEB124-P45-rfp
This study
N8-2-P1-rfpEmr, L. lactis N8-2 derivative containing
pLEB124-P1-rfp
This study
N8-2-P2-rfpEmr, L. lactis N8-2 derivative containing
pLEB124-P2-rfp
This study
N8-1-P1-butB-catEmr, L. lactis N8-1 derivative containing
pLEB124-P1-butB-cat
This study
N8-1-P2-butB-catEmr, L. lactis N8-1 derivative containing
pLEB124-P2-butB-cat
This study
N8-2-P1-butB-catEmr, L. lactis N8-2 derivative containing
pLEB124-P1-butB-cat
This study
N8-2-P2-butB-catEmr, L. lactis N8-2 derivative containing
pLEB124-P1-butB-cat
This study
pACYC-N8-1-cre-rfpCmr, E. coli BL21 containing pACYC-N8-1-cre-rfpThis study
pACYC-N8-2-cre-rfpCmr, E. coli BL21 containing pACYC-N8-2-cre-rfpThis study
CcpA-N8-1-cre-eGFPKanr, Cmr, E. coli BL21containing pRSF-CcpA and pACYC-N8-1-cre-rfpThis study
CcpA-N8-2-cre-eGFPKanr, Cmr, E. coli BL21containing pRSF-CcpA and pACYC-N8-2-cre-rfpThis study
Plasmids
pEASY-T1Ampr, Blue-white screening vectorTransGen, Beijing, China
pLEB124Emr, expression vector[28]
pETm3cAmpr, expression vectorLab stork
pNZ8048-rfpCmr, pNZ8048 derivative containing the rfp geneLab stork
pRSF-DuteKanr, pRSF-Duet is designed for the coexpression of two target ORFs. Lab stork
pACYC-eGFPCmr, pACYC-eGFP is designed for the coexpression of two target genes. Lab stork
pETm3c-CcpAAmpr, pETm3c derivative containing the CcpA geneThis study
pEASY-N8-1-creAmpr, pEASY-T1 derivative containing the N8-1-cre geneThis study
pEASY-N8-2-creAmpr, pEASY-T1 derivative containing the N8-2-cre geneThis study
pEASY-N8-16sAmpr, pEASY-T1 derivative containing the N8-16s geneThis study
pACYC-N8-1-cre-eGFPCmr, pACYC-eGFP derivative containing the N8-1-cre geneThis study
pACYC-N8-2-cre-eGFPCmr, pACYC-eGFP derivative containing the N8-2-cre geneThis study
pRSF-CcpAKanr, pRSF-Dute derivative containing the CcpA geneThis study
pLEB124-P45-catEmr, pLEB124 derivative containing the P45 and cat
cassette
This study
pLEB124-P1-catEmr, pLEB124 derivative containing the P1 and cat
cassette
This study
pLEB124-P2-catEmr, pLEB124 derivative containing the P2 and cat
cassette
This study
pLEB124-P45-rfpEmr, pLEB124 derivative containing the P45 and rfp
cassette
This study
pLEB124-P1-rfpEmr, pLEB124 derivative containing the P1 and rfp
cassette
This study
pLEB124-P2-rfpEmr, pLEB124 derivative containing the P2 and rfp
cassette
This study
pLEB124-P1-butB-catEmr, pLEB124 derivative containing the P1 and
butB and cat cassette
This study
pLEB124-P2-butB-catEmr, pLEB124 derivative containing the P2 and
butB and cat cassette
This study
Table 2. Primers in this study.
Primer Primer Sequence (5′-3′)
cat-clone-F GCTAGATCTAGGCATATCAAATGAA
cat-clone-RGCTAAGCTTCCAATCATCAATTGCG
P45-FGCTTCTAGACGTTAGGGGCTTGAAC
P45-R GCTAGATCTTTTTCACTATTCTAGGTTCC
rfp-clone-FCTAGATCTCTCGAGATGGTTTCAAAAGGTGAAG
rfp-clone-RGCCGAATTCCAATTGAACGTTTCAAGCC
PbutBA-F GCTTCTAGACAATTAATAAGAATACAAAAAGTAA
PbutBA-R GCTGCTAGATCT AAAAACGCCTCCTCTAT
PbutBA-butB-F GCTGGTACCCAATTAATAAGAATACAAAAAGTAA
PbutBA-butB-R GCTCTCGAGTTTATAGACCTTTACCAGTTG
CcpA-FCGGGATCCATGGTAGAATCAACAACAACAAT
CcpA-RCGAGCTCTTTGGTAGAACGACGAGAAAAGA
Cy5′AGCCAGTGGCGATAAG
N8-1/N8-2-cre-FAGCCAGTGGCGATAAGTACGATAAAATATTTAAAAGTCT
N8-1/N8-2-cre-RCTATCATTATTTCTAATAATTTAC
16s-FAGCCAGTGGCGATAAGGCGTTAGCTGCGATACAG
16s-RCATGTGTAGCGGTGAAATG
N8-1-cre-rfp-FCGGGATCCCCAAGGAAGAAAACGCTTTAAATTTTTATGGTGAGCAAGGGCGAGGAGG
N8-2-cre-rfp-FCGGGATCCCCAAGGAAGAAAACTCTTTAAATTTTTATGGTGAGCAAGGGCGAGGAGG
For the RT-qPCR
Q-tufA-FGACCTCTTGAGCGAATACGACT
Q-tufA-RTTCTTCAACTTTAGCAACCCATT
Q-butA-FATTATCAACGCAACCTCACAAGC
Q-butA-RTCCCCATTCATCATCTTTACCAG
Q-butB-FCCGTCAGCAGAACATCCTAATC
Q-butB-RTCAGCCAATCCTCCACCAT
T7-FTAATACGACTCACTATAGGG
T7-RTGCTAGTTATTGCTCAGCGG
Table 3. Verification of the impact of downstream structural genes on promoter transcription of the PbutBA promoter.
Recombinant PlasmidHost Bacterium MIC (μg/mL)
L. lactis N8-1L. lactis N8-2
pLEB124-P45-cat1010
pLEB124-P1-cat2.52.5
pLEB124-P2-cat2.52.5
Table 4. Validation of the viability of the P1-butB and P2-butB promoters linked to the butB gene.
Recombinant PlasmidHost Bacterium MIC (μg/mL)
L. lactis N8-1L. lactis N8-2
pLEB124-P45-cat1010
pLEB124-P1-butB-cat7.57.5
pLEB124-P2-butB-cat8080
Disclaimer/Publisher’s Note: The statements, opinions and data contained in all publications are solely those of the individual author(s) and contributor(s) and not of MDPI and/or the editor(s). MDPI and/or the editor(s) disclaim responsibility for any injury to people or property resulting from any ideas, methods, instructions or products referred to in the content.

