Article

Biological Characteristics, Artificial Domestication Conditions Optimization, and Bioactive Components of Beauveria caledonica

1
Institute of Edible Fungi, Shanghai Academy of Agricultural Sciences, Shanghai 201403, China
2
Nanjing Institute for Comprehensive Utilization of Wild Plants, China Co-ops, Nanjing 210110, China
3
Guizhou Institute of Biology, Guizhou Academy of Sciences, Guiyang 550001, China
*
Authors to whom correspondence should be addressed.
These authors contributed equally to this work.
Microorganisms 2024, 12(8), 1554; https://doi.org/10.3390/microorganisms12081554 (registering DOI)
Submission received: 26 June 2024 / Revised: 20 July 2024 / Accepted: 25 July 2024 / Published: 29 July 2024
(This article belongs to the Section Microbial Biotechnology)

Abstract

:
In this study, one strain of Beauveria caledonica was isolated from wild fruiting bodies collected from Guizhou Province, China, and its species identification, biological characteristics, domestication, and cultivation methods were studied along with polysaccharide and adenosine content analysis. The mycelia were identified by ITS sequencing, and the fruiting bodies of B. caledonica were domestically cultivated for the first time using wheat and rice as basic cultivation media. The carbon sources, nitrogen sources, cultivation temperatures, and pH for mycelial growth were optimized through single-factor experiments and response surface methodology (RSM) experiments. The polysaccharide content was detected by the phenol–sulfuric acid method, and the adenosine content was measured by high-performance liquid chromatography (HPLC). The results confirmed that the identified mycelia were B. caledonica. The optimum medium for solid culture was 25.8 g/L glycerol, 10.9 g/L yeast extract, 1 g/L MgSO4·7H2O, 1 g/L KH2PO4, 10 mg/L vitamin B1, and 20 g/L agar; the optimum pH was 6.5, and the optimum culture temperature was 25 °C. The optimal liquid culture medium was 26.2 g/L glycerol, 11.1 g/L yeast extract, 1 g/L MgSO4·7H2O, 1 g/L KH2PO4, and 10 mg/L vitamin B1; the mycelia grew well at pH 6.6 and 25 °C. The average biological efficiencies of fruiting bodies on wheat and rice as culture media were 1.880% and 2.115%, respectively; the polysaccharide contents of fruiting bodies on the two media were 6.635% and 9.264%, respectively, while the adenosine contents were 0.145% and 0.150%, respectively. This study provides a valuable reference for further artificial cultivation and utilization of B. caledonica by investigating its biological characteristics, cultivation conditions for artificial domestication, and polysaccharide and adenosine contents in cultivated fruiting bodies.

1. Introduction

Cordyceps sensu lato (hereafter referred to as Cordyceps s.l.) is a group of complex organisms consisting of entomogenous fungi and hosts. The infestation hosts for these entomogenous fungal complexes generally include many types of organic substances, such as insects, spiders, some fungi [1,2], plants [3], and rotifers [4], as well as inorganic substances, such as rocks, soil, and fresh water [5]. These entomogenous fungi are primarily distributed among nearly 200 genera within the Hypocreales order and belong to the Clavicipitaceae, Cordycipitaceae, Ophiocordycipitaceae, and Polycephalomycetaceae families [6]. Currently, there are approximately 1300 recorded species of Cordyceps s.l. worldwide [7,8]. However, only a few species form fruiting bodies. Among the numerous species of Cordyceps s.l. identified thus far, only Ophiocordyceps sinensis [9,10], Cordyceps chanhua [11], Cordyceps militaris [12], and Tolypocladium guangdongense [13] have been cultivated for commercial use.
In the natural world, there are many asexual and a few sexual species of Cordyceps s.l. belonging to Beauveria [14], Metarhizium [15,16], Tilachlidium [17,18], Tolypocladium [7], and others. Beauveria spp. are a class of entomogenous fungi that can parasitize 15 orders, 149 families, and more than 700 species of insects, including Lepidoptera, Coleoptera, Hymenoptera, and some tick mites [19]. According to the fungal classification system, Beauveria belongs to Ascomycota, Sordariomycetes, Hypocreales, and Cordycipitaceae [20]. Out of approximately 1300 species records of Cordyceps s.l., 81 records belong to Beauveria [8], among which China has 18 records of species, namely, B. amorpha [21], B. araneola [22], B. baoshanensis [23], B. bassiana [24], B. brongniartii [24], B. caledonica [25], B. lii [26], B. majiangensis [27], B. malawiensis [28], B. medogensis [29], B. polyrhachicola [30], B. scarabaeidicola [31], B. sinensis [32], B. sobolifera [33], B. songmingensis [30], B. subscarabaeidicola [30], B. velata [24], and B. yunnanensis [23]. As species of Cordyceps s.l., Beauveria spp. have characteristics such as a wide host range, strong pathogenicity, and strong selectivity [34]. Related studies on Beauveria have focused mainly on agricultural and forestry pest control [35]. Insecticidal preparations of Beauveria have been widely used in the control of agricultural and forestry pests, such as Ostrinia furnacalis [36] and Frankliniella occidentalis [37], which play important roles in promoting the development of agricultural and forestry industries as well as maintaining the stability of natural ecology. However, recent studies have shown that Beauveria insecticide may cause harm to the silkworm breeding industry [38], resulting in economic losses for farmers and, thus, limiting its application to some extent. Other studies have shown that Bombyx batryticatus is a coconstituted complex organism that is a traditional Chinese medicine formed after Bombyx mori is infected by Beauveria bassiana [39].
There has been no study on the artificial domestication and cultivation of fruiting bodies of Beauveria. This may be another area where Beauveria can be developed and utilized by humans in the future. The successful domestication and cultivation of Beauveria is highly important for the comprehensive development and utilization of Cordyceps s.l. resources [40]. A strain of B. caledonica collected from the wild was isolated and identified in this research, and its biological characteristics and artificial domestication cultivation were studied. Furthermore, the bioactive components of B. caledonica obtained from the fruiting bodies, such as polysaccharides, adenosine, and cordycepin, were studied, thus providing a reference for the comprehensive development and utilization of this fungus.

2. Materials and Methods

2.1. Materials

2.1.1. Sample Collection

Wild fruiting bodies of B. caledonica (Figure 1) were collected from Leigongshan National Nature Reserve in Leishan County, Qiandongnan Miao and Dong Autonomous Prefecture, Guizhou Province, China, at an altitude of 1912 m. Specimen number DCY 4974 was collected by Qunying Lin, Chuanhua Li, and Chunying Deng on 23 July 2022. Strains were obtained through tissue isolation using wild fruiting bodies as materials.

2.1.2. Culture Medium

PDA medium (PDB medium without agar): 200 g of potato was peeled and boiled to extract the juice; 20 g of glucose and 20 g of agar were added and the volume was increased to 1 L with distilled water. Basal medium: 20 g of glucose, 10 g of peptone, 20 g of agar (liquid medium without agar), 1 g of MgSO4·7H2O, 1 g of KH2PO4, and 10 mg of vitamin B1 were mixed; the volume was increased to 1 L with distilled water. The above media were sterilized for 20 min at 121 °C.
Cultivation medium: In a 350 mL culture bottle containing 30 g of wheat/rice, 30 mL of nutrient solution was added, with 10 replications in each group, and the medium was sterilized for 40 min at 121 °C. The nutrient solutions used were as follows: 26.2 g of glycerol, 11.1 g of yeast powder, 1 g of MgSO4·7H2O, 1 g of KH2PO4, and 10 mg of vitamin B1 in 1 L of distilled water.

2.2. Methods

2.2.1. Molecular Biological Identification of the Strain

The mycelia were collected and ground thoroughly in liquid nitrogen, and DNA was extracted using a fungal DNA extraction kit (Yisheng Biotechnology Shanghai Co., Ltd., Shanghai, China) and then stored at −20 °C until further use. PCR amplification was performed using the primers ITS4 (5′-TCCTCCGCTTATTGATATGC-3′) and ITS5 (5′-GGAAGTAAAAGTCGTAACAAGG-3′) (synthesized by Sangon Biotech (Shanghai) Co., Ltd., Shanghai, China). The reaction system included 1 μL of template DNA, 12.5 μL of 2×Taq PCR Master Mix (Vazyme, Nanjing, China), 1 μL of each primer, and 9.5 μL of ddH2O. The PCR amplification program was as follows: predenaturation at 94 °C for 4 min, followed by 30 cycles of denaturation at 94 °C for 30 s, annealing at 55 °C for 30 s, extension at 72 °C for 1 min, and a final extension at 72 °C for 10 min.
The amplified products were sequenced by Sangon Biotech (Shanghai) Co., Ltd., and the measured sequences were compared with the DNA database with the BLAST tool on the NCBI website. The MEGA-X neighbor-joining (NJ) method was used to construct a phylogenetic tree, the bootstrap method was used, and the bootstrap parameter was set to 1000 to establish a p-distance model, with the other parameters set to the defaults.

2.2.2. Single-Factor Experiment

Temperature experiment: PDA medium was used to measure the growth rate of mycelia, and 20 mL of PDA medium was poured into Petri dishes. After inoculation, the cultures were incubated in a dark environment at a constant temperature of 15, 20, 23, 25, 28, or 30 °C. The biomass (dry weight) of the mycelia in the PDB medium was measured, and 100 mL of PDB medium was added to 250 mL flasks. After inoculation, the flasks were incubated at a constant temperature with shaking at 150 rpm in the dark. Each experiment was repeated four times.
Carbon source experiment: Basal medium (solid culture supplemented with 20 g/L agar powder) was selected; glucose, sucrose, maltose, fructose, glycerol, and soluble starch were used as carbon sources (20 g/L); and no carbon source was added as the control (CK). Peptone was used as the fixed nitrogen source (10 g/L), and, after inoculation, the fungi were cultured at 25 °C. Each experiment was repeated four times.
Nitrogen source experiment: Basal medium (solid culture supplemented with 20 g/L agar powder) was selected, yeast extract, peptone, soy peptone, beef extract, (NH4)2SO4, and silkworm pupae powder were used as nitrogen sources (10 g/L), and no nitrogen source was added as the control (CK). Glucose was used as the fixed carbon source (20 g/L), and, after inoculation, the fungi were cultured at 25 °C. Each experiment was repeated four times.
pH experiment: The media used were as follows: 20 g of glycerol, 10 g yeast extract, 1 g of MgSO4·7H2O, 1 g of KH2PO4, and 10 mg of vitamin B1 were added to 1 L of distilled water, and the media were sterilized for 20 min at 121 °C. The pH of the culture media was adjusted to 5, 6, 7, 8, or 9 using 1 M NaOH or 1 M HCl solution. Each experiment was repeated four times.

2.2.3. RSM Experiment

The glycerol content (A), yeast extract content (B), and pH (C) were selected to optimize the mycelial growth rate and biomass according to the single-factor experimental results. The three-factor, three-level combined Box–Behnken method was used for the RSM experiment (Table 1).

2.2.4. Determination of the Growth Rate and Biomass of Mycelia

The growth rates of the mycelia were determined on solid medium and the cross method (measuring the colony growth radius), and the mycelia were observed and marked at 5 d and 20 d after inoculation. The growth rates of the mycelia (mm/d) were calculated as follows: (the second marked radius length—the first marked radius length)/days between two markers.
The biomass of the mycelia was measured in liquid media. After 4 d of cultivation, the mycelia were collected, washed with ddH2O, filtered with filter paper, and dried at 55 °C to a constant weight, after which their dry weight was measured.

2.2.5. Domestication Cultivation

Preparation of cultivated spawn: Liquid spawn were used as cultivated spawn after 4 d of cultivation.
Inoculation: After sterilization and cooling to room temperature, each sterilized cultivation medium was inoculated with 5 mL of cultivated spawn on an ultraclean bench.
Mushroom production management: After inoculation, the culture bottles were placed in a 25 °C incubator in the dark. When the medium was covered with mycelia, the medium was illuminated for 12 h (2000 lux) per day, and the other culture conditions were unchanged. Twenty days after the surface of the mycelia formed a bundle and then reached the shoulder of the bottle, the fruiting bodies were harvested.

2.2.6. Polysaccharide Detection in Fruiting Bodies

Glucose solutions were prepared (0, 0.01, 0.02, 0.04, 0.06, 0.08, and 0.10 mg/mL). Fruiting body powder (0.05 g) was suspended in 1 mL of distilled water and then extracted in a 100 °C water bath for 2 h. After that, the solution was cooled to room temperature, the lost water was replenished, the mixture was centrifuged at 10,000× g for 10 min, and the supernatant was retained. One milliliter of distilled water was added to the precipitate, the above steps were repeated twice, and the supernatant was concentrated to 1 mL (the supernatant containing the suspended spore powder was filtered with a 0.22 μm cellulose filter membrane to remove impurities). Then, 0.2 mL of the supernatant was suspended in 0.8 mL of anhydrous ethanol, placed at 4 °C for 12 h, and centrifuged at 10,000× g for 10 min. The supernatant was discarded, and 1 mL of distilled water was added for precipitation. Then, 0.2 mL of sample solution (20-fold diluted) was added to 0.1 mL of 5% phenol solution and 0.5 mL of concentrated sulfuric acid. After vortexing, the mixture was placed in a 90 °C water bath for 20 min. After cooling with running water, 0.2 mL of solution was transferred to an enzyme-linked immunosorbent assay (ELISA) plate, and the absorbance was measured at 490 nm [41].

2.2.7. Adenosine and Cordycepin Detection in Fruiting Bodies

Chromatographic conditions: A Sunfire C18 column (4.6 mm × 250 mm, 5 μm) was used as the analytical column. Methanol and water (15:85, v/v) were used as the mobile phase, with a flow rate of 1 mL/min, a detection wavelength of 260 nm at 25 °C, and an injection volume of 10 μL [42].
Standard curve experiments: A mixed standard solution of adenosine and cordycepin (0, 2.5, 5, 10, 20, 40, 60, 80, and 100 μg/mL) was prepared to obtain the calibration curves, and the relative correction factors were calculated. Standard curves of the investigated compounds were established by plotting the peak areas (Y) versus the concentration of standard compound (X, μg/mL).
Sample preparation: Powdered fruiting bodies (0.15 g) were suspended in 10 mL of ultrapure water, and after sonication for 1 h, the solution was centrifuged at 7000× g for 20 min. The supernatant was filtered with a filter membrane (0.22 μm cellulose filter, Millipore, Shanghai, China) and then analyzed according to the chromatographic conditions, with three replicates for each sample.
Recovery detection: The recovery experiment was performed by adding an equal volume of 20 μg/mL mixed standard solution to a known concentration of sample solution of fruiting bodies. Then, these samples were prepared and analyzed through chromatography, and the recovery rate was calculated.

2.3. Data Analysis

Data analysis and significant differences were assessed by using Microsoft Excel and SPSS 25.0 software. Visual graphs were generated with Origin 2018, and the RSM model and standard deviations were generated with Design-Expert10 software.

3. Results

3.1. Molecular Analysis

The ITS amplification sequence was cleaved and spliced using ContigExpress alignment program in Vector NTI version 9.0 software (Invitrogen corporation, Carlsbad, CA, USA), and a 525 bp DNA fragment was obtained (accession number: SUB14585645), which shared more than 99% homology with three fragments of B. caledonica in the GenBank database (accession numbers: MG642831, MH165256, and MT180426). The constructed phylogenetic tree was divided into two main branches, one composed of M. anisopliae and M. robertsii and the other consisting of sample D, B. caledonica (MG642831, MH165256), B. bassiana (OR674049), B. brunniarteii (OR810361), B. amorpha (AY646405), B. velata (U35289), and B. vermiconia (FJ973063). The studied sample clustered on the same branch as the two B. caledonica. The sample was, therefore, identified as B. caledonica (Figure 2). The identification was done with one single molecular marker and may be other molecular markers such as TEF1-α are needed to confirm the molecular identity of the isolate at the species level further.

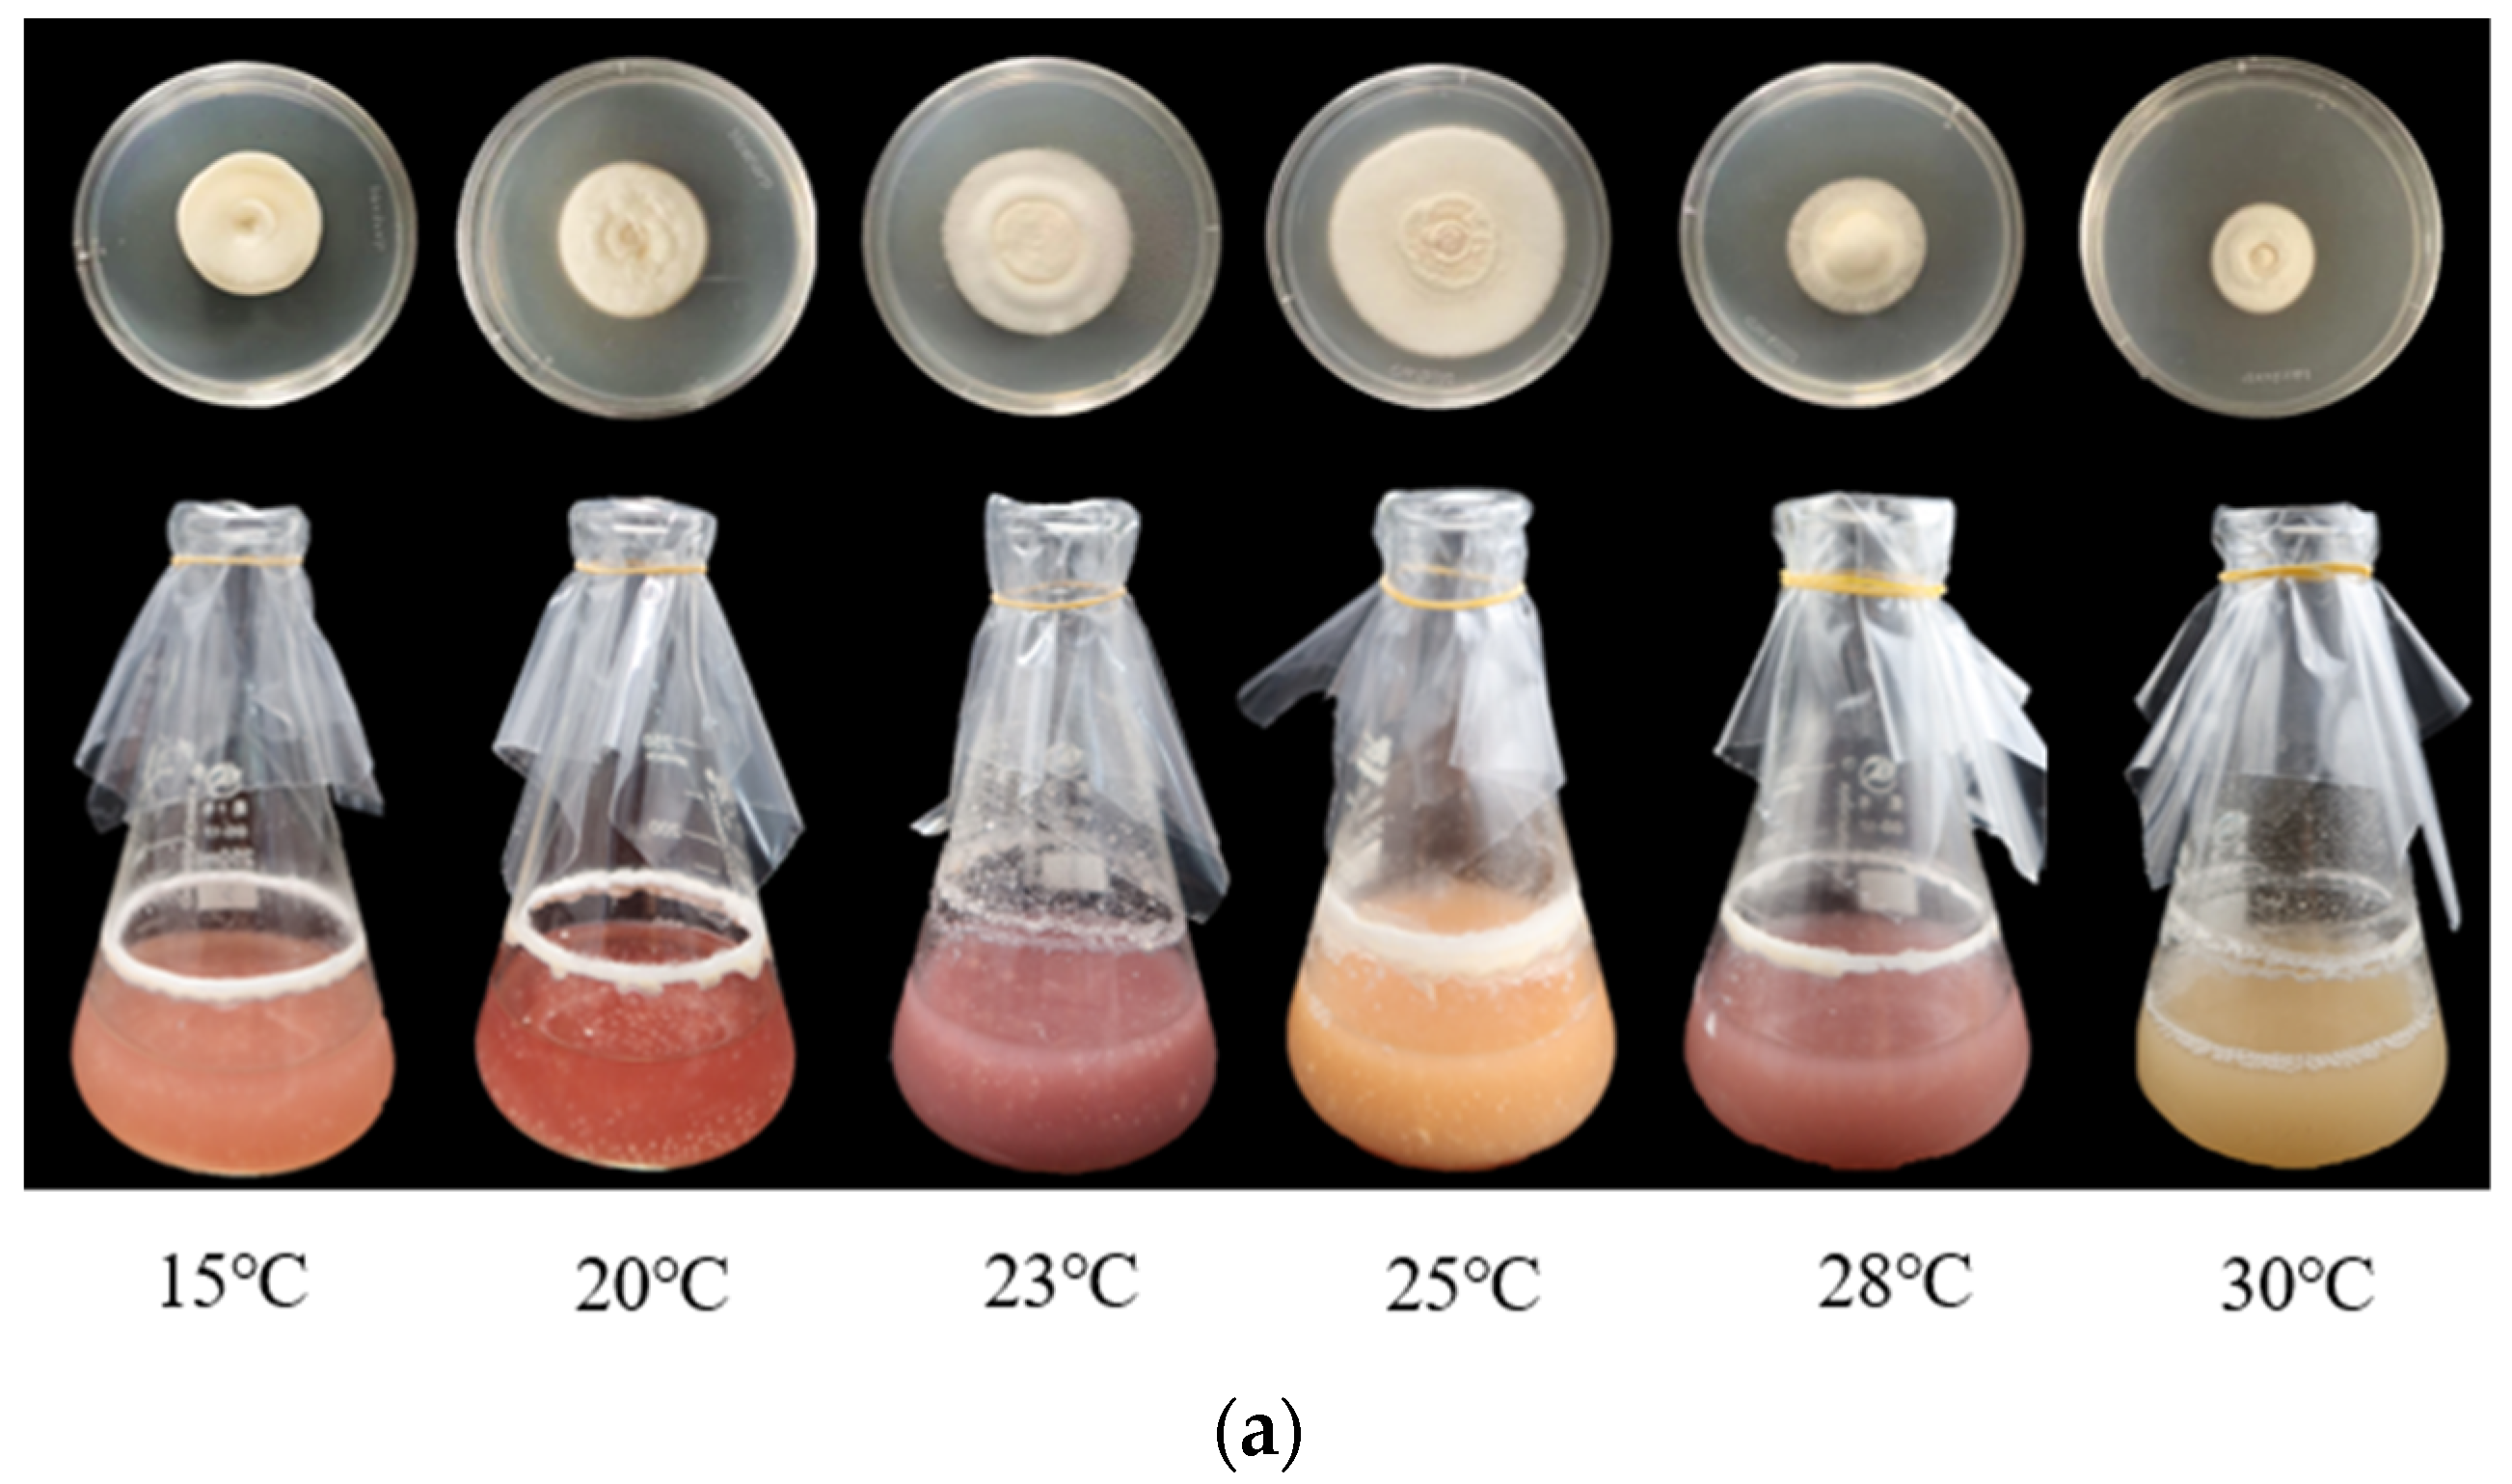
3.2. Temperature Experiment

The mycelia of B. caledonica could grow in PDA and PDB media at different temperatures (15, 20, 23, 25, 28, and 30 °C), and the optimal temperature was 25 °C for both cultivation methods (the fastest mycelia growth rate and the greatest mycelia biomass) (Figure 3a). Mycelia were cultured under solid culture conditions, and the growth rates were sequentially slower in this order: 25, 23, 20, 15, 28, and 30 °C. The biomass of the mycelia also decreased sequentially in the following order: 25, 23, 28, 30, 20, and 15 °C under liquid culture conditions (Figure 3b).

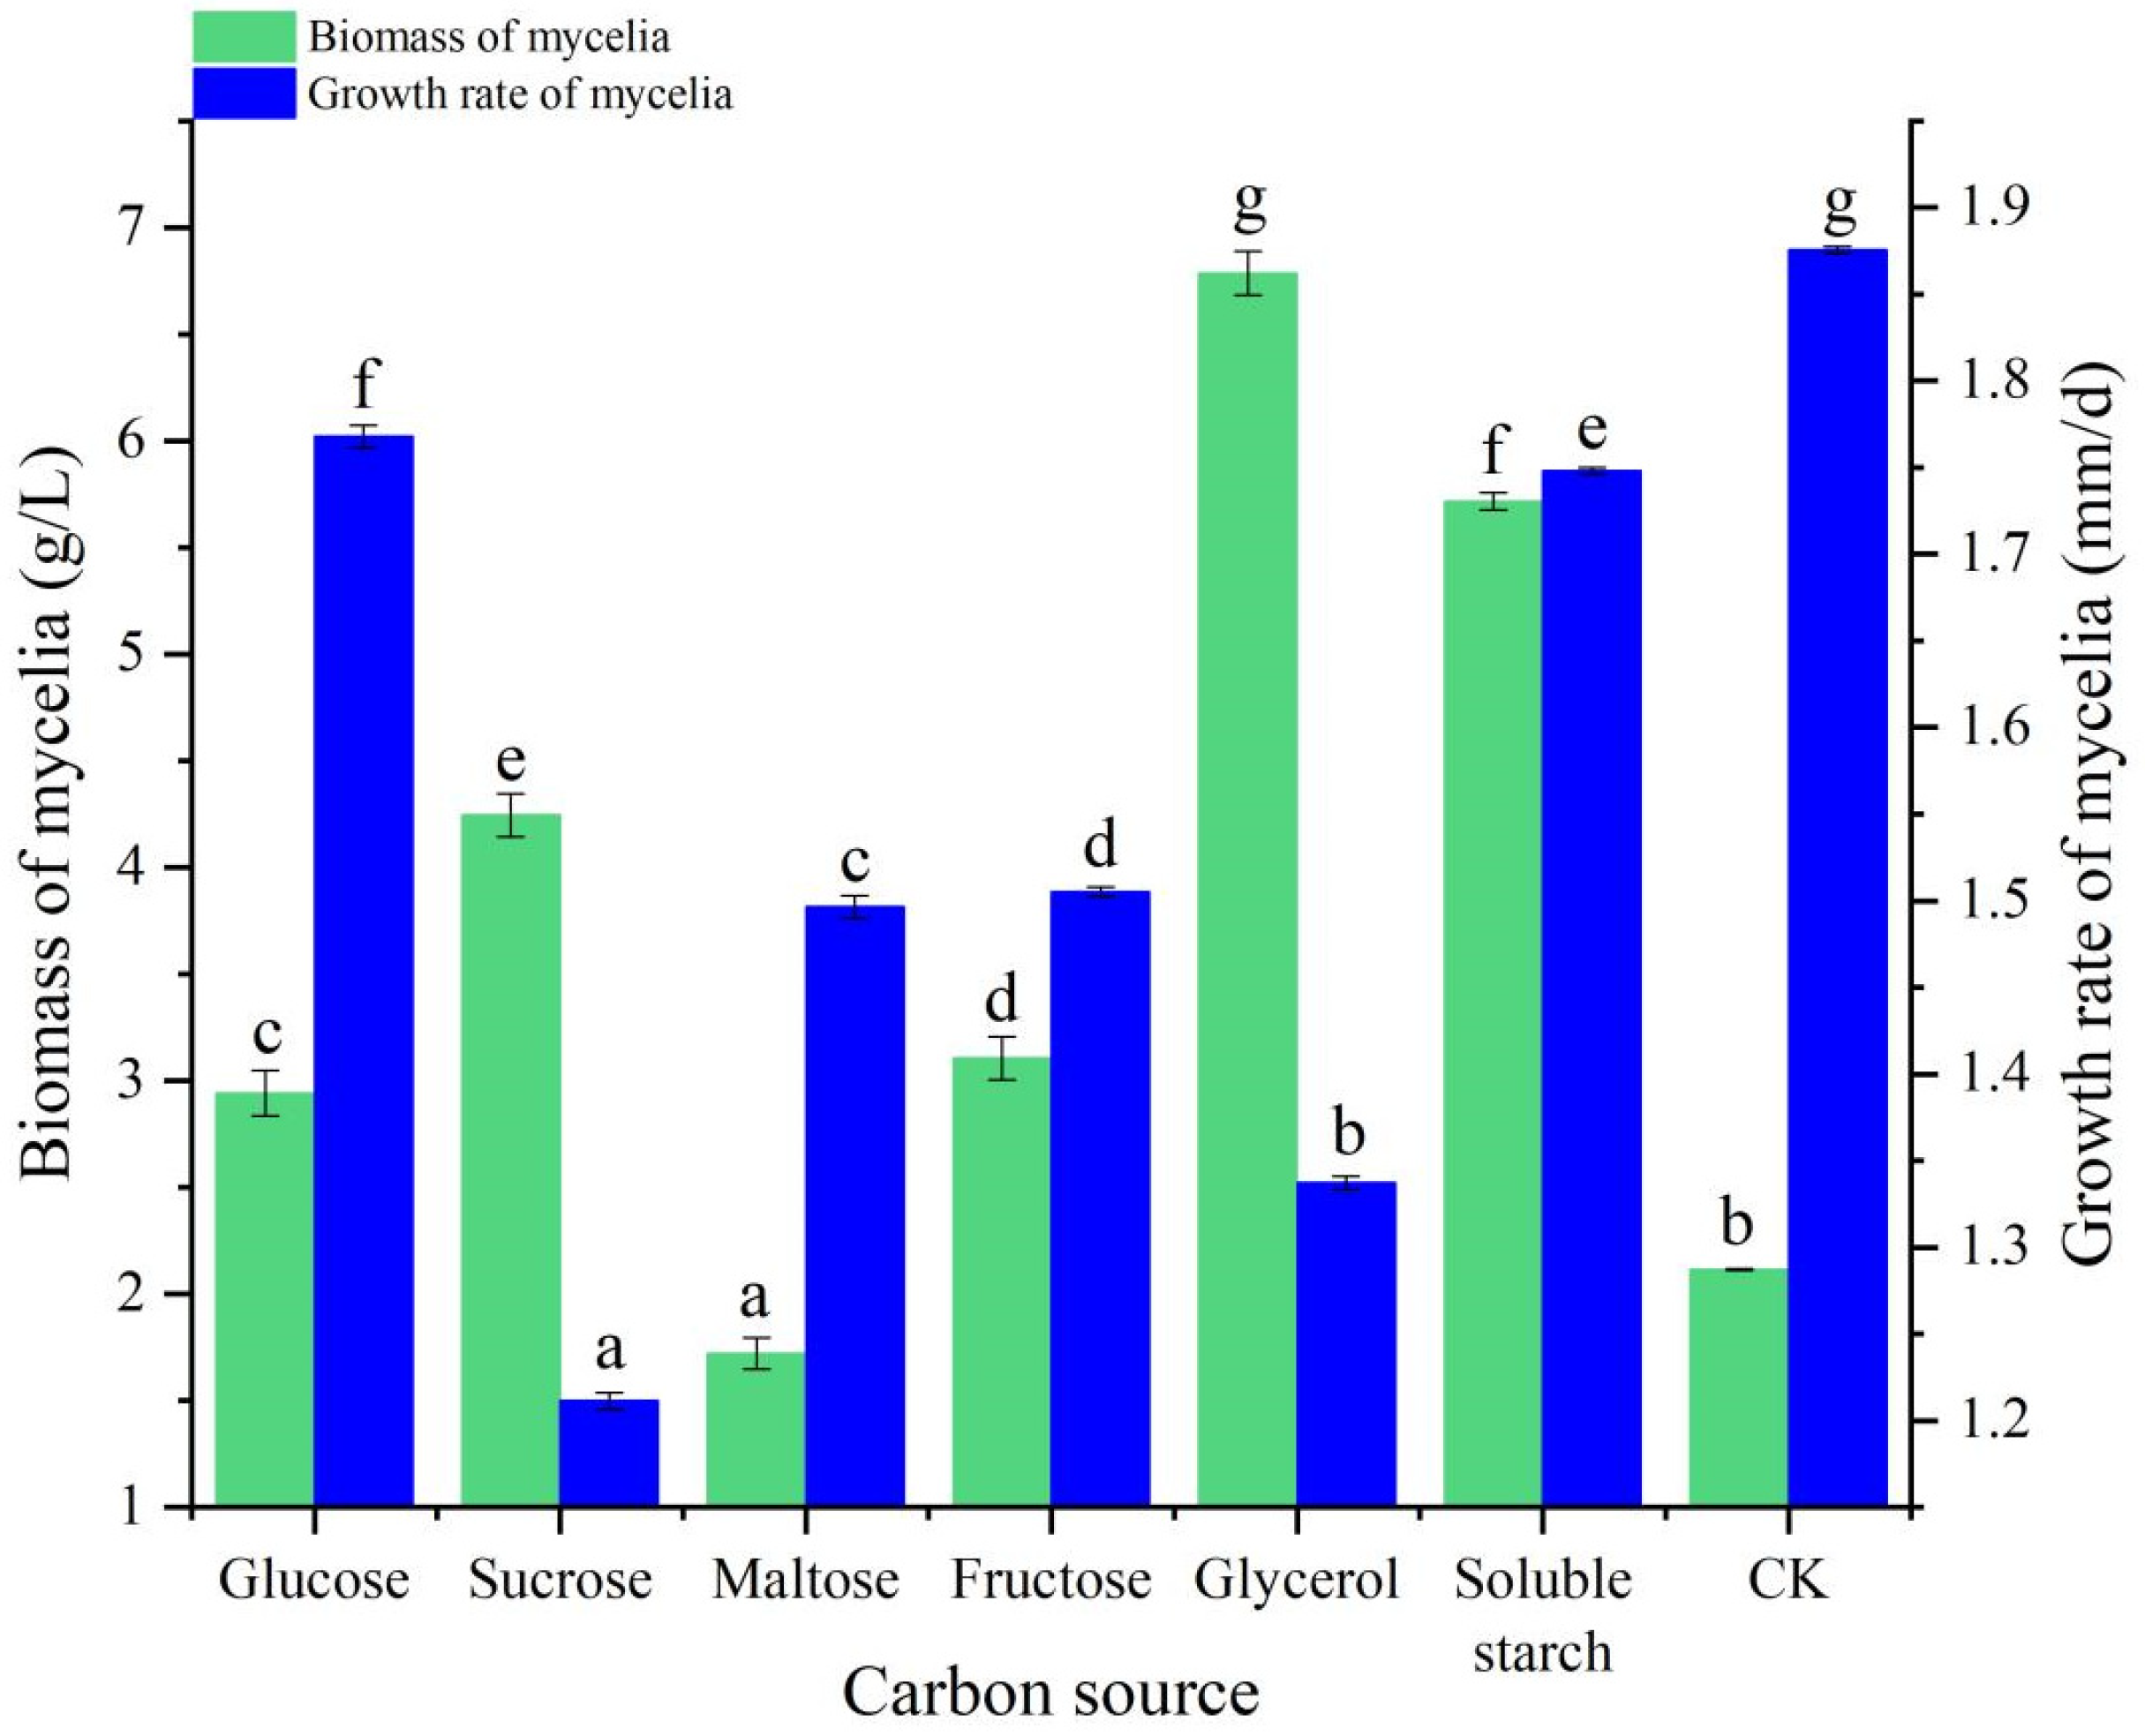
3.3. Carbon Source Experiment

The mycelia of B. caledonica could grow on solid and liquid media with different carbon sources (glucose, sucrose, maltose, fructose, glycerol, and soluble starch) and on the control (CK), but there were significant differences in mycelial growth among these conditions. The growth rates of mycelia on solid media sequentially decreased in this order: control, glucose, soluble starch, fructose, maltose, glycerol, and sucrose (Figure 4). The colonies were sparse when glucose, maltose, fructose, and soluble starch were used as carbon sources, and the colonies in the control group were also sparse. However, the colonies were dense, and the mycelial surface was smooth and pure white when sucrose and glycerol were used as carbon sources. The biomass of mycelia in liquid media decreased sequentially in this order: glycerol, soluble starch, sucrose, fructose, glucose, no carbon source, and maltose. In general, the optimal carbon source for both cultivation methods was glycerol (Figure 4).

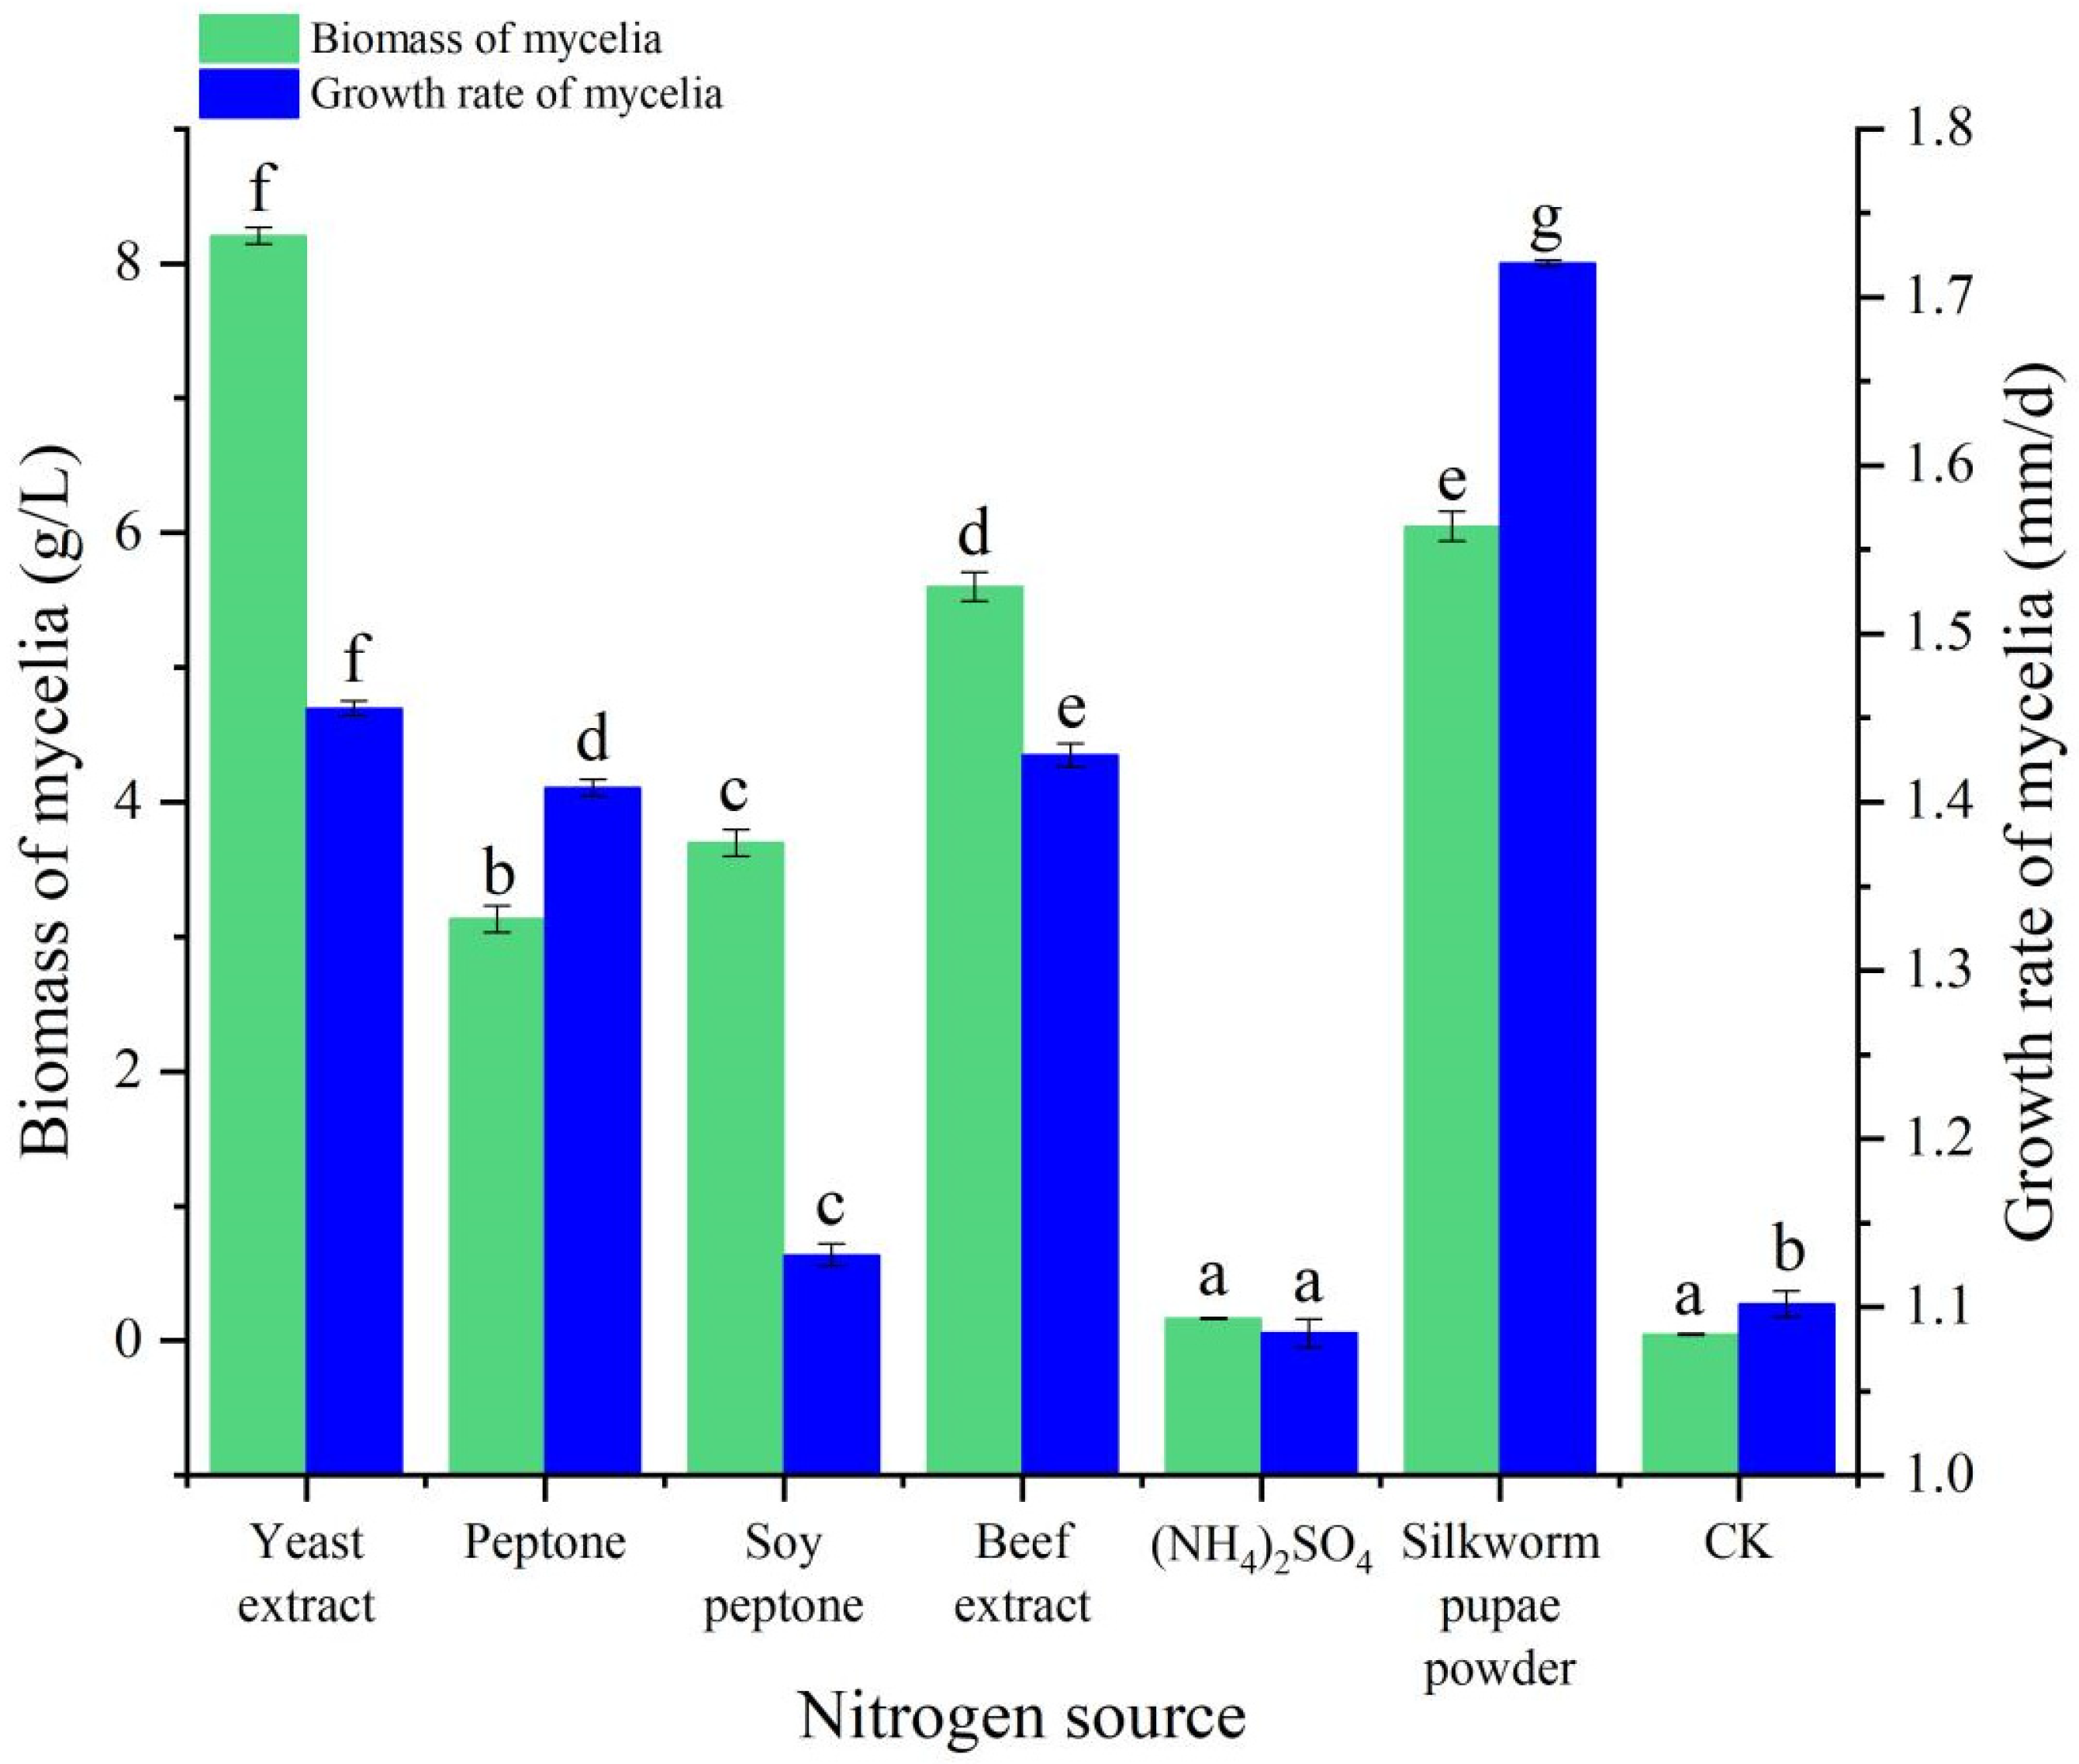
3.4. Nitrogen Source Experiment

The mycelia of B. caledonica could grow on solid and liquid media with different nitrogen sources (yeast extract, peptone, soy peptone, beef extract, (NH4)2SO4, and silkworm pupae powder) and on the control, but there were significant differences in mycelial growth. The growth rate of the mycelia decreased sequentially in the following order: silkworm pupae powder, yeast extract, beef extract, peptone, soy peptone, control, and (NH4)2SO4 (Figure 5). The colonies were sparse when beef extract, (NH4)2SO4, and silkworm pupae powder were used as nitrogen sources, and the colonies in the control group were also sparse. However, the colonies were dense when yeast extract, peptone, and soy peptone were used as nitrogen sources, and the colonies were whiter and denser when yeast extract was used as a nitrogen source than when other nitrogen sources were used. In liquid culture, the biomass of the mycelia decreased sequentially in the following order: yeast extract, silkworm pupae powder, beef extract, soy peptone, peptone, (NH4)2SO4, and control, and there was no significant difference between (NH4)2SO4 and the control (Figure 5). In general, the optimal nitrogen source for both cultivation methods was yeast extract.

3.5. pH Experiment

The mycelia of B. caledonica could grow on solid and liquid media with different pH values (pH 5, 6, 7, 8, and 9). The growth rate of mycelia decreased sequentially in the following order: pH 7, 6, 5, 8, and 9. The biomass of the mycelia in liquid culture decreased sequentially in the following order: pH 7, 6, 5, 8, and 9. The two cultivation methods had the same change trend with respect to pH; therefore, the optimal pH was 7 for both liquid and solid cultivation (Figure 6).

3.6. RSM Experiment

3.6.1. Statistical Analysis Using RSM

To optimize mycelial growth, the glycerol content, yeast extract content, and pH were selected as independent variables in the single-factor experiments. The growth rate and biomass were optimized using the RSM approach combined with the Box–Behnken method. The complete experimental design is shown in Table 2, consisting of 17 runs with independent variables at three variable levels.
A total of 17 runs were performed to optimize each parameter in the Box–Behnken design. The regression equation of response can be predicted by examining the independent and dependent variables. The mathematical model for predicting the response Y (growth rate) of B. caledonica can be represented by the following quadratic formula:
Ygrowthrate
= −33.31694 + 0.056245A + 0.16851B + 10.26720C + 0.0012875AB − 0.000575AC + 0.00303BC − 0.00133862A2 − 0.0099505B2 − 0.78645C2
The mathematical model for predicting the response Y (biomass) of B. caledonica can be represented by the following quadratic formula:
Ybiomass
= 178.85926 + 0.27031A + 1.05365B + 55.19357C + 0.0068025AB + 0.009685AC + 0.01876BC − 0.0083162A2 − 0.061738B2 − 4.24398C2
The models showed that three factors had a nonlinear relationship with the growth rate and biomass of mycelia, and there was an interaction effect among the independent variables.

3.6.2. Analysis of Variance (ANOVA) of Regression Equations

A good quadratic model for the growth rate of B. caledonica was obtained. According to the ANOVA, the model was extremely significant (p < 0.0001), and the degree of fit was good, which could reflect the relationships between the mycelial growth rate of B. caledonica and the independent variables (Table 3). The difference in lack of fit was not significant (p > 0.05), indicating that the model fit well throughout the entire regression area. The resulting R2 = 0.9888 and RAdj2 = 0.9743 of the regression model showed that three independent variables in the test had an impact on the response value of 98.88%, and only 2.57% of the total variation could not be fitted by the model. A C.V. of 2.19% indicates the high reliability and accuracy of the test, and this mathematical model can be used to predict the experimental results. The regression coefficients A, B, and C, interaction coefficient AB, and quadratic coefficients A2, B2, and C2 were all significant (p < 0.01), indicating that glycerol content, yeast extract content, and pH were significantly correlated with the growth rate of the mycelia. The glycerol content was shown to be the major factor impacting the growth rate of the mycelia, followed by the yeast extract content and pH, according to a comparison of F (A) = 94.12 > F (B) = 37.53 > F (C) = 6.49 (Table 3).
According to the ANOVA of the biomass, the quadratic model was extremely significant (p < 0.0001), and the degree of fitting was good, which could reflect the relationship between the mycelial biomass of B. caledonica and the independent variables (Table 4). The difference in lack of fit was not significant (p > 0.05), indicating that the model fit well throughout the entire regression area. The resulting R2 = 0.9952 and RAdj2 = 0.9890 of the regression model showed that three independent variables in the test had an impact on the response value of 99.52%, and only 1.10% of the total variation could not be fitted by the model. The C.V. of 1.43% indicates the high reliability and accuracy of the test, and the mathematical model can be used to predict the experimental results. The regression coefficients A, B, and C, interaction coefficient AB, and quadratic coefficients A2, B2, and C2 were all significant (p < 0.01), indicating that glycerol content, yeast extract content, and pH were significantly correlated with the growth rate of the mycelia. The glycerol content was shown to be the major factor impacting the growth rate of the mycelia, followed by the yeast extract content and pH, according to a comparison of F (A) = 216.28 > F (B) = 67.83 > F (C) = 18.65 (Table 4).

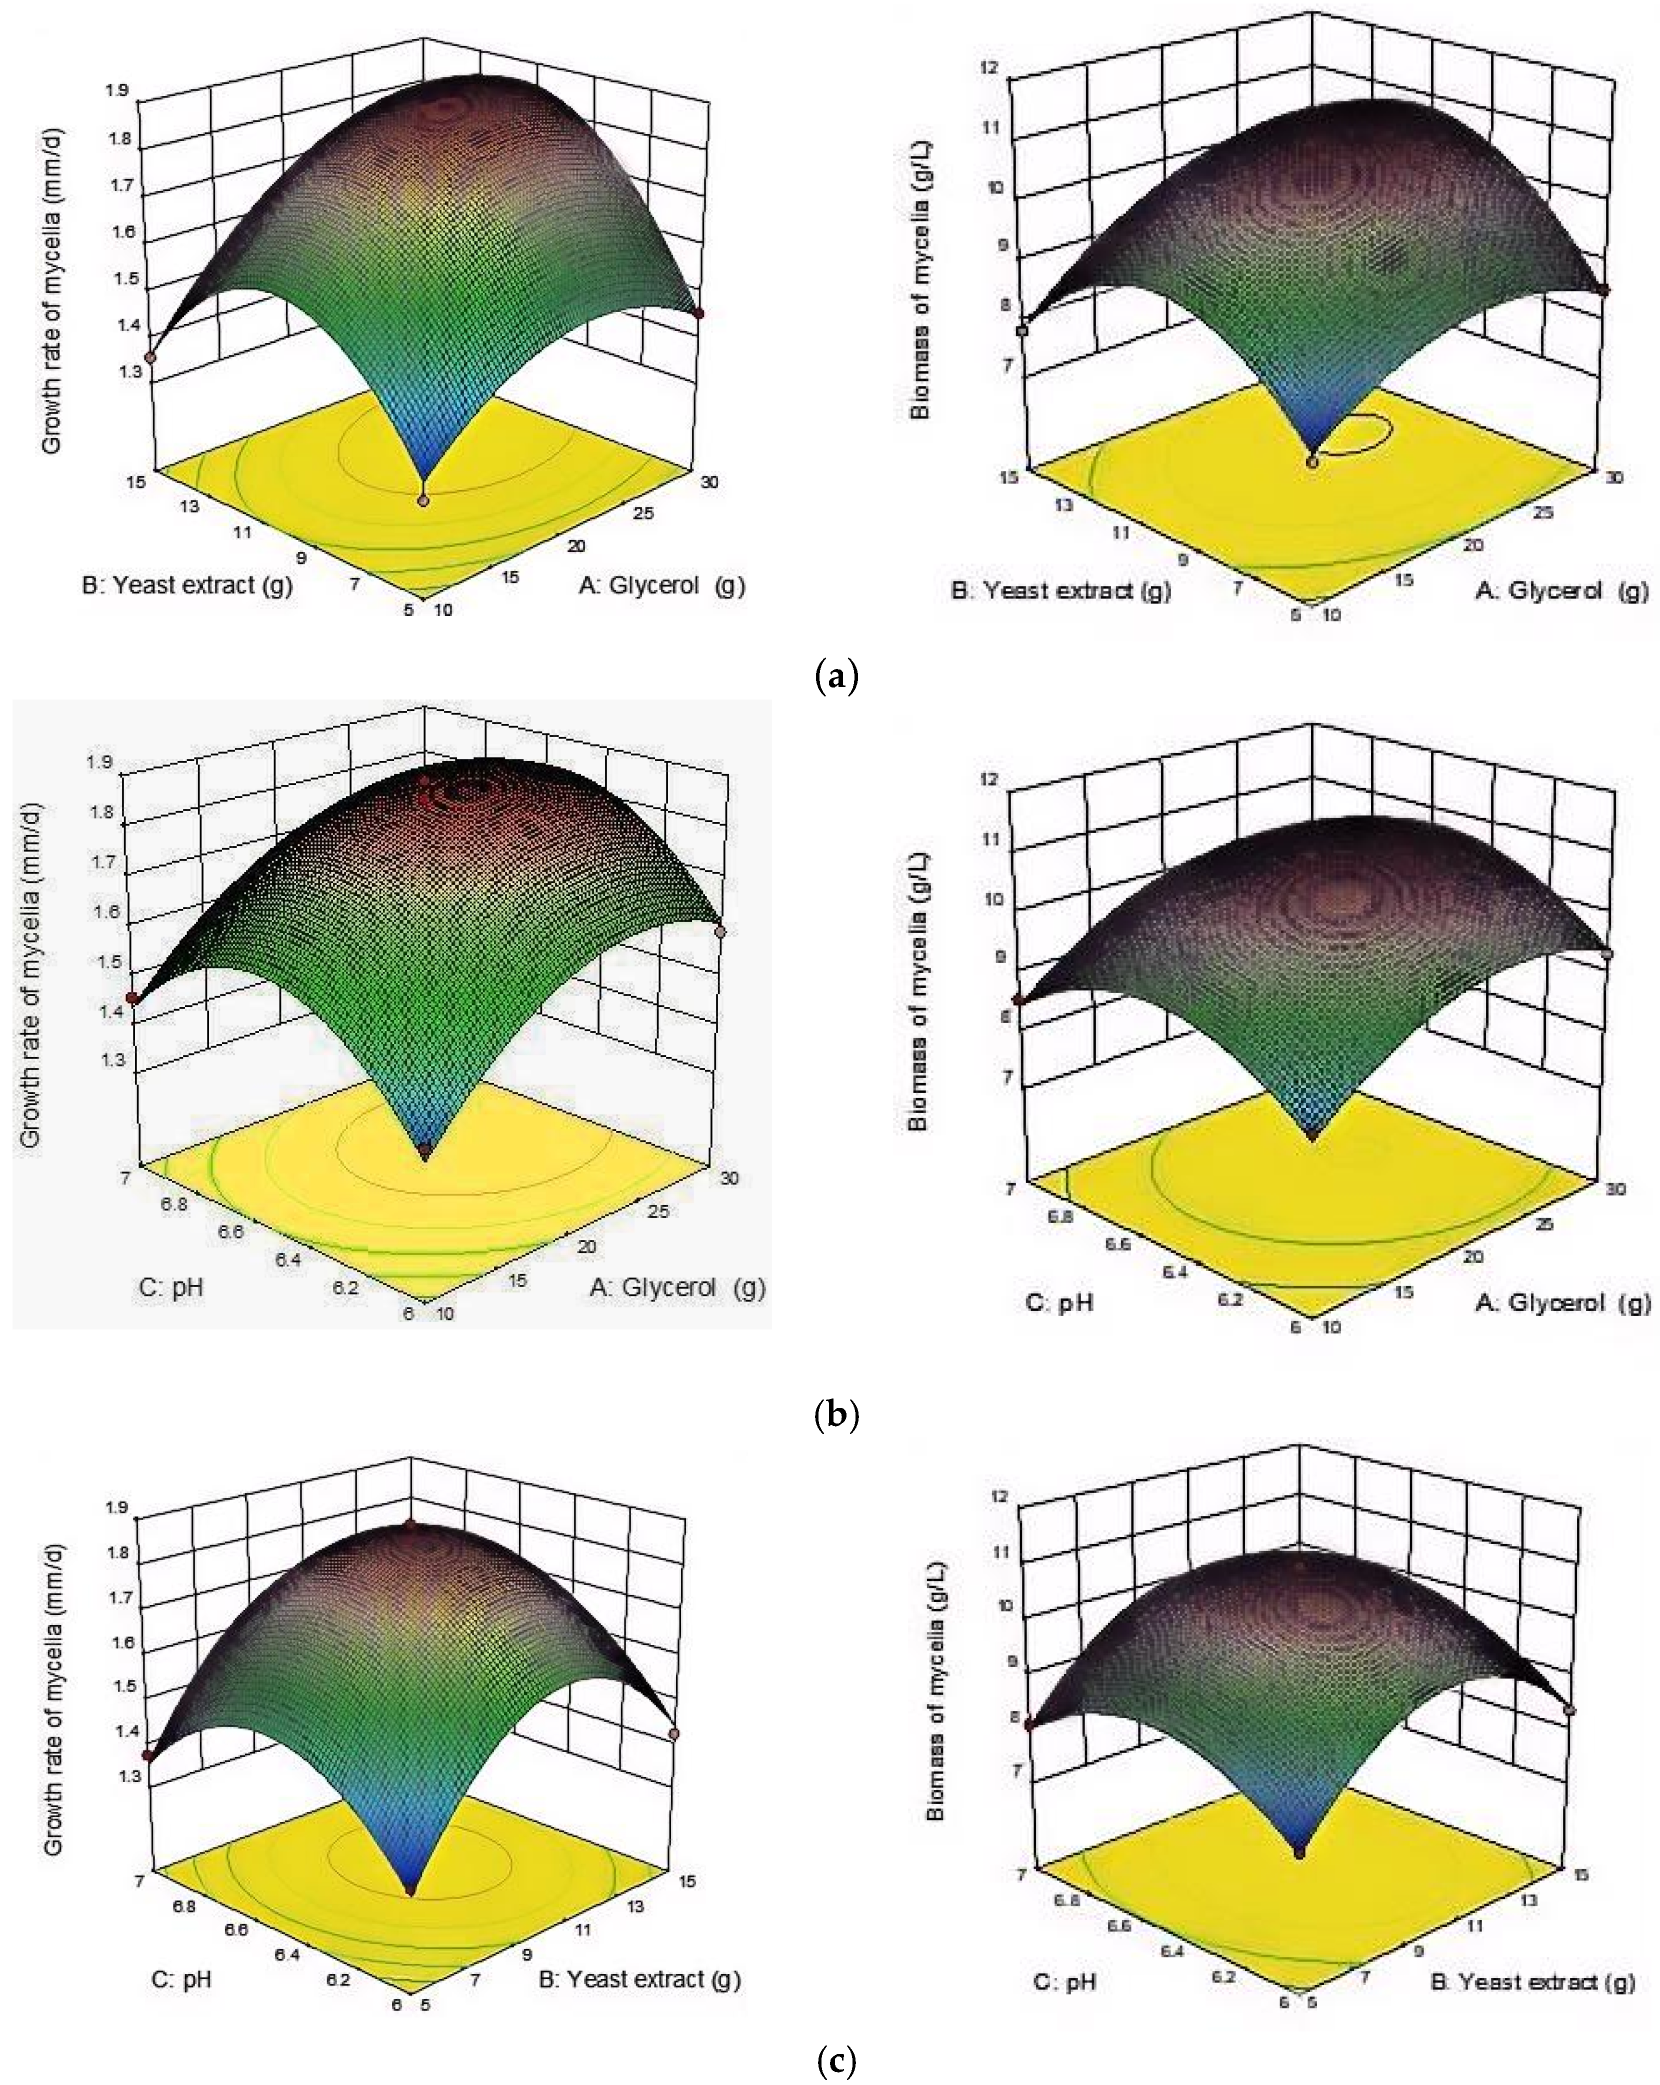
3.6.3. RSM Analysis of the Interaction of Factors

The interactions between the variables were examined by a three-dimensional (3D) response surface plot through Design Expert 10 software. To optimize the growth rate and biomass, graphs were created to show the correlation between the response and the level of the variable, as well as the interactions among the variables. The steepness of the surface in this 3D map can indicate the extent to which the three independent variables affect the change in the growth rate and biomass of the mycelia. According to Figure 7, it was observed that when the glycerol content ranged from 25 to 30 g and the yeast extract content ranged from 9 to 15 g, the mycelial growth rate and biomass were greater (Figure 7a). Similarly, when the glycerol content was within the range of 25–30 g and the pH was maintained at 6.4–6.8, there was also an increase in mycelial growth rate and biomass (Figure 7b). Additionally, when the yeast extract content fell between 9 and 15 g and the pH remained at 6.4–6.8, there was a similar enhancement in mycelial growth rate and biomass (Figure 7c). The steepness and corresponding contour plots displayed significant changes in Figure 7a, indicating that both glycerol content and yeast extract content had substantial effects on mycelial growth rate and biomass. However, the interactions between glycerol content and pH as well as yeast extract content and pH were found to be insignificant in Figure 7b,c. These findings are consistent with the ANOVA results of the response surfaces presented in Table 3 and Table 4. Combined with the quadratic regression equation in this study, the results showed that the glycerol content and yeast extract content had an extremely significant interaction effect (p < 0.01), and the response value showed a parabolic trend (Figure 7a). Therefore, the regression equation had a maximum value.

3.6.4. RSM Optimization Validation

According to the analysis by the Numerical Optimization module of Design-Expert 10.0.1 software, the optimal theoretical formula for the growth rate of solid cultured mycelia was 25.783 g glycerol, 10.919 g yeast extract, and pH 6.551. The theoretical mycelial growth rate under the optimal conditions was 1.889 mm/d. However, for the convenience of operation, the following formula was used: 25.8 g of glycerol, 10.9 g of yeast extract, pH 6.5, 1 g of MgSO4·7H2O, 1 g of KH2PO4, 10 mg of vitamin B1, 20 g of agar, and 1 L of distilled water, with four replicates. The final experimental mycelial growth rate was 1.890 mm/d, which was approximately the expected value.
The theoretical formula for the maximum biomass of liquid-cultured mycelia yielded optimal conditions of 26.171 g glycerol, 11.076 g yeast extract, and pH 6.613. Under these conditions, the theoretical mycelial biomass calculated by the formula was 11.036 g/L. Using the actual operating formula, these numbers were 26.2 g glycerol, 11.1 g yeast extract, pH 6.6, 1 g MgSO4·7H2O, 1 g KH2PO4, 10 mg vitamin B1, and 1 L distilled water, and this medium was tested with four replicates. The final experimental mycelial biomass was 11.020 g/L, which was approximately the expected value. In general, the quadratic multiple regression equation model had a certain degree of practical predictability.

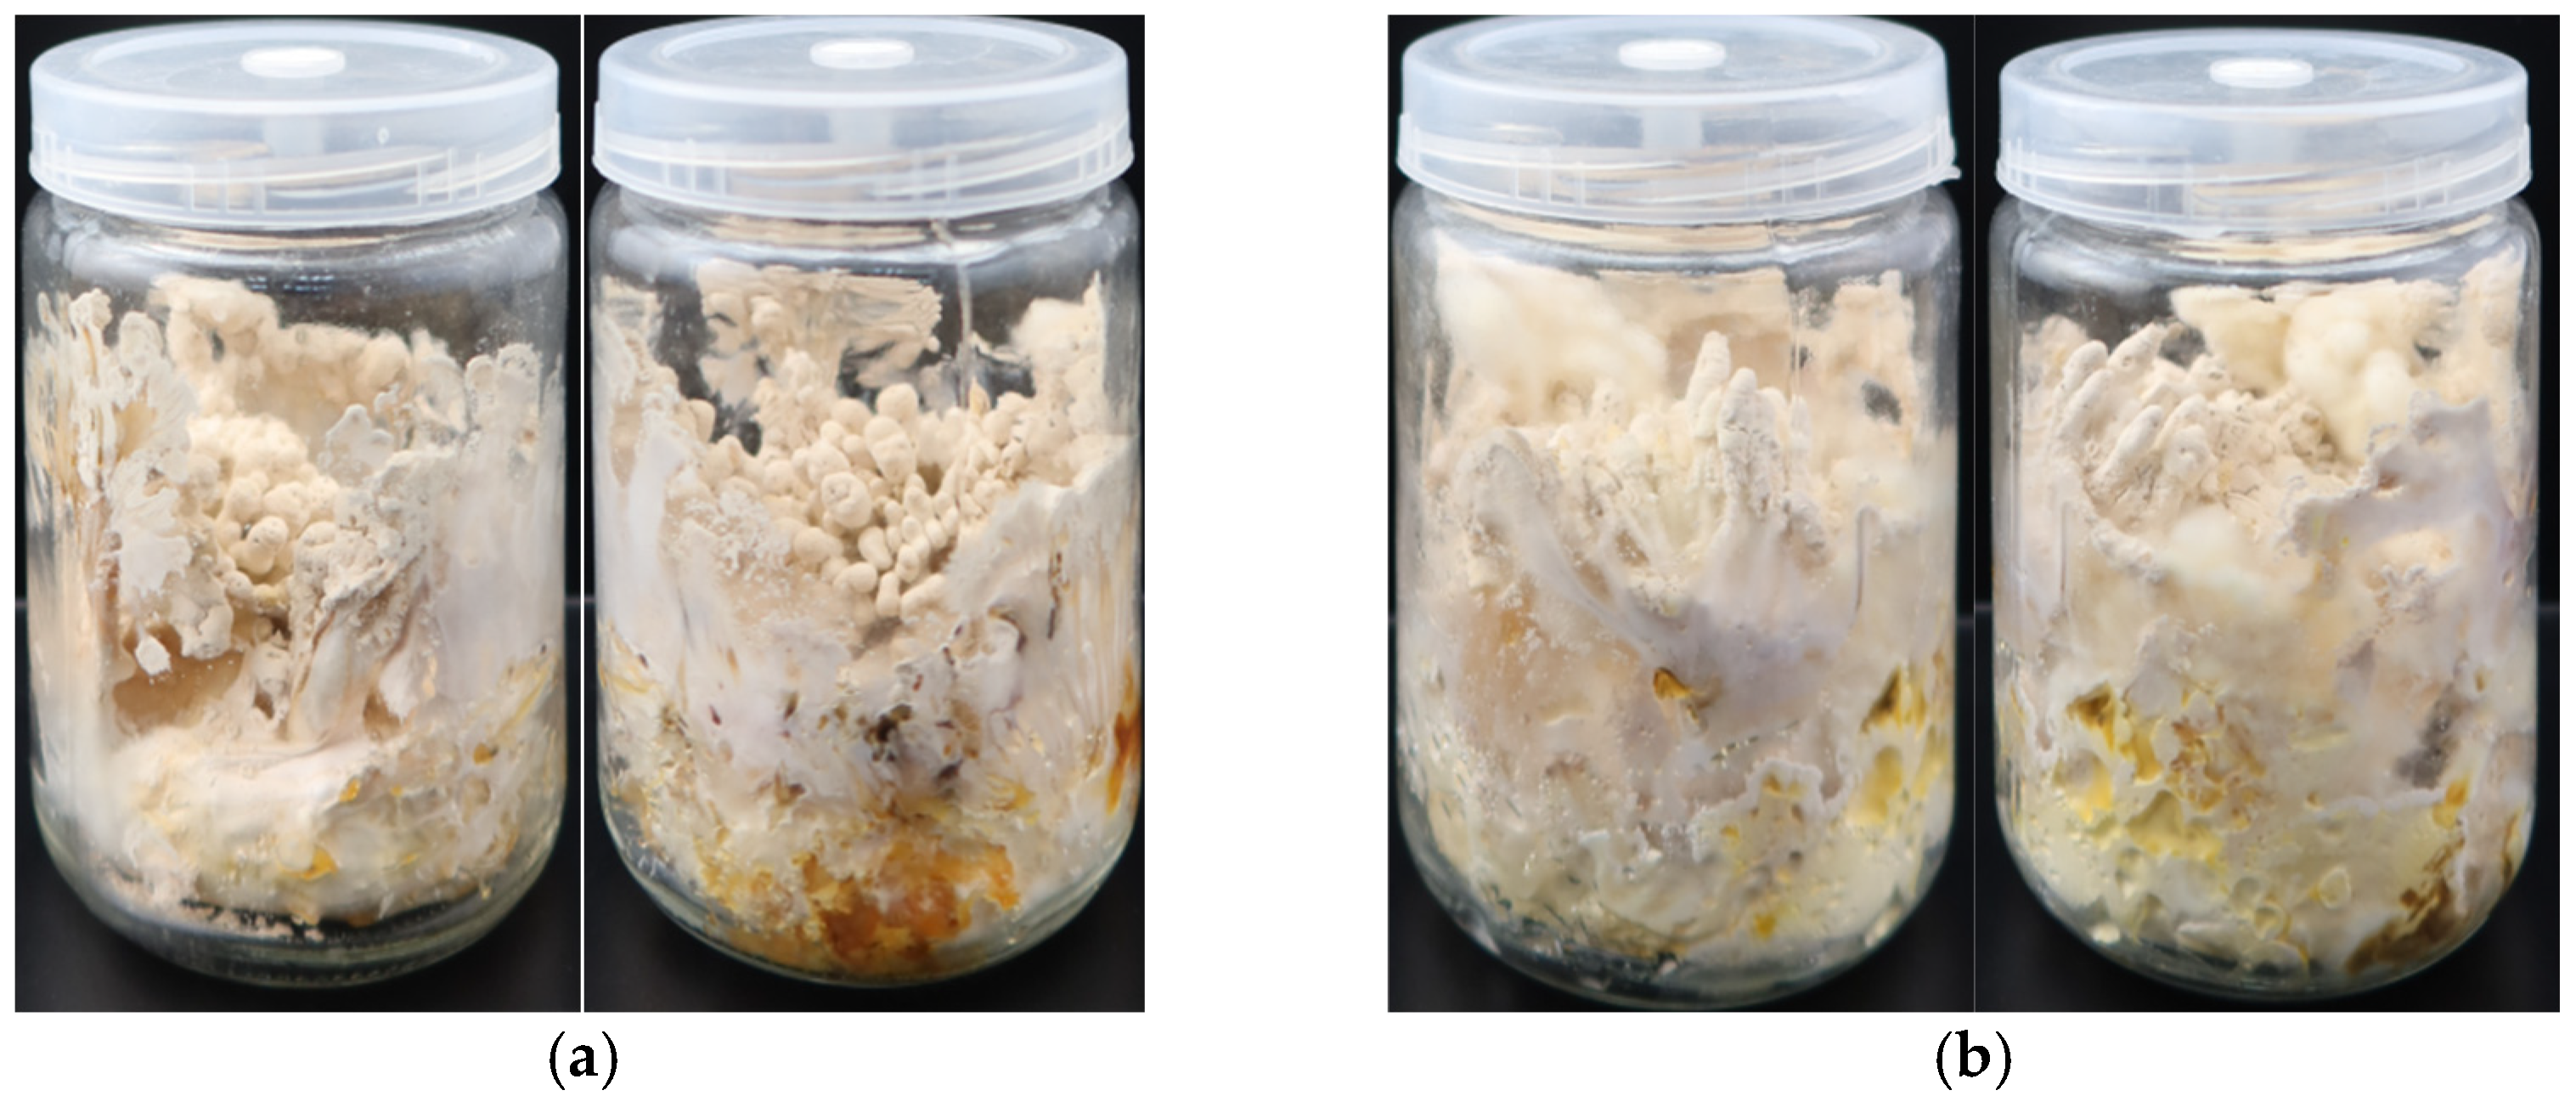
3.7. Domestication Cultivation Experiment

Figure 8 shows the differences in the domestication and cultivation of B. caledonica between wheat cultivation medium (Figure 8a) and rice cultivation medium (Figure 8b). There was a significant difference in the growth rate of B. caledonica mycelia between the two different cultivation media. B. caledonica could grow normally in both cultivation media, and the time for the mycelia to completely fill the cultivation bottle was approximately 10–11 d in the wheat cultivation medium, whereas it took 13–15 d in the rice cultivation medium. After the mycelia were fully grown, the bottles were cultured under light for 12 h/d. Approximately 20 d later, the mycelia had adhered to the wall of the bottle and had grown to approximately two-thirds of the height of the bottle. However, no primordia or fruiting bodies formed on the surface of the mycelia at this time. After approximately 20 d of further culture, fruiting bodies formed from the surface of the mycelia in the middle of the cultivation medium, and aleuriospores attached to the surface of the fruiting bodies. The fruiting bodies could be harvested after 15 d of further culture when they had grown to the height of the adherent mycelia. Therefore, the entire cultivation cycle lasted approximately 65 d.
The average yields of fruiting bodies produced by the wheat cultivation medium and rice cultivation medium were 0.470 g and 0.529 g, respectively (Table 5). There was no obvious difference in the morphology of the fruiting bodies produced by the two cultivation media, and the heads of the fruiting bodies were swollen and elliptical, branching or not branching, with villi on the surface and some spore powder attached. The stem of the fruiting bodies was often branched, with villi on the surface. The single fruiting bodies had a soft texture and a gap inside (Figure 8a,b).

3.8. Polysaccharide Content of Fruiting Bodies

The glucose standard curve equation was Y = 8.8179x + 0.0492, and the correlation coefficient R2 = 0.999.
Polysaccharide   content   ( % ) = A 0.0492 × 100 × 100 W × 8.8179
A: absorbance value; W: weight of fruiting bodies (mg).
The polysaccharide contents of the fruiting bodies produced by the wheat cultivation medium and rice cultivation medium were 6.635 ± 0.059% and 9.264 ± 0.053%, respectively. The polysaccharide content of the fruiting bodies produced by the rice cultivation medium was greater than that produced by the wheat cultivation medium.

3.9. Adenosine and Cordycepin Contents in Fruiting Bodies

The chromatographic peaks of the adenosine and cordycepin standards were obvious and symmetrical, with no miscellaneous peak interference, indicating that the purity of the mixed standard solution was good (Figure 9). As shown in Figure 9a, the chromatographic peak with a retention time of 10.226 min was attributed to adenosine, and the peak with a retention time of 13.253 min was attributed to cordycepin. Two peaks with high response values appeared at 10-14 min in the mixed sample solution, with retention times of 10.108 and 12.444 min, respectively (Figure 9b). Three peaks with high response values appeared at 10–14 min, as shown in Figure 9c. Compared with Figure 9a,b, the chromatographic peak with a retention time of 10.118 min was adenosine, and the peak with a retention time of 13.037 min was cordycepin. Adenosine was detected in the fruiting bodies of B. caledonica, but cordycepin was not detected.
The average recovery rate of adenosine was 98.175%, and the RSD was 0.955%. The results showed that the standard compound was recovered well and could be used to detect the adenosine content of fruiting bodies in Cordyceps in this study (Table 6). The regression equation for the adenosine standard curve was y = 32617x + 3788.5, and the correlation coefficient R2 = 0.9994. According to the standard curve equation, the adenosine content of fruiting bodies produced in wheat medium was 0.145 ± 0.001%, and the adenosine content of fruiting bodies produced in rice medium was 0.150 ± 0.001%.

4. Discussion

As a rare species of Cordyceps s.l., B. caledonica has only been studied in field investigations for its antibacterial activities and insect toxicity. The biological characteristics, artificial domestication, and cultivation of this fungus have not been reported and need to be further studied [43,44]. In this research, the ITS4/ITS5 primers were used to amplify the ITS sequence of the wild fruiting bodies, which was identified by homologous and phylogenetic analysis. It was found that the wild strain was B. caledonica based on molecular identification. Because of high degree of interspecific variability, conserved primer sites and multiple copy nature in the genome, the potential barcode ITS molecular marker for most of fungi was used for the identification. Other molecular markers such as TEF1-α may be use as secondary barcode to confirm the molecular identity of wild strain, which may be more effective for species level identification [45]. The isolated strain was further used as the study object to explore the optimal mycelial culture conditions and domestication cultivation of fruiting bodies. We found that different liquid media exhibited different colors when used to cultivate the mycelia, which may be related to the pigments secreted during the B. caledonica growth process. According to Jian et al., the yellow pigment of C. militaris could be widely used in the food industry because of its beneficial physiological properties, such as anti-inflammatory and antioxidant effects [46]. Therefore, subsequent research should be performed on the biological pigments of B. caledonica, which has great potential for pigment production.
Fruiting bodies often consist of conidiophores with dense, sticky or soft, upright or curved, branched or unbranched morphologies and are clustered into sporulation structures [47]. In our previous study, we found that when rice or wheat were used as cultivation media under humid (air relative humidity 90 ± 5%), ventilated (opening the bottle cap), and light conditions (12 h/d), the mycelia could completely fill the whole culture bottle, but they could not form fruiting bodies even after approximately 50 days of cultivation. Our further study showed that the fruiting bodies only grew well under light conditions (12 h/d) for mushroom production management, excluding humidification and ventilation conditions. Under the same cultivation conditions, the fruiting bodies produced by B. caledonica were different from those produced by Cordyceps tenuipes and Polycephalomyces ramosus and had a soft texture, light weight, and low yield [48,49]. The domestication and cultivation of B. caledonica indicated that artificial regulation to produce a dry and low-oxygen culture environment is an effective way to promote the transformation of some difficult to domesticate Cordyceps from asexual propagation to fruiting bodies.
The fruiting bodies of Cordyceps have medicinal value. Cordyceps has a high content of polysaccharide, which is an important bioactive substance that has been widely used in health and medical products because of its physiological functions, such as improving immunity, and antiaging, anticancer, and antioxidative effects [50]. In this study, the polysaccharide content of fruiting bodies produced by B. caledonica was greater than that produced by P. ramosus [49]. Therefore, subsequent research should be performed on the polysaccharide activity and function of B. caledonica. In addition, the minimum adenosine content of fruiting bodies in this study was 0.145 ± 0.001%, which was much greater than the standard of the pharmacopoeia. The adenosine content in Cordyceps is not less than 0.010% according to the Pharmacopoeia of the People’s Republic of China (2020 edition), suggesting that the fruiting bodies of B. caledonica in this study may have high medicinal value. However, cordycepin was not detected in this study. This study provides a reference for the artificial cultivation and utilization of B. caledonica.

Author Contributions

Conceptualization, W.C., Q.L. and C.L.; methodology, W.C., C.Y. and C.L.; writing—original draft, C.Y.; investigation, W.C., C.D. and C.L.; formal analysis, C.Y., Y.Z. and C.L.; funding acquisition, Y.Z.; project administration, Y.Z. and C.L.; supervision, Q.L. and C.D.; data curation, W.C.; writing—review and editing, Y.Z. All authors have read and agreed to the published version of the manuscript.

Funding

This work was supported financially by the Shanghai Agricultural Commission Program (2020-02-08-00-12-F01479), Shanghai Academy of Agricultural Sciences (JCYJ231601), and the Project of the Science and Technology Department of Guizhou Province (20190245102).

Data Availability Statement

The original contributions presented in the study are included in the article, further inquiries can be directed to the corresponding authors.

Conflicts of Interest

The authors declare no conflicts of interest.

References

  1. Yeon, S.H.; Kim, J.R.; Ahn, Y.J. Comparison of growth-inhibiting activities of Cordyceps militaris and Paecilomyces japonica cultured on Bombyx mori pupae towards human gastrointestinal bacteria. J. Sci. Food Agric. 2007, 87, 54–59. [Google Scholar] [CrossRef]
  2. Chen, W.H.; Liang, J.D.; Ren, X.X.; Zhao, J.H.; Han, Y.F.; Liang, Z.Q. Cryptic diversity of Isaria-like species in Guizhou, China. Life 2021, 11, 1093. [Google Scholar] [CrossRef]
  3. Kepler, R.; Ban, S.; Nakagiri, A.; Bischoff, J.; Hywel-Jones, N.; Owensby, C.A.; Spatafora, J.W. The phylogenetic placement of hypocrealean insect pathogens in the genus Polycephalomyces: An application of One Fungus One Name. Fungal Biol. 2013, 117, 611–622. [Google Scholar] [CrossRef] [PubMed]
  4. Quandt, C.A.; Kepler, R.M.; Gams, W.; Araujo, J.P.M.; Ban, S.; Evans, H.C.; Hughes, D.; Humber, R.; Hywel-Jones, N.; Li, Z.; et al. Phylogenetic-based nomenclatural proposals for Ophiocordycipitaceae (Hypocreales) with new combinations in Tolypocladium. IMA Fungus 2014, 5, 121–134. [Google Scholar] [CrossRef]
  5. Li, C.H.; Yang, S.S.; Deng, W.Q.; Lin, Q.Y. Cordyceps Sensu Lato and their domestication and cultivation in China. Acta Edulis Fungi 2023, 30, 113–148. (In Chinese) [Google Scholar]
  6. Xiao, Y.P.; Wang, Y.B.; Hyde, K.D.; Eleni, G.; Sun, J.Z.; Yang, Y.; Meng, J.; Yu, H.; Wen, T.C. Polycephalomycetaceae, a new family of clavicipitoid fungi segregates from Ophiocordycipitaceae. Fungal Divers. 2023, 120, 1–76. [Google Scholar] [CrossRef]
  7. Kepler, R.M.; Luangsa-Ard, J.J.; Hywel-Jones, N.L.; Quandt, C.A.; Sung, G.H.; Rehner, S.A.; Aime, M.C.; Henkel, T.W.; Sanjuan, T.; Zare, R.; et al. A phylogenetically-based nomenclature for Cordycipitaceae (Hypocreales). IMA Fungus 2017, 8, 335–353. [Google Scholar] [CrossRef] [PubMed]
  8. Index Fungorum. Available online: https://www.indexfungorum.org/names/names.asp (accessed on 18 January 2024).
  9. Bussmann, R.W. Ophiocordyceps sinensis (Berk.) G.H. Sung, J.M. Sung, Hywel-Jones & Spatafora OPHIOCORDYCIPITACEAE. In Ethnobotany of the Himalayas. Ethnobotany of Mountain Regions; Kunwar, R.M., Sher, H., Bussmann, R.W., Eds.; Springer International: Cham, Switzerland, 2021; pp. 1393–1396. [Google Scholar]
  10. Zhou, X.W.; Li, L.J.; Tian, E.W. Advances in research of the artificial cultivation of Ophiocordyceps sinensis in China. Crit. Rev. Biotechnol. 2014, 34, 233–243. [Google Scholar] [CrossRef] [PubMed]
  11. Li, Z.Z.; Luan, F.G.; Hywel-Jones, N.L.; Zhang, S.L.; Chen, M.J.; Huang, B.; Sun, C.S.; Chen, Z.A.; Li, C.R.; Tan, Y.J.; et al. Biodiversity of cordycipitoid fungi associated with Isaria cicadae Miquel Ⅱ: Teleomorph discovery and nomenclature of chanhua, an important medicinal fungus in China. Mycosystema 2021, 40, 95–107. (In Chinese) [Google Scholar]
  12. Basith, M.; Madelin, M.F. Studies on the production of perithecial stromata by Cordyceps militaris in artificial culture. Can. J. Bot. 1968, 46, 473–480. [Google Scholar] [CrossRef]
  13. Lin, Q.Y.; Song, B.; Huang, H.; Li, T.H. Optimization of selected cultivation parameters for Cordyceps guangdongensis. Lett. Appl. Microbiol. 2010, 51, 219–225. [Google Scholar] [CrossRef] [PubMed]
  14. Liu, X.; Tibpromma, S.; Hughes, A.; Chethana, K.; Wijayawardene, N.; Dai, D.; Du, T.; Elgorban, A.; Stephenson, S.; Suwannarach, N.; et al. Culturable mycota on bats in central and southern Yunnan Province, China. Mycosphere 2023, 14, 497–662. [Google Scholar] [CrossRef]
  15. Liu, Z.Y.; Liang, Z.Q.; Whalley, A.J.; Yao, Y.J.; Liu, A.Y. Cordyceps brittlebankisoides, a new pathogen of grubs and its anamorph, Metarhizium anisopliae var. majus. J. Invertebr. Pathol. 2001, 78, 178–182. [Google Scholar] [CrossRef]
  16. Kepler, R.M.; Humber, R.A.; Bischoff, J.F.; Rehner, S.A. Clarification of generic and species boundaries for Metarhizium and related fungi through multigene phylogenetics. Mycologia 2014, 106, 811–829. [Google Scholar] [CrossRef]
  17. Liang, Z.Q.; Liang, J.D.; Chen, W.H.; Han, Y.F.; Zou, X. Phenotypic polymorphism of the stilbellaceous entomogenous fungi in an ant nest of Ponera II. A cryptic new Tilachildium species, Tilachildium poneraticum. Microbiol. China 2016, 43, 379–385. [Google Scholar]
  18. Liang, J.D.; Chen, W.H.; Han, Y.F.; Liang, Z.Q. Tilachlidiopsis scarabaei L.S. Olive, a rare stilbellaceous entomogenous fungus in China. Microbiol. China 2014, 41, 1121–1124. [Google Scholar]
  19. Maina, U.M.; Galadima, I.B.; Gambo, F.M.; Zakaria, D.J.J.O.E. A review on the use of entomopathogenic fungi in the management of insect pests of field crops. J. Entomol. Zool. Stud. 2018, 6, 27–32. [Google Scholar]
  20. Imoulan, A.; Hussain, M.; Kirk, P.M.; Meziane, E.; Yao, Y.J. Entomopathogenic fungus Beauveria: Host specificity, ecology and significance of morpho-molecular characterization in accurate taxonomic classification. J. Asia-Pac. Entomol. 2017, 20, 1204–1212. [Google Scholar] [CrossRef]
  21. Huang, B.; Li, C.R.; Ding, D.G.; Fan, M.Z.; Li, Z.Z. A new recorded of Beauveria in China. Mycosystema 1997, 16, 317. [Google Scholar]
  22. Chen, W.H.; Han, Y.F.; Liang, Z.Q.; Jin, D.C. A new araneogenous fungus in the genus Beauveria from Guizhou, China. Phytotaxa 2017, 302, 57–64. [Google Scholar] [CrossRef]
  23. Chen, Z.H.; Chen, K.; Dai, Y.D.; Zheng, Y.; Wang, Y.B.; Yang, X.N.; Yu, H.; Yang, Y.M.; Xu, L. Beauveria species diversity in the Gaoligong Mountains of China. Mycol. Prog. 2019, 18, 933–943. [Google Scholar] [CrossRef]
  24. Li, Z.Z. Classification and identification of the Genus Beauveria. Res. Appl. Entomopathog. Fungi China 1990, 2, 89–95. [Google Scholar]
  25. Huang, B.; Chen, M.J.; Wang, S.B.; Li, Z.Z.; Fan, M.Z. A new record of Beauveria isolated from Scolytidae in China. Mycosystema 2007, 26, 139–142. [Google Scholar]
  26. Zhang, S.L.; He, L.M.; Chen, X.; Huang, B. Beauveria lii sp. nov. isolated from Henosepilachna vigintioctopunctata. Mycotaxon 2012, 121, 199–206. [Google Scholar] [CrossRef]
  27. Chen, W.H.; Liu, M.; Huang, Z.X.; Yang, G.M.; Han, Y.F.; Liang, J.D.; Liang, Z.Q. Beauveria majiangensis, a new entomopathogenic fungus from Guizhou, China. Phytotaxa 2018, 333, 243–250. [Google Scholar] [CrossRef]
  28. Guo, D.S.; Zhai, Y.Y.; Ren, G.W.; Cheng, J.L.; Liu, Y.; An, D.R. Advance of classification of genus Beauveria. Acta Agric. Boreali—Occident. Sin. 2019, 28, 497–509. (In Chinese) [Google Scholar]
  29. Imoulan, A.; Wu, H.J.; Lu, W.L.; Li, Y.; Li, B.B.; Yang, R.F.; Wang, W.J.; Wang, X.L.; Kirk, P.M.; Yao, Y.J. Beauveria medogensis sp. nov., a new fungus of the entomopathogenic genus from China. J. Invertebr. Pathol. 2016, 139, 74–81. [Google Scholar] [CrossRef] [PubMed]
  30. Wang, Y.; Fan, Q.; Wang, D.; Zou, W.Q.; Tang, D.X.; Hongthong, P.; Yu, H. Species diversity and virulence potential of the Beauveria bassiana complex and Beauveria scarabaeidicola complex. Front. Microbiol. 2022, 13, 841604. [Google Scholar] [CrossRef] [PubMed]
  31. Liang, Z.Q.; Liu, A.Y.; Feng, D.M. Some entomogeous fungi from Fanjing mountain preserve in China. Mycosystema 1993, 12, 110–117. (In Chinese) [Google Scholar]
  32. Chen, M.J.; Huang, B.; Li, Z.Z.; Spatafora, J.W. Morphological and genetic characterisation of Beauveria sinensis sp. Nov. from China. Mycotaxon 2013, 124, 301–308. [Google Scholar] [CrossRef]
  33. Liu, Z.Y.; Liang, Z.Q.; Whalley, A.J.S.; Liu, A.Y.; Yao, Y.J. A new species of Beauveria, the anamorph of Cordyceps sobolifera. Fungal Divers. 2001, 7, 61–70. [Google Scholar]
  34. Kotta-Loizou, L.; Coutts, R.H.A. Studies on the virome of the entomopathogenic fungus Beauveria bassiana reveal novel dsRNA elements and mild hypervirulence. PLoS Pathog. 2017, 13, 1006183. [Google Scholar] [CrossRef]
  35. Wang, H.; Peng, H.; Li, W.; Cheng, P.; Gong, M. The toxins of Beauveria bassiana and the strategies to improve their virulence to insects. Front. Microbiol. 2021, 12, 2375. [Google Scholar] [CrossRef] [PubMed]
  36. Zhu, H.; Fu, J.; Wang, H.; Bidochka, M.J.; Duan, M.; Xu, W.; Sui, L.; Ren, B.Z.; Li, Q.Y.; Zhang, Z.K. Fitness consequences of oviposition choice by an herbivorous insect on a host plant colonized by an endophytic entomopathogenic fungus. J. Pest. Sci. 2023, 96, 745–758. [Google Scholar] [CrossRef]
  37. Lee, S.J.; Kim, S.; Kim, J.C.; Lee, M.R.; Hossain, M.S.; Shin, T.S.; Kim, T.H.; Kim, J.S. Entomopathogeic Beauveria bassiana, granules to control soil-dwelling stage of western flower thrips, Frankliniella occidentalis (Thysanoptera: Thripidae). Biocontrol 2017, 62, 639–648. [Google Scholar] [CrossRef]
  38. Luo, H.Y. Studies on the Pathogenity of the Biocontrol Agent Beauveria bassiana to the Silkworm, Bombyx mori. Master’s Thesis, Guangxi Normal University, Guilin, China, 2009. (In Chinese). [Google Scholar]
  39. Jiang, X. Researches on the Separation, Purification and Pharmacological Effects of Active Components from Bombyx batryticatus. Ph.D. Thesis, Zhangjiang University, Hangzhou, China, 2013. (In Chinese). [Google Scholar]
  40. Pelizza, S.A.; Scorsetti, A.C.; Fogel, M.N.; Pacheco-Marino, S.G.; Stenglein, S.A.; Cabello, M.N.; Lange, C.E. Compatibility between entomopathogenic fungi and biorational insecticides in toxicity against Ronderosia bergi under laboratory conditions. BioControl 2015, 60, 81–91. [Google Scholar] [CrossRef]
  41. Xue, J.J.; Tang, Q.J.; Liu, Y.F.; Zhou, S.; Zhao, M.W.; Zhang, J.S. Comparison and optimization of the methods for analyzing the water soluble polysaccharides in Cordyceps militaris. Mycosystema. 2012, 31, 443–449. (In Chinese) [Google Scholar]
  42. Zou, G.; Li, B.; Wang, Y.; Yin, X.; Gong, M.; Shang, J.J.; Wei, Y.J.; Li, X.L.; Bao, D.P. Efficient conversion of spent mushroom substrate into a high value-added anticancer drug pentostatin with engineered Cordyceps militaris. Green. Chem. 2021, 23, 10030–10038. [Google Scholar] [CrossRef]
  43. Moura, G.M.; Marinho-Prado, J.S.; Assalin, M.R.; Martins, L.G.; Braga, E.S.; Tasic, L.; Dita, M.; Lopes, R.B. Natural occurrence of Beauveria caledonica, pathogenicity to Cosmopolites sordidus and antifungal activity against Fusarium oxysporum f. sp. cubense. Pest. Manag. sci. 2022, 78, 4458–4470. [Google Scholar]
  44. Namara, M.L.; Dolan, K.S.; Walsh, M.J.; Stephens, J.C.; Glare, T.R.; Kavanagh, K.; Griffin, C.T. Oosporein, an abundant metabolite in Beauveria caledonica, with a feedback induction mechanism and a role in insect virulence. Fungal Biol. 2019, 123, 601–610. [Google Scholar] [CrossRef]
  45. Tekpinar, A.D.; Kalmer, A. Utility of various molecular markers in fungal identification and phylogeny. Nova Hedwigia 2019, 109, 187–224. [Google Scholar] [CrossRef]
  46. Jian, J.H.; Guo, L.Q.; Ye, Z.W.; Liu, C.; Yin, L.; Lin, J.F. Research progress of Cordyceps militaris novel pigment. China Food. Addit 2015, 11, 137–140. (In Chinese) [Google Scholar]
  47. Li, C.R.; Nan, S.H.; Geng, D.G.; Fan, M.Z.; Li, Z.Z. Artificial culture of seventeen Cordyceps spp. Mycosystema 2006, 25, 639–645. (In Chinese) [Google Scholar]
  48. Yang, S.S.; Lin, Q.Y.; Zhu, L.N.; Bao, D.P.; Chen, M.J.; Li, C.H. Biological characteristics of Cordyceps tenuipes and the optimization of artificially domesticated conditions. Mycosystema 2021, 40, 1480–1497. (In Chinese) [Google Scholar]
  49. Cao, W.; Zhao, Y.; Yang, S.S.; Lin, Q.Y.; Deng, C.Y.; Li, C.H. Domestication and bioactive components of Polycephalomyces ramosus. Mycosystema 2024, 43, 133–145. (In Chinese) [Google Scholar]
  50. Zhang, J.X.; Wen, C.T.; Duan, Y.Q.; Zhang, H.H.; Ma, H.L. Advance in Cordyceps militaris (Linn) Link polysaccharides: Isolation, structure, and bioactivities: A review. Int. J. Biol. Macromol. 2019, 132, 906–914. [Google Scholar] [CrossRef]
Figure 1. Wild fruiting bodies of B. caledonica.
Microorganisms 12 01554 g001
Figure 2. Phylogenetic tree constructed from the ITS sequences of B. caledonica and two other species of Metarhizium. Scale bar indicates 0.050 sequence divergence substitutions per nucleotide position.
Microorganisms 12 01554 g002
Figure 3. Effects of temperature on the mycelial growth of B. caledonica. (a) The mycelia of B. caledonica grew in PDA and PDB media at different temperatures. (b) The biomass of B. caledonica mycelia at different temperatures. Data are shown as the mean ± standard deviation (n = 4). The lowercase letters indicate a significant difference at the level of 0.05 (p < 0.05).
Microorganisms 12 01554 g003aMicroorganisms 12 01554 g003b
Figure 4. Effects of different carbon sources on the mycelial growth of B. caledonica. Data are shown as the mean ± standard deviation (n = 4). Bar charts with different letters are significantly different (p < 0.05).
Microorganisms 12 01554 g004
Figure 5. Effects of different nitrogen sources on the mycelial growth of B. caledonica. Data are shown as the mean ± standard deviation (n = 4). Bar charts with different letters are significantly different (p < 0.05).
Microorganisms 12 01554 g005
Figure 6. Effects of pH on the mycelial growth of B. caledonica. Data are shown as the mean ± standard deviation (n = 4). The lowercase letters indicate a significant difference at the level of 0.05 (p < 0.05).
Microorganisms 12 01554 g006
Figure 7. The independent variable response surface 3D maps of B. caledonica mycelia under the two culture methods. (a) AB response surface map; (b) AC response surface map; (c) BC response surface map. A: glycerol content; B: yeast extract content; C: pH.
Microorganisms 12 01554 g007
Figure 8. Domestication cultivation of B. caledonica. (a) Wheat cultivation medium; (b) rice cultivation medium.
Microorganisms 12 01554 g008
Figure 9. HPLC chromatogram of the adenosine and cordycepin in B. caledonica. (a) A 100 μg/mL adenosine and cordycepin standard solution; (b) mixed sample liquid chromatogram; (c) addition of adenosine and cordycepin standard solution to the mixed sample solution. The chromatographic peak with a retention time of 10.226 min was attributed to adenosine, and the peak with a retention time of 13.253 min was attributed to cordycepin.
Microorganisms 12 01554 g009
Table 1. Values of the factors and the corresponding levels in the RSM.
Independent VariablesSymbolLevels
−101
Glycerol content (g/L)A102030
Yeast extract content (g/L)B51015
pHC6.06.57.0
Table 2. Experimental matrix with results for response surface methodology.
RunCoded Variable LevelsResponse Value
A
Glycerol Content(g)
B
Yeast Extract
Content(g)
C
pH
Growth Rate of
Mycelia (mm/d)
Biomass of Mycelia (g/L)
11056.51.30067.6249
23056.51.45378.5149
310156.51.35557.799
430156.51.766110.0495
5101061.39338.2417
6301061.59079.3202
7101071.45738.542
8301071.64329.8142
920561.32317.7684
10201561.42338.3579
1120571.3748.0837
12201571.50458.8608
1320106.51.888410.8245
1420106.51.84410.7834
1520106.51.835910.9635
1620106.51.853710.8246
1720106.51.83610.9647
Table 3. Significance test and ANOVA of the regression equation (growth rate as the dependent variable).
SourceSum of SquaresDfMean SquareF Valuep-ValueSignificance
Model0.7390.08268.49<0.0001**
A0.1110.1194.12<0.0001**
B0.04510.04537.530.0005**
C7.725 × 10−317.725 × 10−36.490.0383*
AB0.01710.01713.920.0074**
AC3.306 × 10−513.306 × 10−50.0280.8724
BC2.295 × 10−412.295 × 10−40.190.6739
A20.07510.07563.35<0.0001**
B20.2610.26218.77<0.0001**
C20.1610.16136.66<0.0001**
Residual8.337 × 10−371.191 × 10⁻³
Lack of Fit6.431 × 10−332.144 × 10−34.500.0902
Pure Error1.906 × 10−344.766 × 10⁻⁴
Cor Total0.7416
R2 = 0.9888 RAdj2 = 0.9743 C.V./% = 2.19
Note: *: significant (p < 0.05); **: highly significant (p < 0.01).
Table 4. Significance test and ANOVA of the regression equation (with biomass as the dependent variable).
SourceSum of SquaresDfMean SquareF Valuep-ValueSignificance
Model25.3392.81161.52<0.0001**
A3.7713.77216.28<0.0001**
B1.1811.1867.83<0.0001**
C0.3310.3318.650.0035**
AB0.4610.4626.550.0013**
AC9.38 × 10−319.38 × 10−30.540.4870
BC8.798 × 10−318.798 × 10−30.50.5004
A22.9112.91167.09<0.0001**
B210.03110.03575.55<0.0001**
C24.7414.74271.98<0.0001**
Residual0.1270.017
Lack of Fit0.09330.0314.210.0992
Pure Error0.02947.33 × 10−3
Cor Total25.4616
R2 = 0.9952 RAdj2 = 0.9890 C.V./% = 1.43
Note: **: highly significant (p < 0.01).
Table 5. Domestication cultivation of B. caledonica.
Cultivation
Medium
Average Yield (g)Dry/Wet
Weight Ratio
Biological Efficiency (%)
Wheat0.470 ± 0.0470.403 ± 0.0351.880 ± 0.188
Rice0.529 ± 0.0430.451 ± 0.0342.115 ± 0.172
Table 6. Standard recovery detection of the adenosine content in B. caledonica.
IngredientSample Concentration (μg/mL)Standard
Concentration (μg/mL)
Detect the
Concentration
(μg/mL)
Concentration Should be Measured (μg/mL)Recovery (%)Average Recovery (%)RSD (%)
Adenosine32.0762026.86926.03896.90798.1750.955
32.10826.73826.05497.441
32.11226.39726.05698.708
32.07826.33126.03998.893
32.09626.33126.04898.926
Disclaimer/Publisher’s Note: The statements, opinions and data contained in all publications are solely those of the individual author(s) and contributor(s) and not of MDPI and/or the editor(s). MDPI and/or the editor(s) disclaim responsibility for any injury to people or property resulting from any ideas, methods, instructions or products referred to in the content.

