Article

Breaking the Cycle: A Yeast Mannan-Rich Fraction Beneficially Modulates Egg Quality and the Antimicrobial Resistome Associated with Layer Hen Caecal Microbiomes under Commercial Conditions

1
Alltech Bioscience Centre, A86 X006 Dunboyne, Co. Meath, Ireland
2
Alltech (UK) Ltd., Stamford PE9 1TZ, UK
3
Novogene (UK) Company Ltd., 25 Cambridge Science Park, Cambridge CB4 0FW, UK
4
BioFigR, Ballyvoloon, P24 N524 Cobh, Cork, Ireland
*
Author to whom correspondence should be addressed.
Microorganisms 2024, 12(8), 1562; https://doi.org/10.3390/microorganisms12081562
Submission received: 16 July 2024 / Revised: 25 July 2024 / Accepted: 26 July 2024 / Published: 30 July 2024
(This article belongs to the Special Issue Combating Antibiotic Resistance in Veterinary Microbiology)

Abstract

:
Antibiotics and antibiotic growth promoters have been extensively employed in poultry farming to enhance growth performance, maintain bird health, improve nutrient uptake efficiency, and mitigate enteric diseases at both sub-therapeutic and therapeutic doses. However, the extensive use of antimicrobials in poultry farming has led to the emergence of antimicrobial resistance (AMR) in microbial reservoirs, representing a significant global public health concern. In response, non-antibiotic dietary interventions, such as yeast mannan-rich fraction (MRF), have emerged as a promising alternative to modulate the gut microbiota and combat the AMR crisis. This study investigated whether a yeast mannan-rich fraction containing feed supplement impacted the performance of laying hens, their microbiomes, and the associated carriage of antimicrobial resistance genes under commercial conditions. High-throughput DNA sequencing was utilised to profile the bacterial community and assess changes in the antibiotic resistance genomes detected in the metagenome, the “resistome”, in response to MRF supplementation. It was found that supplementation favourably influenced laying hen performance and microbial composition. Notably, there was a compositional shift in the MRF supplemented group associated with a lower relative abundance of pathobionts, e.g., Escherichia, Brachyspira and Trueperella, and their AMR-encoded genes, relative to beneficial microbes. Overall, the findings further demonstrate the ability of prebiotics to improve laying hen performance through changes associated with their microbiome and resistome.

1. Introduction

The gut microbiome can exert a profound influence on the health and physiology of its host [1]. In poultry, the gut microbiota plays a crucial role in fundamental functions such as nutrient digestion and absorption, energy metabolism, immune development, and protection against pathogens [2]. This significance has propelled the optimisation of the gut microbiome’s composition and functionality into a focal point for enhancing productivity and efficiency in laying hen production, a critical aspect of sustainable agriculture [3].
Over the years, antibiotics have been extensively employed in poultry farming to enhance growth performance, maintain bird health, improve nutrient uptake efficiency, and to prevent and control enteric diseases at both sub-therapeutic and therapeutic doses [4]. Unfortunately, this widespread use has led to the establishment of microbial reservoirs carrying antimicrobial resistance (AMR) determinants in poultry, posing a serious threat to global public health [5]. As a consequence, and in an effort to preserve antibiotic efficacy, numerous jurisdictions, including the European Union, New Zealand, and the USA, have banned the use of antibiotics as growth promoters, prompting poultry farmers worldwide to seek alternatives [6].
In response to the growing global threat of antibiotic resistance and the ban on antibiotic growth promoters, the quest for effective alternatives has gained urgency in food animal production. Several non-antibiotic dietary interventions that do not contribute selection pressures that promote the development of antibiotic resistance have emerged as promising strategies to modulate the gut microbiota and enhance host health and performance in the last decade [6]. Among these interventions, mannan-rich fractions (MRFs), derived from the cell wall of yeast, have attracted considerable attention due to their prebiotic properties, which favourably modulate the microbiome without conferring an antibiotic resistance-promoting selection pressure.
MRFs, primarily composed of mannose and other polysaccharides, are known to exhibit prebiotic effects by serving as a substrate for beneficial bacteria, stimulating their growth and modulating the gut microbial community. For example, a meta-analysis showed benefits to the egg production, feed efficiency, and mortality of laying hens fed mannan-based prebiotics [7]. However, an important, yet comparatively unexplored, potential application of prebiotic MRF in layers is to improve bacterial diversity, impair pathobiont colonisation, and alter the bacterial resistome in the gastrointestinal tract. Recent research from a controlled environment study demonstrated favourable outcomes on bacterial diversity and uniformity, as well as pathogen control [8,9]. Other research has also shown that MRFs can potentiate bactericidal antibiotic efficiency, impacting antibiotic susceptibility in resistant strains of bacteria in vitro [10,11,12], with additional in vivo research highlighting reductions in resistant Escherichia coli and enterococci in broilers supplemented with MRF [13].
This study focused on investigating the impact of dietary supplementation with a yeast MRF-containing product on the caecal metagenome of laying hens under typical commercial conditions. Leveraging high-throughput DNA sequencing technologies, we comprehensively profiled the bacterial community in the caeca of laying hens fed the supplemented diet in comparison to control diets. Additionally, metagenomic analysis enabled the assessment of changes in the caecal resistome in response to MRF supplementation. Through the characterisation of alterations in caecal microbiota composition and antibiotic resistance gene profiles, our aim was to investigate whether MRF impacted the performance of laying hens, their microbiomes, and the associated carriage of antimicrobial resistance genes.

2. Materials and Methods

2.1. Ethics Statement

Animals were selected from commercial production units and were raised under animal welfare guidelines as set forth by the European Union. Birds were slaughtered in accordance with humane killing protocols as set forth in European Union Council Regulation (EC) 1099/2009.

2.2. Experimental Design, Sample Collection and Preservation

A layer trial was performed at a commercial production site in the United Kingdom. At 16 weeks old, 8000 pullets were randomly assigned to commercial free-range production units, where they received either a control standard commercial corn–soy mash diet or a standard diet plus a yeast mannan-rich fraction-containing supplement (Alltech Layer Pak™, Alltech Inc., Nicholasville, KY, USA) at the inclusion rate of 1 kg t−1 (Table S1). All other conditions were kept uniform among the groups. At 50 weeks old, the birds were housed permanently due to the threat of Avian Influenza. The birds were reared as per typical commercial production conditions, receiving feed and water ad libitum. Birds were culled at end of lay (77 weeks old), and the caecal contents of 12 randomly selected birds per shed (group) were aseptically transferred into sterile tubes containing 10 mL of DNAShield stabilisation solution (DNA/RNA Shield, Zymo Research, Irvine, CA, USA). The tubes were kept at room temperature for shipping and refrigerated thereafter.

2.3. Performance Data

The average daily feed intake (ADFI), mortality (%), and percentage of second-grade eggs (%) was calculated for each 10-week period of the trial for weeks 20–29, 30–39, 40–49, 50–59, 60–69, and 70–76, as well as for the entire trial duration (weeks 20–76). The ADFI was calculated as the amount of feed delivered weekly, divided by the number of birds housed and the number of days per week. Mortality was calculated as percentage of birds dead per week. The percentage of graded seconds was calculated as the number of grade B eggs out of the total eggs produced weekly that were received by the egg packing centre. Eggshell strength was measured using an egg force reader (Orka food technology, West Bountiful, UT, USA), and eggshell strength (kgF) was measured as the average of 30 eggs per group per timepoint. The results were analysed using the unpaired Student’s t-test in GraphPad prism (p ≤ 0.05).

2.4. DNA Extraction, Library Construction, Quality Control, and Sequencing

DNA was extracted from caecal contents using a DNeasy Powersoil Pro kit (Qiagen, Hilden, Germany) according to the manufacturer’s instructions. The genomic DNA concentration, purity, and integrity were determined using an Agilent 5400 Fragment Analyzer System (Agilent Technologies, Santa-Clara, CA, USA). Sequencing libraries were generated using NEBNext® Ultra™ DNA Library Prep Kit for Illumina sequencing (NEB, Ipswich, MA, USA).
Whole DNA fractions were fragmented by sonication to the size of ~350 bp. The DNA fragments were then end-polished, A-tailed, and ligated to a full-length Illumina adaptor with PCR amplification. Each PCR product was purified (AMPure XP system), and library size distributions were established using an Agilent 2100 Bioanalyzer (Agilent Technologies, Santa-Clara, CA, USA)and quantified using a real-time PCR. A clustering of the uniquely indexed samples was performed on the Illumina cBot Cluster Generation System; then, the library preparations were sequenced on an Illumina NovaSeq 6000 platform, using an S4 flow cell with paired-end 150 bp reads (Novogene, Cambridge, UK).

2.5. Data Reprocessing and Assembly

The preprocessing of raw data from the Illumina sequencing platform was conducted with Readfq (V8, https://github.com/cjfields/readfq, accessed on 16 July 2024) to obtain clean data for subsequent analysis (Table S2). The specific steps are as follows: reads with low-quality bases were removed (default quality threshold < 38) above a certain proportion (default length is 40 bp); reads with N bases that reached a certain proportion (default length is 10 bp) and reads whose overlaps with adapters exceeded a certain threshold (default length is 15 bp) were removed. Considering the possibility of host contamination in the samples, the clean data were aligned to a reference host sequence, to filter out reads that may have come from a host origin using Bowtie2 software (version 2.2.4, http://bowtie-bio.sourceforge.net/bowtie2/index.shtml, accessed on 16 July 2024), with the following parameter settings: --end-to-end, --sensitive, -I 200, and -X 400 [14,15].
MEGAHIT software (v1.0.4-beta) was used for the assembly analysis of the clean data, with the assembly parameter settings --presets meta-large (--end-to-end, --sensitive, -I 200, -X 400), and Scaftigs without N were obtained by breaking the resulting Scaffolds from the N junction [16,17,18,19].

2.6. Gene Prediction and Abundance Analysis

With the default parameters, MetaGeneMark (V3.05, http://topaz.gatech.edu/GeneMark/, accessed on 16 July 2024) was used to perform an open reading frame prediction for Scaftigs (>= 500 bp) of each sample [14,15,20,21,22] using default parameters, and the information with a length less than 100 nt [16,17,18,23,24,25] in the prediction results was filtered out. For the ORF prediction results, CD-HIT [26,27] software (V4.5.8, http://www.bioinformatics.org/cd-hit/, accessed on 16 July 2024) was used to eliminate redundancy and obtain the non-redundant initial gene catalogue (with parameter settings [24]: -c 0.95, -G 0, -aS 0.9, -g 1, -d 0). Clean data of each sample was aligned to the initial gene catalogue by using Bowtie2 (Bowtie2.2.4) to calculate the number of reads of the genes on each sample alignment, with the following parameter settings [16,17,25]: --end-to-end, --sensitive, -I 200, -x 400. Genes with reads ≤2 [17,25] in each sample were filtered out to determine the gene catalogue (Unigenes) for subsequent analysis. Based on the number of reads aligned and the length of gene, the abundance of each gene in each sample was calculated by the following formula, in which r is the number of gene reads on alignment, and L is the length of gene [15,23,24,28,29,30]:
G k = r k L k . 1 Σ i = 1 n r i L i

2.7. Species Annotation

Double index alignment of next-generation sequencing data [31] software (V0.9.9.110, https://github.com/bbuchfink/diamond/, accessed on 16 July 2024) was used for the alignment of Unigenes sequences with those of bacteria, fungi, archaea, and viruses extracted from the National Centre for Biotechnology Information (NCBI) non-redundant (NR) database (Version 2018-01-02, https://www.ncbi.nlm.nih.gov/, accessed on 16 July 2024), with the parameter settings blastp, e-value <= 1 × 10⁻⁵. From the alignment results of each sequence, the one with an e-value ≤ min. e-value × 10 is selected [15,22] was selected as the least common ancestor (LCA) algorithm applied to the Metagenome Analyzer (MEGAN) system classification of software to ensure the species annotation information of the sequence. According to the LCA annotation results and the gene abundance table, a table containing the number and abundance information of each sample in each classification level (phylum, class, order, family, genus, and species) was obtained.
On the basis of the abundance tables at each taxonomy level (Supplementary Tables S3–S8), a relative abundance overview and abundance clustering heatmap were performed, combined with a PCOA [32] (R ade4 package, Version 3.2.1), and NMDS using Bray–Curtis dissimilarity [33] (R vegan package, Version 2.15.3) analysis of dimension reduction (Table S9). Anosim analysis (R vegan package, Version 2.15.3) was used to test the differences between groups. Metastats and LEfSe analyses were used to search for species differences between groups. Metastats analysis was used to perform a permutation test between groups on each taxonomy level and obtain a p-value. Then, the Benjamini–Hochberg False Discovery Rate (fdr) was used to correct the p-value and obtain a q-value [34]. LEfSe software was used for the LEfSe analysis (LDA Score is 3 by default).

2.8. Resistance Gene Annotation

Resistance gene identifier (RGI) software was used to align Unigenes with the Comprehensive Antibiotic Resistance Database (CARD)4 [35,36,37] with the parameter set to Blastp (BLASTP), e-value ≤ 1 × 10⁻³⁰. According to the comparison result, the relative abundance of the antibiotic resistance ontology (ARO) in all the genes was calculated as parts per million (ppm). According to the abundance of the ARO, the abundance bar graph and the number difference between the resistant genomes were displayed. In the same way, the abundance distribution of resistance genes in each sample, the species attribution analysis of resistance genes, and the resistance mechanism of resistance genes were analysed (BCD Table S10). The ARGs were assigned to the core resistome if the gene was present in all 16 samples. If a resistance gene was detected in at least one sample but less than 15 samples, it was assigned to the accessory resistome.

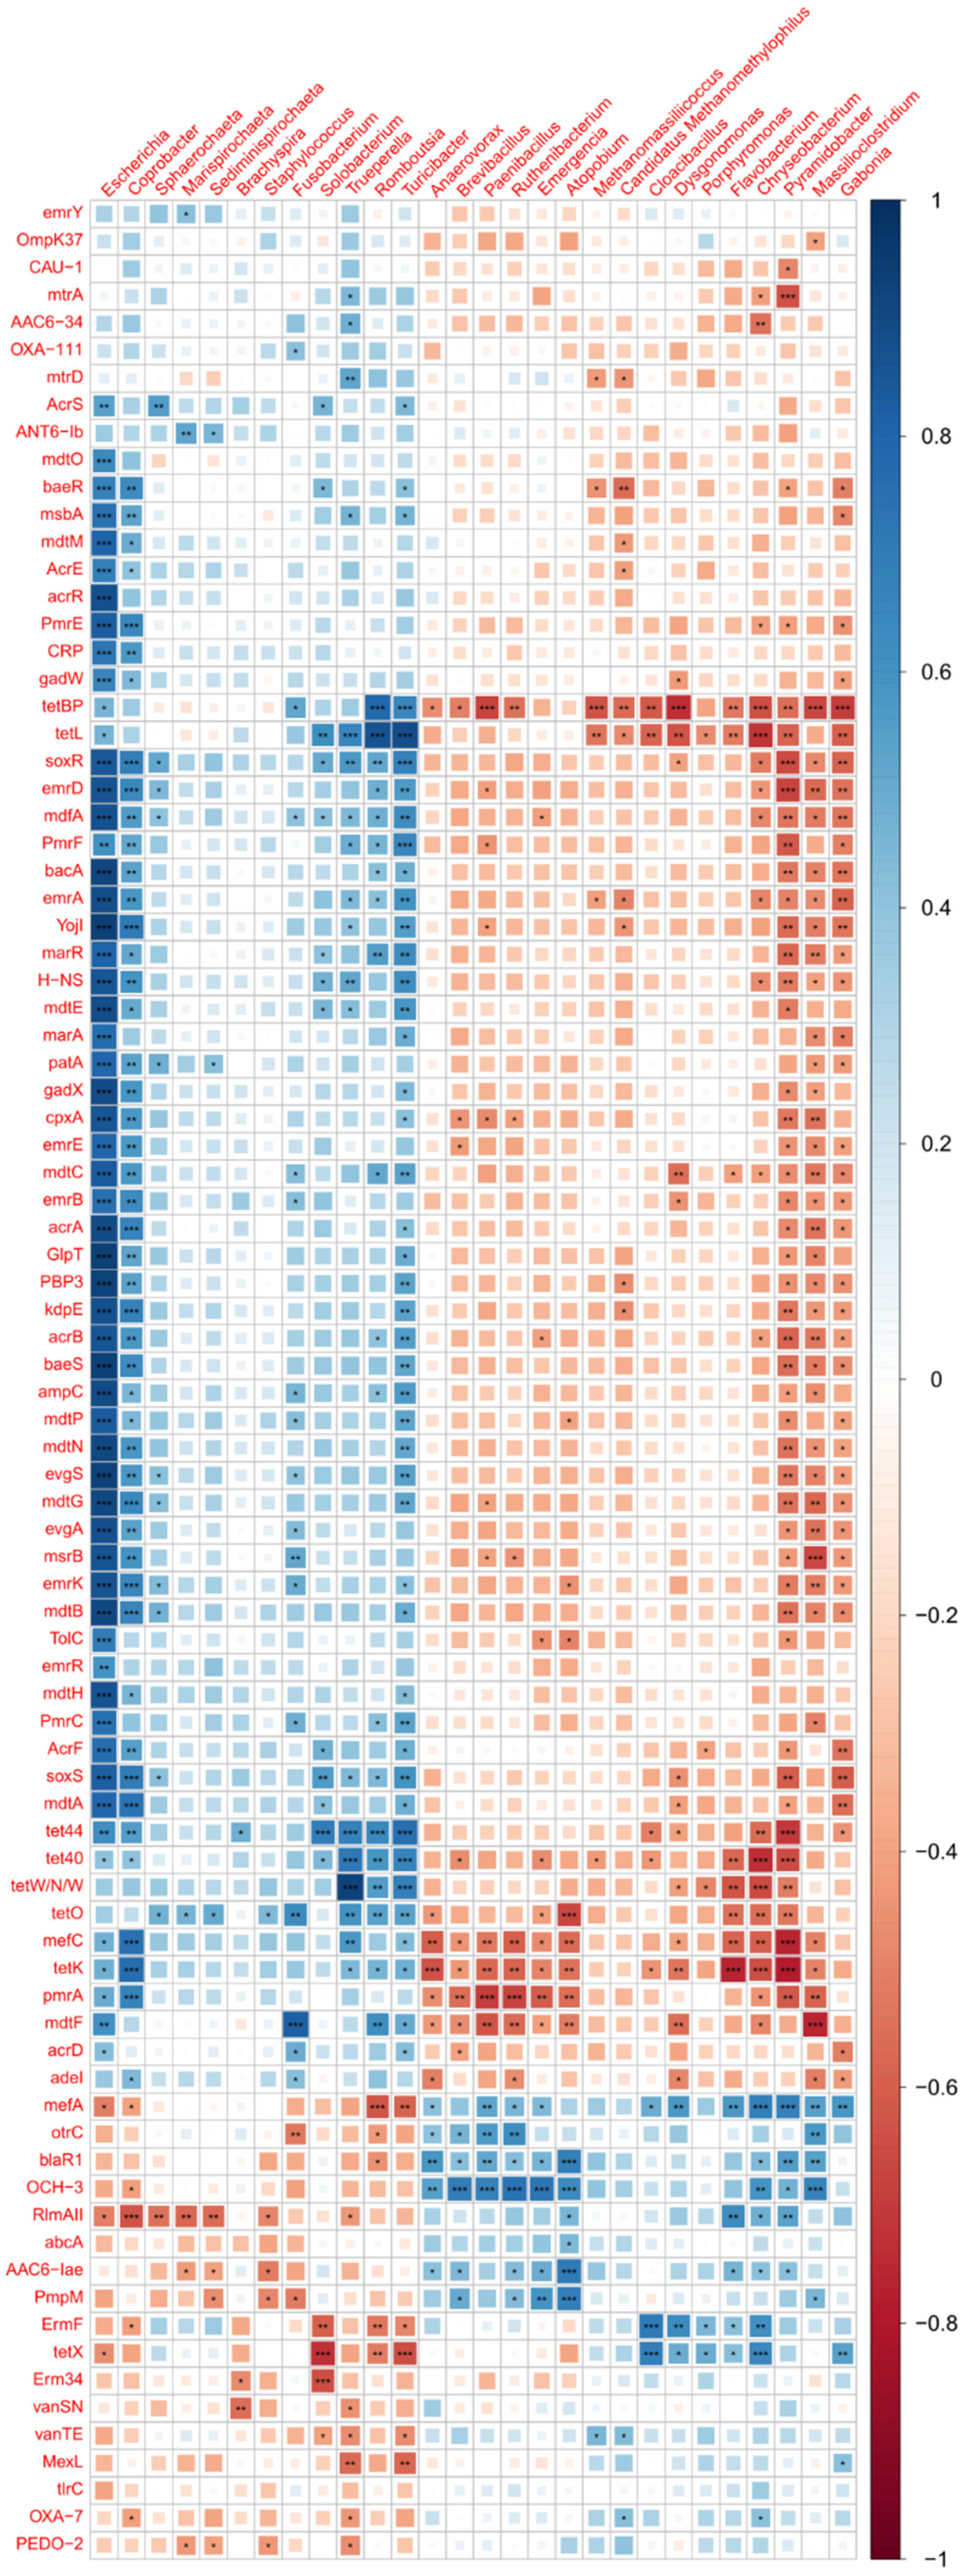
2.9. Bacterial Composition vs. Antimicrobial Resistance Genes

The genus relative abundance count table of shotgun sequencing-identified taxa and antibiotic resistance ontology files were processed identically using R, in the following specific order: Taxa or AMR genes needed to be (1) present in 12 of the 24 caecal samples, (2) present in the top 10% of the accumulative abundance of all taxa and genes identified, and (3) have a p-value difference < 0.1 between the control and supplemented group. The only difference in the preparation of the taxonomic and AMR data was the aggregation of duplicate AMR rows.
The corrplot package [v0.92] was used to calculate Spearman correlations between genera and AMR genes of interest using all observations. Taxa, followed by AMR genes, were hierarchically clustered, and this determined the order of the plotted variables. The correlation plot p-values shown were calculated within the corrplot package, whereas boxplot p-values were calculated using the ggpubr package [v0.6.0] “stat_compare_means” function, with the default Wilcoxon test selection. Boxplots were generated with ggplot2 [v3.4.4], with general data manipulation facilitated by the reshape2 package [v1.4.4].

3. Results

3.1. Performance

Results from the growth performance are shown in Table 1. Eggshell strength was significantly greater in the supplemented birds at weeks 30, 38, 45, 59, 63, and 75 and was 0.55 kgF greater overall from weeks 24 to 75 (p < 0.05). Mortality and ADFI were not significantly different between the control and supplemented birds but were lower over the entire feeding period by 19.05% and 2.3%, respectively, in the supplemented group. The rate of second-grade eggs was lower at weeks 30–39, 40–49, 50–59 and significantly greater at weeks 70–76 in the supplemented group compared to the control. Overall, the percentage of second-grade eggs was numerically lower by 7.07% over the entire laying period.

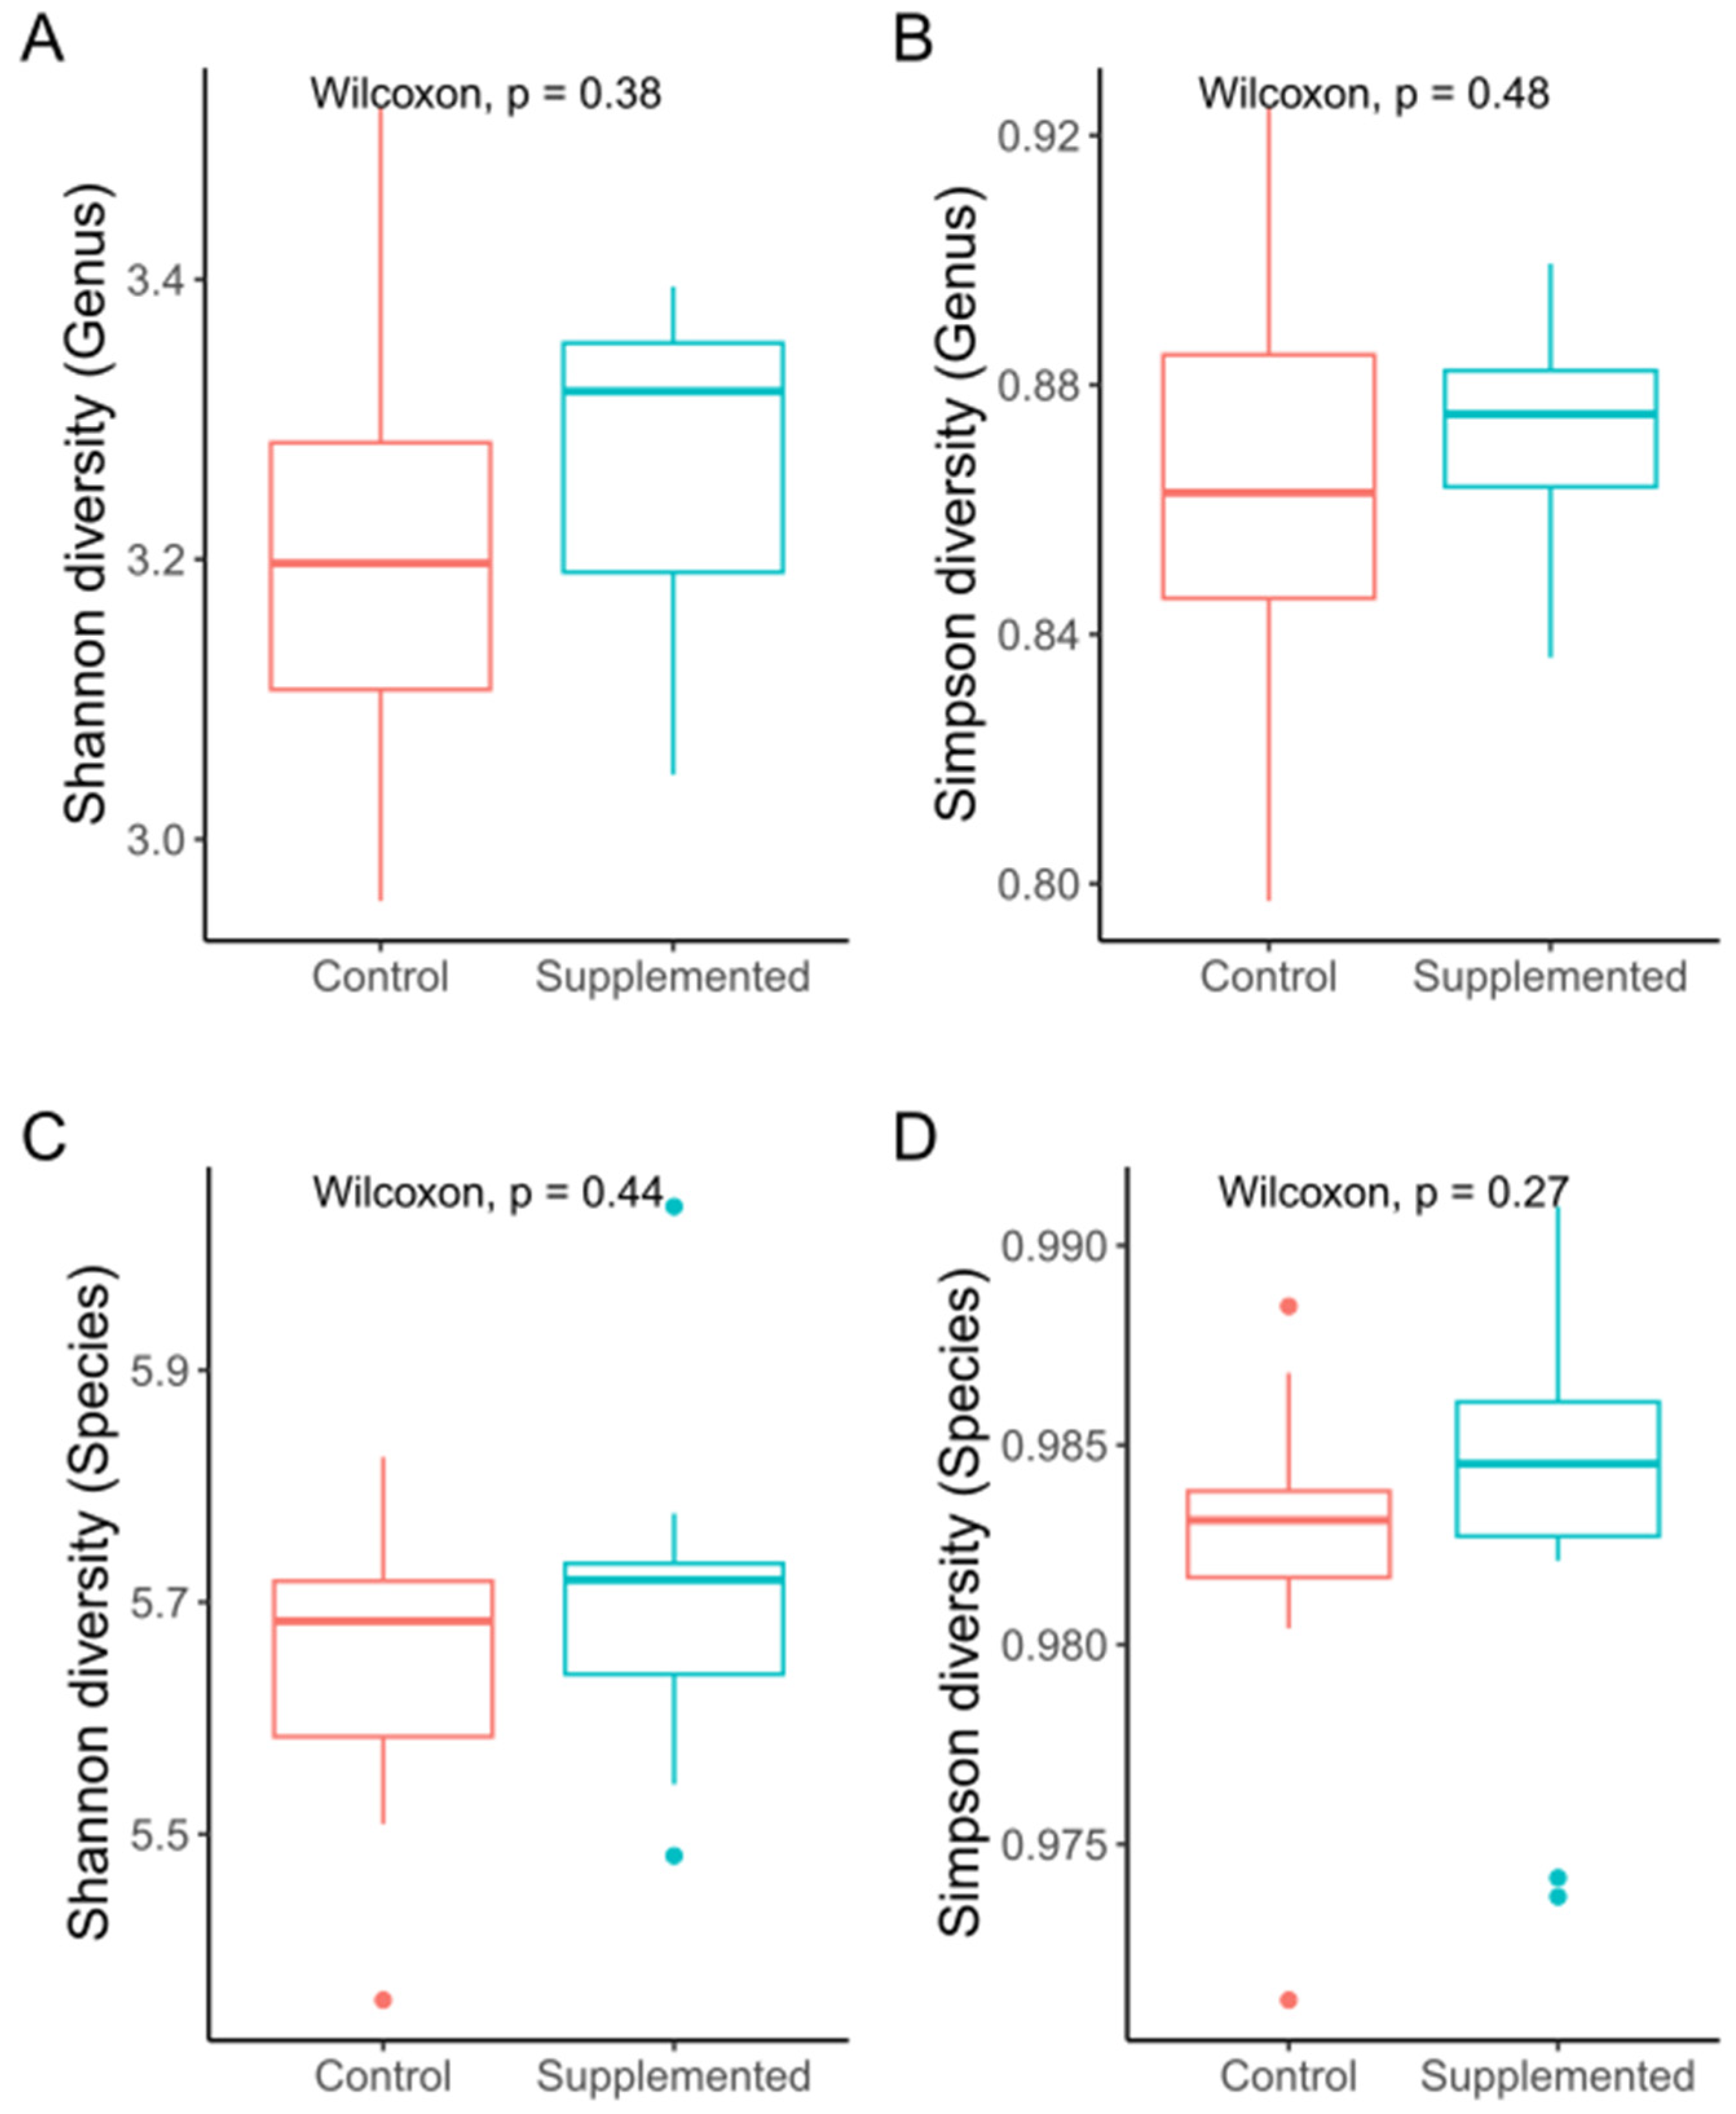
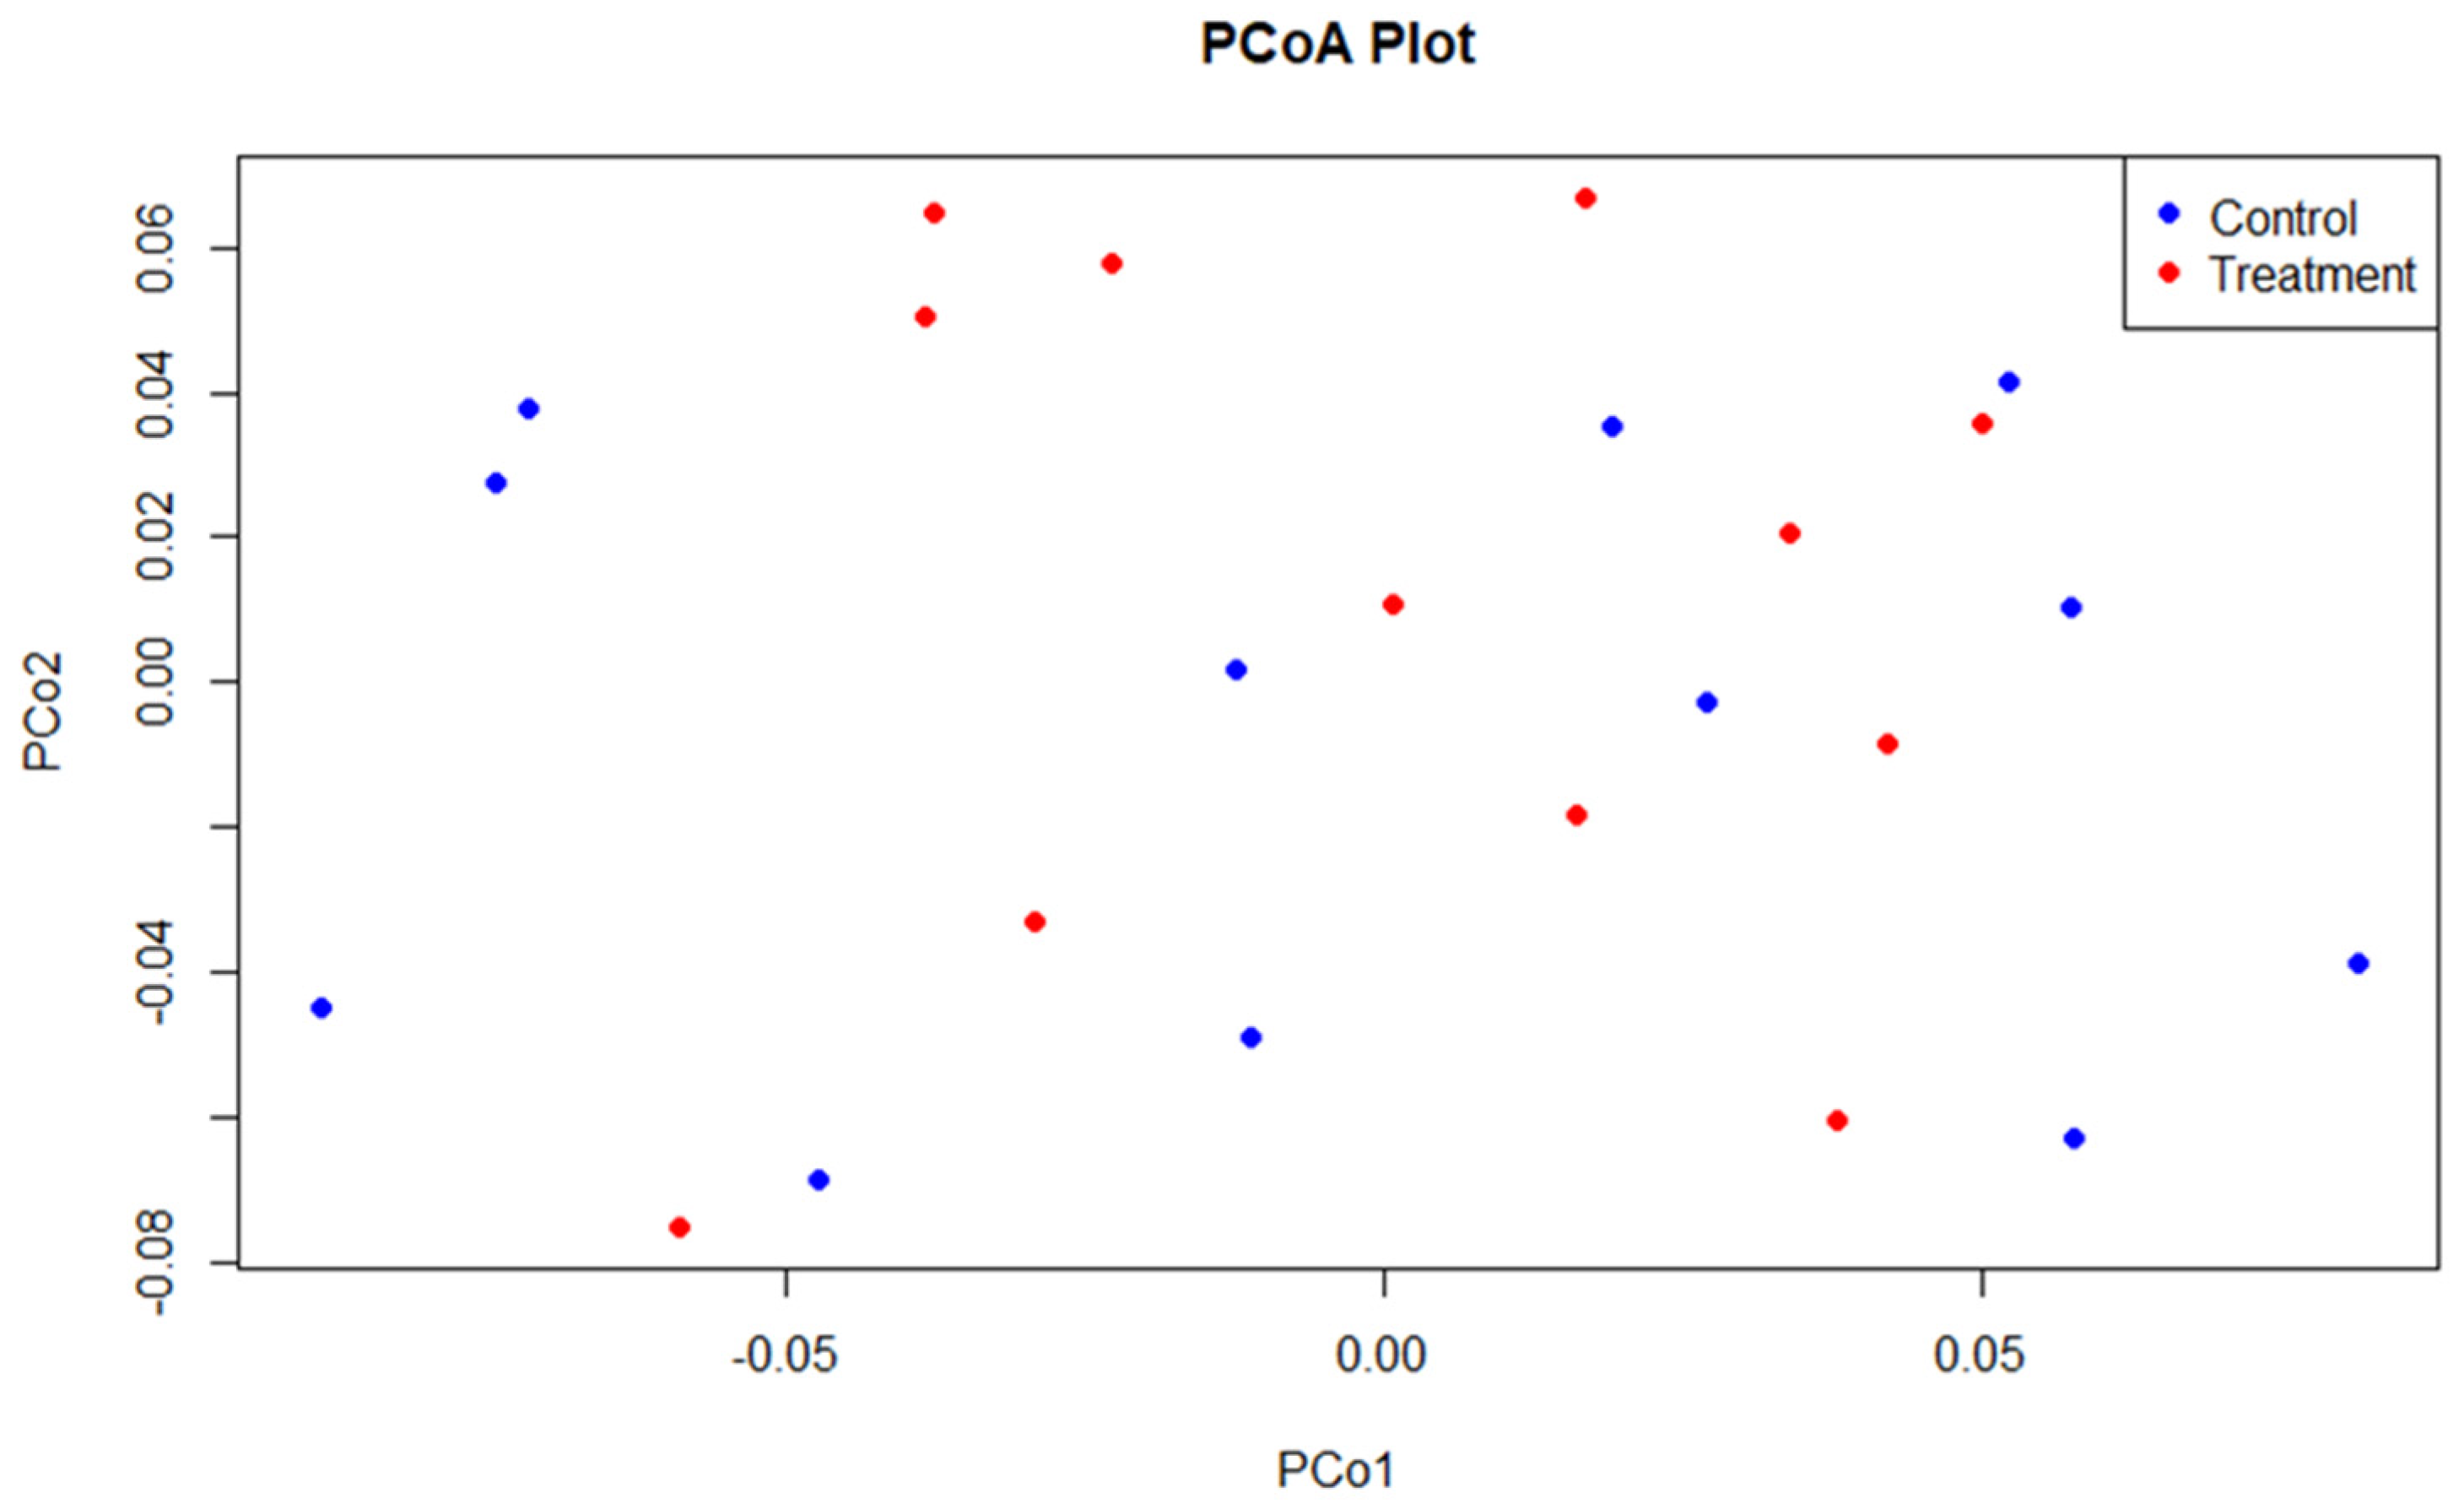
3.2. Sequencing and Microbial Diversity

DNA extracted from layer caecal content was sequenced with Illumina NovaSeq 6000, and after quality filtering, a total average number of 35,835,329 ± 1,334,350 high-quality sequences were analysed, resulting in a 99.97% percent clean-read rate (Table S2). After de novo metagenomic assembly by MEGAHIT, there were 71,757 to 315,613 assembled Scaftigs (Table S11). The Genus- (Figure 1A,B) and Species-level (Figure 1C,D) diversity estimates of the Shannon diversity and Simpson indexes were used to assess caecal microbial alpha diversity, and the results showed a trend towards greater diversity in the supplemented group when compared to the control, but this was not significantly different (Table S12).
The beta diversity, using principal coordinate analysis (PCoA), showed no significant differences (p = 0.485) in bacterial community structure between control and supplemented birds (Figure 2).

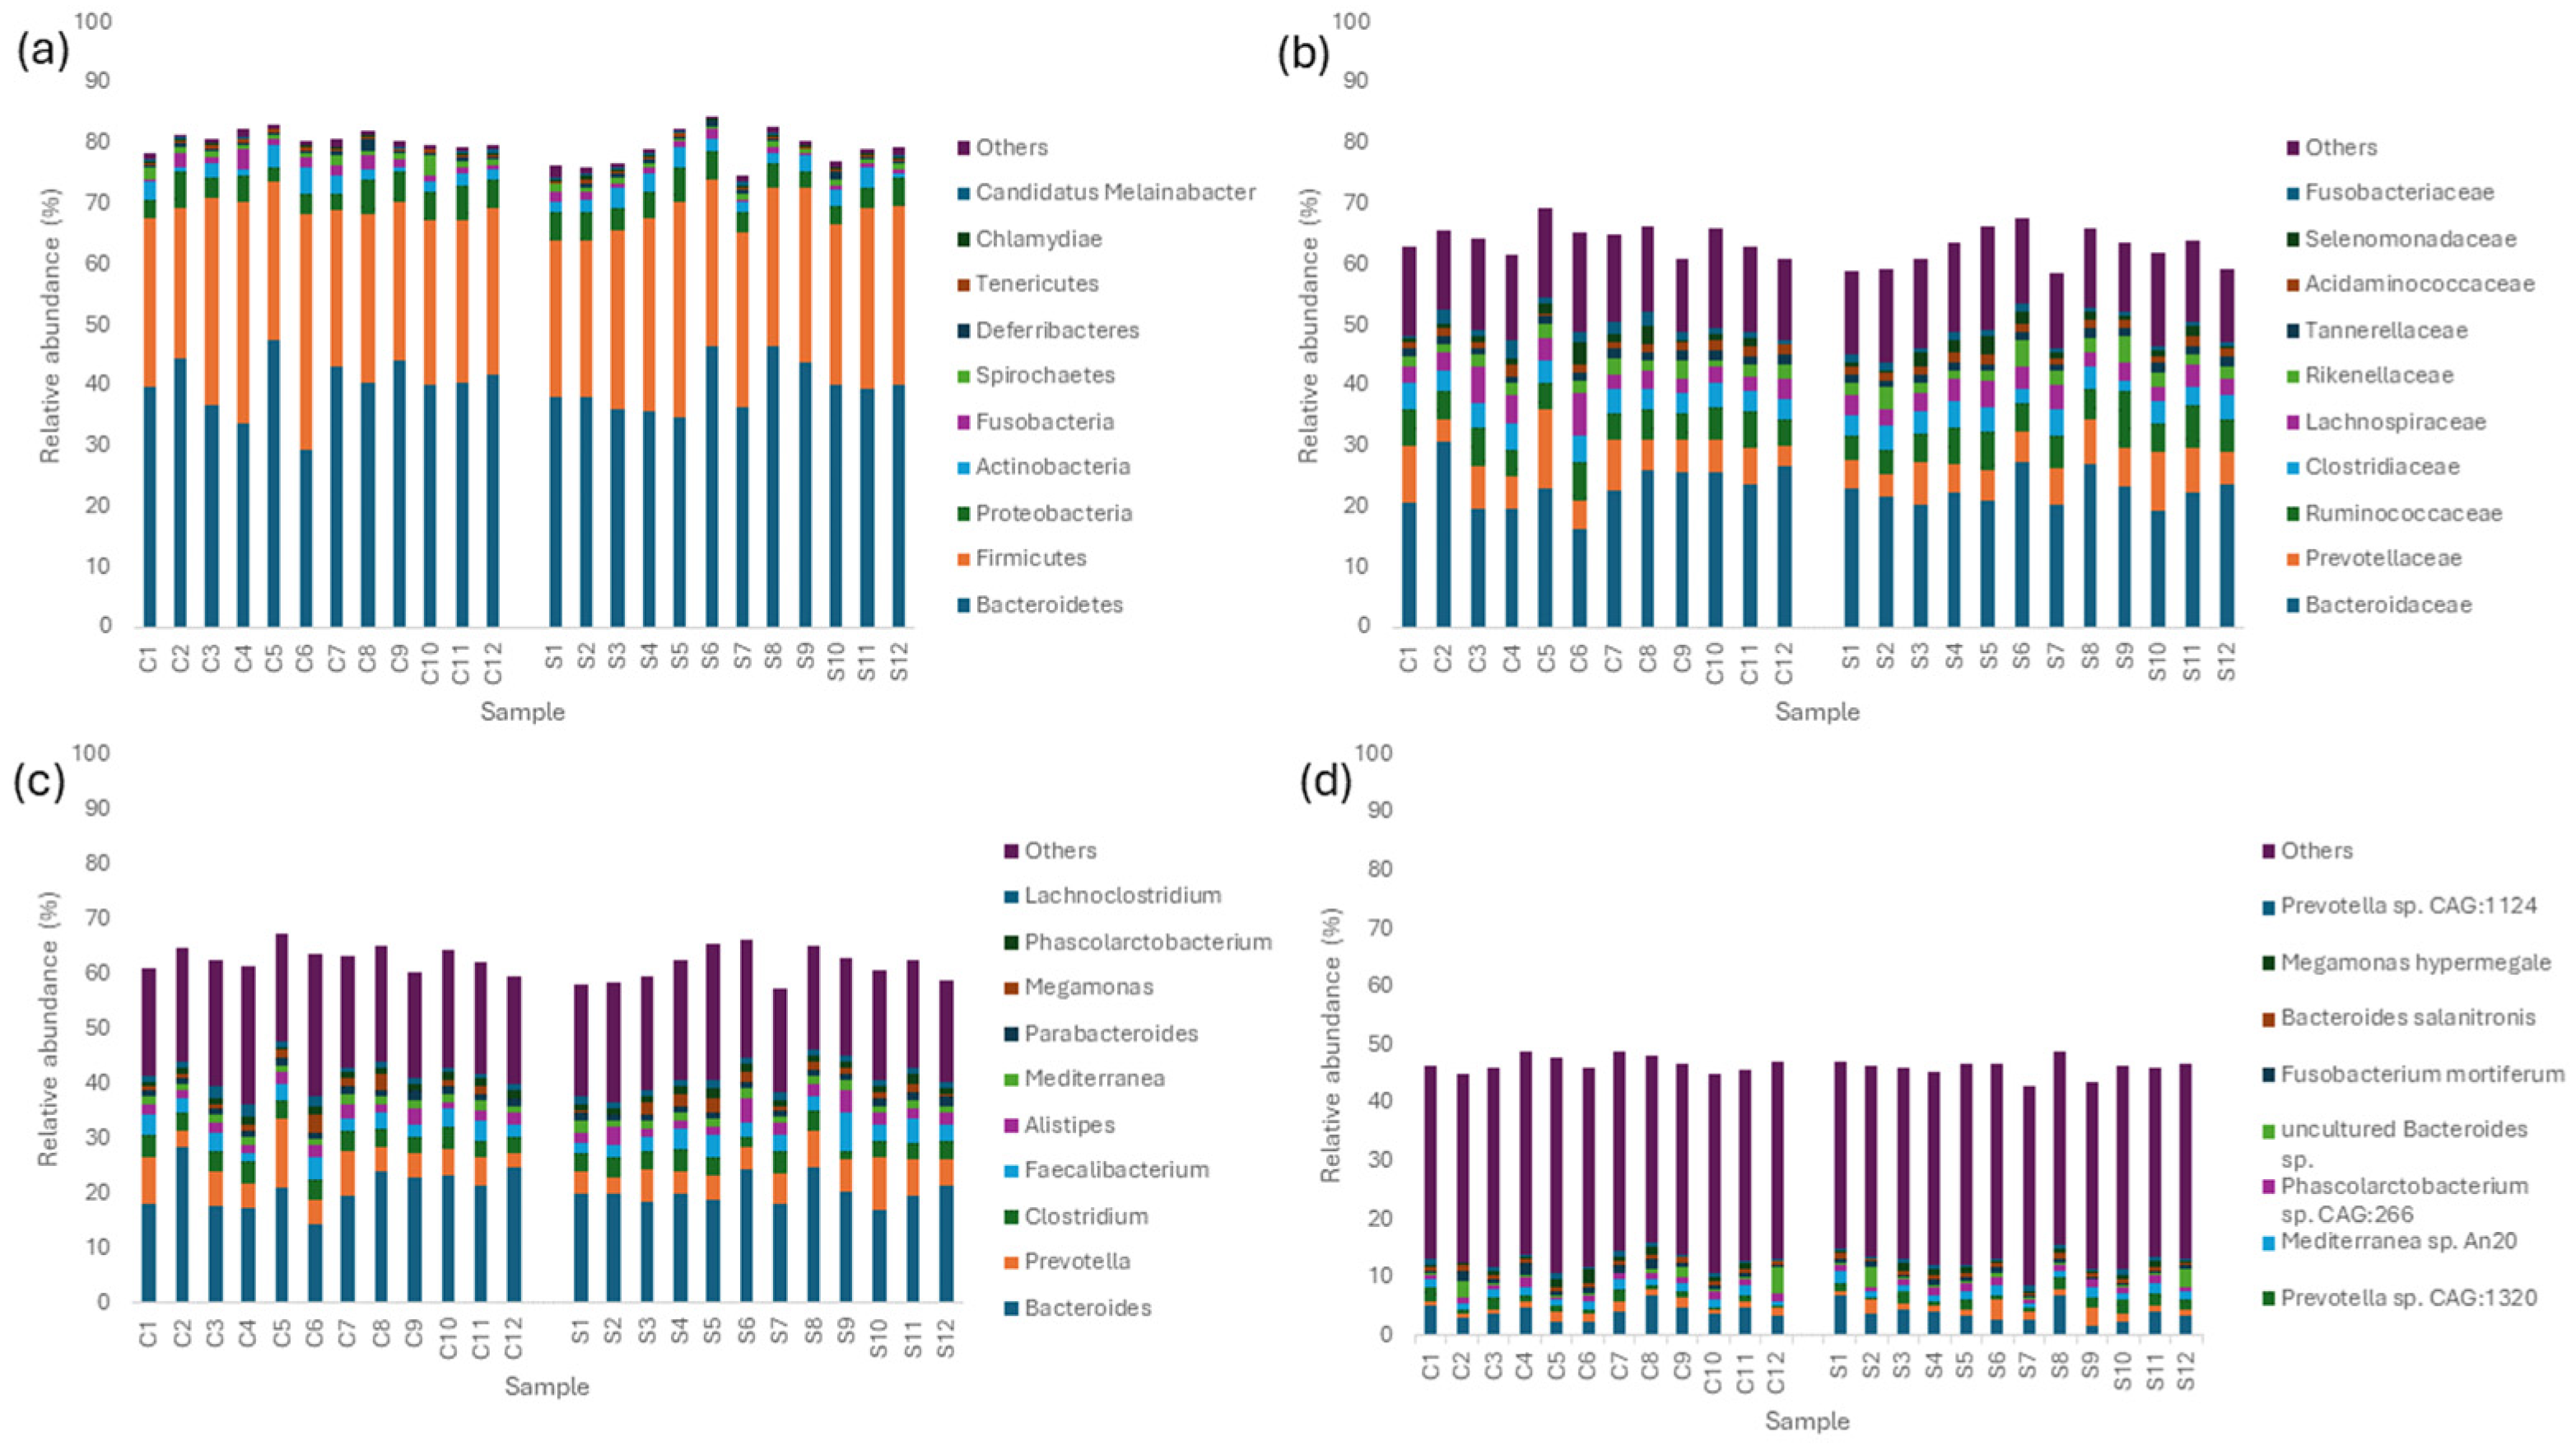
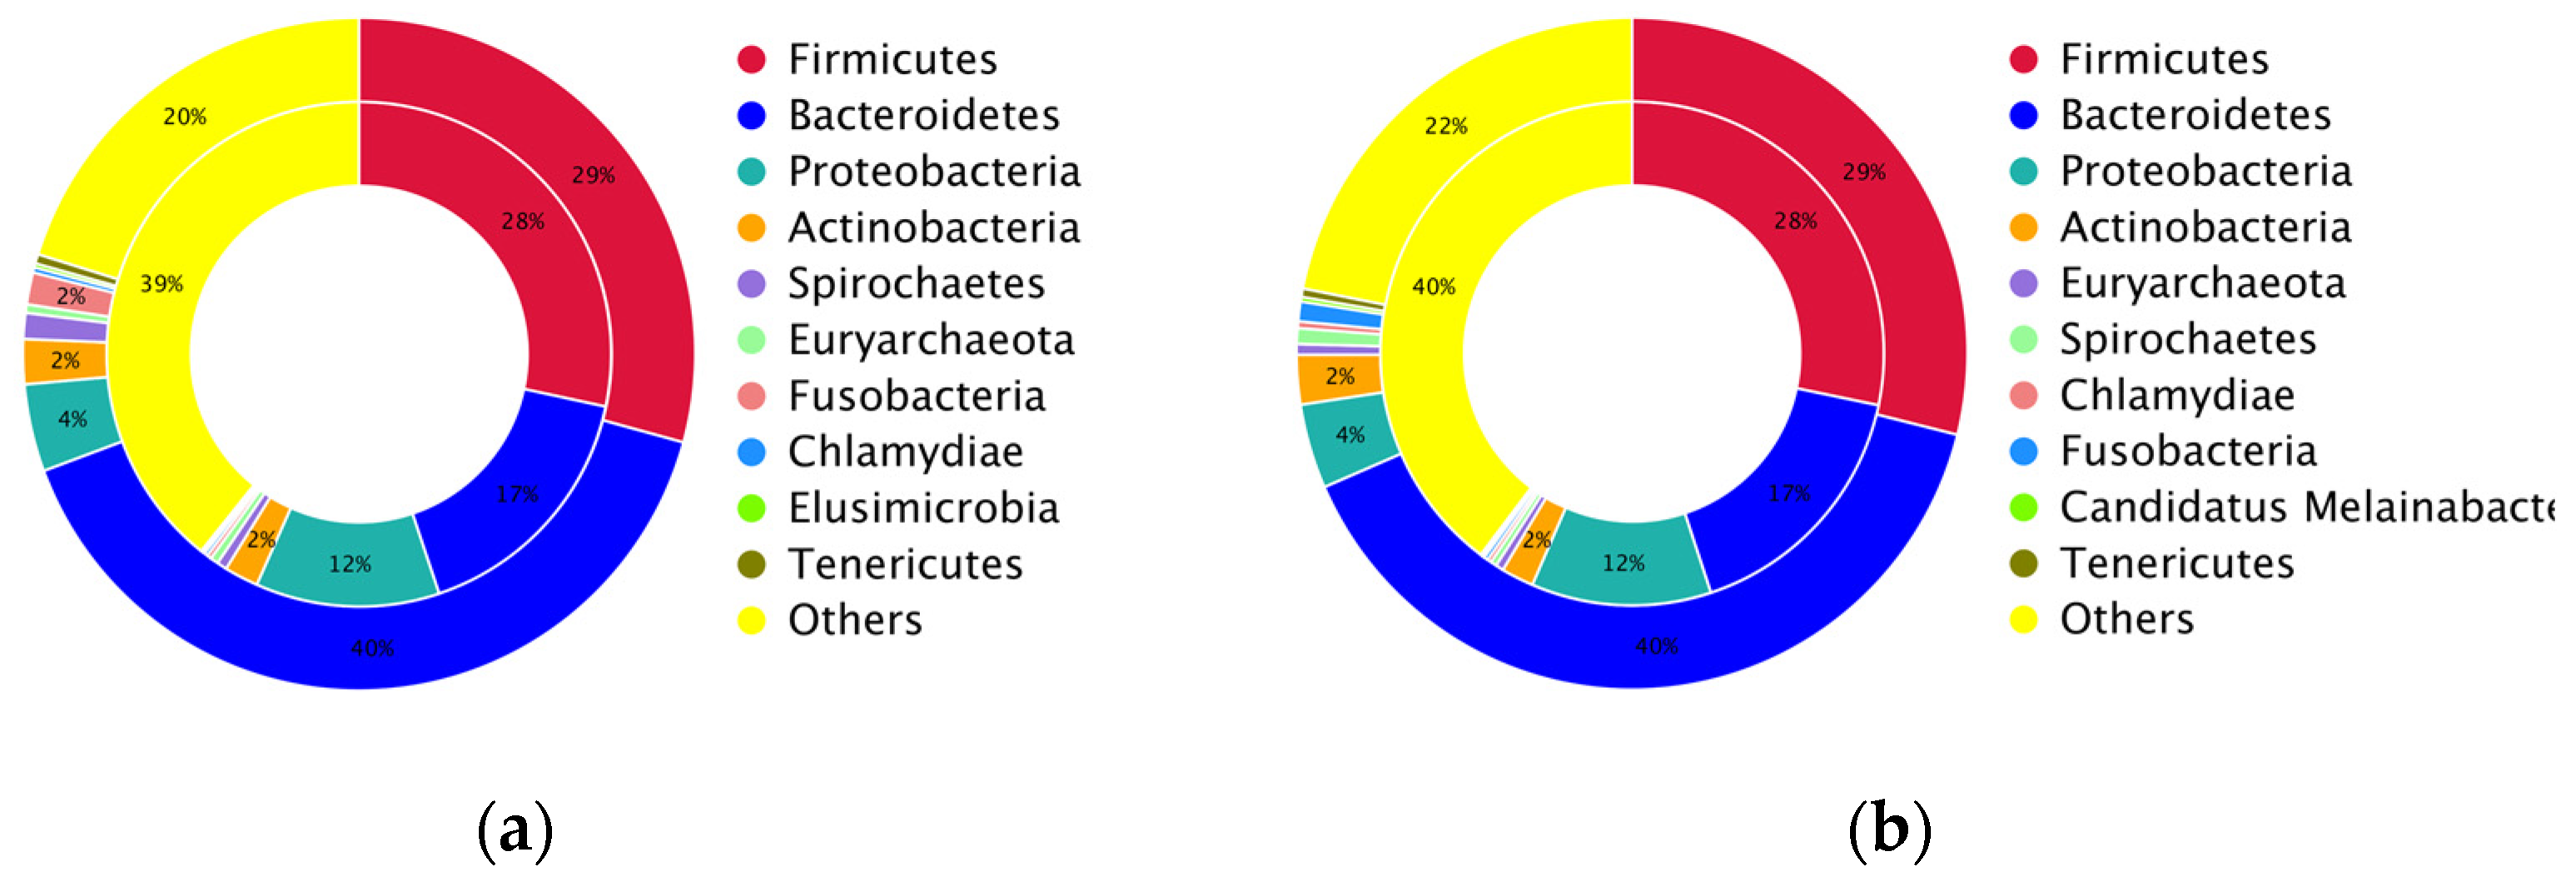
3.3. Taxonomic Abundance and Composition of the Layer Caecal Microbiota

The abundance and composition of bacterial taxonomic groups at the phylum, family, genus, and species level are depicted in Figure 3a–d. The most prevalent phyla in the mature layer caecum were Bacteroidetes, Firmicutes, Proteobacteria, Actinobacteria, and Fusobacteria (Figure 3a). The most common families that were identified were Bacteroidaceae, Prevotellaceae, Ruminococcaceae, Clostridiaceae, and Lachnospiraceae (Figure 3b). Furthermore, the most abundant genera in the layer caecal content samples were Bacteroides, Prevotella, Clostridium, Faecalibacterium, and Alistipes (Figure 3c). Finally, the most prevalent species in layer caecal content were Bacteroides sp. An322, Mediterranea sp. An20, Prevotella sp. CAG:1320, Phascolarctobacterium sp. CAG:266, and Alistipes sp. CAG:831 in the control group and Bacteroides sp. An322, Alistipes sp. CAG:831, Prevotella sp. CAG:1320, Mediterranea sp. An20, and Phascolarctobacterium sp. CAG:266 in the supplemented group (Figure 3d). There were no significant differences observed between major bacterial phyla or families related to dietary supplementation. Bacterial genera which were differentially affected because of supplementation are shown in Figure 4 (Table S13). Thirteen bacterial genera were significantly different in abundance, with nine genera being significantly lower and four genera being significantly greater in the supplemented group. Seventy-six bacterial species were significantly different between the control and supplemented groups (Figure 5), with 29 species more abundant and 47 less abundant in the supplemented group (Table S14).
Differentially abundant microbial communities were tested by linear discriminant analysis effect size, with a linear discriminant analysis score greater than 4.0. Representative bacteria at different taxonomic levels (from phylum to species) in the caecal microbiota of the supplemented and control groups are presented in Figure 6. The phylum proteobacteria, family Enterobacteriaceae, and species Brachyspira pilosicoli were more abundant in the control group caecal microbiota when compared with the supplemented group.

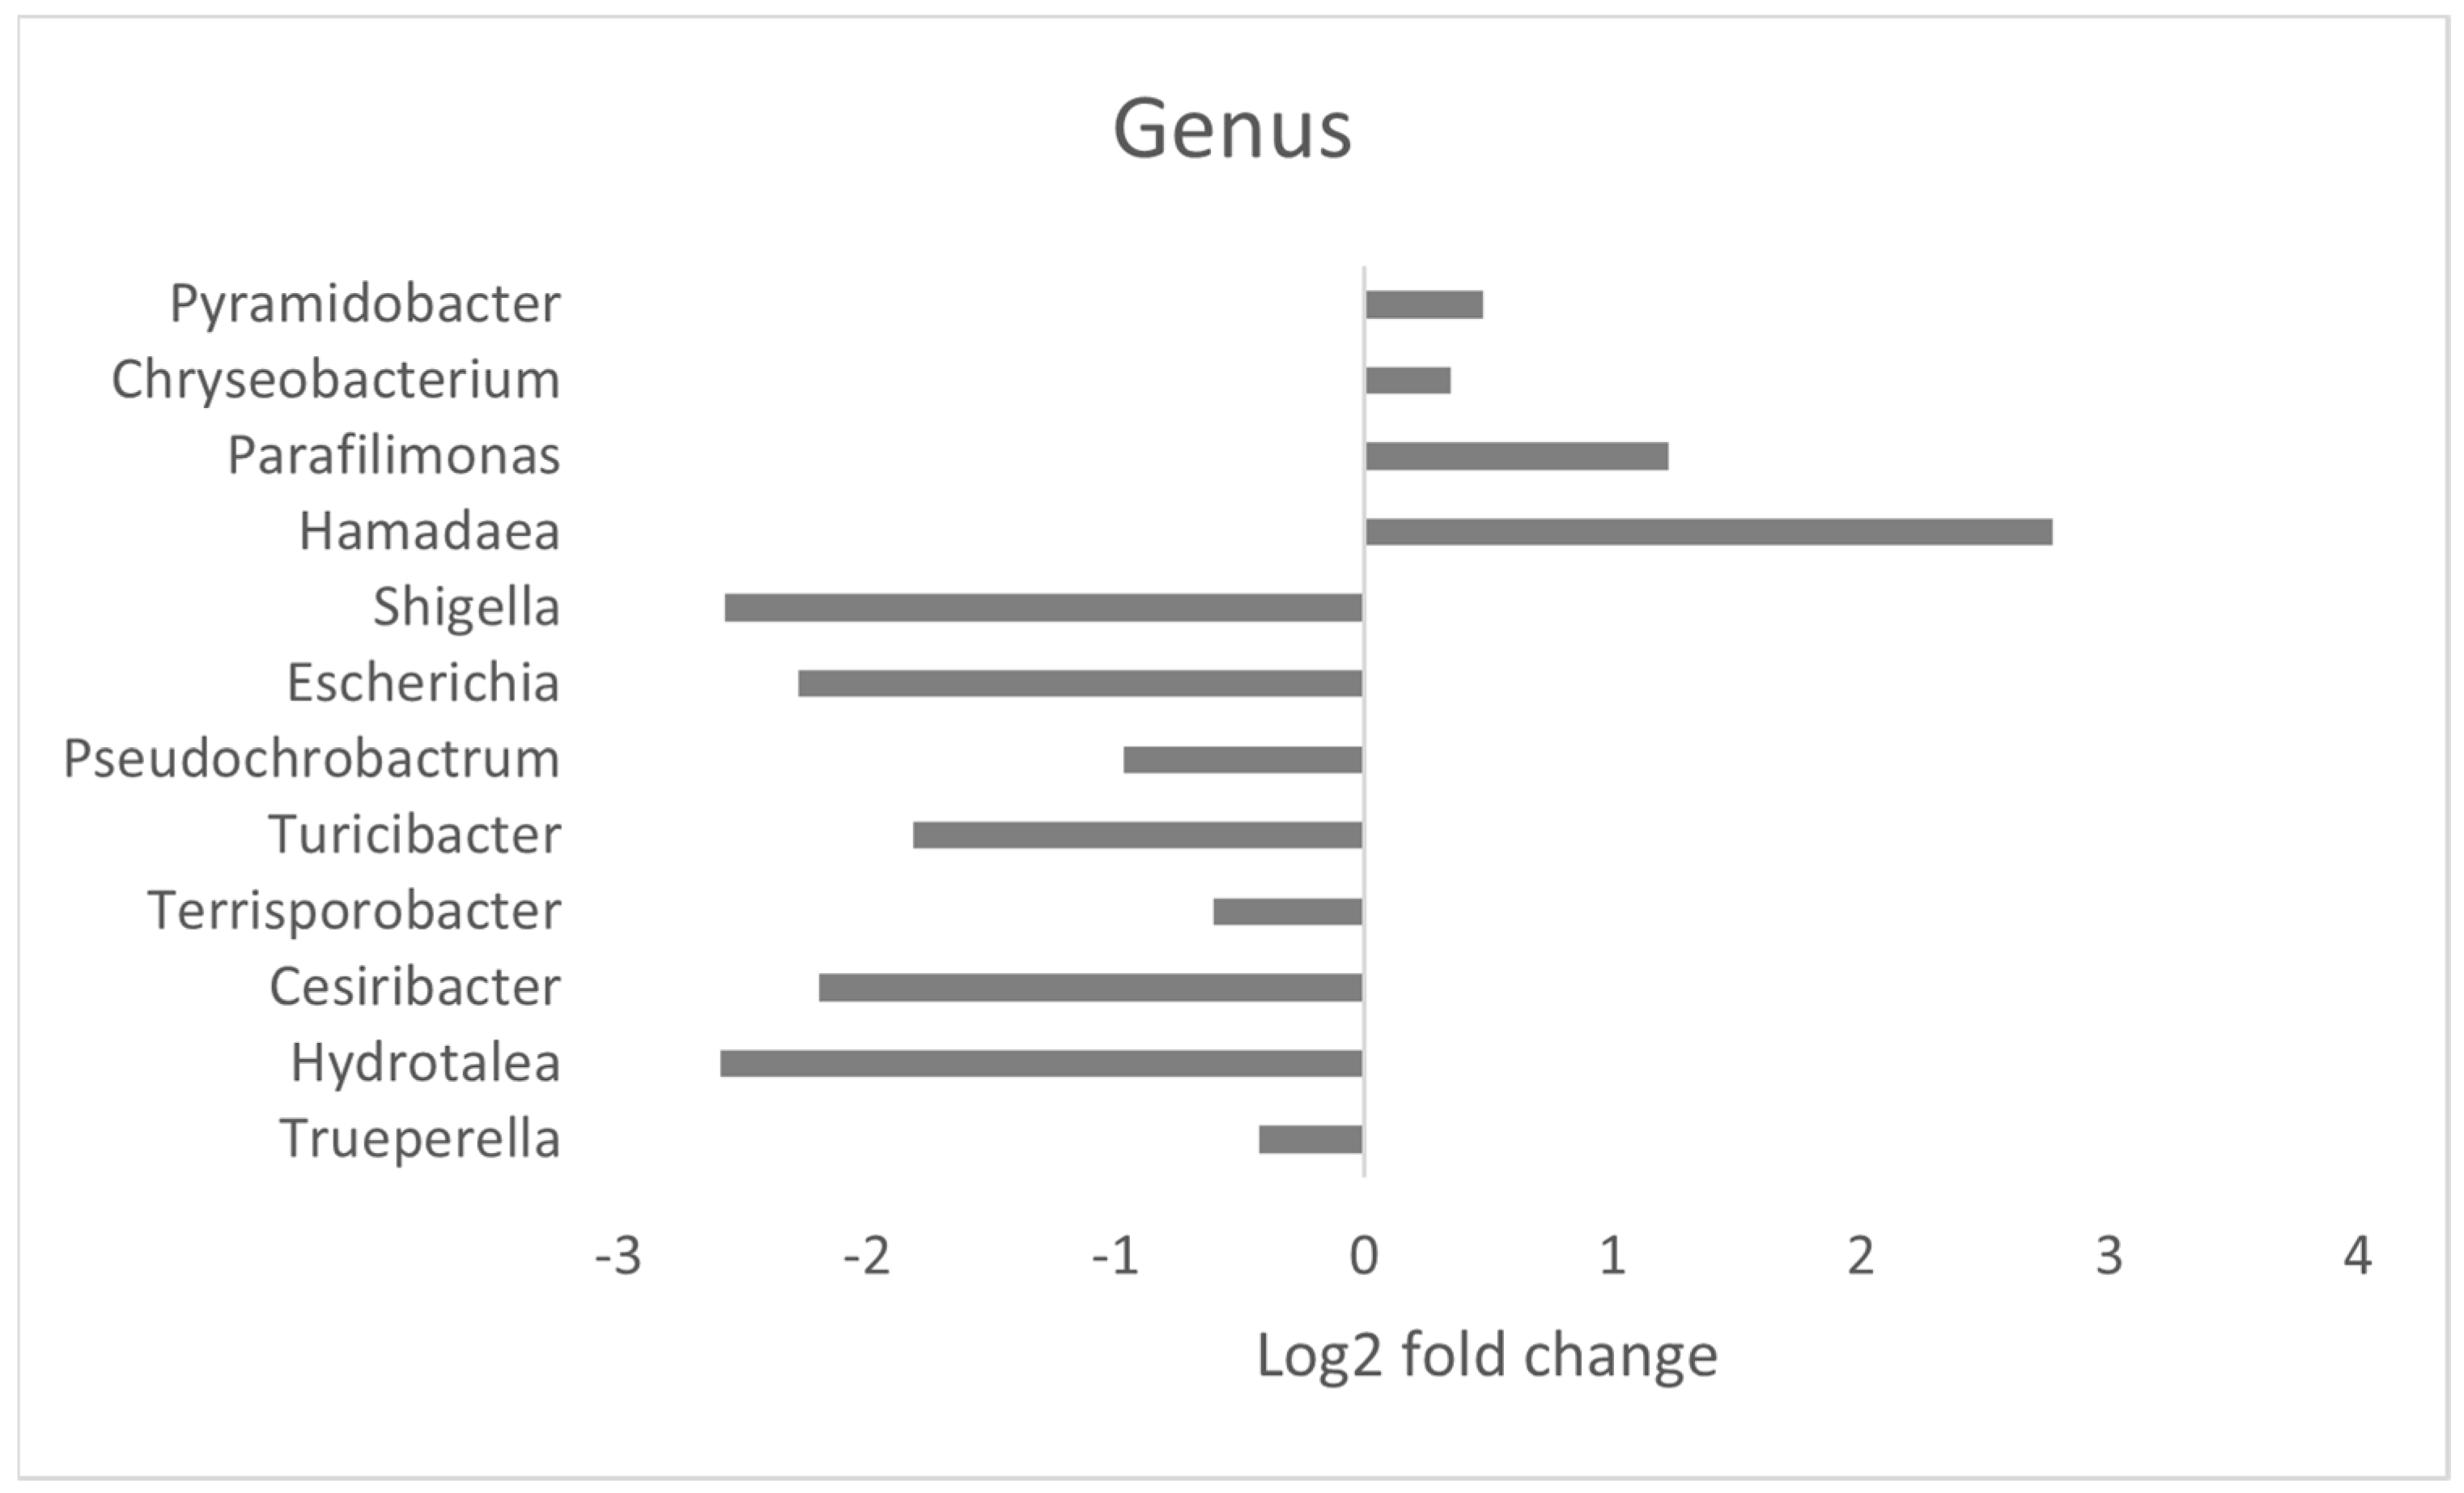
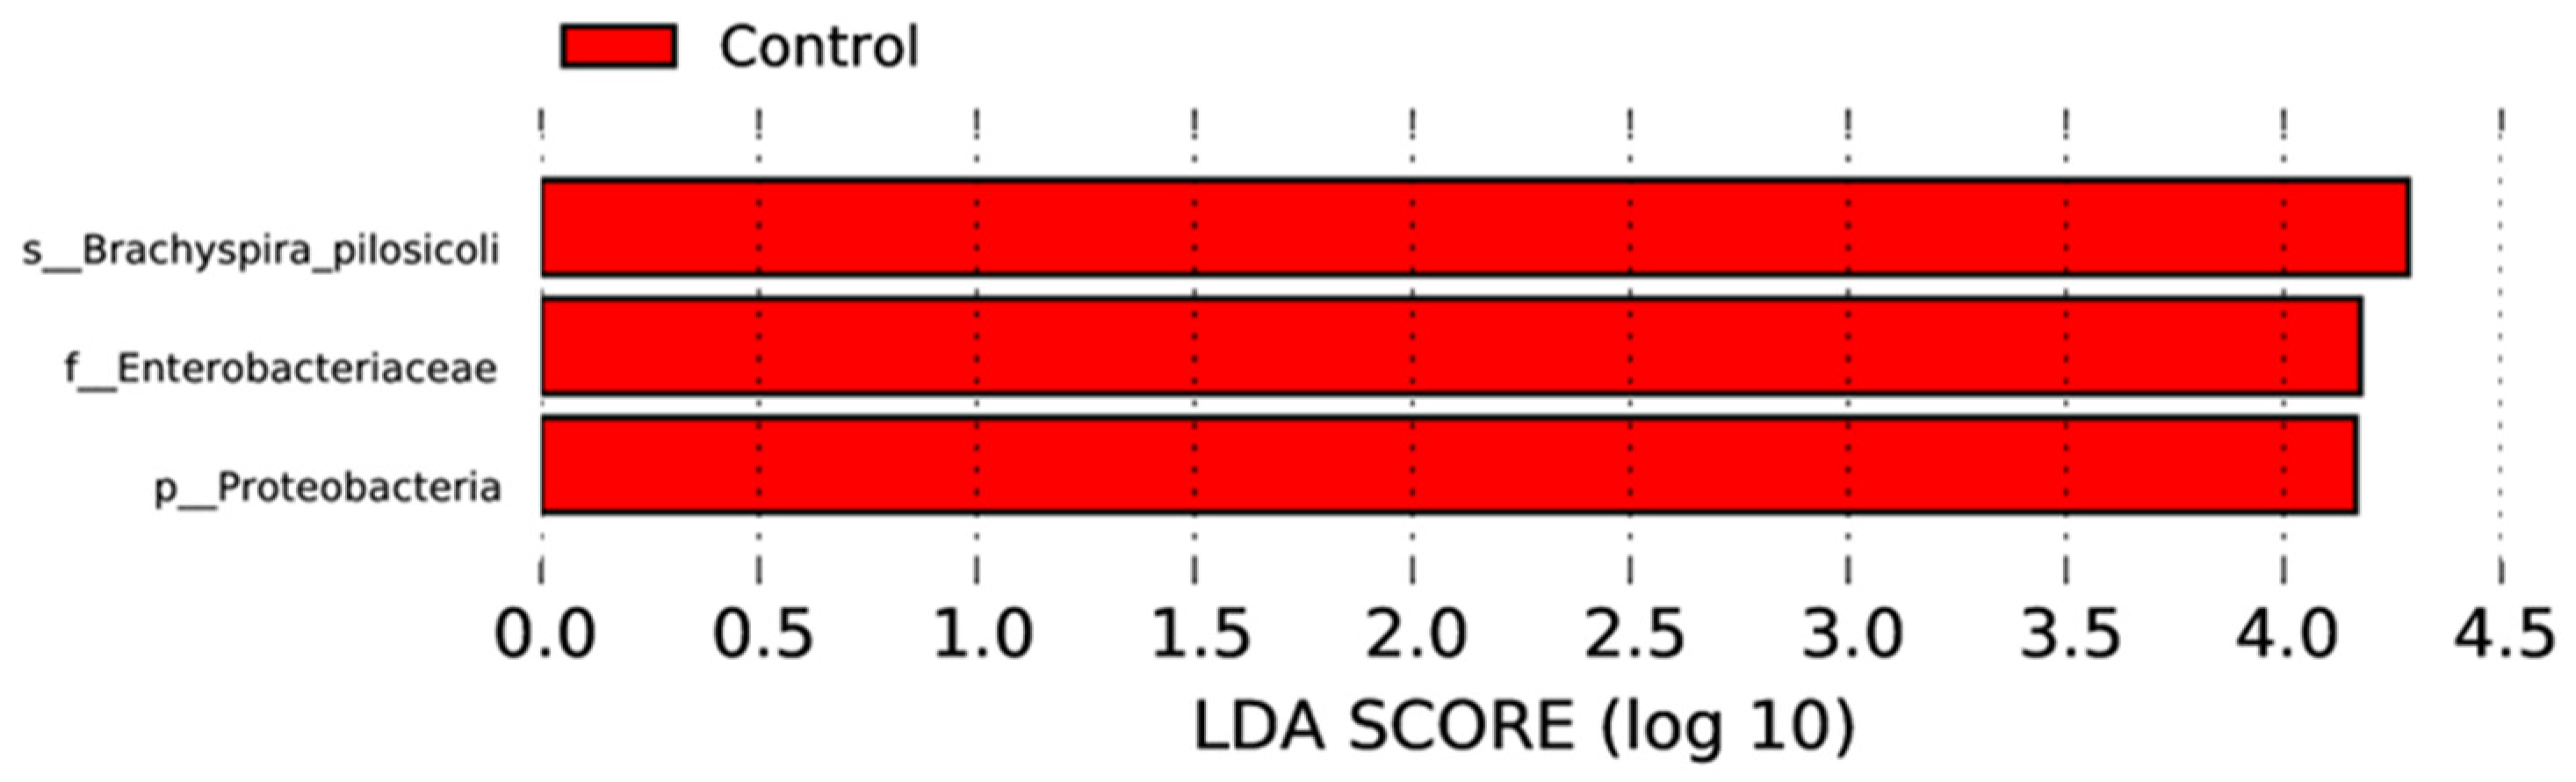
3.4. Effect of MRF Supplementation on Bacterial Pathobionts

Among the bacterial genera and species that were differentially abundant between groups, we identified several pathobionts and examined the effect of dietary supplementation on their relative abundance. (Figure 7). At the genus level, the relative abundance of both Escherichia and Shigella were significantly lower in the supplemented group. When examining the bacterial species which were affected, nine were identified as potential pathobionts, including Escherichia fergusonii, Shigella boydii, S. sonnei, S. Flexneri, and S. dysenteriae. Additionally, Brachyspira pilosicoli, Gallibacterium anatis, Mycoplasma gallisepticum, and Trueperella pyogenes were all significantly lower in the supplemented groups. The total relative abundance of these bacterial pathobionts was substantially lowered with the MRF supplement relative to the control laying hens under commercial conditions (0.01% vs. 0.28%, respectively).

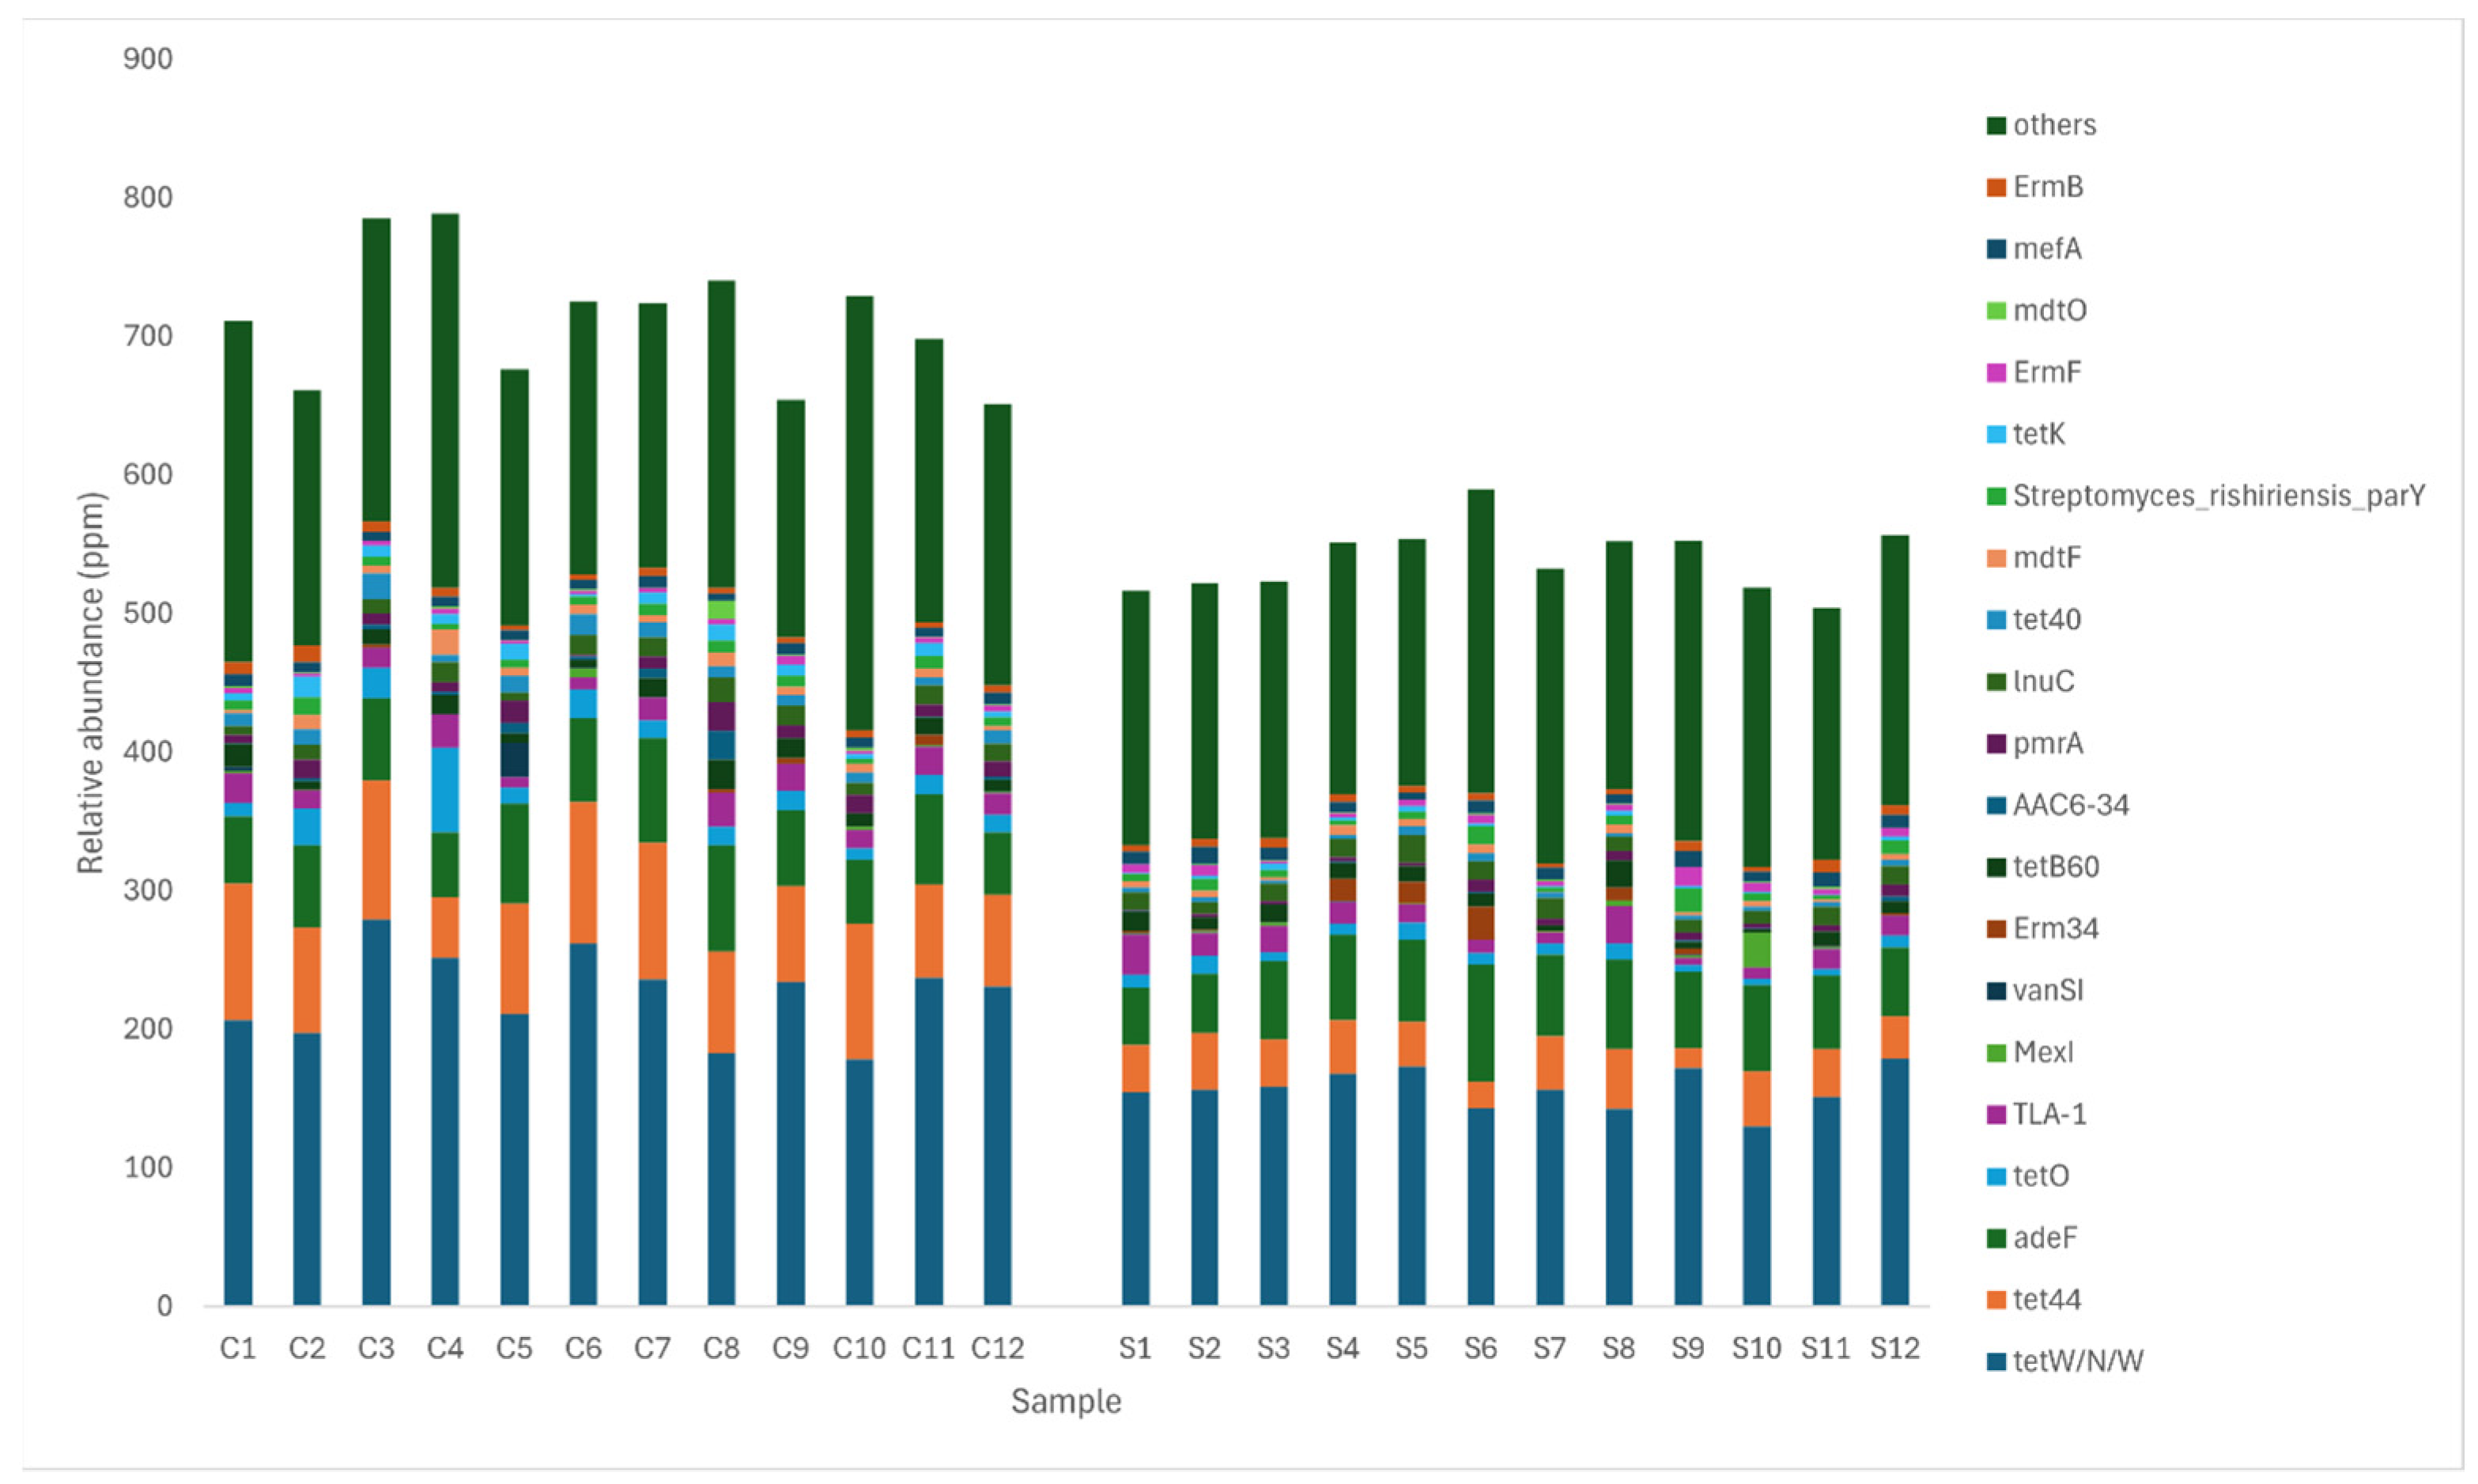
3.5. Comparison of Antibiotic Resistance Genes between Control and MRF Supplemented Layers

In total, 469 resistance genes were detected in layer caecal content. An analysis of beta diversity using PCoA based on Bray–Curtis distances and PERMANOVA between groups showed significant differences in ARG composition between the groups (Figure 8, p < 0.001). The 20 most abundant antibiotic resistance genes are shown in Figure 9. The resistance gene tetW/N/W was shown to be the most abundant across both control and supplemented caecal samples, followed by tet44, adeF, tetO, and TLA-1 in the control group and adeF, tet44, TLA-1, and lnuC in the supplemented group. The relative abundance of antibiotic resistance genes was significantly lower (p < 0.001) in the supplemented group (0.0539%) compared to the control group (0.0712%). According to the CARD database, all resistance genes identified in this study were classified into 10 primary categories based on their resistance mechanism: antibiotic efflux, antibiotic inactivation, antibiotic target alteration, antibiotic target protection, antibiotic target replacement, reduced permeability to antibiotics, and four multiple resistance mechanisms (antibiotic efflux and reduced permeability to antibiotics, antibiotic target alteration and antibiotic efflux, antibiotic target alteration and antibiotic efflux and reduced permeability to antibiotics, antibiotic target alteration and antibiotic target replacement).
The dominant antibiotic resistance gene classes were found to be tetracyclines, fluoroquinolone multidrug, macrolide multidrug, aminoglycosides, and fluroquinolones in the control group and tetracyclines, fluoroquinolone multidrug, macrolide multidrug, aminoglycosides, and cephalosporin multidrug in the supplemented group. To compare the microbial origin of antibiotic resistance genes with the total microbial genes in the layer caecum, all antibiotic resistance genes and total gut microbial genes were classified into different taxa with the support of the resistance gene identifier. Different assignments of antibiotic resistance genes and total microbial genes at the phylum level were observed in both the control and supplemented group, 28% vs. 29% (Firmicuites), 17% vs. 40% (Bacteroidetes), and 12% vs. 4% (Proteobacteria), indicating that proteobacteria carried the greatest proportion of resistance genes compared with the other phyla (Figure 10).
From the total resistomes, ARGs were assigned to the core resistome if the gene was present in all 12 samples and to the accessory resistome if a gene was detected in at least 1 sample but less than 12 samples (Figure 11). A total of 68 ARGs were assigned to the core resistome and 382 ARGs were assigned to the accessory resistome for the control birds. In the supplemented birds, 63 ARGs were assigned to the core resistome and 387 ARGS were assigned to the accessory resistome. Within the core resistome, 30 genes were unique to the control and 25 genes were unique to the supplemented group, with 38 shared genes. Within the accessory resistome, 43 genes were unique to the control and 48 genes unique to the supplemented group, with 339 genes shared.
A total of 49 ARGs were shown to be different between groups (Pfdr < 0.05, Table 2), with 41 genes being significantly lower in the supplemented group. Those genes that were significantly different between the groups were mainly associated with the following antibiotic resistance mechanisms: antibiotic efflux (25 genes); antibiotic inactivation (12 genes); antibiotic target alteration (5 genes); antibiotic target protection (4 genes); antibiotic target alteration and antibiotic efflux (2 gene); and one gene associated with antibiotic target alteration, antibiotic efflux and reduced permeability to antibiotics. These genes were associated with resistance to the following antibiotic classes: aminocoumarin antibiotic (2 genes), aminoglycoside antibiotic (3 genes), fluoroquinolone antibiotic (4 genes), Fosfomycin (2 genes), macrolide antibiotic (1 gene), penam antibiotic (1 gene), peptide antibiotic (3 genes), phenicol antibiotic (1 gene), streptogramin antibiotic (1 gene), tetracycline antibiotic (9 genes), or were multidrug resistant (22). The phylogenetic origins of the resistance genes which were significantly different between groups were assigned, and this indicated that many of those genes which were different between control and supplemented layers belonged to the phylum Proteobacteria, Enterobacteriaceae, and Bacteroides (Table 2).
To further investigate the changes in microbial composition and AMR-encoded genes following MRF supplementation, the most abundant taxa detected across the study and differing between the control and supplemented group were analysed. A total of 29 genera were identified; however, one genus, Podovirus phage Cba41, was removed as it was deemed irrelevant to the subsequent AMR analyses performed. A total of 86 abundant AMR genes were found to substantially differ between the control and supplemented groups. For legibility, eleven lengthy CARD database AMR hits were simplified to represent the relevant gene name only.
The correlation analysis of the 28 bacterial genera versus the 86 AMR genes highlights strong and positive correlations between potential pathobionts and AMR genes, including Escherichia, Coprobacter, Brachyspira, and Trueperella (Figure 12). The multidrug efflux pump, YojI, was the strongest and most significant hit observed, associated with Escherichia (p-value 1.5 × 10⁻¹¹). The fourth most significant hit was a tetracycline resistance mechanism, TetW/N/W, associated with pathobiont Trueperella (p-value 8.8 × 10⁻¹¹). A subsequent focused analysis of the 28 most abundant genera showed MRF supplementation was significantly associated with decreases in Escherichia, Coprobacter, and Trueperella (Figure 13), whereas the decrease observed in the relative abundance of Brachyspira did not reach statistical significance.
Finally, a correlation analysis of the 28 most abundant and differing taxa between the control and supplemented groups highlights an increased abundance in anaerobic fermentative gut microbes that may also contribute to the inhibition of pathogens. Anaerovorax, Brevibacillus, Paenibacillus, Ruthenibacterium, Emergencia, Atopobium, strongly correlate together (Figure 14), with a consistent trend towards greater relative abundance in the MRF-supplemented laying hens. An expansion of these beneficial microbes could also be responsible for the observed decrease in relative abundance of AMR-carrying pathobionts.

4. Discussion

Nutritional strategies aimed at improving production performance and feed efficiency are pivotal for enhancing the economic viability of egg production. Dietary MRF has been extensively investigated in broiler chickens, and to a lesser extent, in laying hens, in relation to these production parameters. A published meta-analysis demonstrated that supplementing mannan-oligosaccharides in broiler diets led to notable improvements in body weight (+1.61%), feed conversion ratio (−1.99%), and mortality (−21.4%) compared to control diets [38]. Similarly, a recent meta-analysis of layers by [7] highlighted the positive impact of MRF supplementation on feed efficiency, mortality, egg mass, and eggshell thickness. Likewise, another recent study by Leigh and colleagues also demonstrated improved productivity factors in MRF-supplemented layers, such as total egg weight, total egg numbers, total egg mass, and laying frequency [9].
Consistent with the current literature, our commercial field-trial study showed a trend for lower mortality (−2.3%) and an improved ADFI (+19.05%) within the MRF-supplemented group, compared with the control group. The percentage of second-grade eggs was significantly lower in the supplemented groups during the majority of time periods (weeks 30–59, but not weeks 70–76). Combined over the entire laying period, the percentage of second-grade eggs was lower by 7.07% with MRF. In addition to this, eggshell strength (+12.09%) was significantly greater in the supplemented birds over the entire feeding period.
Improvements in egg quality traits are important for enhancing the economic performance of laying hens, particularly in reducing egg cracking. Dietary nutrients such as calcium, phosphorous, trace minerals, and vitamins are important for the development of stronger shells. The observed positive effects on performance responses could be potentially attributed to better nutrient digestion and absorption facilitated by the improved intestinal development often associated with MRF supplementation, or a decrease in the need for the partition of nutrients toward supporting immune responses, thereby sparing more nutrients for production purposes [39].
Alpha and beta diversity indices often serve as indicators of gut health. In many scenarios, an increase in alpha diversity metrics is considered beneficial. Likewise, a beta diversity composition shift towards a microbiome composed of beneficial bacteria with fewer pathobionts is desired. Prebiotics such as yeast MRF have been found to have beneficial effects in broilers and layers in terms of improving bacterial diversity, decreasing the pathobiont load, and modulating immunity [8,9,40,41,42,43].
However, the results from this study showed that supplementation from 16 to 76 weeks of age did not significantly change alpha or beta diversity at the end of lay, which may be attributed to age-related variations in gut microbiota composition and stability. Factors influencing gut microbiota diversity include host and environmental factors, such as age and diet, and MRF supplementation at earlier stages of lay has been shown to effect both alpha and beta diversity indices [8,9]. Age-linked variations in the microbial composition of the layer intestinal tract have been defined in recent studies [44]. Longitudinal studies on the caecal microbiota of laying hens by [45,46] showed that bacterial diversity increased as birds matured. The composition of the gut microbiota fluctuates substantially before the laying period, while it is relatively stable in the laying period, which may be attributed to the management system of laying hens making the microbiome less susceptible to changes from dietary interventions as the hens age [44,47]. In the study by Wei et al. [45], dietary supplementation at later stages had no impact on diversity, as peak bacterial diversity was already achieved, suggesting the starter and mid-lay period are the key periods for the development of the gut microbiota in laying hens.
The importance of the gut microbiota regarding poultry growth performance and the reduction of pathogen load is well recognised. Similar to other studies of late-phase laying hens [47,48,49,50], we found that the caecal microbiota of our commercial laying hens was formed mainly by the phyla Bacteroidetes, Firmicutes, and Proteobacteria and genera Bacteroides, Faecalibacterium, and Alistipes. We further noted that there were significantly lower levels of numerous bacterial species in the MRF-supplemented group that are known to be disease causing, in both poultry and humans, specifically Escherichia and Shigella. The presence of normal flora in the intestine mainly functions to control or eliminate an invading pathogen, with the use of an in-feed prebiotic supplement strengthening the gut microbiota for improved host performance and colonisation resistance to pathogens.
A reduction in the levels of foodborne pathogens has also been noted in previous studies which involved the use of MRF in earlier stages of the life cycle of both laying hens and broilers [8,51]. MRF is known to bind type-1 fimbriated bacteria [52], and some of the pathogens that were affected in this study such as Escherichia spp., Shigella spp., and Truperella pyogenes are known to possess these mannose-sensitive adherence structures, which may explain their observed lower abundances in the supplemented group compared with the control [53,54,55]. Egg contamination with pathogenic bacteria can pose serious threats to food safety; therefore, modulating the intestinal microbiota is an effective way to reduce the risk of spreading foodborne pathogens in humans.
Brachyspira pilosicoli, the causative agent of avian intestinal spirochaetosis (AIS), was also lower in the supplemented group. Symptoms of infection can vary but typically present as reduced growth rates, delayed onset of lay, reduced egg production, faecally stained eggs, and diarrhoea. AIS has an estimated cost to the UK laying industry of GBP 18 million per annum; therefore, reducing the levels on-farm could have potential economic benefits for producers [56]. In addition, antimicrobials are the main control strategy for AIS in poultry, so alternative nutritional approaches to infection control could aid in reducing the use of antimicrobials in poultry [44,57].
While the emphasis of nutritional supplementation typically centres on control of bacteria within the intestinal tract causing gastrointestinal disease or presenting food safety implications, we observed in this study marked variations in some bacteria associated with respiratory pathologies. The avian respiratory tract is a common site of pathogen entry and disease, including both viruses and bacteria. The treatment and prevention of respiratory infections are of utmost importance for the industry, not only because they have a devastating effect on poultry flocks, but they also render flocks immunosuppressed and susceptible to opportunistic infections such as colibacillosis [58,59,60].
Significantly lower levels were noted for Gallibacterium anatis and Mycoplasma gallisepticum in the supplemented layer caeca, and given the potential for faecal–oral transmission of these diseases, this could potentially lower the risk of transmission and disease. Disease caused by G. anatis can lead to economic losses in the poultry industry due to respiratory issues in birds, as well as a range of pathological lesions in the ovaries and oviducts of laying hens, where it is estimated that infection of the reproductive tract can lower egg production by 8–10% [61]. Mycoplasma gallisepticum is a pathogenic mycoplasma species in poultry and can result in breathing difficulty, nasal discharge, sinusitis, airsacculitis, a decrease in egg production, and an increase in embryo mortality in layer parents and commercial layers [62]. Although infections with this pathogen may be subclinical, they can predispose birds to secondary infections with bacteria such as Escherichia coli, and viruses such as Newcastle disease, infectious bronchitis, and infectious laryngotracheitis.
Antimicrobial resistance genes are ubiquitous in both the GIT and other environmental microbial reservoirs, and infections caused by antibiotic-resistant bacteria are a major threat to public health [63,64]. In this study, we found 469 AMR determinants in the caeca of aged laying hens, with supplemented layers having a significantly lower proportion of AMR determinants compared with the control. Additionally, there were significant differences in ARG composition between the groups, with 41 of the 49 significantly different genes found to be lower in the supplemented group compared with the control. Previous studies have shown that tetracyclines, macrolides, and aminoglycosides are among the most common antibiotic resistance classes in laying hens, which is consistent with our findings [5,65,66].
Most of those genes which were significantly different were determined to be chromosomally located resistance gene determinants, typically efflux pumps, suggesting they are part of the natural resistance gene profile of the core microbiome [67]. Typically, plasmid-mediated resistance genes are thought to pose a greater risk for facilitating the exchange of ARGs under environmental stresses [68]; however, it is argued that chromosomally located ARGs may move into susceptible pathogens and may also pose a risk, making them relevant [69].
Prebiotic mannan-rich fractions modify gut microbial populations and microbial metabolites, inhibiting the colonisation of some bacteria, including type 1 fimbriated pathogens such as E. coli, Shigella, and Salmonella, and other pathogens such as C. perfringens and Listeria spp., amongst others [8,9,51]. MRF achieves this through competition for binding sites, improving nutrient digestion, intestinal morphology, and function, in addition to regulating the immune response [7,43,52,70]. Pathogenic strains of Enterobacteriaceae and E. coli can have an impact on human and animal health by acquiring and disseminating AMR and virulence genes through the food supply chain [71]. Other research has shown that the use of prebiotic mannan-rich fractions has impacted antimicrobial resistance by potentiating bacterial susceptibility to antibiotics in E. coli through modulation of the bacterial metabolism [12]. In a previous study which tracked the dynamics of ARG-harbouring bacterial hosts, the authors found that the ARG-harbouring genera in the faecal resistome of broilers belonged to Escherichia, Klebsiella, Shigella and Salmonella, with the ARGs resistant to multidrug resistance, tetracycline, aminoglycoside, and MLS being noted to reside in Escherichia [66].
A possible explanation for the reduced abundance of ARGs may be through a reduction of these ARG-harbouring bacterial hosts. In our current study, LEfSe analysis showed that Proteobacteria and Enterobacteriaceae were significant discriminators between the control and supplemented groups, with their abundance being over-represented in the control group. In addition, correlation analysis showed that those bacterial genera which were significantly different also had strong and positive correlations between potential pathobionts such as Escherichia, Coprobacter, Brachyspira, and Trueperella. Further correlation analysis also showed that an expansion of bacteria that carry fewer AMR genes could be responsible for the observed decrease in the relative abundance of AMR-carrying pathobionts.
Another study showed that in the chicken metagenome, the proteobacteria carried almost 30% of ARGs, and Escherichia was the main ARG host at the genus level [72]. Similar to this, we noted that while the proteobacteria accounted for approximately 4% of the bacteria within the layer caecal content of this study, approximately 12% of resistance genes were associated with this same phylum. According to the CARD database, the phylogenetic associations of the differentially abundant ARGs were mainly Proteobacteria, Enterobacteriaceae, and Bacteroides. In addition, many of these differentially abundant genes were more frequently identified as core genes in the control compared with the supplemented group, where they were identified as part of the accessory resistome. This may be attributed to the shift in microbial composition, where those bacterial hosts typically harbouring these genes were lower and not as frequently identified in the caeca of birds in the supplemented group. These results, taken together with the LefSe and correlation analysis showing proteobacteria and Enterobacteriaceae contribute to the greatest difference between the two bacterial communities, may explain the differences observed in the resistome analysis.
Interestingly, a large proportion of the ARGs which were differentially abundant in our study (10/49) were associated with tetracycline resistance, with nine of these genes being significantly lower in the supplemented group compared with the control. The same study by Xiong et al. [66] also found that the antibiotic alteration of bacterial community structure significantly influenced ARG-harbouring bacterial hosts via inhibition of Escherichia and was the primary reason for an observed decrease in multidrug resistance genes. Tetracycline is one of the most widely used antibiotics in farming. Therefore, there is a need to limit the evolution and spread of tetracycline resistance [73].

5. Conclusions

The findings of this commercial field-trial study demonstrate that dietary supplementation with a yeast mannan-rich fraction containing prebiotic product can positively affect laying hen performance, while reducing the observed abundance of antimicrobial resistance genes. We believe the MRF-associated benefits were achieved by a greater abundance of beneficial microbes and simultaneously lowering AMR-carrying pathobionts. Pathogenic strains of Enterobacteriaceae can have an impact on human and animal health by acquiring and disseminating AMR and virulence genes through the food supply chain, leading to increased treatment failures and higher mortality, posing an increasing threat to public health. These changes may limit the evolution and spread of antibiotic resistance genes within the gastrointestinal tract and other environments, such as food and water.
Future research could explore the underlying mechanisms driving these changes, investigating the specific pathways through which supplementation with a yeast mannan-rich prebiotic influences microbial communities. Additionally, longitudinal studies may provide insights into the temporal dynamics of these effects throughout the laying cycle. Future improvements in monitoring AMR movement will be critical to prevent the spread of resistance genes in the environment, thus contributing to the One Health approach in controlling AMR. Overall, this study greatly contributes to the growing body of knowledge on the beneficial impacts of dietary intervention in poultry and their multifaceted effects on both the microbiome and resistome.

Supplementary Materials

The following supporting information can be downloaded at: https://www.mdpi.com/article/10.3390/microorganisms12081562/s1, Tables S1–S14.

Author Contributions

Conceptualisation, A.C., R.M., J.T.-P. and P.M.; methodology, A.C.; formal analysis, A.C. and S.S.; data curation, A.C. and S.S.; writing—original draft preparation, A.C.; writing—review and editing, A.C. and R.M. All authors have read and agreed to the published version of the manuscript.

Funding

This research received no external funding.

Data Availability Statement

Sequencing data can be found in NCBI Sequence Read Archive (SRA) database (Accession Number: PRJNA1136229). All other data that support the findings of this study are available on request from the corresponding author.

Conflicts of Interest

The authors were employed by Alltech Inc. Alltech is a manufacturer of animal feed and dietary supplements. Author S.S. is employed by Novogene (UK) Company Ltd. and was involved in the generation of the next-generation sequencing data and results.

References

  1. Wickramasuriya, S.S.; Park, I.; Lee, K.; Lee, Y.; Kim, W.H.; Nam, H.; Lillehoj, H.S. Role of Physiology, Immunity, Microbiota, and Infectious Diseases in the Gut Health of Poultry. Vaccines 2022, 10, 172. [Google Scholar] [CrossRef] [PubMed]
  2. Aruwa, C.E.; Pillay, C.; Nyaga, M.M.; Sabiu, S. Poultry gut health–microbiome functions, environmental impacts, microbiome engineering and advancements in characterization technologies. J. Anim. Sci. Biotechnol. 2021, 12, 119. [Google Scholar] [CrossRef] [PubMed]
  3. Diaz Carrasco, J.M.; Casanova, N.A.; Fernández Miyakawa, M.E. Microbiota, Gut Health and Chicken Productivity: What Is the Connection? Microorganisms 2019, 7, 374. [Google Scholar] [CrossRef] [PubMed]
  4. Abreu, R.; Semedo-Lemsaddek, T.; Cunha, E.; Tavares, L.; Oliveira, M. Antimicrobial Drug Resistance in Poultry Production: Current Status and Innovative Strategies for Bacterial Control. Microorganisms 2023, 11, 953. [Google Scholar] [CrossRef] [PubMed]
  5. Koorakula, R.; Schiavinato, M.; Ghanbari, M.; Wegl, G.; Grabner, N.; Koestelbauer, A.; Klose, V.; Dohm, J.C.; Domig, K.J. Metatranscriptomic Analysis of the Chicken Gut Resistome Response to In-Feed Antibiotics and Natural Feed Additives. Front. Microbiol. 2022, 13, 833790. [Google Scholar] [CrossRef]
  6. Rahman, M.R.T.; Fliss, I.; Biron, E. Insights in the Development and Uses of Alternatives to Antibiotic Growth Promoters in Poultry and Swine Production. Antibiotics 2022, 11, 766. [Google Scholar] [CrossRef]
  7. Salami, S.A.; Ross, S.A.; Patsiogiannis, A.; Moran, C.A.; Taylor-Pickard, J. Performance and environmental impact of egg production in response to dietary supplementation of mannan oligosaccharide in laying hens: A meta-analysis. Poult. Sci. 2022, 101, 101745. [Google Scholar] [CrossRef] [PubMed]
  8. Corrigan, A.; Leigh, R.J.; Walsh, F.; Murphy, R. Microbial community diversity and structure in the cecum of laying hens with and without mannan-rich fraction supplementation. J. Appl. Poult. Res. 2023, 32, 100342. [Google Scholar] [CrossRef]
  9. Leigh, R.J.; Corrigan, A.; Murphy, R.A.; Walsh, F. Yeast mannan rich fraction positively influences microbiome uniformity, productivity associated taxa, and lay performance. Anim. Microbiome 2024, 6, 9. [Google Scholar] [CrossRef]
  10. Grant, S.; Smith, H.; Murphy, R. Mannan based prebiotics modulate growth rate and energy phenotype of tetracycline resistant E. coli. Front. Anim. Sci. 2023, 3, 1069280. [Google Scholar] [CrossRef]
  11. Smith, H.; Grant, S.; Parker, J.; Murphy, R. Yeast cell wall mannan rich fraction modulates bacterial cellular respiration potentiating antibiotic efficacy. Sci. Rep. 2020, 10, 21880. [Google Scholar] [CrossRef] [PubMed]
  12. Smith, H.; Grant, S.; Meleady, P.; Henry, M.; O’Gorman, D.; Clynes, M.; Murphy, R. Yeast Mannan-Rich Fraction Modulates Endogenous Reactive Oxygen Species Generation and Antibiotic Sensitivity in Resistant E. coli. Int. J. Mol. Sci. 2022, 24, 218. [Google Scholar] [CrossRef]
  13. Parker, J.; Smith, H.; Corrigan, A.; Fay, B.J.; Murphy, R. Effects of dietary mannan-rich fraction on microbial populations in broiler chickens. In Proceedings of the 6th International Conference on Poultry Intestinal Health, Rome, Italy, 3–5 April 2019. [Google Scholar]
  14. Karlsson, F.H.; Fåk, F.; Nookaew, I.; Tremaroli, V.; Fagerberg, B.; Petranovic, D.; Bäckhed, F.; Nielsen, J. Symptomatic atherosclerosis is associated with an altered gut metagenome. Nat. Commun. 2012, 3, 1245. [Google Scholar] [CrossRef] [PubMed]
  15. Qin, J.; Li, R.; Raes, J.; Arumugam, M.; Burgdorf, K.S.; Manichanh, C.; Nielsen, T.; Pons, N.; Levenez, F.; Yamada, T.; et al. A human gut microbial gene catalogue established by metagenomic sequencing. Nature 2010, 464, 59–65. [Google Scholar] [CrossRef] [PubMed]
  16. Feng, Q.; Liang, S.; Jia, H.; Stadlmayr, A.; Tang, L.; Lan, Z.; Zhang, D.; Xia, H.; Xu, X.; Jie, Z.; et al. Gut microbiome development along the colorectal adenoma-carcinoma sequence. Nat. Commun. 2015, 6, 6528. [Google Scholar] [CrossRef]
  17. Li, J.; Jia, H.; Cai, X.; Zhong, H.; Feng, Q.; Sunagawa, S.; Arumugam, M.; Kultima, J.R.; Prifti, E.; Nielsen, T.; et al. An integrated catalog of reference genes in the human gut microbiome. Nat. Biotechnol. 2014, 32, 834–841. [Google Scholar] [CrossRef]
  18. Karlsson, F.H.; Tremaroli, V.; Nookaew, I.; Bergström, G.; Behre, C.J.; Fagerberg, B.; Nielsen, J.; Bäckhed, F. Gut metagenome in European women with normal, impaired and diabetic glucose control. Nature 2013, 498, 99–103. [Google Scholar] [CrossRef]
  19. Nielsen, H.B.; Almeida, M.; Juncker, A.S.; Rasmussen, S.; Li, J.; Sunagawa, S.; Plichta, D.R.; Gautier, L.; Pedersen, A.G.; Le Chatelier, E.; et al. Identification and assembly of genomes and genetic elements in complex metagenomic samples without using reference genomes. Nat. Biotechnol. 2014, 32, 822–828. [Google Scholar] [CrossRef]
  20. Handelsman, J.; Rondon, M.R.; Brady, S.F.; Clardy, J.; Goodman, R.M. Molecular biological access to the chemistry of unknown soil microbes: A new frontier for natural products. Chem. Biol. 1998, 5, R245–R249. [Google Scholar] [CrossRef]
  21. Chen, K.; Pachter, L. Bioinformatics for Whole-Genome Shotgun Sequencing of Microbial Communities. PLOS Comput. Biol. 2005, 1, e24. [Google Scholar] [CrossRef]
  22. Zhu, W.; Lomsadze, A.; Borodovsky, M. Ab initio gene identification in metagenomic sequences. Nucleic Acids Res. 2010, 38, e132. [Google Scholar] [CrossRef]
  23. Zeller, G.; Tap, J.; Voigt, A.Y.; Sunagawa, S.; Kultima, J.R.; Costea, P.I.; Amiot, A.; Böhm, J.; Brunetti, F.; Habermann, N.; et al. Potential of fecal microbiota for early-stage detection of colorectal cancer. Mol. Syst. Biol. 2014, 10, 766. [Google Scholar] [CrossRef] [PubMed]
  24. Sunagawa, S.; Coelho, L.P.; Chaffron, S.; Kultima, J.R.; Labadie, K.; Salazar, G.; Djahanschiri, B.; Zeller, G.; Mende, D.R.; Alberti, A.; et al. Structure and function of the global ocean microbiome. Science 2015, 348, 1261359. [Google Scholar] [CrossRef] [PubMed]
  25. Oh, J.; Byrd, A.L.; Deming, C.; Conlan, S.; Barnabas, B.; Blakesley, R.; Bouffard, G.; Brooks, S.; Coleman, H.; Dekhtyar, M.; et al. Biogeography and individuality shape function in the human skin metagenome. Nature 2014, 514, 59–64. [Google Scholar] [CrossRef] [PubMed]
  26. Fu, L.; Niu, B.; Zhu, Z.; Wu, S.; Li, W. CD-HIT: Accelerated for clustering the next-generation sequencing data. Bioinformatics 2012, 28, 3150–3152. [Google Scholar] [CrossRef] [PubMed]
  27. Qin, J.; Li, Y.; Cai, Z.; Li, S.; Zhu, J.; Zhang, F.; Liang, S.; Zhang, W.; Guan, Y.; Shen, D.; et al. A metagenome-wide association study of gut microbiota in type 2 diabetes. Nature 2012, 490, 55–60. [Google Scholar] [CrossRef] [PubMed]
  28. Villar, E.; Farrant, G.K.; Follows, M.; Garczarek, L.; Speich, S.; Audic, S.; Bittner, L.; Blanke, B.; Brum, J.R.; Brunet, C.; et al. Environmental characteristics of Agulhas rings affect interocean plankton transport. Science 2015, 348, 1261447. [Google Scholar] [CrossRef] [PubMed]
  29. Cotillard, A.; Kennedy, S.P.; Kong, L.C.; Prifti, E.; Pons, N.; Le Chatelier, E.; Almeida, M.; Quinquis, B.; Levenez, F.; Galleron, N.; et al. Dietary intervention impact on gut microbial gene richness. Nature 2013, 500, 585–588. [Google Scholar] [CrossRef] [PubMed]
  30. Le Chatelier, E.; Nielsen, T.; Qin, J.; Prifti, E.; Hildebrand, F.; Falony, G.; Almeida, M.; Arumugam, M.; Batto, J.-M.; Kennedy, S.; et al. Richness of human gut microbiome correlates with metabolic markers. Nature 2013, 500, 541–546. [Google Scholar] [CrossRef]
  31. Buchfink, B.; Xie, C.; Huson, D.H. Fast and sensitive protein alignment using DIAMOND. Nat. Methods 2015, 12, 59–60. [Google Scholar] [CrossRef]
  32. Avershina, E.; Frisli, T.; Rudi, K. De novo semi-alignment of 16S rRNA gene sequences for deep phylogenetic characterization of next generation sequencing data. Microbes Environ. 2013, 28, 211–216. [Google Scholar] [CrossRef] [PubMed]
  33. Noval Rivas, M.; Burton, O.T.; Wise, P.; Zhang, Y.Q.; Hobson, S.A.; Garcia Lloret, M.; Chehoud, C.; Kuczynski, J.; DeSantis, T.; Warrington, J.; et al. A microbiota signature associated with experimental food allergy promotes allergic sensitization and anaphylaxis. J. Allergy Clin. Immunol. 2013, 131, 201–212. [Google Scholar] [CrossRef]
  34. White, J.R.; Nagarajan, N.; Pop, M. Statistical Methods for Detecting Differentially Abundant Features in Clinical Metagenomic Samples. PLOS Comput. Biol. 2009, 5, e1000352. [Google Scholar] [CrossRef] [PubMed]
  35. McArthur, A.G.; Waglechner, N.; Nizam, F.; Yan, A.; Azad, M.A.; Baylay, A.J.; Bhullar, K.; Canova, M.J.; De Pascale, G.; Ejim, L.; et al. The comprehensive antibiotic resistance database. Antimicrob. Agents Chemother. 2013, 57, 3348–3357. [Google Scholar] [CrossRef]
  36. Martínez, J.L.; Coque, T.M.; Baquero, F. What is a resistance gene? Ranking risk in resistomes. Nat. Rev. Microbiol. 2015, 13, 116–123. [Google Scholar] [CrossRef] [PubMed]
  37. Jia, B.; Raphenya, A.R.; Alcock, B.; Waglechner, N.; Guo, P.; Tsang, K.K.; Lago, B.A.; Dave, B.M.; Pereira, S.; Sharma, A.N.; et al. CARD 2017: Expansion and model-centric curation of the comprehensive antibiotic resistance database. Nucleic Acids Res. 2016, 45, D566–D573. [Google Scholar] [CrossRef]
  38. Hooge, D. Meta-analysis of Broiler Chicken Pen Trials Evaluating Dietary Mannan Oligosaccharide, 1993–2003. Int. J. Poult. Sci. 2004, 3, 163–174. [Google Scholar]
  39. Dilawar, M.A.; Mun, H.S.; Rathnayake, D.; Yang, E.J.; Seo, Y.S.; Park, H.S.; Yang, C.J. Egg Quality Parameters, Production Performance and Immunity of Laying Hens Supplemented with Plant Extracts. Animals 2021, 11, 975. [Google Scholar] [CrossRef]
  40. Corrigan, A.; de Leeuw, M.; Penaud-Frézet, S.; Dimova, D.; Murphy, R.A. Phylogenetic and functional alterations in bacterial community compositions in broiler ceca as a result of mannan oligosaccharide supplementation. Appl. Environ. Microbiol. 2015, 81, 3460–3470. [Google Scholar] [CrossRef]
  41. Corrigan, A.; Fay, B.J.; Corcionivoschi, N.; Murphy, R.A. Effect of yeast mannan-rich fractions on reducing Campylobacter colonization in broiler chickens. J. Appl. Poult. Res. 2017, 26, 350–357. [Google Scholar] [CrossRef]
  42. Corrigan, A.; Russell, N.; Welge, M.; Auvil, L.; Bushell, C.; White, B.A.; Murphy, R.A. The use of random forests modelling to detect yeast-mannan sensitive bacterial changes in the broiler cecum. Sci. Rep. 2018, 8, 13270. [Google Scholar] [CrossRef] [PubMed]
  43. McCaffrey, C.; Corrigan, A.; Moynagh, P.; Murphy, R. Effect of yeast cell wall supplementation on intestinal integrity, digestive enzyme activity and immune traits of broilers. Br. Poult. Sci. 2021, 62, 771–782. [Google Scholar] [CrossRef] [PubMed]
  44. Joat, N.; Van, T.T.H.; Stanley, D.; Moore, R.J.; Chousalkar, K. Temporal dynamics of gut microbiota in caged laying hens: A field observation from hatching to end of lay. Appl. Microbiol. Biotechnol. 2021, 105, 4719–4730. [Google Scholar] [CrossRef]
  45. Wei, J.; Xiao, H.; Wei, Y.; Tsopmejio, I.S.N.; Sun, C.; Wu, H.; Jin, Z.; Song, H. Longitudinal Study of the Effects of Flammulina velutipes Stipe Wastes on the Cecal Microbiota of Laying Hens. mSystems 2023, 8, e00835-22. [Google Scholar] [CrossRef] [PubMed]
  46. Mon, K.K.; Saelao, P.; Halstead, M.M.; Chanthavixay, G.; Chang, H.C.; Garas, L.; Maga, E.A.; Zhou, H. Salmonella enterica Serovars Enteritidis Infection Alters the Indigenous Microbiota Diversity in Young Layer Chicks. Front. Vet. Sci. 2015, 2, 61. [Google Scholar] [CrossRef]
  47. Dai, D.; Qi, G.-h.; Wang, J.; Zhang, H.-j.; Qiu, K.; Wu, S.-g. Intestinal microbiota of layer hens and its association with egg quality and safety. Poult. Sci. 2022, 101, 102008. [Google Scholar] [CrossRef]
  48. Videnska, P.; Sedlar, K.; Lukac, M.; Faldynova, M.; Gerzova, L.; Cejkova, D.; Sisak, F.; Rychlik, I. Succession and Replacement of Bacterial Populations in the Caecum of Egg Laying Hens over Their Whole Life. PLoS ONE 2014, 9, e115142. [Google Scholar] [CrossRef]
  49. Van Goor, A.; Redweik, G.A.J.; Stromberg, Z.R.; Treadwell, C.G.; Xin, H.; Mellata, M. Microbiome and biological blood marker changes in hens at different laying stages in conventional and cage free housings. Poult. Sci. 2020, 99, 2362–2374. [Google Scholar] [CrossRef]
  50. Xu, H.; Lu, Y.; Li, D.; Yan, C.; Jiang, Y.; Hu, Z.; Zhang, Z.; Du, R.; Zhao, X.; Zhang, Y.; et al. Probiotic mediated intestinal microbiota and improved performance, egg quality and ovarian immune function of laying hens at different laying stage. Front. Microbiol. 2023, 14, 1041072. [Google Scholar] [CrossRef]
  51. Leigh, R.J.; Corrigan, A.; Murphy, R.A.; Walsh, F. Effect of Mannan-rich fraction supplementation on commercial broiler intestinum tenue and cecum microbiota. Anim. Microbiome 2022, 4, 66. [Google Scholar] [CrossRef]
  52. Spring, P.; Wenk, C.; Connolly, A.; Kiers, A. A review of 733 published trials on Bio-Mos®, a mannan oligosaccharide, and Actigen®, a second generation mannose rich fraction, on farm and companion animals. J. Appl. Anim. Nutr. 2015, 3, e8. [Google Scholar] [CrossRef]
  53. Rzewuska, M.; Kwiecień, E.; Chrobak-Chmiel, D.; Kizerwetter-Świda, M.; Stefańska, I.; Gieryńska, M. Pathogenicity and Virulence of Trueperella pyogenes: A Review. Int. J. Mol. Sci. 2019, 20, 2737. [Google Scholar] [CrossRef] [PubMed]
  54. Zhao, K.; Liu, M.; Zhang, X.; Wang, H.; Yue, B. In vitro and in vivo expression of virulence genes in Trueperella pyogenes based on a mouse model. Vet. Microbiol. 2013, 163, 344–350. [Google Scholar] [CrossRef]
  55. Thanassi David, G.; Nuccio, S.-P.; Shu Kin So, S.; Bäumler Andreas, J. Fimbriae: Classification and Biochemistry. EcoSal Plus 2007, 2. [Google Scholar] [CrossRef]
  56. Passey, J.L.; La Ragione, R.M. JMM Profile: Brachyspira species: The causative agent of Avian Intestinal Spirochaetosis. J. Med. Microbiol. 2022, 71, 001495. [Google Scholar] [CrossRef] [PubMed]
  57. Rebollada-Merino, A.; Ugarte-Ruiz, M.; Gómez-Buendía, A.; Bárcena, C.; García, N.; Domínguez, L.; Rodríguez-Bertos, A. Cecal Reduction of Brachyspira and Lesion Severity in Laying Hens Supplemented with Fermented Defatted ‘Alperujo’. Fermentation 2022, 8, 550. [Google Scholar] [CrossRef]
  58. Leigh, R.J.; Murphy, R.A.; Walsh, F. uniForest: An unsupervised machine learning technique to detect outliers and restrict variance in microbiome studies. bioRxiv 2021. [Google Scholar] [CrossRef]
  59. Glendinning, L.; McLachlan, G.; Vervelde, L. Age-related differences in the respiratory microbiota of chickens. PLoS ONE 2017, 12, e0188455. [Google Scholar] [CrossRef] [PubMed]
  60. Mach, N.; Baranowski, E.; Nouvel, L.X.; Citti, C. The Airway Pathobiome in Complex Respiratory Diseases: A Perspective in Domestic Animals. Front. Cell. Infect. Microbiol. 2021, 11, 583600. [Google Scholar] [CrossRef]
  61. Kursa, O.; Tomczyk, G.; Sieczkowska, A.; Sawicka-Durkalec, A. Prevalence, Identification and Antibiotic Resistance of Gallibacterium anatis Isolates from Chickens in Poland. Pathogens 2023, 12, 992. [Google Scholar] [CrossRef]
  62. Michiels, T.; Welby, S.; Vanrobaeys, M.; Quinet, C.; Rouffaer, L.; Lens, L.; Martel, A.; Butaye, P. Prevalence of Mycoplasma gallisepticum and Mycoplasma synoviae in commercial poultry, racing pigeons and wild birds in Belgium. Avian Pathol. 2016, 45, 244–252. [Google Scholar] [CrossRef]
  63. Salam, M.A.; Al-Amin, M.Y.; Salam, M.T.; Pawar, J.S.; Akhter, N.; Rabaan, A.A.; Alqumber, M.A.A. Antimicrobial Resistance: A Growing Serious Threat for Global Public Health. Healthcare 2023, 11, 1946. [Google Scholar] [CrossRef] [PubMed]
  64. Maciel-Guerra, A.; Baker, M.; Hu, Y.; Wang, W.; Zhang, X.; Rong, J.; Zhang, Y.; Zhang, J.; Kaler, J.; Renney, D.; et al. Dissecting microbial communities and resistomes for interconnected humans, soil, and livestock. ISME J. 2023, 17, 21–35. [Google Scholar] [CrossRef] [PubMed]
  65. Wang, Y.; Lyu, N.; Liu, F.; Liu, W.J.; Bi, Y.; Zhang, Z.; Ma, S.; Cao, J.; Song, X.; Wang, A.; et al. More diversified antibiotic resistance genes in chickens and workers of the live poultry markets. Environ. Int. 2021, 153, 106534. [Google Scholar] [CrossRef] [PubMed]
  66. Xiong, W.; Wang, Y.; Sun, Y.; Ma, L.; Zeng, Q.; Jiang, X.; Li, A.; Zeng, Z.; Zhang, T. Antibiotic-mediated changes in the fecal microbiome of broiler chickens define the incidence of antibiotic resistance genes. Microbiome 2018, 6, 34. [Google Scholar] [CrossRef] [PubMed]
  67. Moore-Machacek, A.s.; Gloe, A.; O’Leary, N.; Reen, F.J. Efflux, Signaling and Warfare in a Polymicrobial World. Antibiotics 2023, 12, 731. [Google Scholar] [CrossRef] [PubMed]
  68. Harris, M.; Fasolino, T.; Ivankovic, D.; Davis, N.J.; Brownlee, N. Genetic Factors That Contribute to Antibiotic Resistance through Intrinsic and Acquired Bacterial Genes in Urinary Tract Infections. Microorganisms 2023, 11, 1407. [Google Scholar] [CrossRef] [PubMed]
  69. Joyce, A.; McCarthy, C.G.P.; Murphy, S.; Walsh, F. Antibiotic resistomes of healthy pig faecal metagenomes. Microb. Genom. 2019, 5, e000272. [Google Scholar] [CrossRef] [PubMed]
  70. Browne, N.; Traynor, A.; Horgan, K.A. Mannan rich fraction from yeast modulates inflammatory responses in intestinal cells (HT-29) exposed to Escherichia coli. J. Appl. Anim. Nutr. 2019, 7, e5. [Google Scholar] [CrossRef]
  71. Almansour, A.M.; Alhadlaq, M.A.; Alzahrani, K.O.; Mukhtar, L.E.; Alharbi, A.L.; Alajel, S.M. The Silent Threat: Antimicrobial-Resistant Pathogens in Food-Producing Animals and Their Impact on Public Health. Microorganisms 2023, 11, 2127. [Google Scholar] [CrossRef]
  72. Yang, J.; Tong, C.; Xiao, D.; Xie, L.; Zhao, R.; Huo, Z.; Tang, Z.; Hao, J.; Zeng, Z.; Xiong, W. Metagenomic Insights into Chicken Gut Antibiotic Resistomes and Microbiomes. Microbiol. Spectr. 2022, 10, e01907–e01921. [Google Scholar] [CrossRef] [PubMed]
  73. Sreejith, S.; Shajahan, S.; Prathiush, P.R.; Anjana, V.M.; Viswanathan, A.; Chandran, V.; Ajith Kumar, G.S.; Jayachandran, R.; Mathew, J.; Radhakrishnan, E.K. Healthy broilers disseminate antibiotic resistance in response to tetracycline input in feed concentrates. Microb. Pathog. 2020, 149, 104562. [Google Scholar] [CrossRef] [PubMed]
Figure 1. Impact of dietary supplementation on alpha diversity indices at Genus and Species level. Shannon H’ (A,C) and Simpson D (B,D) are shown for control and supplemented groups. Wilcoxon test group comparison p-values are shown.
Microorganisms 12 01562 g001
Figure 2. PCoA plot based on Bray–Curtis distance matrix at the genus level for control (blue) and supplemented (red) layers. Each point on the plot represents an individual sample.
Microorganisms 12 01562 g002
Figure 3. (ad) Relative abundances of microbial communities in the control (J.C1-12) and supplemented (J.T 1-12) caecum of laying hens at phylum (a), family (b), genus (c), and species (d) levels. The x-axis represents the sample name. The y-axis represents the relative proportion of bacterial species annotated to a certain type. The legend on the right is the species category corresponding to each colour block. Diet is represented by C1–C12 for control group samples and S1–S12 for supplementedgroup samples.
Microorganisms 12 01562 g003
Figure 4. Caecal bacterial genera significantly different with dietary supplementation. Horizontal bars represent the log2-fold change of relative abundance, as determined by a differential abundance analysis performed using Metastats analysis, relative to the control (Pfdr < 0.005). Only genera with statistically significant differences in abundance are displayed.
Microorganisms 12 01562 g004
Figure 5. Caecal bacterial species significantly different with dietary supplementation. Horizontal bars represent the log2-fold change of relative abundance, as determined by a differential abundance analysis performed using Metastats analysis, relative to the control (Pfdr < 0.005). Only genera with statistically significant differences in abundance were displayed.
Microorganisms 12 01562 g005
Figure 6. Distribution of linear discriminant analysis effect size results on the caecal microbiota of the control and supplemented laying hens. The LDA value distribution histogram shows the species whose LDA score is greater than the set value (the default setting is 4), that is, the biomarker with a significant difference between groups, and the length of the histogram represents the impact size of different species (i.e., LDA score).
Microorganisms 12 01562 g006
Figure 7. Caecal bacterial pathobionts significantly different with dietary MRF supplementation. Horizontal bars represent the log2-fold change of relative abundance as determined by a differential abundance analysis performed using Metastats analysis, relative to the control (Pfdr < 0.005). Only genera with statistically significant changes in abundance were displayed.
Microorganisms 12 01562 g007
Figure 8. PCoA plot based on Bray–Curtis distance matrix of antibiotic resistance gene abundance for control (blue) and MRF-supplemented (red) layers. Each point on the plot represents an individual sample.
Microorganisms 12 01562 g008
Figure 9. Histogram of the abundance of different AROs in each sample in control and MRF=supplemented layer caecal content. The relative abundance of all genes of ARO in each sample, in ppm, which is the result of enlarging the original relative abundance data by 106 times. Diet is represented by C1–C12 for control group samples and S1–S12 for supplemented group samples. Significantly fewer antibiotic resistance genes were detected in the caecal samples from the supplemented group (p < 0.001).
Microorganisms 12 01562 g009
Figure 10. Circos plots representing alignment of the proportion of different antibiotic resistance ontologies and microbial phyla. Species identification analysis of AROs in the control (a) and MRF-supplemented (b) groups The inner ring refers to the distribution of different antibiotic resistance ontologies in corresponding microbial phyla. The outer ring refers to the relative abundance of different phyla in each group.
Microorganisms 12 01562 g010
Figure 11. (a,b). Venn diagrams showing unique and shared genes of the core or accessory resistome for the control and supplemented groups.
Microorganisms 12 01562 g011
Figure 12. Spearman correlation analysis of abundant and significantly different taxa between the control and supplemented groups versus the abundant and significantly different antimicrobial resistance genes detected. The colour scale represents Spearman rho value rank correlations, with blue representing the strongest positive correlations. p-value legend: “***” ≤ 0.001, “**” ≤ 0.01, “*” ≤ 0.05.
Microorganisms 12 01562 g012
Figure 13. Individual taxon breakdown highlighting specific changes in relative abundance between the control and supplemented groups. Abbreviation “Ca.” represents “Candidatus”. The order of the boxplots corresponds to the order of taxa presented in Figure 12. p-value legend: “****” ≤ 0.0001, “***” ≤ 0.001, “**” ≤ 0.01, “*” ≤ 0.05, “ns” not significant.
Microorganisms 12 01562 g013
Figure 14. Spearman correlation analysis of abundant and significantly different taxa between control and supplemented groups versus themselves. The colour scale represents Spearman rho value rank correlations, with blue representing the strongest positive correlations. p-value legend: “***” ≤ 0.001, “**” ≤ 0.01, “*” ≤ 0.05.
Microorganisms 12 01562 g014
Table 1. Impact of supplementation on eggshell strength, egg grading, and performance.
W24W30W38W45W52W59W63W70W75W24-75
Eggshell strength (kg.f)Control5.495.09 a4.92 a4.51 a4.434.54 a3.96 a4.43.87 a4.55 a
Supplemented5.595.920 b5.24 b5.28 b4.885.13 b5.00 b4.524.33 b5.10 b
W20-29W30-39W40-49W50-59W60-69W70-76W20-76
ADFIControl 115.8127.3143.6146.4125.3133130.2
Supplemented117.6140.2133.2129.0123.5115.6127.2
MortalityControl0.0190.0440.0130.0890.2710.2670.063
Supplemented0.0190.0130.0320.0570.2210.2880.051
Second-grade eggsControl4.454.95 a5.95 a8.25 a10.2710.97 a6.51
Supplemented4.364.40 b5.16 b7.48 b8.8112.39 b6.05
Values represent medians and are compared at each timepoint; values in each column which have different letters (a, b) are significantly different (p < 0.05) and are emboldened.
Table 2. Differentially abundant antimicrobial resistance genes.
Drug ClassResistance MechanismARO NameControl Mean (%)Supplemented Mean (%)Log2 Fold ChangeControl GenomeSupplemented GenomePhylogenetic Association
fluoroquinolone antibiotic; cephalosporin; glycylcycline; penam; tetracycline antibiotic; rifamycin antibiotic; phenicol antibiotic; triclosanantibiotic target alteration; antibiotic effluxEscherichia_coli_soxR1.07 × 10−065.37 × 10−08−4.31 CoreAccProteobacteria
fluoroquinolone antibiotic; cephalosporin; glycylcycline; penam; tetracycline antibiotic; rifamycin antibiotic; phenicol antibiotic; triclosanantibiotic target alteration; antibiotic effluxEscherichia_coli_marR8.34 × 10−077.18 × 10−08−3.54 AccAccBacteria
macrolide antibioticantibiotic effluxmefC2.19 × 10−062.16 × 10−07−3.35 CoreAccBacteroidetes; Bacteroides coprophilus CAG:333
fluoroquinolone antibioticantibiotic effluxemrA8.90 × 10−078.90 × 10−08−3.32 AccAccProteobacteria
aminoglycoside antibioticantibiotic effluxkdpE8.52 × 10−078.74 × 10−08−3.28 AccAccProteobacteria
aminoglycoside antibiotic; aminocoumarin antibioticantibiotic effluxbaeS7.56 × 10−078.62 × 10−08−3.13 CoreAccProteobacteria
fluoroquinolone antibiotic; monobactam; carbapenem; cephalosporin; glycylcycline; cephamycin; penam; tetracycline antibiotic; rifamycin antibiotic; phenicol antibiotic; triclosan; penemantibiotic target alteration; antibiotic efflux; reduced permeability to antibioticEscherichia_coli_soxS1.16 × 10−061.33 × 10−07−3.12 AccAccBacteria
monobactam; carbapenem; cephalosporin; cephamycin; penamantibiotic target alterationHaemophilus_influenzae_PBP36.65 × 10−077.67 × 10−08−3.12 AccAccProteobacteria
peptide antibioticantibiotic effluxYojI7.57 × 10−078.96 × 10−08−3.08 CoreAccProteobacteria
fluoroquinolone antibiotic; cephalosporin; glycylcycline; penam; tetracycline antibiotic; rifamycin antibiotic; phenicol antibiotic; triclosanantibiotic effluxacrB8.20 × 10−071.02 × 10−07−3.01 Core AccProteobacteria; Enterobacteriaceae
macrolide antibiotic; fluoroquinolone antibiotic; cephalosporin; cephamycin; penam; tetracycline antibioticantibiotic effluxH-NS1.02 × 10−061.27 × 10−07−3.00 AccAccProteobacteria
fluoroquinolone antibioticantibiotic effluxmdtH7.05 × 10−078.90 × 10−08−2.99 AccAccProteobacteria
macrolide antibiotic; fluoroquinolone antibiotic; penam; tetracycline antibioticantibiotic effluxevgS5.90 × 10−077.55 × 10−08−2.96 CoreAccProteobacteria; Enterobacteriaceae
phenicol antibioticantibiotic effluxemrD9.01 × 10−071.19 × 10−07−2.92 CoreAccProteobacteria
aminocoumarin antibioticantibiotic effluxmdtB9.06 × 10−071.21 × 10−07−2.90 CoreAccProteobacteria; Enterobacteriaceae
tetracycline antibiotic; benzalkonium chloride; rhodamineantibiotic effluxEscherichia_coli_mdfA5.75 × 10−078.33 × 10−08−2.79 CoreAccBacteria
macrolide antibiotic; fluoroquinolone antibiotic; penamantibiotic effluxmdtE9.49 × 10−071.39 × 10−07−2.77 AccAccProteobacteria
tetracycline antibioticantibiotic effluxemrK5.73 × 10−079.31 × 10−08−2.62 AccAccProteobacteria
fosfomycinantibiotic target alterationEscherichia_coli_GlpT8.14 × 10−071.36 × 10−07−2.58 AccAccProteobacteria
cephalosporin; penamantibiotic inactivationEscherichia_coli_ampC9.61 × 10−071.61 × 10−07−2.58 AccAccProteobacteria/Enterobacteriaceae; Escherichia
peptide antibioticantibiotic target alterationbacA7.34 × 10−071.26 × 10−07−2.54 AccAccProteobacteria
fosfomycinantibiotic effluxmdtG1.05 × 10−061.90 × 10−07−2.47 CoreNDProteobacteria/Enterobacteriaceae; Escherichia
peptide antibioticantibiotic target alterationPmrF1.13 × 10−062.07 × 10−07−2.44 CoreAccProteobacteria
fluoroquinolone antibioticantibiotic effluxpatA9.10 × 10−071.74 × 10−07−2.39 CoreAccProteobacteria/Firmicutes
nucleoside antibiotic; acridine dyeantibiotic effluxmdtN8.21 × 10−071.59 × 10−07−2.37 CoreAccBacteria
aminocoumarin antibioticantibiotic effluxmdtC1.32 × 10−062.84 × 10−07−2.22 CoreAccProteobacteria; Enterobacteriaceae
fluoroquinolone antibiotic; cephalosporin; cephamycin; penamantibiotic effluxAcrF1.63 × 10−063.82 × 10−07−2.10 CoreAccProteobacteria; Enterobacteriaceae
tetracycline antibioticantibiotic effluxtetL3.40 × 10−068.65 × 10−07−1.98 CoreCoreBacteria
tetracycline antibioticantibiotic effluxtetK7.68 × 10−062.25 × 10−06−1.77 CoreCoreBacteroidetes; Bacteroides
tetracycline antibioticantibiotic effluxtet401.00 × 10−053.71 × 10−06−1.43 CoreCoreFirmicutes; Clostridiales
tetracycline antibioticantibiotic target protectiontetBP1.70 × 10−066.73 × 10−07−1.34 CoreCoreBacteria
tetracycline antibioticantibiotic target protectiontet448.11 × 10−053.34 × 10−05−1.28 CoreCoreBacteroidetes; Bacteroides
fluoroquinolone antibioticantibiotic effluxpmrA1.02 × 10−054.33 × 10−06−1.24 CoreCoreBacteroidetes; Bacteroides
tetracycline antibioticantibiotic target protectiontetO1.88 × 10−058.25 × 10−06−1.19 CoreCoreBacteria
tetracycline antibioticantibiotic target protectiontetW/N/W2.26 × 10−041.57 × 10−04−0.52 CoreCoreBacteria
cephalosporin; penamantibiotic inactivationOXA-74.71 × 10−071.03 × 10−061.13 AccCoreBacteroidetes; Bacteroides
macrolide antibiotic; lincosamide antibioticantibiotic target alterationRlmAII1.77 × 10−077.68 × 10−072.12 AccCoreBacteroidetes; Prevotella bryantii
monobactam; carbapenem; cephalosporin; cephamycin; penam; penemantibiotic inactivationGIM-23.25 × 10−070.00 × 10+00DepletedAccNDUnknown
cephalosporin; penamantibiotic inactivationOXA-1367.55 × 10−070.00 × 10+00DepletedAccNDSpirochaetes; Brachyspira pilosicoli
cephalosporin; penamantibiotic inactivationOXA-2441.58 × 10−070.00 × 10+00DepletedAccNDUnknown
monobactam; cephalosporin; penam; penemantibiotic inactivationTEM-1271.48 × 10−070.00 × 10+00DepletedAccNDBacteria
monobactam; cephalosporin; penam; penemantibiotic inactivationTEM-2191.39 × 10−070.00 × 10+00DepletedAccNDEnterobacteriaceae
streptogramin antibiotic; pleuromutilin antibioticantibiotic effluxvgaC8.45 × 10−070.00 × 10+00DepletedAccNDProteobacteria; Enterobacteriaceae
aminoglycoside antibioticantibiotic inactivationAAC6-Ii0.00 × 10+003.06 × 10−07DetectedAccAccUnknown
carbapenem; cephalosporin; cephamycin; penamantibiotic inactivationACT-300.00 × 10+004.95 × 10−07DetectedNDAccUnknown
aminoglycoside antibioticantibiotic inactivationAPH3-IVa0.00 × 10+006.40 × 10−08DetectedNDAccUnknown
penamantibiotic inactivationCARB-30.00 × 10+001.55 × 10−07DetectedNDAccUnknown
tetracycline antibioticantibiotic effluxtcr30.00 × 10+001.33 × 10−07DetectedNDAccRuminococcaceae
streptogramin antibioticantibiotic inactivationvgbC0.00 × 10+002.40 × 10−07DetectedNDAccRuminococcaceae
Genes are shown alongside their mean relative abundance per treatment group, their drug class, resistance mechanism, and phylogenetic associations, and their association with core or accessory (acc) genomes is shown.
Disclaimer/Publisher’s Note: The statements, opinions and data contained in all publications are solely those of the individual author(s) and contributor(s) and not of MDPI and/or the editor(s). MDPI and/or the editor(s) disclaim responsibility for any injury to people or property resulting from any ideas, methods, instructions or products referred to in the content.

