Article

Microbial Diversity of Soil in a Mediterranean Biodiversity Hotspot: Parque Nacional La Campana, Chile

by
Carolina Quinteros-Urquieta
1,
Jean-Pierre Francois
2,3,
Polette Aguilar-Muñoz
2,3,4,
Roberto Orellana
2,3,
Rodrigo Villaseñor
3,
Andres Moreira-Muñoz
5 and
Verónica Molina
2,3,4,*
1
Programa de Doctorado Interdisciplinario en Ciencias Ambientales, Universidad de Playa Ancha, Valparaíso 2340000, Chile
2
Departamento de Ciencias y Geografía, Universidad de Playa Ancha, Valparaíso 2340000, Chile
3
HUB AMBIENTAL UPLA, Universidad de Playa Ancha, Valparaíso 2340000, Chile
4
Centro de Investigación Oceanográfica COPAS COASTAL, Universidad de Concepción, Concepción 4070386, Chile
5
Instituto de Geografía, Pontificia Universidad Católica de Valparaíso, Valparaíso 2362807, Chile
*
Author to whom correspondence should be addressed.
Microorganisms 2024, 12(8), 1569; https://doi.org/10.3390/microorganisms12081569
Submission received: 12 June 2024 / Revised: 22 July 2024 / Accepted: 25 July 2024 / Published: 31 July 2024
(This article belongs to the Special Issue Advances in Soil Microbial Ecology)

Abstract

:
Parque Nacional La Campana (PNLC) is recognized worldwide for its flora and fauna, rather than for its microbial richness. Our goal was to characterize the structure and composition of microbial communities (bacteria, archaea and fungi) and their relationship with the plant communities typical of PNLC, such as sclerophyllous forest, xerophytic shrubland, hygrophilous forest and dry sclerophyllous forest, distributed along topoclimatic variables, namely, exposure, elevation and slope. The plant ecosystems, the physical and chemical properties of organic matter and the soil microbial composition were characterized by massive sequencing (iTag-16S rRNA, V4 and ITS1-5F) from the DNA extracted from the soil surface (5 cm, n = 16). A contribution of environmental variables, particularly related to each location, is observed. Proteobacteria (35.43%), Actinobacteria (32.86%), Acidobacteria (10.07%), Ascomycota (76.11%) and Basidiomycota (15.62%) were the dominant phyla. The beta diversity (~80% in its axes) indicates that bacteria and archaea are linked to their plant categories, where the xerophytic shrub stands out with the most particular microbial community. More specifically, Crenarchaeote, Humicola and Mortierella were dominant in the sclerophyllous forest; Chloroflexi, Cyanobacteria and Alternaria in the xerophytic shrubland; Solicoccozyma in the dry sclerophyllous forest; and Cladophialophora in the hygrophilous forest. In conclusion, the structure and composition of the microbial consortia is characteristic of PNLC’s vegetation, related to its topoclimatic variables, which suggests a strong association within the soil microbiome.

1. Introduction

There is a close relationship between vegetation landscape and soil microbiome structures [1]. The co-occurrence of changes both in the plant community and soil microbiome composition and structure, along environmental gradients, suggest common associations or mechanisms between landscape function and morphology [2]. The soil is composed of extraordinarily diverse microbial communities [3], including different domains of life, both eukaryote (i.e., algae, fungi, protozoa) as well as prokaryote (i.e., bacteria and archaea) [4], the structure of which is associated with changes in environmental properties [5]. Among these properties, abiotic factors, such as pH, nitrogen availability [6], soil organic carbon content [7], temperature [8], redox condition [9] and also the physical soil structure, stand out [10]. Conversely, interactions, competition and predation by viruses and other grazers, besides plant communities, are biotic factors that influence the soil microbiome [5]. Additionally, there are hotspots characterized by an increased (heterotrophic or autotrophic) metabolic activity associated with the availability of built-up particulate organic matter [11], such as animal manure [12] or the rhizosphere [13]. The integration of this information can help us better understand the ecosystem’s functioning, not only regarding the soil as a natural habitat of microbial communities, but also regarding the way in which it influences the composition of the flora and fauna inhabiting such areas.
In Chile, studies on soil microorganisms provide relevant information on aspects such as vegetation productivity and fungal activity, mainly in the Crop–Livestock–Forestry area [14,15,16]. Other studies address prokaryote (i.e., bacteria and archaea) adaption and evolution processes in extreme environments [17,18], whether living freely [19] or associated with other organisms [20]. Research on ecosystems with different environments and climates, fluctuating between arid and temperate, represent significant changes in the soil microbiome related to environmental variables varying across the spatial scale [21,22]. Finally, changes in the microbial communities’ structure involved in pedogenic processes indicate clear upward (Proteobacteria, Acidobacteria, Chloroflexi, Verrucomicrobia and Planctomycetes) and downward (Actinobacteria and Gemmatimonadetes) trends of complete phyla along the north–south bioclimatic gradient [23]. These variations are partly the result of the relationship between climate and environmental factors (e.g., pH, plant-available P, organic matter, apparent density and clay %) and are strongly related to vegetation structure and composition. Thus, while an increased abundance of the so-called pioneer bacteria associated with pedogenic processes was observed in arid climates, an increased abundance of bacteria specialized in recycling organic compounds as a source of plant nutrients and soil stabilization was observed in arid and humid climates, which accounts for the impact of climate and slope on the microbial communities’ composition and structure [23].
The biodiversity hotspot, a term mainly used in conservation studies, is addressed from different biological criteria, such as endemism, which highlights its delimited distribution zones [24], species richness and the presence of rare species and their corresponding threat level [25], following the principles of vulnerability and irreplaceability in conservation planning. In this context, the definition based on the endemism criteria [24] for the biodiversity hotspot in Central Chile [26,27,28] is used. This region spans 40% of continental Chile, and the percentage of endemic vascular plants is similar to that of the California Floristic Province hotspot [29]. The aim of this study was to examine the composition and structure of microbial communities of diverse dominions of life (bacteria, archaea and fungi), in the soil of a representative area known as the biodiversity hotspot of Central Chile: Parque Nacional la Campana [26,27,30].
In particular, from the toposequence approach, we anticipate that the soil microbial community structure will be associated with sunlight exposure and elevation gradients with a higher diversity in the dry sclerophyllous forest and hygrophilous forest compared with xerophytic shrubland, with distinctive rare bacteria and archaea at the phyla level (<0.1%) and specific fungi. Consequently, high biodiversity at the bulk soil scale and its potential implications for the processes and functions associated with the vegetation landscape would be evident.

2. Materials and Methods
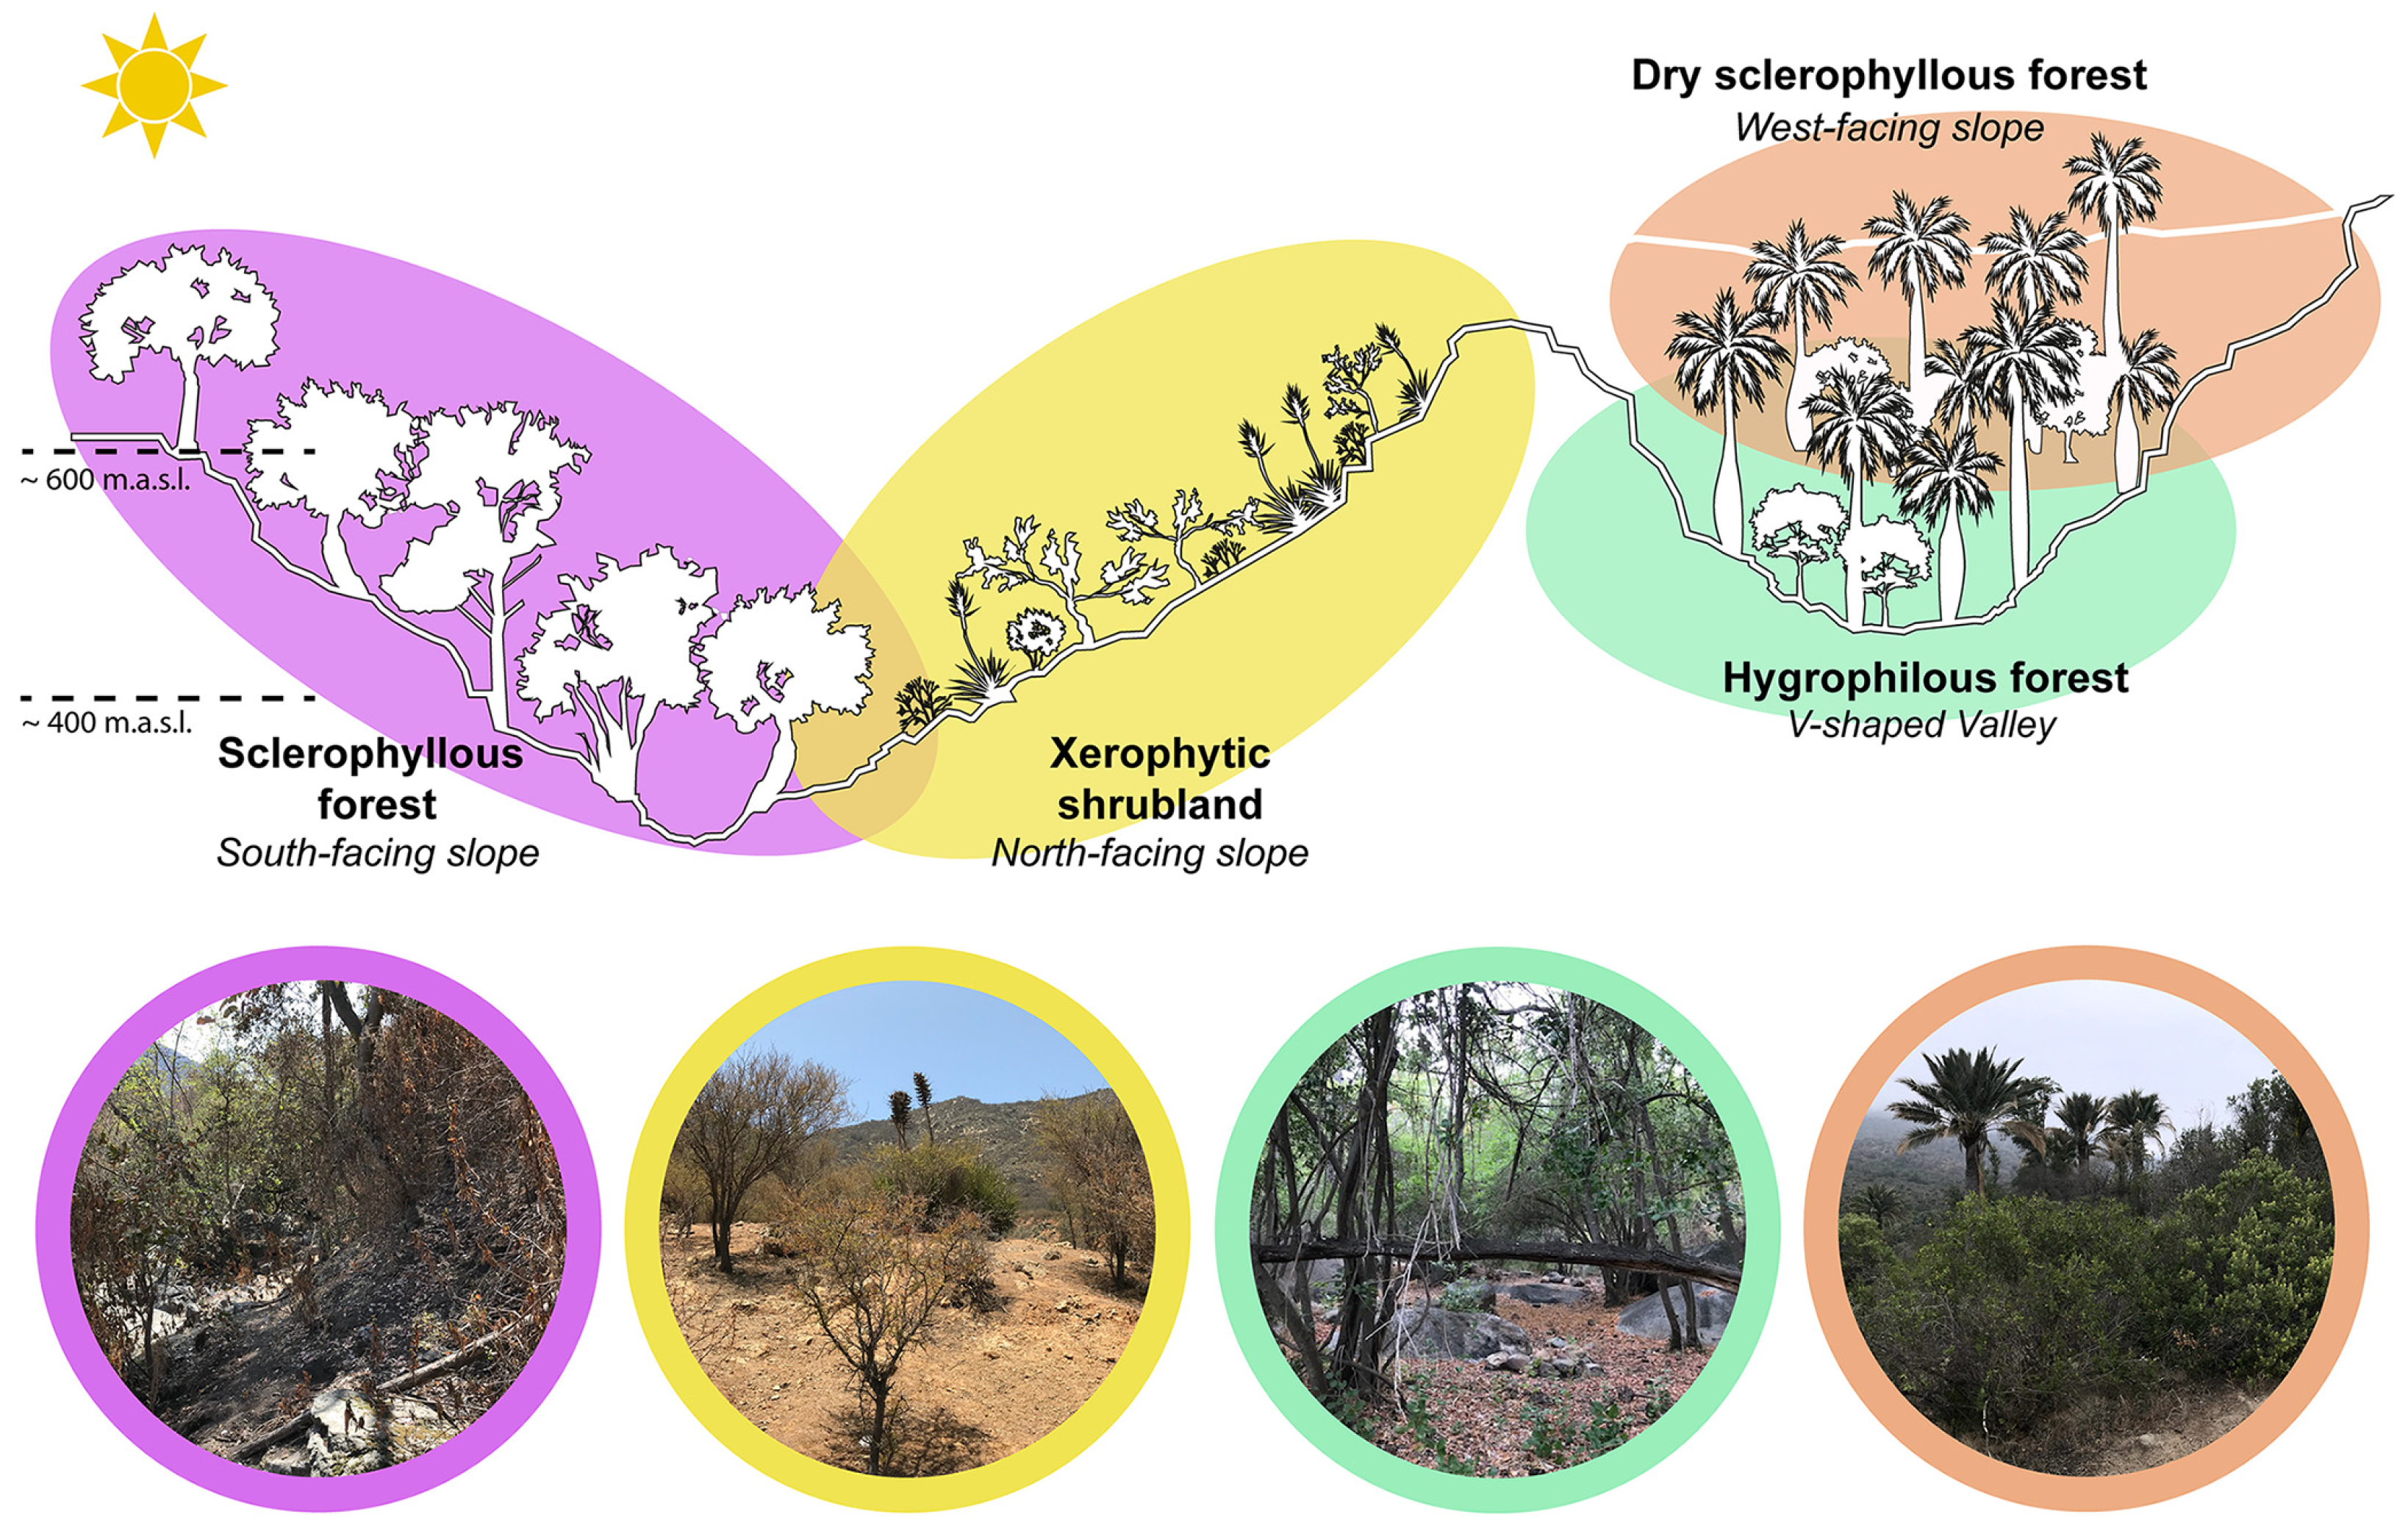
2.1. Study Area

Parque Nacional La Campana (La Campana National Park) (PNLC), located in the Valparaíso region (32°55′–33°01′ S; 71°09′–71°01′ O) (Figure 1), was established as National Park in 1967 and as a National Biosphere Reserve in 1987 [31] as it stands out due to its good ecosystem conservation. The park, in the Coastal Cordillera of Central Chile, covers an area over 8000 ha and includes foothills, such as Cerro La Campana (1828 masl), which favors the development of topoclimatic conditions (e.g., elevation, slope, orientation, sunlight exposure, etc.) that enable the coexistence of ecosystems characteristic of the biodiversity hotspot of Central Chile [32]. Among them, the development of xerophytic and sclerophyllous shrubland and relict palm and oak forests with significant biogeographic relevance stands out [30,33].
PNLC has a Mediterranean climate with mean annual temperatures of 18 °C, and a rainy (480 mm per year) and mild winter which contrasts with a hot and dry summer [34]. Vegetation responds to the climate by developing sclerophyllous plant communities [35] and with a significant number of native and endemic species [36], subject to the particular topoclimatic and edaphic conditions [37]. Hence, hygrophilous communities are found in the valley floor forming peumo (Cryptocaria alba) and boldo (Peumus boldus) forests or swamp forests of myrtaceas (Luma chequen) and canelo (Drymis winteri). Sclerophyllous communities, which vary depending on the slope exposure and insolation, develop in average elevations (400–1100 masl). Thus, while quillay (Quillaja saponaria) and litre (Lithraea caustica) forests grow under the conditions of the sclerophyllous forests found in the south-facing slopes, plant communities characteristic of xerophytic shrubland, such as matorral de trevo (Retanilla trinervia) and succulents, are found on the north-facing slopes. In addition, there is a strong presence of Chilean palm trees (Juabea chilensis), which are part of various plant communities [38,39] in the northern sector of the PNLC [25,34]. Finally, subalpine communities characterized by oak forests (Nothofagus macrocarpa) and neneo (Mulinum spinosum) shrublands are found in sectors at higher elevations (1100–2000 masl) [37,38,39].
Figure 1. Map that shows PNLC sampling locations (1, 2, 3, 4). Vegetation map, adapted from Hauck et al. [38].
Microorganisms 12 01569 g001
These plant communities present in PNLC also grow in soils with different physicochemical characteristics. For instance, the soil in the areas where xerophytic formation prevails has a pH and TOC (total organic carbon content) (6.0 and 3.1%) values different to those where the sclerophyllous forest (5.7 and 18.7%) formations develop [22]. Additionally, edaphic microbial communities, which have a fundamental role in contributing to nutrient recycling and plant growth through a symbiotic relationship with mycorrhizal fungi, are within the least studied soil components in Cordillera de la Costa [5].

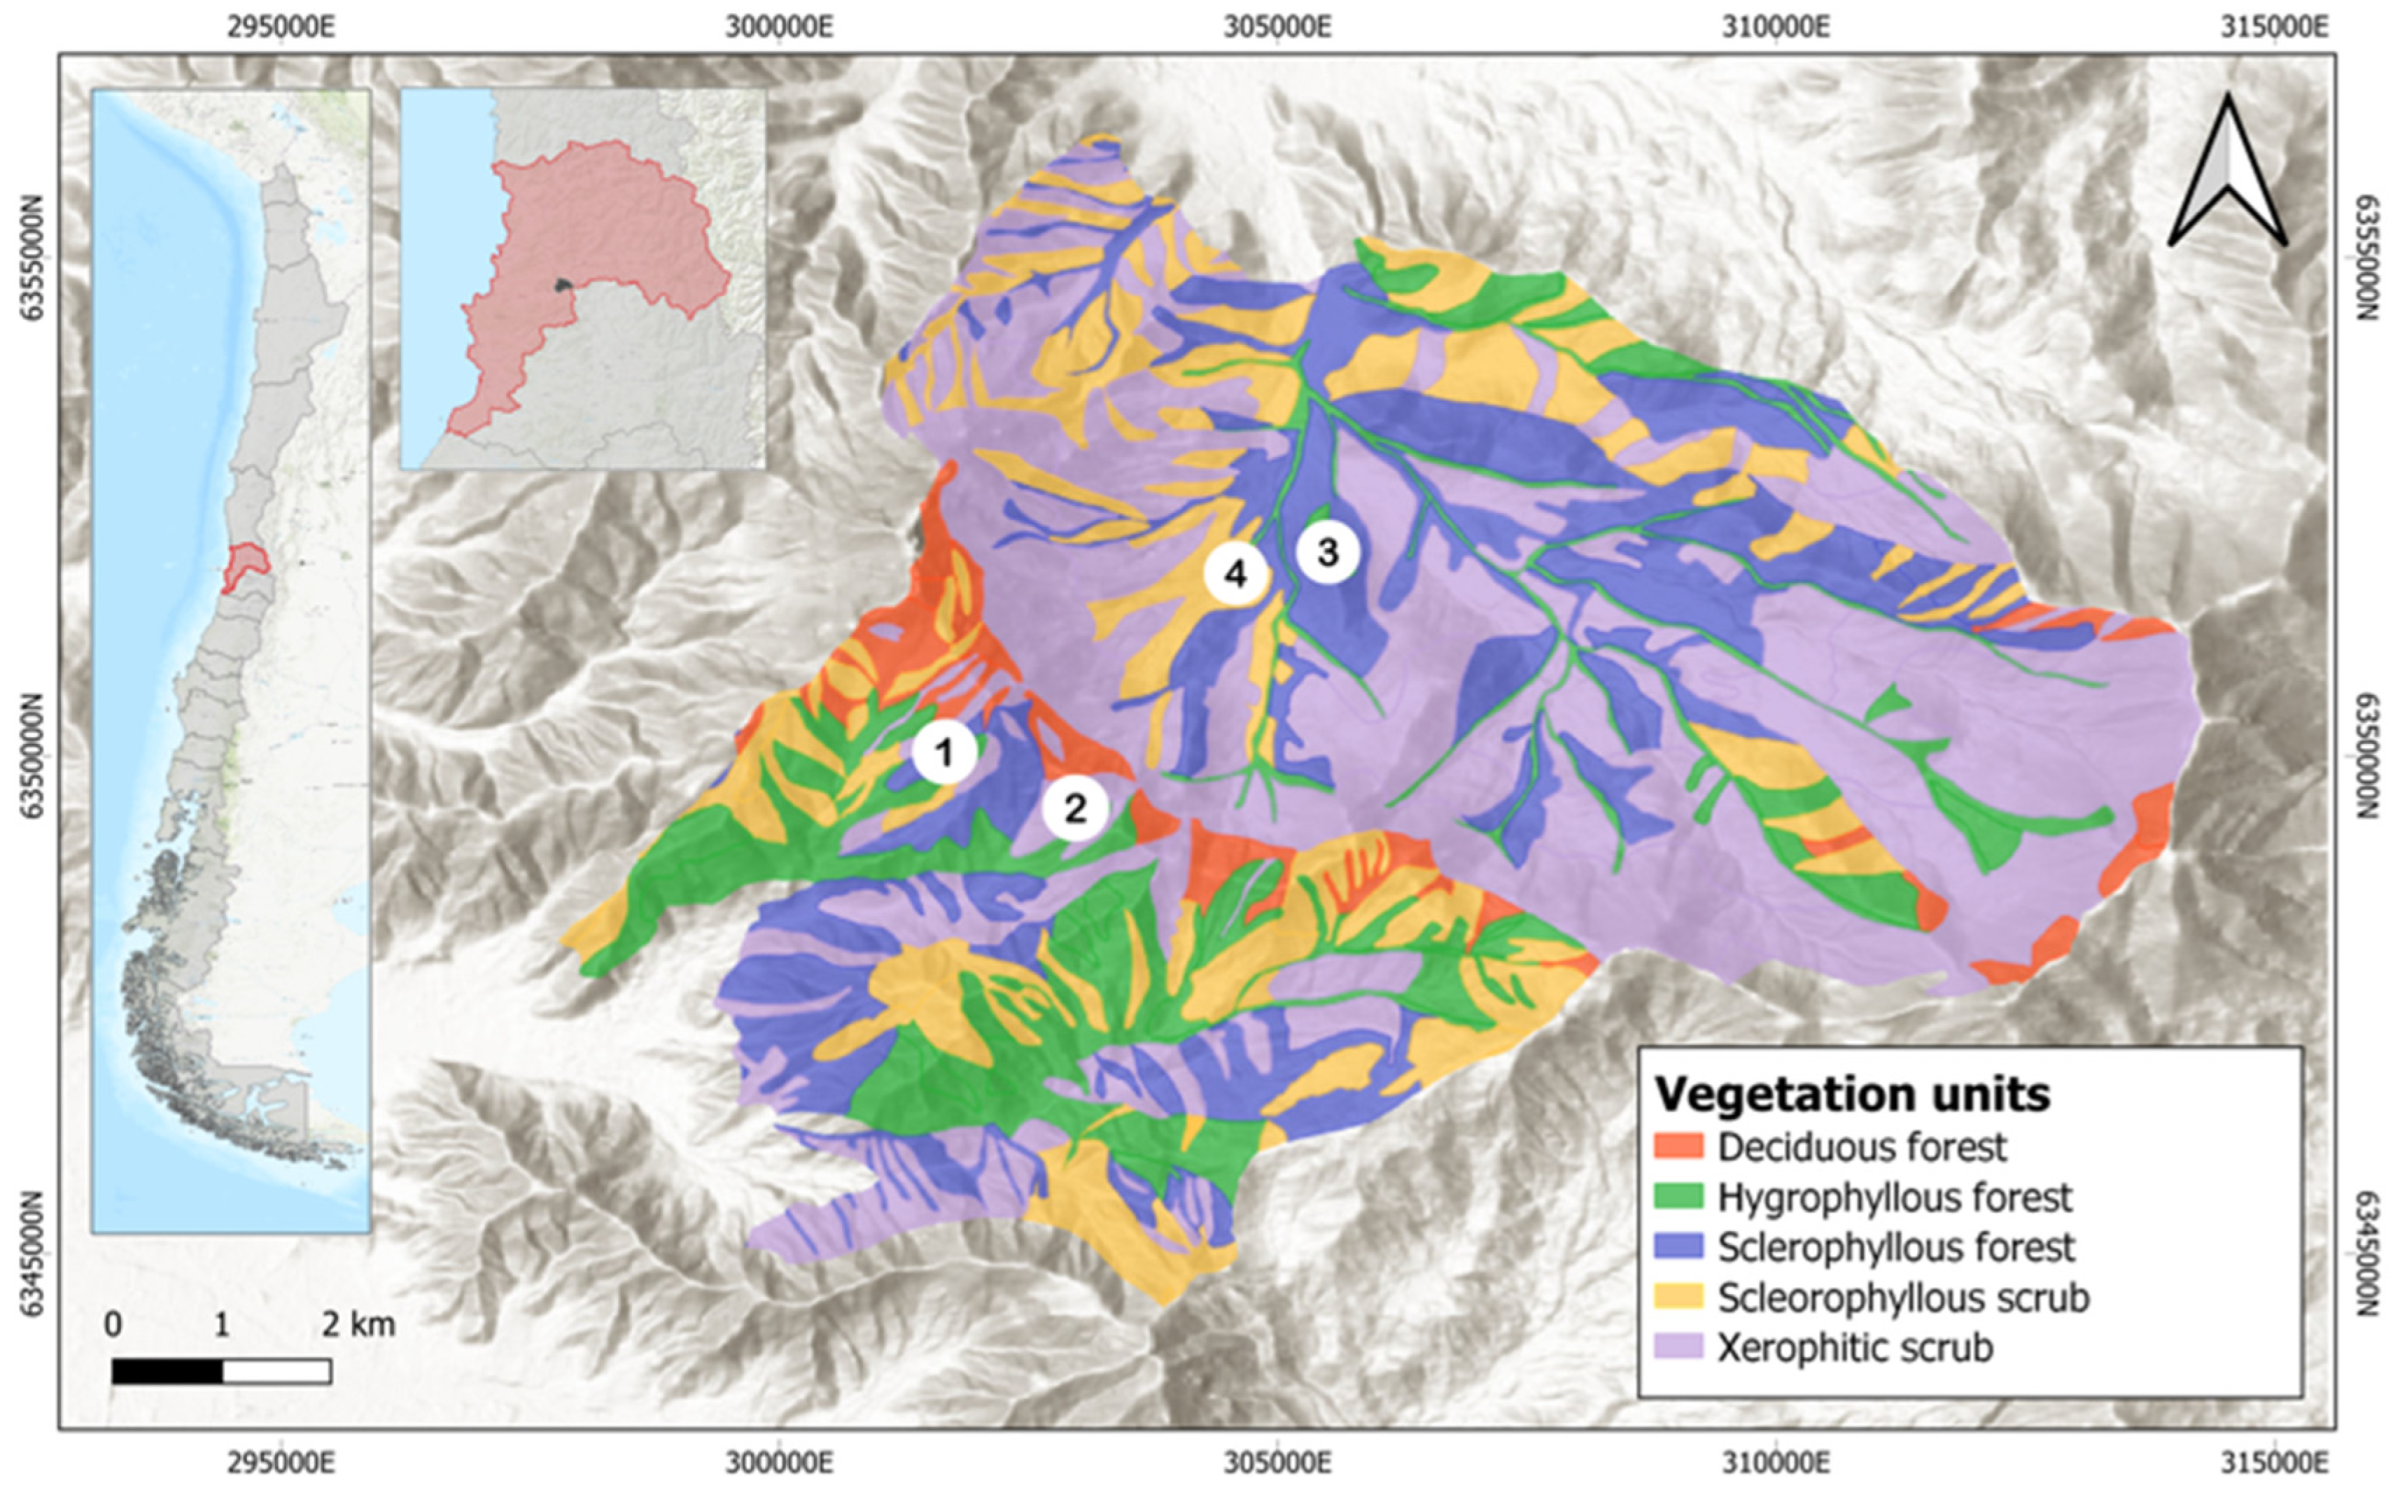
2.2. Study Sites and Sample Collection

The study sites (Figure 1) were selected on the basis of the relief and vegetation characteristics, and four sample sites, corresponding to plant communities, were established: (i) sclerophyllous forest on the southern slope, (ii) xerophytic shrubland on the north-facing slope, (iii) hygrophilous forest of Drimys winteris [38] and the presence of Jubaea chilensis at the bottom of the ravine and (iv) dry sclerophyllous forest on the west slope (Figure 2).
The sites were visited for two consecutive years in the austral summer (January 2020, Cajón Grande sector, and February 2021, Palmas de Ocoa sector), and the geographic coordinates, altitude, slope, orientation and type of dominant plant community were registered for both of the sites (Figure 2, Table 1). In the latter case, an analysis of the plant species composition and cover of each sampling site was conducted by way of the standard phytosociological methodology [40]. To do this, a plant census of each study site was carried out in 10 × 10 m2 plots, and a list of the species present and an estimate of the relative abundance of the number of individuals coverage per plot was recorded. For cover values of less than 1%, the signs “+” and “r” (cross and r) were used; the former when various individuals of the species in question were found, and the latter when there was just one [41,42]. The results were expressed as a percentage of the herb, shrub and tree layer cover. A census of species such as peumo (Cryptocarya alba), boldo (Peumus boldus), quillay (Quillaja saponaria) and palito negro (Adiantum chilense), among others, with closed forest aspect and the presence of litre (Lithraea caustica) in the surroundings, was conducted in the sclerophyllous forest. Species such as litre (Lithraea caustica), trevo (Retanilla trinervia), espino (Acacia caven) and puya (Puya chilensis), of the thorny type were observed in the xerophytic shrubland. Boldo (Peumus boldus), quillay (Quillaja saponaria) and litre (Lithraea caustica) were found in nearby areas. A census of canelo (Drimys winteri) and Chilean palm tree (Jubaea chilensis) forest, among others, with closed forest aspect, was conducted in the hygrophilous forest. A census of species of Chilean palm trees (Jubaea chilensis), litre (Lithraea caustica), colliguay (Colliguaja odorífera) and bollén (Kageneckia oblonga) was conducted in the dry sclerophyllous forest. The latter four species are characteristic of shrub-like dry sclerophyllous forest [37]. Palito negro (Adiantum chilense) growing along the censused hillside was observed.
Soil surface samples (5 cm) were collected at random within 10 × 10 m2 plots [2]. Sterile Falcon tubes and gloves were used to prevent the contamination of the samples. A total of 4 representative samples (i.e., plots) were taken from each site (Table 1). After the samples were collected, they were transported to the laboratory in cold gel packs, then they were homogenized and subdivided for analysis; part of the samples was stored at 4 °C for physicochemical analysis (pH, LOI) and the remaining part was stored in cryotubes, in an RNAlater solution [2], at −20 °C for isotopic and molecular analysis.

2.3. Climate Variables in PNLC

Climate variables (e.g., mean annual temperature, annual precipitation, etc.), associated with the sampling sites were obtained from 2 complementary databases. The first one, the WorldCLim 2.1 database [43], contains average values gridded data for the period of 1970–2000 from 1 km2; the second one corresponds to the CR2 gridded data [44], with a spatial resolution of 5 km2, for the period of 1979–2016. Thus, and using the SIG ArcGis platform, version 9.3, and Global Mapper for each sampling point, an average value of the applied climate variables was obtained (Figure 1, Table 1). Supplementary Table S1 shows all the measured data.

2.4. Soil and Organic Matter Physicochemical Analysis

In order to determine soil parameters, such as pH, dry density, organic content, C/N ratio, and δ15N δ13C isotope values, subsamples representative of each site were analyzed. The dry density and moisture content were determined using the LOI method, drying the samples at 105 °C for 24 h [45]. The soil pH was determined following the INIA-recommended process [46], consisting of resuspending 20 g of dry soil in 50 mL of water, using a magnetic stirrer at a controlled temperature of 23 °C for 5 min and then allowing it to settle for 3 h. The pH was measured with a Thermo Scientific Orion Star A215 X11399 multiparametric meter (Thermo Fisher Scientific, Waltham, MA, USA) and pH electrode Thermo Scientific, Series VZ1-15288 (Thermo Fisher Scientific). The soil organic matter composition was determined by analyzing samples of 50 mg through an Isotope Ratio Mass Spectrometer, IRMS, at the Laboratory of Biogeochemistry and Applied Stable Isotopes of the Pontificia Universidad de Chile (LABASI). The results are shown in relation to the δ15N vs. air and δ13C vs. VPDB value.

2.5. DNA Extraction and Sequencing of Prokaryote and Fungal Phylogenetic Markers

The microbial composition was determined by first extracting the total genomic DNA from 250 mg of the soil using the MoBio PowerSoil® DNA isolation kit (MO BIO Laboratories, Inc., Carlsbad, CA, USA), following the manufacture’s protocol. Subsequently, DNA quantification was performed using the Qubit fluorometer (Thermo Fisher Scientific), and its amplification was verified by conventional PCR. The variable V4 region of the 16S rRNA gene was sequenced through high-throughput sequencing using primers 515F (GTGCCAGCMGCCGCGGTAA) and 806R (GGACTACHVGGGTWTCTAAT) [47] for bacteria and archaea and with region ITS1-5F, with primers ITS5-1737F (GGAAGTAAAAGTCGTAACAAGG) and ITS2-2043R (GCTGCGTTCTTCATCGATGC) for fungi [48]. This was performed using the NovaSeq PE250 sequencing platform (Novogene Biology Information Technology Co., Ltd., Beijing, China). The sequences were entered into the ENA PRJEB56868 database.

2.6. Analysis of Microbial Composition and Other Statistic Data

Paired-end sequences were imported and aligned from the “manifiest Fastq” format using QIIME2 2021.4 [47]. The sequences were subjected to quality filtering and chimera checking, leaving prokaryotes with a length between 206 and 312 bp and fungi with a length between 218 and 424 bp, using the QIIME2 DADA2 denoise-paired plugin [49] (see Supplementary Table S2). Then, microorganism sequences in amplicon sequence variants (ASV) [50] were classified using the Greengenes database version 13_8 at 99% [51] of the 515F/806R sequence region and the UNITE QIIME database release for fungi for ITS regions with a threshold at 99% [52,53].
The microbial community was analyzed in RStudio v4.2.2 software using a ‘phyloseq’ package [54]. First, the libraries were rarefied using the rarefy_even_depth function, and the alpha diversity indices (richness, Shannon index, Pielou’s evenness index) were determined with the estimate_richness and evenness functions. Venn diagrams were drawn using the get_vennlist function of the ‘MicrobiotaProcess’ package at the ASVs level [55] to identify the microbial community composition. Changes in the microbial community at the phylum level were analyzed using the amp_heatmap and amp_boxplot functions of the ‘ampvis2’ package [56].
In order to identify differences in the microbial community structures among the study sites, the Bray–Curtis distance was estimated, and its variation was analyzed by Principal Coordinate Analysis (PCoA) using the ordinate function of the ‘phyloseq’ package. Likewise, the level of association between environmental factors and changes in the microbial community (at the phylum level) was determined using the envfit function in the ‘vegan’ package and was graphed on the PCoA. A differential analysis using the ASV was performed with the ‘DESeq2’ package [57], from non-normalized libraries, to determine the microorganisms that varied significantly between the sites. The potential functions associated with the ASVs present in the different samples were determined by using the trans_func function of the ‘microeco’ package [58], by specifying the FAPROTAX database [59] for prokaryotes and FUNGuild [60] for fungi. The results were plotted using the plot_spe_func_perc function of the same package.
A redundancy analysis (RDA) was carried out on environmental variables, and accomplished with the rda function of the ‘vegan’ package [61]. The differences between environmental parameters and alpha diversity in the sites were analyzed using a One-Way Analysis of Variance (ANOVA) followed by a post hoc (Tukey’s HSD) test, ensuring that the ANOVA assumptions (Shapiro test of normality and Levene’s test of homoscedasticity) were complied with; otherwise, a non-parametric Kruskal–Wallis test was performed, using the functions aov and TukeyHSD included in the ‘stats’ package.

3. Results

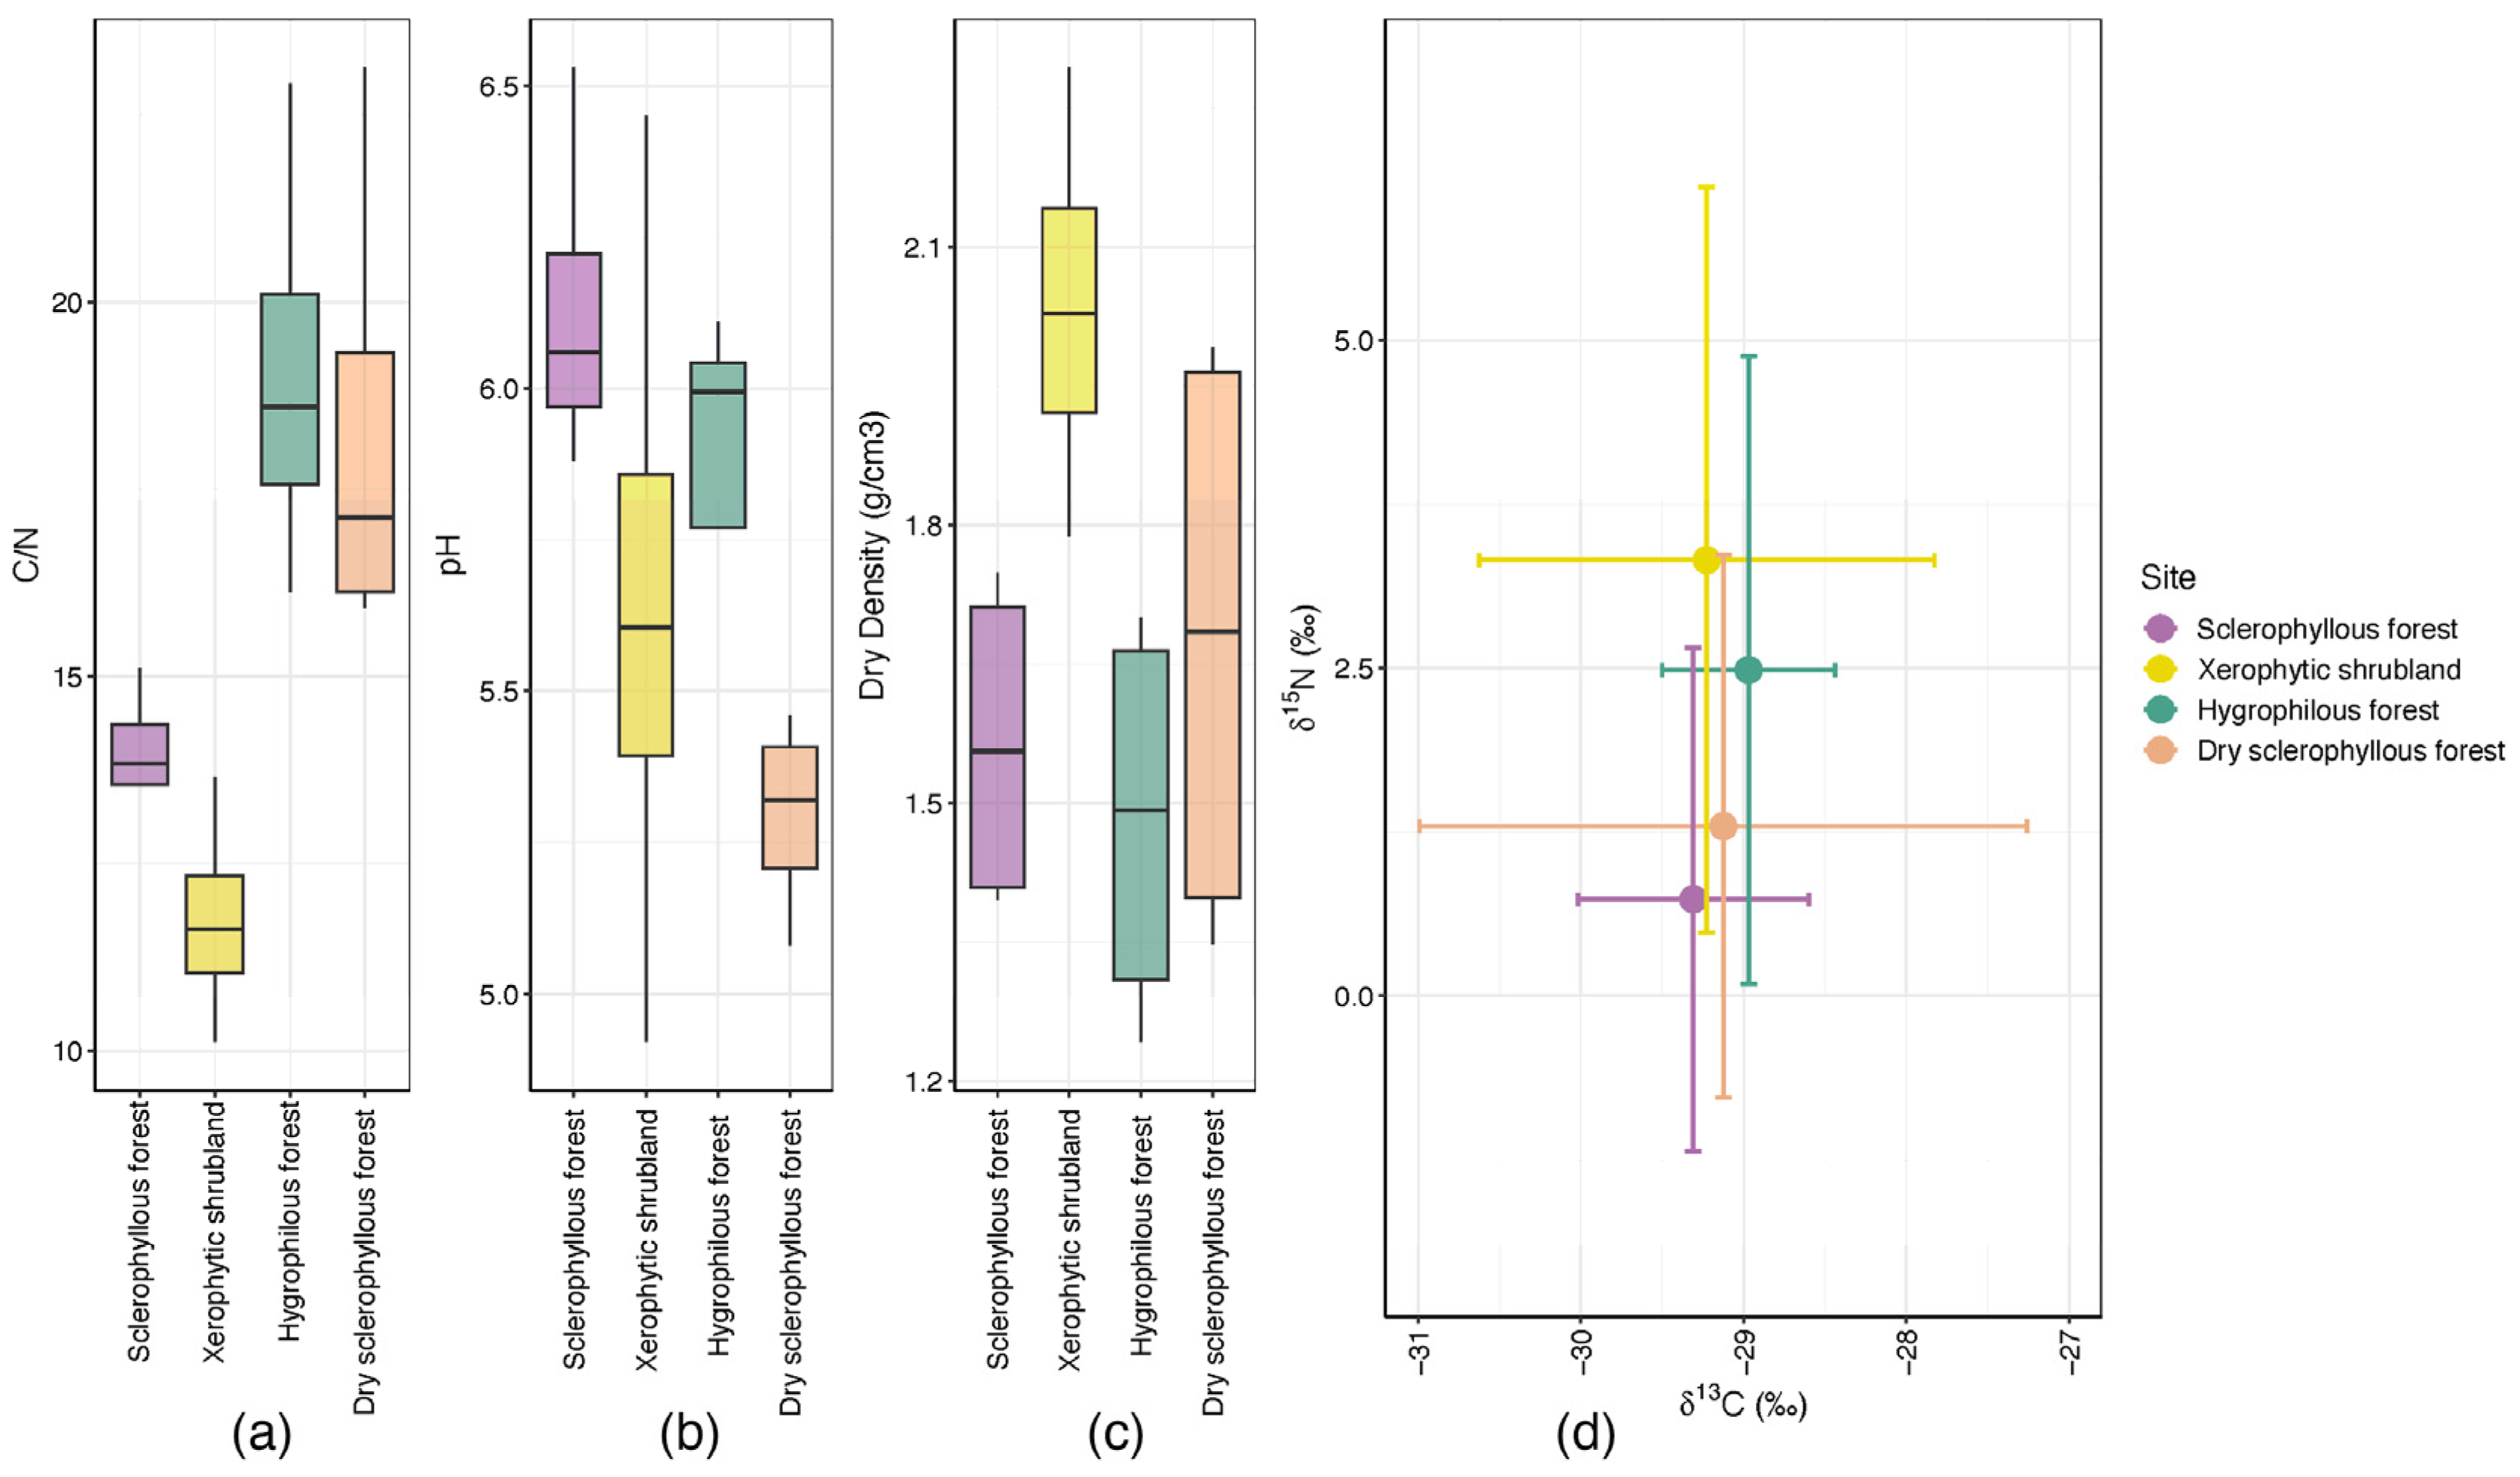
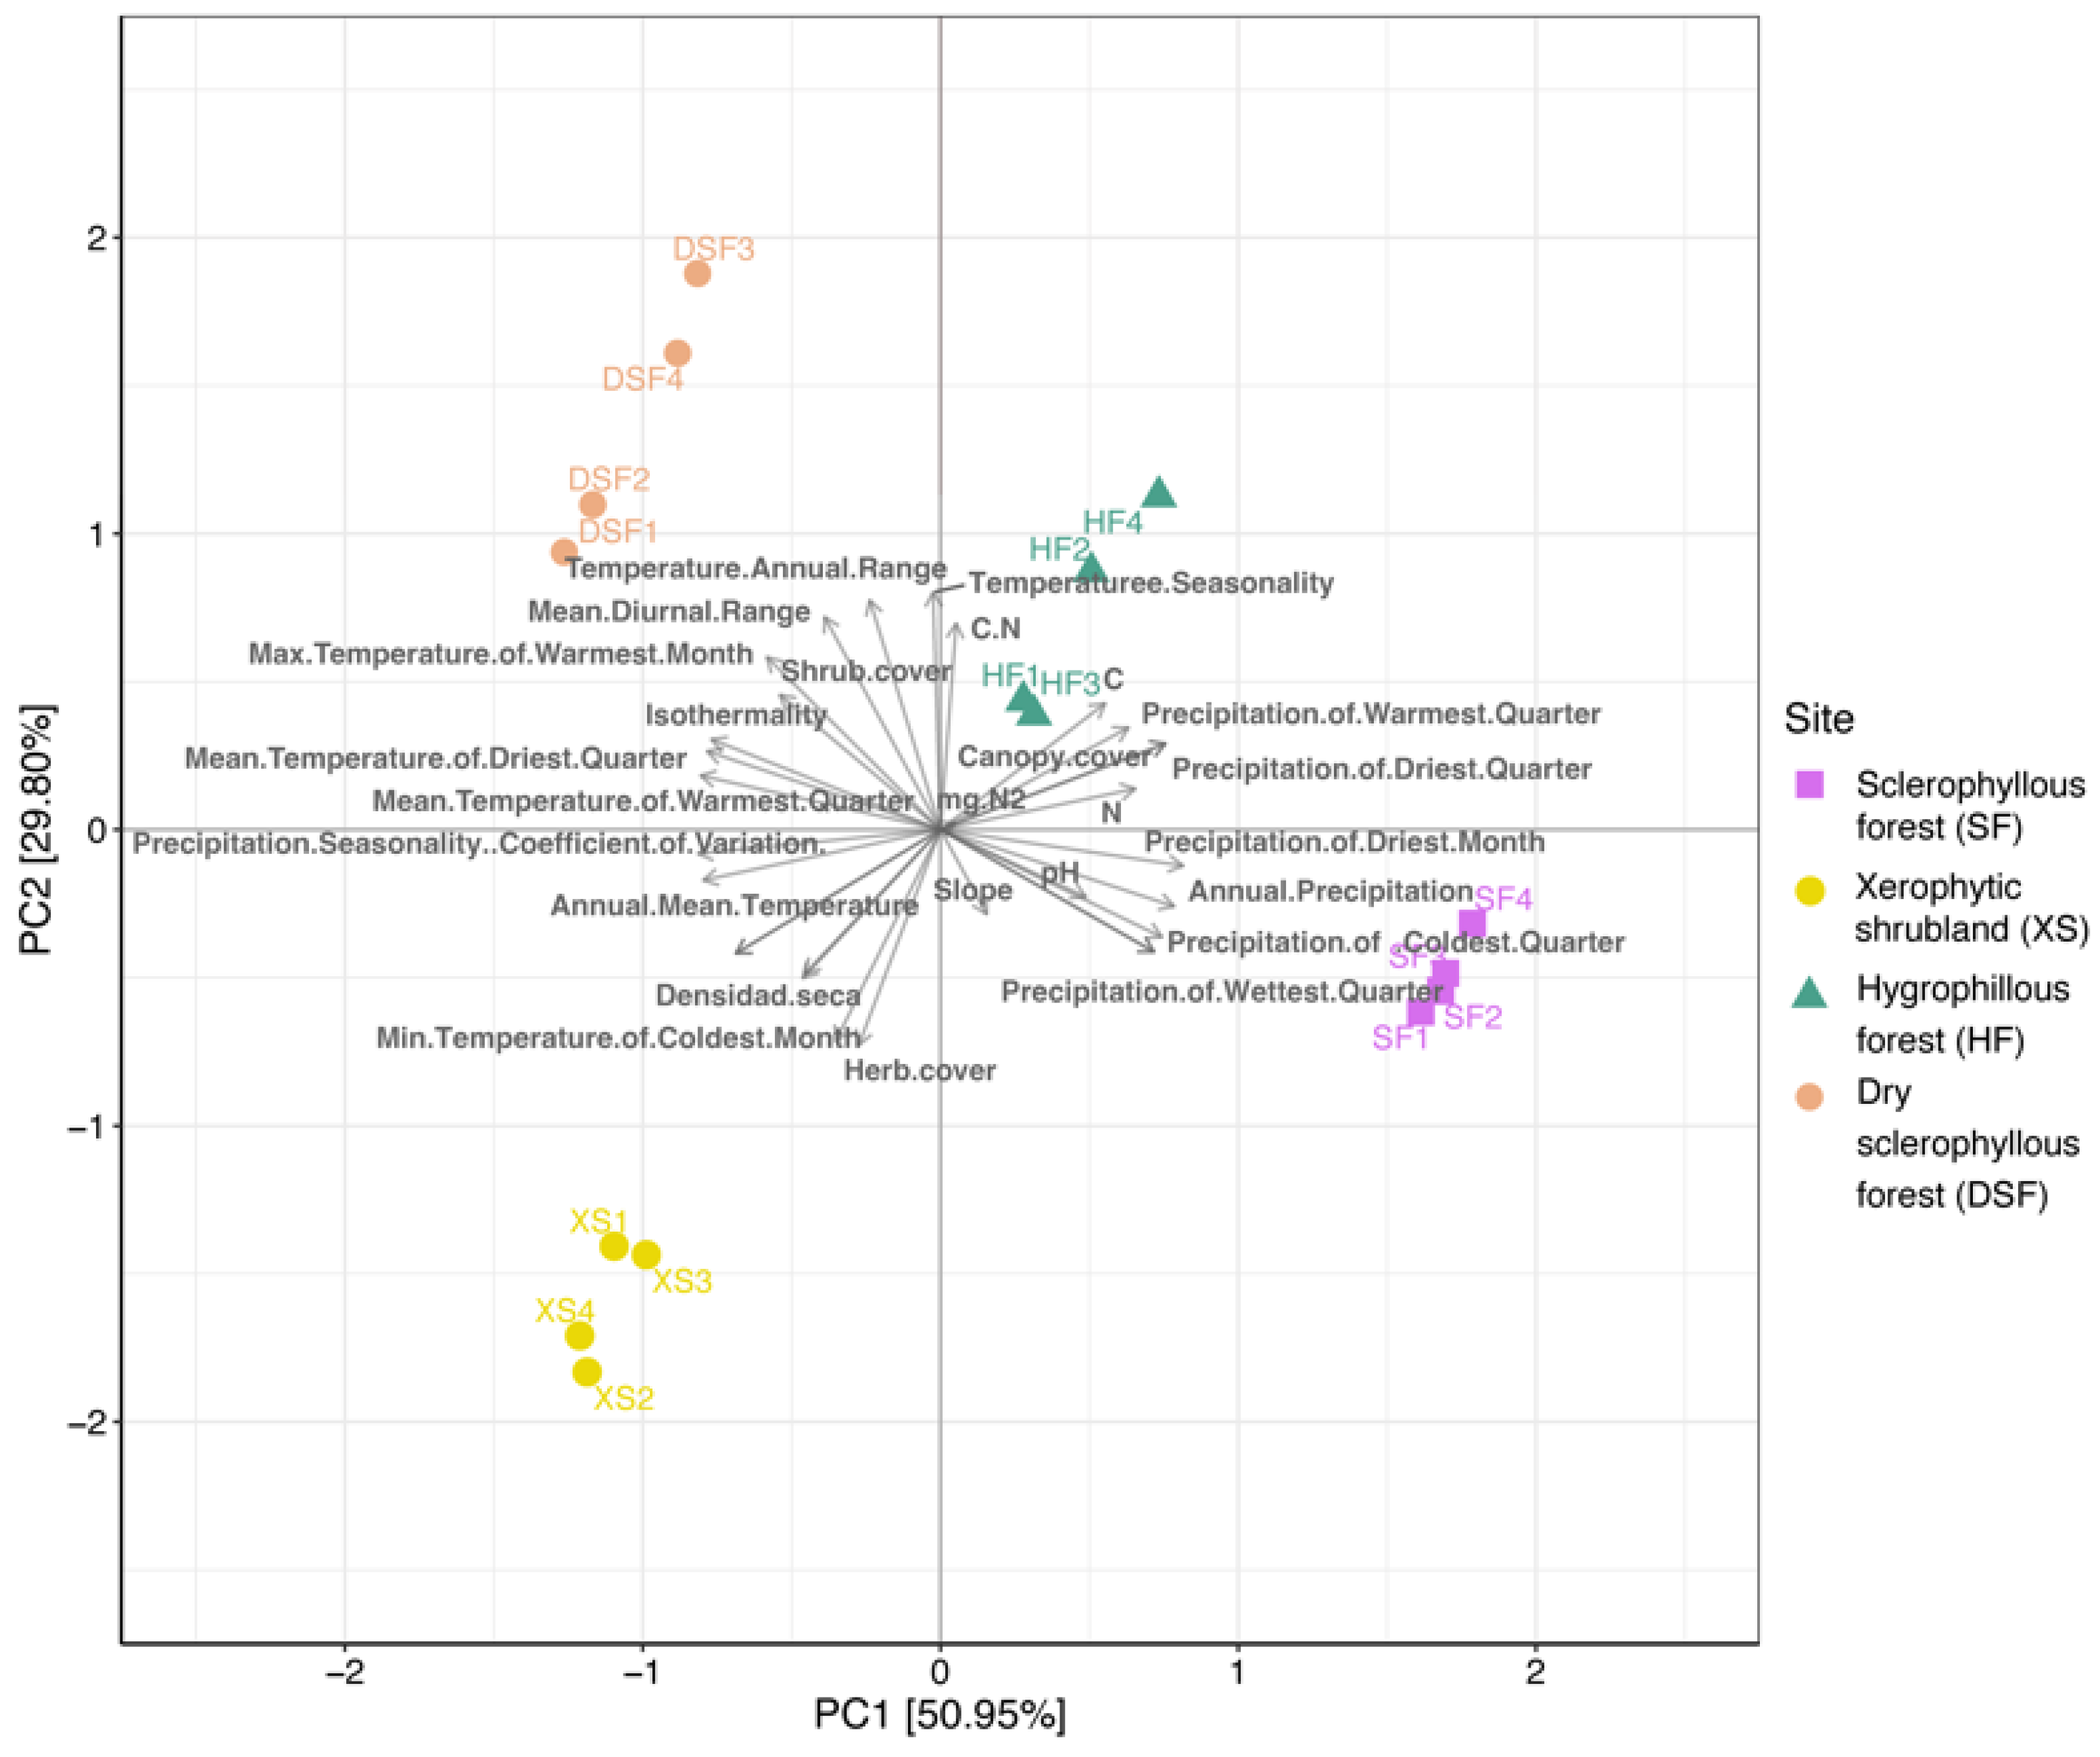
3.1. Environmental and Soil Physicochemical Conditions

The environmental conditions in the study sites in Parque Nacional La Campana very well represent the so-called Mediterranean climate with an oceanic influence. There are slight variations in the climate parameters, precipitation and temperature within the locations. Exposure is, perhaps, the most significant factor (as shown in Supplementary Table S1). Regarding the plant cover, significant tree cover at the hygrophilous forest (95%), sclerophyllous forest (85%), dry sclerophyllous forest (70%) and xerophytic shrubland (60%) were observed. Regarding the annual temperature range, an increased variation in temperature between the warmest and coldest day in the hygrophilous forest and dry sclerophyllous forest, which are at a highest latitude, was observed. Annual precipitation ranged from 353 to 371 mm (Supplementary Table S1). The soil physicochemical analysis reported that the average pH was lower in the dry sclerophyllous forest (5.295), while it was higher (Figure 3b) in the sclerophyllous forest (6.1325 g/m3). Regarding the dry density, the lowest average was recorded in the dry sclerophyllous forest (42.7 g/m3) and the highest in the xerophytic shrubland (159.2 g/m3) (Figure 3c). A carbon and nitrogen isotope composition showed the highest values in the xerophytic shrubland in comparison with the sclerophyllous forest, which shows the lowest values (Figure 3d). The sites in the hygrophilous forest and dry sclerophyllous forest had similar N values and a higher C content.
The PCA shows the environmental variability of the study sites associated with the climate conditions, the soil physicochemical characteristics and plant cover, which evidences a clear difference associated with the plant communities (Figure 4). The slopes were associated with different temperature and precipitation components, plant cover and soil conditions that, in total, represent >80% of the variability. For instance, the xerophytic shrubland site is associated with the mean annual temperature variation, herb cover and dry density, while the sclerophyllous forest is mainly associated with the annual precipitation, and precipitation in the driest, coldest quarter and more humid months. In the sites of the dry sclerophyllous forest and hygrophilous forest, it is associated with temperature, precipitation and soil carbon content.

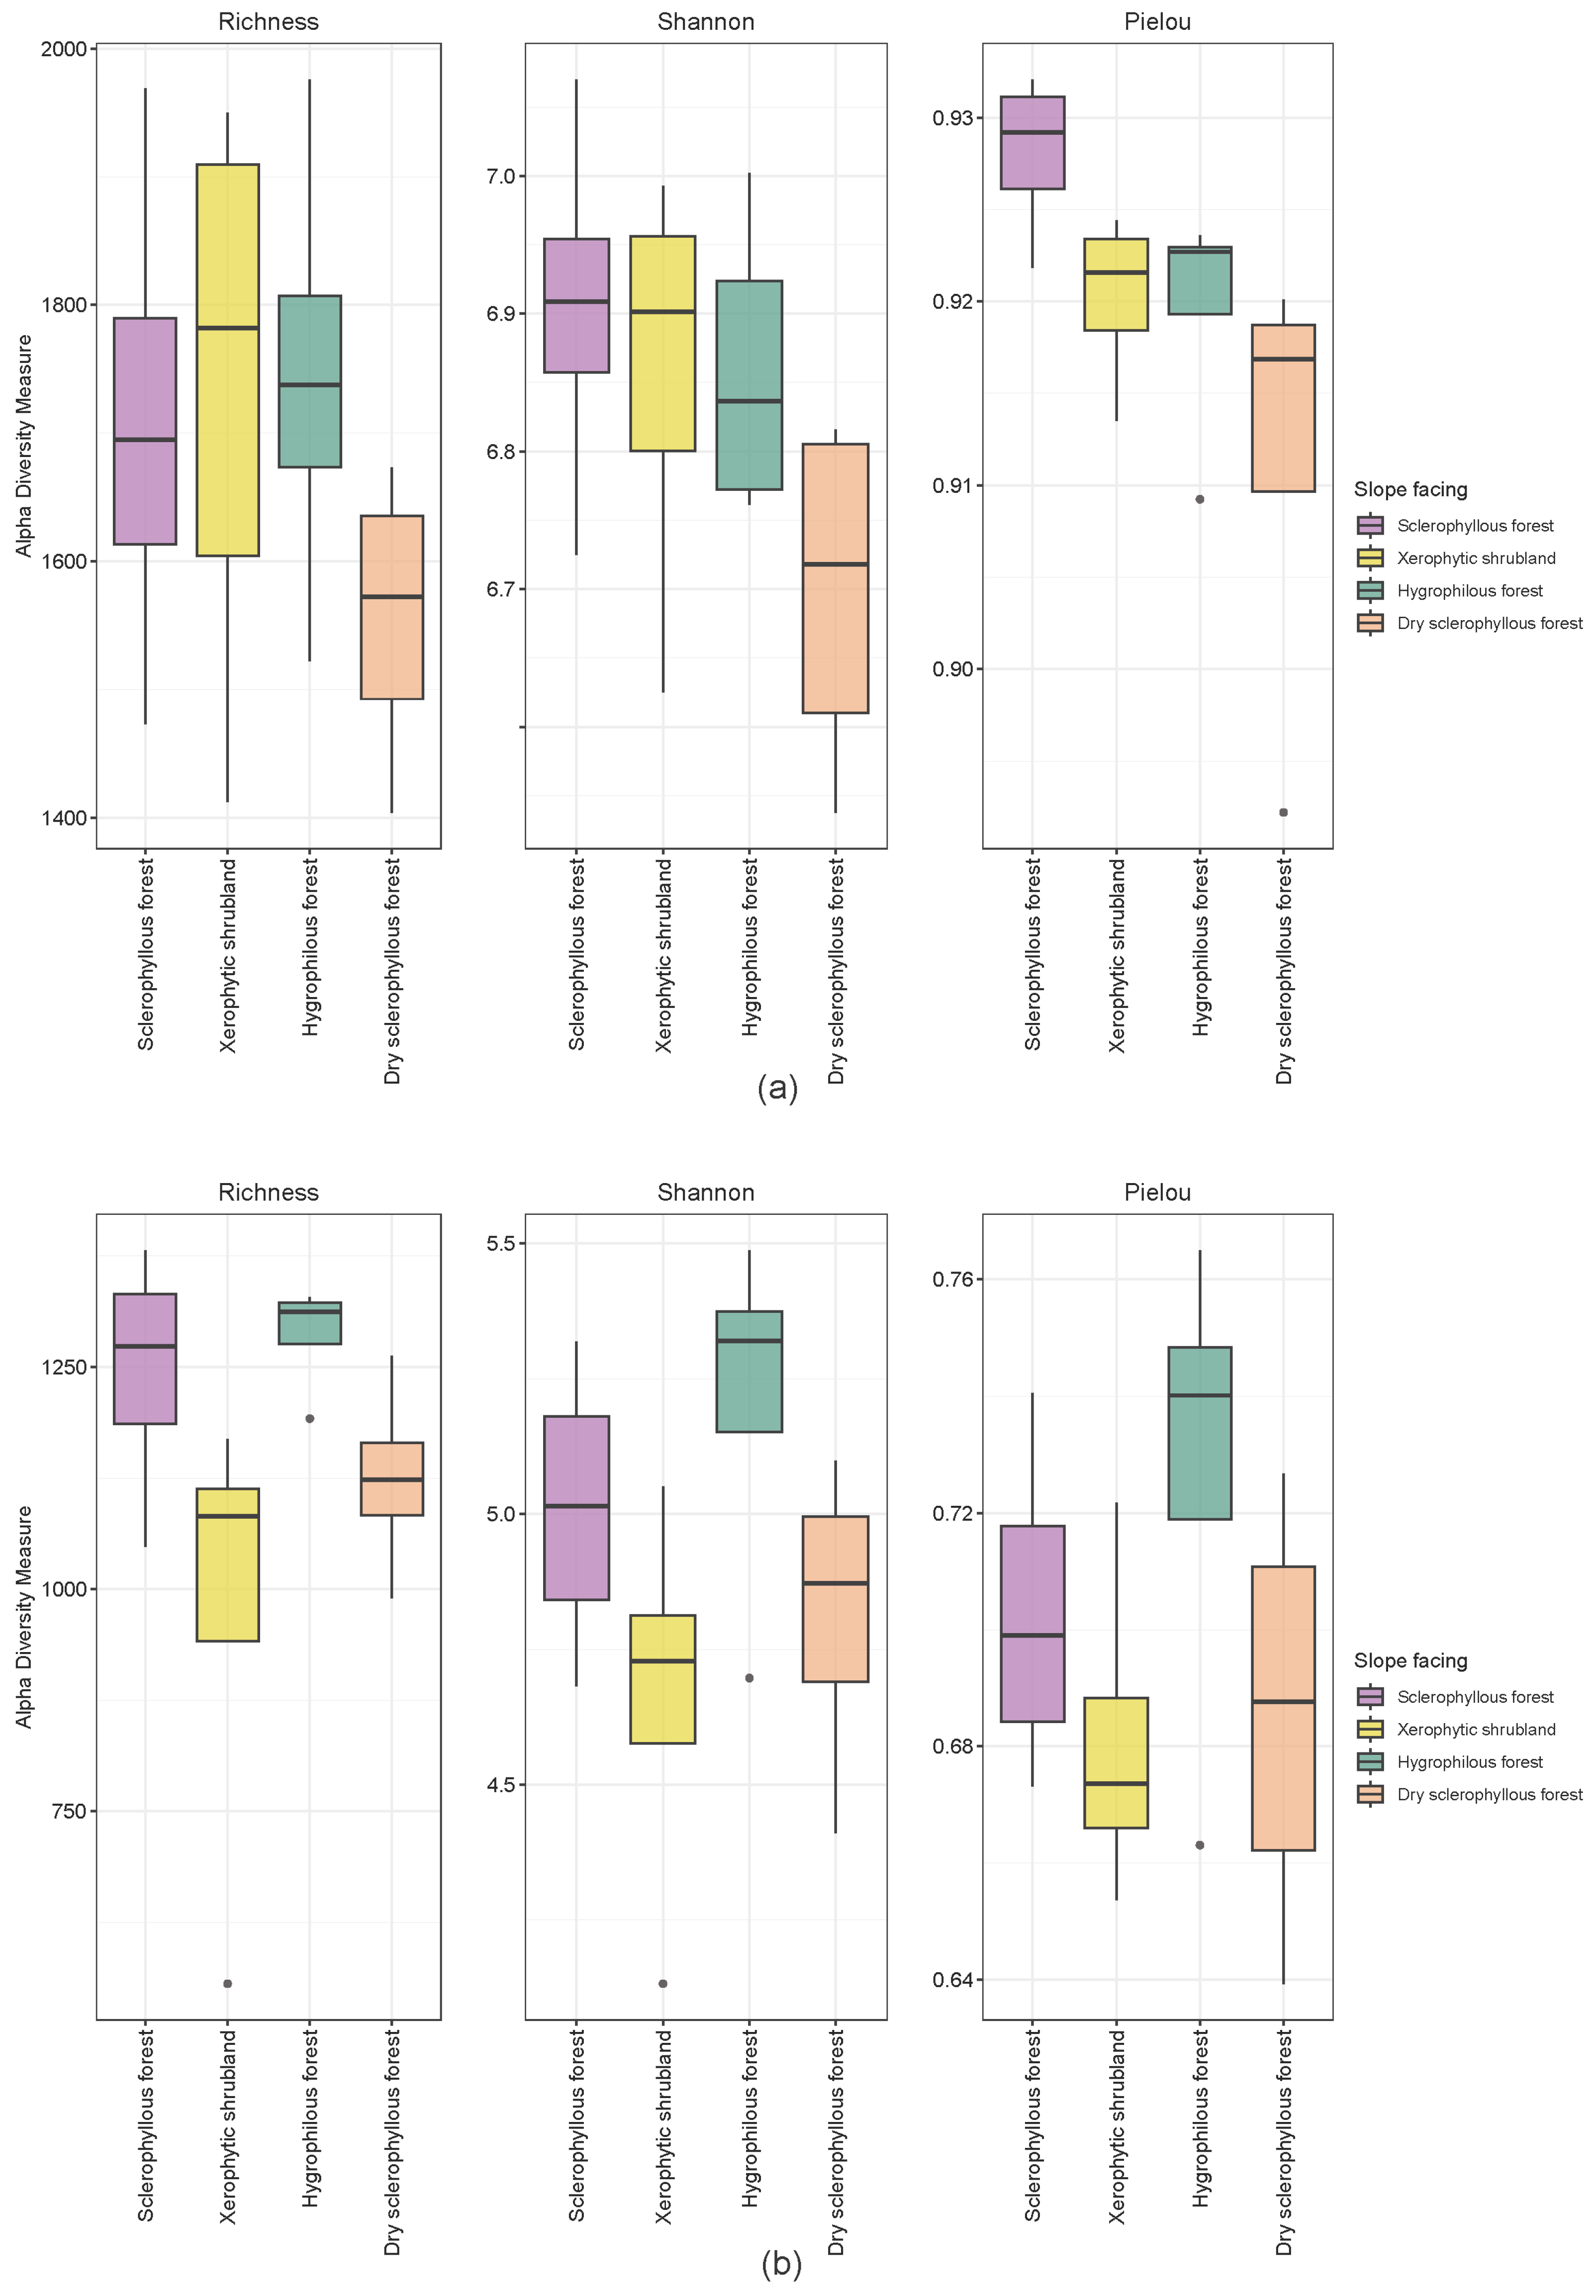
3.2. Sequencing and Structure of the Soil Microbial Community

The number of sequences obtained from the soil microorganisms of PNLC, after the sequencing and the curing process, is summarized in Table S2. A larger number of fungal sequences was observed, with an average of 141.898 (fungi), compared to 93.706 (prokaryotes), reaching an adequate recovery of the expected microbial richness based on the rarefaction curves (Supplementary Figure S1 for fungi and Figure S2 for prokaryotes).
The estimated soil prokaryotic and fungal richness and diversity are shown in Figure 5a,b, respectively. In the case of prokaryotes, a higher richness and composition diversity in the sclerophyllous forest, xerophytic shrubland and hygrophilous forest soils was observed, where the sclerophyllous forest presented a higher evenness, reaching significant differences in comparison with the dry sclerophyllous forest (Kruskal–Wallis test, p-value < 0.05). The hygrophilous forest soils presented a higher diversity and evenness in fungi composition in comparison with other sites.
The variability of the microbial structure based on the beta-diversity analysis at the phylum level for prokaryotes and fungal communities is visualized using PCoA, which represents 74.8% and 81.4% of the variance, respectively (Figure 6a,b). This result reveals that there is an intra-site clusters generation both for bacteria and archaea, as well as for fungi, given that environmental variables have a similar impact in both cases (where axis 1 has a 60% range and axis 2 is close to 20%). Firstly, it was established that there are significant differences between the communities of the different plant communities for prokaryotes and fungi (PERMANOVA, p-value < 0.05). Additionally, similarities have been observed between prokaryote communities of the hygrophilous forest and dry sclerophyllous forest soils. In accordance with the PCoA of fungal communities, the xerophytic shrubland community shows a microbial community with more similarities within it in comparison with the other analyzed soils. These variabilities were associated with climatic variables and soil physicochemical characteristics. For xeric environments (p-value < 0.05), herb cover and the minimum temperature of the coldest month were significant for prokaryotes and fungi. In the case of the bacteria–archaea communities in a sclerophyllous environment, the slope, precipitation of warmest quarter and precipitation of driest quarter were significant. Regarding the hygrophilous forest and dry sclerophyllous forest soils, the temperature annual range and temperature seasonality were significant for bacteria and archaea, as well as for fungi.

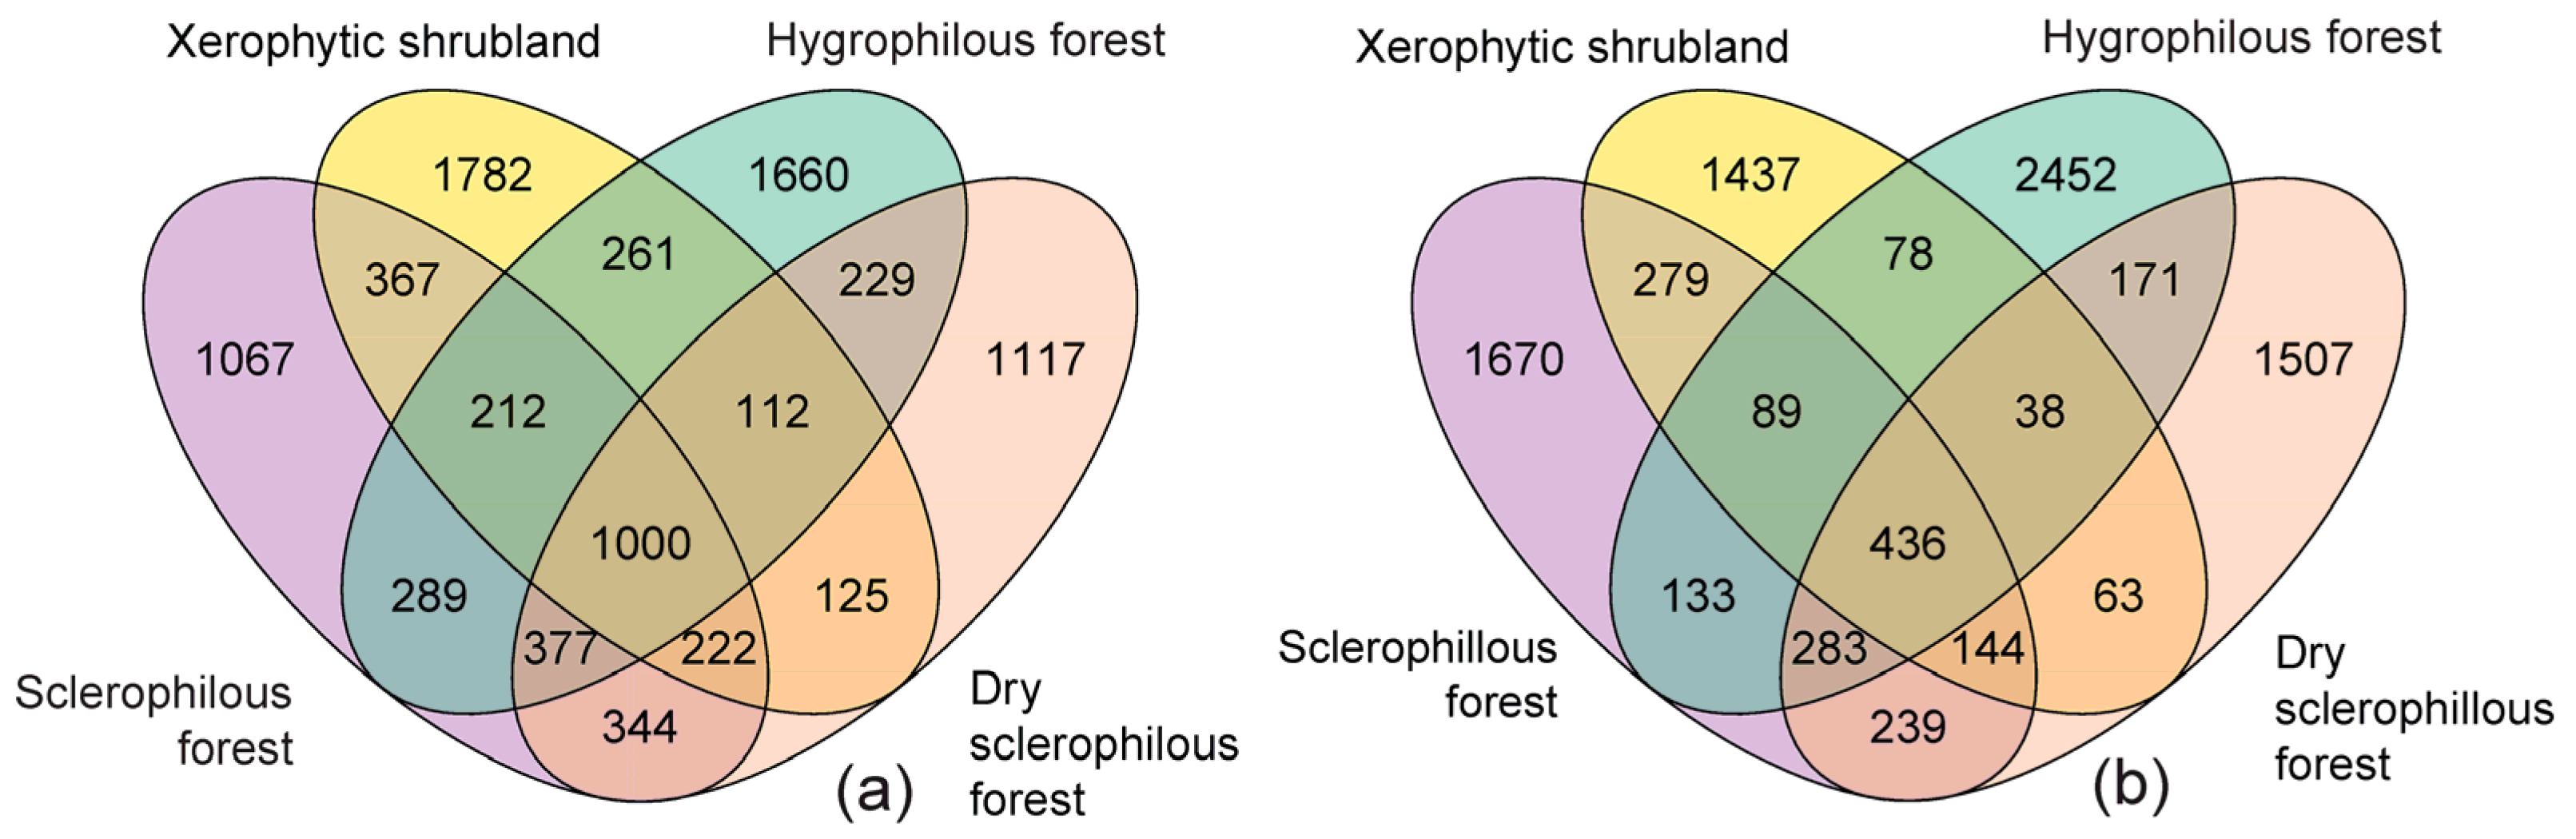
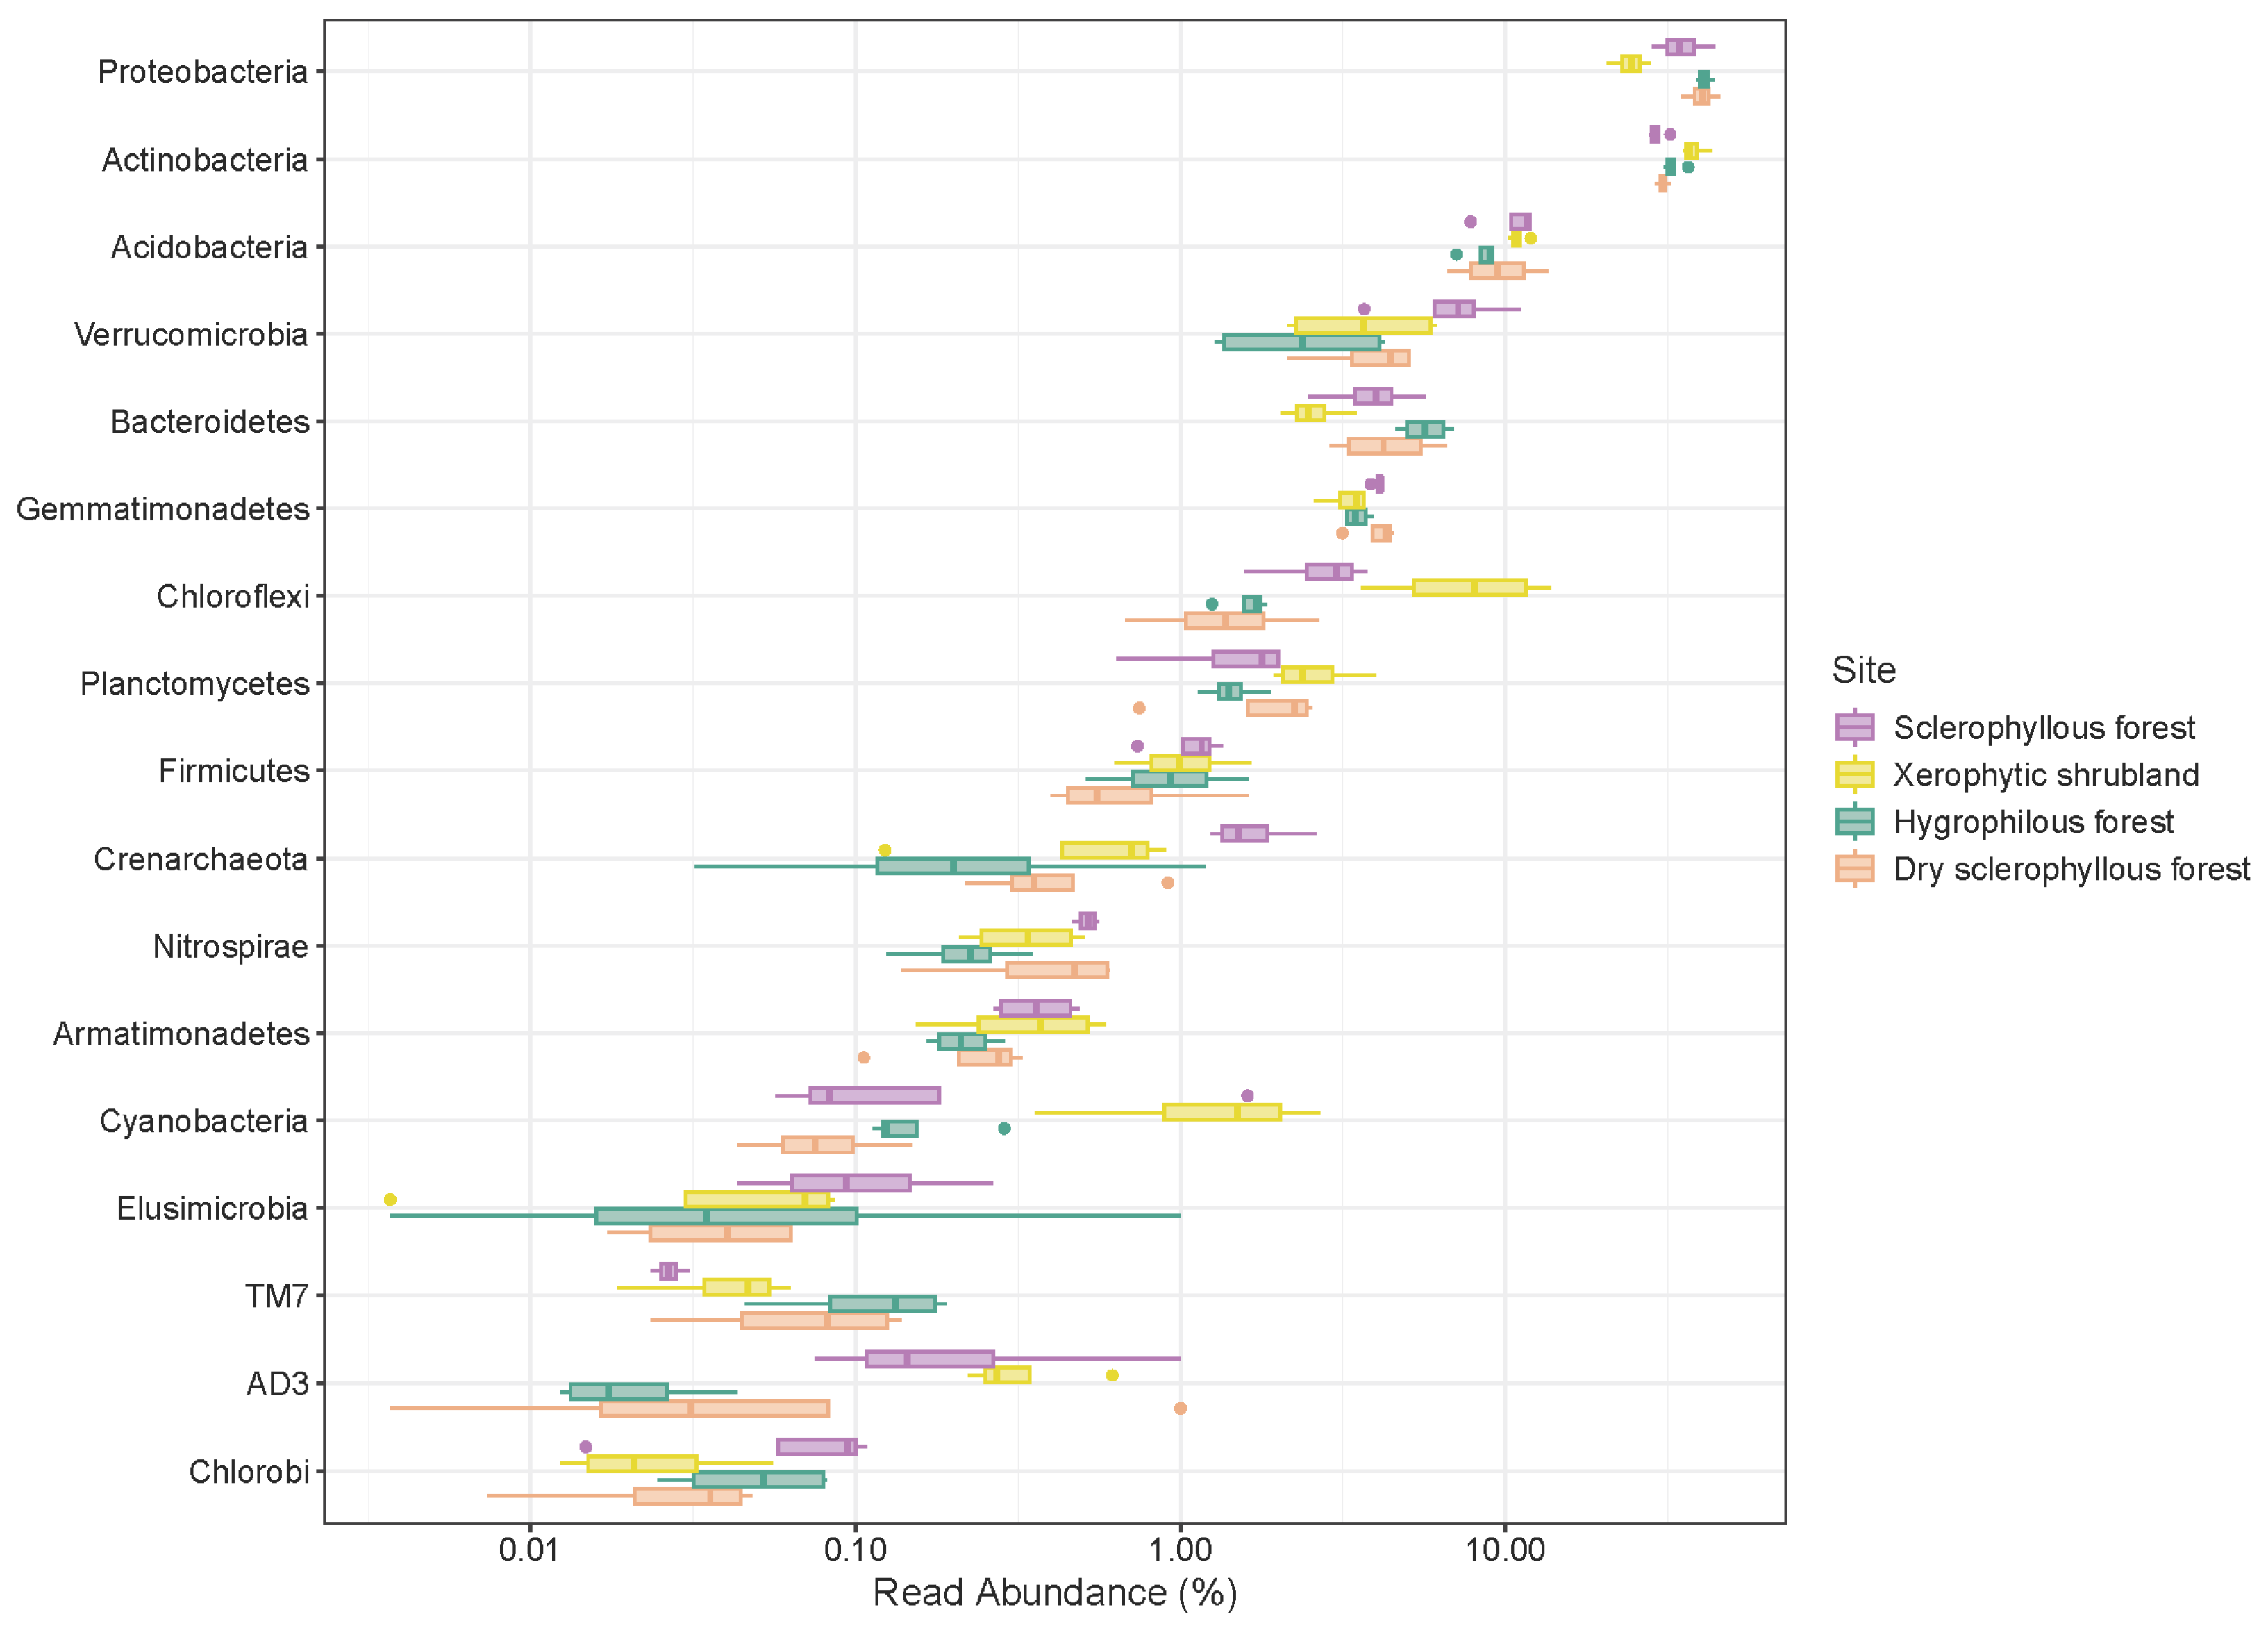
3.3. Microbial Composition in Different Types of Environments

The Venn diagram below, Figure 7, allows the comparison of the soil microbiome of plant communities in PNLC between prokaryotes and fungi. Soil prokaryote communities show 1000 common (core) ASVs in all of the sites, representing 10.9% (Figure 7a). The xerophytic shrubland soil with 1782 ASVs showed a higher number of unique prokaryotes, followed by the hygrophilous forest with 1660 ASVs, dry sclerophyllous forest with 1117 ASVs and sclerophyllous forest with 1067 ASVs (Figure 7a). Fungi showed a bigger number of shared ASVs in all of the sites, 436 ASVs, which represent 4.8% of the total number of sequences (Figure 7b) compared with each plant community, where the hygrophilous forest concentrated the largest number of unique ASVs with 2452 sequences (27.1%), followed by the sclerophyllous forest, with 1670 ASVs, the dry sclerophyllous forest with 1507 ASVs and the xerophytic shrubland with 1437 ASVs (Figure 7b).
For bacteria, 98.27–99.59% of the sequences (Figure 8) showed a dominance of prokaryotic microbial communities’ composition, particularly in the south-facing slopes (sclerophyllous forest) with a greater number of archaea (1.7%). In general, the most abundant bacterial phyla were the Proteobacteria (35.43%), Actinobacteria (32.86%), Acidobacteria (10.07%), Verrucomicrobia (4.55%), Bacteroidetes (4.24%), Gemmatimonadetes (3.75%) and Chloroflexi (3.66%), followed by Planctomycetes (1.92%), Firmicutes (0.99%) and the Crenarchaeote (0.80%) phylum of archaea. Among the low-abundance microorganisms (<0.5%), there was the presence of the bacteria Nitrospirae (0.49%), Armatimonadetes (0.43%), Cyanobacteria (0.69%), Chlorobi (0.07%), Elusimicrobia (0.07%), AD3 (0.17%), WS3 (0.06%), TM7 (0.08%) and WPS-2 (0.05%). The distribution of these phyla varied from site to site, especially for the less frequent groups < 1% and the rare biosphere < 0.1% (Figure 8).
In the xerophytic shrubland, the bacterial phyla Proteobacteria, Actinobacteria, Acidobacteria and Chloroflexi represent >10% of the total sequences, followed by Gemmatimonadetes, Bacteroidetes, Verrucomicrobia, Planctomycetes, Firmicutes and Cyanobacteria (1–10%). Crenarcheaote, Nitrospirae, Armatimonadetes and AD3 represent <1%, and at the rare biosphere level < 0.1%, the Chlorobi, Elusimicrobia and TM7 phyla are found. Proteobacteria, Actinobacteria and Acidobacteria are the most abundant bacterial phyla (>10%) in the sclerophyllous forest, followed by Gemmatimonadetes, Bacteroidetes, Verrucomicrobia, Chloroflexi, Planctomycetes, Firmicutes and Crenarchaeota (1–10%), Nitrospirae, Armatimonadetes, Cyanobacteria, Elusimicrobia and AD3 (0.1–1%). In comparison with other plant communities, there was a lower number of phyla of the rare biosphere (<0.1%) in the sclerophyllous forest (Chlorobi and TM7).
The bacterial phyla Proteobacteria and Actinobacteria (>10%) were the most abundant in the hygrophilous forest, followed by Acidobacteria, Verrucomicrobia, Bacteroidetes, Gemmatimonadetes, Chloroflexi, Planctomycetes and Firmicutes (1–10%). Crenarchaeote, Nitrospirae, Armatimonadetes, Cyanobacteria and Elusimicrobia consist of 0.1–1% of the sequences. The larger number of phyla classified as part of the rare biosphere (<0.1%), including Chlorobi, AD3 and TM7, are found in the hygrophilous forest. Additionally, there are only two abundant phyla > 10% (Proteobacteria, Actinobacteria and Acidobacteria) in the dry sclerophyllous forest. The bacterial phyla Gemmatimonadetes, Bacteroidetes, Verrucomicrobia, Chloroflexi, Planctomycetes and Firmicutes represent 1–10% of the sequences. Crenarchaeote, Nitrospirae, Armatimonadetes, Cyanobacteria and TM7 (0.1–1%) are more rarely found. The bacterial phyla Chlorobi, Elusimicrobia and AD3 (<0.1%) are found in the rare biosphere.
A smaller number of fungal phyla (Figure 9) were found in the PNLC soil. The phylum Ascomycota reached 76.11%, followed by Basidiomycota (15.62%), Mortierellomycota (5.63%) and Chytridiomycota (1.56%), and a new unidentified phylum was found (0.46%). There was a variability associated with less abundant and rare phyla among the different sampled sites. In the xerophytic shrubland, Ascomycota represent >10% of the microbial community while the phyla Basidiomycota and Mortierellomycota constitute <10%, and Chytridiomycota and Glomeromycota between 1% and >0.1%, respectively, of the microbial community. The phyla Mucoromycota and Olpidiomycota were found at the level of the rare biosphere (<0.1%). In the sclerophyllous forest, the most abundant fungal community (>1%) was similar to that in the xerophytic shrubland, while the less abundant fungal communities were associated with the phyla Glomeromycota and Olpidiomycota (0.1–1%). The phyla Ascomycota and Basidiomycota were more abundant (>10%) in the hygrophilous forest, followed by the phyla Mortierellomycota (1–10%), Chytridiomycota and Mucoromycota, (0.1–1%). As in the sclerophyllous forest, the rare biosphere is represented by Glomeromycota and Olpidiomycota (<0.1%). The same abundant phyla (>10%, Ascomycota and Basidiomycota) were observed in the dry sclerophyllous forest. The phyla Mortierellomycota and Chytridiomycota represent 1–10% abundance, followed by Mucoromycota and Olpidiomycota (0.1–1%), where Glomeromycota (<0.1%), as in the other sites, constituted the rare biosphere.
An unidentified phylum (0.1–1%) is present in all the sites. In addition, it was observed that fungal groups (e.g., Chytridiomycota and Mucoromycota) are more abundant than prokaryotes. This suggests that fungi might be site-specific communities.

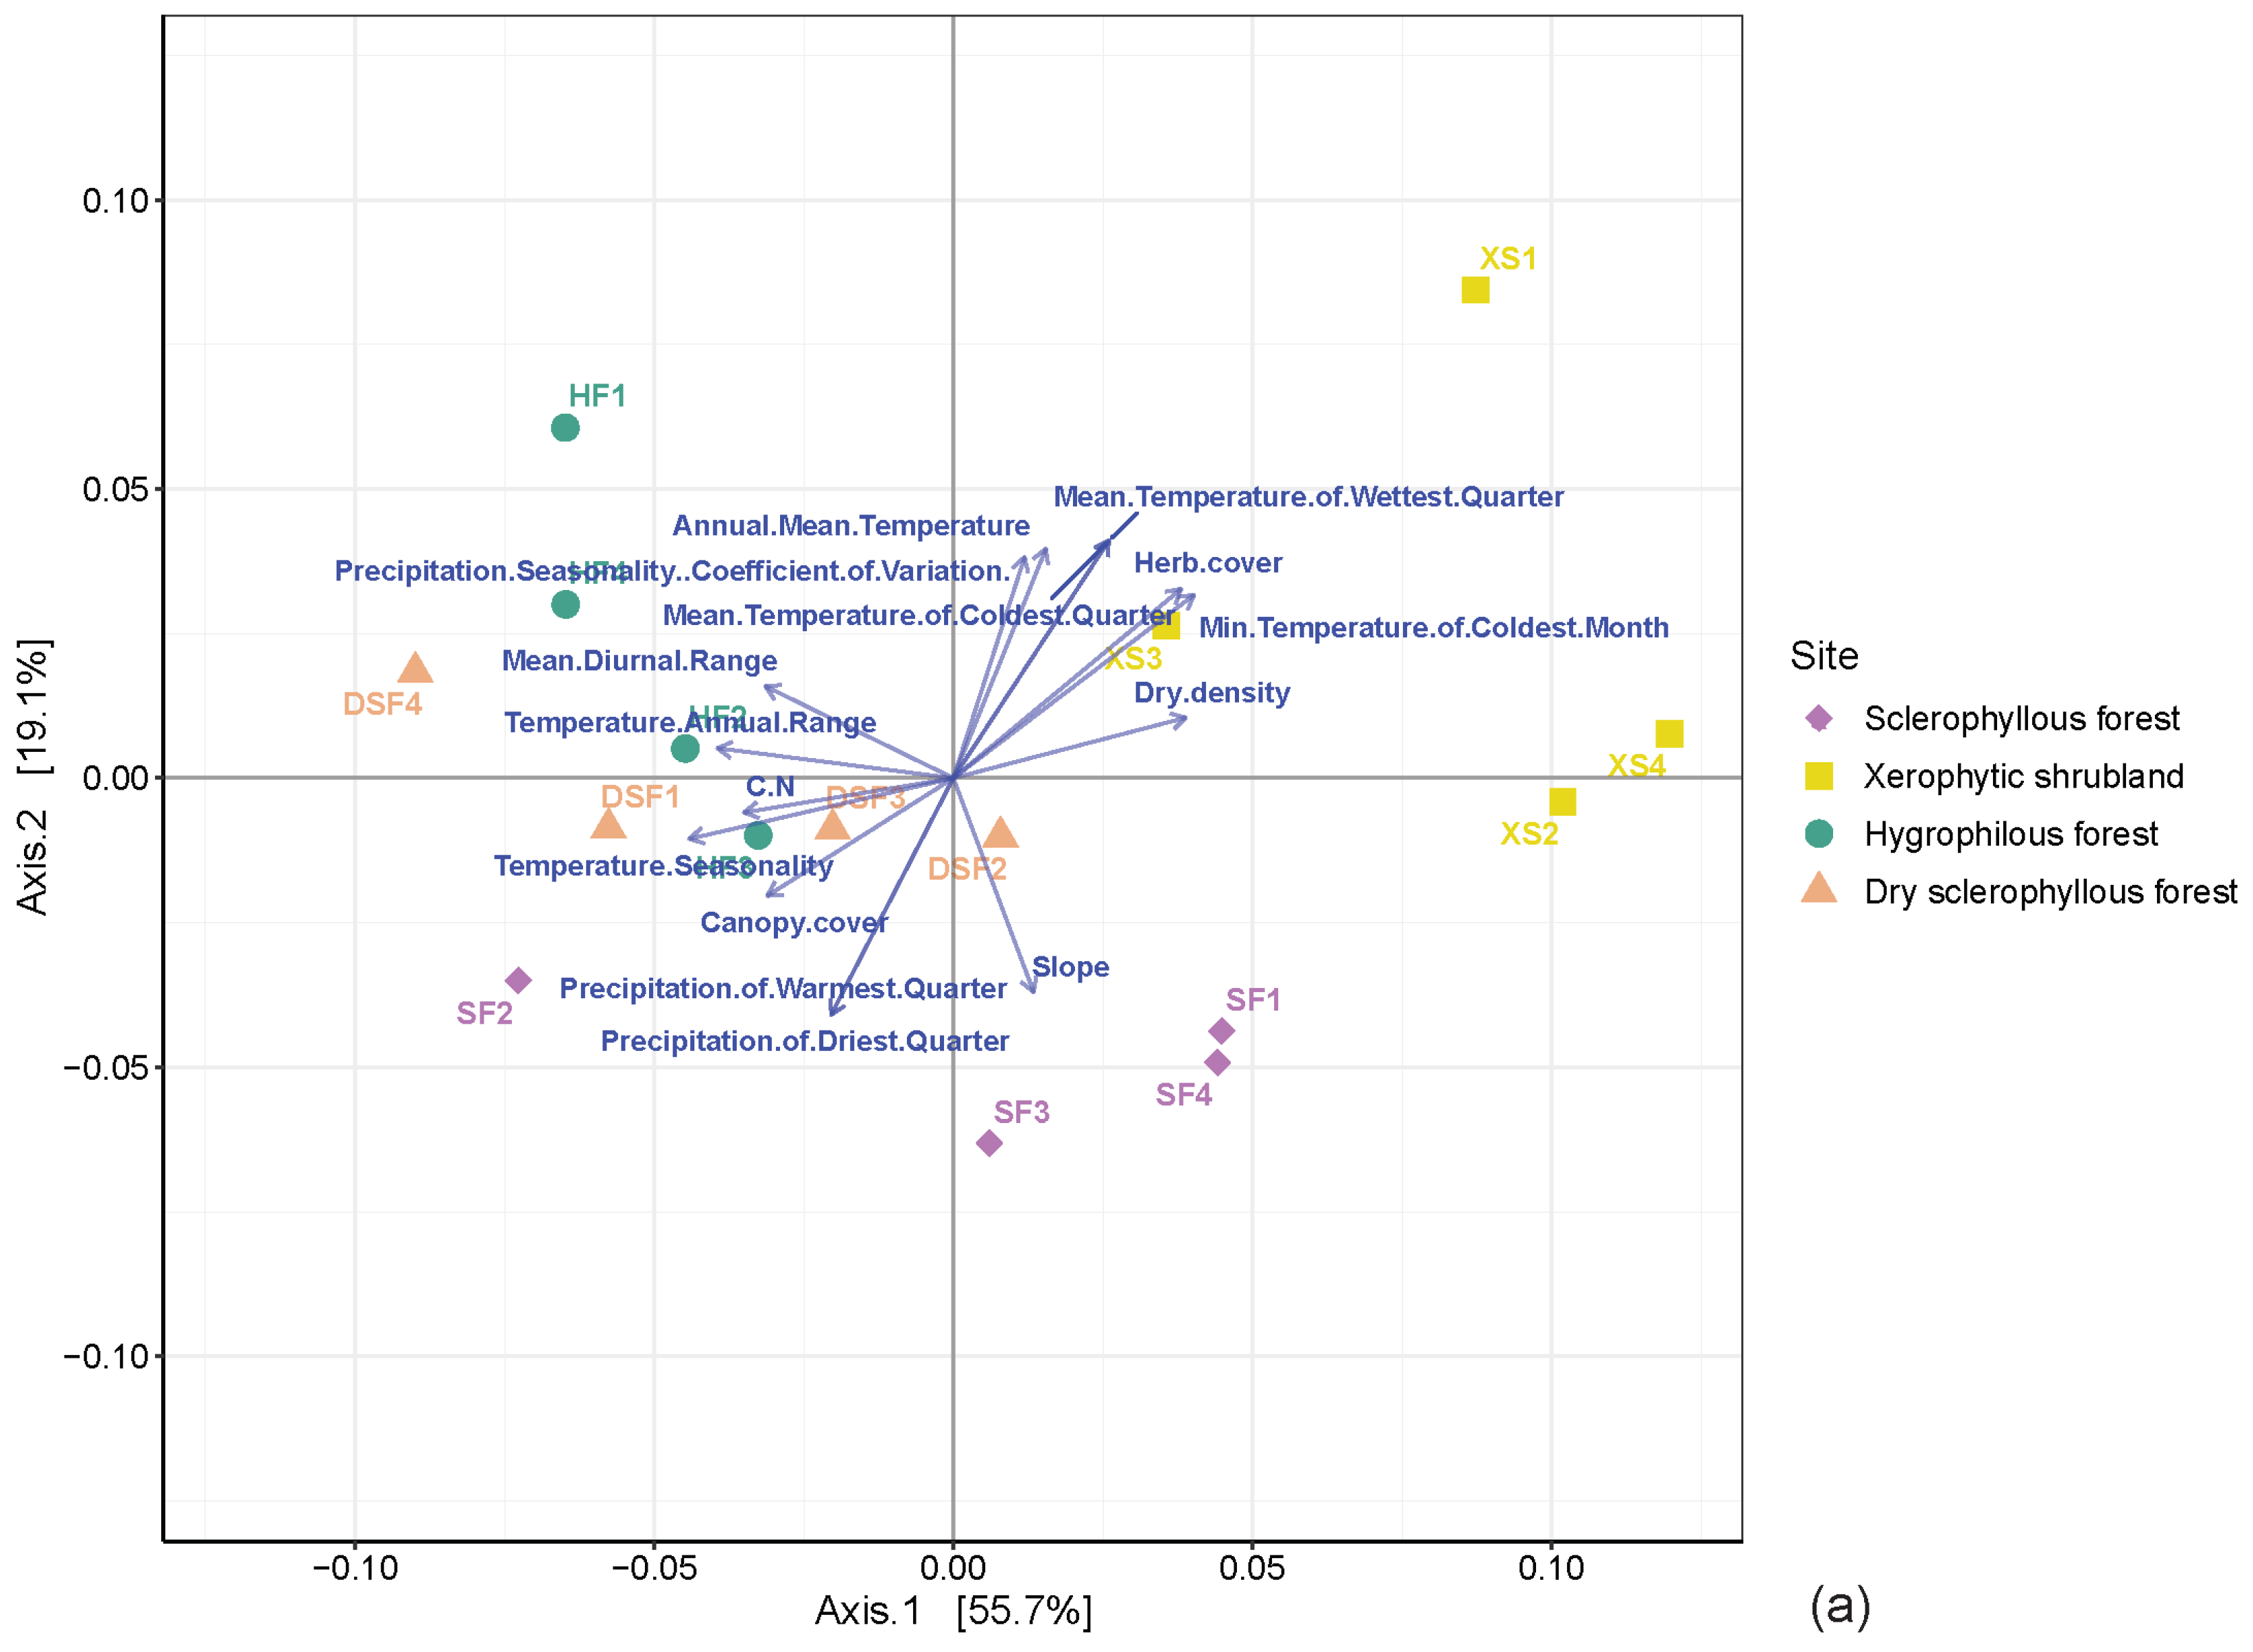
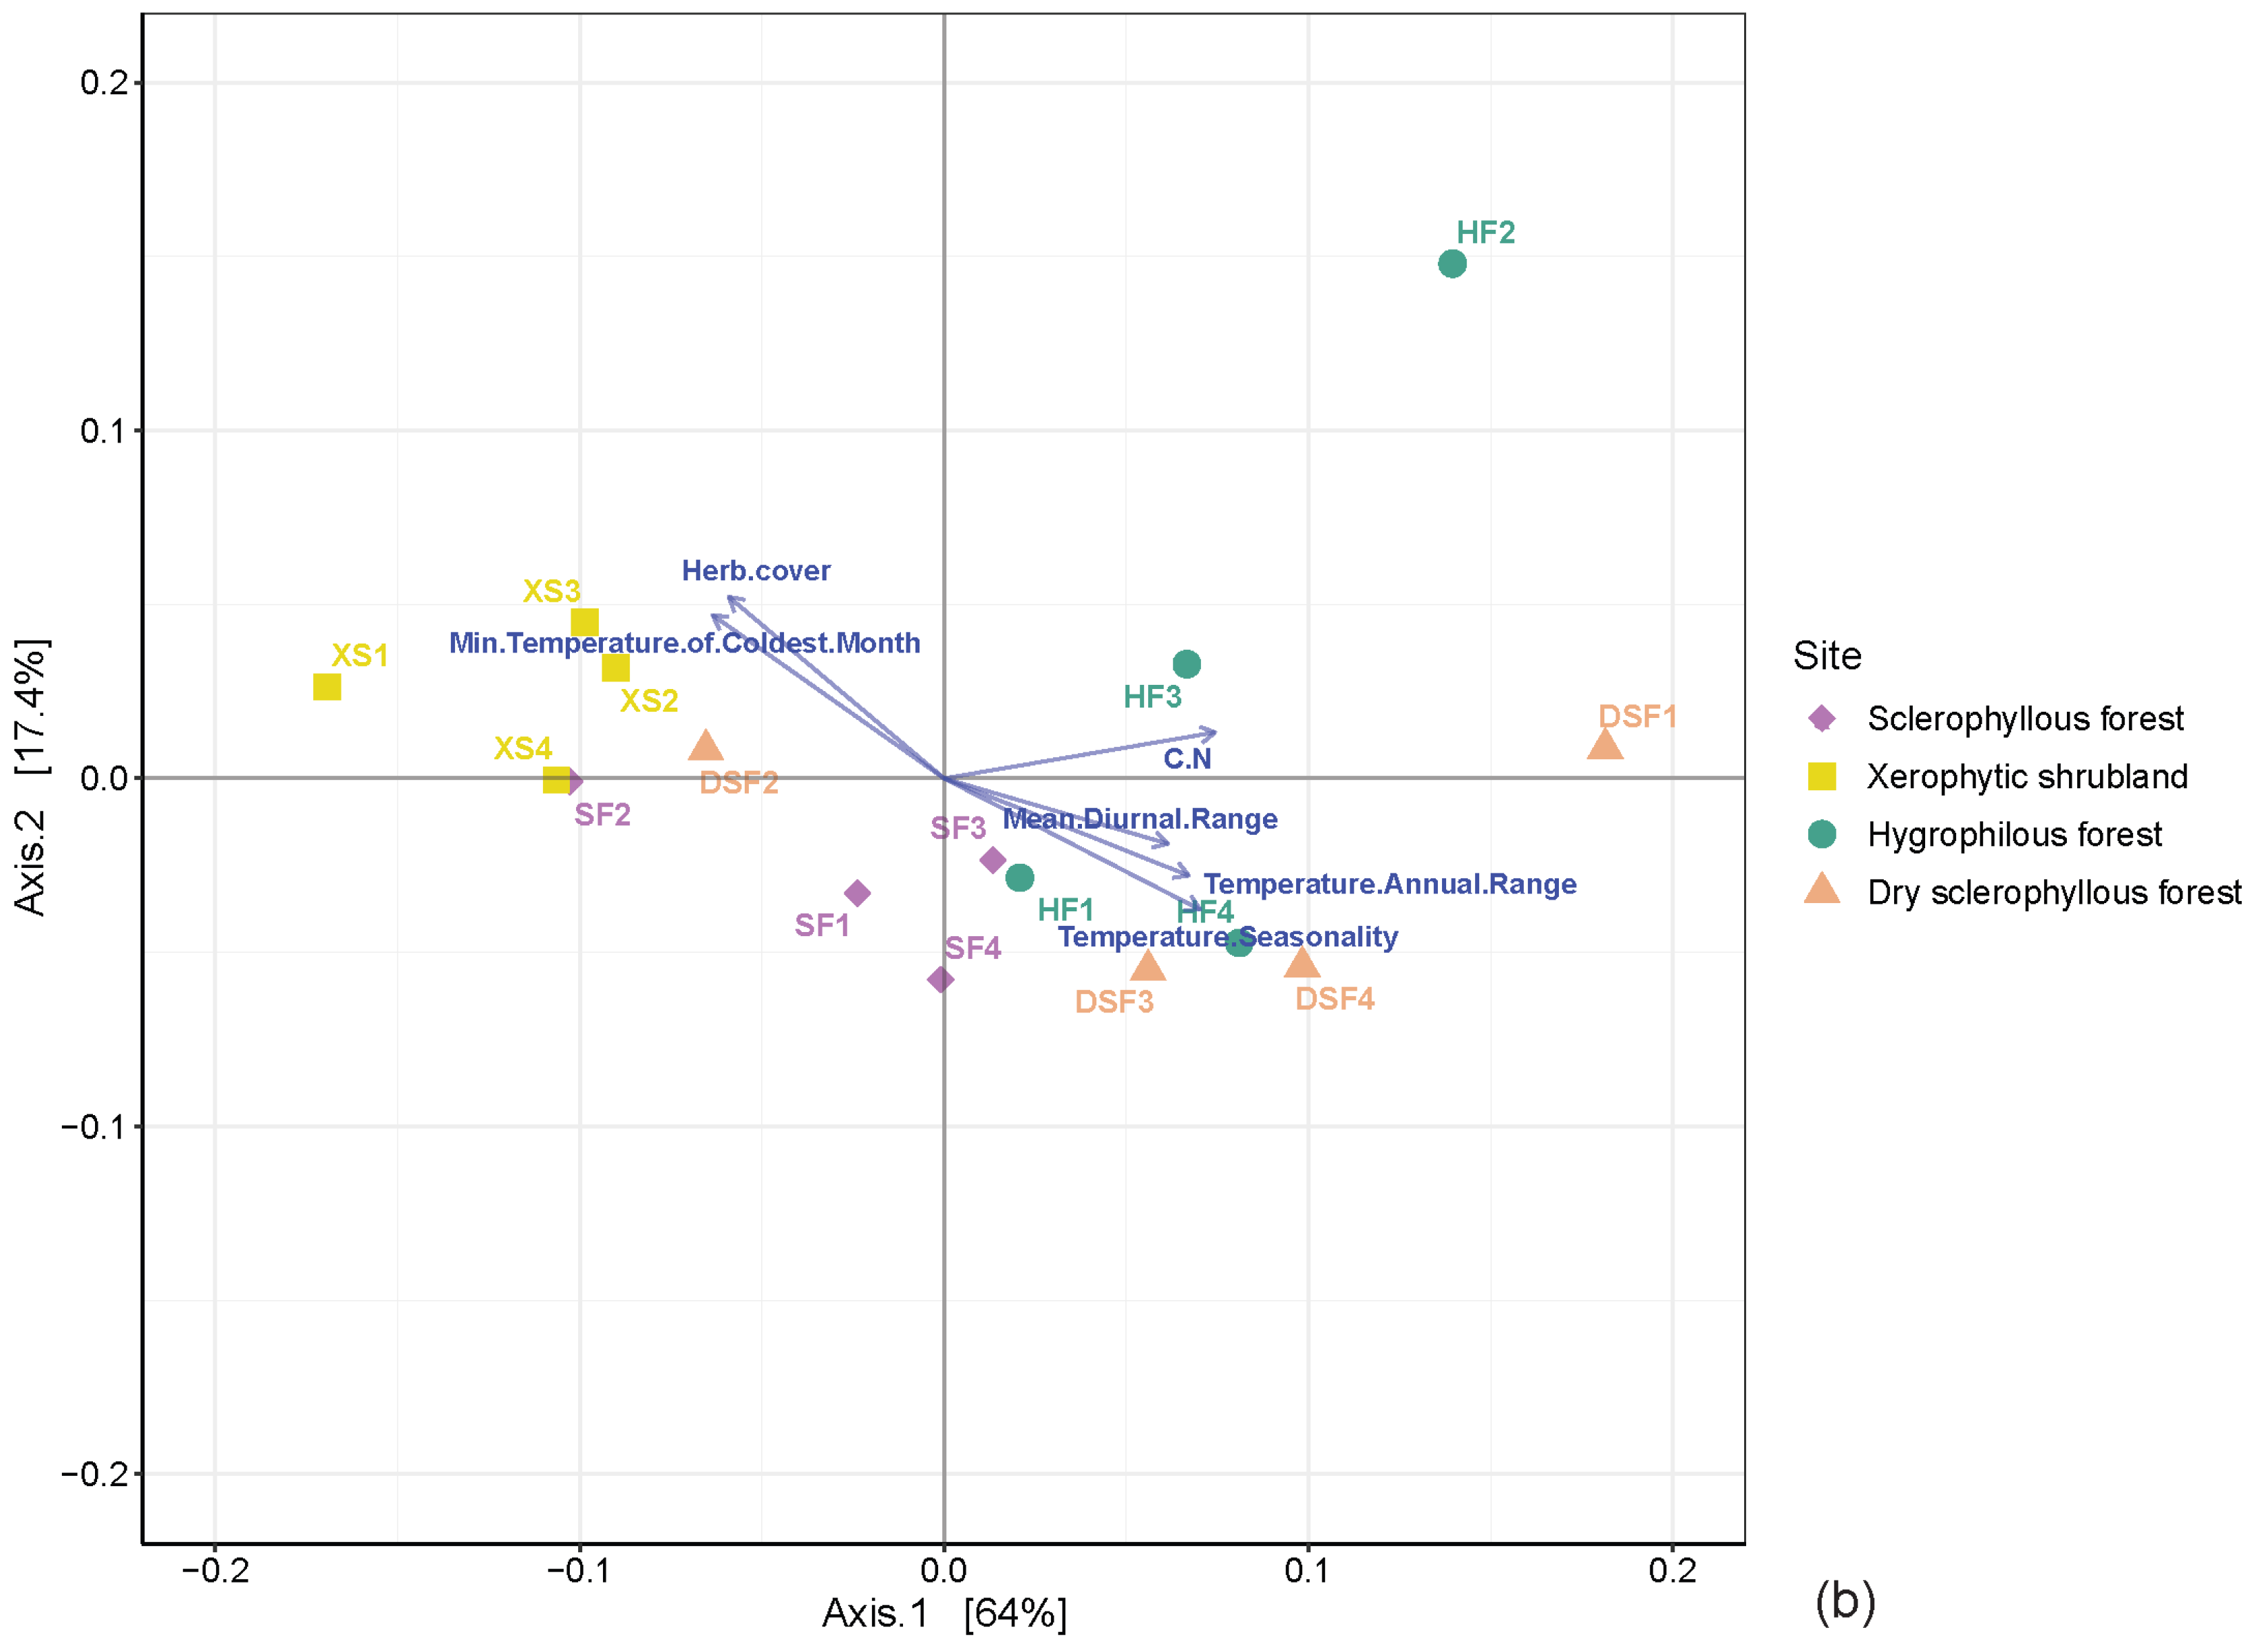
3.4. Distribution of Microbial Communities among the Different Plant Communities

The distribution of the 18 bacterial and archaeal genera that individually contribute a higher percentage to the soils is shown in Figure 10. DA101 is the most abundant in the sclerophyllous forest plant community, whereas the genera Rhodoplanes and Candidatus Nitrososphaera also show a higher relative contribution. In addition, a number of genera represent individually >1% in the dry sclerophyllous forest in comparison with the sclerophyllous forest and xerophytic shrubland, such as Pseudonocardia, Mycobacterium, Actinoplanes, Segetibacter and Massilia (Figure 10).
Figure 11 shows the distribution of 20 genera of fungi that individually represent the highest percentage in the soil categorized by different plant communities. The genera Solicoccozyma, Humicola, Mortierella, Penicillium and Zopfiella, represent up to 10% in the sclerophyllous forest. The genera Alternaria, Rutstroemia, Cladosporium, Nothophoma, Zopfiella and Ascobolus presented higher values in the xerophytic shrubland. Sharing the presence of abundant genera associated with Solicoccozyma (26.8%) are Humicola, Mortierella and Cladophialophora in the hygrophilous forest and dry sclerophyllous forest. Some samples of the hygrophilous forest show a higher individual representation of the genera Cladophialophora, while genera such as Hormonema and Coniochaeta were far more abundant in the dry sclerophyllous forest (Figure 11).

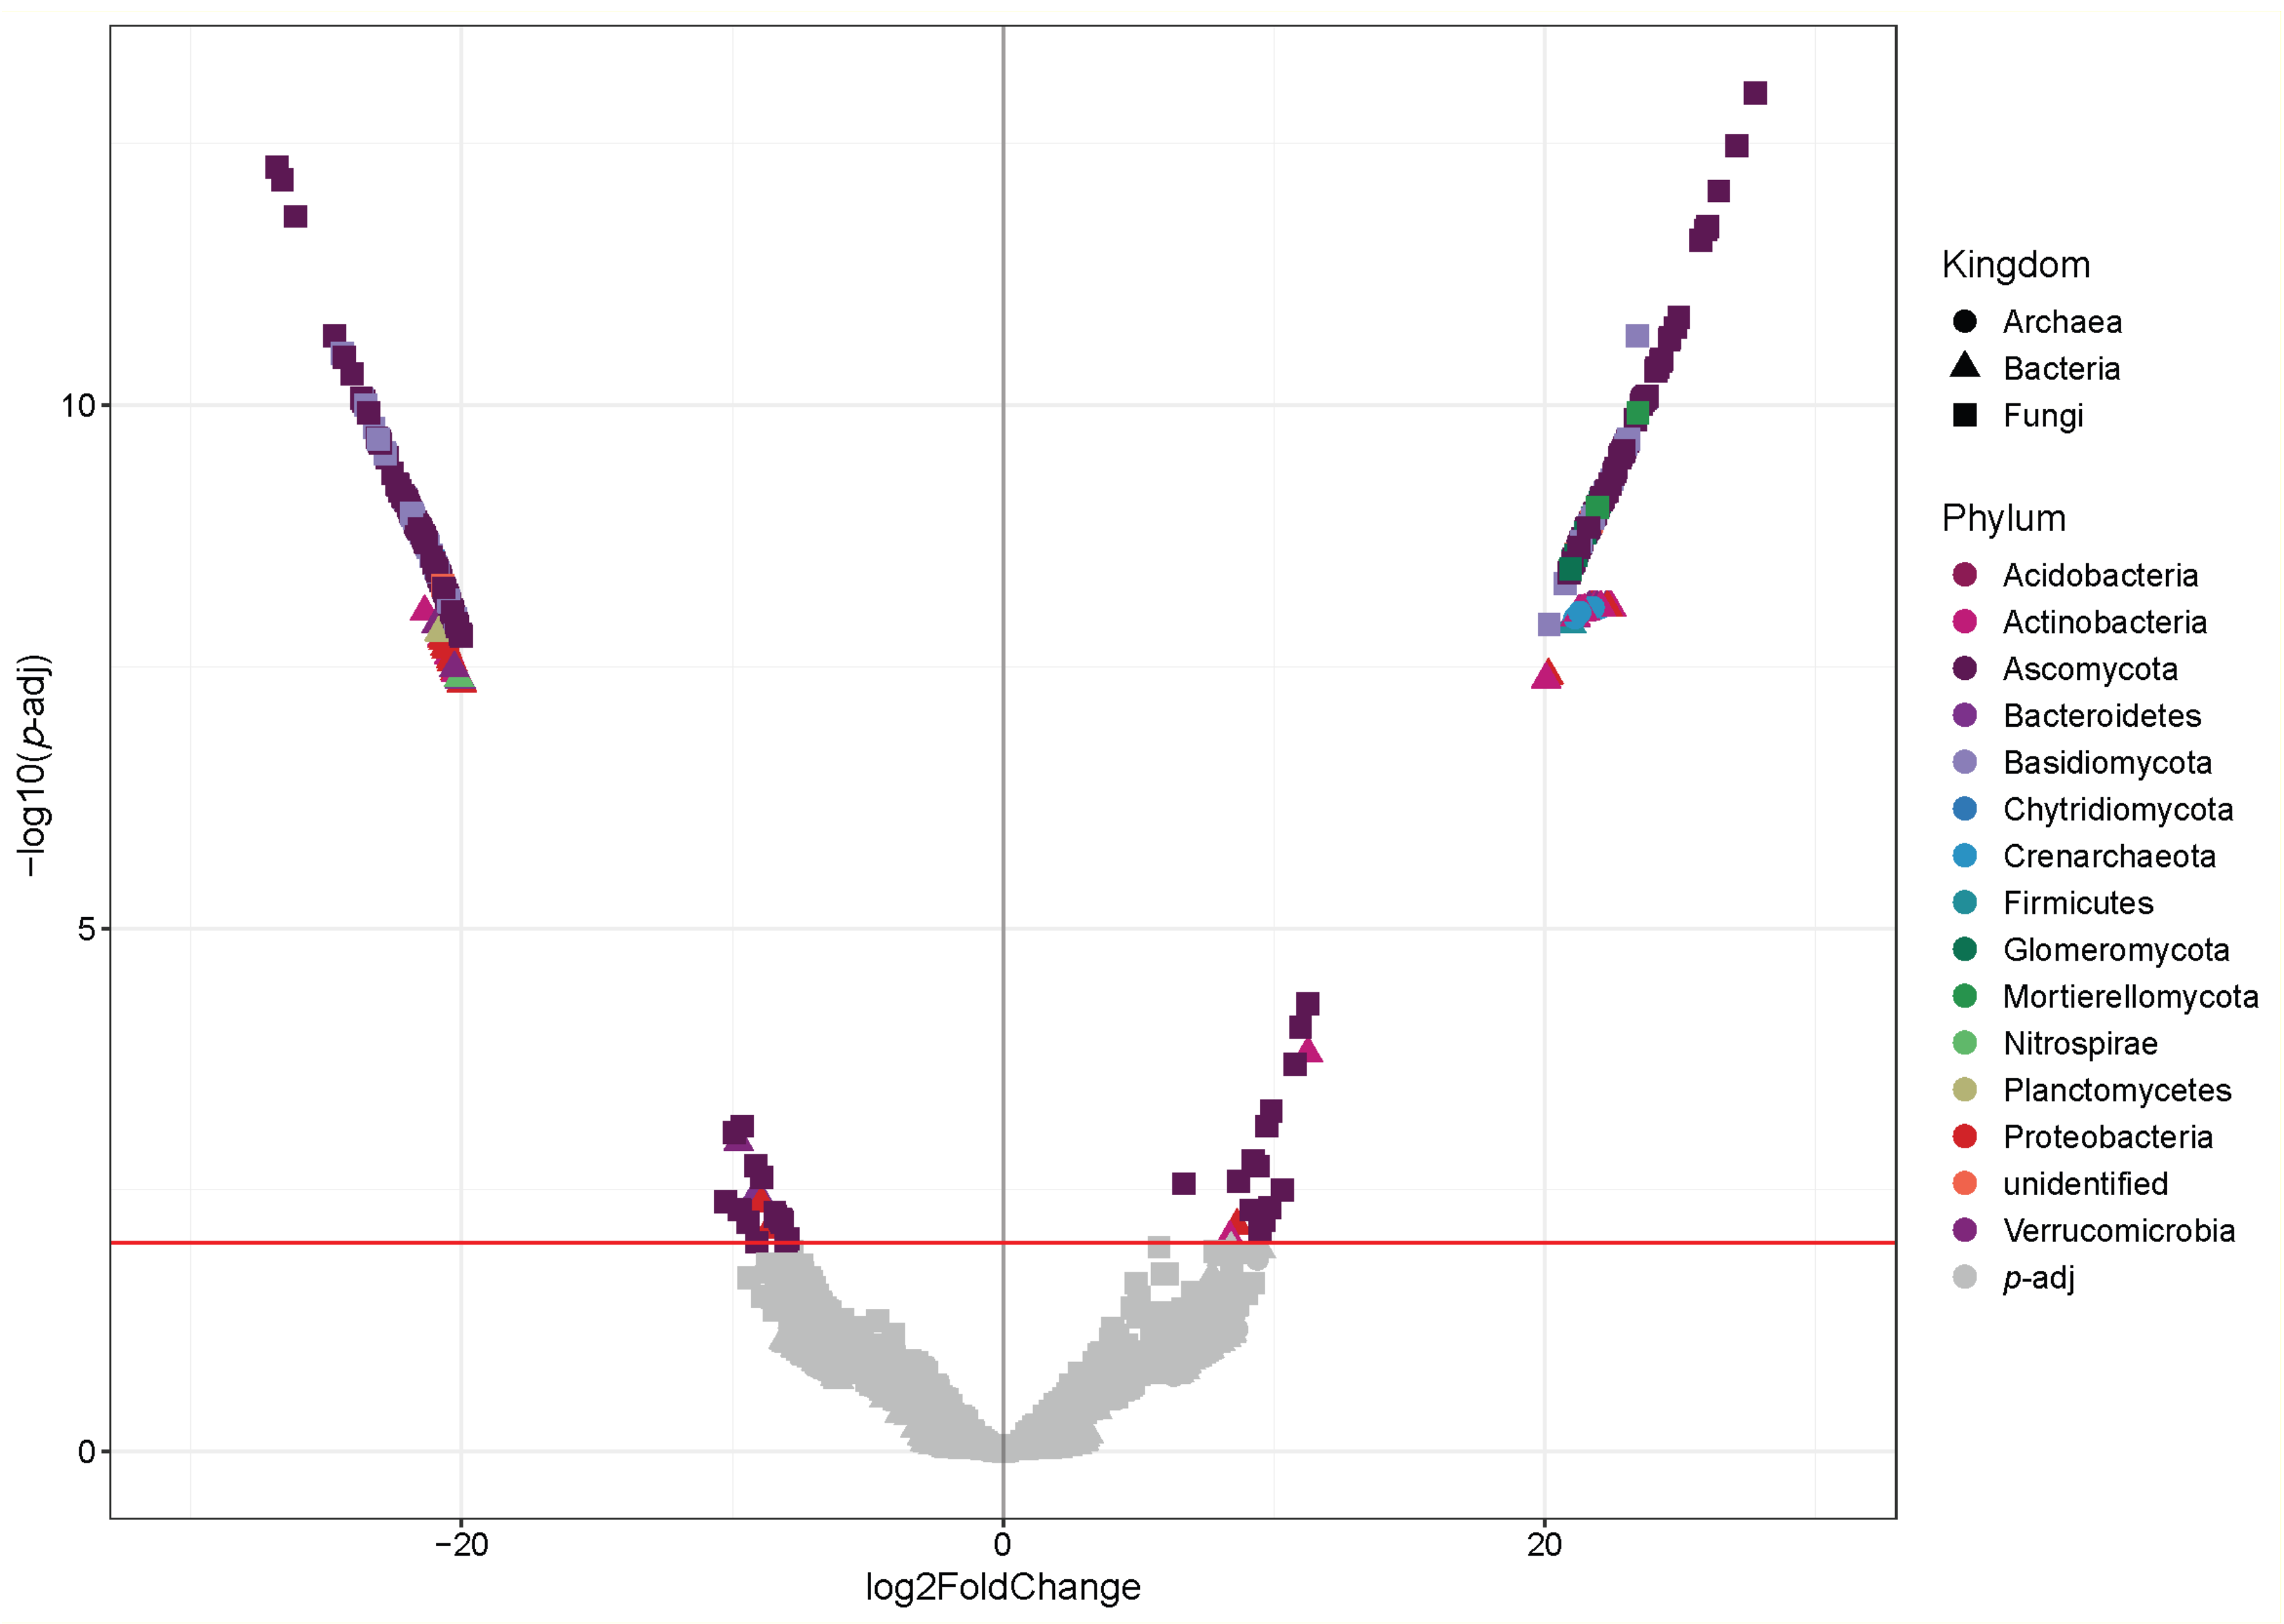
3.5. Analysis of Differential Abundance of Microorganisms

The DeSeq analysis represented in a Volcano plot allowed the identification of differentially represented ASVs in the microbial communities in the soil of plant communities in the xerophytic shrubland versus sclerophyllous forest (Figure 12, Supplementary Table S4). Particularly, 335 ASVs among the sites are observed; 167 ASVs in the sclerophyllous forest and 168 in xerophytic shrubland. The community is composed of 16 phyla, where Ascomycota (199 ASV), Basidiomycota (47), Actinobacteria (23 ASV) and Proteobacteria (18) stand out.
Although these different taxa were found at both sites, they were distributed in a different manner; the phyla Ascomycota (107 ASV), Basidiomycota (32 ASV) and Proteobacteria (13 ASV) were more abundant in the sclerophyllous forest, while the phyla Actinobacteria (18 ASV) and Acidobacteria (3 ASV) were more abundant in the xerophytic shrubland.
When comparing the ASVs of the microbial communities in the hygrophilous forest and the dry sclerophyllous forest based on the DeSeq analysis represented in a Volcano plot (Figure 13), 563 ASVs were found to be significant (p-adj). The community is composed of 49 phyla, where Ascomycota (264 ASVs), Basidiomycota (100 ASVs), Proteobacteria (61 ASVs), Actinobacteria (47 ASVs), Acidobacteria (28 ASVs) and Gemmatimonadetes (11 ASVs) stand out. Regarding their distribution, the phyla Ascomycota (181 ASVs), Basidiomycota (72 ASVs), and Actinobacteria (25 ASVs) are more abundantly found in the dry sclerophyllous forest and Acidobacteria (15 ASVs), Gemmatimonadetes (9 ASVs) and Chytridiomycota (5 ASVs) in the hygrophilous forest.

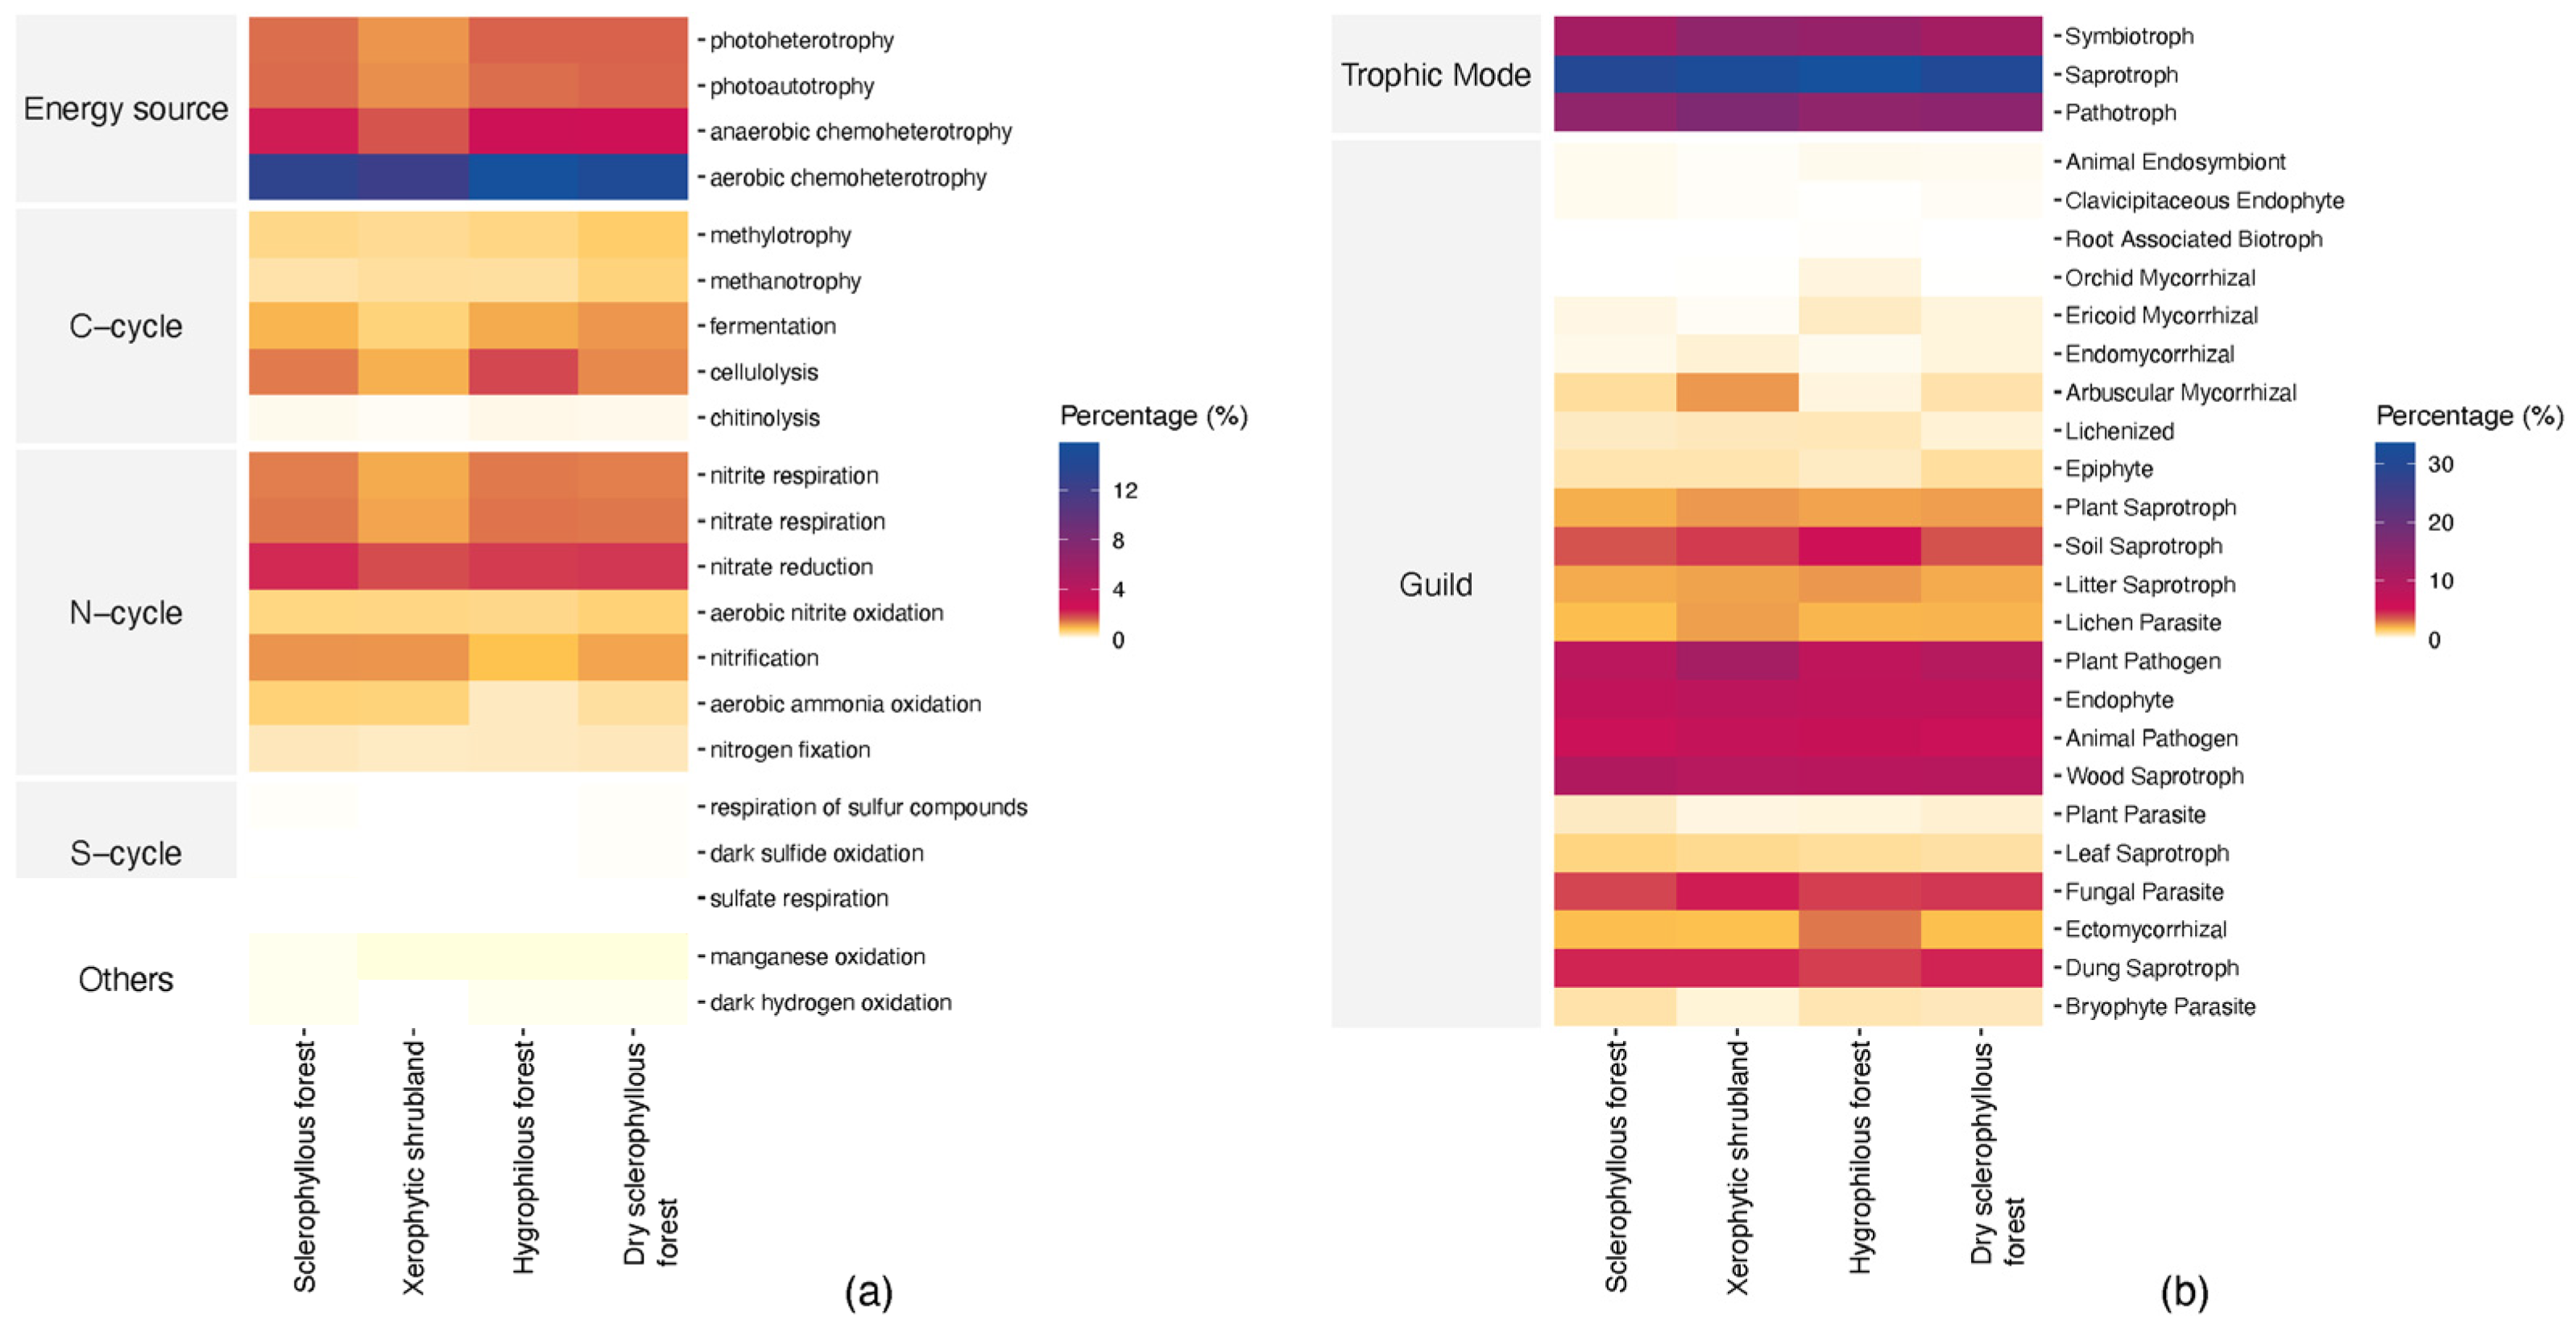
3.6. Predicted Potential Microbial Function

It was predicted that the potential functional profile microbial function of prokaryote communities (Figure 14a) would be similar in each site. Aerobic chemoheterotrophs, anaerobic chemoheterotrophs, photoheterotrophy and photo-autotrophy are predominant in obtaining energy; while nitrate reduction is associated with the nitrogen cycle, the cellulolytic bacteria are associated with the carbon cycle. Regarding fungi (Figure 14b), at a trophic level, saprotrophic fungi, followed by pathotroph and symbiotroph, are predominant in all sites; regarding ecological guilds, the plan pathogen, endophyte, animal pathogen and wood saprotroph stand out. Regarding each plant community, a slight increase in nitrifying prokaryotes is observed in the sclerophyllous forest, hygrophilous forest and dry sclerophyllous forest in comparison with the xerophytic shrubland; and, regarding fungi, an increase in the soil saprotroph in the sclerophyllous forest, fungal parasites in the xerophytic shrubland and dung saprotroph in the sclerophyllous forest, xerophytic shrubland and dry sclerophyllous forest is observed.

4. Discussion

4.1. Toposequence, Microbial and Plant Communities in PNLC

In a toposequence, the direction of the slope is a significant topographic factor that affects the local microclimate, influencing the solar radiation, soil temperature, water retention and availability and nutrient dynamics [62,63,64]. These conditions determine the plant distribution and potentially determine the soil microbial communities’ composition and activity, which has been reported for the north- and south-facing slopes in Chilean national parks, such as Pan de Azúcar, Santa Gracia, La Campana and Nahuelbuta, each of them with a different type of climate [21,22,23], and for the north and south slopes of the Italian Alps [2,65]. These studies, focused on climosequences and toposequences, have reported differences in the soil microbial communities’ [66,67] diversity, abundance and activity. In the Chilean national parks’ case, there was a comparative study conducted along the north–south climatic gradient of the coast of Chile which, among other things, accounts for changes in microbial abundancy and biodiversity (i.e., bacteria and archaea) in relation with the north–south arid–humid gradient [21,22]. Likewise, a study reveals the change in microalgae and cyanobacteria richness associated with the biocrusts along this gradient, where a lower species richness is observed in arid climates and a higher richness in Mediterranean climates [68].
According to our study, the spatial distribution of the microbial composition and structure and soil characteristics of the sites in PNLC was associated with sunlight exposure gradients, elevation and plant cover, specifically, on the basis of the comparison of two pairs of sites (sclerophyllous forest–xerophytic shrubland and hygrophilous forest–dry sclerophyllous forest).
Hence, the significant influence of climatic variables, such as precipitation and soil physicochemical conditions associated with the C and N composition of the organic matter, was observed in the sclerophyllous forest in comparison with the xerophytic shrubland. This is related to higher humidity conditions and a slightly lower temperature in the south-facing sclerophyllous forest, in contrast with the xerophytic shrubland, which presents a higher sunlight exposure, less plant cover and less humidity [37]. These environmental variables were significant in accounting for the prokaryotic and fungal community structure (Figure 6a,b). Variables relating to organic matter composition, temperature seasonality and temperature annual range, typical environmental conditions in this type of forest, in which growth is restricted to the bottom of ravines, i.e., with more humidity and less light availability, were especially significant for hygrophilous forest soil microorganisms [38]. Consequently, a higher richness, diversity and evenness of ravine fungal species, consistent with the data on the Central Chile template and coastal forests [69,70], was observed.
Slope, temperature seasonality and C/N were some of the significant variables for prokaryotes in the dry sclerophyllous forest. C/N, temperature annual range and temperature seasonality were significant for fungi. Although Chilean palm trees (Jubaea chilensis) in the dry sclerophyllous forest and hygrophilous forest are not predictors of the type of plant communities, since they are found in all habitats of Valle de Ocoa [71], the results showed a large Chytridiomycota and Mucoromycota fungal relative abundance that might be related to the presence of palm trees, which is a plant species found in both sites.

4.2. Variation in the Microbial Community and Its Association with the Environmental Conditions of the Plant Communities

There is a relationship between the microbial community structure in PNLC and plant distribution, where a greater differentiation between the bacterial and fungal communities in soils associated with the xerophytic shrubland and the hygrophillous forest, respectively, is highlighted. The comparison at higher taxonomical levels indicates that, in particular, soil fungi show more specificity associated with the plant communities that we have studied in PNLC.
In general, the bacterial phyla Proteobacteria, Actinobacteria and Acidobacteria comprised the most representative bacterial composition of soils, which is consistent with former studies of the Mediterranean semi-arid soils of PNLC [24]. The bacterial phyla Gemmatimonadetes, Bacteroidetes and Verrucomicrobia are frequently found in PNLC soil. The phylum Gemmatimonadetes is a cosmopolitan bacterial phylum, the distribution of which is related to the low water content of xeric soils [72]. Additionally, bacteria related with the bacterial phyla Bacteroidetes and Verrucomicrobia are commonly found in the rhizosphere, are involved in organic matter decomposition [73,74], and correlate with the soil physicochemical characteristics, such as pH and C/N ratio [75].
Certain individual microbial genera, in particular, showed a differential distribution associated with the plant communities; for instance, phylotype DA101 (Verrucomicrobia) [76] was the most abundant in the sclerophyllous forest and xerophytic shrubland, followed by the genera Rhodoplanes (Proteobacteria) in the sclerophyllous forest and dry sclerophyllous forest when comparing it with the other two sites (hygrophilous forest and xerophytic shrubland). Phylotype DA101 corresponds to Ca. Udaeobacter copiosus [76], a globally ubiquitous bacterium in a wide range of soils [75]. Rhodoplanes is a potentially phototrophic [77] and nitrogen-fixing bacteria [78]; Catania et al. (2022) reported that Rhodoplanes is a rare soil bacterium that has been detected in the soils of Spain, Portugal and Italy, associated with extremely dry and low-nutrient conditions [79], which are ecofunctional characteristics that allow them proliferate in Mediterranean semi-arid soils [80,81].
The phylum Ascomycota was the most abundant fungi in all of the sites, where its contribution to the total percentage of fungi in the sclerophyllous forest and dry sclerophyllous forest in PNLC stands out. In general, Ascomycota fungi play an important role in organic matter decomposition, the formation of humus, soil nutrient recycling and, additionally, are mutualists and parasites [82]. Furthermore, the significant relative abundance of Chytridiomycota and Mucoromycota in the hygrophilous forest and dry sclerophyllous forest suggests that these might be site-specific phyla of those plant communities, at a higher altitude, potentially favoring plant development in this type of environment in PNLC. The Chytridiomycotas group of fungi inhabits semi-arid soils [83] and show extreme cold and heat tolerance [84], while the saprophytic fungi of the phylum Mucoromycota are present in the soil and compost [85]. These correspond to endophytic fungal groups at the base of the phylogenetic tree of fungi [86] that might be adapted to specific environmental conditions that favor palm tree growth in the hygrophilous forest and the dry sclerophyllous forest.
Our research is consistent with the results reported by Egidi et al. (2019), which found high-specificity fungal OTUs when comparing four grassland (mild, mountain, coastal and arid) bioregions in Australia, the community structure of which was mainly associated with edaphic variables, such as soil organic carbon, pH, phosphorous, gravel, magnesium, manganese, copper and iron, as well as the distance between sites [87].
The distribution of the edaphic fungal and bacterial communities in PNLC is related with Mediterranean environmental conditions and potential ecological interactions with the endemic vegetation of the study area. Moreover, there is a higher fungal degree of specificity and potential endemism in PNLC compared with prokaryotes, since there are more than 37% unassigned groups and 1.8% unclassified groups in the databases in the case of fungi, in comparison with 3% of unassigned prokaryotic sequences. However, a high percentage of unassigned sequences has been reported for eukaryotes using ITS amplicons [88] and for functional fungal guilds, reaching up to 38.6% [89].

4.3. Key Microbial Taxa, Potential Functions and Their Relation with the Different Plant Communities of PNLC

In our study, the microbial function prediction indicates the presence of functional groups of the nitrogen cycle, among other biogeochemical cycles, which has been linked to forests with high plant species richness [90]—for example, nitrate reduction communities, such as Rhodoplanes [91] and ammonia-oxidizing archaea in the sclerophyllous forest, xerophytic shrubland and dry sclerophyllous forest. In general, the Archaea domain was not abundant in the PNLC soil; however, the ammonia-oxidizing archaea were mostly found in the sclerophyllous forest soil. This might be related to N reduction in both plant communities, since it has been suggested that the soil C/N ratio was the best individual predictor of archaea relative abundance and that dominance decreases in high inorganic N availability conditions, perhaps due to competitive interactions with nitrifying bacteria [92]. The foregoing is consistent with studies where an increased presence of archaea in north-facing slopes (shade) in the southern Alps in northern Italy has been observed [2].
Furthermore, our study found a predominance of microbial groups of the soil rare biosphere, such as phylum TM7 (Saccharibacteria) with Chlorobi [93], which are specific to the hygrophilous forest microbial community in comparison with the dry sclerophyllous forest microbial community. In the xerophytic shrubland, Chloroflexi [94] and Cyanobacteria [95], photosynthetic organisms that might be related to this site due to their higher sunlight exposure, were the most abundant prokaryotic phyla. The phylum Actinobacteria, along with the genera Pseudonocardia and Mycobacterium, which are closely related taxa that have been associated with a higher nutrient absorption [96], plant growth [97] and nitrogen fixation [98], share predominance in the hygrophilous forest and dry sclerophyllous forest soils.
Regarding fungi, saprophytic fungi, decomposers associated with the carbon cycle, were predominantly found, which is consistent with the results reported by research conducted in Norway’s beech tree forests [99,100] and in Mediterranean zones [101].
In the PNLC soil, the phylum Ascomycota, with the genera Alternaria, Rutstroemia, Cladosporium, Nothophoma and Zopfiella, among others, was mainly found in the grasslands and shrublands of arid environments which are associated with processes related with soil stability and plant biomass decomposition in this type of ecosystem [101]. Also, in the case of decomposer fungi, it was observed that the increase in the C/N ratio was related to a higher fungal diversity than bacterial diversity [102], which accounts for the larger number of specialist fungi in the hygrophilous forest, followed by the dry sclerophyllous forest and sclerophyllous forest. The genera Cladophialophora, described in different geographical regions; Hormonema, an opportunistic plant pathogen, mainly found in the phyllosphere [103,104]; and Coniochaeta, described as a tree pathogenic fungus [105], were observed in the dry sclerophyllous forest [106]. In particular, a higher relative abundance of the fungal community of the genera Solicoccozyma [107] of the phylum Basidiomycota was found in the dry sclerophyllous forest, hygrophilous forest and in a sample spot in the sclerophyllous forest.
The study of the soil fungal community indicates potential plant–fungal associations, such as in the case of the genus Humicola, which has been described as ascomycetes associated with ectomycorrhizas in the Tasmanian wet sclerophyllous forests [108], or the genera Dothideomycetes and Sordariomycetes, commonly found in tropical and subtropical palm trees [109].
In addition, the genus Mortierella spp. saprophytic and decomposer fungi, highly valuable for agricultural soils since they promote plant growth by way of phosphorous and iron bioavailability, were found in PNLC. These are also present in hostile environments [110] such as nutrient-poor (oligotrophic) soils, bare rocks, sandstone, dunes and areas destroyed by wildfires [111,112].

5. Conclusions

The microbial community structure, including prokaryotes and fungi, is spatially distributed in relation with a toposequence associated with Parque Nacional La Campana (PNLC)’s orientation and vegetation. In particular, the influence of the topoclimate conditions on the microbial community structure was more evident in contrasting sites, such as the xerophytic shrubland and hygrophilous forest. Both fungi and prokaryotes are dominated by genera of the rare biosphere in the hygrophilous forest and the dry sclerophyllous forest, which supports our hypothesis on the structure and role of microbial communities in PNLC. Specifically, each site presented dominant communities, highlighting the following: Crenarchaeote, Humicola and Mortierella were dominant in the sclerophyllous forest; Chloroflexi, Cyanobacteria and Alternaria in the xeric scrubland; Solicoccozyma in the dry sclerophyllous forest; and Cladophialophora in the hygrophilous forest. A great presence of Chytridiomycota and Mucoromycota fungi in the sclerophyllous dry forest and hygrophilous forest could be related to the presence of Chilean palms (Jubaea chilensis).
The potential functional prediction of microbial communities indicates the presence of functional groups associated with the nitrogen cycle, particularly those involved in nitrate reduction and ammonia oxidation, with a notable prevalence in the sclerophyllous forest and xerophytic scrub. The prevalence of saprophytic and decomposer fungi indicates a pivotal function in the decomposition of organic matter and the recycling of soil nutrients, a conclusion that is consistent with studies conducted in Mediterranean regions and temperate forests.
The greater diversity and specificity of fungi in hygrophytic forests compared to other vegetation types underscores the pivotal role of edaphic and climatic conditions in structuring fungal communities. The abundance of fungal genera such as Solicoccozyma, Humicola, Mortierella and others reflects potential plant–fungus associations and adaptations to specific environmental conditions in PNLC.
Further studies on the contribution of microorganisms are required to understand the role of diversity and microorganisms’ functions on the soil, so as to develop conservation strategies and the possible restoration of edaphic ecosystems affected by human activity.

Supplementary Materials

The following supporting information can be downloaded at: https://www.mdpi.com/article/10.3390/microorganisms12081569/s1, Figure S1: Rarefaction curves for fungi sequences and Figure S2: Rarefaction curves for fungi prokaryotes, Table S1: Environmental and soil physico chemical conditions, Table S2: Per-sample sequence counts, Table S3: Significance regarding each environmental variables from the RDA analysis, Table S4: DeSeq analysis: identification of differentially represented ASVs in the microbial communities in the soil of plant communities in the xerophytic shrubland versus sclerophyllous forest and Table S5: DeSeq analysis: identification of differentially represented ASVs in the microbial communities in the soil of plant communities in the hygrophilous forest versus dry sclerophyllous forest.

Author Contributions

Conceptualization, C.Q.-U., J.-P.F. and V.M.; methodology, C.Q.-U., J.-P.F., V.M. and P.A.-M.; writing—original draft preparation, C.Q.-U., J.-P.F., R.O. and V.M.; writing—review and editing, C.Q.-U., J.-P.F., R.O., A.M.-M., R.V. and V.M.; funding acquisition, C.Q.-U., J.-P.F. and V.M. All authors have read and agreed to the published version of the manuscript.

Funding

This research was funded by FONDECYT grants #11170566 and #1211977, Concurso Regular de Investigación 2019 UPLA (CNE 23-20). Additional funding was provided by Programa de Biodiversidad de la Facultad de Ciencias Naturales y Exactas and Project RED21992 “Sistema articulado de investigación en Cambio Climático y Sustentabilidad en zonas costeras de Chile”. C.Q.-U. was supported by the Scholarship Program Beca Doctorado Nacional ANID 2022 N°21221130 and “Tesis que impactan territorios” Programa NODO CIV-VAL 220002 ANID. The APC was funded by the Dirección General de Investigación UPLA, Universidad de Playa Ancha through Plan de Fortalecimiento Universidades Estatales—Ministerio de Educación, Convenio UPA 1999 grant.

Data Availability Statement

The original contributions presented in the study are included in the article/Supplementary Materials; further inquiries can be directed to the corresponding author/s.

Acknowledgments

We acknowledge the Corporación Nacional Forestal (CONAF) and the Administration of Parque Nacional La Campana and their staff for field campaign support. We are grateful to Pamela Ramírez, Paulina Hernández and Yael Aguirre for their support in taking samples; to Claudia Cano, Marta Muñoz and Fabiola Moenne for their technical support; and to Katalina Salvador for map editing.

Conflicts of Interest

The authors declare no conflicts of interest.

References

  1. Vandenkoornhuyse, P.; Quaiser, A.; Duhamel, M.; Le Van, A.; Dufresne, A. The Importance of the Microbiome of the Plant Holobiont. New Phytol. 2015, 206, 1196–1206. [Google Scholar] [CrossRef]
  2. Bardelli, T.; Gómez-Brandón, M.; Ascher-Jenull, J.; Fornasier, F.; Arfaioli, P.; Francioli, D.; Egli, M.; Sartori, G.; Insam, H.; Pietramellara, G. Effects of Slope Exposure on Soil Physico-Chemical and Microbiological Properties along an Altitudinal Climosequence in the Italian Alps. Sci. Total Environ. 2017, 575, 1041–1055. [Google Scholar] [CrossRef]
  3. Torsvik, V.; Øvreås, L. Microbial Diversity and Function in Soil: From Genes to Ecosystems. Curr. Opin. Microbiol. 2002, 5, 240–245. [Google Scholar] [CrossRef]
  4. Philippot, L.; Raaijmakers, J.M.; Lemanceau, P.; van der Putten, W.H. Going Back to the Roots: The Microbial Ecology of the Rhizosphere. Nat. Rev. Microbiol. 2013, 11, 789–799. [Google Scholar] [CrossRef]
  5. Fierer, N. Embracing the Unknown: Disentangling the Complexities of the Soil Microbiome. Nat. Rev. Microbiol. 2017, 15, 579–590. [Google Scholar] [CrossRef]
  6. Cederlund, H.; Wessén, E.; Enwall, K.; Jones, C.M.; Juhanson, J.; Pell, M.; Philippot, L.; Hallin, S. Soil Carbon Quality and Nitrogen Fertilization Structure Bacterial Communities with Predictable Responses of Major Bacterial Phyla. Appl. Soil Ecol. 2014, 84, 62–68. [Google Scholar] [CrossRef]
  7. Sul, W.J.; Asuming-Brempong, S.; Wang, Q.; Tourlousse, D.M.; Penton, C.R.; Deng, Y.; Rodrigues, J.L.M.; Adiku, S.G.K.; Jones, J.W.; Zhou, J.; et al. Tropical Agricultural Land Management Influences on Soil Microbial Communities through Its Effect on Soil Organic Carbon. Soil Biol. Biochem. 2013, 65, 33–38. [Google Scholar] [CrossRef]
  8. Oliverio, A.M.; Bradford, M.A.; Fierer, N. Identifying the Microbial Taxa That Consistently Respond to Soil Warming across Time and Space. Glob. Change Biol. 2017, 23, 2117–2129. [Google Scholar] [CrossRef]
  9. Pett-Ridge, J.; Firestone, M.K. Redox Fluctuation Structures Microbial Communities in a Wet Tropical Soil. Appl. Environ. Microbiol. 2005, 71, 6998–7007. [Google Scholar] [CrossRef]
  10. Erktan, A.; Or, D.; Scheu, S. The Physical Structure of Soil: Determinant and Consequence of Trophic Interactions. Soil Biol. Biochem. 2020, 148, 107876. [Google Scholar] [CrossRef]
  11. Parkin, T.B. Soil Microsites as a Source of Denitrification Variability. Soil Sci. Soc. Am. J. 1987, 51, 1194–1199. [Google Scholar] [CrossRef]
  12. Petersen, S.O.; Nielsen, T.H.; Frostegård, Å.; Olesen, T. O2 Uptake, C Metabolism and Denitrification Associated with Manure Hot-Spots. Soil Biol. Biochem. 1996, 28, 341–349. [Google Scholar] [CrossRef]
  13. Lynch, J.M.; Whipps, J.M. Substrate Flow in the Rhizosphere. Plant Soil 1990, 129, 1–10. [Google Scholar] [CrossRef]
  14. Aguilera, P.; Cornejo, P.; Borie, F.; Barea, J.M.; von Baer, E.; Oehl, F. Diversity of Arbuscular Mycorrhizal Fungi Associated with Triticum aestivum L. Plants Growing in an Andosol with High Aluminum Level. Agric. Ecosyst. Environ. 2014, 186, 178–184. [Google Scholar] [CrossRef]
  15. Benedetti, S.; Balocchi, F.; Hormazábal, M. Hongos Micorrícicos Arbusculares (HMA) Asociados a Poblaciones Naturales de Peumus Boldus En Chile Central Arbuscular Mycorrhizal Fungi (AMF) Linked to Peumus Boldus Natural Formation in Central. Gayana Bot. 2018, 75, 431–437. [Google Scholar] [CrossRef]
  16. Castillo, C.G.; Borie, F.; Oehl, F.; Sieverding, E. Arbuscular Mycorrhizal Fungi Biodiversity: Prospecting in Southern-Central Zone of Chile. A Review. J. Soil Sci. Plant Nutr. 2016, 16, 400–422. [Google Scholar] [CrossRef]
  17. Bull, A.T.; Asenjo, J.A. Microbiology of Hyper-Arid Environments: Recent Insights from the Atacama Desert, Chile. Antonie Van Leeuwenhoek Int. J. Gen. Mol. Microbiol. 2013, 103, 1173–1179. [Google Scholar] [CrossRef]
  18. Okoro, C.K.; Brown, R.; Jones, A.L.; Andrews, B.A.; Asenjo, J.A.; Goodfellow, M.; Bull, A.T. Diversity of Culturable Actinomycetes in Hyper-Arid Soils of the Atacama Desert, Chile. Antonie Leeuwenhoek Int. J. Gen. Mol. Microbiol. 2009, 95, 121–133. [Google Scholar] [CrossRef]
  19. Schulze-Makuch, D.; Wagner, D.; Kounaves, S.P.; Mangelsdorf, K.; Devine, K.G.; de Vera, J.-P.; Schmitt-Kopplin, P.; Grossart, H.-P.; Parro, V.; Kaupenjohann, M.; et al. Transitory Microbial Habitat in the Hyperarid Atacama Desert. Proc. Natl. Acad. Sci. USA 2018, 115, 2670–2675. [Google Scholar] [CrossRef]
  20. Zhang, Q.; Acuña, J.J.; Inostroza, N.G.; Mora, M.L.; Radic, S.; Sadowsky, M.J.; Jorquera, M.A. Endophytic Bacterial Communities Associated with Roots and Leaves of Plants Growing in Chilean Extreme Environments. Sci. Rep. 2019, 9, 4950. [Google Scholar] [CrossRef]
  21. Oeser, R.A.; Stroncik, N.; Moskwa, L.M.; Bernhard, N.; Schaller, M.; Canessa, R.; van den Brink, L.; Köster, M.; Brucker, E.; Stock, S.; et al. Chemistry and Microbiology of the Critical Zone along a Steep Climate and Vegetation Gradient in the Chilean Coastal Cordillera. Catena 2018, 170, 183–203. [Google Scholar] [CrossRef]
  22. Bernhard, N.; Moskwa, L.M.; Schmidt, K.; Oeser, R.A.; Aburto, F.; Bader, M.Y.; Baumann, K.; von Blanckenburg, F.; Boy, J.; van den Brink, L.; et al. Pedogenic and Microbial Interrelations to Regional Climate and Local Topography: New Insights from a Climate Gradient (Arid to Humid) along the Coastal Cordillera of Chile. Catena 2018, 170, 335–355. [Google Scholar] [CrossRef]
  23. Rodriguez, V.; Moskwa, L.M.; Oses, R.; Kühn, P.; Riveras-Muñoz, N.; Seguel, O.; Scholten, T.; Wagner, D. Impact of Climate and Slope Aspects on the Composition of Soil Bacterial Communities Involved in Pedogenetic Processes along the Chilean Coastal Cordillera. Microorganisms 2022, 10, 847. [Google Scholar] [CrossRef] [PubMed]
  24. Vanderplank, S.E.; Moreira-Muñoz, A.A.; Hobohm, C.; Pils, G.; Noroozi, J.; Clark, V.R. Endemism in Vascular Plants; Hobohm, C., Ed.; Springer: Dordrecht, The Netherlands, 2014; Volume 9, ISBN 978-94-007-6912-0. [Google Scholar]
  25. Mittermeier, R.A.; Turner, W.R.; Larsen, F.W.; Brooks, T.M.; Gascon, C. Global biodiversity conservation: The critical role of hotspots. In Biodiversity Hotspots; Springer: Berlin/Heidelberg, Germany, 2011; pp. 3–22. [Google Scholar]
  26. Manríquez, H.; Mansilla, P.; Figueroa-Sterquel, R.; Moreira-Muñoz, A. Geodiversity Meets Biodiversity: A Landscape Approach for Biogeocultural Conservation and Governance in Mediterranean Central Chile. J. Prot. Mt. Areas Res. 2019, 11, 43–48. [Google Scholar] [CrossRef]
  27. Leguia-Cruz, M.; Tejer-Nos, C.; Cubillos, N.O.; Mansilla-Quiñones, P.; Moreira-Muñoz, A. Biocultural Resistance and Re-Existence through a Dialogue of Knowledges and Citizen Art in a Threatened Biosphere Reserve. J. Prot. Mt. Areas Res. 2021, 13, 102–107. [Google Scholar] [CrossRef]
  28. Moreira-Muñoz, A.; del Río, C.; Leguia-Cruz, M.; Mansilla-Quiñones, P. Spatial Dynamics in the Urban-Rural-Natural Interface within a Social-Ecological Hotspot. Appl. Geogr. 2023, 159, 103060. [Google Scholar] [CrossRef]
  29. Mittermeier, R.; Myers, N.; Gill, P.; Mittermeier, C. Hotspots: Earth’s Biologically Richest and Most Endangered Terrestrial Ecoregions. J. Mammal. 2002, 83, 630–633. [Google Scholar] [CrossRef]
  30. Elórtegui, S.; Moreira-Muñoz, A. (Eds.) El Paisaje: Formas, Texturas y Colores. In Parque Nacional La Campana: Origen de Una Reserva de La Biósfera En Chile Central, 2nd ed.; Taller la Era: Viña del Mar, Chile, 2009. [Google Scholar]
  31. Casale, J.-F.; Borsdorf, A.; Moreira-Muñoz, Á. Reservas de la biosfera como laboratorios para la sustentabilidad: Paisajes de conservación y ordenamiento territorial. In Reservas de la Biosfera de Chile: Laboratorios para la Sustentabilidad; Serie Geolibros; Academia de Ciencias Austriaca-Pontifiia Universidad Católica de Chile-Instituto de Geografía: Santiago, Chile, 2014; Volume 17, pp. 272–293. [Google Scholar]
  32. Myers, N.; Mittermeier, R.A.; Mittermeier, C.G.; Da Fonseca, G.A.B.; Kent, J. Biodiversity Hotspots for Conservation Priorities. Nature 2000, 403, 853–858. [Google Scholar] [CrossRef]
  33. Quintanilla, V.G.; Cadiñanos, J.A.; Latasa, I.; Lozano, P.J. Aproximación Biogeográfica a Los Bosques de La Zona Mediterránea de Chile: Caracterización e Inventario. Boletín Asoc. Geógrafos Españoles 2012, 2012, 91–114. [Google Scholar] [CrossRef]
  34. Quintanilla, V. Situación Postincendio En Ecosistemas de Un Macizo Montañoso de Gran Valor Geobotánico, En La Cordillera Meditarránea de Chile. Cad. Geografia. Coimbra FLUC 2009, 28, 149–150. [Google Scholar]
  35. Gajardo, R. La Vegetación Natural de Chile: Clasificación y Distribución Geográfica; Universitaria: Santiago, Chile, 1995. [Google Scholar]
  36. Villaseñor, R. Guía para el Reconocimiento de las Especies Arbóreas y Arbustivas del Parque Nacional La Campana; CONAF V Región: Valparaíso, Chile, 1998. [Google Scholar]
  37. Hauck, L.; Moreira-Muñoz, A.; Nezadal, W. La Flora Exótica Ruderal Del Parque Nacional La Campana, Región de Valparaíso, Chile Central. Gayana Bot. 2016, 73, 206–219. [Google Scholar] [CrossRef]
  38. Luebert, F.; Muñoz Schick, M.; Moreira-Muñoz, A. Vegetación y flora. In Parque Nacional La Campana: Origen de una Reserva de la Biósfera en Chile Central; Elórtegui, S., Moreira-Muñoz, A., Eds.; Taller La Era: Viña del Mar, Chile, 2009. [Google Scholar]
  39. Luebert, F.; Pliscoff, P. Sinopsis Bioclimática y Vegetacional de Chile; Editorial Universitaria: Santiago, Chile, 2006. [Google Scholar]
  40. Dierschke, H. Pflanzensoziologie: Grundlagen und Methoden, 1st ed.; UTB: Stuttgart, Germany, 1994. [Google Scholar]
  41. Knapp, R. Sampling Methods and Taxon Analysis in Vegetation Science; Springer: Dordrecht, The Netherland, 1984; Volume 4. [Google Scholar]
  42. San Martín, C.; Ramírez, C.; San Martín, J.; Villaseñor, R. Flora Y Vegetacion Del Estero Reñaca (V Region, Chile). Gayana Bot. 2001, 58, 31–46. [Google Scholar] [CrossRef]
  43. Fick, S.E.; Hijmans, R.J. WorldClim 2: New 1-km Spatial Resolution Climate Surfaces for Global Land Areas. Int. J. Climatol. 2017, 37, 4302–4315. [Google Scholar] [CrossRef]
  44. Boisier, J.P. CR2MET: A High-Resolution Precipitation and Temperature Dataset for the Period 1960–2021 in Continental Chile. (v2.5) [Data Set]; Zenodo: Genève, Switzerland, 2023. [Google Scholar]
  45. Ball, D.F. Loss-on-Ignition as an Estimate of Organic Matter and Organic Carbon in Non-Calcareous Soils. J. Soil Sci. 1964, 15, 84–92. [Google Scholar] [CrossRef]
  46. Sadzawka, R.A.; Carrasco, R.M.A.; Grez, Z.R.; Mora, G.M.d.l.L.; Flores, P.H.; Neaman, A. Métodos de Análisis Recomendados para los Suelos de Chile. Revisión 2006; Instituto de Investigaciones Agropecuarias: Santiago, Chile, 2006; Volume 34. [Google Scholar]
  47. Caporaso, J.G.; Lauber, C.L.; Costello, E.K.; Berg-Lyons, D.; Gonzalez, A.; Stombaugh, J.; Knights, D.; Gajer, P.; Ravel, J.; Fierer, N.; et al. Moving Pictures of the Human Microbiome. Genome Biol. 2011, 12, R50. [Google Scholar] [CrossRef] [PubMed]
  48. Degnan, P.H.; Ochman, H. Illumina-Based Analysis of Microbial Community Diversity. ISME J. 2012, 6, 183–194. [Google Scholar] [CrossRef] [PubMed]
  49. Callahan, B.J.; McMurdie, P.J.; Rosen, M.J.; Han, A.W.; Johnson, A.J.A.; Holmes, S.P. DADA2: High-Resolution Sample Inference from Illumina Amplicon Data. Nat. Methods 2016, 13, 581–583. [Google Scholar] [CrossRef] [PubMed]
  50. Eren, A.M.; Maignien, L.; Sul, W.J.; Murphy, L.G.; Grim, S.L.; Morrison, H.G.; Sogin, M.L. Oligotyping: Differentiating between Closely Related Microbial Taxa Using 16S rRNA Gene Data. Methods Ecol. Evol. 2013, 4, 1111–1119. [Google Scholar] [CrossRef] [PubMed]
  51. DeSantis, T.Z.; Hugenholtz, P.; Larsen, N.; Rojas, M.; Brodie, E.L.; Keller, K.; Huber, T.; Dalevi, D.; Hu, P.; Andersen, G.L. Greengenes, a Chimera-Checked 16S RRNA Gene Database and Workbench Compatible with ARB. Appl. Environ. Microbiol. 2006, 72, 5069–5072. [Google Scholar] [CrossRef]
  52. Abarenkov, K.; Nilsson, R.H.; Larsson, K.H.; Alexander, I.J.; Eberhardt, U.; Erland, S.; Høiland, K.; Kjøller, R.; Larsson, E.; Pennanen, T.; et al. The UNITE Database for Molecular Identification of Fungi—Recent Updates and Future Perspectives. New Phytol. 2010, 186, 281–285. [Google Scholar] [CrossRef]
  53. Abarenkov, K.; Zirk, A.; Piirmann, T.; Pöhönen, R.; Ivanov, F.; Nilsson, R.H.; Kõljalg, U. UNITE QIIME Release for Fungi 2; Version 10.05.2021; UNITE Community: Greenville, SC, USA, 2021. [Google Scholar]
  54. McMurdie, P.J.; Holmes, S. Phyloseq: An R Package for Reproducible Interactive Analysis and Graphics of Microbiome Census Data. PLoS ONE 2013, 8, e61217. [Google Scholar] [CrossRef] [PubMed]
  55. Xu, S.; Zhan, L.; Tang, W.; Wang, Q.; Dai, Z.; Zhou, L.; Feng, T.; Chen, M.; Wu, T.; Hu, E.; et al. MicrobiotaProcess: A Comprehensive R Package for Deep Mining Microbiome. Innovation 2023, 4, 100388. [Google Scholar] [CrossRef]
  56. Andersen, K.S.; Kirkegaard, R.H.; Karst, S.M.; Albertsen, M. Ampvis2: An R Package to Analyse and Visualise 16S RRNA Amplicon Data. bioRxiv 2018, 299537. [Google Scholar] [CrossRef]
  57. Love, M.I.; Huber, W.; Anders, S. Moderated Estimation of Fold Change and Dispersion for RNA-Seq Data with DESeq2. Genome Biol. 2014, 15, 550. [Google Scholar] [CrossRef] [PubMed]
  58. Liu, C.; Cui, Y.; Li, X.; Yao, M. Microeco: An R Package for Data Mining in Microbial Community Ecology. FEMS Microbiol. Ecol. 2021, 97, fiaa255. [Google Scholar] [CrossRef]
  59. Louca, S.; Parfrey, L.W.; Doebeli, M. Decoupling Function and Taxonomy in the Global Ocean Microbiome. Science 2016, 353, 1272–1277. [Google Scholar] [CrossRef]
  60. Nguyen, N.H.; Song, Z.; Bates, S.T.; Branco, S.; Tedersoo, L.; Menke, J.; Schilling, J.S.; Kennedy, P.G. FUNGuild: An Open Annotation Tool for Parsing Fungal Community Datasets by Ecological Guild. Fungal Ecol. 2016, 20, 241–248. [Google Scholar] [CrossRef]
  61. Oksanen, J. Design Decisions and Implementation Details in Vegan; Vignette of the Package Vegan. R Package Version 2016; R Foundation: Vienna, Austria, 2016; pp. 2–4. [Google Scholar]
  62. Egli, M.; Sartori, G.; Mirabella, A.; Favilli, F.; Giaccai, D.; Delbos, E. Effect of North and South Exposure on Organic Matter in High Alpine Soils. Geoderma 2009, 149, 124–136. [Google Scholar] [CrossRef]
  63. Carletti, P.; Vendramin, E.; Pizzeghello, D.; Concheri, G.; Zanella, A.; Nardi, S.; Squartini, A. Soil Humic Compounds and Microbial Communities in Six Spruce Forests as Function of Parent Material, Slope Aspect and Stand Age. Plant Soil 2009, 315, 47–65. [Google Scholar] [CrossRef]
  64. Barbosa, W.R.; Romero, R.E.; Júnior, V.S.d.S.; Cooper, M.; Sartor, L.R.; Partiti, C.S.d.M.; Jorge, F.d.O.; Cohen, R.; de Jesus, S.L.; Ferreira, T.O. Effects of Slope Orientation on Pedogenesis of Altimontane Soils from the Brazilian Semi-Arid Region (Baturité Massif, Ceará). Environ. Earth Sci. 2015, 73, 3731–3743. [Google Scholar] [CrossRef]
  65. Egli, M.; Mirabella, A.; Sartori, G.; Zanelli, R.; Bischof, S. Effect of North and South Exposure on Weathering Rates and Clay Mineral Formation in Alpine Soils. Catena 2006, 67, 155–174. [Google Scholar] [CrossRef]
  66. Zhang, B.; Liang, C.; He, H.; Zhang, X. Variations in Soil Microbial Communities and Residues Along an Altitude Gradient on the Northern Slope of Changbai Mountain, China. PLoS ONE 2013, 8, e66184. [Google Scholar] [CrossRef] [PubMed]
  67. Djukic, I.; Zehetner, F.; Tatzber, M.; Gerzabek, M.H. Soil Organic-matter Stocks and Characteristics along an Alpine Elevation Gradient. J. Plant Nutr. Soil Sci. 2010, 173, 30–38. [Google Scholar] [CrossRef]
  68. Samolov, E.; Baumann, K.; Büdel, B.; Jung, P.; Leinweber, P.; Mikhailyuk, T.; Karsten, U.; Glaser, K. Biodiversity of Algae and Cyanobacteria in Biological Soil Crusts Collected along a Climatic Gradient in Chile Using an Integrative Approach. Microorganisms 2020, 8, 1047. [Google Scholar] [CrossRef] [PubMed]
  69. Rivas, Y.; Aponte, H.; Rivera-Salazar, D.; Matus, F.; Martínez, O.; Encina, C.; Retamal-Salgado, J. Microbial Community and Enzyme Activity of Forest Plantation, Natural Forests, and Agricultural Land in Chilean Coastal Cordillera Soils. Forests 2023, 14, 938. [Google Scholar] [CrossRef]
  70. Almonacid-Muñoz, L.; Herrera, H.; Fuentes-Ramírez, A.; Vargas-Gaete, R.; Larama, G.; Jara, R.; Fernández-Urrutia, C.; da Silva Valadares, R.B. Tree Cover Species Modify the Diversity of Rhizosphere-Associated Microorganisms in Nothofagus Obliqua (Mirb.) Oerst Temperate Forests in South-Central Chile. Forests 2022, 13, 756. [Google Scholar] [CrossRef]
  71. Villaseñor, R. Unidades Fisionómicas y Florísticas Del Parque Nacional La Campana. Chloris Chil. Rev. Chil. Flora Veg. 2021, 24, 128–134. [Google Scholar]
  72. Siles, J.A.; Rachid, C.T.C.C.; Sampedro, I.; García-Romera, I.; Tiedje, J.M. Microbial Diversity of a Mediterranean Soil and Its Changes after Biotransformed Dry Olive Residue Amendment. PLoS ONE 2014, 9, e103035. [Google Scholar] [CrossRef]
  73. Frenk, S.; Hadar, Y.; Minz, D. Resilience of Soil Bacterial Community to Irrigation with Water of Different Qualities under M Editerranean Climate. Environ. Microbiol. 2014, 16, 559–569. [Google Scholar] [CrossRef]
  74. Pii, Y.; Borruso, L.; Brusetti, L.; Crecchio, C.; Cesco, S.; Mimmo, T. The Interaction between Iron Nutrition, Plant Species and Soil Type Shapes the Rhizosphere Microbiome. Plant Physiol. Biochem. 2016, 99, 39–48. [Google Scholar] [CrossRef]
  75. Shen, C.; Ge, Y.; Yang, T.; Chu, H. Verrucomicrobial Elevational Distribution Was Strongly Influenced by Soil PH and Carbon/Nitrogen Ratio. J. Soils Sediments 2017, 17, 2449–2456. [Google Scholar] [CrossRef]
  76. Brewer, T.E.; Handley, K.M.; Carini, P.; Gilbert, J.A.; Fierer, N. Genome Reduction in an Abundant and Ubiquitous Soil Bacterium ‘Candidatus Udaeobacter Copiosus’. Nat. Microbiol. 2016, 2, 16198. [Google Scholar] [CrossRef] [PubMed]
  77. Khan, M.A.; Khan, S.T. Microbial Communities and Their Predictive Functional Profiles in the Arid Soil of Saudi Arabia. Soil 2020, 6, 513–521. [Google Scholar] [CrossRef]
  78. Buckley, D.H.; Huangyutitham, V.; Hsu, S.-F.; Nelson, T.A. Stable Isotope Probing with 15N2 Reveals Novel Noncultivated Diazotrophs in Soil. Appl. Environ. Microbiol. 2007, 73, 3196–3204. [Google Scholar] [CrossRef]
  79. Catania, V.; Bueno, R.S.; Alduina, R.; Grilli, E.; La Mantia, T.; Castaldi, S.; Quatrini, P. Soil Microbial Biomass and Bacterial Diversity in Southern European Regions Vulnerable to Desertification. Ecol. Indic. 2022, 145, 109725. [Google Scholar] [CrossRef]
  80. Vohník, M.; Mrnka, L.; Lukešová, T.; Bruzone, M.C.; Kohout, P.; Fehrer, J. The Cultivable Endophytic Community of Norway Spruce Ectomycorrhizas from Microhabitats Lacking Ericaceous Hosts Is Dominated by Ericoid Mycorrhizal Meliniomyces Variabilis. Fungal Ecol. 2013, 6, 281–292. [Google Scholar] [CrossRef]
  81. Bickel, S.; Or, D. The Chosen Few—Variations in Common and Rare Soil Bacteria across Biomes. ISME J. 2021, 15, 3315–3325. [Google Scholar] [CrossRef] [PubMed]
  82. Egidi, E.; Delgado-Baquerizo, M.; Plett, J.M.; Wang, J.; Eldridge, D.J.; Bardgett, R.D.; Maestre, F.T.; Singh, B.K. A Few Ascomycota Taxa Dominate Soil Fungal Communities Worldwide. Nat. Commun. 2019, 10, 2369. [Google Scholar] [CrossRef]
  83. Gleason, F.H.; Letcher, P.M.; Commandeur, Z.; Jeong, C.E.; McGee, P.A. The Growth Response of Some Chytridiomycota to Temperatures Commonly Observed in the Soil. Mycol. Res. 2005, 109, 717–722. [Google Scholar] [CrossRef] [PubMed]
  84. Hanrahan-Tan, D.G.; Lilje, O.; Henderson, L. Chytrids in Soil Environments: Unique Adaptations and Distributions. Encyclopedia 2023, 3, 642–664. [Google Scholar] [CrossRef]
  85. Vega, F.E.; Meyling, N.V.; Luangsa-ard, J.J.; Blackwell, M. Fungal entomopathogens. In Insect Pathology; Elsevier: Amsterdam, The Netherlands, 2012; pp. 171–220. [Google Scholar]
  86. Rungjindamai, N.; Jones, E.B.G. Why Are There So Few Basidiomycota and Basal Fungi as Endophytes? A Review. J. Fungi 2024, 10, 67. [Google Scholar] [CrossRef] [PubMed]
  87. Egidi, E.; Wood, J.L.; Celestina, C.; May, T.W.; Mele, P.; Edwards, J.; Powell, J.; Bissett, A.; Franks, A.E. Delving into the Dark Ecology: A Continent-Wide Assessment of Patterns of Composition in Soil Fungal Communities from Australian Tussock Grasslands. Fungal Ecol. 2019, 39, 356–370. [Google Scholar] [CrossRef]
  88. Tedersoo, L.; Tooming-Klunderud, A.; Anslan, S. PacBio Metabarcoding of Fungi and Other Eukaryotes: Errors, Biases and Perspectives. New Phytol. 2018, 217, 1370–1385. [Google Scholar] [CrossRef]
  89. Tedersoo, L.; Mikryukov, V.; Anslan, S.; Bahram, M.; Khalid, A.N.; Corrales, A.; Agan, A.; Vasco-Palacios, A.-M.; Saitta, A.; Antonelli, A.; et al. The Global Soil Mycobiome Consortium Dataset for Boosting Fungal Diversity Research. Fungal Divers. 2021, 111, 573–588. [Google Scholar] [CrossRef]
  90. Pereira, A.P.A.; Durrer, A.; Gumiere, T.; Gonçalves, J.L.M.; Robin, A.; Bouillet, J.-P.; Wang, J.; Verma, J.P.; Singh, B.K.; Cardoso, E.J.B.N. Mixed Eucalyptus Plantations Induce Changes in Microbial Communities and Increase Biological Functions in the Soil and Litter Layers. For. Ecol. Manag. 2019, 433, 332–342. [Google Scholar] [CrossRef]
  91. Zhang, H.; Shi, Y.; Dong, Y.; Lapen, D.R.; Liu, J.; Chen, W. Subsoiling and Conversion to Conservation Tillage Enriched Nitrogen Cycling Bacterial Communities in Sandy Soils under Long-Term Maize Monoculture. Soil Tillage Res. 2022, 215, 105197. [Google Scholar] [CrossRef]
  92. Bates, S.T.; Berg-Lyons, D.; Caporaso, J.G.; Walters, W.A.; Knight, R.; Fierer, N. Examining the Global Distribution of Dominant Archaeal Populations in Soil. ISME J. 2011, 5, 908–917. [Google Scholar] [CrossRef] [PubMed]
  93. Nicolas, A.M.; Jaffe, A.L.; Nuccio, E.E.; Taga, M.E.; Firestone, M.K.; Banfield, J.F. Soil Candidate Phyla Radiation Bacteria Encode Components of Aerobic Metabolism and Co-Occur with Nanoarchaea in the Rare Biosphere of Rhizosphere Grassland Communities. mSystems 2021, 6, e0120520. [Google Scholar] [CrossRef] [PubMed]
  94. Ward, L.M.; Hemp, J.; Shih, P.M.; McGlynn, S.E.; Fischer, W.W. Evolution of Phototrophy in the Chloroflexi Phylum Driven by Horizontal Gene Transfer. Front. Microbiol. 2018, 9, 260. [Google Scholar] [CrossRef]
  95. Sánchez-Baracaldo, P.; Cardona, T. On the Origin of Oxygenic Photosynthesis and Cyanobacteria. New Phytol. 2020, 225, 1440–1446. [Google Scholar] [CrossRef]
  96. Genitsaris, S.; Stefanidou, N.; Leontidou, K.; Matsi, T.; Karamanoli, K.; Mellidou, I. Bacterial Communities in the Rhizosphere and Phyllosphere of Halophytes and Drought-Tolerant Plants in Mediterranean Ecosystems. Microorganisms 2020, 8, 1708. [Google Scholar] [CrossRef] [PubMed]
  97. Velázquez-Becerra, C.; Macías-Rodríguez, L.I.; López-Bucio, J.; Altamirano-Hernández, J.; Flores-Cortez, I.; Valencia-Cantero, E. A Volatile Organic Compound Analysis from Arthrobacter Agilis Identifies Dimethylhexadecylamine, an Amino-Containing Lipid Modulating Bacterial Growth and Medicago Sativa Morphogenesis in Vitro. Plant Soil 2011, 339, 329–340. [Google Scholar] [CrossRef]
  98. Requena, N.; Jimenez, I.; Toro, M.; Barea, J.M. Interactions between Plant-growth-promoting Rhizobacteria (PGPR), Arbuscular Mycorrhizal Fungi and Rhizobium spp. in the Rhizosphere of Anthyllis cytisoides, a Model Legume for Revegetation in Mediterranean Semi-arid Ecosystems. New Phytol. 1997, 136, 667–677. [Google Scholar] [CrossRef] [PubMed]
  99. Asplund, J.; Kauserud, H.; Bokhorst, S.; Lie, M.H.; Ohlson, M.; Nybakken, L. Fungal Communities Influence Decomposition Rates of Plant Litter from Two Dominant Tree Species. Fungal Ecol. 2018, 32, 1–8. [Google Scholar] [CrossRef]
  100. Asplund, J.; Kauserud, H.; Ohlson, M.; Nybakken, L. Spruce and Beech as Local Determinants of Forest Fungal Community Structure in Litter, Humus and Mineral Soil. FEMS Microbiol. Ecol. 2019, 95, fiy232. [Google Scholar] [CrossRef] [PubMed]
  101. Challacombe, J.F.; Hesse, C.N.; Bramer, L.M.; McCue, L.A.; Lipton, M.; Purvine, S.; Nicora, C.; Gallegos-Graves, L.V.; Porras-Alfaro, A.; Kuske, C.R. Genomes and Secretomes of Ascomycota Fungi Reveal Diverse Functions in Plant Biomass Decomposition and Pathogenesis. BMC Genom. 2019, 20, 976. [Google Scholar] [CrossRef]
  102. Santonja, M.; Foucault, Q.; Rancon, A.; Gauquelin, T.; Fernandez, C.; Baldy, V.; Mirleau, P. Contrasting Responses of Bacterial and Fungal Communities to Plant Litter Diversity in a Mediterranean Oak Forest. Soil Biol. Biochem. 2018, 125, 27–36. [Google Scholar] [CrossRef]
  103. Funk, A. Foliar Fungi of Western Trees; Pacific Forest Research Centre: Victoria, BC, Canada, 1985. [Google Scholar]
  104. Selbmann, L.; de Hoog, G.S.; Mazzaglia, A.; Friedmann, E.I.; Onofri, S. Fungi at the Edge of Life: Cryptoendolithic Black Fungi from Antarctic Desert. Stud. Mycol. 2005, 51, 1–32. [Google Scholar]
  105. Hart, M.; Gorzelak, M.A.; McAmmond, B.M.; Van Hamme, J.D.; Stevens, J.; Abbott, L.; Whiteley, A.S.; Nevill, P. Fungal Communities Resist Recovery in Sand Mine Restoration. Front. For. Glob. Change 2019, 2, 78. [Google Scholar] [CrossRef]
  106. Das, K.; Lee, S.-Y.; Jung, H.-Y. Cladophialophora lanosa Sp. Nov., a New Species Isolated from Soil. Mycobiology 2019, 47, 173–179. [Google Scholar] [CrossRef]
  107. Liu, X.-Z.; Wang, Q.-M.; Göker, M.; Groenewald, M.; Kachalkin, A.V.; Lumbsch, H.T.; Millanes, A.M.; Wedin, M.; Yurkov, A.M.; Boekhout, T.; et al. Towards an Integrated Phylogenetic Classification of the Tremellomycetes. Stud. Mycol. 2015, 81, 85–147. [Google Scholar] [CrossRef] [PubMed]
  108. Tedersoo, L.; Pärtel, K.; Jairus, T.; Gates, G.; Põldmaa, K.; Tamm, H. Ascomycetes Associated with Ectomycorrhizas: Molecular Diversity and Ecology with Particular Reference to the Helotiales. Environ. Microbiol. 2009, 11, 3166–3178. [Google Scholar] [CrossRef] [PubMed]
  109. Pereira, D.S.; Phillips, A.J.L. Palm Fungi and Their Key Role in Biodiversity Surveys: A Review. J. Fungi 2023, 9, 1121. [Google Scholar] [CrossRef] [PubMed]
  110. Ozimek, E.; Hanaka, A. Mortierella Species as the Plant Growth-Promoting Fungi Present in the Agricultural Soils. Agriculture 2020, 11, 7. [Google Scholar] [CrossRef]
  111. Daghino, S.; Murat, C.; Sizzano, E.; Girlanda, M.; Perotto, S. Fungal Diversity Is Not Determined by Mineral and Chemical Differences in Serpentine Substrates. PLoS ONE 2012, 7, e44233. [Google Scholar] [CrossRef]
  112. van Schöll, L.; Kuyper, T.W.; Smits, M.M.; Landeweert, R.; Hoffland, E.; Breemen, N. van Rock-Eating Mycorrhizas: Their Role in Plant Nutrition and Biogeochemical Cycles. Plant Soil 2008, 303, 35–47. [Google Scholar] [CrossRef]
Figure 2. Graphical representation of the four sample sites characterized by their exposure and elevation.
Microorganisms 12 01569 g002
Figure 3. Physicochemical variables of the soil samples: (a) C/N. Significant C/N differences were observed between the hygrophilous forest and the xerophytic shrubland, and between the dry sclerophyllous forest and the xerophytic shrubland. (b) pH. No significant differences between locations were observed. (c) Dry density (g/cm3). Significant differences were observed between the hygrophilous forest and the xerophytic shrubland (d) d15N and d13C isotope content.
Microorganisms 12 01569 g003
Figure 4. Redundancy analysis (RDA) that shows the variability of the environmental conditions associated with the plant communities. (For further information, see Supplementary Table S3.)
Microorganisms 12 01569 g004
Figure 5. (a) Prokaryote and (b) fungi soil microorganism’s alpha diversity in PNLC plant communities. Grey dots correspond to replicate outliers.
Microorganisms 12 01569 g005
Figure 6. PCoA (PERMANOVA p-value < 0.05) that illustrates the microbial variability of the soil of the plant communities at the phylum level of (a) prokaryotes and (b) fungi. The blue arrows represent the environmental parameters that significantly correlate with the microbial communities (envfit, p-value < 0.05).
Microorganisms 12 01569 g006aMicroorganisms 12 01569 g006b
Figure 7. Venn diagram that shows the comparison of ASVs richness associated with (a) prokaryotes and (b) fungi, grouped on the basis of the soil of the plant communities. Sclerophilous forest—purple area, Xerophytic shrubland—yellow area, Hygrophilous forest—green area, Dry sclerophilous forest—orange area.
Microorganisms 12 01569 g007
Figure 8. The box plot shows the relative abundance of bacterial and archaeal phyla in the PNLC soil categorized by the different plant communities.
Microorganisms 12 01569 g008
Figure 9. The box plots show the relative abundance of the fungal phyla in the PNLC soil categorized by different plant communities.
Microorganisms 12 01569 g009
Figure 10. Heatmap of the 18 most abundant genera of prokaryotes in the soil (n = 16) analyzed in PNLC, categorized by plant communities.
Microorganisms 12 01569 g010
Figure 11. Heatmap for the 20 genera of fungi in the soil (n = 16) analyzed in PNLC categorized by plant communities.
Microorganisms 12 01569 g011
Figure 12. Volcano plot that shows the ASVs of microorganisms (bacteria, archaea and fungi) when comparing the xerophytic shrubland vs. sclerophyllous forest plant communities in PNLC. The red line indicates the significantly different ASVs (p-adj). Complete data in Supplementary Table S4.
Microorganisms 12 01569 g012
Figure 13. Volcano plot that shows the ASVs of microorganism when comparing the hygrophilous forest and dry sclerophyllous forest plant communities in PNLC. The red line indicates the significantly different ASVs (p-adj). Complete data in Supplementary Table S5.
Microorganisms 12 01569 g013
Figure 14. Predicted potential microbial function profile by comparison of the 4 study sites. (a) Prokaryotes, (b) fungi.
Microorganisms 12 01569 g014
Table 1. Sampling points.
IDSiteSlope Facing or AspectGeographic Location
(Latitude)
Geographic Location (Longitude)Elevation
(masl)
Collection Date
SF1Sclerophyllous forestSouth33°0′12.13″ S71°7′24.62″ O396January 2020
SF2Sclerophyllous forestSouth33°0′12.28″ S71°7′25.17″ O391January 2020
SF3Sclerophyllous forestSouth33°0′12.34″ S71°7′26.40″ O383January 2020
SF4Sclerophyllous forestSouth33°0′12.39″ S71°7′25.82″ O390January 2020
XS1Xerophytic shrublandNorth33°0′16.82″ S71°7′28.00″ O410January 2020
XS2Xerophytic shrublandNorth33°0′16.65″ S71°7′27.32″ O407January 2020
XS3Xerophytic shrublandNorth33°0′16.40″ S71°7′27.80″ O405January 2020
XS4Xerophytic shrublandNorth 33°0′17.19″ S71°7′27.43″ O413January 2020
HF1Hygrophilous forestV-shaped valley 32°57′13.86″ S71°5′26.47″ O590February 2021
HF2Hygrophilous forestV-shaped valley 32°57′14.28″ S71°5′26.84″ O587February 2021
HF3Hygrophilous forestV-shaped valley 32°57′14.63″ S71°5′25.78″ O585February 2021
HF4Hygrophilous forestV-shaped valley 32°57′14.95″ S71°5′26.46″ O589February 2021
DSF1Dry sclerophyllous forestWest32°57′14.14″ S71°5′23.46″ O621February 2021
DSF2Dry sclerophyllous forestWest32°57′13.73″ S71°5′23.92″ O618February 2021
DSF3Dry sclerophyllous forestWest32°57′14.51″ S71°5′23.69″ O624February 2021
DSF4Dry sclerophyllous forestWest32°57′14.38″ S71°5′23.02″ O626February 2021
Disclaimer/Publisher’s Note: The statements, opinions and data contained in all publications are solely those of the individual author(s) and contributor(s) and not of MDPI and/or the editor(s). MDPI and/or the editor(s) disclaim responsibility for any injury to people or property resulting from any ideas, methods, instructions or products referred to in the content.

