
Salmonella Inactivation Model by UV-C Light Treatment in Chicken Breast


Abstract
:1. Introduction
2. Materials and Methods
2.1. Experimental Setup
2.2. Chicken Breast Preparation and Characterization
2.3. Inoculum Preparation and Samples Inoculation
2.4. UV-C Radiation of Chicken Breast Samples
2.5. Microbial Analysis
2.6. Statistical Analysis
2.7. Data Modeling
3. Results and Discussion
3.1. Physicochemical Characterization of the Chicken Breast
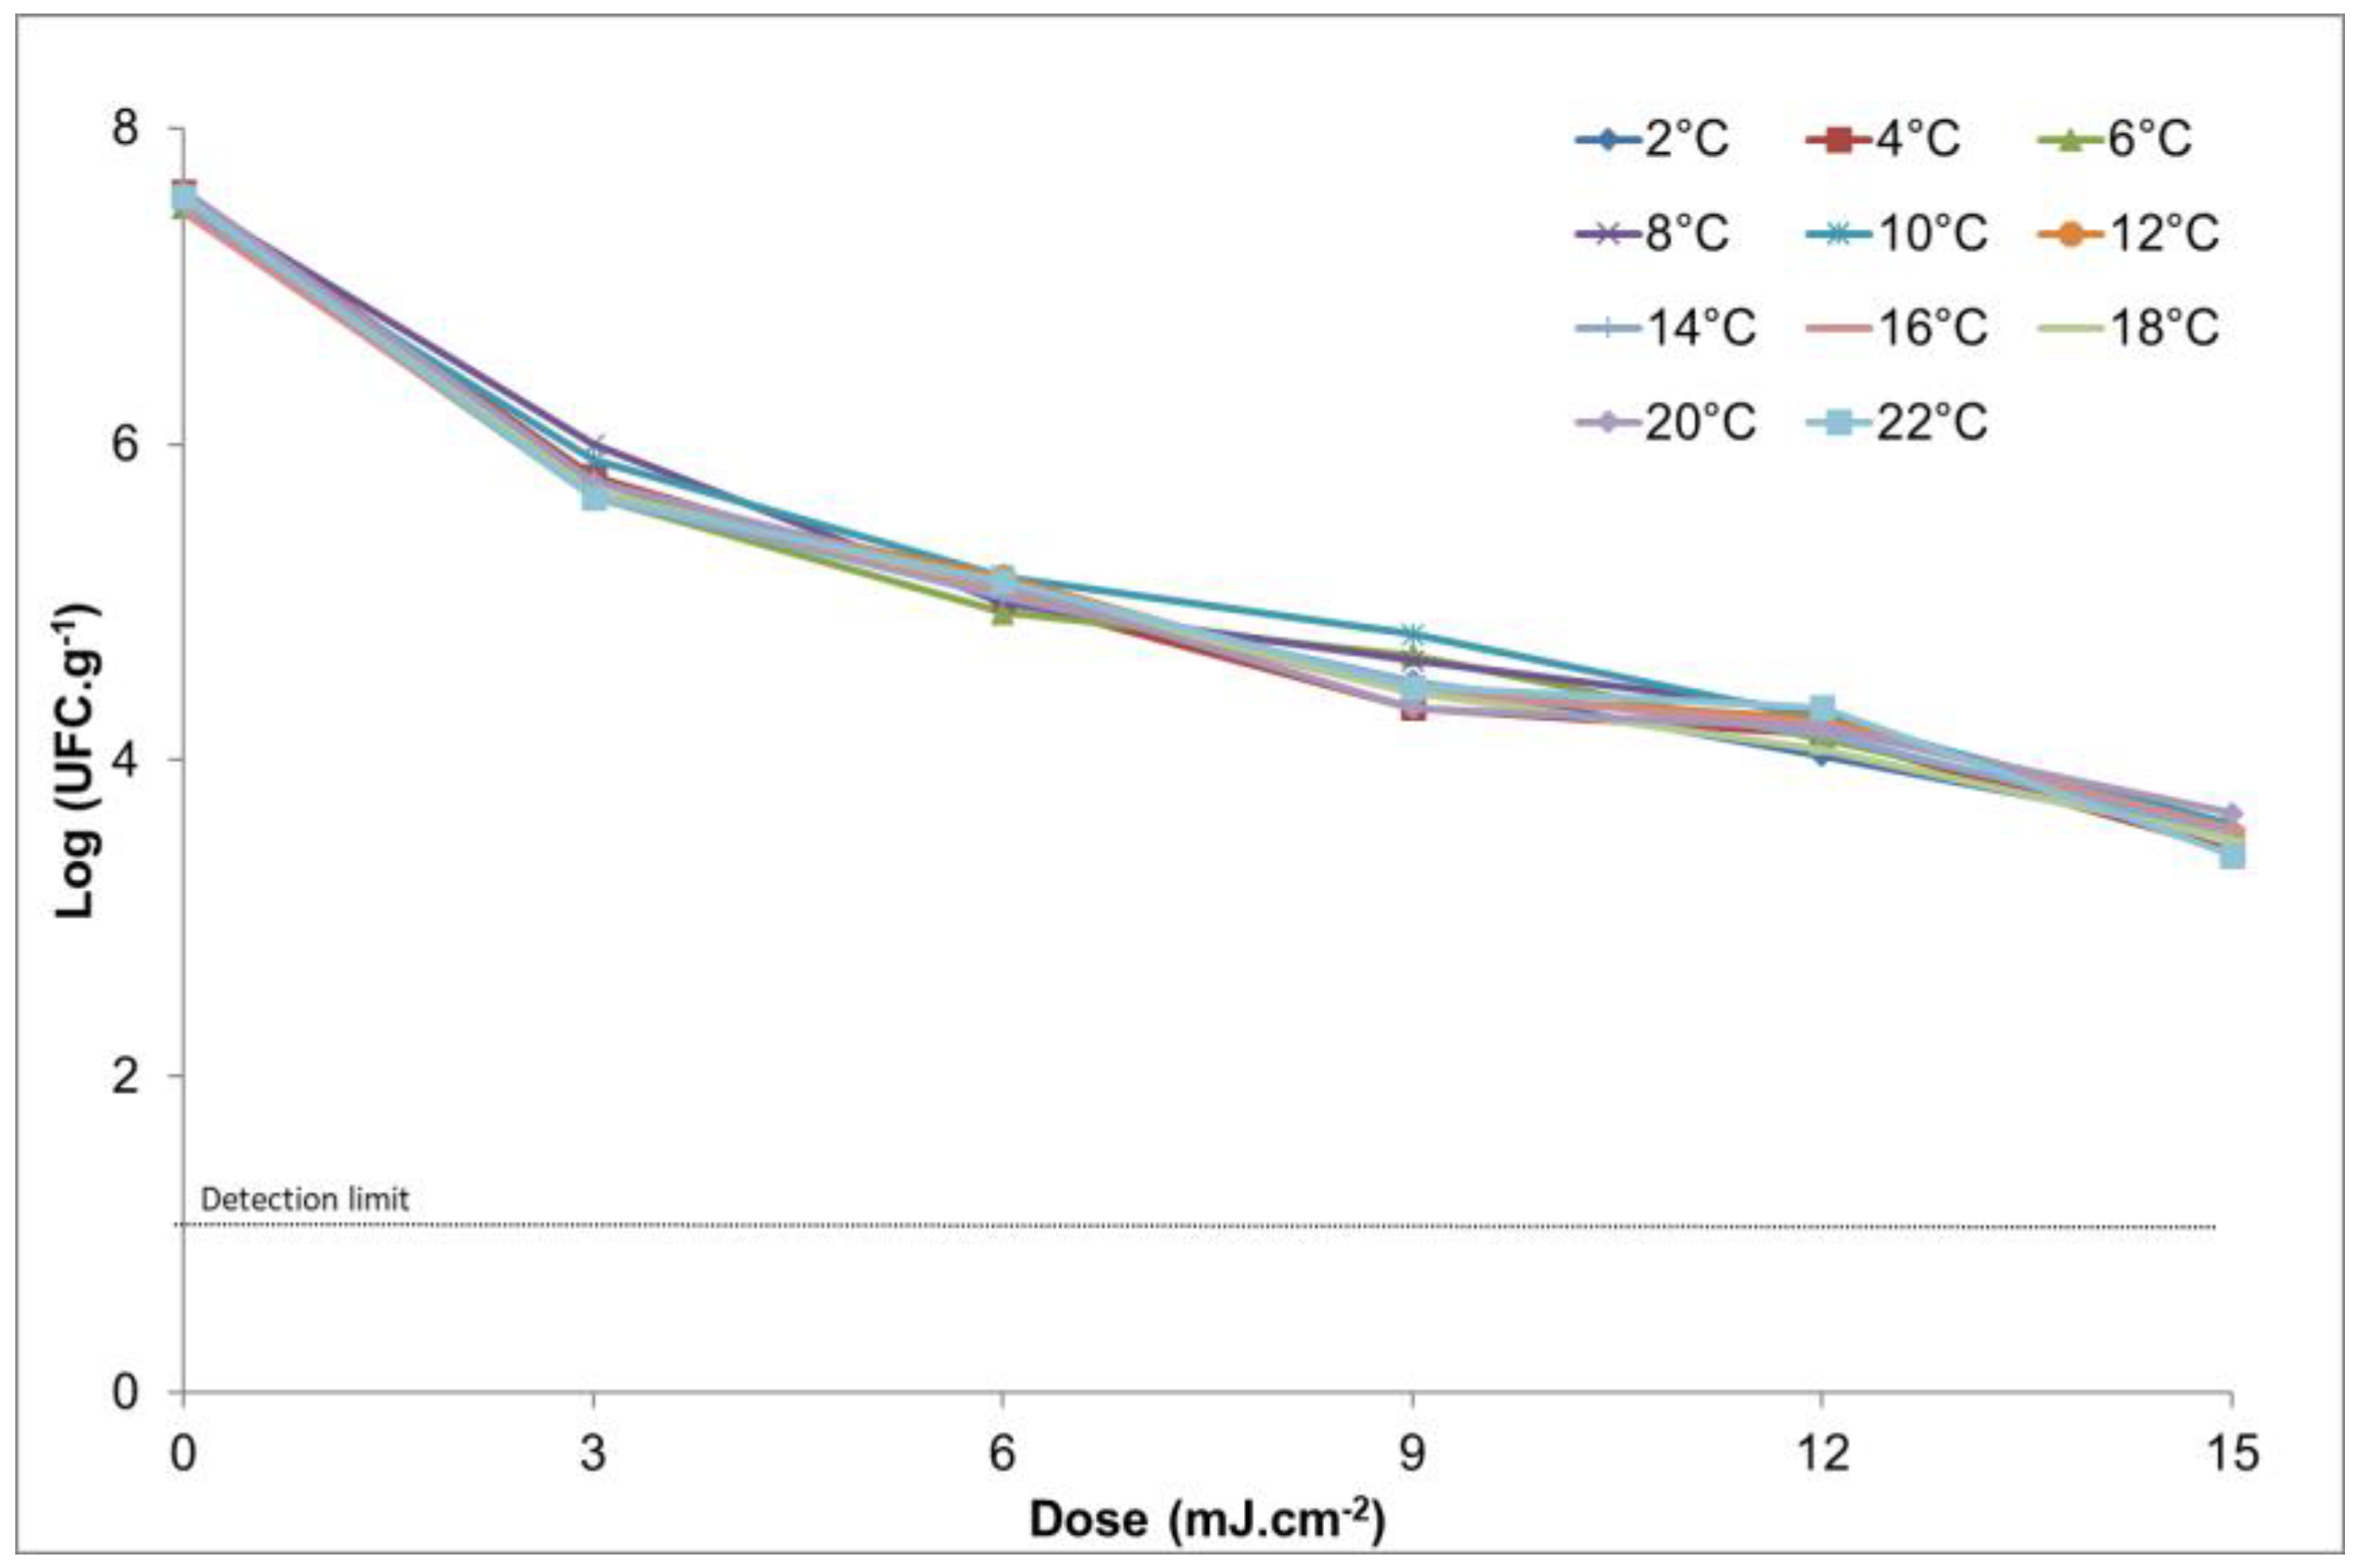
3.2. Behavior of Salmonella enteritidis at Different Doses of UV Light in Chicken Breast at Treatment Temperatures from 2 to 22 °C
3.3. Primary Model of the Inactivation of Salmonella enteritidis at Different Doses of Caffeine in Chicken Breast at a Constant Temperature of 14 °C
3.4. Inactivation Effect of UV and Caffein on Salmonella enteritidis
4. Conclusions
Author Contributions
Funding
Data Availability Statement
Conflicts of Interest
Appendix A

| Temperature (°C) | Model | Log-Linear Regression | Log-Linear + Shoulder | Log-Linear + Tail | Log-Linear + Shoulder + Tail | Weibull | Weibull Fixed p-Parameter | Weibull + Tail | Double Weibull | Biphasic Model | Biphasic + Shoulder |
|---|---|---|---|---|---|---|---|---|---|---|---|
| 2 | RMSE | 0.5378 | 0.3117 | 0.2488 | 0.2270 | 0.2314 | 0.6375 | 0.1992 | 0.3061 | 0.1115 | 0.1577 |
| R2 adj | 0.8895 | 0.9629 | 0.9764 | 0.9803 | 0.9796 | 0.8448 | 0.9848 | 0.9642 | 0.9952 | 0.9905 | |
| RMSE | 0.4814 | 0.2045 | 0.5039 | 0.2504 | 0.2490 | 0.5656 | 0.2990 | 0.2990 | 0.1897 | 0.2683 | |
| R2 adj | 0.8356 | 0.9703 | 0.8198 | 0.9555 | 0.9560 | 0.7731 | 0.9366 | 0.9366 | 0.9745 | 0.9489 | |
| RMSE | 0.4436 | 0.0544 | 0.4123 | 0.0666 | 0.0816 | 0.5277 | 0.1000 | 0.1000 | 0.0409 | 0.0548 | |
| R2 adj | 0.9163 | 0.9987 | 0.9277 | 0.9981 | 0.9972 | 0.8815 | 0.9957 | 0.9957 | 0.9993 | 0.9987 | |
| 4 | RMSE | 0.5337 | 0.4395 | 0.2810 | 0.3433 | 0.3971 | 0.6283 | 0.3441 | 0.3398 | 0.3403 | 0.4816 |
| R2 adj | 0.8555 | 0.9020 | 0.9599 | 0.9402 | 0.9200 | 0.7997 | 0.9399 | 0.9414 | 0.9412 | 0.8823 | |
| RMSE | 0.7604 | 0.2047 | 0.6000 | 0.2508 | 0.6890 | 0.8932 | 0.2752 | 0.2757 | 0.2530 | 0.3577 | |
| R2 adj | 0.7886 | 0.9847 | 0.8684 | 0.9770 | 0.8264 | 0.7083 | 0.9723 | 0.9723 | 0.9766 | 0.9532 | |
| RMSE | 0.4052 | 0.2816 | 0.4647 | 0.3449 | 0.3130 | 0.4787 | 0.3834 | 0.3834 | 0.3388 | 0.4764 | |
| R2 adj | 0.9226 | 0.9626 | 0.8983 | 0.9440 | 0.9538 | 0.8921 | 0.9307 | 0.9307 | 0.9459 | 0.8931 | |
| 6 | RMSE | 0.4762 | 0.3261 | 0.3978 | 0.3994 | 0.3049 | 0.5619 | 0.3734 | 0.3714 | 0.2976 | 0.3834 |
| R2 adj | 0.8777 | 0.9427 | 0.9147 | 0.9140 | 0.9499 | 0.8298 | 0.9248 | 0.9256 | 0.9523 | 0.9207 | |
| RMSE | 0.4121 | 0.2776 | 0.4638 | 0.3401 | 0.3362 | 0.4859 | 0.4117 | 0.4117 | 0.3033 | 0.4290 | |
| R2 adj | 0.9224 | 0.9648 | 0.9017 | 0.9472 | 0.9484 | 0.8921 | 0.9225 | 0.9225 | 0.9580 | 0.9159 | |
| RMSE | 0.7805 | 0.2751 | 0.3999 | 0.3369 | 0.5415 | 0.9133 | 0.3376 | 0.3376 | 0.2973 | 0.4183 | |
| R2 adj | 0.6871 | 0.9611 | 0.9178 | 0.9417 | 0.8494 | 0.5715 | 0.9414 | 0.9414 | 0.9546 | 0.9101 | |
| 8 | RMSE | 0.3096 | 0.1820 | 0.3039 | 0.1649 | 0.1374 | 0.3692 | 0.1683 | 0.1683 | 0.1407 | 0.1871 |
| R2 adj | 0.9338 | 0.9771 | 0.9362 | 0.9812 | 0.9870 | 0.9058 | 0.9804 | 0.9804 | 0.9863 | 0.9758 | |
| RMSE | 0.5666 | 0.2787 | 0.3524 | 0.2952 | 0.2145 | 0.6709 | 0.3991 | 0.1879 | 0.1934 | 0.2735 | |
| R2 adj | 0.8815 | 0.9713 | 0.9542 | 0.9678 | 0.9830 | 0.8339 | 0.9412 | 0.9870 | 0.9862 | 0.9724 | |
| RMSE | 0.5213 | 0.3358 | 0.5927 | 0.4103 | 0.5159 | 0.6134 | 0.4429 | 0.4429 | 0.3960 | 0.5541 | |
| R2 adj | 0.8753 | 0.9482 | 0.8388 | 0.9227 | 0.8778 | 0.8273 | 0.9100 | 0.9100 | 0.9280 | 0.8591 | |
| 10 | RMSE | 0.6261 | 0.2772 | 0.6084 | 0.3395 | 0.3128 | 0.7352 | 0.3831 | 0.3831 | 0.3282 | 0.4637 |
| R2 adj | 0.8158 | 0.9639 | 0.8260 | 0.9459 | 0.9540 | 0.7460 | 0.9310 | 0.9310 | 0.9494 | 0.8990 | |
| RMSE | 0.3984 | 0.0447 | 0.3334 | 0.0498 | 0.0534 | 0.4736 | 0.0654 | 0.0654 | 0.0576 | 0.0815 | |
| R2 adj | 0.9098 | 0.9989 | 0.9368 | 0.9986 | 0.9984 | 0.8725 | 0.9976 | 0.9976 | 0.9981 | 0.9962 | |
| RMSE | 0.2008 | 0.1225 | 0.1989 | 0.1496 | 0.1312 | 0.2440 | 0.1607 | 0.1607 | 0.1485 | 0.2074 | |
| R2 adj | 0.9782 | 0.9919 | 0.9786 | 0.9879 | 0.9907 | 0.9678 | 0.9860 | 0.9860 | 0.9881 | 0.9767 | |
| 12 | RMSE | 0.4075 | 0.1954 | 0.4325 | 0.2393 | 0.2121 | 0.4851 | 0.2598 | 0.2598 | 0.2396 | 0.3388 |
| R2 adj | 0.9337 | 0.9847 | 0.9253 | 0.9771 | 0.9820 | 0.9060 | 0.9730 | 0.9730 | 0.9771 | 0.9541 | |
| RMSE | 0.5596 | 0.4233 | 0.4924 | 0.5145 | 0.4208 | 0.6560 | 0.5153 | 0.5153 | 0.5215 | 0.7376 | |
| R2 adj | 0.8112 | 0.8920 | 0.8538 | 0.8404 | 0.8933 | 0.7406 | 0.8399 | 0.8399 | 0.8360 | 0.6720 | |
| RMSE | 0.6649 | 0.2282 | 0.5477 | 0.2795 | 0.2549 | 0.7804 | 0.3122 | 0.3439 | 0.2651 | 0.3742 | |
| R2 adj | 0.7877 | 0.9750 | 0.8560 | 0.9625 | 0.9688 | 0.7076 | 0.9532 | 0.9432 | 0.9663 | 0.9328 | |
| 14 | RMSE | 0.4405 | 0.1211 | 0.4406 | 0.1483 | 0.1574 | 0.5228 | 0.1927 | 0.1927 | 0.1466 | 0.2073 |
| R2 adj | 0.9102 | 0.9932 | 0.9102 | 0.9898 | 0.9885 | 0.8736 | 0.9828 | 0.9828 | 0.9901 | 0.9801 | |
| RMSE | 0.6994 | 0.5778 | 0.8634 | 0.7076 | 0.6137 | 0.8168 | 0.7842 | 0.7516 | 0.7011 | 0.9915 | |
| R2 adj | 0.8035 | 0.8659 | 0.7006 | 0.7989 | 0.8487 | 0.7321 | 0.7530 | 0.7731 | 0.8026 | 0.6052 | |
| RMSE | 0.6937 | 0.4784 | 0.4931 | 0.4847 | 0.4561 | 0.8119 | 0.5016 | 0.5111 | 0.5832 | 0.8248 | |
| R2 adj | 0.7179 | 0.8658 | 0.8575 | 0.8623 | 0.8780 | 0.6136 | 0.8525 | 0.8469 | 0.8006 | 0.6011 | |
| 16 | RMSE | 0.6937 | 0.4784 | 0.4931 | 0.4847 | 0.4561 | 0.8090 | 0.5016 | 0.2572 | 0.5832 | 0.8248 |
| R2 adj | 0.7179 | 0.8658 | 0.8575 | 0.8623 | 0.8780 | 0.6154 | 0.8525 | 0.9611 | 0.8006 | 0.6011 | |
| RMSE | 0.5794 | 0.3891 | 0.5219 | 0.4765 | 0.3857 | 0.6813 | 0.4724 | 0.4724 | 0.4730 | 0.6690 | |
| R2 adj | 0.8474 | 0.9312 | 0.8762 | 0.8968 | 0.9324 | 0.7890 | 0.8985 | 0.8985 | 0.8983 | 0.7966 | |
| RMSE | 0.3476 | 0.2496 | 0.4014 | 0.3057 | 0.2895 | 0.4112 | 0.3546 | 0.3546 | 0.2924 | 0.4135 | |
| R2 adj | 0.9408 | 0.9695 | 0.9211 | 0.9543 | 0.9590 | 0.9172 | 0.9385 | 0.9385 | 0.9581 | 0.9163 | |
| 18 | RMSE | 0.5472 | 0.1900 | 0.5384 | 0.2327 | 0.2417 | 0.6454 | 0.2960 | 0.2960 | 0.2037 | 0.2881 |
| R2 adj | 0.8702 | 0.9843 | 0.8743 | 0.9765 | 0.9747 | 0.8194 | 0.9620 | 0.9620 | 0.9820 | 0.9640 | |
| RMSE | 0.5348 | 0.1097 | 0.4345 | 0.0836 | 0.1070 | 0.6341 | 0.1311 | 0.1311 | 0.1411 | 0.1996 | |
| R2 adj | 0.8933 | 0.9955 | 0.9296 | 0.9974 | 0.9957 | 0.8501 | 0.9936 | 0.9936 | 0.9926 | 0.9851 | |
| RMSE | 0.4688 | 0.2374 | 0.3425 | 0.2908 | 0.2221 | 0.5531 | 0.2721 | 0.1114 | 0.2048 | 0.2683 | |
| R2 adj | 0.8590 | 0.9638 | 0.9247 | 0.9457 | 0.9683 | 0.8037 | 0.9525 | 0.9920 | 0.9731 | 0.9538 | |
| 20 | RMSE | 0.4526 | 0.4866 | 0.3186 | 0.3840 | 0.4636 | 0.5310 | 0.3634 | 0.3634 | 0.3901 | 0.5431 |
| R2 adj | 0.9136 | 0.9002 | 0.9572 | 0.9378 | 0.9094 | 0.8811 | 0.9443 | 0.9443 | 0.9358 | 0.8757 | |
| RMSE | 0.8864 | 0.7444 | 0.9001 | 0.9117 | 0.7578 | 1.0330 | 1.0600 | 0.9281 | 0.9086 | 1.2849 | |
| R2 adj | 0.6931 | 0.7836 | 0.6836 | 0.6753 | 0.7757 | 0.5831 | 0.5611 | 0.6636 | 0.6775 | 0.3551 | |
| RMSE | 0.8106 | 0.4411 | 0.2494 | 0.3054 | 0.3199 | 0.9479 | 0.3062 | 0.1801 | 0.2368 | 0.3318 | |
| R2 adj | 0.6465 | 0.8953 | 0.9665 | 0.9498 | 0.9450 | 0.5165 | 0.9496 | 0.9826 | 0.9698 | 0.9408 | |
| 22 | RMSE | 0.7309 | 0.4878 | 0.8440 | 0.5974 | 0.6194 | 0.8531 | 0.6927 | 0.6750 | 0.5527 | 0.7817 |
| R2 adj | 0.7647 | 0.8952 | 0.6863 | 0.8428 | 0.8311 | 0.6795 | 0.7887 | 0.7994 | 0.8655 | 0.7309 | |
| RMSE | 0.4208 | 0.2650 | 0.4531 | 0.3246 | 0.4211 | 0.4996 | 0.3983 | 0.3605 | 0.2931 | 0.4099 | |
| R2 adj | 0.9262 | 0.9707 | 0.9144 | 0.9561 | 0.9261 | 0.8959 | 0.9338 | 0.9458 | 0.9642 | 0.9299 | |
| RMSE | 0.4889 | 0.1759 | 0.2487 | 0.0997 | 0.1263 | 0.5780 | 0.0948 | 0.1169 | 0.1552 | 0.2194 | |
| R2 adj | 0.8596 | 0.9818 | 0.9637 | 0.9942 | 0.9906 | 0.8038 | 0.9947 | 0.9920 | 0.9859 | 0.9717 |
| UVC (J/cm2) | Model | Log-Linear Regression | Log-Linear ± Shoulder | Log-Linear ± Tail | Log-Linear ± Shoulder ± Tail | Weibull | Weibull Fixed p-Parameter | Weibull ± Tail | Biphasic Model |
|---|---|---|---|---|---|---|---|---|---|
| o | RMSE | 0.0399 | 0.0485 | 0.0488 | 0.0686 | 0.0486 | 0.0502 | 0.0688 | 0.0684 |
| R2 adj | 0.9958 | 0.9938 | 0.9937 | 0.9877 | 0.9938 | 0.9934 | 0.9876 | 0.9877 | |
| 1 | RMSE | 0.1292 | 0.1458 | 0.1543 | 0.2051 | 0.1461 | 0.1615 | 0.2066 | 0.2034 |
| R2 adj | 0.9602 | 0.9493 | 0.9432 | 0.8997 | 0.9491 | 0.9378 | 0.8982 | 0.9013 | |
| 2 | RMSE | 0.1026 | 0.0942 | 0.1256 | 0.1333 | 0.0938 | 0.1199 | 0.1325 | 0.1776 |
| R2 adj | 0.9786 | 0.9819 | 0.9679 | 0.9639 | 0.9821 | 0.9708 | 0.9643 | 0.9358 | |
| 3 | RMSE | 0.0869 | 0.1032 | 0.1065 | 0.1428 | 0.1036 | 0.1047 | 0.1434 | 0.1506 |
| R2 adj | 0.9866 | 0.9812 | 0.9800 | 0.9639 | 0.9810 | 0.9806 | 0.9637 | 0.9599 | |
| 4 | RMSE | 0.0710 | 0.0719 | 0.0868 | 0.0194 | 0.0763 | 0.0824 | 0.0121 | 0.1229 |
| R2 adj | 0.9928 | 0.9926 | 0.9892 | 0.9995 | 0.9917 | 0.9903 | 0.9998 | 0.9783 | |
| 5 | RMSE | 0.0380 | 0.0417 | 0.0235 | 0.0219 | 0.0399 | 0.0526 | 0.0210 | 0.0332 |
| R2 adj | 0.9979 | 0.9975 | 0.9992 | 0.9993 | 0.9977 | 0.9960 | 0.9994 | 0.9984 | |
| 6 | RM5E | 0.0678 | 0.0509 | 0.0785 | 0.0720 | 0.0546 | 0.0907 | 0.0772 | 0.0686 |
| R2 adj | 0.9932 | 0.9962 | 0.9909 | 0.9924 | 0.9956 | 0.9879 | 0.9912 | 0.9931 | |
| 7 | RMSE | 0.1970 | 0.1234 | 0.0225 | 0.0121 | 0.1100 | 0.2511 | 0.0100 | 0.0060 |
| R2 adj | 0.9488 | 0.9799 | 0.9993 | 0.9998 | 0.9841 | 0.9168 | 0.9999 | 1.0000 | |
| 8 | RMSE | 0.3864 | 0.1616 | 0.1104 | 0.1343 | 0.2113 | 0.4834 | 0.1289 | 0.0767 |
| R2 adj | 0.8186 | 0.9683 | 0.9852 | 0.9781 | 0.9457 | 0.7161 | 0.9798 | 0.9929 | |
| 9 | RMSE | 0.3342 | 0.2330 | 0.0178 | 0.0184 | 0.2127 | 0.4198 | 0.0197 | 0.0250 |
| R2 adj | 0.8817 | 0.9425 | 0.9997 | 0.9996 | 0.9521 | 0.8134 | 0.9996 | 0.9993 | |
| 10 | RMSE | 0.3360 | 0.2380 | 0.1128 | 0.1567 | 0.2191 | 0.4220 | 0.1587 | 0.1324 |
| R2 adj J | 0.8854 | 0.9425 | 0.9871 | 0.9751 | 0.9513 | 0.8191 | 0.9744 | 0.9822 | |
| 11 | RMSE | 0.3088 | 0.2764 | 0.0988 | 0.1138 | 0.2582 | 0.3873 | 0.1055 | 0.1397 |
| R2 adj J | 0.8966 | 0.9172 | 0.9894 | 0.9860 | 0.9277 | 0.8373 | 0.9879 | 0.9788 | |
| 12 | RM5E | 0.3199 | 0.2281 | 0.0528 | 0.0444 | 0.1942 | 0.4047 | 0.0507 | 0.0742 |
| R2 adj | 0.9261 | 0.9624 | 0.9980 | 0.9986 | 0.9728 | 0.8817 | 0.9981 | 0.9960 | |
| 13 | RMSE | 0.4358 | 0.1895 | 0.0823 | 0.0271 | 0.2460 | 0.5451 | 0.0204 | 0.0401 |
| R2 adj | 0.8143 | 0.9649 | 0.9934 | 0.9993 | 0.9408 | 0.7094 | 0.9996 | 0.9984 | |
| 14 | RMSE | 0.4375 | 0.2009 | 0.1448 | 0.1113 | 0.1834 | 0.5471 | 0.1206 | 0.1861 |
| R2 adj | 0.8130 | 0.9606 | 0.9795 | 0.9879 | 0.9671 | 0.7076 | 0.9858 | 0.9662 | |
| 15 | RM5E | 0.3691 | 0.2540 | 0.0187 | 0.0255 | 0.2321 | 0.4628 | 0.0249 | 0.1502 |
| R2 adj | 0.8627 | 0.9350 | 0.9996 | 0.9993 | 0.9457 | 0.7841 | 0.9994 | 0.9773 |
| Caffeine (nM/g) | Model | Log-Linear Regression | Log-Linear + Shoulder | Log-Linear + Tail | Log-Linear + Shoulder + Tail | Weibull | Weibull Fixed p-Parameter | Weibull + Tail | Double Weibull | Biphasic Model | Biphasic + Shoulder |
|---|---|---|---|---|---|---|---|---|---|---|---|
| 0 | RMSE | 0.3197 | 0.1481 | 0.2739 | 0.1518 | 0.1273 | 0.3398 | 0.1304 | 0.1127 | 0.1133 | 0.1159 |
| R2 adj | 0.9224 | 0.9833 | 0.9430 | 0.9825 | 0.9877 | 0.9123 | 0.9871 | 0.9903 | 0.9902 | 0.9898 | |
| RMSE | 0.4962 | 0.4084 | 0.5130 | 0.4251 | 0.4063 | 0.5204 | 0.4531 | 0.4229 | 0.4126 | 0.4310 | |
| R2 adj | 0.8446 | 0.8947 | 0.8339 | 0.8859 | 0.8958 | 0.8290 | 0.8704 | 0.8871 | 0.8925 | 0.8827 | |
| RMSE | 0.4871 | 0.4191 | 0.4027 | 0.3896 | 0.4022 | 0.5107 | 0.3974 | 0.4271 | 0.4261 | 0.4451 | |
| R2 adj | 0.8103 | 0.8595 | 0.8703 | 0.8786 | 0.8706 | 0.7915 | 0.8737 | 0.8542 | 0.8548 | 0.8416 | |
| 5 | RMSE | 0.2630 | 0.1764 | 0.2711 | 0.1836 | 0.1915 | 0.2808 | 0.2038 | 0.1993 | 0.1842 | 0.1924 |
| R2 adj | 0.9683 | 0.9857 | 0.9663 | 0.9846 | 0.9832 | 0.9639 | 0.9810 | 0.9818 | 0.9845 | 0.9830 | |
| RMSE | 0.4241 | 0.3509 | 0.3412 | 0.3107 | 0.3107 | 0.4489 | 0.4035 | 0.3060 | 0.3273 | 0.3418 | |
| R2 adj | 0.9239 | 0.9479 | 0.9507 | 0.9592 | 0.9591 | 0.9147 | 0.9311 | 0.9604 | 0.9547 | 0.9505 | |
| RMSE | 0.4881 | 0.4057 | 0.2958 | 0.2934 | 0.3486 | 0.5149 | 0.2935 | 0.2909 | 0.2943 | 0.3073 | |
| R2 adj | 0.8743 | 0.9131 | 0.9538 | 0.9546 | 0.9359 | 0.8601 | 0.9545 | 0.9553 | 0.9543 | 0.9501 | |
| 10 | RMSE | 0.3585 | 0.2517 | 0.2320 | 0.1685 | 0.2055 | 0.3821 | 0.3124 | 0.1814 | 0.2332 | 0.2435 |
| R2 adj | 0.9425 | 0.9717 | 0.9758 | 0.9873 | 0.9811 | 0.9347 | 0.9564 | 0.9853 | 0.9757 | 0.9735 | |
| RMSE | 0.3575 | 0.2671 | 0.2505 | 0.2042 | 0.2267 | 0.3810 | 0.2119 | 0.2120 | 0.2442 | 0.2551 | |
| R2 adj | 0.9479 | 0.9709 | 0.9744 | 0.9830 | 0.9791 | 0.9408 | 0.9817 | 0.9817 | 0.9757 | 0.9735 | |
| RMSE | 0.5428 | 0.4842 | 0.4793 | 0.4753 | 0.4482 | 0.5713 | 0.4721 | 0.4831 | 0.4536 | 0.4738 | |
| R2 adj | 0.8914 | 0.9136 | 0.9153 | 0.9167 | 0.9259 | 0.8797 | 0.9178 | 0.9140 | 0.9242 | 0.9173 | |
| 15 | RMSE | 0.3702 | 0.3166 | 0.3647 | 0.3244 | 0.3147 | 0.3917 | 0.3276 | 0.3276 | 0.3029 | 0.3072 |
| R2 adj | 0.9524 | 0.9652 | 0.9538 | 0.9635 | 0.9656 | 0.9467 | 0.9627 | 0.9627 | 0.9681 | 0.9672 | |
| RMSE | 0.4405 | 0.3679 | 0.2684 | 0.3225 | 0.2853 | 0.4675 | 0.3674 | 0.2129 | 0.3125 | 0.2181 | |
| R2 adj | 0.9169 | 0.9420 | 0.9691 | 0.9554 | 0.9651 | 0.9064 | 0.9422 | 0.9806 | 0.9649 | 0.9796 | |
| RMSE | 0.5291 | 0.3820 | 0.3091 | 0.2341 | 0.3112 | 0.5600 | 0.5696 | 0.2630 | 0.3125 | 0.3264 | |
| R2 adj | 0.8995 | 0.9476 | 0.9657 | 0.9803 | 0.9652 | 0.8874 | 0.8835 | 0.9752 | 0.9649 | 0.9617 | |
| 20 | RMSE | 0.4977 | 0.3750 | 0.3231 | 0.3128 | 0.3017 | 0.5258 | 0.2914 | 0.2395 | 0.2415 | 0.2523 |
| R2 adj | 0.8747 | 0.9288 | 0.9472 | 0.9505 | 0.9539 | 0.8601 | 0.9570 | 0.9710 | 0.9705 | 0.9678 | |
| RMSE | 0.5530 | 0.3819 | 0.4105 | 0.3561 | 0.3043 | 0.5837 | 0.2890 | 0.2587 | 0.2598 | 0.2713 | |
| R2 adj | 0.8589 | 0.9327 | 0.9222 | 0.9415 | 0.9573 | 0.8427 | 0.9614 | 0.9691 | 0.9688 | 0.9660 | |
| RMSE | 0.3976 | 0.3359 | 0.3571 | 0.3244 | 0.3519 | 0.4188 | 0.3524 | 0.3533 | 0.3717 | 0.4890 | |
| R2 adj | 0.9296 | 0.9498 | 0.9432 | 0.9531 | 0.9449 | 0.9219 | 0.9447 | 0.9444 | 0.9385 | 0.8935 |
References
- Townshend, A. Food and Nutritional Analysis—Meat and Meat Products. In Encyclopedia of Analytical Science; Elsevier Applied Science: Amsterdam, The Netherlands, 2019; pp. 436–450. [Google Scholar]
- EU Parliament and Council. Regulation 853/2004; EU Parliament and Council: Luxembourg, 2024; Volume 139, p. 55. [Google Scholar]
- Chouliara, E.; Karatapanis, A.; Savvaidis, I.N.; Kontominas, M.G. Combined Effect of Oregano Essential Oil and Modified Atmosphere Packaging on Shelf-Life Extension of Fresh Chicken Breast Meat, Stored at 4 °C. Food Microbiol. 2007, 24, 607–617. [Google Scholar] [CrossRef]
- Barbut, S. Poultry Products Processing; CRC Press: Boca Raton, FL, USA, 2016. [Google Scholar]
- Yang, S.; Park, S.Y.; Ha, S.D. A Predictive Growth Model of Aeromonas Hydrophila on Chicken Breasts under Various Storage Temperatures. LWT Food Sci. Technol. 2016, 69, 98–103. [Google Scholar] [CrossRef]
- Boelaert, F.; Tegegne, H.A.; Stoicescu, A.; Messens, W.; Hempen, M.; Rossi, M.; Sarno, E.; Rizzi, V.; Aznar, I.; Antoniou, S.E.; et al. The European Union One Health 2018 Zoonoses Report. EFSA J. 2019, 17, e05926. [Google Scholar] [CrossRef]
- Aymerich, T.; Picouet, P.A.; Monfort, J.M. Decontamination Technologies for Meat Products. Meat. Sci. 2008, 78, 114–129. [Google Scholar] [CrossRef] [PubMed]
- Chen, J.H.; Ren, Y.; Seow, J.; Liu, T.; Bang, W.S.; Yuk, H.G. Intervention Technologies for Ensuring Microbiological Safety of Meat: Current and Future Trends. Compr. Rev. Food Sci. Food Saf. 2012, 11, 119–132. [Google Scholar] [CrossRef]
- Troy, D.J.; Ojha, K.S.; Kerry, J.P.; Tiwari, B.K. Sustainable and Consumer-Friendly Emerging Technologies for Application within the Meat Industry: An Overview. Meat. Sci. 2016, 120, 2–9. [Google Scholar] [CrossRef]
- Guerrero-Beltrán, J.A.; Barbosa-Cánovas, G.V. Review: Advantages and Limitations on Processing Foods by UV Light. Food Sci. Technol. Int. 2004, 10, 137–147. [Google Scholar] [CrossRef]
- Gabriel, A.A. Inactivation of Escherichia Coli O157:H7 and Spoilage Yeasts in Germicidal UV-C-Irradiated and Heat-Treated Clear Apple Juice. Food Control 2012, 25, 425–432. [Google Scholar] [CrossRef]
- Amanina, A.K.Z.; Rosnah, S.; Noranizan, M.A.; Alifdalino, S. UV-C Effect on Microbial Disinfection of Pineapple-Mango Juice Blend Using Dean-Vortex Technology. Food Res. 2019, 3, 285–294. [Google Scholar] [CrossRef]
- Caminiti, I.M.; Palgan, I.; Muñoz, A.; Noci, F.; Whyte, P.; Morgan, D.J.; Cronin, D.A.; Lyng, J.G. The Effect of Ultraviolet Light on Microbial Inactivation and Quality Attributes of Apple Juice. Food Bioprocess Technol. 2012, 5, 680–686. [Google Scholar] [CrossRef]
- Koutchma, T.; Parisi, B. Biodosimetry of Escherichia coli UV Inactivation in Model Juices with Regard to Dose Distribution in Annular UV Reactors. J. Food Sci. 2004, 69, FEP14–FEP22. [Google Scholar] [CrossRef]
- Chun, H.H.; Kim, J.Y.; Lee, B.D.; Yu, D.J.; Song, K.B. Effect of UV-C Irradiation on the Inactivation of Inoculated Pathogens and Quality of Chicken Breasts during Storage. Food Control 2010, 21, 276–280. [Google Scholar] [CrossRef]
- Barba, F.J.; Koubaa, M.; do Prado-Silva, L.; Orlien, V.; Sant’Ana, A. de S. Mild Processing Applied to the Inactivation of the Main Foodborne Bacterial Pathogens: A Review. Trends Food Sci. Technol. 2017, 66, 20–35. [Google Scholar] [CrossRef]
- Reichel, J.; Kehrenberg, C.; Krischek, C. UV-C Irradiation of Rolled Fillets of Ham Inoculated with Yersinia Enterocolitica and Brochothrix Thermosphacta. Foods 2020, 9, 552. [Google Scholar] [CrossRef] [PubMed]
- Lima, F.; Vieira, K.; Santos, M.; Mendes de Souza, P. Effects of Radiation Technologies on Food Nutritional Quality. In Descriptive Food Science; IntechOpen: London, UK, 2018. [Google Scholar] [CrossRef]
- Porciúncula, L.O.; Sallaberry, C.; Mioranzza, S.; Botton, P.H.S.; Rosemberg, D.B. The Janus Face of Caffeine. Neurochem. Int. 2013, 63, 594–609. [Google Scholar] [CrossRef] [PubMed]
- Madusanka, N.; Eddleston, M.D.; Arhangelskis, M.; Jones, W. Polymorphs, Hydrates and Solvates of a Co-Crystal of Caffeine with Anthranilic Acid. Acta Crystallogr. B Struct. Sci. Cryst. Eng. Mater. 2014, 70, 72–80. [Google Scholar] [CrossRef]
- Ibrahim, S.A.; Salameh, M.M.; Phetsomphou, S.; Yang, H.; Seo, C.W. Application of Caffeine, 1,3,7-Trimethylxanthine, to Control Escherichia coli O157:H7. Food Chem. 2006, 99, 645–650. [Google Scholar] [CrossRef]
- Possas, A.; Valero, A.; García-Gimeno, R.M.; Pérez-Rodríguez, F.; Mendes de Souza, P. Combining UV-C Technology and Caffeine Application to Inactivate Escherichia coli on Chicken Breast Fillets. Food Control 2021, 129, 108206. [Google Scholar] [CrossRef]
- Abosede, O.O.; Gordon, A.T.; Dembaremba, T.O.; Lorentino, C.M.A.; Frota, H.F.; Santos, A.L.S.; Hosten, E.C.; Ogunlaja, A.S. Trimesic Acid-Theophylline and Isopthalic Acid-Caffeine Cocrystals: Synthesis, Characterization, Solubility, Molecular Docking, and Antimicrobial Activity. Cryst. Growth Des. 2020, 20, 3510–3522. [Google Scholar] [CrossRef]
- Maletta, A.B.; Were, L.M. Effect of Coffee Filtrate, Methylglyoxal, Glyoxal, and Caffeine on Salmonella Typhimurium and S. Enteritidis Survival in Ground Chicken Breasts. J. Food Sci. 2012, 77, M135–M141. [Google Scholar] [CrossRef]
- Haas, C.; Rose, J.; Gerba, C. Quantitative Microbial Risk Assessment, 2nd ed.; John Wiley & Sons Inc.: Hoboken, NJ, USA, 2014. [Google Scholar]
- Dean, K.; Wissler, A.; Hernandez-Suarez, J.S.; Nejadhashemi, A.P.; Mitchell, J. Modeling the Persistence of Viruses in Untreated Groundwater. Sci. Total Environ. 2020, 717, 134599. [Google Scholar] [CrossRef] [PubMed]
- McMeekin, T.; Olley, J.; Ratkowsky, D.; Corkrey, R.; Ross, T. Predictive Microbiology Theory and Application: Is It All about Rates? Food Control 2013, 29, 290–299. [Google Scholar] [CrossRef]
- Possas, A.; Valero, A.; García-Gimeno, R.M.; Pérez-Rodríguez, F.; de Souza, P.M. Influence of Temperature on the Inactivation Kinetics of Salmonella Enteritidis by the Application of UV-C Technology in Soymilk. Food Control 2018, 94, 132–139. [Google Scholar] [CrossRef]
- Keklik, N.M.; Demirci, A.; Puri, V.M.; Heinemann, P.H. Modeling the Inactivation of Salmonella Typhimurium, Listeria monocytogenes, and Salmonella Enteritidis on Poultry Products Exposed to Pulsed UV Light. J. Food Prot. 2012, 75, 281–288. [Google Scholar] [CrossRef]
- Hessel, C.T.; de Freitas Costa, E.; Boff, R.T.; Pessoa, J.P.; Tondo, E.C. A Systematic Review and Bayesian Meta-Analysis about Salmonella spp. Prevalence on Raw Chicken Meat. Microb. Risk Anal. 2022, 21, 100205. [Google Scholar] [CrossRef]
- Pagal, G.A.; Gabriel, A.A. Individual and Combined Mild Heat and UV-C Processes for Orange Juice against Escherichia coli O157:H7. LWT 2020, 126, 109295. [Google Scholar] [CrossRef]
- AOAC International; Latimer, G.W. Official Methods of Analysis of AOAC International; AOAC International: Rockville, MD, USA, 2012. [Google Scholar]
- ISO 6579-1:2017; Microbiology of the Food Chain—Horizontal Method for the Detection, Enumeration and Serotyping of Salmonella. ISO: Geneva, Switzerland, 2017.
- Geeraerd, A.H.; Valdramidis, V.P.; Van Impe, J.F. GInaFiT, a Freeware Tool to Assess Non-Log-Linear Microbial Survivor Curves. Int. J. Food Microbiol. 2005, 102, 95–105. [Google Scholar] [CrossRef]
- Soro, A.B.; Harrison, S.M.; Whyte, P.; Bolton, D.J.; Tiwari, B.K. Impact of Ultraviolet Light and Cold Plasma on Fatty Acid Profile of Raw Chicken and Pork Meat. J. Food Compos. Anal. 2022, 114, 104872. [Google Scholar] [CrossRef]
- Kim, Y.H.; Jeong, S.G.; Back, K.H.; Park, K.H.; Chung, M.S.; Kang, D.H. Effect of Various Conditions on Inactivation of Escherichia coli O157:H7, Salmonella Typhimurium, and Listeria monocytogenes in Fresh-Cut Lettuce Using Ultraviolet Radiation. Int. J. Food Microbiol. 2013, 166, 349–355. [Google Scholar] [CrossRef]
- Baysal, A.H.; Molva, C.; Unluturk, S. UV-C Light Inactivation and Modeling Kinetics of Alicyclobacillus acidoterrestris Spores in White Grape and Apple Juices. Int. J. Food Microbiol. 2013, 166, 494–498. [Google Scholar] [CrossRef]
- Gabriel, A.A.; Vera, D.D.; Lazo, O.M.Y.; Azarcon, V.B.; De Ocampo, C.G.; Marasigan, J.C.; Sandel, G.T. Ultraviolet-C Inactivation of Escherichia coli O157:H7, Listeria monocytogenes, Pseudomonas aeruginosa, and Salmonella enterica in Liquid Egg White. Food Control 2017, 73, 1303–1309. [Google Scholar] [CrossRef]
- Albert, I.; Mafart, P. A Modified Weibull Model for Bacterial Inactivation. Int. J. Food Microbiol. 2005, 100, 197–211. [Google Scholar] [CrossRef]
- Mutz, Y.S.; Rosario, D.K.A.; Bernardes, P.C.; Paschoalin, V.M.F.; Conte-Junior, C.A. Modeling Salmonella Typhimurium Inactivation in Dry-Fermented Sausages: Previous Habituation in the Food Matrix Undermines UV-C Decontamination Efficacy. Front. Microbiol. 2020, 11, 591. [Google Scholar] [CrossRef] [PubMed]
- Siguemoto, É.S.; Gut, J.A.W.; Martinez, A.; Rodrigo, D. Inactivation Kinetics of Escherichia coli O157:H7 and Listeria monocytogenes in Apple Juice by Microwave and Conventional Thermal Processing. Innov. Food Sci. Emerg. Technol. 2018, 45, 84–91. [Google Scholar] [CrossRef]
- Cerf, O. A REVIEW Tailing of Survival Curves of Bacterial Spores. J. Appl. Bacteriol. 1977, 42, 1–19. [Google Scholar] [CrossRef]
- Gündüz, G.T.; Korkmaz, A. UV-C Treatment for the Inhibition of Molds Isolated from Dried Persimmons (Diospyros kaki L.) and Modelling of UV-C Inactivation Kinetics. LWT 2019, 115, 108451. [Google Scholar] [CrossRef]
- Haughton, P.N.; Lyng, J.G.; Cronin, D.A.; Morgan, D.J.; Fanning, S.; Whyte, P. Efficacy of UV Light Treatment for the Microbiological Decontamination of Chicken, Associated Packaging, and Contact Surfaces. J. Food Prot. 2011, 74, 565–572. [Google Scholar] [CrossRef]
- Gyawali, R.; Adkins, A.; Minor, R.C.; Ibrahim, S.A. Behavior and Changes in Cell Morphology of Escherichia coli O157:H7 in Liquid Medium and Skim Milk in the Presence of Caffeine. CYTA J. Food 2014, 12, 235–241. [Google Scholar] [CrossRef]
- Almeida, A.A.P.; Naghetini, C.C.; Santos, V.R.; Antonio, A.G.; Farah, A.; Glória, M.B.A. Influence of Natural Coffee Compounds, Coffee Extracts and Increased Levels of Caffeine on the Inhibition of Streptococcus Mutans. Food Res. Int. 2012, 49, 459–461. [Google Scholar] [CrossRef]
- Bigelow, W.D.; Esty, J.R. The Thermal Death Point in Relation to Time of Typical Thermophilic Organisms. J. Infect. Dis. 1920, 27, 602–617. [Google Scholar] [CrossRef]
- Melnik, M.; Sprusansky, O.; Musil, P. Bio-Medical Aspects of Purine Alkaloids. Adv. Biol. Chem. 2014, 4, 274–280. [Google Scholar] [CrossRef]
- Apshingekar, P.P.; Aher, S.; Kelly, A.L.; Brown, E.C.; Paradkar, A. Synthesis of Caffeine/Maleic Acid Co-Crystal by Ultrasound-Assisted Slurry Co-Crystallization. J. Pharm. Sci. 2017, 106, 66–70. [Google Scholar] [CrossRef] [PubMed]
- Daurio, D.; Medina, C.; Saw, R.; Nagapudi, K.; Alvarez-Núñez, F. Application of Twin Screw Extrusion in the Manufacture of Cocrystals, Part I: Four Case Studies. Pharmaceutics 2011, 3, 582–600. [Google Scholar] [CrossRef]
- Leyssens, T.; Tumanova, N.; Robeyns, K.; Candoni, N.; Veesler, S. Solution Cocrystallization, an Effective Tool to Explore the Variety of Cocrystal Systems: Caffeine/Dicarboxylic Acid Cocrystals. CrystEngComm 2014, 16, 9603–9611. [Google Scholar] [CrossRef]
- El Hamdani, H.; El Amane, M.; Duhayon, C. Studies on the Syntheses, Structural Characterization, Antimicrobial of the CO-CRYSTAL 1,10-Phenanthrolin-1-IUM(1,10-PhenH+)-Caffeine(Caf)-Hexafluorophosphate. J. Mol. Struct. 2018, 1155, 789–796. [Google Scholar] [CrossRef]
- Ross, T. Indices for Performance Evaluation of Predictive Models in Food Microbiology. J. Appl. Bacteriol. 1996, 81, 501–508. [Google Scholar] [CrossRef]


| Caffeine (nM/g) | Protein (%) | Fat (%) | Humidity (%) | Ash (%) | Total Acidity (%) | pH | Absorption Coefficient (cm−1) |
|---|---|---|---|---|---|---|---|
| 0 | 20.82 ± 0.18 | 2.85 ± 0.08 | 74.85 ± 2.28 | 1.69 ± 0.05 | 0.21 ± 0.05 | 5.87 ± 0.08 | 959.2 ± 46.7 |
| 5 | 20.97 ± 1.48 | 2.84 ± 0.07 | 76.56 ± 2.40 | 1.66 ± 0.10 | 0.24 ± 0.05 | 5.84 ± 0.06 | 961.5 ± 31.2 |
| 10 | 21.13 ± 2.00 | 2.86 ± 0.12 | 75.40 ± 2.18 | 1.67 ± 0.06 | 0.22 ± 0.03 | 5.82 ± 0.08 | 965.8 ± 42.9 |
| 15 | 20.77 ± 1.07 | 2.80 ± 0.09 | 76.69 ± 1.70 | 1.65 ± 0.08 | 0.23 ± 0.03 | 5.84 ± 0.05 | 961.3 ± 79.7 |
| 20 | 21.18 ± 1.70 | 2.86 ± 0.05 | 74.94 ± 2.71 | 1.67 ± 0.04 | 0.24 ± 0.02 | 5.82 ± 0.12 | 962.6 ± 49.1 |
| Caffeine Dose (nM/g) | Without Caffeine * | With Caffeine * | Inactivation Rate |
|---|---|---|---|
| 0 | 7.5 ± 0.2 | 7.5 ± 0.2 | 0.23 |
| 5 | 7.6 ± 0.2 | 7.2 ± 0.0 | 0.30 |
| 10 | 7.6 ± 0.2 | 6.7 ± 0.1 | 0.32 |
| 15 | 7.6 ± 0.2 | 6.4 ± 0.2 | 0.33 |
| 20 | 7.5 ± 0.2 | 6.0 ± 0.2 | 0.29 |
| Caffeine (nM/g) | |||||
|---|---|---|---|---|---|
| Dose (J/cm2) | 0 | 5 | 10 | 15 | 20 |
| 0 | 7.5 ± 0.2 | 7.2 ± 0.0 | 6.7 ± 0.1 | 6.4 ± 0.2 | 6.0 ± 0.2 |
| 1 | 6.7 ± 0.2 | 6.3 ± 0.1 | 5.7 ± 0.1 | 5.6 ± 0.2 | 5.1 ± 0.2 |
| 2 | 6.2 ± 0.2 | 6.0 ± 0.1 | 5.4 ± 0.1 | 5.1 ± 0.2 | 4.5 ± 0.3 |
| 3 | 5.7 ± 0.1 | 5.3 ± 0.2 | 4.7 ± 0.2 | 4.3 ± 0.1 | 3.8 ± 0.2 |
| 4 | 5.6 ± 0.2 | 5.2 ± 0.2 | 4.7 ± 0.2 | 4.0 ± 0.2 | 3.6 ± 0.2 |
| 5 | 5.3 ± 0.1 | 4.8 ± 0.1 | 4.2 ± 0.2 | 3.7 ± 0.1 | 3.2 ± 0.2 |
| 6 | 5.0 ± 0.0 | 4.4 ± 0.1 | 3.9 ± 0.0 | 3.5 ± 0.1 | 2.9 ± 0.3 |
| 7 | 4.8 ± 0.3 | 4.0 ± 0.1 | 3.3 ± 0.2 | 2.9 ± 0.2 | 2.6 ± 0.3 |
| 8 | 4.8 ± 0.2 | 3.7 ± 0.3 | 3.0 ± 0.2 | 2.8 ± 0.6 | 2.6 ± 0.4 |
| 9 | 4.5 ± 0.1 | 3.6 ± 0.4 | 2.7 ± 0.5 | 2.3 ± 0.2 | 2.2 ± 0.1 |
| 10 | 4.3 ± 0.3 | 3.4 ± 0.2 | 2.4 ± 0.4 | 2.2 ± 0.2 | 1.9 ± 0.2 |
| 11 | 4.1 ± 0.3 | 3.3 ± 0.3 | 2.5 ± 0.5 | 1.8 ± 0.2 | 1.9 ± 0.4 |
| 12 | 4.2 ± 0.5 | 3.1 ± 0.3 | 2.2 ± 0.2 | 1.5 ± 0.1 | 1.3 ± 0.2 |
| 13 | 3.9 ± 0.4 | 2.6 ± 0.4 | 1.8 ± 0.2 | 1.5 ± 0.4 | 1.4 ± 0.3 |
| 14 | 3.7 ± 0.2 | 2.4 ± 0.2 | 1.8 ± 0.1 | 1.3 ± 0.2 | 1.3 ± 0.3 |
| 15 | 3.5 ± 0.5 | 2.5 ± 0.4 | 1.7 ± 0.3 | 1.2 ± 0.2 | 1.2 ± 0.2 |
Disclaimer/Publisher’s Note: The statements, opinions and data contained in all publications are solely those of the individual author(s) and contributor(s) and not of MDPI and/or the editor(s). MDPI and/or the editor(s) disclaim responsibility for any injury to people or property resulting from any ideas, methods, instructions or products referred to in the content. |
© 2024 by the authors. Licensee MDPI, Basel, Switzerland. This article is an open access article distributed under the terms and conditions of the Creative Commons Attribution (CC BY) license (https://creativecommons.org/licenses/by/4.0/).
Share and Cite
García-Gimeno, R.M.; Palomo-Manzano, E.; Posada-Izquierdo, G.D. Salmonella Inactivation Model by UV-C Light Treatment in Chicken Breast. Microorganisms 2024, 12, 1805. https://doi.org/10.3390/microorganisms12091805
García-Gimeno RM, Palomo-Manzano E, Posada-Izquierdo GD. Salmonella Inactivation Model by UV-C Light Treatment in Chicken Breast. Microorganisms. 2024; 12(9):1805. https://doi.org/10.3390/microorganisms12091805
Chicago/Turabian StyleGarcía-Gimeno, Rosa María, Eva Palomo-Manzano, and Guiomar Denisse Posada-Izquierdo. 2024. "Salmonella Inactivation Model by UV-C Light Treatment in Chicken Breast" Microorganisms 12, no. 9: 1805. https://doi.org/10.3390/microorganisms12091805