Abstract
Historical microbial collections often contain samples that have been deposited over extended time periods, during which accepted taxonomic classification (and also available methods for taxonomic assignment) may have changed considerably. Deposited samples can, therefore, have historical taxonomic assignments (HTAs) that may now be in need of revision, and subdivisions of previously-accepted taxa may also be possible with the aid of current methodologies. One such methodology is matrix-assisted laser-desorption and ionization time-of-flight mass spectrometry (MALDI-TOF MS). Motivated by the high discriminating power of MALDI-TOF MS coupled with the speed and low cost of the method, we have investigated the use of MALDI-TOF MS for spectral grouping of past deposits made to the Centre for Agriculture and Bioscience International (CABI) Genetic Resource Collection under the HTA Aspergillus versicolor, a common ascomycete fungus frequently associated with soil and plant material, food spoilage, and damp indoor environments. Despite their common HTA, the 40 deposits analyzed in this study fall into six clear spectral-linkage groups (containing nine, four, four, four, four, and two members, respectively), along with a group of ten spectrally-unique samples. This study demonstrates the clear resolving power of MALDI-TOF MS when applied to samples deposited in historical microbial collections.
1. Introduction
Historical microbial collections often contain samples that have been deposited over extended time periods, sometimes many decades. Over this time, accepted taxonomic classification (and also the available methods for taxonomic assignment) may have changed considerably. Prior to the 1990s, common methods for taxonomic assignment of fungi were based predominantly upon microscopy and the analysis of morphological features, often coupled with taxonomic keys. Whilst DNA-based methods have increased considerably in significance since, samples deposited earlier may have historical taxonomic assignments (HTAs) that may now be in need of revision, and the subdivision of previously-accepted taxa may also be possible with the aid of current methodologies. One such methodology is matrix-assisted laser-desorption and ionization time-of-flight mass spectrometry (MALDI-TOF MS), which is rapid and relatively inexpensive, and has found widespread use in the characterization and identification of biological samples.
MALDI-TOF MS exploits the simple yet elegant laser-initiated ‘MALDI’ soft-ionization process [1], which enables the desorption of large proteins into the gas phase without fragmentation. In addition, the MALDI process adds a single positive charge to a significant proportion of the desorbed proteins [2]. This positive charge allows the gas-phase proteins to be accelerated over a short distance by means of an electrical field, thereafter travelling at constant velocity down an evacuated flight tube. As protein times-of-flight to a detector at the end of the flight tube are proportional to the square root of their mass-over-charge ratios [3], a mass spectrum can readily be generated from the biological sample. Whilst MALDI-TOF MS is possible with a wide range of proteins, for the characterization (or identification) of protein-containing samples, highly-expressed and acid-soluble proteins are frequently employed [4]. This fraction of the proteome also contains many ribosomal proteins.
Numerous methods have been developed for MALDI-TOF MS sample-preparation [3,5,6,7,8,9,10,11], ranging from so-called ‘direct-transfer’ protocols (frequently used for the identification of bacteria and yeasts, particularly in clinical diagnostics) to ‘full-extraction’ protocols after Cassagne et al. [7] (which are commonly used for fungal identifications). In addition to the above, Reeve et al. [12] have developed a broadly-applicable yet simple and inexpensive sample-preparation method that lyses microbial cells by immersion in aqueous acetonitrile that also contains trifluoroacetic acid (TFA) to extract acid-soluble proteins, along with near-saturated and inexpensive-grade α-cyano-4-hydroxycinnamic acid (HCCA) matrix. This method can also be applied to insect [12], plant, [12,13], and seed material [14] simply by macerating the biomass of interest in the above reagent. After immersion (or maceration), the resulting matrix-saturated lysate, which also contains the extracted proteins for sample characterization or identification, is simply dried directly onto the MALDI-TOF MS sample plate ready for analysis. Given the high discriminating power of MALDI-TOF MS [12,13,14,15,16] coupled with the speed and low cost of the method [12], we have applied MALDI-TOF MS-based analysis to historical deposits made to the CABI Genetic Resource Collection that all share the HTA Aspergillus versicolor.
Aspergillus versicolor (Vuillemin) Tiraboschi [17] is an ascomycete fungus commonly associated with soil and plant material [18], food spoilage [19], and damp indoor environments [20,21,22,23], where it can produce a characteristic ‘earthy’ odor. A. versicolor also produces the mycotoxin sterigmatocystin [24]. In addition to A. versicolor’s environmental occurrence, invasive aspergillosis is also a significant clinical problem in immunocompromised patients [25], and disseminated aspergillosis in dogs has been linked to A. versicolor [26]. As reviewed in [27], Aspergillus section Versicolores (containing the species A. amoenus, A. protuberus, A. sydowii, A. tabacinus and A. versicolor) was derived from the original Aspergillus versicolor group [28] through five historical taxonomic revisions. Using multilocus DNA sequence-based phylogeny, nine new species (A. austroafricanus, A. creber, A. cvjetkovicii, A. fructus, A. jensenii, A. puulaauensis, A. subversicolor, A. tennesseensis and A. venenatus) were described within Aspergillus section Versicolores [27]. A subsequent multilocus phylogenetic study [29] synonymized section Versicolores with section Nidulantes and established that Aspergillus section Versicolores formed a subclade within section Nidulantes.
As a rapid and inexpensive complement to methodologies based upon morphological analysis of growth in culture [29] and nucleic-acid analysis [27,29,30,31,32], in the current article, we have investigated the use of MALDI-TOF MS for spectral grouping of past deposits made to the CABI Genetic Resource Collection under the HTA A. versicolor.
2. Materials and Methods
The following 40 strains used in this study (Table 1) were obtained from the CABI Genetic Resources Collection, a recognized microbial repository, an International Depositary Authority under the Budapest Treaty, and part of the global World Federation for Culture Collections network of public-service culture collections providing authenticated microorganism and reference material to the scientific community.

Table 1.
Strains used in the current study.
All cultures were then grown for 3 days at 25 °C on duplicate Potato Dextrose Agar (Oxoid, Thermo Fisher Scientific, Waltham, MA, USA) plates. ≥99.8% ethanol, ≥ 98% (TLC-grade) α-cyano-4-hydroxycinnamic acid (HCCA) matrix, LC-MS-grade acetonitrile, and 99% ReagentPlus®-grade TFA were purchased from Sigma (Gillingham, UK). CHROMASOLVTM LC-MS-grade water was purchased from Fluka (Loughborough, UK).
Fungal biomass was mixed with 60 µL of MALDI reagent 1 (11 mg/mL HCCA matrix in 65% (v/v) acetonitrile, 2.5% (v/v) TFA, and 32.5% (v/v) water) using a plastic inoculating loop coated in biomass. Cell lysis and acid-soluble-protein extraction were carried out at room temperature (20 °C), and samples were left for at least one minute before further processing. One microliter of the resulting crude lysates was then pipetted onto the Bruker sample plate, air dried, and loaded into the spectrometer.
Mass spectrometry covering the mass range between 2 kDa and 20 kDa was carried out using a Bruker Microflex LT linear-mode instrument running the MALDI Biotyper 4.0 applications (Bruker Daltonik, Bremen, Germany) as described in Reeve and Seehausen [15]. All spectra are shown baseline-subtracted, smoothed, y-axis-autoscaled, and covering the mass range 2 kDa to 20 kDa (with x-axis scale increments of 2 kDa). Calibration was carried out using the manufacturer’s ‘BTS’ controls (E. coli proteins supplemented with ribonuclease A and myoglobin), using peaks with masses at 3,637.8; 5,096.8; 5,381.4; 6,255.4; 7,274.5; 10,300.2; 13,683.2, and 16,952.3 for calibration according to the manufacturer’s instructions.
Sample preparations from plate-1 and plate-2 replicates were carried out as described above, from which a database of 40 plate-1 reference spectra was generated. For spectral comparison, plate-2 test samples were compared against the database of plate-1 reference spectra and Bruker identification scores were generated as described in Reeve and Seehausen [15]. In these molecular-weight-based spectral comparisons, Bruker identification scores were derived using the standard Bruker algorithm. This first converts raw mass spectra into peak lists, which are then compared between spectra. Three separate values are computed: the number of peaks in the reference spectrum that have a closely-matching partner in the test spectrum (value range 0–1), the number of peaks in the test spectrum that have a closely-matching partner in the reference spectrum (value range 0–1), and the peak-height symmetry of the matching peaks (value range 0–1). The above three values are multiplied together and normalized to 1000, and the base-10 logarithm is then taken to give the final Bruker score (range 0–3). Bruker scores of scores between 2.3 and 3.0 indicate very close relatedness, scores between 2.0 and 2.3 indicate close relatedness, and scores below 1.7 indicate low relatedness.
Methods used to undertake morphological identification were based on Klich [33]. Cultures were recovered from preserved stock and three-point inoculations were prepared on 90 mm plates of Czapek Yeast Autolysate Extract Agar (CYA formulation according to Samson and Pitt [34]). The cultures were incubated in darkness at 25 °C for 7 days. Growth rate was then measured and colony colors (upperside and reverse) were recorded. Using a Nikon D40 camera with a DX Nikkor 18–55 mm f/3.5–5.6 G ED II lens and zoom setting at 45, photographs were taken of the top and base of the 7-day culture plates.
Microscopic examination was performed by removing a small quantity of material from the 7-day plates using a sterile needle, mounting on a glass slide in a drop of lactofuchsin stain (0.2 g acid-fuschin, 50 mL glycerol, and 150 mL lactic acid), adding a cover slip, and examining structures at 400× using an Olympus BH-2 microscope. From the features observed, including vesicle diameter and shape, presence/absence of metulae, colony diameter and size, shape, color, and ornamentation of conidia, the taxonomic key to the Aspergillus species [33] was used to determine provisional morphological identification.
3. Results
Figure 1 and Figure 2 show the MALDI-TOF MS spectra of acid-soluble fungal proteins from duplicate plates for all strains with the HTA A. versicolor listed in the methods section.
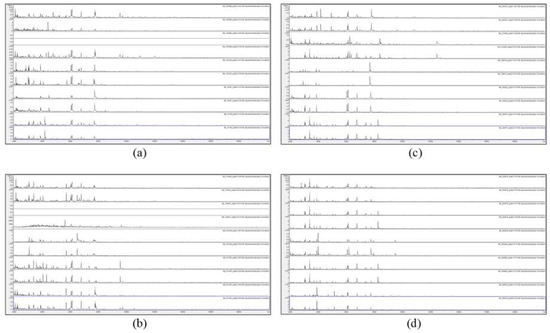
Figure 1.
Matrix-assisted laser-desorption and ionization time-of-flight mass spectrometry (MALDI-TOF MS) spectra of acid-soluble fungal proteins from duplicate plates (plate 1 above and plate 2 below), for (a) from top to bottom IMI 129488, IMI 129489, IMI 133245, IMI 16041 ii, and IMI 16139; (b) from top to bottom IMI 174454, IMI 194967, IMI 210448, IMI 211385, and IMI 211400; (c) from top to bottom IMI 226507, IMI 314386, IMI 339610, IMI 349032, and IMI 360877; and (d) from top to bottom IMI 360878, IMI 360879, IMI 366228, IMI 360880, and IMI 369918. IMI: Imperial Mycological Institute.
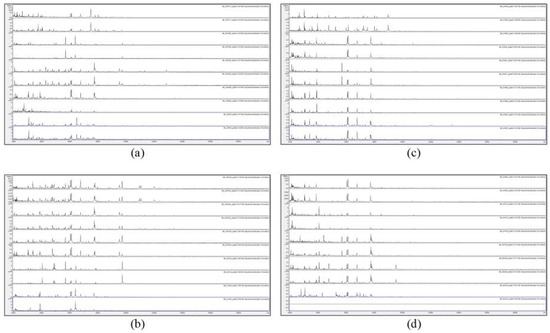
Figure 2.
MALDI-TOF MS spectra of acid-soluble fungal proteins from duplicate plates (plate 1 above and plate 2 below), for (a) from top to bottom IMI 381617, IMI 381685, IMI 383240, IMI 40496b, and IMI 40636; (b) from top to bottom IMI 45554 ii, IMI 45554 iii, IMI, 45554 iv, IMI 49124, and IMI 57426; (c) from top to bottom IMI 91859, IMI 91883, IMI 91887, IMI 91890, and IMI 91891; and (d) from top to bottom IMI 91892, IMI 94152, IMI 94159, IMI 96228, and IMI 96330.
Figure 1 and Figure 2 show that no spectra were obtained from IMI 129489 (plate 1), IMI 194967 (plate 1), and IMI 96330 (plate 2), and poor-quality spectra were obtained from IMI 129488 (plate 2) and IMI 194967 (plate 2) (not included for further analysis). For the remaining 75 samples (94%), peak-rich spectra with good duplication were obtained. Despite the fact that the HTA for each sample is nominally the same (A. versicolor), there are visible differences apparent between many of the spectra. In order to discriminate at high resolution between the samples, pairwise spectral comparisons were made. Table 2 shows the Bruker scores generated from spectral comparisons between plate-1 reference-sample spectra and plate-2 test-sample spectra, showing all Bruker scores of 2.0 or greater obtained for each test sample unless the highest score was below 2.0, in which case the highest score obtained is shown (indicated in parentheses). Bruker scores of between 2.300 and 3.000 indicate very close relatedness (‘highly-probable species-level identification’), scores between 2.000 and 2.299 indicate close relatedness (‘secure genus-level identification and probable species-level identification’), scores between 1.700 and 1.999 indicate intermediate relatedness (‘probable genus-level identification’), and scores below 1.699 indicate low relatedness (‘no reliable identification’).
Table 2.
Bruker scores for spectral comparison between plate-1 reference samples and plate-2 test samples.
From the 100 spectral comparisons shown Table 2, one score of zero was obtained (because IMI 96330 plate 2 failed to generate a spectrum), and three comparisons were obtained with Bruker scores falling below 2.0 (samples 4, 7, and 24). For the remaining 96 comparisons, Bruker scores exceeding 2.0 were obtained, with an average score of 2.319 and a standard deviation of 0.193.
The data in Table 2 enable the construction of spectral-linkage groups (SLGs), within which all members are related by one or more spectral comparison in Table 2 with a Bruker score exceeding 2.0, and between which SLGs no members have a spectral comparison in Table 2 with a Bruker score exceeding 2.0. Six SLGs are apparent from the data in Table 2.
SLG 1 contains 37 high-scoring spectral linkages [(IMI 383240–IMI 45554ii), (IMI 45554ii–IMI 383240), (IMI 129489–IMI 45554ii), (IMI 129489–IMI 383240), (IMI 383240–IMI 96228), (IMI 45554iii–IMI 383240), (IMI 94159–IMI 96228), (IMI 96228–IMI 129488), (IMI 96228–IMI 45554iii), (IMI 96228–IMI 211400), (IMI 96228–IMI 45554iv), (IMI 96228–IMI 94159), (IMI 96228–IMI 45554ii), (IMI 45554iv–IMI 96228), (IMI 45554iii–IMI 96228), (IMI 45554ii–IMI 96228), (IMI 211400–IMI 96228), (IMI 129489–IMI 96228), (IMI 45554iii–IMI 129488), (IMI 45554iii–IMI 45554iv), (IMI 45554iii–IMI 45554ii), (IMI 45554iv–IMI 45554iii), (IMI 129488–IMI 45554iii), (IMI 129489–IMI 45554iii), (IMI 383240–IMI 45554iii), (IMI 45554ii–IMI 45554iii), (IMI 45554iv–IMI 129488), (IMI 45554ii–IMI 129488), (IMI 383240–IMI 129488), (IMI 129489–IMI 129488), (IMI 45554iv–IMI 45554ii), (IMI 45554iv–IMI 211400), (IMI 383240–IMI 45554iv), (IMI 45554ii–IMI 45554iv), (IMI 129489–IMI 45554iv), (IMI 211400–IMI 94159), and (IMI 94159–IMI 211400)]. SLG 1 members are IMI 129488, IMI 129489, IMI 211400, IMI 383240, IMI 45554ii, IMI 45554iii, IMI 45554iv, IMI 94159, and IMI 96228.
SLG 2 contains 12 high-scoring spectral linkages [(IMI 360877–IMI 360879), (IMI 360878–IMI 360879), (IMI 360879–IMI 360877), (IMI 360879–IMI 360880), (IMI 360879–IMI 360878), (IMI 360880–IMI 360879), (IMI 360877–IMI 360880), (IMI 360877–IMI 360878), (IMI 360878–IMI 360877), (IMI 360878–IMI 360880), (IMI 360880–IMI 360878), and (IMI 360880–IMI 360877)]. SLG 2 members are IMI 360877, IMI 360878, IMI 360879, and IMI 360880.
SLG 3 contains five high-scoring spectral linkages [(IMI 91887–IMI 16139), (IMI 91887–IMI 91891), (IMI 16139–IMI 91891), (IMI 16139–IMI 40496b), and (IMI 91891–IMI 40496b)]. SLG 3 members are IMI 16139, IMI 40496b, IMI 91887, and IMI 91891.
SLG 4 contains four high-scoring spectral linkages [(IMI 40636–IMI 174454), (IMI 40636–IMI 339610), (IMI 40636–IMI 210448), and (IMI 174454–IMI 210448)]. SLG 4 members are IMI 174454, IMI 210448, IMI 339610, and IMI 40636.
SLG 5 contains three high-scoring spectral linkages [(IMI 369918–IMI 91890), (IMI 369918–IMI 57426), and (IMI 369918–IMI 91892)]. SLG 5 members are IMI 57426, IMI 91890, IMI 91892, and IMI 369918.
SLG 6 contains one high-scoring spectral linkage [(IMI 133245–IMI 349032)]. SLG 6 members are IMI 133245 and IMI 349032.
In addition to the above six SLGs, the data in Table 2 show that there are ten spectrally-unique samples (SUSs) that generated no other Bruker score exceeding 2.0 other than the plate-1 against cognate plate-2 comparison. The ten high-scoring SUSs are IMI 211385, IMI 226507, IMI 314386, IMI 366228, IMI 381617, IMI 381685, IMI 49124, IMI 91859, IMI 91883, and IMI 94152 (with plate-1 against cognate plate-2 matches of 2.439, 2.249, 2.289, 2.276, 2.220, 2.361, 2.607, 2.400, 2.021, and 2.130 respectively).
The remaining three samples either failed to generate a plate-2 test spectrum (IMI 96330) or failed to give spectral comparison scores of greater than 2.0 (IMI 16041 ii and IMI 194967).
In order to assess visually the spectral consistency within each SLG, Figure 3 shows the MALDI-TOF MS spectra of acid-soluble fungal proteins from the plate-2 samples comprising SLG 1 to SLG 6, along with the ten SUSs.
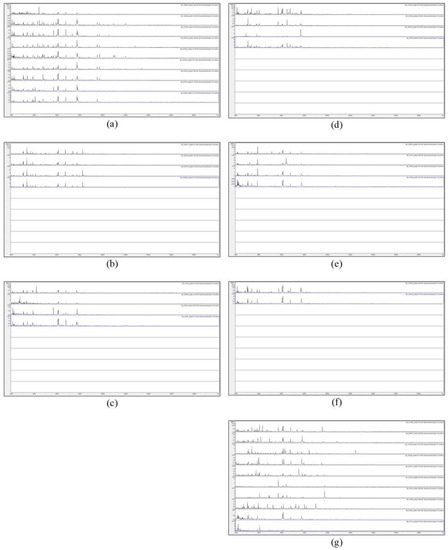
Figure 3.
MALDI-TOF MS spectra of acid-soluble fungal proteins from plate-2 samples comprising (a) spectral-linkage group (SLG) 1, (b) SLG 2, (c) SLG 3, (d) SLG 4, (e) SLG 5, (f) SLG 6, and (g) spectrally-unique samples (SUSs).
Figure 3 shows a considerable degree of spectral variation in the SUSs; good consistency between spectra within SLGs 1, 2, 5, and 6; and some variation (mainly due to additional peaks) within SLGs 3 and 4. Figure 4 shows, for ready visual comparison between the six SLGs, MALDI-TOF MS spectra of acid-soluble fungal proteins from plate-2 examples of each of the six SLGs.
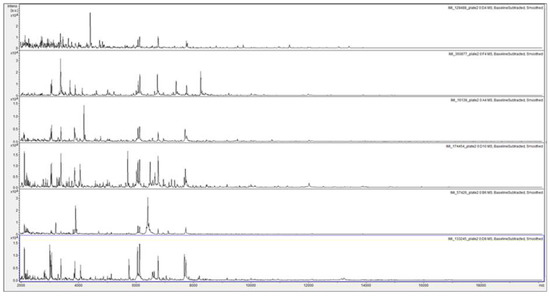
Figure 4.
MALDI-TOF MS spectra of acid-soluble fungal proteins from plate-2 examples of, from top to bottom, SLG 1 (IMI 129488), SLG 2 (IMI 360877), SLG 3 (IMI 16139), SLG 4 (IMI174454), SLG 5 (IMI 57426), and SLG 6 (133245).
Table 3 shows the Bruker scores for spectral comparison against the Bruker database of filamentous fungal samples for the SLGs and SUSs, where Bruker scores between 1.700 and 1.999 (‘probable genus-level identification’) are indicated in parentheses, and Bruker scores below 1.699 (‘no reliable identification’) are indicated by strike-through. The results of independent and blind post-MALDI-TOF MS taxonomic-key-based morphological identifications at seven days (see Figure S1 for example images) are also given for comparison.
Table 3.
Bruker scores for spectral comparison against the Bruker database of filamentous-fungal samples for the SLGs and SUSs, along with taxonomic-key-based identification results.
4. Discussion
Motivated by the high discriminating power of MALDI-TOF MS coupled with the speed and low cost of the method, we have investigated the use of MALDI-TOF MS for spectral grouping of past deposits made to the CABI Genetic Resource Collection under the HTA A. versicolor. Despite their common HTA, the 40 deposits analyzed fall into six clear SLGs (SLGs 1, 2, 3, 4, 5, and 6, with nine, four, four, four, four, and two members respectively), along with a group of ten high-scoring SUSs.
Comparison between the spectra obtained and the Bruker database has been carried out but, whilst the grouping of samples on the basis of spectral similarity is clear, the results shown in Table 3 should not be interpreted as definitive taxonomic classifications for the samples analyzed in this study as relatively few species of Aspergillus are represented in the Bruker database spectra. Those available in the database are A. calidoustus, A. clavatus, A. flavus oryzae group, A. fumigatus, A. glaucus, A. iizukae, A. japonicus, A. lentulus, A. minisclerotigenes, A. montvidensis, A. nidulans, A. niger, A. nomius, A. ochraceus, A. parasiticus, A. penicillioides, A. pseudoglaucus, A. pulvinus, A. sclerotiorum, A. sydowii, A. tamarii, A. terreus, A. tritici, A. unguis, A. ustus, A. versicolor, and A. westerdijkiae. In addition, spectra found in the Bruker database will have been generated following sample-preparation methods other than the method used in the present study, which may reduce the scorings obtained from spectral comparisons. Bearing these caveats in mind, however, the spectral comparisons do reveal a number of interesting observations.
Firstly, members of SLG 2 show a consistent ‘identification’ of A. ustus (supported by taxonomic-key-based morphological identifications) rather than A. versicolor as is the case for the remaining five SLGs, with IMI 360877, IMI 360878, IMI 360879 matching most closely to A. ustus database-entry DSM 1349 DSM and IMI 360880 matching most closely to A. ustus database-entry DSM 63535 DSM. Secondly, whilst SLG 1 is the largest SLG observed in this study, in contrast to any of the other SLGs, the Bruker scores for database entries within SLG 1 all fall below 1.7, suggesting that members of this SLG, whilst closely-related to each other, are spectrally the most remote from any of the Bruker database entries. Thirdly, all members of SLG 4 show a consistent ‘identification’ of A. versicolor 2009_137364 MUZ, with higher Bruker scores that suggest closer relatedness of these SLG members to the database entry. Fourthly, higher Bruker scores against database entries are again observed in SLG 6, where the highest ‘identifications’ scores are to A. versicolor database-entry F51 LLH. Finally, the SUS IMI 91859 is ‘identified’ as Penicillium italicum DSM 2754NT DSM, which is supported by the different growth morphology observed for this strain on the agar plates prior to sampling and by taxonomic-key-based morphological identification. As such, it is clear that this isolate was mis-identified on its deposit to the CABI collection.
It is clear from the above that the HTA given to the 40 strains used in this study (A. versicolor) covers a wide range of groupable subtypes from the MALDI-TOF MS spectra resulting from growth in culture followed by a simple and inexpensive method of sample preparation. MALDI-TOF MS, therefore, offers a rapid and inexpensive method for the classification of past deposits made to microbial collections and has great potential alongside complementary methodologies based upon morphological assessment [27,33] and nucleic-acid analysis [27,29,30,31,32] to assist taxonomists working with deposits made under HTAs that now may be in need of further revision or clarification.
Supplementary Materials
Supplementary materials can be found at https://www.mdpi.com/2076-2607/7/8/235/s1. Figure S1 Examples of morphology from SLGs 1–6 at 7-days on CYA grown at 25 °C.
Author Contributions
Conceptualization, A.G.B., T.S.C., and M.A.R.; resources, A.G.B.; methodology, M.A.R., and T.S.C.; formal analysis, M.A.R.; writing—original draft preparation, M.A.R.; writing—review and editing, M.A.R., T.S.C., and A.G.B.
Funding
The Bruker Microflex mass spectrometer and time spent on these studies were kindly funded by Crop Health and Protection Limited (CHAP).
Acknowledgments
Thanks are due to Esther Madden for providing information on the strains used. CABI is an international intergovernmental organization, and we gratefully acknowledge the core financial support from our member countries (and lead agencies) including the United Kingdom (Department for International Development), China (Chinese Ministry of Agriculture), Australia (Australian Centre for International Agricultural Research), Canada (Agriculture and Agri-Food Canada), Netherlands (Directorate-General for International Cooperation), and Switzerland (Swiss Agency for Development and Cooperation). See https://www.cabi.org/about-cabi/who-we-work-with/key-donors/ for full details.
Conflicts of Interest
The authors declare no conflict of interest.
References
- Karas, M.; Bachmann, D.; Hillenkamp, F. Influence of the wavelength in high-irradiance ultraviolet laser desorption mass spectrometry of organic molecules. Anal. Chem. 1985, 57, 2935–2939. [Google Scholar] [CrossRef]
- Knochenmuss, R. Ion formation mechanisms in UV-MALDI. Analyst 2006, 131, 966–986. [Google Scholar] [CrossRef]
- Clark, A.E.; Kaleta, E.J.; Arora, A.; Wolk, D.M. Matrix-assisted laser desorption ionization–time of flight mass spectrometry: A fundamental shift in the routine practice of clinical microbiology. Clin. Microbiol. Rev. 2013, 26, 547–603. [Google Scholar] [CrossRef]
- Singhal, N.; Kumar, M.; Kanaujia, P.K.; Virdi, J.S. MALDI-TOF mass spectrometry: An emerging technology for microbial identification and diagnosis. Front. Microbiol. 2015, 6, 791. [Google Scholar] [CrossRef]
- Fraser, M.; Brown, Z.; Houldsworth, M.; Borman, A.M.; Johnson, E.M. Rapid identification of 6328 isolates of pathogenic yeasts using MALDI-ToF MS and a simplified rapid extraction procedure that is compatible with the Bruker Biotyper platform and database. Med. Mycol. 2016, 54, 80–88. [Google Scholar] [CrossRef]
- Bader, O. MALDI-TOF-MS-based species identification and typing approaches in medical mycology. Proteomics 2013, 13, 788–799. [Google Scholar] [CrossRef]
- Cassagne, C.; Ranque, S.; Normand, A.C.; Fourquet, P.; Thiebault, S.; Planard, C.; Hendrickx, M.; Piarroux, R. Mould routine identification in the clinical laboratory by matrix-assisted laser desorption ionization time-of-flight mass spectrometry. PLoS ONE 2011, 6, e28425. [Google Scholar] [CrossRef]
- Becker, P.T.; Stubbe, D.; Claessens, J.; Roesems, S.; Bastin, Y.; Planard, C.; Cassagne, C.; Piarroux, R.; Hendrickx, M. Quality control in culture collections: Confirming identity of filamentous fungi by MALDI-TOF MS. Mycoscience 2015, 56, 273–279. [Google Scholar] [CrossRef]
- Normand, A.C.; Cassagne, C.; Ranque, S.; L’Ollivier, C.; Fourquet, P.; Roesems, S.; Hendrickx, M.; Piarroux, R. Assessment of various parameters to improve MALDI-TOF MS reference spectra libraries constructed for the routine identification of filamentous fungi. BMC Microbiol. 2013, 13, 76. [Google Scholar] [CrossRef]
- Adams, L.L.; Salee, P.; Dionne, K.; Carroll, K.; Parrish, N. A novel protein extraction method for identification of mycobacteria using MALDI-ToF MS. J. Microbiol. Methods 2015, 119, 1–3. [Google Scholar] [CrossRef]
- Instructions for Use: Bruker Guide to MALDI Sample Preparation; Bruker Daltonik GmbH: Bremen, Germany, 2015.
- Reeve, M.A.; Buddie, A.G.; Pollard, K.M.; Varia, S.; Seier, M.K.; Offord, L.C.; Cock, M.J.W. A highly-simplified and inexpensive MALDI-TOF mass spectrometry sample-preparation method with broad applicability to microorganisms, plants, and insects. J. Biol. Methods 2018, 5, e103. [Google Scholar] [CrossRef]
- Reeve, M.A.; Pollard, K.M.; Kurose, D. Differentiation between closely-related Impatiens spp. and regional biotypes of Impatiens glandulifera using a highly-simplified and inexpensive method for MALDI-TOF MS. Plant. Methods 2018, 14, 60. [Google Scholar] [CrossRef]
- Reeve, M.A.; Pollard, K.M. Discrimination between regional biotypes of Impatiens glandulifera using a simple MALDI-TOF MS-based method for use with seeds. Plant. Methods 2019, 15, 25. [Google Scholar] [CrossRef]
- Reeve, M.A.; Seehausen, M.L. Discrimination between Asian populations of the parasitoid wasp Ganaspis cf. brasiliensis using a simple MALDI-TOF MS-based method for use with insects. Biol. Methods Protoc. 2019, 4. [Google Scholar] [CrossRef]
- Caputo, P.; Di Martino, M.C.; Perfetto, B.; Iovino, F.; Donnarumma, G. Use of MALDI-TOF MS to Discriminate between Biofilm-Producer and Non-Producer Strains of Staphylococcus epidermidis. Int. J. Environ. Res. Public Health 2018, 15, 1695. [Google Scholar] [CrossRef]
- Tiraboschi. Aspergillus versicolor (Vuill.). Ann. Bot. 1908, 7, 9. [Google Scholar]
- Bertuzzi, T.; Romani, M.; Rastelli, S.; Giorni, P. Mycotoxins and Related Fungi in Italian Paddy Rice During the Growing Season and Storage. Toxins 2019, 11, 151. [Google Scholar] [CrossRef]
- Garnier, L.; Valence, F.; Mounier, J. Diversity and Control of Spoilage Fungi in Dairy Products: An Update. Microorganisms 2017, 5, 42. [Google Scholar] [CrossRef]
- Pasanen, P.; Korpi, A.; Kalliokoski, P.; Pasanen, A.-L. Growth and volatile metabolite production of Aspergillus versicolor in house dust. Environ. Int. 1997, 23, 425–432. [Google Scholar] [CrossRef]
- Shelton, B.G.; Kirkland, K.H.; Flanders, W.D.; Morris, G.K. Profiles of airborne fungi in buildings and outdoor environments in the United States. Appl. Environ. Microbiol. 2002, 68, 1743–1753. [Google Scholar] [CrossRef]
- Engelhart, S.; Loock, A.; Skutlarek, D.; Sagunski, H.; Lommel, A.; Färber, H.; Exner, M. Occurrence of toxigenic Aspergillus versicolor isolates and sterigmatocystin in carpet dust from damp indoor environments. Appl. Environ. Microbiol. 2002, 68, 3886–3890. [Google Scholar] [CrossRef]
- Andersen, B.; Frisvad, J.; Søndergaard, I.; Rasmussen, I.; Larsen, L. Associations between fungal species and water-damaged building materials. Appl. Environ. Microbiol. 2011, 77, 4180–4188. [Google Scholar] [CrossRef]
- Tuomi, T.; Reijula, K.; Johnsson, T.; Hemminki, K.; Hintikka, E.L.; Lindroos, O.; Haahtela, T. Mycotoxins in crude building materials from water-damaged buildings. Appl. Environ. Microbiol. 2000, 66, 1899–1904. [Google Scholar] [CrossRef]
- Baddley, J.W.; Marr, K.A.; Andes, D.R.; Walsh, T.J.; Kauffman, C.A.; Kontoyiannis, D.P.; Moser, S.A. Patterns of susceptibility of Aspergillus isolates recovered from patients enrolled in the Transplant-Associated Infection Surveillance Network. J. Clin. Microbiol. 2009, 47, 3271–3275. [Google Scholar] [CrossRef]
- Zhang, S.; Corapi, W.; Quist, E.; Griffin, S.; Zhang, M. Aspergillus versicolor, a new causative agent of canine disseminated aspergillosis. J. Clin. Microbiol. 2012, 50, 187–191. [Google Scholar] [CrossRef]
- Jurjevic, Z.; Peterson, S.W.; Horn, B.W. Aspergillus section Versicolores: Nine new species and multilocus DNA sequence based phylogeny. Ima Fungus 2012, 3, 59–79. [Google Scholar] [CrossRef]
- Thom, C.; Church, M.B. The Aspergilli; Williams & Wilkins comp.: Baltimore, MD, USA, 1926; pp. 1–272. [Google Scholar]
- Hubka, V.; Nováková, A.; Peterson, S.W. A reappraisal of Aspergillus section Nidulantes with descriptions of two new sterigmatocystin-producing species. Plant. Syst. Evol. 2016, 302, 1267–1299. [Google Scholar] [CrossRef]
- Schoch, C.L.; Seifert, K.A.; Huhndorf, S.; Robert, V.; Spouge, J.L.; Levesque, C.A. Fungal Barcoding Consortium Author List. Nuclear ribosomal internal transcribed spacer (ITS) region as a universal DNA barcode marker for Fungi. Proc. Natl. Acad. Sci. USA 2012, 109, 6241–6246. [Google Scholar] [CrossRef]
- Zhao, J.; Kong, F.; Li, R.; Wang, X.; Wan, Z.; Wang, D. Identification of Aspergillus fumigatus and related species by nested PCR targeting ribosomal DNA internal transcribed spacer regions. J. Clin. Microbiol. 2001, 39, 2261–2266. [Google Scholar] [CrossRef]
- Libert, X.; Packeu, A.; Bureau, F.; Roosens, N.H.; De Keersmaecker, S.C. Discrimination of three genetically close Aspergillus species by using high resolution melting analysis applied to indoor air as case study. BMC Microbiol. 2017, 17, 84. [Google Scholar] [CrossRef]
- Klich, M.A. Identification of Common Aspergillus Species; Centraalbureau voor Schimmelcultures: Utrecht, The Netherlands, 2002. [Google Scholar]
- Samson, R.A.; Pitt, J.I. Advances in Penicillium and Aspergillus Systematics; Plenum Publishers: New York, NY, USA, 1985. [Google Scholar]


© 2019 by the authors. Licensee MDPI, Basel, Switzerland. This article is an open access article distributed under the terms and conditions of the Creative Commons Attribution (CC BY) license (http://creativecommons.org/licenses/by/4.0/).