4. Discussion
The term resistant starch (RS) refers to the starch fraction that escapes digestion by mammalian enzymes in the small intestine and reaches the large intestine where it is fermented by commensal bacteria into beneficial energy substrates like SCFAs [
20]. The resistance to digestion of these starches can be by means of cell walls, of their raw granular crystalline format, retrogradation, chemical modification, or complexation with lipids (RS types I, II, III, IV and V, respectively; [
21]). In previous work on this topic, dog kibbles with three levels of thermomechanical energy were produced through a single-screw extruder (Wenger X115, Sabetha, KS, USA) by modifying extruder in-barrel moisture (IBM) and shaft speed (SS; [
6]) with the goal to retain more RS types II and III. These diets were fed to dogs in the present study. Our hypothesis was that canine consumption of foods having increased retention of resistant starch via modulation of thermomechanical energy would lead to increased levels of gut bacteria with documented metabolic predilections toward saccharolysis. Secondarily, we sought to assess the meaningfulness of microbial changes by assessing whether fecal products of saccharolytic fermentation (e.g., SCFA, pH, lactate) changed in a manner concordant with the fecal microbiota community abundances. We found that although there were relatively minor changes to the fecal microbiota abundances and community structure, there were more numerous and larger magnitude changes in the products of gut microbiota fermentation of carbohydrate. These data show the metabolic flexibility of the canine gut microbiota and emphasize that altering substrate availability may mediate positive changes in levels of saccharolytic postbiotics without necessarily changing which bacteria are present. Thus, data from the present work point towards a change in microbial activity without significantly changing the microbial ecology.
The amount of starch that escapes small intestinal (SI) digestion and reaches the colon can vary according to dietary effects such as food matrix composition, starch processing and cooking level, and individual dog factors such as food intake, species mastication habits, transit time, among others [
20]. Resistant starches that are not chemically modified can be digested in the small intestine, given the right amount of enzymes relative to substrate and adequate environmental conditions [
22].
There might be a concern that high levels of RS would cause digestive upset due to overfermentation. However, this was not the case of the present study because the amount of RS in each diet was low (<1.06%;
Table S1). Previous reports indicate that small-sized dogs had no adverse stool quality issues even when fed as much as 7% RS per day [
23]. Further, there was no expectation for diet refusals since corn is known to be palatable for the dog [
24].
Processing inputs to produce dietary treatments in this experiment were intentionally modified to produce increasing levels of slowly digestible starch (SDS) and RS as determined by an in vitro enzymatic procedure [
6]. While the intent was to alter RS, the more appropriate description of dietary treatments was high, medium and low shear, because what we could control was the mechanical energy input in each diet. The high shear food was produced similar to most pet foods available in the market with the highest level of starch gelatinization and lowest amount of RS or SDS [
6]. By contrast, the low shear food was produced with less mechanical energy and retained more RS and SDS, because starch was cooked to a lesser extent than the other diets [
6]. Meanwhile, the MS diet was intended to be intermediate, though results indicated that it behaved more like the LS food with regard to changes in the microbiota, SCFAs and fecal sugars. The net result of increasing RS would be a bypassing of starch from the SI into the large intestine/colon for fermentation. Thus, this RS might be considered a prebiotic, defined as “selectively fermented ingredients that allow specific changes, both in the composition and/or activity in the GI microflora that confer benefits upon host wellbeing and health” [
25]. In our study, the increased fecal butyric acid when dogs were fed the LS relative to HS implies a potential improvement in the gut health which is typical of that of a prebiotic.
When fed to dogs, the two diets produced with less thermomechanical energy, namely MS and LS, resulted in many physiological and biochemical profiles that did not differ significantly from one another. Ash digestibility on the preliminary assessment was greater when dogs were fed the diet containing more RS (LS food), which corroborates findings from other studies [
26,
27] regarding an increased absorption of some minerals when prebiotics were added to the dog and human foods. Both the LS and MS diets induced increased fecal glucose and oligosaccharides than the HS diet, which was consistent with the work of [
2] for dogs fed a low shear food based on corn and rice. This finding provided indirect confirmation that the treatments produced with lower thermomechanical energy, namely LS and MS, were likely effective in retaining RS since glucose and glucose-based oligosaccharides are starch derivatives. The small intestine (SI) is sensitive to dietary changes and has a higher abundance of carbohydrate fermenting bacteria than the colon [
28,
29]. Thus, considering that feces of dogs fed the LS or MS diets had more oligosaccharides than those fed the HS it would suggest the presence of higher concentrations of these sugars in both the SI and proximal regions of the large intestine.
The gastro-intestinal tract (GI) harbors trillions of metabolically active bacterial species that compose the microbiota, as well as a small percentage of fungi, archaea, protozoa and virus [
29,
30]. The gut microbiota in mammals are known to be commensal, which in Latin means “sharing a dining table” [
31]. This definition was attributed to these bacteria because they live in symbiosis with their host. Specifically, gut commensal bacteria can utilize host endogenous molecules or dietary products that bypass upper digestive tract digestion and generate fermentation by-products or post-biotics that benefit host health [
32]. By contrast, in the event that there is a stressor and the luminal environment is perturbed with overgrowth of pathological microbes, there may be dysbiosis that can negatively affect the body system [
32]. Rather, the increase in starch fermentation byproducts, specifically butyric acid, suggested that both the LS and MS diets likely improved gut health. That the clinical blood work and stool quality stayed within normal ranges supports the conclusion that RS did not have a significant negative impact on dog health.
The most predominant phylum in the gut of healthy dogs are reportedly Bacteroidetes, Firmicutes, Proteobacteria, Fusobacteria, and Actinobacteria [
29,
33,
34], which is consistent with results from this study. Firmicutes were the most abundant phylum, with some bacteria exhibiting saccharolytic activity and others not. The growth of species belonging to the phylum Firmicutes were favored by a mildly acidic pH in the colon, and dogs fed more RS (i.e., LS and MS) tended to have lower fecal pH (due to fermentation). Ref. [
35] reported that there was a high proportion of Firmicutes (51%) attached to resistant starch in the human colonic microbiota. Anaerobic gram-positive Roseburia within the phylum Firmicutes has the ability to utilize starch and produce butyric acid [
20,
36]. However, findings from this study indicate that this microbe was not correlated to butyric acid or SCFA. Genus Blautia was the most prevalent OTU in our dataset and correlated negatively to both total SCFA and butyric acid. Studies in other species have reported Blautia to have a negative correlation to carbohydrates [
37,
38]; whereas, [
39] observed an increase in Blautia in the cecum and colon of pigs fed a retrograded potato starch (RS source) relative to corn starch.
Bifidobacterium from phylum Actinobacteria has been the focus of human studies due to their effectiveness in utilizing starches as energy substrate [
40]. However, the only marginally significant representative of phylum Actinobacteria in our dataset was Slackia, and it had a negative correlation to SCFA. Although our data did not indicate any evidence for saccharolytic activity based on Spearman rho correlations, Slackia has been previously reported to be saccharolytic and to increase with fermentable fiber addition to the diet [
26]. The Bacteroides genus was found to have broad saccharolytic potential which agrees with the other research reports in the literature [
20,
26,
41]. The present study provided evidence that Bacteroides increased in RS-rich diets, that is MS and LS. Most members of phylum Bacteroidetes had a high saccharolytic activity with butyric acid producing capacity. Bartonella could possibly be pathogenic and had a tendency to decrease in dogs fed the LS and MS foods. Ref. [
26] reported that a high meat food supplemented with a fiber blend led to a decline in Bartonella. A second study from the same group reported an increase in Bartonella in dogs fed a low shear diet, that is a food with elevated RS [
2]. The latter study also reported an increase in Yersinia in dogs fed the low shear diet [
2], which is consistent with our results.
Important tools to analyze microbial compositional changes are alpha diversity indices, which are mathematical measures of species diversity in a community that provide information about rarity or commonness of different species [
14]. Alpha diversity is characterized as the variation in the microbiota within each dog. There are no clear definitions between an ecosystem diversity and its health as their validity are limited within each system [
42]. For example, when studying forests one can find environments with low diversity measures, but that are productive, healthy and have integrity, whereas others can be highly diverse but with low stability and productivity [
42]. This analogy can be translated to the dog microbiota. It is difficult to characterize a specific microbiota profile for health or disease, because there is large variation between individuals’ microbiotas [
29,
43,
44]. The functional profile of the microbiota is usually a better assessment of health as compared to the microbiota composition [
29]. One can determine the health of a microbiota by measuring biomarkers known to positively affect the animal, such as SCFAs. In the present study, there was no evidence for differences in alpha diversity though the relative abundance of specific OTU seemed to differ between dietary treatments. Consistent with our work, [
45] also observed that the addition of prebiotics to a dog food failed to induce shifts in alpha diversity in the gut, as assessed in fecal samples. However, some fermentation products including SCFAs increased in response to prebiotics addition to the food and proved these to be beneficial to the colonic health of dogs. In our study, in order to detect differences in alpha diversity it might have been necessary to extend the adaptation time (over 4 weeks), or to produce foods with lower mechanical energy during the extrusion process to enhance RS concentration. Indeed, when dogs were fed a low shear food after 6 weeks of feeding, an increase in species richness was observed compared to dogs fed a high shear food [
2]. In their work, the difference in mechanical energy between the low and high shear foods was 4-fold, while in our study, this difference was only 1.7-fold.
Large polysaccharides that reach the colon are first hydrolyzed by primary polysaccharidases which release smaller oligosaccharides that serve as substrate for fermentation and ultimately production of SCFAs [
46]. A small proportion of SCFAs are also derived from protein fermentation [
47]. Bacterial enzymes that degrade starch comprise glycoside hydrolases [
48]. Starch α-1,4 linkages can be catalyzed by bacterial α-amylase or α-glucosidases, while branching-point α-1,6 linkages are hydrolyzed by a pullulanase [
20]. Bacteria also contain binding domains from different families that are responsible for their adhesion to starch molecules as the first step to the degradation process [
49].
Once the microbiota hydrolyzes fermentable fiber or resistant starches into monosaccharides, these are fermented by bacterial enzymes in the anaerobic environment of the colon. The major bacterial metabolic route for six-carbon sugars such as glucose is the Embden-Meyerhof-Parnas pathway [
50]. Ref. [
51] provided a good review on pathways to produce SCFA to further understand the metabolism involved in their synthesis. In short, glucose is first fermented to pyruvate, which is reduced to lactate and ethanol. The production of SCFA is linked to the attempt of bacteria to decrease reducing agents (such as 2H+ and NADH) in their environment. A major part of pyruvate can be converted to acetyl-CoA with the formation of H
2 and CO
2. Acetic acid can be formed from hydrolysis of acetyl CoA or from CO
2, while propionic acid can be produced from the reduction of lactate. There is another metabolic pathway to produce propionic acid from the pentose-phosphate pathway, which is most relevant in fermentation of fibers rather than RS. Butyric acid synthesis starts by linking two acetyl-CoA molecules, which can derive from pyruvate or acetic acid [
51]. Butyric acid can also be produced by lactate-utilizing bacteria [
52]. The LS and MS foods in the present study favored higher production of fecal butyric acid. Butyric acid has been a preferred end-product for studies of prebiotics [
53].
Butyric acid is mainly used as colonocyte energetic substrate, but also presents anti-inflammatory properties that improve intestinal homeostasis and mucosa immunity [
30,
54]. All SCFAs; butyric, propionic and acetic acids, have been reported to regulate satiety in the long-term via activation of PYY and GLP-1 and increased expression of leptin, exerting an anorexigenic effect [
54]. These satiety effects may be attributed mainly to propionic and acetic acids, since butyric acid is mostly utilized at the intestinal level [
55]. In the present study there was no evidence for a dietary treatment effect on propionic and acetic acids concentrations, nor on satiety in the long term. It is possible that there wasn’t enough RS to promote satiety through SCFA production, and (or) that dogs were fasting for a longer time (>20 h) which overrode changes in satiety hormones. In the present study, the MS and LS diets did not show any evidence for improvement on markers of colonic immunity in fasted dogs relative to the HS treatment. Likewise, [
3] did not find increases in fecal IgA when dogs were fed a high RS (type II) diet from corn. However, [
2] reported greater amounts of epithelial sugar and fecal IgA after feeding a low shear food to dogs which indicated a faster epithelial cell turn over and improved local immunity. These findings may be partially explained by a longer feeding period and a lower mechanical energy to produce the food than in the present study (specific mechanical energy 9 vs. 23.6 Wh/kg, respectively; [
6]).
The main reduced fermentation byproducts include lactate, succinate, H
2, and butyric acid [
40]. Dogs fed the LS or MS diets showed marginal evidence for an increase in lactate, succinate and butyric acid, and decreased fecal pH, which were indicative of starch fermentation by saccharolytic bacteria [
51,
56]. Ref. [
3] also reported an increase in fecal lactate, butyric acid, and a decrease in pH associated with low shear (high RS) food consumption. Luminal pH declines from the ileum to the colon due to higher SCFA production [
51]. The drop in pH in the large intestine is important for shifting the microbiota to prevent overgrowth of pathogenic strains [
51,
57]. The SCFAs are absorbed by colonocytes in exchange for bicarbonate (HCO
3−), which acts as a buffer and increases the pH again as digesta passes to the rectum [
51]. So, it is possible that dog colonic pH would be lower than what was measured in the rectum or feces. A similar phenomenon occurs with SCFAs. The concentration of SCFAs was much higher in the proximal regions of the swine colon compared to distal portions [
58], which would be closer in composition to the feces excreted. Only ~5% of total SCFA produced are present in the feces with most butyric acid absorbed by the epithelial cells [
47,
59]. Although the butyric acid difference in the present study seemed small, the actual production could be much greater. Moreover, when carbohydrate substrates become less available at the distal colon, there is a downward shift in butyric acid producing bacteria and propionic and acetic acids producing strains become more prevalent [
60]. Other studies have also reported that dogs and cats fed an extruded food with RS from corn had increased fecal butyric acid [
2,
3,
4,
61].
Butyric acid has an important role in suppressing colonic carcinogenesis and regulating gut immunological homeostasis [
31]. Ref. [
58] found that RS was completely degraded in the swine cecum and that butyric acid was increased in the proximal portion of their colon. The digestive system of pigs is larger than canines and possesses a greater fermentation capacity. Butyric acid administered orally also prevented mice fed a high fat diet to develop insulin resistance and obesity [
62].
While there were significant changes in carbohydrate metabolism by the gut microbiota of dogs fed the LS and MS foods, analogous outcomes were not observed in serum. Metabolomics detection of analytes are directly tied to the time of blood collection. Since dogs were fasting and blood glucose levels are constantly being controlled by insulin, glucagon and other hormones, we did not expect changes in either carbohydrate or Krebs cycle metabolites in serum, and this was confirmed.
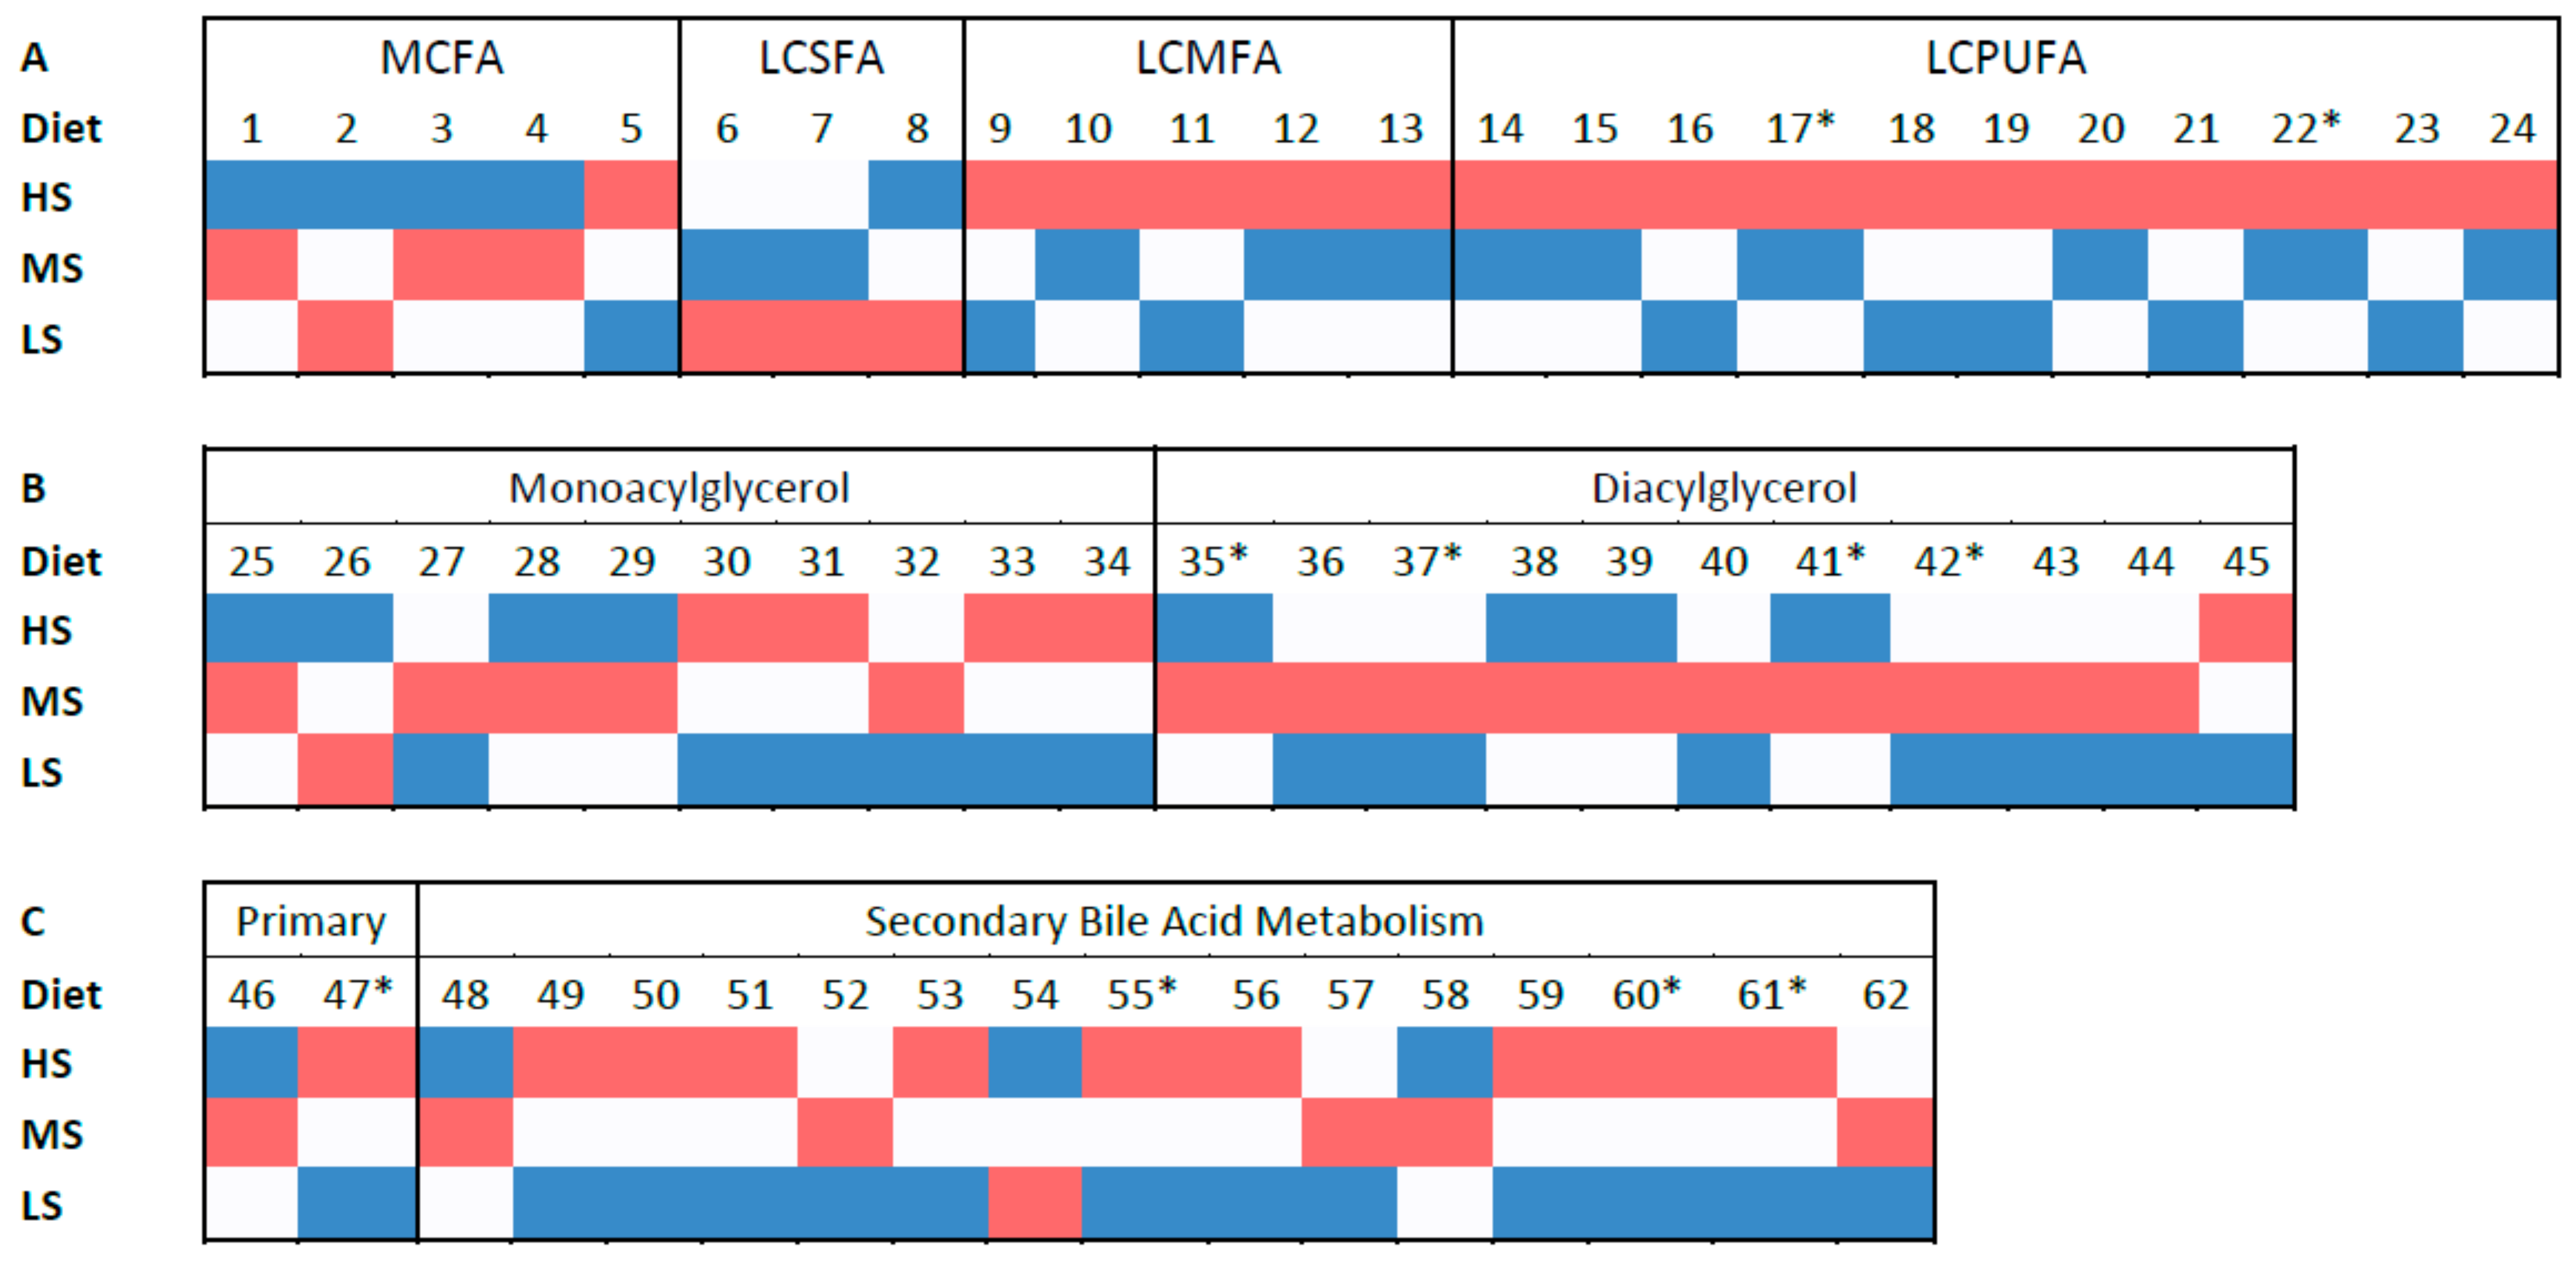
A possible route for energetic metabolism that sustains long term energy supply is through fatty acid oxidation which is activated by SCFAs concurrent with inhibition of lipid synthesis from glucose [
63]. In the present study there were some trends in metabolomics of lipids. The increase in diacylglycerols in feces of dogs fed the MS food could be explained by the higher bypass of these lipids to the colon. Interestingly, serum of these dogs had lower levels of some fatty acids than the other treatments. This suggests that bacterial breakdown of diacylglycerols into fatty acids and consequent absorption into the blood stream were less pronounced in the MS treatment. Ref. [
64] reported that mice fed corn diets supplemented with chemically modified RS had lower body weight gain, as well as lower levels of serum total lipids, triglycerides, and cholesterol. Some studies have reported reduced serum triglyceride associated with RS type II consumption by healthy humans [
65]. In the present study, dogs fed the MS food had lower levels of serum fatty acids, but there was no evidence for differences amongst treatments in serum triglycerides or cholesterol measured by blood chemistry. Conversely, dogs fed the HS diet had a tendency for more fecal long-chain polyunsaturated fatty acids (LCPUFA) than the other treatments, though the LCPUFA serum concentrations were not significantly different from the LS treatment. This would be expected since long-chain fatty acids are not readily absorbed across the colon in a quantitatively meaningful manner, so serum LCPUFAs should not be directly correlated with its amount in feces. Saccharolytic bacteria such as Bifidobacteria, Roseburia and Lactobacillus are responsible for the breakdown of LCPUFAs into conjugated linoleic acid (CLA) [
63] which could partially explain the decreased fecal LCPUFAs observed when dogs were fed the MS and LS diets in our study. The tendency to decrease fecal medium chain fatty acids (MCFAs), as well as some mono- and diacylglycerols when dogs were fed the HS food may suggest that the restriction of fermentable carbohydrate induced microbes to seek alternative carbon sources.
The high shear food favored the increase of both primary and secondary bile salts in dog feces. Bile salts need to be deconjugated by microbial bile salt hydrolase (BSH) in order to not be reabsorbed and bypass to the colon [
66]. The activity of this enzyme is greater in gut microbes residing in the terminal ileaum and colon. There is large variation of BSH between bacterial species and these can be transmitted between microbes through plasmids [
66]. The increase in bile salt excretion contributes to a decrease in serum cholesterol as it needs to be used to replenish the lost liver bile salts. In parallel, the fraction of secondary bile salts that are reabsorbed by the host modulates the systemic lipid and glucose metabolism, contributing to an improved liver and pancreatic functions, as well as improved glucose tolerance [
63]. Taurocholate was greater in feces of dogs fed the high shear (less RS) food of the present study. This agrees with observations in dogs reported by [
2]. Some secondary bile salts also increased in feces of dogs fed the HS food, which may suggest a higher microbial metabolism of bile salts in this treatment. Conversely, [
2] reported that four secondary bile salts increased in dogs that consumed the low shear foods, and six that increased for dogs fed a high shear treatment. The mechanism that led consumption of the high shear food to increase bile salt excretion is not easily explained.


 and
and 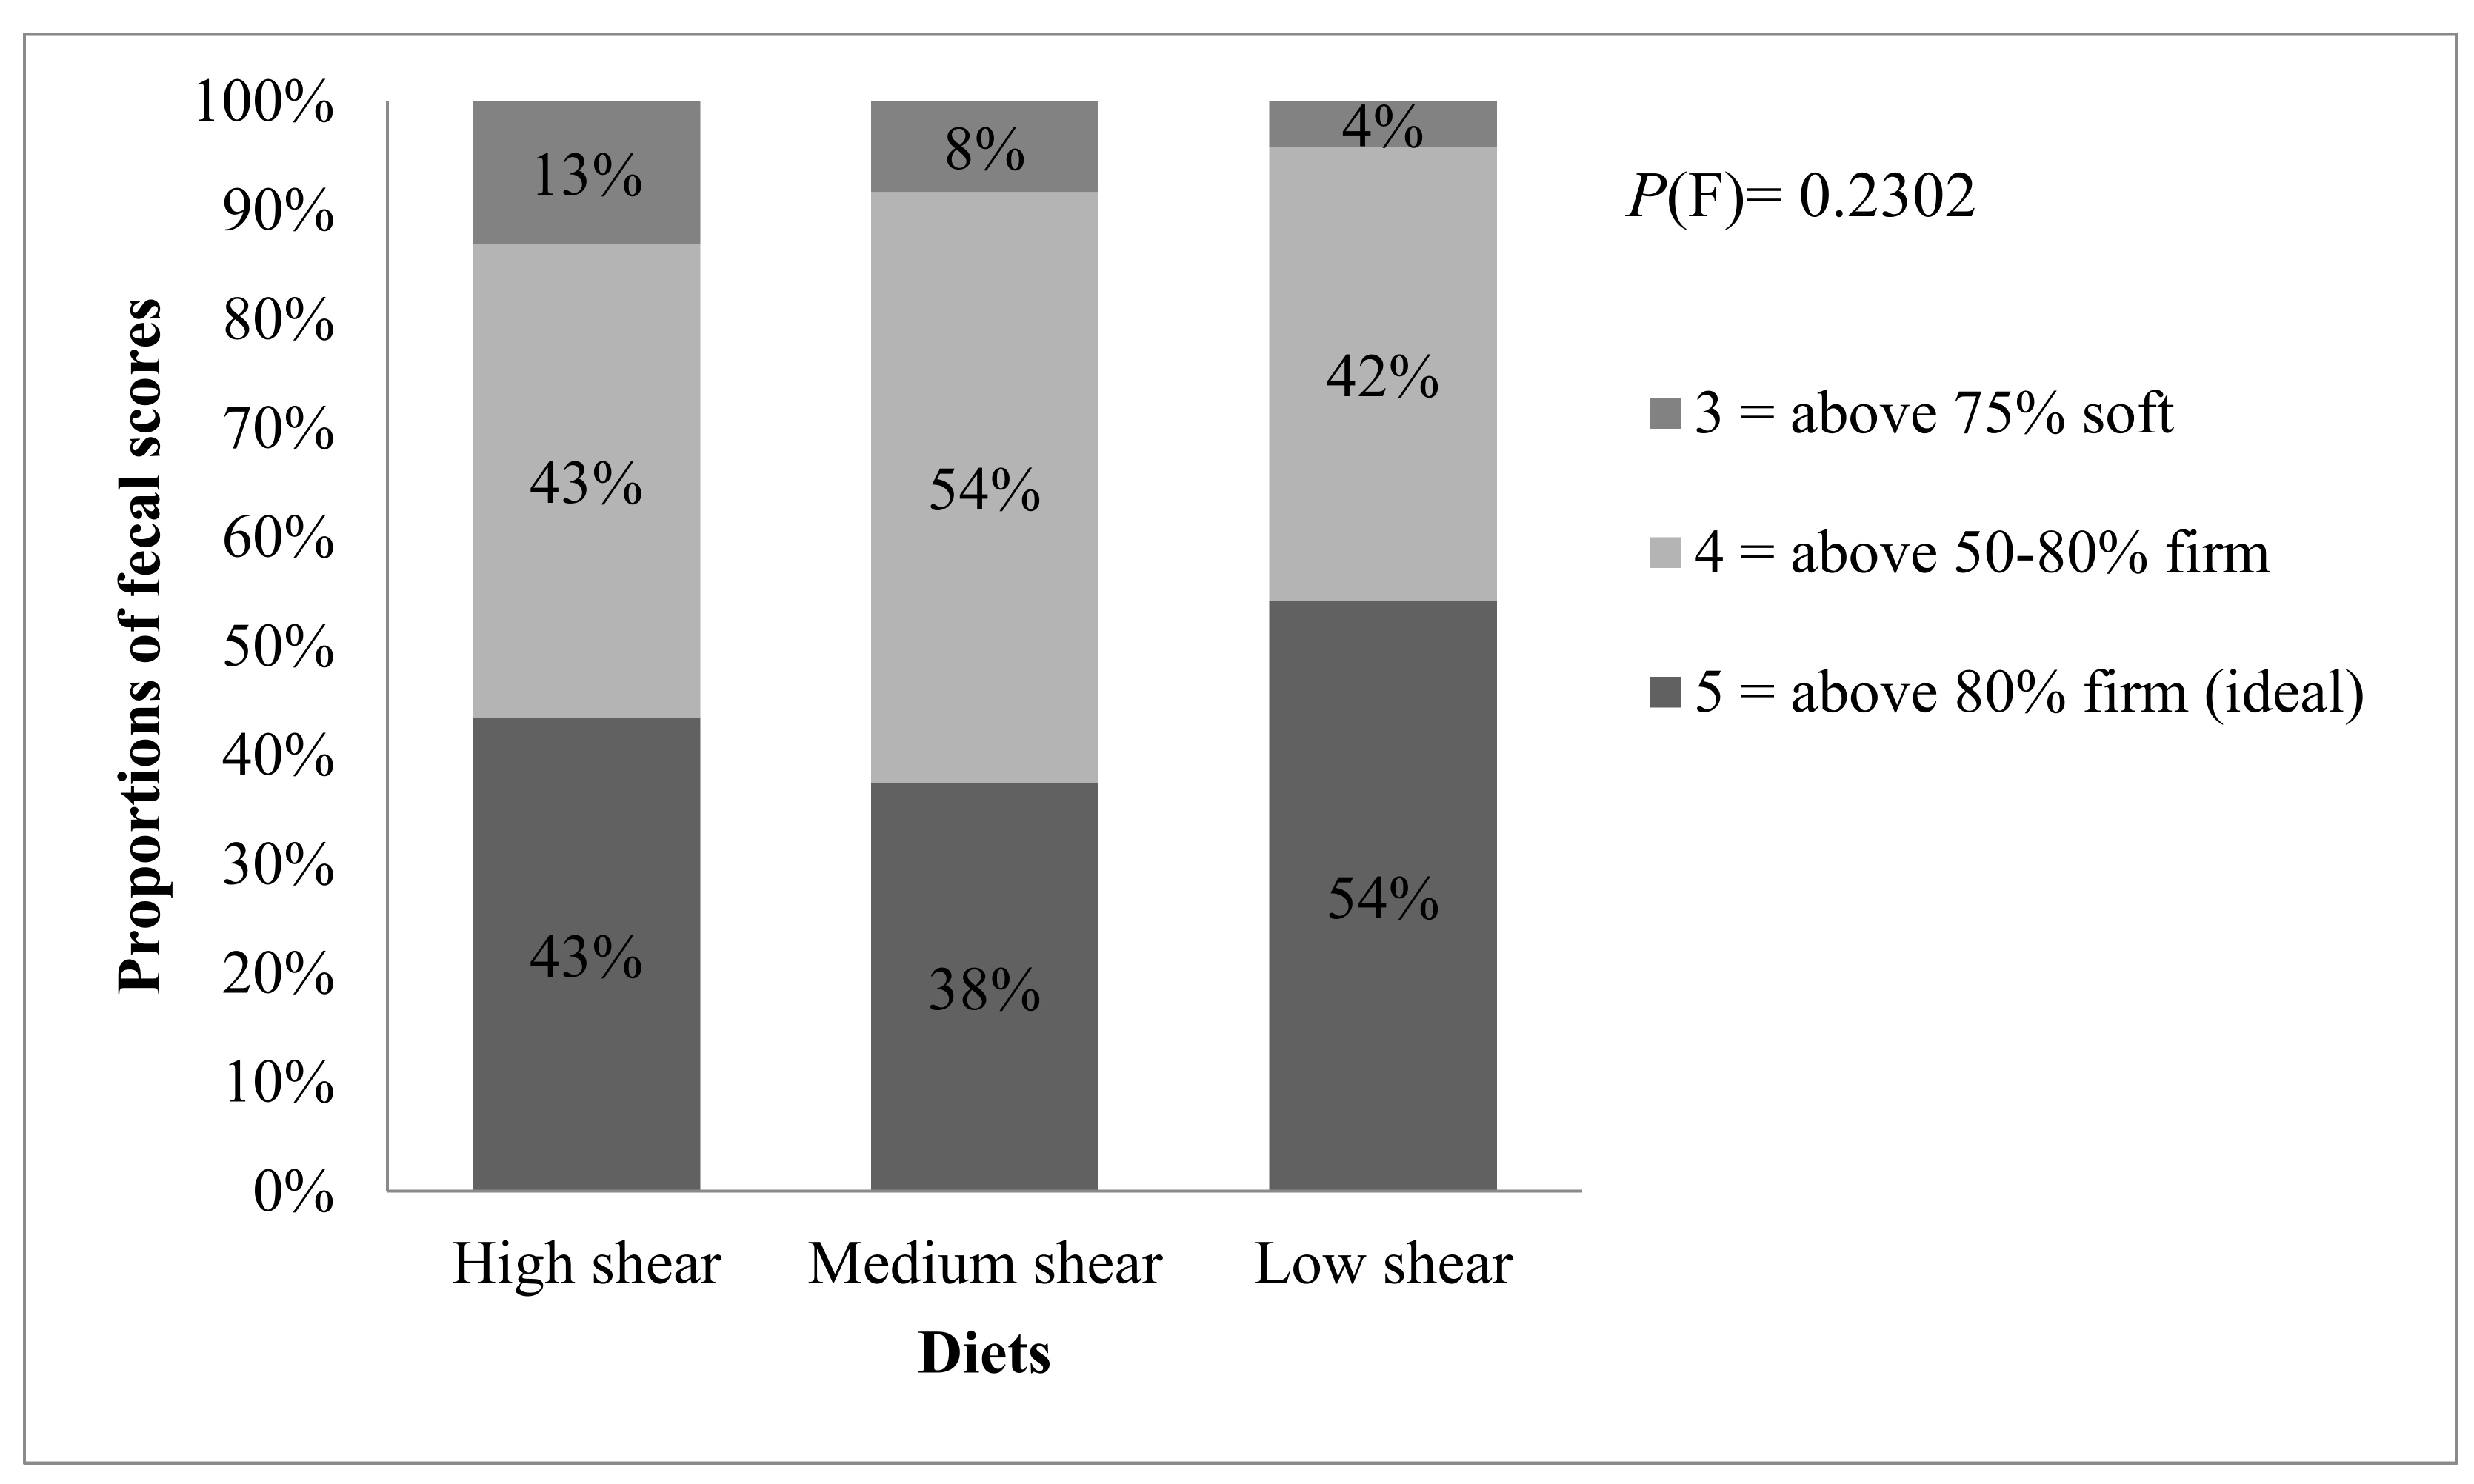


