Article

Novel Genomic Regions Associated with Intramuscular Fatty Acid Composition in Rabbits

by
Houda Laghouaouta
,
Bolívar Samuel Sosa-Madrid
,
Agostina Zubiri-Gaitán
,
Pilar Hernández
and
Agustín Blasco
*
Institute for Animal Science and Technology, Universitat Politècnica de València, 46022 Valencia, Spain
*
Author to whom correspondence should be addressed.
Animals 2020, 10(11), 2090; https://doi.org/10.3390/ani10112090
Submission received: 8 October 2020 / Revised: 8 November 2020 / Accepted: 9 November 2020 / Published: 11 November 2020
(This article belongs to the Section Animal Genetics and Genomics)

Abstract

:

Simple Summary

A divergent selection experiment on intramuscular fat (IMF) content was carried out during nine generations in rabbits. The IMF content was successfully improved through generations. Besides, selection for IMF content generated a correlated response on its composition. Association analyses were performed to understand the genetic background of IMF composition using two rabbit lines divergently selected for IMF content. Several genomic regions and genes were identified, revealing the polygenic nature of the intramuscular fatty acid composition in rabbits.

Abstract

Intramuscular fat (IMF) content and its composition affect the quality of meat. Selection for IMF generated a correlated response on its fatty acid composition. The increase of IMF content is associated with an increase of its saturated (SFA) and monounsaturated (MUFA) fatty acids, and consequently a decrease of polyunsaturated fatty acids (PUFA). We carried out a genome wide association study (GWAS) for IMF composition on two rabbit lines divergently selected for IMF content, using a Bayes B procedure. Association analyses were performed using 475 individuals and 90,235 Single Nucleotide Polymorphisms (SNPs). The main objectives were to identify genomic regions associated with the IMF composition and to generate a list of candidate genes. Genomic regions associated with the intramuscular fatty acid composition were spread across different rabbit chromosomes (OCU). An important region at 34.0–37.9 Mb on OCU1 was associated with C14:0, C16:0, SFA, and C18:2n6, explaining 3.5%, 11.2%, 11.3%, and 3.2% of the genomic variance, respectively. Another relevant genomic region was found to be associated at 46.0–48.9 Mb on OCU18, explaining up to 8% of the genomic variance of MUFA/SFA. The associated regions harbor several genes related to lipid metabolism, such as SCD, PLIN2, and ERLIN1. The main genomic regions associated with the fatty acids were not previously associated with IMF content in rabbits. Nonetheless, MTMR2 is the only gene that was associated with both the IMF content and composition in rabbits. Our study highlighted the polygenic nature of the fatty acids in rabbits and elucidated its genetic background.

1. Introduction

Intramuscular fat (IMF) content and its fatty acid composition are key traits influencing meat quality [1]. The increase of IMF improves the juiciness, tenderness, and flavor of the meat [2]. IMF content and its fatty acid composition determine also the nutritional value of the meat. Individual saturated (SFA) and monounsaturated (MUFA) fatty acids could be biosynthesized. However, linoleic (precursor of n-6 fatty acids) and alpha linoleic (precursor of n-3 fatty acids) are both polyunsaturated fatty acids (PUFA) that cannot be biosynthesized, thus they must be obtained from the diet [3]. High intake of SFA increases low-density lipoprotein (LDL) cholesterol which is associated with cardiovascular diseases. In contrast, PUFA decrease LDL cholesterol [4]. Meat consumers are interested in the fatty acid composition of the meat, demanding healthy products rich in PUFA respect to SFA.
The high heritability of IMF and its substantial variability allowed its improvement through selection in cattle [5], chickens [6,7], and pigs [8]. In rabbits, a divergent selection experiment on IMF was carried out at the Universitat Politècnica de València during nine generations revealing a correlated response on its fatty acid composition [9,10]. The high-IMF line had greater percentages of MUFA than the low-IMF line. In contrast, the low-IMF line had greater percentages of PUFA [9].
Several association analyses were performed in order to unravel the genetic background of the IMF fatty acid composition. Previous Genome-Wide Association Studies (GWAS) reported genetic markers and genes associated with fatty acid composition in pigs [11,12,13] and cattle [14,15,16]. The main candidate genes were Stearoyl-CoA desaturase-1 (SCD), Leptin receptor (LEPR), Fatty Acid Synthase (FASN), and Fatty Acid Elongase (ELOVL). These studies underlined the complexity and the polygenic nature of the fatty acids in pigs [11,12,13] and cattle [14,15,16]. To our knowledge, there are no previous association analyses for the intramuscular fatty acid composition in rabbits. A previous study identified four genomic regions related to IMF content in rabbits, using two rabbit lines divergently selected for IMF [10]. IMF content and its fatty acid composition can share genomic regions with pleiotropic effects, since they have moderate to high genetic correlations [9]. In this study, we carried out a GWAS for intramuscular fatty acid composition, using the same previous rabbit lines divergently selected for IMF, in order to identify genomic regions associated with this trait and to detect putative candidate genes.

2. Materials and Methods

2.1. Animals

The present study was carried out on 478 individuals from the 9th generation of two lines divergently selected for IMF (239 rabbits each line). The base population had 13 sires and 83 does [17]. High (high-IMF) and low (low-IMF) lines had approximately 8 sires and 40 does per generation within each line, from the 1st to the 7th generation [9]. The latest generations (8th and 9th) comprised approximately 10 sires and 60 does per generation for each line [10]. Rabbits were weaned at 4 weeks of age and housed collectively until slaughter. Both lines were contemporarily reared in the same building having the same management and fed ad libitum with a standard commercial diet, containing 15.1% of crude protein, 14.5% of crude fiber and 2.8% of fat. The housing ventilation was controlled, and the photoperiod was constant (16:8 h). Two full sibs of the first parity of each doe were slaughtered at 9 weeks of age by exsanguination prior electrical stunning. Carcasses were chilled for 24 h at 4 °C. From each animal, Longissimus thoracis et lumborum muscle (LM) was excised and freeze-dried. IMF content was measured in LM by near-infrared reflectance spectroscopy (NIRS) and expressed in g/100 g of LM [18]. Twenty percent of the samples were chemically analyzed to test NIRS results. More details of the experiment can be found in previous works [9,17,18].

2.2. Phenotypes

Fatty acids were quantified by gas chromatography. First, we prepared fatty acid methyl esters (FAME) [19]. Further, FAME were analyzed by gas chromatography (FOCUS, Thermo, Milan, Italy), using a split/splitless injection, flame ionization detection, and a fused silica capillary column SPTM 2560 (Supelco, Bellefonte, PA, USA) (100 m × 0.25 mm × 0.2 μm film thickness). We injected FAME using a split ratio of 1/100 and Helium as a carrier gas (20 cm/s). The oven temperature was set at 140 °C during 5 min, then increased (4 °C/min) to 240 °C and maintained at 240 °C during 30 min. Detector and injector were at a temperature of 260 °C. We determined the fatty acids by comparing their retention times with the standards supplied by Supelco (Bellefonte, PA, USA), after that individual fatty acids were quantified using C13:0 as internal standard. The fatty acids contents were expressed as percentage of total fatty acids.
The studied traits were the main individual fatty acids C14:0, C16:0, C18:0, C16:1n7, C18:1n9, C18:2n6, C18:3n3, C20:4n6, the groups SFA, MUFA, PUFA, and the ratios PUFA/SFA, MUFA/SFA, n-6/n-3. Other minor individual fatty acids such as C12:0, C15:0, C17:0, C20:0, C18:1n7, C20:1n11, C22:1n9, C18:3n6, C20:2n6, C20:3n6, C20:3n3, C20:5n3, C22:4n6, C22:5n3, and C22:6n3 were not studied individually, however, they were considered to estimate SFA, MUFA, and PUFA groups. The studied fatty acids accounted for more than 93% of total fatty acids.

2.3. Genotypes and Quality Control

Rabbits were genotyped using the Affymetrix Axiom OrcunSNP Array (Affymetrix Inc., Santa Clara, CA, USA). The Single Nucleotide Polymorphisms (SNP) array contained 199,692 molecular markers. Quality control was performed using Axiom Analysis Suite v.4.0.3 of Thermo Fisher Scientific (Santa Clara, CA, USA). SNPs with a call rate greater than 0.95, a minor allele frequency greater than 0.05, and a known chromosome position were retained for the association analyses. In addition, individuals with a missing genotype frequency greater than 0.05 were excluded from the dataset. The missing genotypes were imputed by Beagle software v.4.1 [20] using 96 ancestors. A score of R2 > 0.75 was used as quality parameter for imputed genotypes. After quality control, 475 animals (low-IMF: 236; high-IMF: 239) and 90,235 SNPs remained in the dataset.

2.4. Genome-Wide Association Study (GWAS)

The association analyses were performed using Bayesian procedures [21]. A Multiple-Marker Regression was performed under the following Bayes B model as in [21,22]:
y = X b + j = 1 k z j α j δ j + e
where y is the phenotypes vector. X is the incidence matrix for fixed effects and b is the vector of the fixed effects of month (five levels), sex (two levels), and parity order (three levels), with bounded flat prior density. zj is the genotypes vector for a SNP at locus j (j = 1, …, k, where k is the number of SNPs after quality control). αj is the random substitution effect for SNP j, distributed as t ν ( 0 , σ α 2 ) , where σ α 2 was derived as in [21,22] from the genetic variance of each trait estimated using data of the fatty acids from all generations of the divergent selection experiment for IMF [9]. δj is a random 0/1 variable (δj = 1 represents the presence of SNP j with probability 1−π and δj = 0 represents the absence of SNP j with probability π). e is the residual term, distributed as N ( 0 , I σ e 2 ) , where σ e 2 has a bounded flat prior density. It was assumed π = 0.9988, according to a previous GWAS for IMF in rabbits and to exploratory analyses for the studied traits [10]. Marginal posterior distributions of the model unknowns were estimated using Monte Carlo Markov chains. A total of 500,000 iterations were performed with a burn-in of 100,000 and a lag of 40. In this study, 1982 non-overlapping genomic windows of 1 Mb were a priori allocated to the 21 autosomes using the SNPs that remained after quality control. The windows have an average of 45 SNPs per 1 Mb window. The contributions of the windows to the genomic variance were computed as the posterior distribution of the genomic variance explained by the SNPs within each 1 Mb genomic window. All GWAS were performed using the GenSel software [22].
Bayes factors (BF) were estimated to evaluate the statistical relevance of the association between SNPs and traits. Bayes factors were calculated as follows [23]:
B F j = p ^ j 1 p ^ j 1 π π
where p ^ j is the posterior probability of SNP j.

2.5. Genomic Regions Associated with the Fatty Acid Composition

The genomic windows exceeding 1.0% of the genomic variance of the trait were considered to be associated with the trait. In addition, the genomic windows exceeding 0.5% of the genomic variance of the trait and having SNPs with a BF greater than 10 were also considered as associated with the trait. These thresholds of 1% and 0.5% represent 20 and 10 times the expected percentage of the genomic variance explained by each genomic window, respectively. SNPs with a BF greater than 10 were considered as associated with the trait [24]. The associated genomic windows were extended to ± 500 Kb from the first and last associated SNP in order to consider nearby associated SNPs, taking into account the linkage disequilibrium (LD). These new genomic windows are termed as “extended regions”.

2.6. Identification of Candidate Genes

Genes were retrieved from the extended regions. Candidate genes were obtained from the Ensembl Genes 98 database using the Oryctolagus cuniculus as the reference genome [25]. The biological functions were retrieved from the Database for Annotation, Visualization, and Integrated Discovery (DAVID) v.6.8 [26]. The genes related to lipid metabolism have been also investigated using the gene ontology (GO) [27].

2.7. Linkage Disequilibrium Analysis

In addition, we examined the LD in the most relevant extended regions to visualize the relationships between the SNPs. LD analyses were performed using plink software [28] and LDheatmap function from R [29].

2.8. Internal Validation

2.8.1. Permutation Test

Results should be validated in order to overcome the problem of multiple testing. The phenotypes were resampled 100,000 times to remove any possible relationship between the phenotypes and genotypes, using the following covariates: sex, month, parity order, and the three first components of the principal component analysis of the genotypes (explaining 36% of the variance) in order to avoid population structures. Permutation testing was performed on the new data corresponding to the null hypothesis. Empirical p-values (EMP1) were provided for each SNP. EMP1 was estimated as K/N, where N is the total number of permutations and K is the number of times the SNP comes out associated in the simulated data. SNPs with EMP1 values close to 10−5 were deemed true positives [30]. Permutation testing was performed using Plink software [28].

2.8.2. Within line GWAS

GWAS within line were performed to compare the SNPs effects. Confidence intervals of the SNPs effects (effect ± 2SD) were calculated in both lines. SNPs with overlapping confidence intervals were considered as true positive associations. In contrast, SNPs with non-overlapping confidence intervals were discarded, since we assumed that these associations were caused by sampling effect and genetic drift.

2.9. Ethics Statement

All experimental procedures were approved by the Universitat Politècnica de València. Research Ethics Committee, according to Council Directives 98/58/EC and 2010/63/EU (reference number 2017/VSC/PEA/00212).

3. Results and Discussion

3.1. Descriptive Statistics of the Intramuscular Fatty Acid Composition

Table 1 shows descriptive statistics of the studied traits. The fatty acids profile of rabbit meat comprises higher percentages of SFA and PUFA (36.4% and 39.2%, respectively), while MUFA presented a lower percentage (24.4%). The most ubiquitous fatty acids were linoleic (C18:2n6), palmitic (C16:0), and oleic (C18:1n9) acids, representing 27.7%, 25.7% and 20.3% of total fatty acids, respectively. Ratios PUFA/SFA, MUFA/SFA, and n-6/n-3 were 1.08, 0.67, and 17.7, respectively. These results are in agreement with previous results in rabbits [9].

3.2. Genomic Data

The association analyses were performed using the 475 individuals and 90,235 SNPs remaining in the dataset after quality control. Allele frequencies differ among lines due to the random genetic drift and selection. As the animals came from a divergent selection experiment for IMF, genes with large causal variants will show extreme frequencies for alternate alleles between lines due to selection. We expect that high-IMF line will show genes with high frequencies given a reference allele, while the same genes will have lower frequencies in low-IMF line. Therefore, these genes will show intermediate frequencies when both lines are used. We did not consider the line as a fixed effect to take advantage from these extreme differences caused by selection and detect the genes with large causal variants. We also performed GWAS with the fixed effect of line in the model. The same associated genomic regions were obtained with lower percentages of the genomic variances of the traits. Divergent selection experiments can improve the detection power, according to simulation studies, especially for large causal variants and their nearby SNPs [31,32]. This statement is also certain for correlated traits. Thus, GWAS would detect in our experiment important genomic regions associated with the correlated traits, despite the small population size.

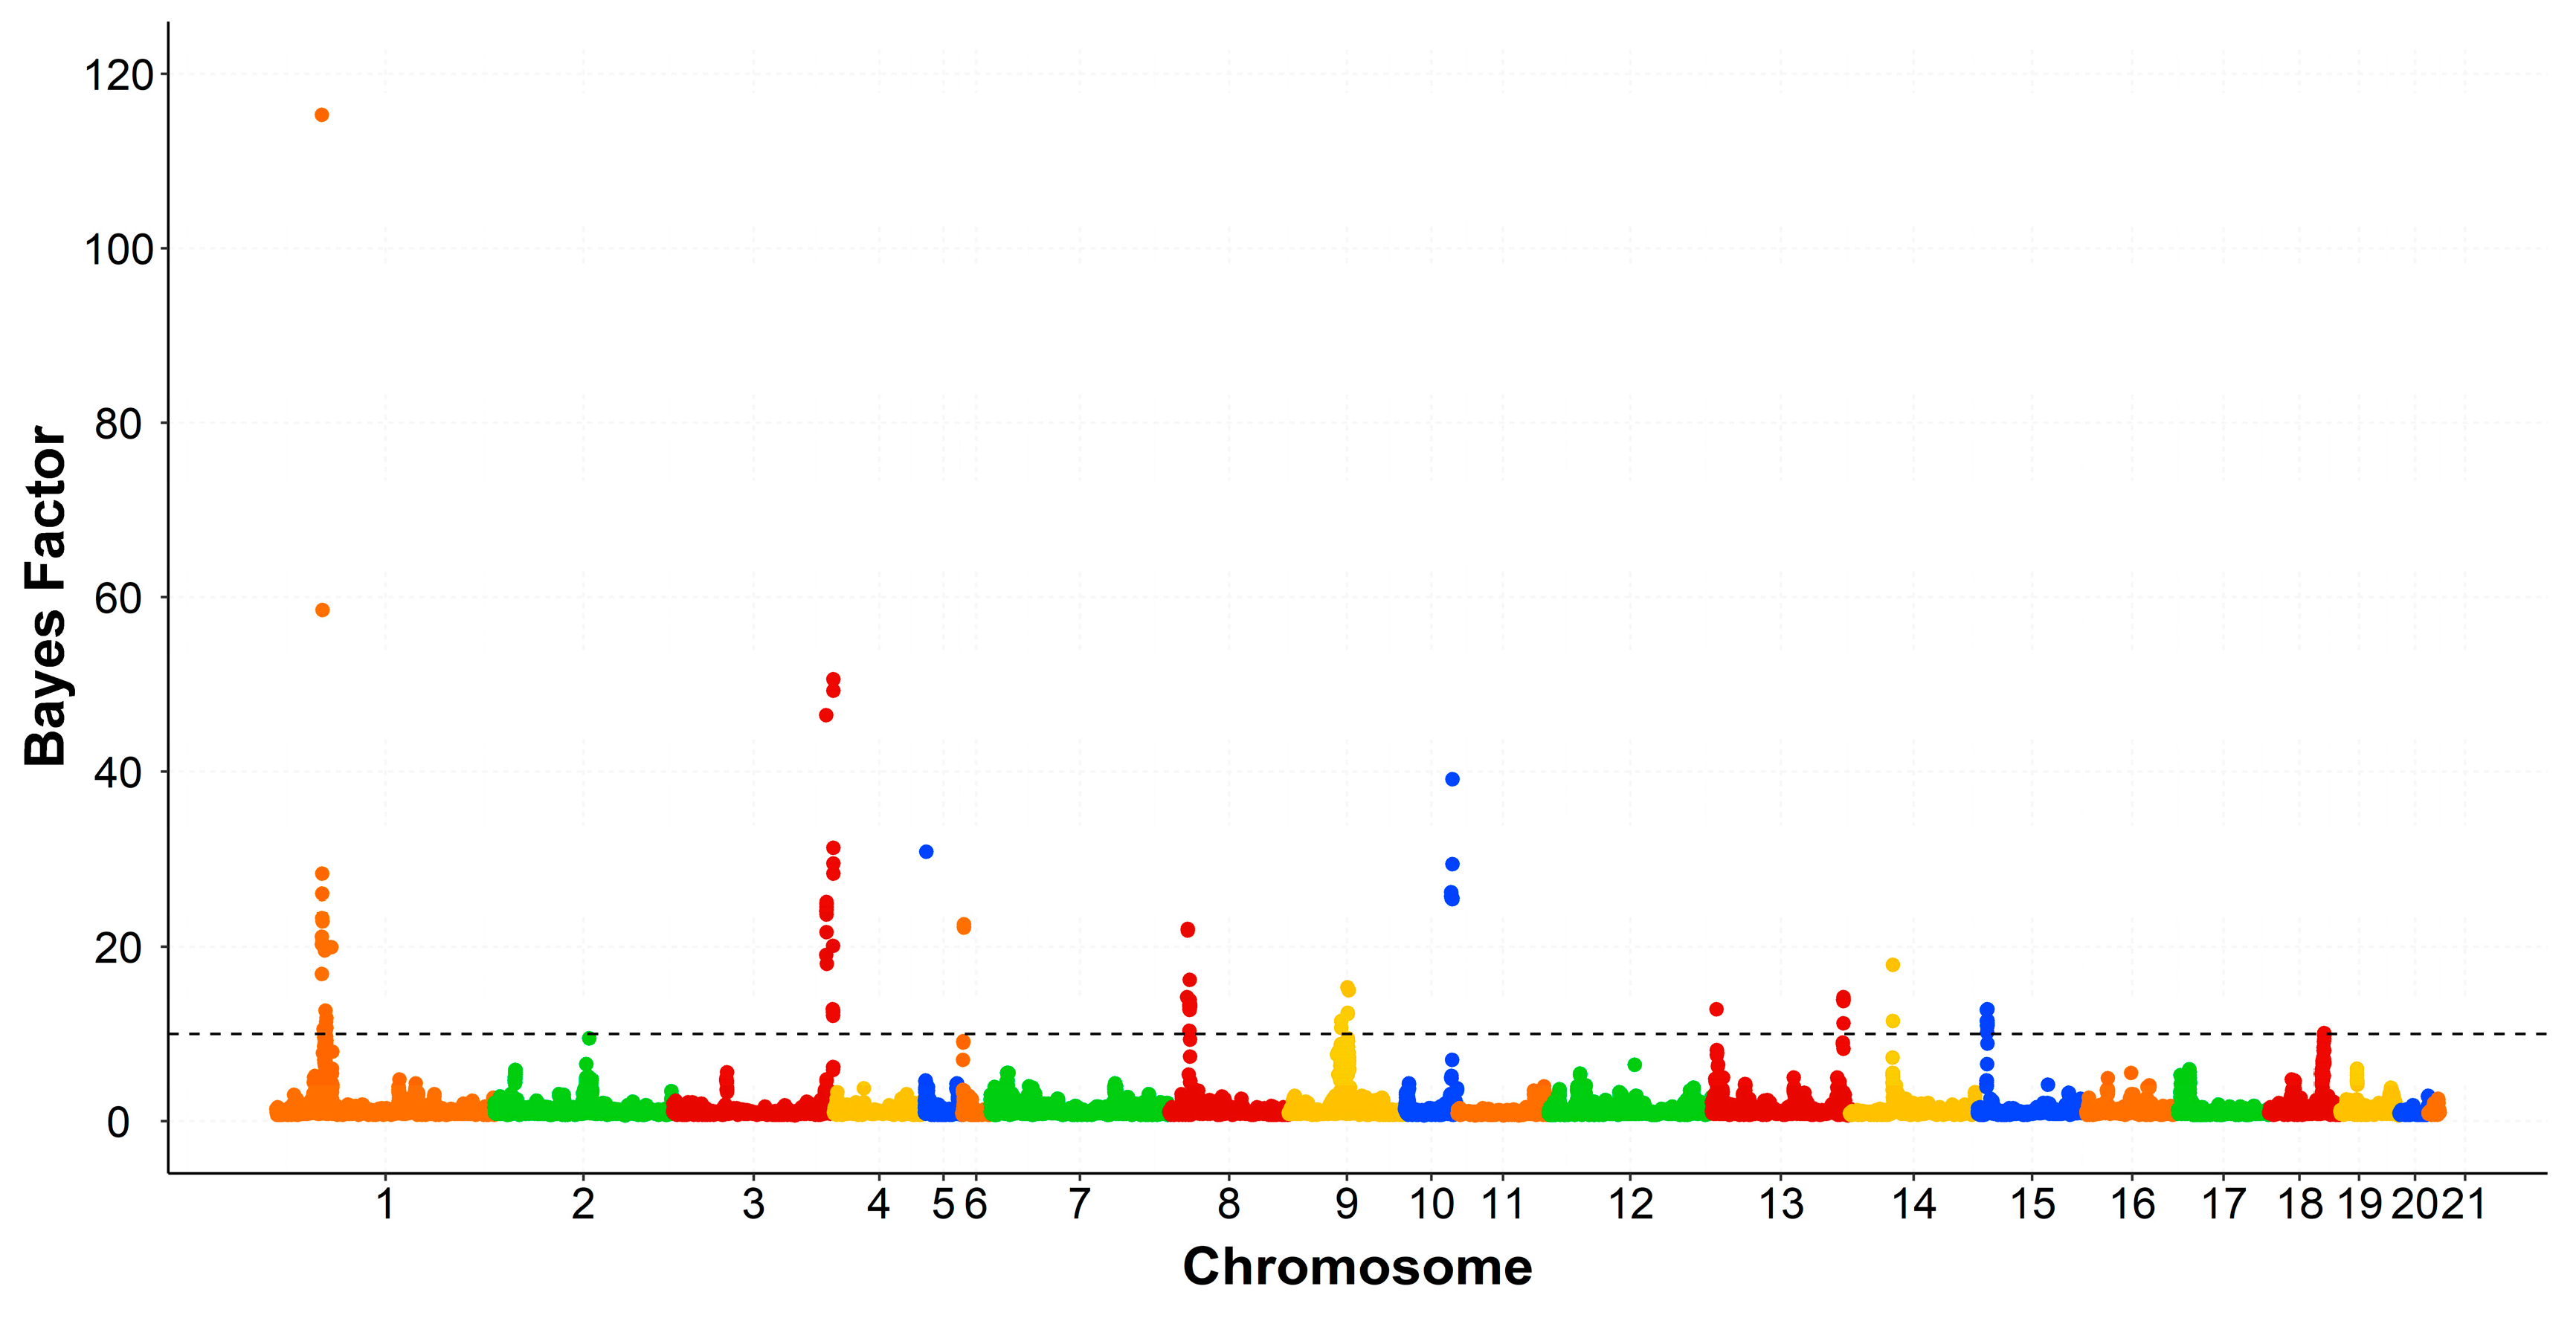
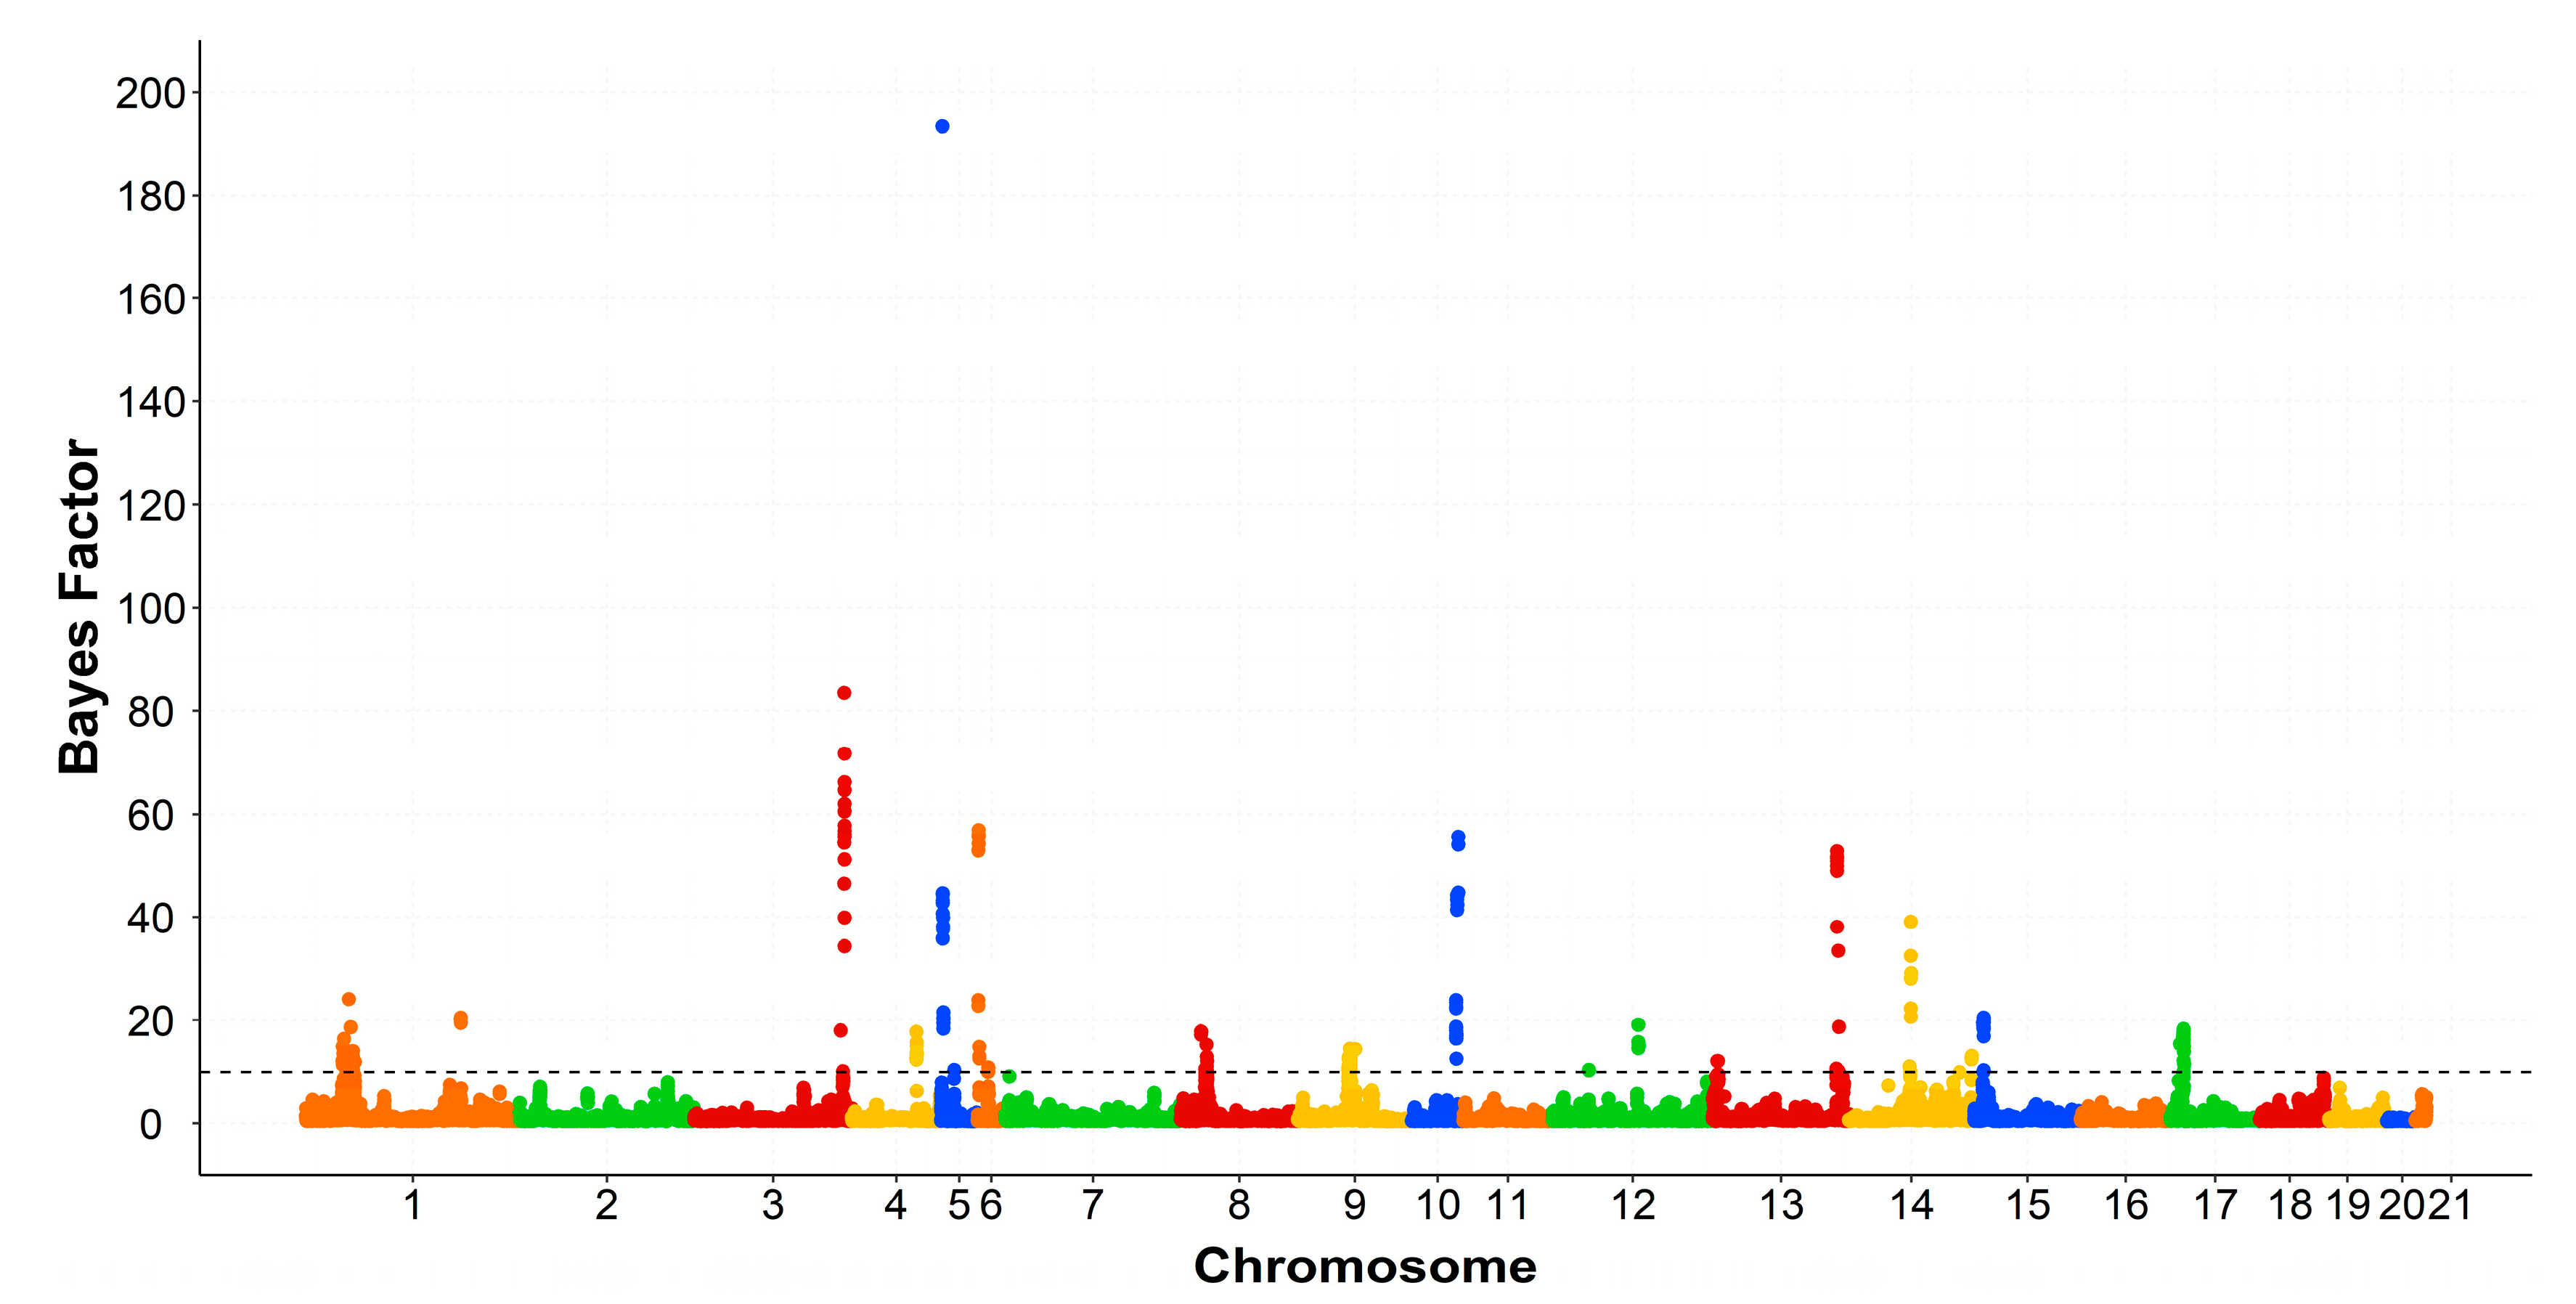
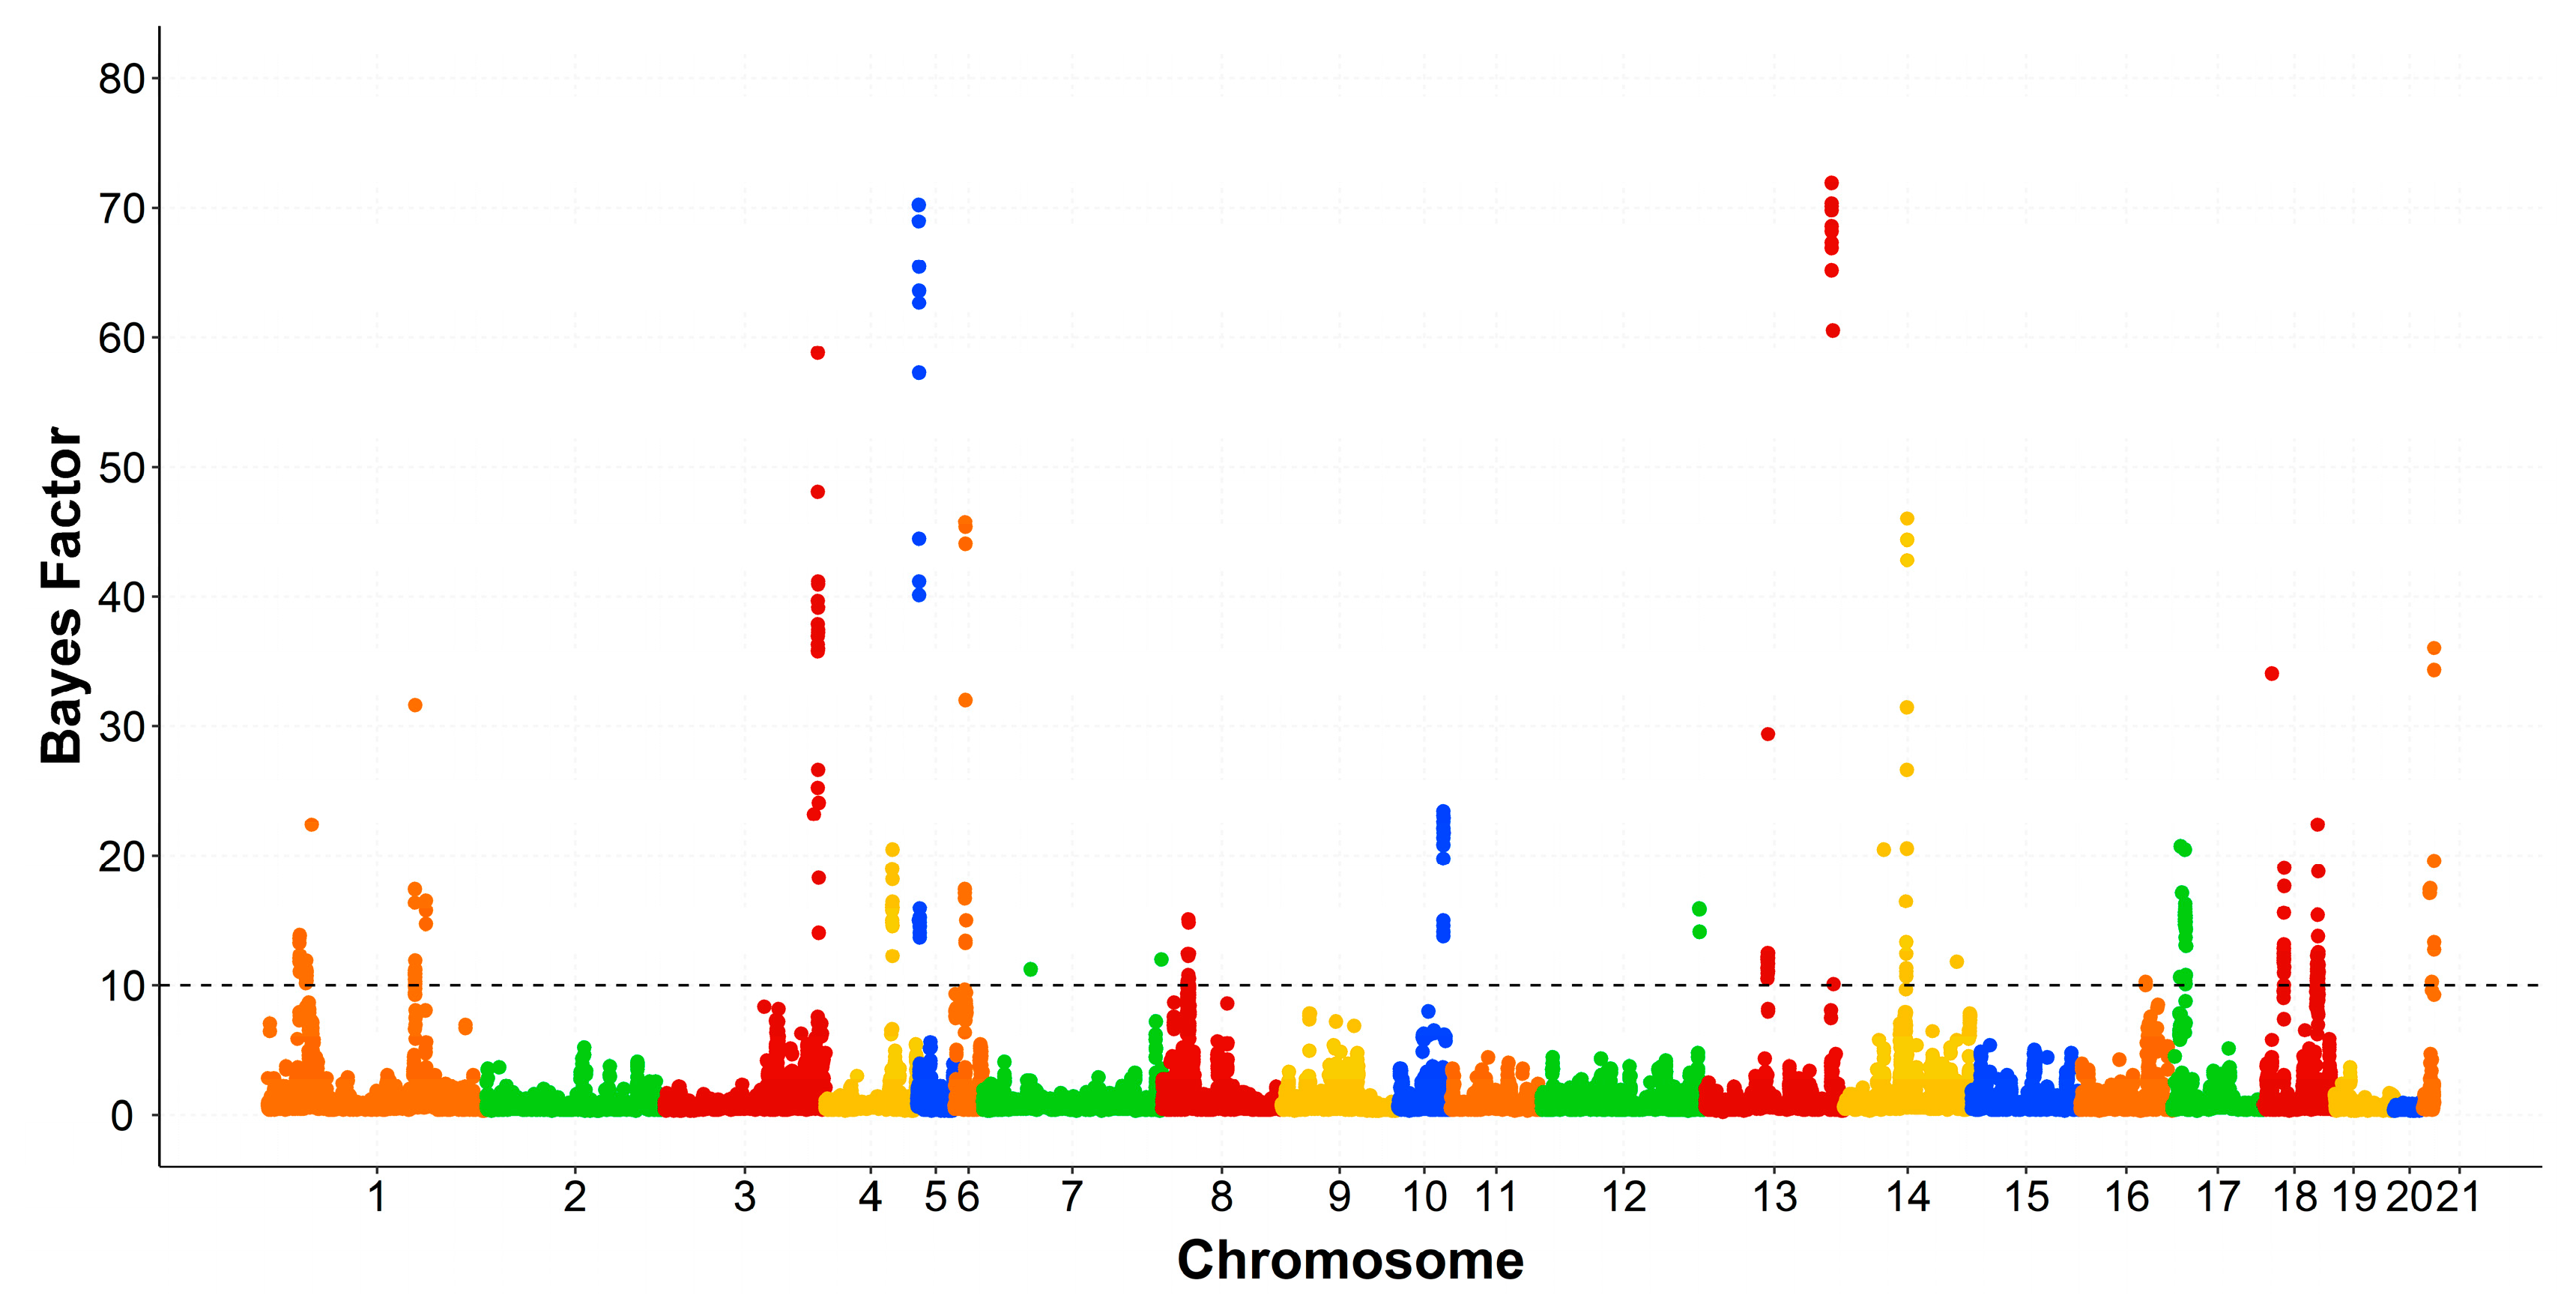
3.3. Genomic Regions Associated with the Intramuscular Fatty Acid Composition

The genomic windows that exceeded the thresholds levels were spread across several chromosomes. All rabbit chromosomes (OCU), except OCU7, OCU11, and OCU20. The associated regions with SFA, MUFA, PUFA, and the ratios were displayed in Table 2, Table 3, Table 4 and Table 5, respectively. The associated SNPs were tested using GWAS within line and permutation testing. The validated SNPs with a BF greater than 50 were presented in Table S1. Manhattan plots of SFA, PUFA, and MUFA groups were displayed in Figure 1, Figure 2 and Figure 3, respectively.
On OCU1, a large genomic region at 34.0–37.9 Mb was associated with C14:0, C16:0, C18:0, and SFA, explaining 3.54%, 11.2%, 0.87%, and 11.3% of the genomic variances, respectively (Table 2). The same region was associated with C18:2n6, C20:4n6, PUFA, PUFA/SFA, and n-6/n-3, explaining 3.18%, 1.57%, 2.41%, 2.98%, and 1.45% of the genomic variances, respectively. This genomic region harbors two genes related to lipids metabolism, alkaline ceramidase 2 (ACER2) and perilipin 2 (PLIN2). ACER2 promotes the hydrolysis of ceramides, the generation of sphingosine, and consequently the biosynthesis of sphingolipids [33,34]. Besides, the protein encoded by PLIN2 covers the intracellular lipid droplets and plays a major role in their stabilization [35]. In pigs, PLIN2 was considered as a useful marker for lean growth and its expression was positively associated with IMF content [36,37]. In rabbits, a selection signature for IMF was located in this genomic region, and presented high values for cross population—composite likelihood ratio (XP-CLR) and cross population—extended haplotype homozygosity (XP-EHH) [38]. Hence, this region harbors genes of pleiotropic effect given its association with the IMF content and its composition. Moreover, this region disclosed two validated SNPs with high BF. The first SNP at position 34.70 Mb was highly associated with C16:0 (BF = 177) and SFA (BF = 115), while the second SNP at 35.18 Mb was associated with SFA (BF = 59) (Table S1, Figure 1).
On the same chromosome (OCU1), the genomic window at 121.0–121.9 Mb was associated with C14:0, C18:0, C18:1n9, and MUFA. This region harbors the MTMR2 gene involved in lipid metabolic processes according to DAVID database. MTMR2 was also associated with the IMF content in rabbits, the genomic region at 120.6–121.9 Mb on OCU1 accounted for 2.03% of the genomic variance of IMF content [10]. Besides, MTMR2 gene was located at a signature of selection for IMF in pigs [39].
The genomic region at 25.0–26.9 Mb on OCU3 accounted for 6.05% of the genomic variance of linoleic acid (C18:2n6). Two candidate genes were retrieved, FGF1 and NR3C1. FGF1 was also considered as a candidate gene for IMF in chickens [40], while an expression Genome-Wide Association Study (eGWAS) reported the implication of NR3C1 gene in lipid metabolism in pigs [41]. On the same chromosome, the genomic region at 149–149.9 Mb was associated with almost all the studied traits except C16:1n7, C18:3n3, MUFA/SFA, and n-6/n-3. This region includes ENSOCUG00000000157 novel gene related to lipid biosynthesis. The novel gene is also known as ST3GAL1 in humans, pigs, and mice. The validated SNPs at this region showed high values of the BF (up to 141 for the ratio PUFA/SFA, 114 for C18:0 and 101 for C14:0) (Table S1). Moreover, these associations were corroborated by high values of the posterior probability of association (PPA). The PPA of C14:0, C16:0, and C18:0 were 0.96, 0.98, and 0.99, respectively (Table 2).
The associated genomic region at 7.2–7.9 Mb on OCU5 did not map to genes related to lipid metabolism, however, it encompasses the highest BF. The validated SNP at position 7.43 Mb on OCU5 was associated with C16:0 (BF = 459), C16:1n7 (BF = 77), PUFA (BF = 193), and the ratio PUFA/SFA (BF = 390) (Table S1, Figure 2).
Three different regions on OCU6 were associated with the fatty acid composition. The first region at the start of the chromosome was associated with C16:0, PUFA, and PUFA/SFA. However, it did not map to putative candidate genes related to lipid metabolism. The second genomic window at 5–5.9 Mb was associated with C18:2n6, and included two genes related to lipid metabolism (LITAF and SNX29). LITAF regulates the response to lipopolysaccharide according to gene oncology (GO: 0032496), whereas SNX29 affects phosphatidylinositol (family of lipids) binding (GO: 0035091). SNX29 was also a candidate gene for IMF in pigs [42]. The third region at 8–9.9 Mb was associated with C16:1n7, C18:1n9, and MUFA. This region harbors two genes related to lipid metabolism (SMG1 and GDE1) according to DAVID database.
On OCU8, the genomic region at 21.0–21.9 Mb was associated with C18:0, C16:1n7, C18:1n9, MUFA, and PUFA. This region harbors PIK3C2G, PLEKHA5, and PLCZ1 genes related to lipid metabolism. PIK3C2G affects phosphatidylinositol binding (GO: 0035091), while PLEKHA5 controls lipid binding (GO: 0032266, GO: 0070273, and GO: 0010314). On the other hand, PLCZ1 regulates lipid metabolic and catabolic processes (GO: 0006629 and GO: 0016042, respectively). On the same chromosome, the genomic region at 53–53.8 Mb was associated with MUFA/SFA. This region harbors DGKH gene involved in triglycerides degradation [43]. The genomic region at 55.3–55.9 Mb explained 4.77% of the genomic variance of C18:2n6, however, it did not contain putative candidate genes.
The genomic region at 12.0–12.5 Mb on OCU9 accounted for 1.05% of the genomic variance of C16:1n7. This region harbors PPARG gene involved in adipocyte differentiation [44]. PPARG was also associated with fat deposition in sheep [45]. In pigs, two polymorphisms in the transcriptional regulatory region of this gene were related to IMF content [46]. Moreover, a correlation (0.64) was detected between mRNA PPARG and IMF content in Korean cattle [47]. On the same chromosome, the region at 64–65.9 Mb was found to be associated with PUFA and PUFA/SFA. This region harbors NPC1 and OSBPL1 genes. NPC1 is associated with lipid transport [48], while OSBPL1 is involved in both lipid transport (GO: 0006869) and binding (GO: 0008289).
On OCU10, the genomic region at 5–5.6 Mb was associated with the ratio MUFA/SFA. This region harbors the ITGB8 gene related to lipid metabolic process. This gene was also located at a signature of selection for IMF content in pigs [39].
Two genomic regions on OCU13 were found to be associated with the fatty acids. The first region at 33–34.9 Mb accounted for 3.42% of the genomic variance of linoleic acid (C18:2n6). This region includes five genes related to lipid metabolism according to DAVID database (CRP, DCAF8, FCER1A, PIGM, and ATP1A2). The second region at 126.0–126.9 Mb was associated with C18:0, C18:1n9, and MUFA, harboring HEYL, MFSD2A, and PPT1 genes. MFSD2A regulates the docosahexaenoic acid (C22:6n3) transport [49]. Validated associated SNPs at this region showed high values of the BF (96 for C18:0, 84 for C18:1n9, and 72 for MUFA; Table S1; Figure 3).
Stearic (C18:0) and oleic (C18:1n9) acids were associated with the genomic window at 82–82.9 Mb on OCU14. This region harbors the ADIPOQ gene that encodes for the adiponectin involved in fatty acids metabolism [50]. ADIPOQ was also associated with IMF in cattle [51]. Moreover, a previous study reported a high correlation between its expression and IMF in cattle [52]. On the same chromosome, the genomic region at 78.2–78.9 Mb was associated with the ratio MUFA/SFA, presenting ATP11B gene involved in phospholipid transport (GO: 0015914).
The genomic region at 10–10.9 Mb on OCU15 was associated with C16:0, SFA, C18:2n6, PUFA, and the ratio PUFA/SFA. Two genes related to lipid metabolism mapped to this region (LRAT and TLR2). On the same chromosome, the genomic region at 70–71.9 Mb accounted for 3.59% of the genomic variance of linoleic acid (C18:2n6), harboring ANXA3 and GK2 genes related to lipid metabolism.
Two regions on OCU16 were associated with the fatty acids. The first region at 62.0–62.9 Mb was associated with C18:2n6 and MUFA/SFA, harboring HSD11B1 gene related to lipid metabolic process. The second region at 71–72.9 Mb was associated with C18:3n3 and n-6/n-3, explaining 1.67% and 1.04% of the genomic variances, respectively. This region harbors ENSOCUG00000006240 novel gene known as NR5A2 in humans. NR5A2 regulates cholesterol homeostasis (GO: 0042632).
On OCU17, the region at 9–10.9 Mb explained 3.87% of the genomic variance of C18:2n6, however, it did not contain candidate genes. Besides, the region at 12–13.9 Mb was associated with C16:1n7, MUFA, C18:2n6, and PUFA. This genomic region harbors three genes related to lipid metabolism (ALDH1A2, LIPC, and MYOE1). LIPC regulates lipid metabolic process (GO: 0006629), whereas MYO1E controls lipid binding (GO: 0035091).
The genomic region at 11–11.9 Mb on OCU18 was associated with the ratio MUFA/SFA, harboring SAMD8 gene related to ceramides biosynthetic process (GO: 0046513). Besides, a large genomic region at 46–48.9 Mb on OCU18 was associated with the majority of the traits, explaining 7.9% of the genomic variance of the ratio MUFA/SFA. This region harbors the following genes: GOT1, ERLIN1, ENSOCUG00000001375, and ENSOCUG00000014801. ERLIN1 promotes lipid binding; it encodes for proteins that bind to cholesterol and interacts with the sterol regulatory element binding protein (SREBP). This latter stimulates the cholesterol and fatty acid synthesis in liver [53,54]. Moreover, a previous GWAS reported that ERLIN1 was associated with lipid metabolism in cattle [55]. The novel genes ENSOCUG00000001375 and ENSOCUG00000014801 are known in pigs and humans as Stearoyl-CoA Desaturase (SCD). SCD gene is responsible for the biosynthesis of MUFA from SFA. A strong association between SCD and the fatty acid composition was reported in pigs [11,56], cattle [16], and goats [57]. In addition, an eGWAS study showed a high correlation (0.78) between SCD and PPARG expressions [58]. The latter gene was located on the associated genomic region at OCU9.
The genomic region at 21.0–21.9 Mb on OCU19 was associated with linoleic acid (C18:2n6) and disclosed the ADAP2 gene related to phosphatidylinositol bisphosphate binding (GO: 1902936).
Many other genes were identified in the associated genomic regions; however, their functional annotations did not show a direct relationship with lipids metabolism. The current study identified several genomic regions associated with the fatty acid composition of IMF in rabbits, showing its polygenic nature, since the associated genomic regions did not explain large percentages of the genomic variances. We did not detect genomic regions with mayor effects like those found in pigs [11].

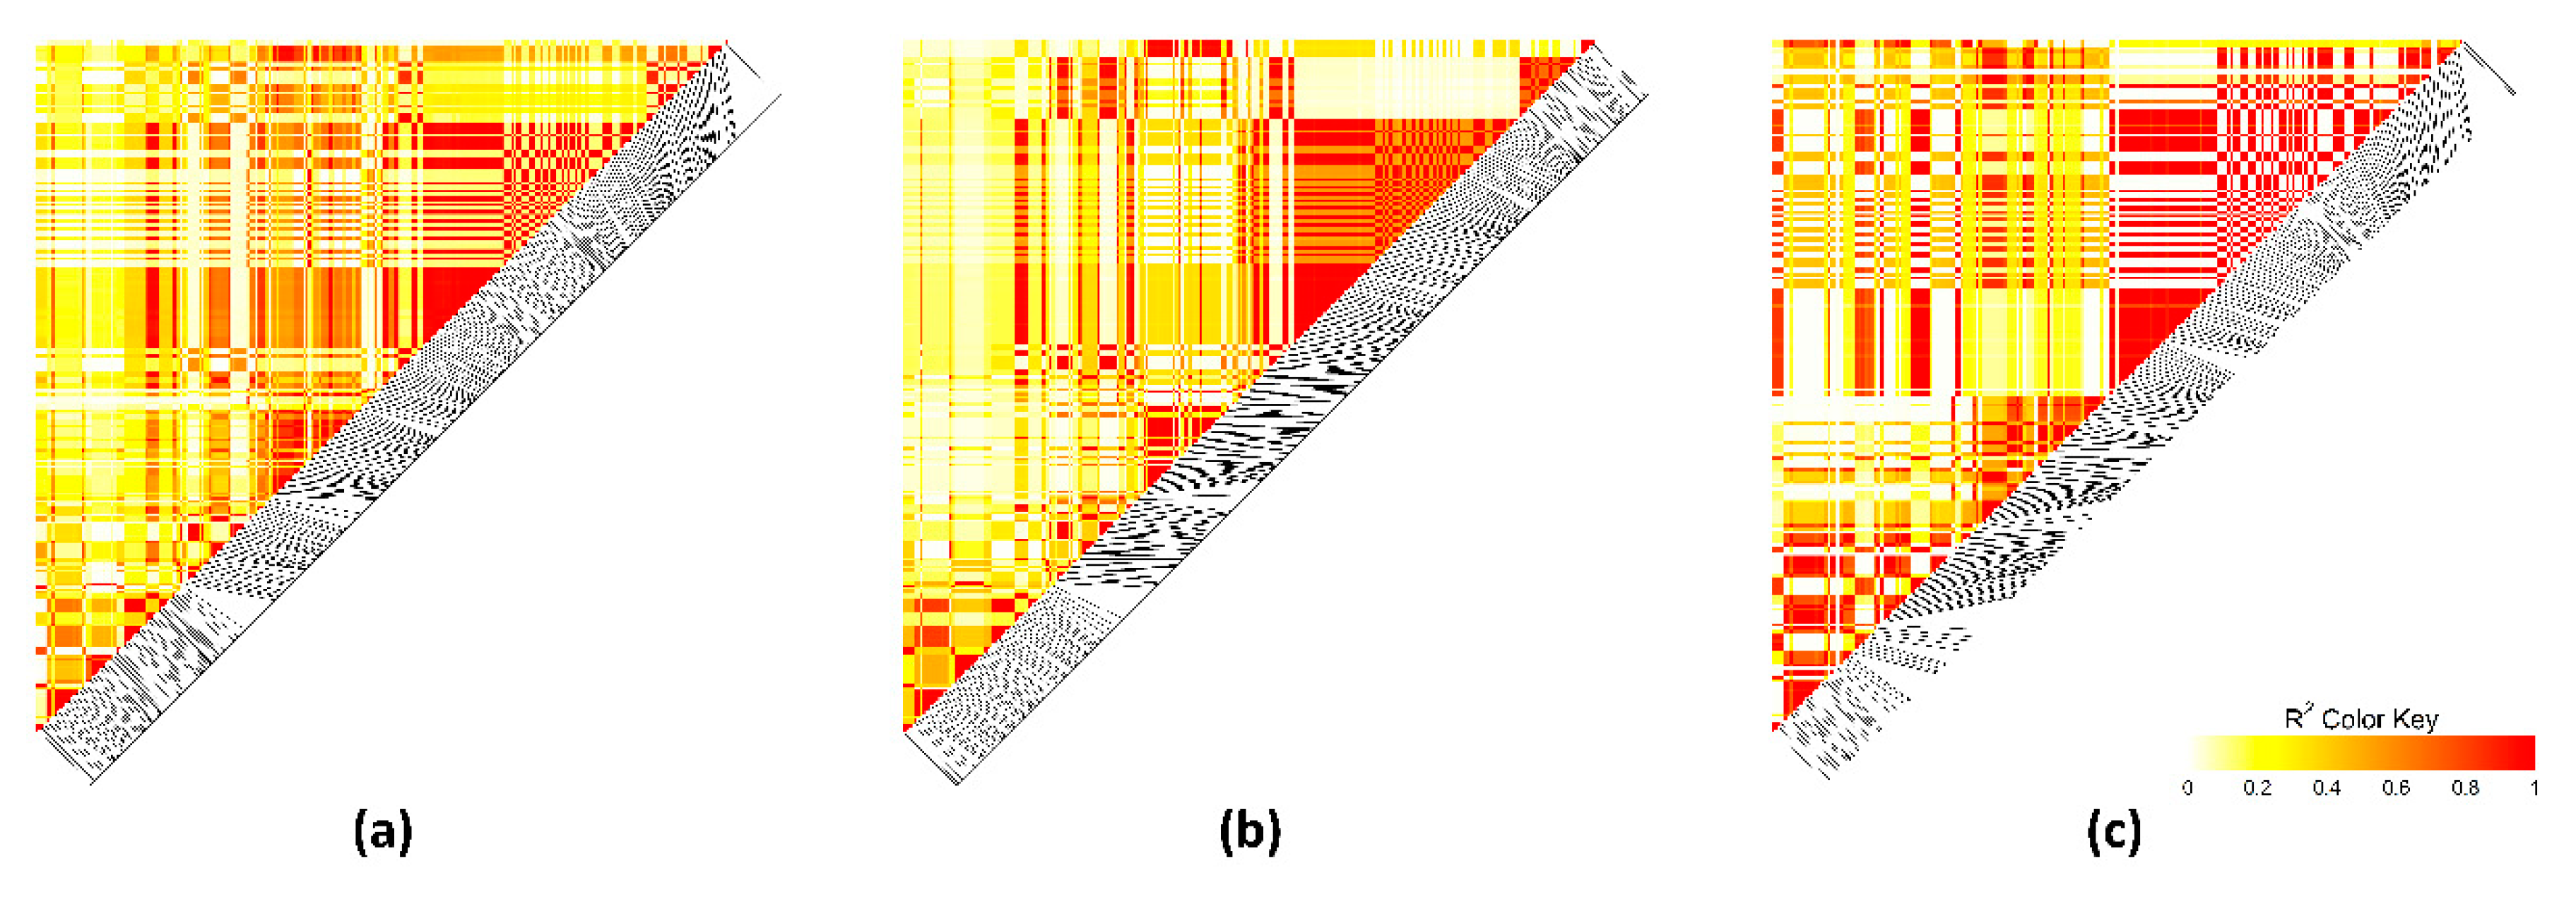
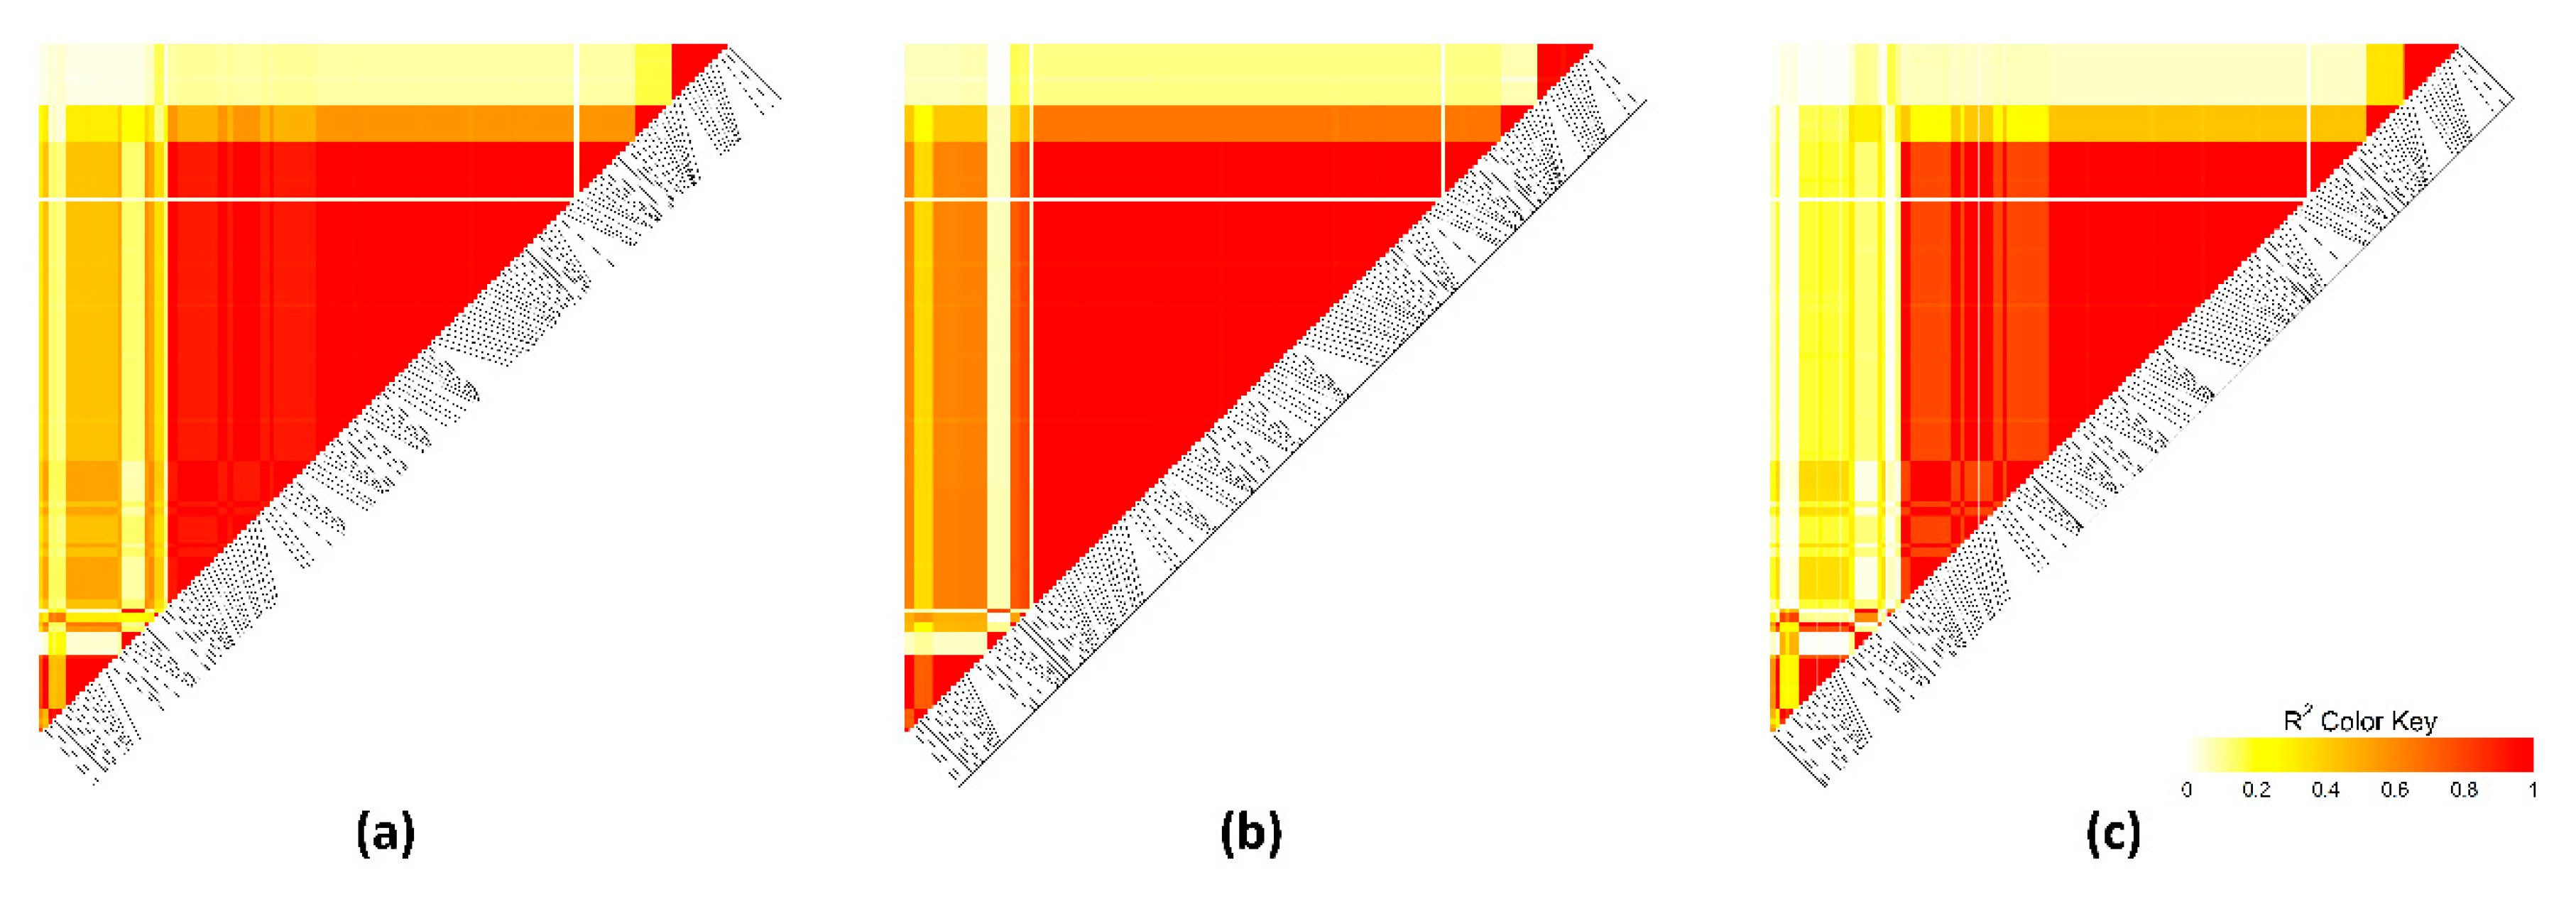
3.4. Linkage Disequilibrium Analysis

Linkage disequilibrium (LD) was assessed throughout the most relevant extended regions (at 34–37.9 Mb on OCU1, at 148.5–150.2 Mb on OCU3, and at 46.0–49.2 Mb on OCU18). Different LD patterns were detected (Figure 4, Figure 5 and Figure 6). The extended region at OCU1 displayed several short blocks for both high-IMF and low-IMF lines, indicating the presence of several causal variants (QTL). Correlations between SNPs were greater in high-IMF line than in low-IMF line (Figure 4). Besides, the genomic region at 148.5–150.2 Mb on OCU3 displayed different LD patterns between lines. Correlations between SNPs were greater in low-IMF line than in high-IMF line (Figure 5). The QTL at 46.0–49.2 Mb on OCU18 formed a strong block (r2 = 1) for both lines, while correlations between SNPs were greater for high-IMF line (Figure 6). Thus, the putative QTLs were exposed to different selection pressures for IMF content.

3.5. Polygenic Nature of the Intramuscular Fatty Acid Composition

Taken together, the present study underlined different genomic regions associated with the fatty acid composition of IMF in rabbits. The results were corroborated having high values of Bayes factors (Figure 1, Figure 2 and Figure 3). The present study highlighted also the polygenic nature of the fatty acid composition and its complexity in rabbits. Similar findings were reported by previous studies for the fatty acid composition in pigs [11,12,13] and cattle [14,16]. To our knowledge, this is the first GWAS for fatty acid composition in rabbits. A pervious study was performed on the IMF content [10]. Comparing the results, MTMR2 is the only gene that was associated with both IMF content and its composition. In addition, ACER2 and PLIN2 genes were associated with the fatty acid composition and were also detected at a selection signature for IMF content [38].

4. Conclusions

Association analyses for the fatty acid composition were carried out on two rabbit lines divergently selected for IMF content. Several associated regions were detected. The most relevant regions were found at 34–37.9 Mb on OCU1, at 149.0–149.9 Mb on OCU3, and at 46.0–48.9 Mb on OCU18. The associated regions disclose several genes related to lipid metabolism such as SCD, PLIN2, ERLIN1, and PPARG. The main genomic regions in which we found genes related to lipid metabolism were not detected in our previous experiment for IMF. MTMR2 is the only gene that was associated with both the IMF content and its composition. To our knowledge, this is the first GWAS for fatty acid composition in rabbits. Our study highlighted the polygenic nature of the fatty acid composition as no large percentages of the genomic variances were explained by the associated genomic regions. Further analyses throughout the associated regions would be needed in order to validate their importance.

Supplementary Materials

The following are available online at https://www.mdpi.com/2076-2615/10/11/2090/s1, Table S1: Relevant validated SNPs associated with the fatty acid composition. Description: 1 Validated SNPs with a Bayes factor greater than 50. 2 Rabbit chromosome. BF: Bayes factor. SFA: Saturated fatty acids stand for the sum of C12:0, C14:0, C15:0, C16:0, C17:0, C18:0, and C20:0. MUFA: monounsaturated fatty acids stand for the sum of C16:1n7, C18:1n9, C18:1n7, C20:1, and C22:1n9, n-3 stand for the sum of C18:3n3, C20:3n3, C20:5n3, C22:5n3, C22:6n3. n-6 stand for the sum of C18:2n6, C18:3n6, C20:2n6, C20:3n6, C20:4n6, and C22:4n6. PUFA: polyunsaturated fatty acids stand for the sum of C18:3n3, C20:3n3, C20:5n3, C22:5n3, C22:6n3, C18:2n6, C18:3n6, C20:2n6, C20:3n6, C20:4n6, and C22:4n6.

Author Contributions

Conceptualization, A.B.; methodology, A.B.; software, B.S.S.-M.; validation, A.B., P.H., and B.S.S.-M.; formal analysis, B.S.S.-M. and H.L.; investigation, P.H., B.S.S.-M. and H.L.; resources, A.B. and P.H.; data curation, H.L. and A.Z.-G.; writing—original draft preparation, H.L.; writing—review and editing, H.L., A.B., P.H., and B.S.S.-M.; visualization, H.L.; supervision, A.B. and P.H.; project administration, A.B.; funding acquisition, A.B. All authors have read and agreed to the published version of the manuscript.

Funding

The work was funded by project AGL2014-55921-C2-1-P and AGL2017-86083-C2-P1 from Plan Nacional de Investigación Científica of Spain—Project I+D. B. Samuel Sosa-Madrid was supported by a FPI grant from Ministerio de Ciencia e Innovación of Spain (BES-2015-074194). Houda Laghouaouta was supported by a scholarship from the Mediterranean Agronomic Institute of Zaragoza.

Conflicts of Interest

The authors declare no conflict of interest.

References

  1. Hernández, P.; Zotte, A.D. Influence of diet on Rabbit meat quality. In Nutrition of the Rabbit; CABI Publishing: Wallingford, UK, 2020; pp. 172–192. [Google Scholar]
  2. Martins, T.D.S.; De Lemos, M.V.A.; Mueller, L.F.; Baldi, F.; Amorim, T.; Ferrinho, A.M.; Muñoz, J.A.; Fuzikawa, I.H.D.S.; De Moura, G.V.; Gemelli, J.L.; et al. Fat Deposition, Fatty Acid Composition, and Its Relationship with Meat Quality and Human Health. Meat Sci. Nutr. 2018, 18–37. [Google Scholar] [CrossRef] [Green Version]
  3. Das, U.N. Essential fatty acids: Biochemistry, physiology and pathology. Biotechnol. J. 2006, 1, 420–439. [Google Scholar] [CrossRef]
  4. Nettleton, J.A.; Brouwer, I.A.; Geleijnse, J.M.; Hornstra, G. Saturated Fat Consumption and Risk of Coronary Heart Disease and Ischemic Stroke: A Science Update. Ann. Nutr. Metab. 2017, 70, 26–33. [Google Scholar] [CrossRef]
  5. Sapp, R.L.; Bertrand, J.K.; Pringle, T.D.; Wilson, D.E. Effects of selection for ultrasound intramuscular fat percentage in Angus bulls on carcass traits of progeny. J. Anim. Sci. 2002, 80, 2017–2022. [Google Scholar] [CrossRef]
  6. Liu, L.; Cui, H.; Xing, S.; Zhao, G.; Wen, J. Effect of Divergent Selection for Intramuscular Fat Content on Muscle Lipid Metabolism in Chickens. Anim. 2019, 10, 4. [Google Scholar] [CrossRef] [Green Version]
  7. Zhao, G.P.; Chen, J.L.; Zheng, M.Q.; Wen, J.; Zhang, Y. Correlated Responses to Selection for Increased Intramuscular Fat in a Chinese Quality Chicken Line. Poult. Sci. 2007, 86, 2309–2314. [Google Scholar] [CrossRef]
  8. Schwab, C.R.; Baas, T.J.; Stalder, K.J.; Nettleton, D. Results from six generations of selection for intramuscular fat in Duroc swine using real-time ultrasound. I. Direct and correlated phenotypic responses to selection1. J. Anim. Sci. 2009, 87, 2774–2780. [Google Scholar] [CrossRef]
  9. Martínez-Álvaro, M.; Blasco, A.; Hernández, P. Effect of selection for intramuscular fat on the fatty acid composition of rabbit meat. Animal 2018, 12, 2002–2008. [Google Scholar] [CrossRef]
  10. Sosa-Madrid, B.S.; Hernández, P.; Blasco, A.; Haley, C.S.; Fontanesi, L.; Santacreu, M.A.; Pena, R.N.; Navarro, P.; Ibáñez-Escriche, N. Genomic regions influencing intramuscular fat in divergently selected rabbit lines. Anim. Genet. 2019, 51, 58–69. [Google Scholar] [CrossRef] [Green Version]
  11. Ros-Freixedes, R.; Gol, S.; Pena, R.N.; Tor, M.; Ibáñez-Escriche, N.; Dekkers, J.C.M.; Estany, J. Genome-Wide Association Study Singles Out SCD and LEPR as the Two Main Loci Influencing Intramuscular Fat Content and Fatty Acid Composition in Duroc Pigs. PLoS ONE 2016, 11, e0152496. [Google Scholar] [CrossRef] [Green Version]
  12. Zhang, W.; Zhang, J.; Cui, L.; Ma, J.; Chen, C.; Ai, H.; Xie, X.; Li, L.; Xiao, S.; Huang, L.; et al. Genetic architecture of fatty acid composition in the longissimus dorsi muscle revealed by genome-wide association studies on diverse pig populations. Genet. Sel. Evol. 2016, 48, 5. [Google Scholar] [CrossRef] [Green Version]
  13. Pena, R.N.; Noguera, J.L.; García-Santana, M.J.; González, E.; Tejeda, J.F.; Ros-Freixedes, R.; Ibáñez-Escriche, N. Five genomic regions have a major impact on fat composition in Iberian pigs. Sci. Rep. 2019, 9, 1–9. [Google Scholar] [CrossRef] [Green Version]
  14. Cesar, A.S.M.; Coutinho, L.L.; Regitano, L.C.A.; Mourão, G.B.; Tullio, R.R.; Lanna, D.P.D.; Nassu, R.T.; Mudado, M.A.; De Oliveira, P.S.N.; Nascimento, M.L.D.; et al. Genome-wide association study for intramuscular fat deposition and composition in Nellore cattle. BMC Genet. 2014, 15, 39. [Google Scholar] [CrossRef] [Green Version]
  15. Sasago, N.; Abe, T.; Sakuma, H.; Kojima, T.; Uemoto, Y. Genome-wide association study for carcass traits, fatty acid composition, chemical composition, sugar, and the effects of related candidate genes in Japanese Black cattle. Anim. Sci. J. 2016, 88, 33–44. [Google Scholar] [CrossRef]
  16. Wang, Z.; Zhu, B.; Niu, H.; Zhang, W.; Xu, L.; Xu, L.; Chen, Y.; Zhang, L.; Gao, X.; Gao, H.; et al. Genome wide association study identifies SNPs associated with fatty acid composition in Chinese Wagyu cattle. J. Anim. Sci. Biotechnol. 2019, 10, 27. [Google Scholar] [CrossRef] [Green Version]
  17. Zomeño, C.; Hernández, P.; Blasco, A. Divergent selection for intramuscular fat content in rabbits. I. Direct response to selection1. J. Anim. Sci. 2013, 91, 4526–4531. [Google Scholar] [CrossRef]
  18. Zomeño, C.; Juste, V.; Hernández, P. Application of NIRS for predicting fatty acids in intramuscular fat of rabbit. Meat Sci. 2012, 91, 155–159. [Google Scholar] [CrossRef]
  19. O’Fallon, J.V.; Busboom, J.R.; Nelson, M.L.; Gaskins, C.T. A direct method for fatty acid methyl ester synthesis: Application to wet meat tissues, oils, and feedstuffs. J. Anim. Sci. 2007, 85, 1511–1521. [Google Scholar] [CrossRef] [Green Version]
  20. Browning, B.L.; Browning, S.R. Genotype Imputation with Millions of Reference Samples. Am. J. Hum. Genet. 2016, 98, 116–126. [Google Scholar] [CrossRef] [Green Version]
  21. Blasco, A. Bayesian Data Analysis for Animal Scientists; Springer Science and Business Media LLC: New York, NY, USA, 2017. [Google Scholar]
  22. Garrick, D.J.; Fernando, R.L. Implementing a QTL Detection Study (GWAS) Using Genomic Prediction Methodology. Advanced Structural Safety Studies 2013, 1019, 275–298. [Google Scholar]
  23. Bouwman, A.C.; Janss, L.L.G.; Heuven, H. A Bayesian approach to detect QTL affecting a simulated binary and quantitative trait. BMC Proc. 2011, 5, S4. [Google Scholar] [CrossRef] [PubMed] [Green Version]
  24. Kass, R.E.; Raftery, A.E. Bayes Factors. J. Am. Stat. Assoc. 1995, 90, 773. [Google Scholar] [CrossRef]
  25. Cunningham, F.; Achuthan, P.; Akanni, W.; Allen, J.E.; Amode, M.R.; Armean, I.M.; Bennett, R.; Bhai, J.; Billis, K.; Boddu, S.; et al. Ensembl 2019. Nucleic Acids Res. 2018, 47, D745–D751. [Google Scholar] [CrossRef] [Green Version]
  26. Jiao, X.; Sherman, B.T.; Huang, D.W.; Stephens, R.M.; Baseler, M.W.; Lane, H.C.; Lempicki, R.A. DAVID-WS: A stateful web service to facilitate gene/protein list analysis. Bioinformatics 2012, 28, 1805–1806. [Google Scholar] [CrossRef] [Green Version]
  27. Binns, D.; Dimmer, E.; Huntley, R.; Barrell, D.; O’Donovan, C.; Apweiler, R. QuickGO: A web-based tool for Gene Ontology searching. Bioinformatics 2009, 25, 3045–3046. [Google Scholar] [CrossRef] [Green Version]
  28. Chang, C.C.; Chow, C.C.; Tellier, L.C.A.M.; Vattikuti, S.; Purcell, S.M.; Lee, J.J. Second-generation PLINK: Rising to the challenge of larger and richer datasets. GigaScience 2015, 4, 7. [Google Scholar] [CrossRef]
  29. Shin, J.-H.; Blay, S.; Graham, J.; McNeney, B. LDheatmap: An R Function for Graphical Display of Pairwise Linkage Disequilibria Between Single Nucleotide Polymorphisms. J. Stat. Softw. 2006, 16, 1–9. [Google Scholar] [CrossRef] [Green Version]
  30. Casto-Rebollo, C.; Argente, M.J.; García, M.L.; Pena, R.; Ibáñez-Escriche, N. Identification of functional mutations associated with environmental variance of litter size in rabbits. Genet. Sel. Evol. 2020, 52, 1–9. [Google Scholar] [CrossRef]
  31. Kessner, D.; Novembre, J. Power Analysis of Artificial Selection Experiments Using Efficient Whole Genome Simulation of Quantitative Traits. Genet. 2015, 199, 991–1005. [Google Scholar] [CrossRef]
  32. Lou, R.N.; Therkildsen, N.O.; Messer, P.W. The Effects of Quantitative Trait Architecture on Detection Power in Short-Term Artificial Selection Experiments. G3 Genes Genomes Genet. 2020, 10, 3213–3227. [Google Scholar] [CrossRef]
  33. Spiegel, S.; Milstien, S. Sphingosine-1-phosphate: An enigmatic signalling lipid. Nat. Rev. Mol. Cell Biol. 2003, 4, 397–407. [Google Scholar] [CrossRef] [PubMed]
  34. Xu, R.; Jin, J.; Hu, W.; Sun, W.; Bielawski, J.; Szulc, Z.; Taha, T.; Obeid, L.M.; Mao, C. Golgi alkaline ceramidase regulates cell proliferation and survival by controlling levels of sphingosine and S1P. FASEB J. 2006, 20, 1813–1825. [Google Scholar] [CrossRef] [PubMed]
  35. Xu, S.; Zou, F.; Diao, Z.; Zhang, S.; Deng, Y.; Zhu, X.; Cui, L.; Yu, J.; Zhang, Z.; Bamigbade, A.T.; et al. Perilipin 2 and lipid droplets provide reciprocal stabilization. Biophys. Rep. 2019, 5, 145–160. [Google Scholar] [CrossRef] [Green Version]
  36. Gandolfi, G.; Mazzoni, M.; Zambonelli, P.; Lalatta-Costerbosa, G.; Tronca, A.; Russo, V.; Davoli, R. Perilipin 1 and perilipin 2 protein localization and gene expression study in skeletal muscles of European cross-breed pigs with different intramuscular fat contents. Meat Sci. 2011, 88, 631–637. [Google Scholar] [CrossRef] [PubMed]
  37. Gol, S.; Ros-Freixedes, R.; Zambonelli, P.; Tor, M.; Pena, R.N.; Braglia, S.; Zappaterra, M.; Estany, J.; Davoli, R. Relationship between perilipin genes polymorphisms and growth, carcass and meat quality traits in pigs. J. Anim. Breed. Genet. 2015, 133, 24–30. [Google Scholar] [CrossRef] [Green Version]
  38. Sosa-Madrid, B.S.; Varona, L.; Blasco, A.; Hernández, P.; Casto-Rebollo, C.; Ibáñez-Escriche, N. The effect of divergent selection for intramuscular fat on the domestic rabbit genome. Animal 2020, 14, 2225–2235. [Google Scholar] [CrossRef]
  39. Kim, E.-S.; Ros-Freixedes, R.; Pena, R.N.; Baas, T.J.; Estany, J.; Rothschild, M.F. Identification of signatures of selection for intramuscular fat and backfat thickness in two Duroc populations1. J. Anim. Sci. 2015, 93, 3292–3302. [Google Scholar] [CrossRef] [Green Version]
  40. Ye, Y.; Lin, S.; Mu, H.; Tang, X.; Ou, Y.; Chen, J.; Ma, Y.; Li, Y. Analysis of Differentially Expressed Genes and Signaling Pathways Related to Intramuscular Fat Deposition in Skeletal Muscle of Sex-Linked Dwarf Chickens. BioMed. Res. Int. 2014, 2014, 1–7. [Google Scholar] [CrossRef]
  41. Ballester, M.; Ramayo-Caldas, Y.; Revilla, M.; Corominas, J.; Castelló, A.; Estellé, J.; Fernández, A.I.; Folch, J.M. Integration of liver gene co-expression networks and eGWAs analyses highlighted candidate regulators implicated in lipid metabolism in pigs. Sci. Rep. 2017, 7, 46539. [Google Scholar] [CrossRef] [Green Version]
  42. Dong, Q.; Liu, H.; Li, X.; Wei, W.; Zhao, S.; Cao, J. A genome-wide association study of five meat quality traits in Yorkshire pigs. Front. Agric. Sci. Eng. 2014, 1, 137–143. [Google Scholar] [CrossRef]
  43. Aung, H.W.; Henry, S.A.; Walker, L.P. Revising the Representation of Fatty Acid, Glycerolipid, and Glycerophospholipid Metabolism in the Consensus Model of Yeast Metabolism. Ind. Biotechnol. 2013, 9, 215–228. [Google Scholar] [CrossRef] [PubMed] [Green Version]
  44. Janani, C.; Kumari, B.D.R. PPAR gamma gene A review. Diabetes Metab. Syndr. Clin. Res. Rev. 2015, 9, 46–50. [Google Scholar] [CrossRef] [PubMed]
  45. Guo, B.; Kongsuwan, K.; Greenwood, P.L.; Zhou, G.; Zhang, W.; Dalrymple, B.P. A gene expression estimator of intramuscular fat percentage for use in both cattle and sheep. J. Anim. Sci. Biotechnol. 2014, 5, 35. [Google Scholar] [CrossRef] [PubMed] [Green Version]
  46. Wang, H.; Xiong, K.; Sun, W.; Fu, Y.; Jiang, Z.; Yu, D.; Liu, H.; Chen, J. Two completely linked polymorphisms in thePPARGtranscriptional regulatory region significantly affect gene expression and intramuscular fat deposition in the longissimus dorsi muscle of Erhualian pigs. Anim. Genet. 2013, 44, 458–462. [Google Scholar] [CrossRef] [PubMed]
  47. Jeong, J.Y.; Kim, J.S.; Nguyen, T.H.; Lee, H.-J.; Baik, M. Wnt/β-catenin signaling and adipogenic genes are associated with intramuscular fat content in the longissimus dorsi muscle of Korean cattle. Anim. Genet. 2013, 44, 627–635. [Google Scholar] [CrossRef]
  48. Sleat, D.E.; Wiseman, J.A.; El-Banna, M.; Price, S.M.; Verot, L.; Shen, M.M.; Tint, G.S.; Vanier, M.T.; Walkley, S.U.; Lobel, P. Genetic evidence for nonredundant functional cooperativity between NPC1 and NPC2 in lipid transport. Proc. Natl. Acad. Sci. USA 2004, 101, 5886–5891. [Google Scholar] [CrossRef] [Green Version]
  49. Nguyen, L.N.; Ma, D.; Shui, G.; Wong, P.; Cazenave-Gassiot, A.; Zhang, X.; Wenk, M.R.; Goh, E.L.K.; Silver, D.L. Mfsd2a is a transporter for the essential omega-3 fatty acid docosahexaenoic acid. Nat. Cell Biol. 2014, 509, 503–506. [Google Scholar] [CrossRef]
  50. Karbowska, J.; Kochan, Z. Role of adiponectin in the regulation of carbohydrate and lipid metabolism. J. Physiol. Pharmacol. 2006, 57, 103–113. [Google Scholar]
  51. Barendse, W. Haplotype Analysis Improved Evidence for Candidate Genes for Intramuscular Fat Percentage from a Genome Wide Association Study of Cattle. PLoS ONE 2011, 6, e29601. [Google Scholar] [CrossRef] [Green Version]
  52. Wang, Y.H.; Bower, N.I.; Reverter, A.; Tan, S.H.; De Jager, N.; Wang, R.; McWilliam, S.M.; Cafe, L.M.; Greenwood, P.L.; Lehnert, S.A. Gene expression patterns during intramuscular fat development in cattle1. J. Anim. Sci. 2009, 87, 119–130. [Google Scholar] [CrossRef]
  53. Goldstein, J.L.; DeBose-Boyd, R.A.; Brown, M.S. Protein Sensors for Membrane Sterols. Cell 2006, 124, 35–46. [Google Scholar] [CrossRef] [PubMed] [Green Version]
  54. Horton, J.D.; Goldstein, J.L.; Brown, M.S. SREBPs: Activators of the complete program of cholesterol and fatty acid synthesis in the liver. J. Clin. Investig. 2002, 109, 1125–1131. [Google Scholar] [CrossRef] [PubMed]
  55. Zhang, F.; Wang, Y.; Mukiibi, R.; Chen, L.; Vinsky, M.; Plastow, G.S.; Basarab, J.A.; Stothard, P.; Li, C. Genetic architecture of quantitative traits in beef cattle revealed by genome wide association studies of imputed whole genome sequence variants: I: Feed efficiency and component traits. BMC Genom. 2020, 21, 1–22. [Google Scholar] [CrossRef] [PubMed]
  56. Maharani, D.; Park, H.-B.; Lee, J.-B.; Yoo, C.-K.; Lim, H.-T.; Han, S.-H.; Lee, S.-S.; Ko, M.-S.; Cho, I.-C.; Lee, J.H. Association of the gene encoding stearoyl-CoA desaturase (SCD) with fatty acid composition in an intercross population between Landrace and Korean native pigs. Mol. Biol. Rep. 2012, 40, 73–80. [Google Scholar] [CrossRef]
  57. Ramírez, C.A.; Horcada, A.; Polvillo, O.; Membrillo, A.; Anaya, G.; Molina, A.; Alcalde, M.J.; Panea, B. Association study between variability in the SCD gene and the fatty acid profile in perirenal and intramuscular fat deposits from Spanish goat populations. Small Rumin. Res. 2016, 136, 127–131. [Google Scholar] [CrossRef]
  58. Puig-Oliveras, A.; Revilla, M.; Castelló, A.; Fernández, A.I.; Folch, J.M.; Ballester, M. Expression-based GWAS identifies variants, gene interactions and key regulators affecting intramuscular fatty acid content and composition in porcine meat. Sci. Rep. 2016, 6, 31803. [Google Scholar] [CrossRef]
Figure 1. Manhattan plot of genome-wide association study for saturated fatty acids. The black dashed line indicates the Bayes factor threshold of 10. Each dot represents a Single Nucleotide Polymorphism (SNP). X-axis: chromosomes. Y-axis: Bayes factor.
Animals 10 02090 g001
Figure 2. Manhattan plot of genome-wide association study for polyunsaturated fatty acids. The black dashed line indicates the Bayes factor threshold of 10. Each dot represents a SNP. X-axis: chromosomes. Y-axis: Bayes factor.
Animals 10 02090 g002
Figure 3. Manhattan plot of genome-wide association study for monounsaturated fatty acids. The black dashed line indicates the Bayes factor threshold of 10. Each dot represents a SNP. X-axis: chromosomes. Y-axis: Bayes factor.
Animals 10 02090 g003
Figure 4. Linkage disequilibrium plot at 34–37.9 Mb on chromosome 1. Colors from white to red indicate r2 value. (a) All lines. (b) High-intramuscular fat (IMF) line. (c) Low-IMF line.
Animals 10 02090 g004
Figure 5. Linkage disequilibrium plot at 148.5–150.2 Mb on chromosome 3. Colors from white to red indicate r2 value. (a) All lines. (b) High-IMF line. (c) Low-IMF line.
Animals 10 02090 g005
Figure 6. Linkage disequilibrium plot at 46.0–49.2 Mb on chromosome 18. Colors from white to red indicate r2 value. (a) All lines. (b) High-IMF line. (c) Low-IMF line
Animals 10 02090 g006
Table 1. Descriptive statistics for fatty acids (% of total fatty acids) of Longissimus thoracis et lumborum muscle in rabbits.
TraitMeanSD 1CV 2 (%)
C14:01.260.2620
C16:025.71.174
C18:08.340.668
SFA36.40.942
C16:1n71.250.5039
C18:1n920.30.884
MUFA24.41.275
C18:2n627.71.184
C18:3n31.160.1412
C20:4n67.451.0514
PUFA39.21.834
PUFA/SFA1.080.076
MUFA/SFA0.670.034
n-6/n-317.70.975
1 Standard deviation, 2 coefficient of variation, SFA: saturated fatty acids stand for the sum of C12:0, C14:0, C15:0, C16:0, C17:0, C18:0, and C20:0, MUFA: monounsaturated fatty acids stand for the sum of C16:1n7, C18:1n9, C18:1n7, C20:1n11, and C22:1n9, n-3 stand for the sum of C18:3n3, C20:3n3, C20:5n3, C22:5n3, and C22:6n3, n-6 stand for the sum of C18:2n6, C18:3n6, C20:2n6, C20:3n6, C20:4n6, and C22:4n6, PUFA: polyunsaturated fatty acids stand for the sum of C18:3n3, C20:3n3, C20:5n3, C22:5n3, C22:6n3, C18:2n6, C18:3n6, C20:2n6, C20:3n6, C20:4n6, and C22:4n6.
Table 2. Genomic regions associated with saturated fatty acids of Longissimus thoracis et lumborum muscle in rabbits.
OCU 1Region (Mb) 2TraitVAR 3PPA 4rSNP 5Number of Genes 6PCG 7
129.1–29.9C18:00.520.55213-
34.0–37.9C14:03.540.513813ACER2, PLIN2
C16:011.200.5136
C18:00.870.331
SFA11.320.4522
121.0–121.9C14:00.620.692713MTMR2
C18:00.500.5927
3149.0–149.9C14:01.110.96198ENSOCUG00000000157
C16:03.650.9815
C18:01.720.9915
SFA0.980.5116
154.0–154.9SFA0.910.39124-
467.0–67.9C18:00.710.75148-
57.2–7.9C16:00.710.50151-
60–0.9C16:01.330.6012--
815.0–15.9SFA0.520.43257-
21.0–21.9C18:00.570.75696PIK3C2G, PLCZ1, PLEKHA5
964.0–64.9C16:00.620.38210NPC1
SFA0.960.372
69.0–69.5SFA0.560.3224-
1043.0–43.9SFA0.590.3583-
13126.0–126.9C18:00.960.87923HEYL, MFSD2A, PPT1
1482.0–82.9C18:00.510.551819ADIPOQ
1510.0–10.9C16:00.630.401711LRAT, TLR2
SFA0.630.3216
1848.0–48.9C18:00.520.524232ERLIN1,
SFA0.550.412 ENSOCUG00000014801
ENSOCUG00000001375
1 Rabbit chromosome, 2 associated region, 3 percentage of the genomic variance explained by the windows belonging to the associated region, 4 posterior probability of association, 5 number of relevant SNPs with a Bayes factor higher than 10 in the extended region, 6 number of protein coding genes in the extended region, 7 putative candidate genes related to lipid metabolism retrieved from Database for Annotation, Visualization, and Integrated Discovery (DAVID) database. SFA: saturated fatty acids stand for the sum of C12:0, C14:0, C15:0, C16:0, C17:0, C18:0, and C20:0.
Table 3. Genomic regions associated with monounsaturated fatty acids of Longissimus thoracis et lumborum muscle in rabbits.
OCU 1Region (Mb) 2TraitVAR 3PPA 4rSNP 5Number of Genes 6PCG 7
129.1–29.9C16:1n70.810.48163-
36.0–36.9C16:1n70.920.3432-
121.0–121.9C18:1n90.630.34213MTMR2
MUFA0.610.3818
3149.0–149.9C18:1n91.060.641711ENSOCUG00000000157
MUFA1.380.7718
467.0–67.9C18:1n90.660.41148-
57.2–7.9C16:1n70.820.61221-
MUFA0.990.6422
68–9.9C16:1n70.710.642222SMG1, GDE1
C18:1n91.430.5012
MUFA0.670.4710
821.0–21.9C16:1n70.630.6586PIK3C2G, PLCZ1,
C18:1n90.720.574 PLEKHA5
MUFA1.010.6616
912.0–12.5C16:1n71.050.60177PPARG
1042.2–42.9MUFA0.530.41161-
13126.0–126.9C18:1n91.280.73923HEYL, MFSD2A, PPT1
MUFA0.990.699
1482.0–82.9C18:1n90.580.30714ADIPOQ
1712.0–13.9C16:1n71.550.663514ALDH1A2, LIPC, MYO1E
MUFA0.810.5636
1847.0–48.9C16:1n71.210.43735GOT1, ERLIN1,
C18:1n90.830.372 ENSOCUG00000014801,
MUFA1.900.5346 ENSOCUG00000001375
2110.0–10.9C18:1n90.720.4462-
1 Rabbit chromosome, 2 associated region, 3 percentage of the genomic variance explained by the windows belonging to the associated region, 4 posterior probability of association, 5 number of relevant SNPs with a Bayes factor higher than 10 in the extended region, 6 number of protein coding genes in the extended region, 7 putative candidate genes related to lipid metabolism retrieved from DAVID database. MUFA: monounsaturated fatty acids stand for the sum of C16:1n7, C18:1n9, C18:1n7, C20:1n11, and C22:1n9.
Table 4. Genomic regions associated with polyunsaturated fatty acids of Longissimus thoracis et lumborum muscle in rabbits.
OCU 1Region (Mb) 2TraitVar 3PPA 4rSNPs 5Number of Genes 6PCG 7
129.1–29.9PUFA0.560.34153-
31–31.9C18:2n61.340.2727-
PUFA0.60.3116
34–37.9C18:2n63.180.20213ACER2, PLIN2
C20:4n61.570.4733
PUFA2.410.3711
285.0–85.9C18:2n61.240.2483-
325.0–26.9C18:2n66.050.65416FGF1, NR3C1
149.0–149.9C18:2n60.680.2418ENSOCUG00000000157
C20:4n60.820.9216
PUFA2.250.9715
57.2–7.9PUFA0.910.66221-
60–0.9PUFA0.550.5714--
5.0–5.9C18:2n60.610.21815LITAF, SNX29
821.0–21.9PUFA0.780.67145PIK3C2G, PLCZ1
50.0–50.9C18:2n61.060.30-6-
55.3–55.9C18:2n64.770.30111-
C18:3n30.990.3818
963.0–63.9C18:2n60.610.2314-
64.0–65.9PUFA1.90.463016NPC1, OSBPL1A
115.0–115.9C18:2n61.210.38163-
1043.0–43.9PUFA0.580.47173-
127.0–7.9C20:4n61.480.93108-
1333.0–34.9C18:2n63.420.491360CRP, DCAF8, FCER1A, PIGM, ATP1A2
14156.2–156.9C18:3n30.730.74173-
1510.0–10.9C18:2n62.410.391611LRAT, TLR2
PUFA0.870.5319
70.0–71.9C18:2n63.590.50412ANXA3, GK2
1662.0–62.9C18:2n60.590.2369HSD11B1
71.0–72.9C18:3n31.670.43107ENSOCUG00000006240
179.0–10.9C18:2n63.870.412110
12.0–13.9C18:2n63.550.463414ALDH1A2, LIPC,
PUFA0.840.61 MYO1E
1823.0–23.8C18:2n61.180.36178NRBF2
1921.0–21.9C18:2n60.520.21215ADAP2
2110.0–10.9C18:3n30.550.6862-
1 Rabbit chromosome, 2 associated region, 3 percentage of the genomic variance explained by the windows belonging to the associated region, 4 posterior probability of association, 5 number of relevant SNPs with a Bayes factor higher than 10 in the extended region, 6 number of the protein coding genes in the extended region. 7 putative candidate genes related to lipid metabolism retrieved from DAVID database, PUFA: polyunsaturated fatty acids stand for the sum of C18:3n3, C20:3n3, C20:5n3, C22:5n3, C22:6n3, C18:2n6, C18:3n6, C20:2n6, C20:3n6, C20:4n6, and C22:4n6.
Table 5. Genomic regions associated with PUFA/SFA, MUFA/SFA, and n-6/n-3 of Longissimus thoracis et lumborum in rabbits.
OCU 1Region (Mb) 2TraitVar 3PPA 4rSNPs 5Number of Genes 6PCG 7
129.1–29.9PUFA/SFA0.530.32143-
31.1–31.9PUFA/SFA0.590.30117-
34.0–37.9PUFA/SFA2.980.381013ACER2, PLIN2
n-6/n-31.450.2917
3118.0–118.9MUFA/SFA0.580.36111-
149.0–149.9PUFA/SFA2.450.98158ENSOCUG00000000157
57.3–7.9PUFA/SFA0.840.61221-
60.0–0.9PUFA/SFA1.090.7414--
851.0–51.9n-6/n-30.670.4237-
53.0–53.8MUFA/SFA0.530.281114DGKH
964.0–65.9PUFA/SFA2.440.503816NPC1, OSBPL1A
105.0–5.6MUFA/SFA0.630.37194ITGB8
43.0–43.9PUFA/SFA0.520.4583-
1478.2–78.9MUFA/SFA0.520.23514ATP11B
158.0–8.9n-6/n-30.830.483013-
10.0–10.9PUFA/SFA1.600.711811LRAT, TLR2
1662.0–62.9MUFA/SFA0.590.1739HSD11B1
71.0–72.9n-6/n-31.040.26107ENSOCUG00000006240
1811.0–11.9MUFA/SFA0.860.3235SAMD8
21.0–21.9MUFA/SFA0.930.52223-
46.0–48.9MUFA/SFA7.910.595441GOT1, ERLIN1
ENSOCUG00000014801, ENSOCUG00000001375
1 Rabbit chromosome, 2 associated region, 3 percentage of the genomic variance explained by the windows belonging to the associated region, 4 posterior probability of association, 5 number of relevant SNPs with a Bayes factor higher than 10 in the extended region, 6 number of the protein coding genes in the extended region, 7 putative candidate genes related to lipid metabolism retrieved from DAVID database, SFA: saturated fatty acids stand for the sum of C12:0, C14:0, C15:0, C16:0, C17:0, C18:0, and C20:0, MUFA: monounsaturated fatty acids stand for the sum of C16:1n7, C18:1n9, C18:1n7, C20:1n11, and C22:1n9, n-3 stand for the sum of C18:3n3, C20:3n3, C20:5n3, C22:5n3, and C22:6n3, n-6 stand for the sum of C18:2n6, C18:3n6, C20:2n6, C20:3n6, C20:4n6, and C22:4n6, PUFA: polyunsaturated fatty acids stand for the sum of C18:3n3, C20:3n3, C20:5n3, C22:5n3, C22:6n3, C18:2n6, C18:3n6, C20:2n6, C20:3n6, C20:4n6, C22:4n6.
Publisher’s Note: MDPI stays neutral with regard to jurisdictional claims in published maps and institutional affiliations.

