2.1. Experimental Design and Sampling
The current experiment was conducted at the Sheep Research Center of the Ohio Agricultural Research and Development Center, Wooster, Ohio, under The Ohio State University Institutional Animal Care and Use Committee procedure #2019A00000001.
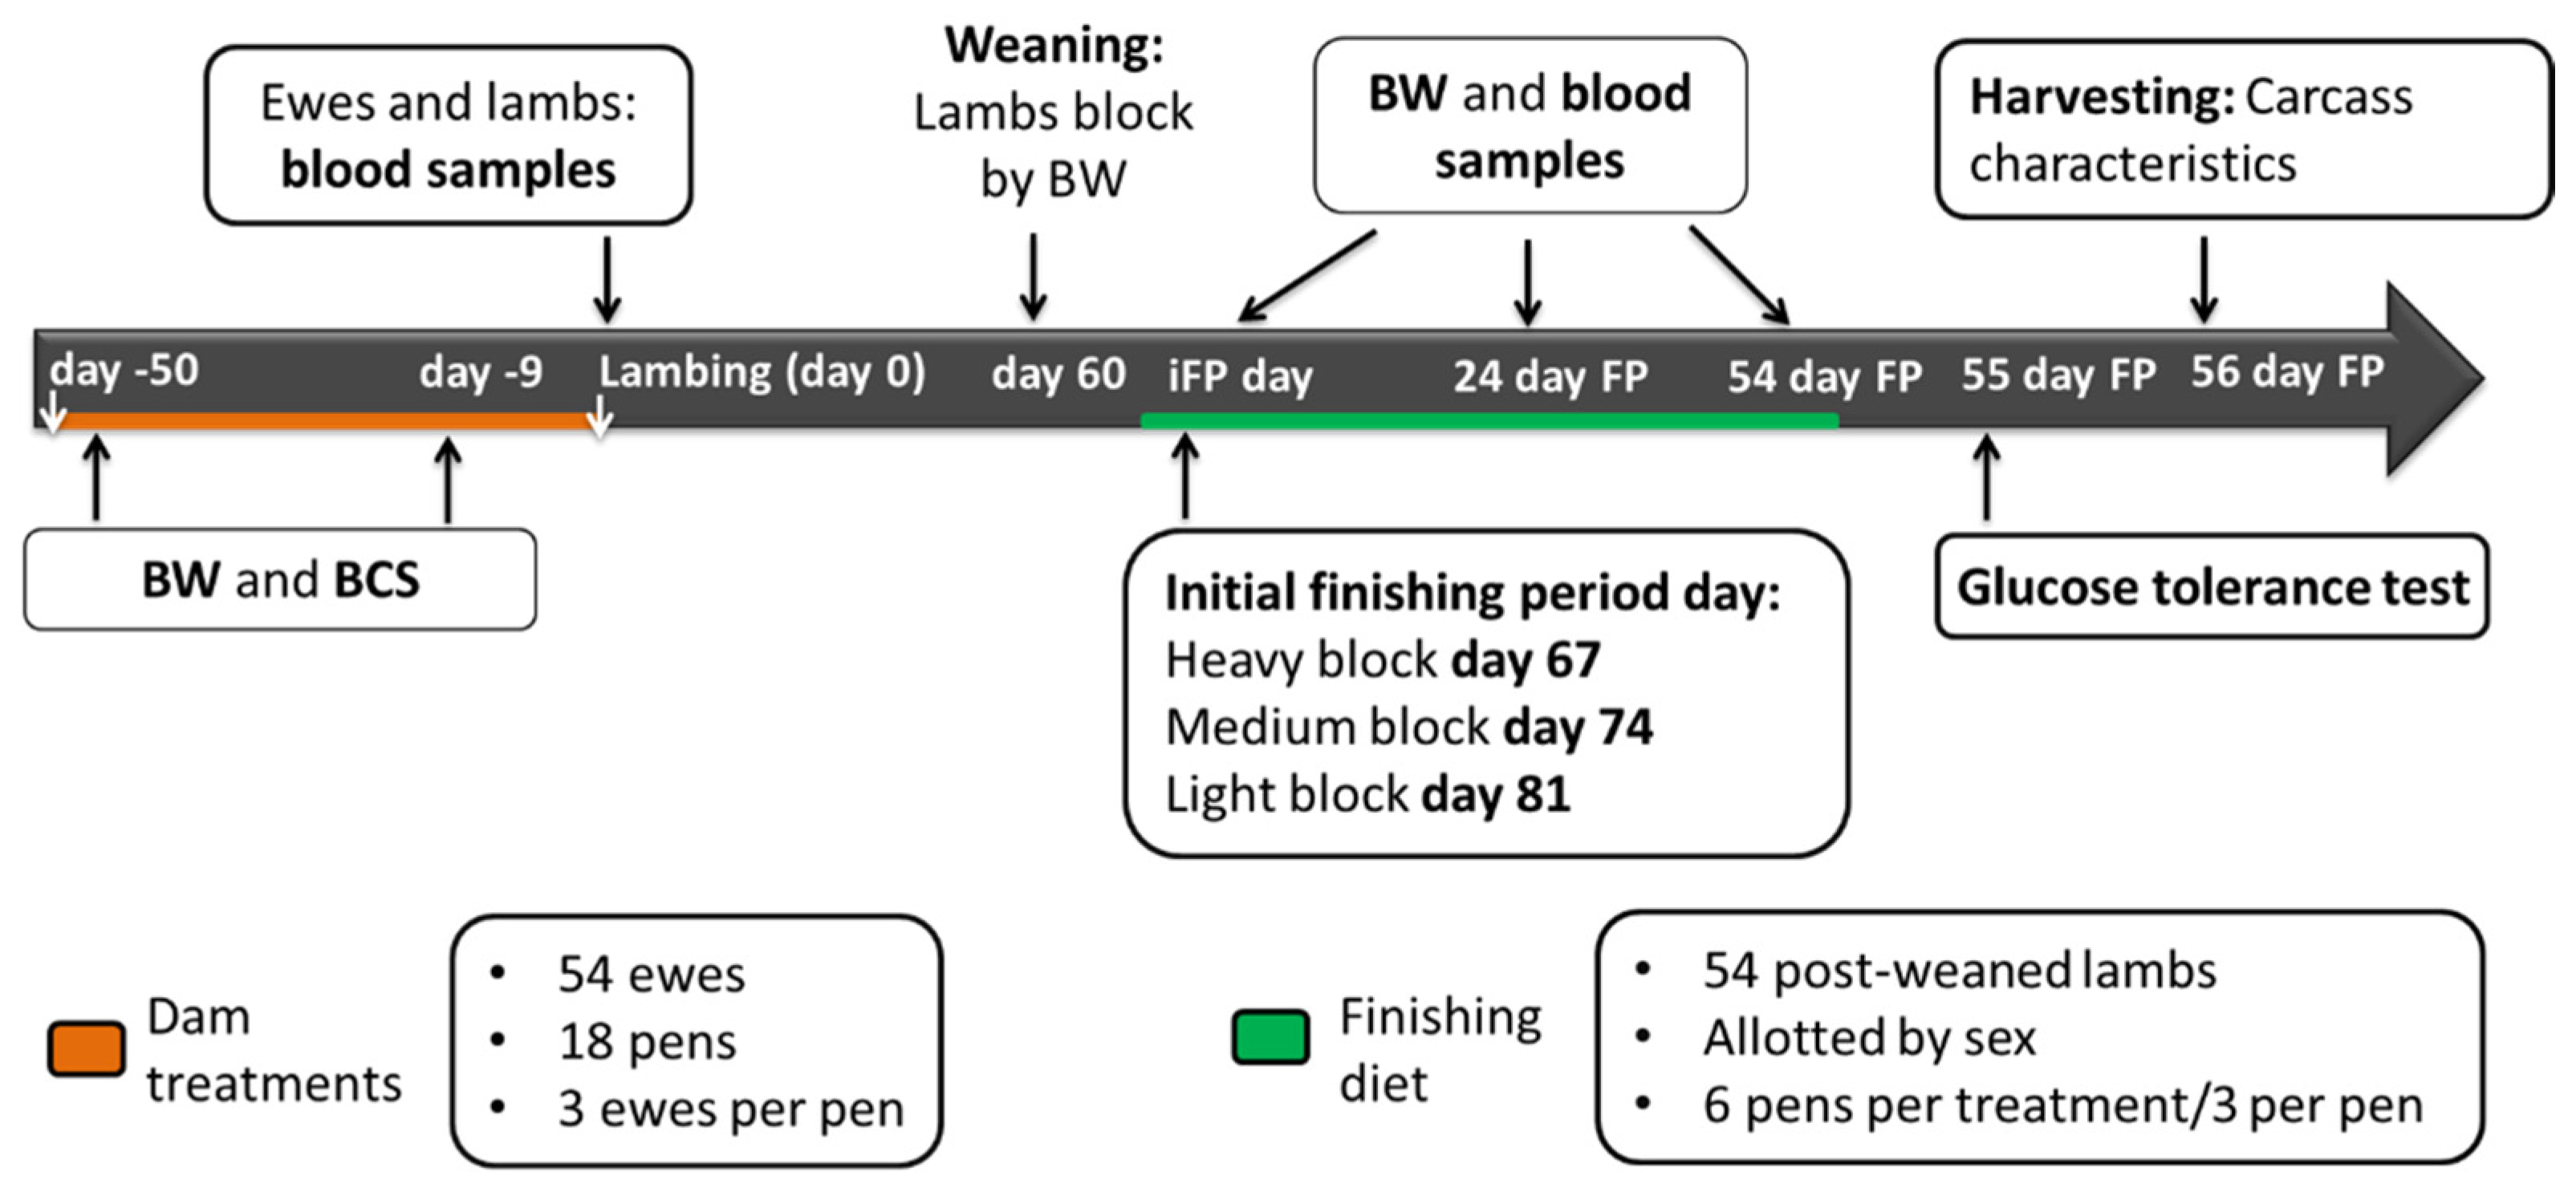
A scheme of the sampling protocol can be found on
Figure 1.
Fifty-four pregnant Dorset × Hampshire ewes (initial BW = 96.2 ± 14.60 kg; 3 to 4 years old) were housed in 18 pens (3 ewes per pen) and supplemented from day 100 of gestation until lambing (day -50 and day 0, respectively). Day one of pregnancy was considered the day on which estrus was confirmed as described previously [
10]. Ewes were blocked by BW, and within each block randomly assigned to one of three treatments: (1) Ewes were fed a basal diet with no supplemental lipids to meet sheep nutrient requirements during late gestation [
15] (NF); (2) Ewes were fed the same basal diet as NF and supplemented with Ca salts of a palmitic fatty acid distillate (PDS) as a source of palmitic and oleic acids at 1.01% of their dry matter intake; and (3) Ewes were fed the same basal diet as NF and supplemented with Ca salts containing eicosapentaenoic acid (EPA) and docosahexaenoic acid (DHA) (EDS) at 1.01 % of their dry matter intake. The Ca salts were EnerGII and Strata G113 for the PDS and EDS, respectively (Virtus Nutrition LLC, Corcoran, CA, USA). Ewes were fed 2.02 kg/day of diet containing the different treatments (
Table 1). The dose of FA supplementation was based on previous fetal programming experiments where supplementation at amounts of FA supplement similar to the ones in this experiment affected offspring growth without affecting dam performance [
9,
10,
16,
17]. The sources of FA were chosen because they are rumen inert, commercially available, and contain similar amounts of net energy and Ca. Commercially, there is no rumen inert product that contain purified EPA and DHA. The PDS was chosen to be a commercial product rich in saturated (SFA) and monounsaturated fatty acids (MUFA) (
Table 2). As described previously [
10], both diets with PDS and EDS have 0.54% more net energy for maintenance (NE
m) than the NF, but the supplementation with a new feed ingredient to make isoenergetic diet in the current experiment might confound the effects of the supplementation with the different sources of FA vs. effects caused by another feed ingredient, as described previously [
18]. Even though the diets were not isoenergetic, an increase of 0.54% in NE
m intake per treatment is likely not enough to cause the offspring changes observed in the current experiment. Feed samples were taken weekly and pooled for further analysis. No orts (feed refusals) were registered during the entire research period for the dams. At birth (day 0), the supplementation stopped and all ewes and lambs were placed in a common pen and feed ad libitum the same diet until weaning (day 60). Measurements of ewe BW and body condition score (BCS) were taken at day -50 and day -9. For the BCS the sample was assessed using a 5-point scale [
19]. Blood samples were taken from ewes at lambing (day 0).
On day 0, blood samples were collected from lambs between 8 to 16 h post-lambing depending on whether the delivery happened overnight or during the daytime. Thus, lamb blood samples at birth were collected after colostrum consumption. With the occurrence of twins or triplets, one lamb was randomly selected. On day 30 lambs were weighed. On day 60, lambs were weighed, blood sampled, weaned, and blocked by body weight (heavy, medium, and light blocks). Lambs had an adaptation to a common pelleted finishing diet. After the adaptation, the finishing diet was fed for 54 days (
Table 3). Starting day of the finishing period was staggered a week between blocks. Therefore, the starting days for the finishing period were day 67, day 74, and day 81 for the heavy, medium, and light blocks, respectively. The initial day of the finishing period, lambs (
n = 54) were weighed, allotted by sex, and placed in 18 pens (3 lambs/pen; 6 pens/treatment with 3 pens with ewes and 3 pens with wethers). Lamb BW and blood samples were taken on the initial day of the finishing period, and 28 and 54 days after the start of the finishing period (iBW, 28 day BW and fBW, respectively). Blood samples of the light blocks for the last sampling were not analyzed due to problems with the temperature after processing.
Blood samples from dams (10 mL) and lambs (6 mL at birth and 10 mL the rest of the samplings) were taken from the jugular vein, transferred into polypropylene tubes (14 mL, VWR International, Radnor, Pa). The polypropylene tubes contained solutions of disodium EDTA (1.6 mg/mL of blood) and benzamidine HCL (4.7 mg/mL of blood). The tubes were and immediately placed on ice and then centrifugated for 25 min at 1800× g at 4 °C. Once the tubes were centrifugated, plasma was aliquoted in individual micro polypropylene tubes with snap caps (1.5 mL, VWR International, Radnor, PA, USA) and stored at −80 °C until analysis. At birth, both dam and offspring blood samples were analyzed for plasma glucose and non-esterified fatty acids (NEFA) concentrations. Offspring blood samples at birth were also analyzed for plasma total FA, and plasma resolvin D1 (RvD1) concentration.
Fifty-five days after the beginning of the finishing period, 18 lambs (one/pen, six/treatment) were selected randomly to conduct a glucose tolerance test (GTT). Catheters (Milacath® extended use #1603, 16 g × 3.0 inches, Mila International, Inc., Florence, KY, USA) were placed in the jugular vein of each lamb using aseptic procedures. Lambs were restrained, their necks were sheared on the right side, the sheared area was rinsed with 70% (vol/vol) ethyl alcohol, scrubbed with surgical soap, and rinsed again with ethyl alcohol. The rinsing and scrubbing procedure was conducted three times. Under local anesthesia (Lidocain 2% -lidocaine hydrochloride injection, MWI/VetOne, Boise, ID, USA), a skin incision of approximately 1 cm was made over the jugular vein with a sterile scalpel. The catheter was placed, and surgical glue and suture were used to stabilize it. A Vetrap bandage was used to protect and keep the catheter in place. Lambs were moved into individual pens without feed (for 24 h) and provided ad libitum access to water.
Prior to conducting the GTT, lambs were weighed 30 min before glucose administration to determine the glucose bolus size (0.25 g of glucose/kg of BW in a 50 % wt/vol dextrose solution). Blood samples were collected 5 min prior to glucose administration (−5 min) and at 2, 5, 10, 15, 20, 30, 60, and 90 min after glucose administration. Before each blood sample was collected and to remove all catheter content blood (1 mL) was collected in a spare syringe and discarded. Blood samples of 10 mL were collected; and subsequently, 1 mL of heparin solution (10 IU of heparin/mL and 0.9% NaCl) was infused into the catheter to prevent clotting. With the 10 mL of blood collected, 7 mL were transferred into a polypropylene tube (VWR International, Radnor, Pa) similar to the ones used for the ewes blood collection (containing disodium EDTA and benzamidine HCL), to measure plasma insulin and ghrelin concentrations, and 3 mL were transferred into 4 mL BD Vacutainer plastic tube with Fluoride (0268847, Fisher Scientific, Pittsburg, PA, USA) to evaluate plasma glucose concentration. Both tubes were immediately placed in ice and centrifuged using the same protocol to separate plasma from blood as explained previously. Plasma from tubes was aliquoted and stored micro polypropylene tubes with snap caps (1.5 mL, VWR International, Radnor, Pa, USA) at −80 °C until analyzed for glucose and insulin. The procedure used to determine plasma ghrelin concentration was similar; however, plasma was placed in similar tubes that were acidified with the addition of 50 μL of 1 N HCl and 10 μL of phenylmethylsulfonyl fluoride per 1 mL of plasma. Plasma glucose and insulin concentrations were measured at −5, 2, 5, 10, 15, 20, 30, 60, and 90 min after the glucose bolus administration; while ghrelin plasma concentration was measured at −5, 2, and 5 min relative to the glucose bolus administration.
Fifty-six days after the beginning of the finishing period, another group of 18 lambs (one/pen was randomly selected, six/treatment) were harvested at the Meat laboratory (Department of Animal Sciences, Ohio State University, Columbus, OH, USA). At harvest, hot carcass weight (HCW) was recorded. Carcasses were stored overnight at 4 °C in a walk-in cooler prior to recording carcass data. Carcasses were ribbed between the 12th and 13th rib after the 12-h chill (4 °C), then a trained university employee determined ribeye area (REA), back fat thickness (BFT), body wall thickness (BWT), and marbling score.
2.2. Sample Analysis
A pooled feed sample was analyzed according to the AOAC (1990) for dry matter (DM, method number 981.10), crude protein (CP, method number 967.03), neutral detergent fiber (NDF), and acid detergent fiber (ADF) according to Van Soest et al. (1991) with a heat-stable amylase included in the NDF. Total FA composition of Ca salts was determined using the methods described by Weiss and Wyatt [
20].
Plasma total FA were extracted as described by Folch et al. [
21] with few modifications [
22]. The extracted FA were methylated as described by Doreau et al. [
23]. All fatty acid methyl esters were separated by gas chromatography (GC, model HP 5890) using a CP-SIL88 capillary column (film thickness: 100-m × 0.25-mm × 0.2-µm; Varian Inc., Palo Alto, CA, USA). Resolvin D1 concentration in lamb’s plasma collected at birth was quantified with the use of a commercial kit (Resolvin D1 ELISA, Cayman Chemical, Ann Arbor, MI, USA). We conducted the validation for the assay to be use for sheep plasma, based on a parallel displacement. For it we used serial dilutions of ovine plasma compared to the RvD1 standard curve. The recovery for RvD1 was 101.03 ± 3.02%. The intraassay and interassay coefficients of variation were 5 and 14%, respectively. The RvD1 assay was conducted according to the manufacturer’s protocol with slight modifications. Based on the parallel displacement results, we decide not extract the samples. Samples were diluted at a ratio of 1:1 RvD1 assay buffer to plasma to fit the values in the standard curve. Plasma glucose (1070 Glucose Trinder, Stanbio Laboratory, Boerne, TX, USA) and NEFA concentrations were measured using a commercial ELISA immunoassay kit (NEFA Wako Pure Chemical 1, FUJIFILM Wako Diagnostics USA Corporation, Richmond, VA, USA) as validated previously for sheep [
24]. Intraassay and interassay coefficients of variation were 3.07% and 1.42% for glucose and 3.25% and 0.25% for NEFA, respectively. Plasma insulin concentration was evaluated using a commercial kit (EMD Millipore Corporation, Billerica, MA, USA). The assay was validated for sheep using a parallel displacement as described for the RvD1. The lowest level of insulin detected by this assay was 1.611 µU/mL when using a 100 µL sample size. The interassay coefficient of variation was 8.79%. Plasma acetylated ghrelin concentration was also measured using a commercial assay (Active Ghrelin radioimmunoassay kit # GHRA-88HK, Linco Research, St. Charles, MO, USA) validated for sheep previously [
24]. The intraassay coefficient of variation and the minimum sensitivity were 7.12%, 7.8 pg/mL, respectively.
2.3. Statistical Analyses
Data from ewe BW, ADG, BCS, and plasma concentrations of glucose and NEFA were analyzed as a randomized complete block (RCB) design. Data was analyzed using the MIXED procedure of SAS (9.4, SAS Institute, Cary, NC, USA.). The model evaluated the fixed effects of FA supplementation, and the random effect of pen within each block. Pen was the experimental unit. Initial BW and BCS were included as covariates for changes in ewe BW and BCS, respectively.
Lamb plasma RvD1 and FA concentrations data were analyzed as a RCB design using the MIXED procedure (SAS Institute, Cary, NC, USA.). The model evaluated the fixed effects of FA supplementation, and the random effect of pen within each block. Lamb sex was added as a second block criteria for the plasma RVD1 concentration.
Lamb BW, ADG, DMI during the finishing period, and plasma concentration of hormones and metabolites data were analyzed as a RCB design with repeated measures using the MIXED procedure (SAS Institute, Cary, NC, USA.). The model tested the fixed effects of treatment, lamb sex, time, and their interactions, and the random effects of pen or lamb (if only 1 lamb was sampled, i.e., GTT and carcass data) within each block. Pen (or lamb, if only one animal per pen was sampled) was considered the experimental unit. Day was included as a repeated measurement. Different covariance structures were compared (compound symmetry, unstructured, autoregressive, and variance components). The compound symmetry structure was used based on the lowest Akaike information criterion. To determine the denominator degrees of freedom for tests of fixed effects, the Kenward Rogers degrees of freedom approximation was used. For lab data before weaning, type of birth (single or multiple) was included as covariate and removed if it was not significant (p > 0.1)
Least square means (LSMEANS) and standard errors of the mean (SEM) were determined using the LSMEANS statement in the MIXED procedure. Significance was set at p ≤ 0.05; and tendencies were determined at p > 0.05 and p ≤ 0.10. The SLICE option of SAS was used for mean separation when the p-value for an interaction with time was ≤0.10 and discuss as different if the p value of the comparation was ≤0.05. In the case of significant difference on main effect, double or triple interaction, the PDIFF option of SAS was used for mean separation.


